
Silica Removal from a Paper Mill Effluent by Adsorption on Pseudoboehmite and γ-Al2O3


Chemical and Materials Engineering, Faculty of Chemistry, Complutense University of Madrid, 28040 Madrid, Spain
*
Author to whom correspondence should be addressed.
Water 2021, 13(15), 2031; https://doi.org/10.3390/w13152031
Submission received: 29 June 2021
/
Revised: 19 July 2021
/
Accepted: 22 July 2021
/
Published: 25 July 2021
(This article belongs to the Section Wastewater Treatment and Reuse)
Abstract
:Effluent reuse is a common practice for sustainable industrial water use. Salt removal is usually carried out by a combination of membrane processes with a final reverse osmosis (RO). However, the presence of silica limits the RO efficiency due to its high scaling potential and the difficulty of cleaning the fouled membranes. Silica adsorption has many advantages compared to coagulation and precipitation at high pHs: pH adjustment is not necessary, the conductivity of treated waters is not increased, and there is no sludge generation. Therefore, this study investigates the feasibility of using pseudoboehmite and its calcination product (γ-Al2O3) for silica adsorption from a paper mill effluent. The effect of sorbent dosage, pH, and temperature, including both equilibrium and kinetics studies, were studied. γ-Al2O3 was clearly more efficient than pseudoboehmite, with optimal dosages around 2.5–5 g/L vs. 7.5–15 g/L. The optimum pH is around 8.5–10, which fits well with the initial pH of the effluent. The kinetics of silica adsorption is fast, especially at high dosages and temperatures: 80–90% of the removable silica is removed in 1 h. At these conditions, silica removal is around 75–85% (<50 mg/L SiO2 in the treated water).
1. Introduction
Industrial water reuse is an important issue because of the lack of fresh water, stringent environmental legislation, and high costs of water treatments. Membrane treatments have gained considerable acceptance in urban and industrial water reuse as they are very efficient in producing high quality water, while they are easy to operate and can be combined with other treatment processes [1,2]. Membrane treatments have been successfully applied in water reuse schemes of many sectors, e.g., chemical [3,4,5], textile [6,7], pulp and paper [8,9,10], metal finishing [11], and food and beverage [12]. However, the presence of silica complicates the wastewater treatment by membrane technologies due to its high scaling potential and the difficulty of cleaning the membranes once the deposits are formed [13,14,15,16]. In fact, silica and silicate precipitation is considered one of the most important limiting factors in high-recovery membrane operations, and silica scaling control remains a challenge that requires further research [17,18,19,20].
There are many strategies for silica control depending on the initial silica concentration, the wastewater characteristics (i.e., hardness, pH, alkalinity, etc.), the volume of wastewater to be treated, and the discharge limit for silica. Coagulation and softening at high pHs are by far the most widely used techniques [21,22,23,24,25]. However, these techniques generate a large amount of sludge and an increase of the total dissolved solids in the treated water. Furthermore, high chemical dosages and high pHs are required, significantly increasing the treatment costs. This paper proposes silica removal by adsorption as an alternative treatment technology to overcome these drawbacks.
Amongst inorganic materials considered for the adsorption of heavy metals and ions, iron (iron (III) hydroxide, ferrihydrite and goethite) and aluminum sorbents (activated alumina and aluminum hydroxide, calcium aluminate and hydrotalcites) are the most studied [13,26]. For silica, aluminum compounds are usually preferred to iron compounds because the latter leads to the formation of a hard, glass-like scale that is more difficult to remove and complicates sorbent regeneration [13].
Among aluminum sorbents, activated alumina is a relatively well-known sorbent with reasonably good regenerability controlled by pH. Adsorption on activated alumina or its precursor (pseudoboehmite or boehmite) has been tested for the removal of ions such as chrome (III) and (VI), fluoride, boron, arsenate, orthophosphate, nickel, cadmium, lead, etc. [27,28,29,30,31,32]. Of the few studies carried out for silica removal by adsorption, all agree that activated alumina is highly selective for silica removal [26,33,34], and this is an important advantage when complex industrial wastewaters are treated. However, there are insufficient fundamental studies to ensure the success of its application at the industrial scale, and the objective of the study described here is to study silica removal by adsorption onto activated alumina (γ-Al2O3) and its precursor (pseudoboehmite) at various sorbent dosages, pHs, and temperatures.
This study focused on the paper industry, specifically deinking paper mills, for three reasons. First, the paper industry is one of the largest fresh water consumers of the industry, fresh water consumption being one of the most important issues during papermaking operations [35]. Even though great efforts have been carried out during the last decades, the fresh water consumption in most papermaking processes is still as high as 5–20 m3/t, and even 50–70 m3/t for some special grades [10,36]. Second, deinking paper mills are characterized by having a high concentration of silica in process waters and in the effluent (50–250 mg/L) [24,25,37,38] resulting from the sodium silicate added to achieve the optical properties required in the final product. Due to the great variety of functions and good performance, its substitution is still difficult without affecting the quality of the final product [39]. Third, previous studies focused on deinking paper mills have demonstrated it is not possible to work with RO membranes for effluent reuse at recoveries higher than 20% without severe scaling problems, making this kind of effluent reuse scheme not feasible [14].
2. Materials and Methods
2.1. Materials
Water samples. The effluent from a paper mill producing newsprint from 100% recovered paper has been studied. The characterization of the effluent and its dissolved fraction, obtained through 0.45 µm PTFE syringe filtration, is shown in Table 1.
Sorbents. A commercial pseudoboehmite (Catapal® B), supplied by Sasol Limited, and its calcination product (γ-Al2O3) were used as sorbents. Dehydration of boehmites by heating causes its transformation to γ-Al2O3, with most calcination conditions being 500–600 °C and 4 h [27,40]. In the present study, 550 °C and 4 h were used as calcination conditions to ensure the complete dehydration of boehmites as confirmed by the thermogravimetric analysis (TG/DTG) of the pseudoboehmite (Figure S2, Supplementary Material). The full characterization of both sorbents is described in Section 3.1 and the Supplementary Material.
2.2. Metodology
Preliminary tests on silica removal were carried out at sorbent dosages of 0.5–20 g/L at an ambient temperature (20 °C) and initial pH of wastewater (8.5) using 4 h contact time.
The percentage of silica removal and silica uptake loading capacity (q, mg/g) were calculated by Equations (1) and (2), respectively, where C0 and CF are the initial and final concentrations of silica in solution (in mg/L), M is the sorbent dosage (g), and V is the volume of solution (L).
Secondly, the effect of initial pH (from 5 to 12) was studied by varying the pH with 0.1 M NaOH or 0.1 M H2SO4, using the sorbent dosages obtained from preliminary tests (15 g/L for pseudoboehmite and 5 g/L for γ-Al2O3), maintaining the temperature and contact time at 20 °C and 4 h, respectively.
Third, kinetic studies were carried out taking samples at pre-determined time intervals up to 16 h and filtering them through 0.45 μm PTFE syringe filters. These studies were carried out at initial pH 8.5 at three temperatures (20, 35, and 50 °C) and two dosages for each sorbent (7.5 and 15 g/L for pseudoboehmite, 2.5 and 5 g/L for γ-Al2O3). The uptake of the adsorbent at a time t, qt (mg/g) was calculated by Equation (3), where Ct is the concentration of silica at a given time t. Adsorption kinetics was studied using the Lagergren’s pseudo-first-order and pseudo-second-order models, while the intraparticle diffusion and Boyd models were used to determine possible adsorption mechanisms and rate limiting steps. The methodology is further detailed in the supplementary material.
Fourth, adsorption isotherms were carried out by varying sorbent dosages (from 0.5 to 20 g/L) at three temperatures (20, 35 and 50 °C) while keeping constant the initial pH (8.5) and initial silica concentration over 16 h contact time. The equilibrium silica uptake loading capacity (qe, mg/g) was obtained by Equation (4), where Ce is the equilibrium concentration of silica (mg/L) in solution. These data were analyzed by Langmuir and Freundlich isotherms, while thermodynamic parameters such as standard free energy, enthalpy, and entropy changes were calculated from the temperature dependence of equilibrium constants using the methodology described in the Supplementary Material.
All adsorption tests were carried out in a multiposition OVAN Therm Multimix magnetic stirrer using 200 mL sample volume and 600 rpm stirring rate. In all the cases, plastic beakers (polypropylene) were used to avoid silica contamination from glass beakers. Adsorption tests were carried out in duplicate and the experimental points represent the average from these two replicates. The average deviation between duplicates was always around 5%.
2.3. Analytical Methods
Water characterization. pH was measured using a GLP 22 pH-meter (Crison, S.A., Barcelona, Spain) and conductivity with a GLP 31 conductimeter (Crison, S.A.), according to Standard Methods 4500 and 2510, respectively. Chemical Oxygen Demand (COD) was photometrically measured by the Nanocolor COD 1500 Method (Macherey–Nagel GmbH, Düren, Germany) using an Aquamate UV–Vis spectrophotometer (Thermo Scientific Inc, Waltham, MA, USA), according to ISO 15705:2003. Color was measured by a PF-11 filter photometer (Macherey-Nagel GmbH).
Regarding silica determination, it is interesting to notice that silica species can be classified into three categories: reactive or soluble silica (which comprise polysilicic acid and small molecules such as dimers, trimers, and oligomers), colloidal or non-reactive soluble silica (highly polymerized species or particles larger than about 10–20 Å or 50 Å, depending on the authors), and non-reactive insoluble silica (also known as particulate or suspended silica, larger than colloidal and dissolved silica). There are several methods for the determination of silica, such as the inductively coupled plasma method (ICP), atomic absorption spectrophotometry method (AAS), and colorimetric methods. The ICP method is the only one that determines total silica, AAS determines soluble silica and part of the colloidal, and colorimetric methods determine only reactive or soluble silica [41]. In this work, reactive silica was routinely measured by flow injection analysis and photometric detection through silicomolybdate and the reduction to molybdenum blue method using a FIA Compact (MLE GmbH, Radebeul, Germany) according to DIN EN ISO 16264. However, in some selected samples, total silica was also measured using the ICP method. The values obtained by ICP and the colorimetric method were about the same, indicating most silica present in the water samples was reactive silica (polysilicic acid and small oligomers), while the contribution of colloidal and particulate silica was almost negligible.
Solids characterization. Textural properties of the sorbents were determined by the N2 adsorption/desorption isotherms at liquid N2 (77 K) using the BET method in Micromeritics ASAP 200 equipment. Micropore sizes and pore volume were calculated by the BJH method. Powder X-ray diffraction (XRD) spectra were recorded with a Philips X’Pert MPD X-ray diffractometer with an autodivergent slit fitted with a graphite monochromator using Cu–Kα radiation at a scanning speed of 3 °/min, operated at 45 kV and 40 mA. Microscope images were taken with a JEOL JSM-6400 Scanning Electron Microscope (SEM) with an energy dispersive X-ray analyzer (EDS system) which enables compositional analysis. Elemental X-ray maps were obtained from selected solids with a JEOL Superprobe JXA-8900M equipped with five spectrometers. Thermal analysis (TG/DTG) of the samples was carried out from 30 to 1000 °C both in inert conditions (N2, 50 mL/min, at a heating rate of 10 °C/min) and in air (30 mL/min, at a heating rate of 5 °C/min) using a Seiko Exstar 6000 TGA/DTA thermobalance. For X-ray fluorescence (XRF) analyses, an AXios (PANAnalytical, Malvern, Britain) wavelength dispersive XRF (4 kW) spectrometer was used. Finally, FTIR analyses were carried out on KBr pellets (2 mg of sample and 98 mg of KBr). A Nicolet Nexus 670 spectrometer was used for recording the spectra (400–4000 cm−1) at 4 cm−1 resolution; 32 scans were taken for both the background and the sample.
3. Results and Discussion
3.1. Sorbents Characterization
The composition of the commercial pseudoboehmite Catapal® B, as given by the supplier, is: 72% Al2O3, 0.25% C, 0.01–0.015% SiO2, 0.005–0.015% Fe2O3, 0.01–0.20% TiO2, and 0.002% Na2O. The molecular formula, calculated from SEM-EDX measurements, is AlOOH·0.6 H2O (Al wt.%: 41.4 ± 0.5; O wt.%: 58.6 ± 0.7). Calcination of the pseudoboehmite at 550 °C produced its successful dehydration as demonstrated by its similar composition (Al wt.%: 48.3 ± 0.4; O wt.%: 51.7 ± 0.7) to pure Al2O3 (Al wt.%: 47.1; O wt.%: 52.9).
Figure 1 shows the XRD spectra of pseudoboehmite before and after calcination. The spectra show the typical pseudoboehmite peaks (JCPDS 01-1283) found at 13.7° (020), 28.4° (120), 37.9° (140), 49.4° (200), 56.0° (151), and 64.7° (231). The interlinear spacing corresponding to the most intense peak (reflection 020) was around 0.64 nm, which agrees with the higher interlinear spacings found in pseudoboehmites compared to well-crystallized boehmites (around 0.61 nm) [42]. After pseudoboehmite calcination, the most intense peaks were found at 37.5° (311), 46.6° (222), 60.8° (511), and 67.0° (411), confirming its successful transformation to γ-Al2O3 (JCPDS 29-63).
The average crystallite size for both sorbents was calculated from the Debye–Scherrer equation with a shape factor k = 0.9 and λ = 0.154 nm (Equation (5)), where FWHM is the full widths at half-maximum (in rad) and θ is the reflection angle (in rad).
The calcination did not noticeably change the crystallite size of the sorbent. The average crystallite size for pseudoboehmite, determined from three reflections (020, 120, and 031), was 5.8 ± 1.3 nm, while the value for γ-Al2O3 (calculated from reflections 400 and 440) was 5.7 ± 1.1 nm. These values agree with the typical values found in the literature [43].
Both sorbents were analyzed by SEM (Figure S1, Supplementary Materials). The d50 for pseudoboehmite, given by the supplier, is 60 µm, which is in agreement with SEM measurements. After calcination, both the shape (almost round) and the particle size of γ-Al2O3 were essentially the same.
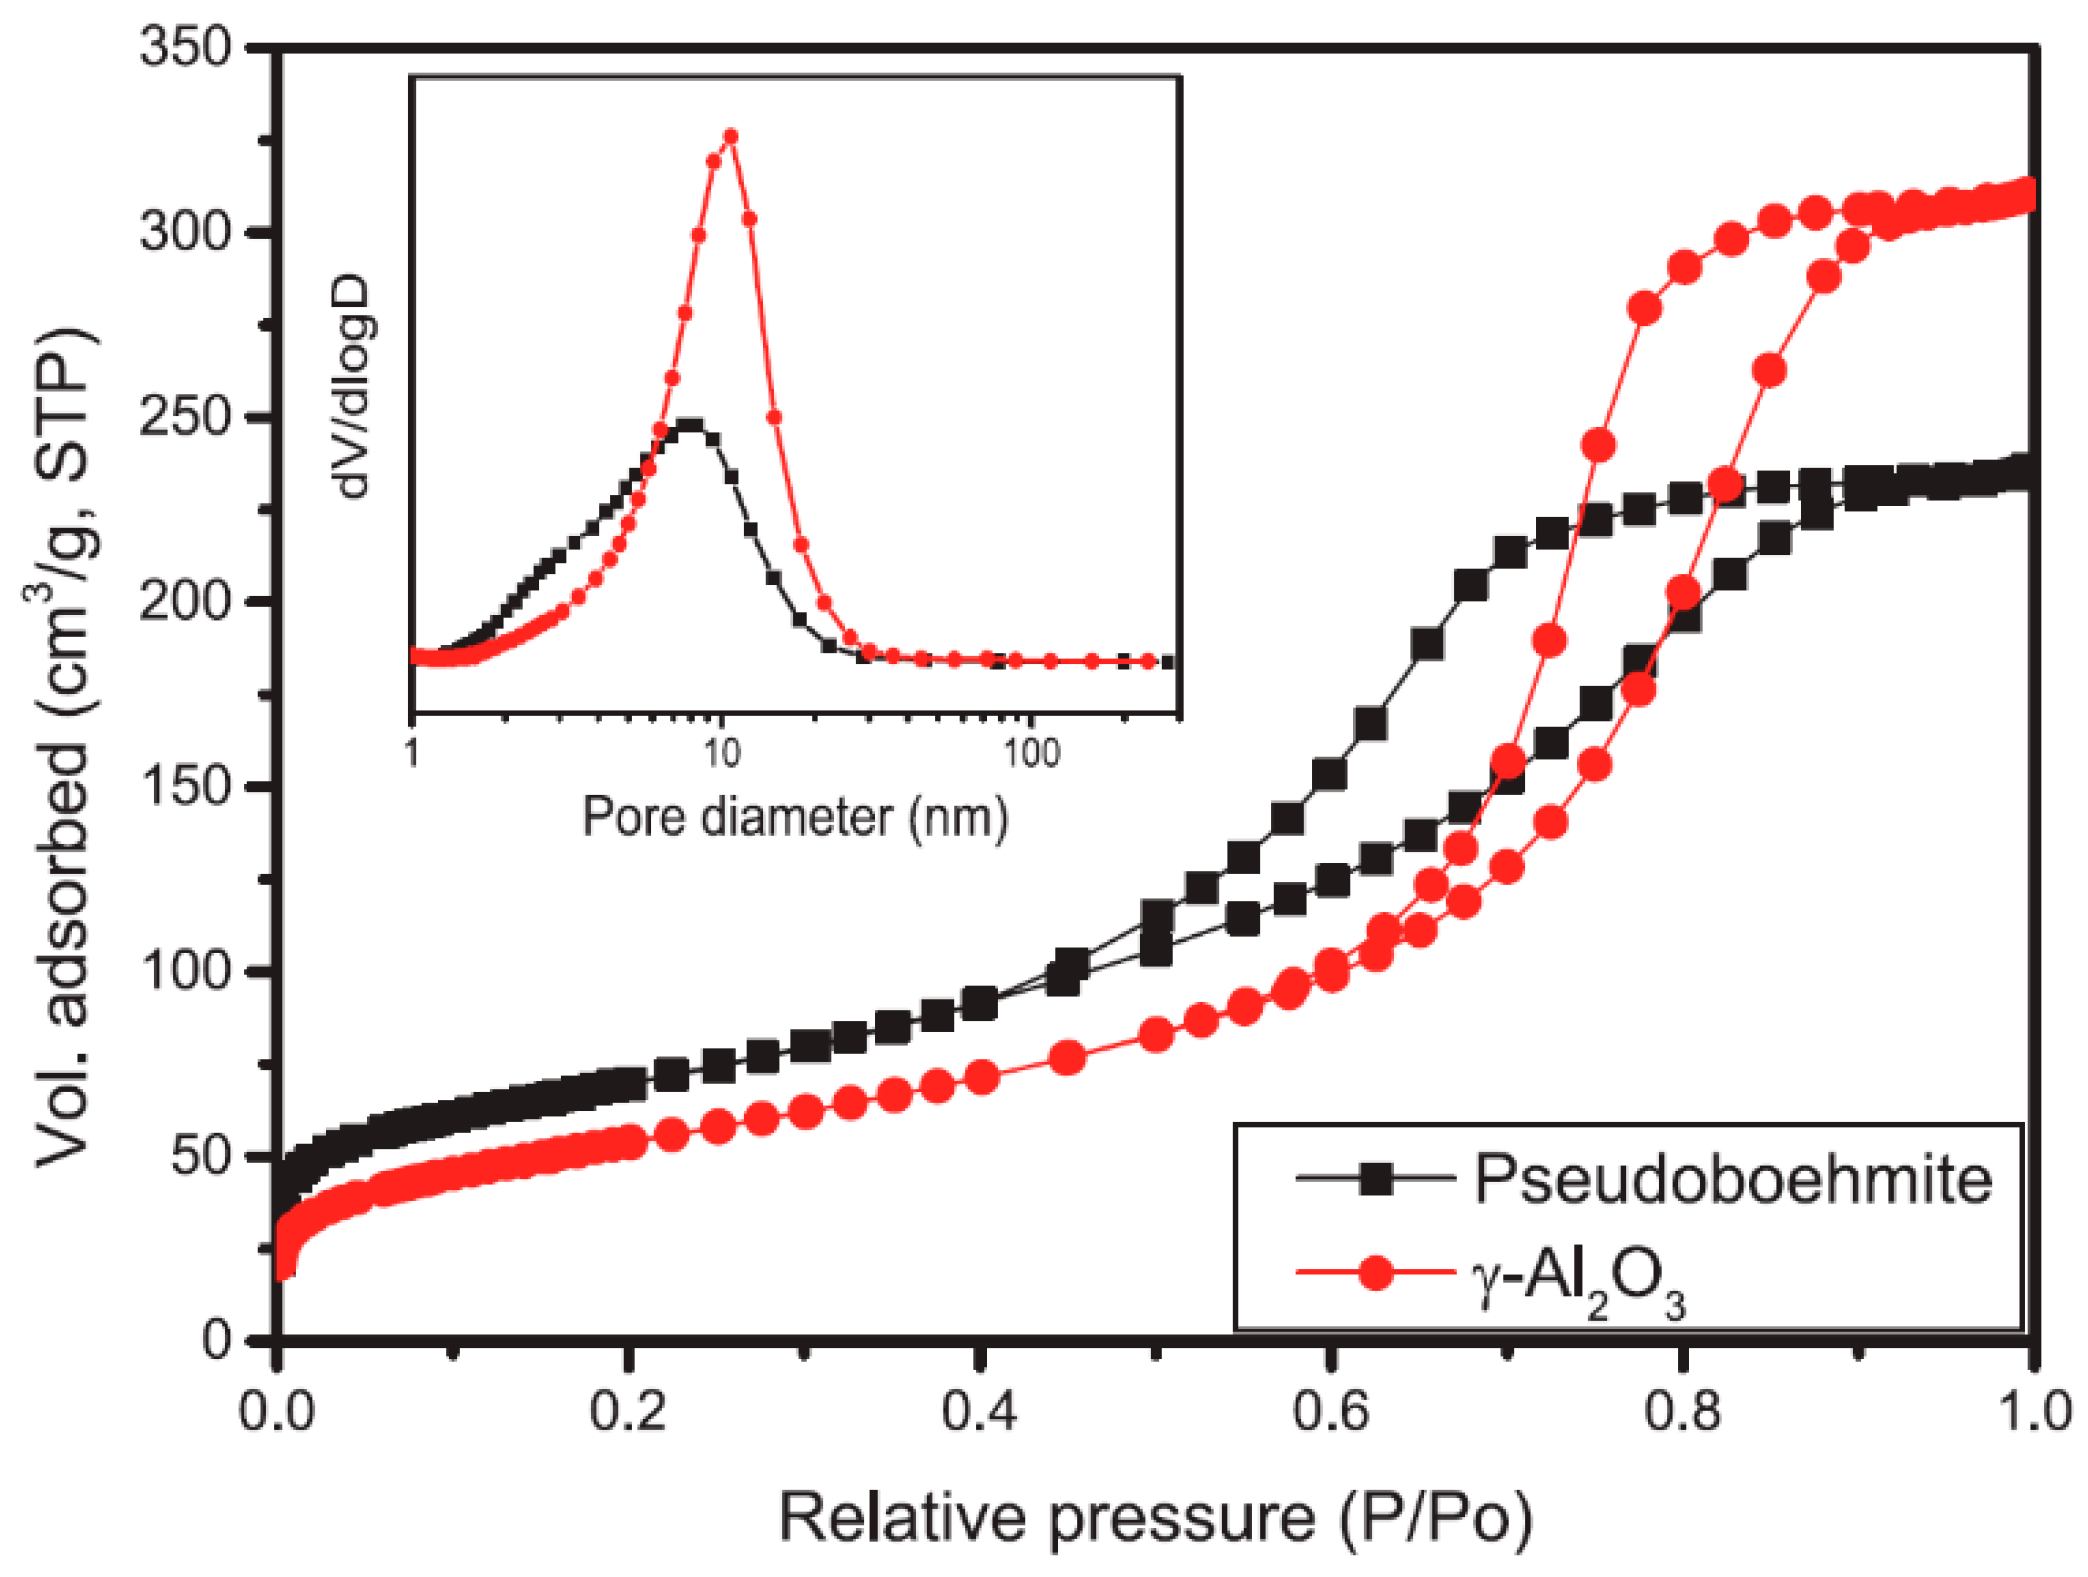
Figure 2 shows the nitrogen adsorption–desorption isotherms and the corresponding pore size distributions of the sorbents. In both cases, isotherms belong to type IV; however, the hysteresis loops are different in size. The isotherms were characterized by a relatively well-defined steep region in the desorption branch of the isotherm curve, at a P/P0 value around 0.45 for pseudoboehmite and 0.50 for γ-Al2O3, which is a characteristic of capillary condensation within uniform mesopores [27].
Textural properties of the sorbents are shown in Table 2. The calcination of the pseudoboehmite increased the average pore size and the pore volume, while it decreased the BET surface, in agreement with existing literature [30,44,45]. As can be seen in the pore size distribution curves (Figure 2), calcination produced a slight decrease in the smallest pores by sinterization, but an important formation of large pores which cannot be attributed to the collapse of the smallest pores into larger pores, as the total pore volume increased. Consequently, both the average pore size and the pore volume increased, while the BET surface slightly decreased. BET surface of the γ-Al2O3 precursors is usually reduced after calcination, the greater calcination temperature, the lower BET surface; however, the calcination largely improves the surface reactivity while securing the existence of a stable structure.
Furthermore, both sorbents were characterized by TG/DTG and FTIR, and the point of zero charge (PZC) was determined (see Supplementary Material, Section S2: Characterization of Sorbents).
3.2. Effect of Sorbent Dosage
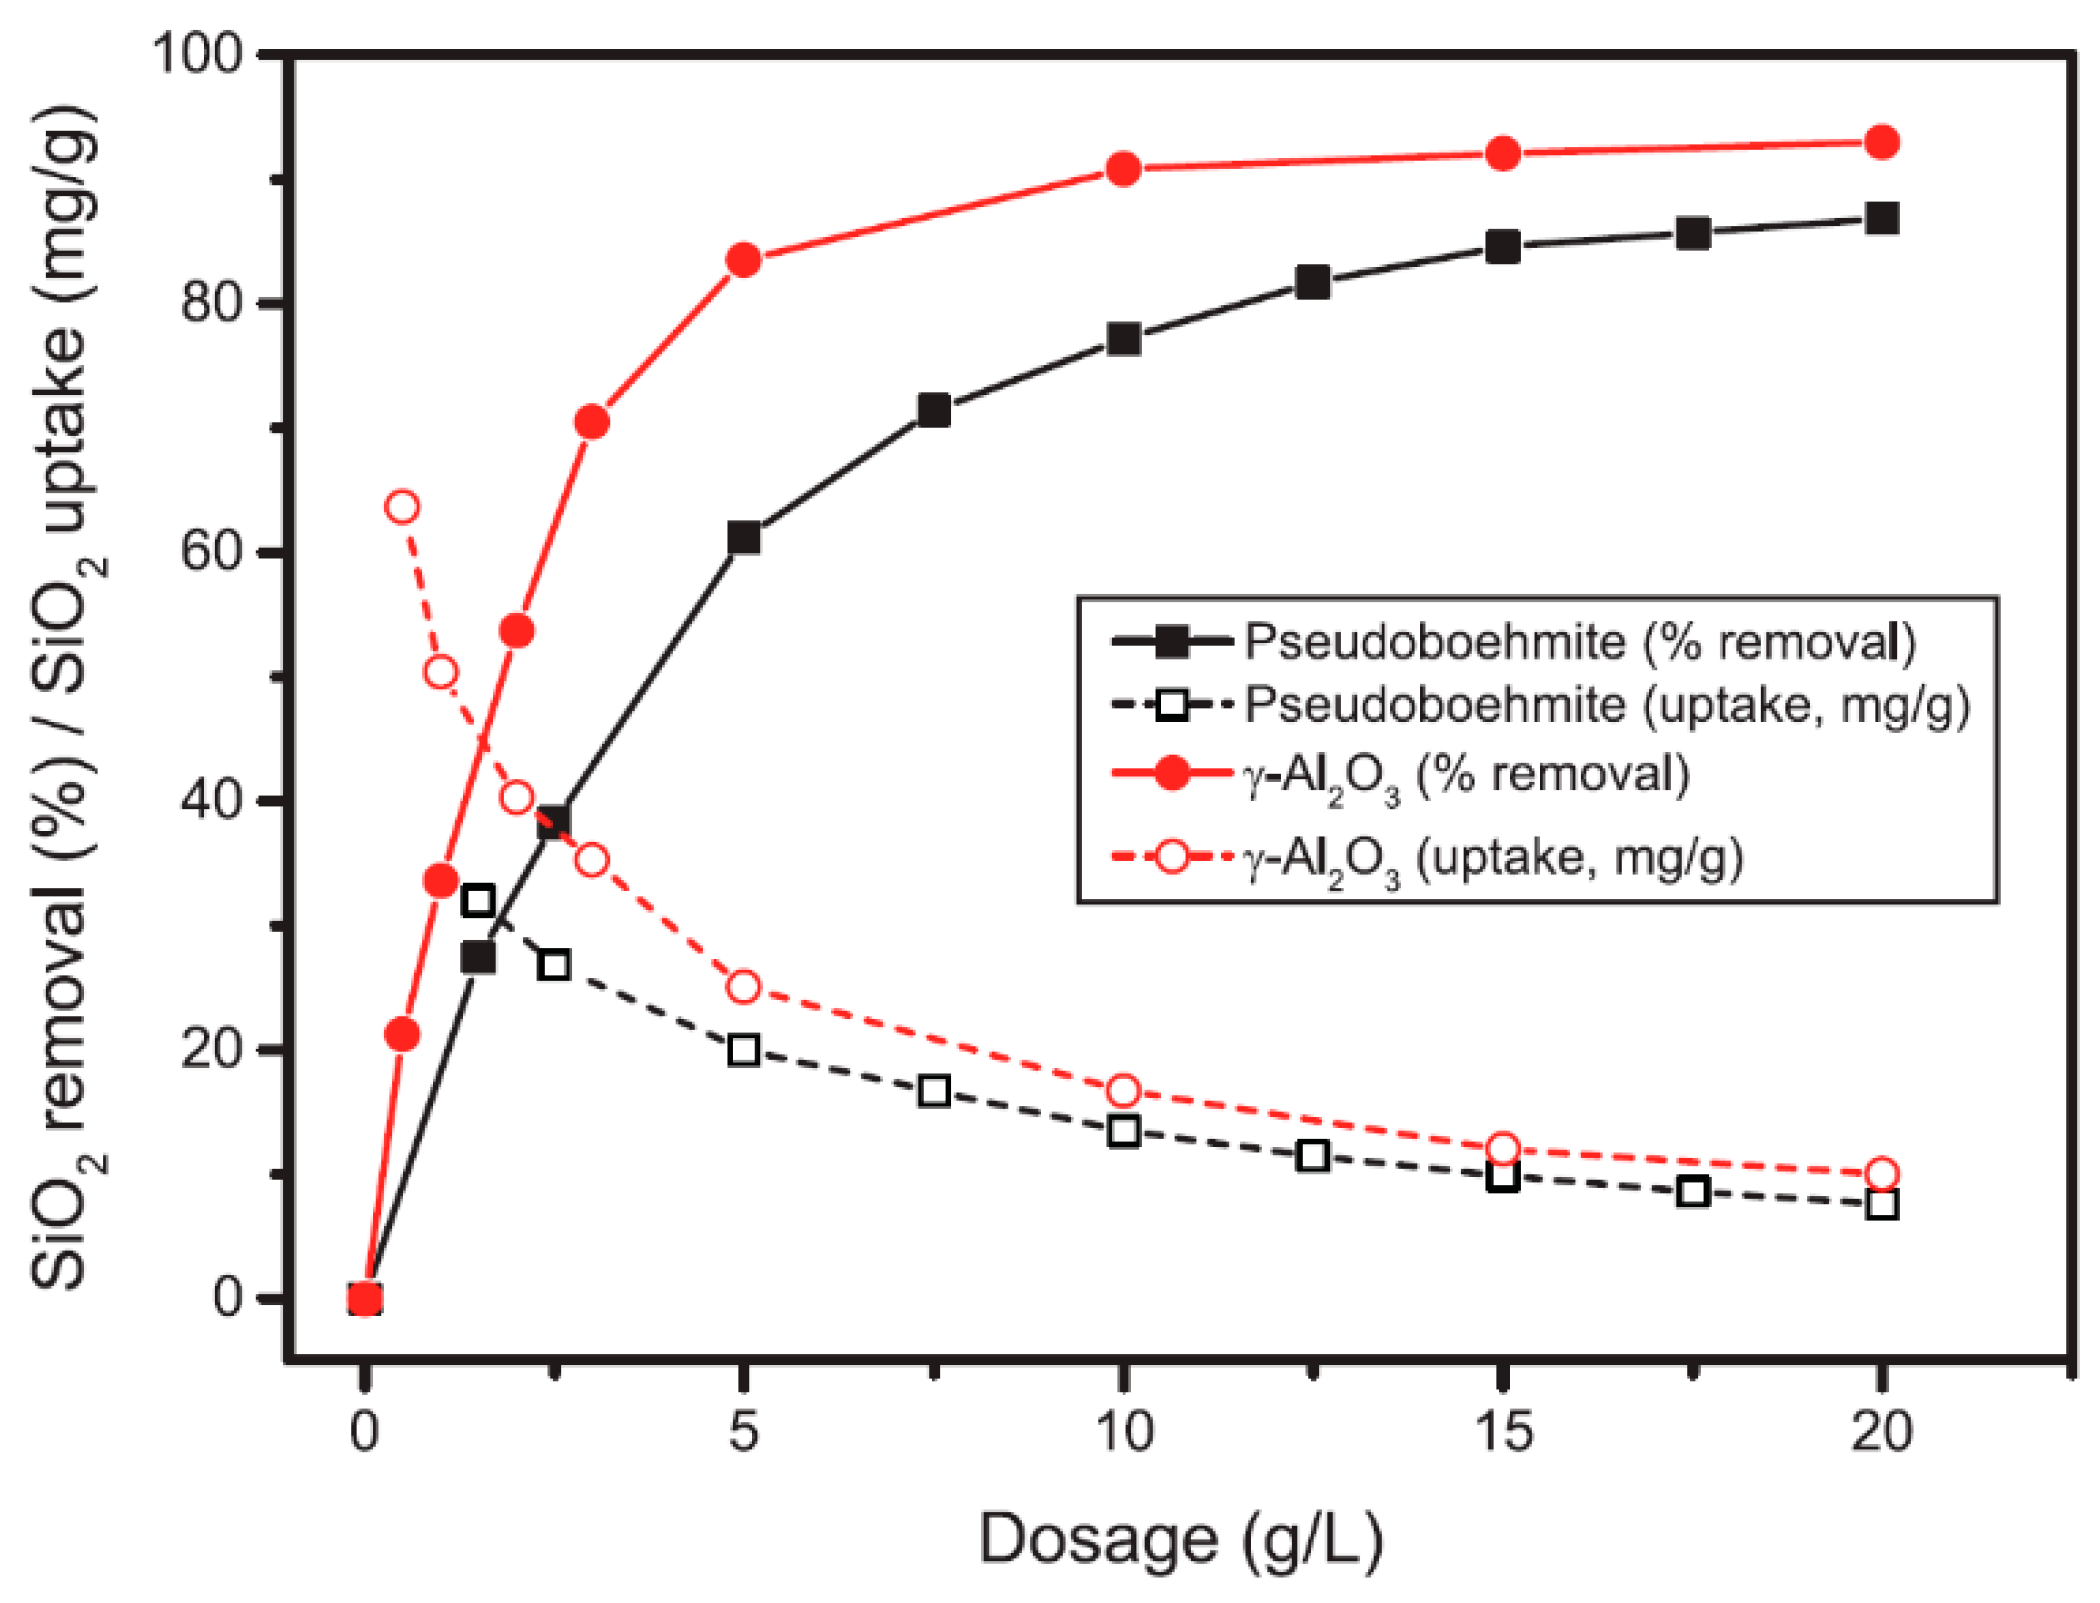
Figure 3 shows that silica removal increased with sorbent dosage due to increased sorbent surface area and the availability of more adsorption sites, reaching an equilibrium value as further increases were minor. This equilibrium value was obtained at around 15 g/L for pseudoboehmite (85% silica removal) and 10 g/L for γ-Al2O3 (95% silica removal). At all the dosages, γ-Al2O3 was more efficient than pseudoboehmite. The maximum difference in silica removal efficiency with both sorbents was obtained at intermediate sorbent dosages (2.5–5 g/L); at these sorbent dosages, the silica removal obtained with γ-Al2O3 was around 23% higher than with pseudoboehmite. At higher dosages, the differences in silica removal decreased to 15.7% (at 7.5 g/L) and maintained being almost stable to 6–7% (at 10–20 g/L). The highest efficiency of γ-Al2O3 for silica removal cannot be explained by its BET surface as this is 24.1% lower than that of pseudoboehmite (180.0 vs. 237.2 m2/g). The highest value of γ-Al2O3 is explained by a combination of two facts. First, the pore volume and the average pore size increased from 0.362 cm3/g to 0.476 cm3/g (31.5% increase) and from 6.1 nm to 10.6 nm (42.4% increase), respectively, after calcination. Even though most silica in this study were in the soluble or reactive form, i.e., polysilicic acid and small molecules such as dimers, trimers, and oligomers, the tendency of silica to polymerize to amorphous silica particles which could block of the smallest pores is well known [46]. Second, it is well established that the calcination of boehmites largely increases the surface reactivity while securing the existence of a stable structure of the sorbent [47].
Similar efficiencies have been obtained in the few references using activated alumina for silica removal. Sanciolo et al. [34], for example, achieved 90% silica removal efficiencies with 10 g/L dosage (pH 8.6, 20–45 °C, industrial wastewater with 160 mg/L SiO2), while Sasan et al. [26] obtained 29% silica removal using 2 g/L activated alumina (pH 8.8, 25 °C, synthetic water with 100 mg/L SiO2).
To avoid silica scaling in the treatment of this effluent by RO, taking into account the initial silica level (175 mg/L SiO2), the typical 97–98% SiO2 rejection in RO, and the theoretical silica solubility (around 100–150 mg/L SiO2 at 25 °C), the target for the present treatment is to achieve 75–80% silica removal (residual 35–50 mg/L SiO2 entering the RO membranes). At these conditions, it would be possible to work at regular recoveries in RO membranes (65–80%), avoiding irreversible membrane fouling by silica scaling. According to Figure 3, this target can be achieved with around 2.5–5 g/L for γ-Al2O3 or 7.5–15 g/L for pseudoboehmite.
3.3. Effect of pH
The removal of silica was studied as a function of pH from pH 5 to 12; pHs < 5 were not tested due to aluminum dissolution at pHs below 4.3 [46]. According to the results from Section 3.2, the dosage of pseudoboehmite and γ-Al2O3 were fixed to 15 g/L and 5 g/L, respectively. Besides silica removal, COD and color removal were also measured. Final pH was always slightly greater than initial pH at lower pHs than PZC of the sorbents (pH 7.6–7.8), and slightly lower at greater pHs than PZC. Maximum differences between initial and final pH were around one pH unit, this difference being almost zero at initial pHs 7 to 9. As expected, the difference between the initial and the final pH was greater for pseudoboehmite than for γ-Al2O3 due to the protonation and deprotonation of the surface Al–OH groups depending on pH [29,48].
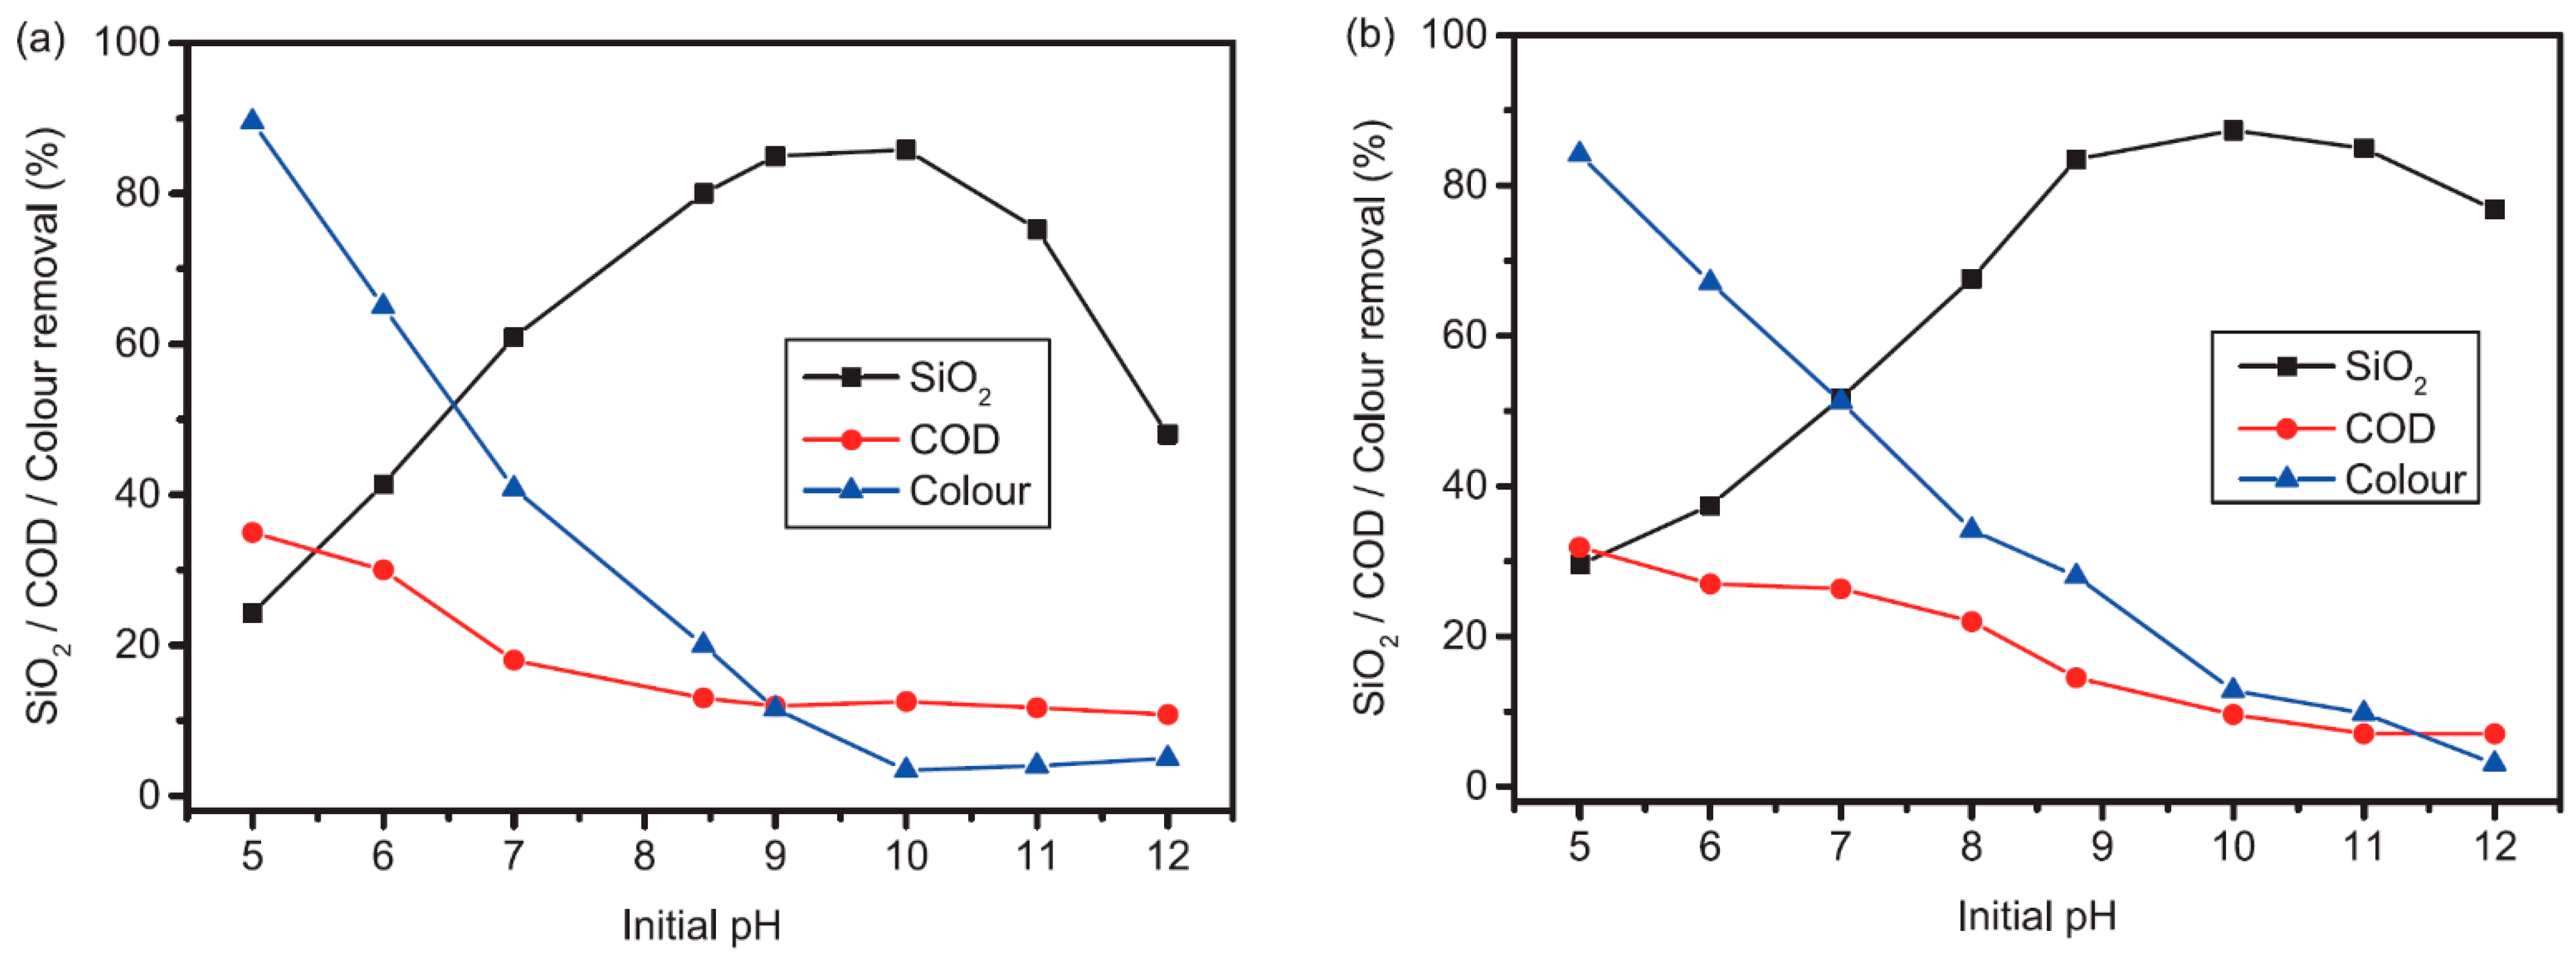
Figure 4a shows the silica removal obtained at different initial pHs for pseudoboehmite. Silica removal increased continuously from the lowest initial pH tested (pH 5) (25% removal) to the highest pHs, reaching a maximum at around pH 8.5–10.5 (85% removal) and then decreasing sharply to 50% removal at initial pH 12. The optimum initial pH fits well with the initial pH of the wastewater, which is an important advantage compared to other silica removal techniques, such as coagulation or removal during softening, which require pH adjustment to highly alkaline for optimal results [23,24,25]. COD removal decreased from 35% (initial pH 5) to around 10% (initial pH 8) and then remained almost constant with the pH. The same behavior was observed in color removal, which decreased from around 90% (initial pH 5) to 20% (initial pH 8) and then remained almost constant at 5–10% removal at higher initial pHs.
Similar results were obtained with γ-Al2O3. Silica removal increased continuously from the lowest initial pH tested (pH 5) (30% removal) to a maximum at initial pH 8.5–11 (85% removal) and then decreased to 75% removal at initial pH 12 (75% removal) (Figure 4b). COD removal decreased from 25–30% at the lowest initial pHs (pH 5–7) to 10% at pH 10 and then remained almost constant at higher initial pHs. Similarly, the color removal decreased from around 85% at initial pH 5 to 12% at initial pH 10 and then remained almost constant at higher initial pHs.
In both cases, a reverse relationship between the removal of silica and organic matter (COD and color) is obtained, which was also observed in previous studies [23,24,25,49]. This means there is a competition for the adsorption sites between organics and silica, the removal of organics being favored at acidic pHs and the removal of silica at alkaline pHs.
pH affects both the surface charge of the adsorbents and the distribution of silica species. As commented before, pseudoboehmite is an amphoteric solid material due to the protonation and deprotonation of the surface at the surface Al–OH groups, which leads to the formation of positive (Al–OH2+) or negative (Al–O−) charges on the surface, depending on pH [29,48,50] (see Equations (6) and (7)). At pHs < PZC, the surface charge of pseudoboehmite becomes cationic by reaction with H+ from the solution and thus producing an increase in the pH of waters (Equation (6)), while at pHs > PZC, the surface of pseudoboehmite became anionic by deprotonation of the surface group Al–OH, thus decreasing the pH of the waters (Equation (7)).
On the other hand, pH affects the speciation and polymerization of silica in aqueous solutions. In the tested waters, most silica is soluble or reactive silica (175 mg/L SiO2 vs. 177 mg/L total silica), the colloidal and particulate silica being almost negligible. As the main origin of silica in wastewaters is the use of sodium silicate as a process additive during pulping, most silica should be present as orthosilic acid (H4SiO4). Depending on the pH, orthosilic acid exists in the form of H4SiO40, H3SiO4−, or H2SiO42− (Equations (8)–(10)). According to the values of pK1 and pK2, it can be expected that at pHs < 8.5, silica mainly exists as H4SiO40 species, which lacks ionic charge, while at pHs > 8.5, the amount of silica present in the form of both H3SiO4− and H2SiO42− increases gradually [37,51].
According to these facts, alkaline pHs (pHs greater than 8.5) would be detrimental for silica removal as the silica species and the surface of the sorbents become negative. In this sense, the optimum pH for silica removal in previous studies was always between 8 and 9 [33,34,52]. In the present study, the highest silica removal was also obtained at pH around 8.5; however, silica removal efficiency was almost constant in an extended pH range of 8.5 to 10.5. One possible explanation is that higher pHs could be beneficial for silica removal by other parallel processes, such as adsorption on other sorbents and/or precipitation. It is well known that at high pHs and hardness, both CaCO3 and Mg(OH)2 can precipitate, and silica can be adsorbed on these precipitates; furthermore, silica can also precipitate with calcium and/or magnesium forming calcium and magnesium silicates of different stoichiometry [21,22,38,39,53,54]. The precipitation of all these species is favored at higher pHs. These mechanisms are supposed to have only a small effect on silica removal due to the low hardness of waters (35.8 mg/L Ca and 3.1 mg/L Mg); however, this could be enough for slightly extending the optimal pH of the adsorption treatment from 8.5 to around 10.5. As is commented in Section 3.6, calcium carbonate precipitates were found in the used sorbents.
At high alkaline pHs (pHs > 10–11), a sharp decrease in silica removal was observed, which can be explained by the increase in the electrostatic repulsion between silica and the sorbent, resulting from the generation of negative surface sites at these pHs and silica ionization [33,50]. The further the pH of the solution from the pH of the PZC, the higher negative charge density of the sorbent and thus the repulsion between silica and the sorbent.
According to the results obtained, it seems electrostatic interactions have an influence in silica adsorption; however, there are also other adsorption mechanisms that take place which justify why at optimum pHs (8.5–10.5) both a significant amount of silica is in the form of H3SiO4− or H2SiO42− species and the surface charge of the sorbents is negative. In previous studies, for example, Leyva-Ramos et al. [48] found the adsorption of fluoride on activated alumina was mainly due to both electrostatic interactions as well as chemisorption between fluoride solution and the basic sites of the activated alumina surface, but not by ion exchange. On the contrary, Gong et al. [55] found that the fluoride adsorption on activated alumina was mainly due to ion exchange, although a partial contribution of electrostatic interaction and chemical adsorption was also observed. Comparing the values of adsorption energy and activation energy obtained in the present study (see Section 3.4 and Section 3.6) with those suggested by Inglezakis and Zorpas [56] to determine different adsorption mechanisms, it can be hypothesized that the main adsorption mechanisms involved in silica removal by pseudoboehmite is a combination of ion exchange and chemisorption, while in the case of γ-Al2O3, it is a combination of ion exchange and physisorption.
3.4. Adsorption Kinetics
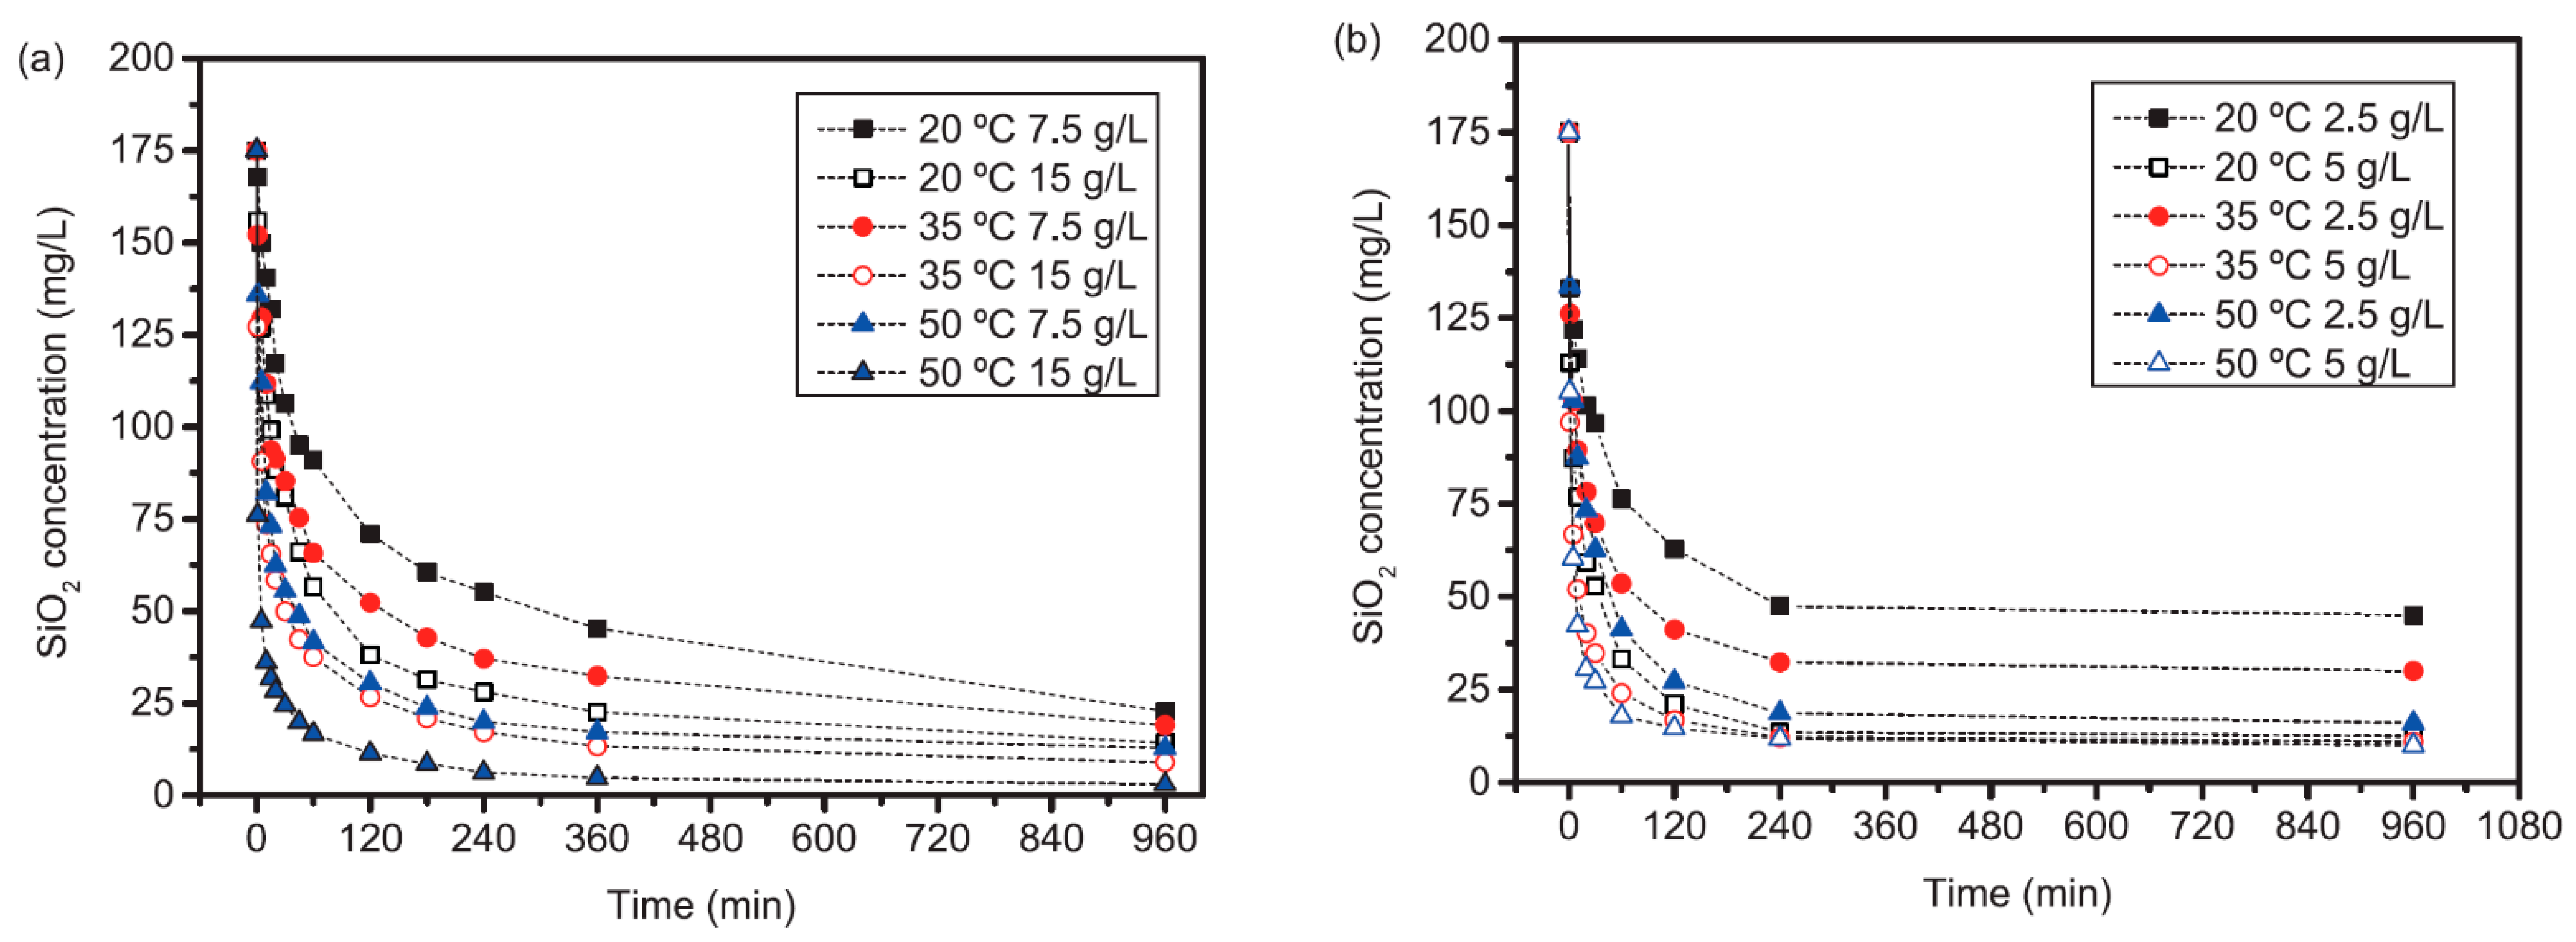
As shown in Figure 5, the kinetics of silica adsorption are fast, especially in the first 10–30 min, then the adsorption rate slows down as silica concentration approaches the equilibrium concentration. The time necessary to achieve equilibrium varied from around 1 h to 4 h, depending on the sorbent dosage and temperature. In all cases, higher sorbent dosages and temperatures required shorter contact times to reach equilibrium, as also observed by Sanciolo et al. [34] Similar results were obtained by Bouguerra et al. [33] and Sanciolo et al. [34], who found most silica adsorption occurred in the first 15–20 min. However, they found silica removal did not vary noticeably at times longer than 1 h, while in the present study the time to achieve equilibrium can be up to 4 h. The faster kinetics observed by Bouguerra et al. [33] could be explained by the high dosage of alumina used (25 g/L) compared to the present study (the particle size of the sorbent was not reported). On the other hand, the faster kinetics found by Sanciolo et al. [34] are justified by the smaller size of the activated alumina used (d50 < 15 µm vs. d50 ≈ 60 µm) as the sorbent dosages were like those used in the present study (2–10 g/L).
3.4.1. Lagergren’s Pseudo-First- and -Second-Order Models
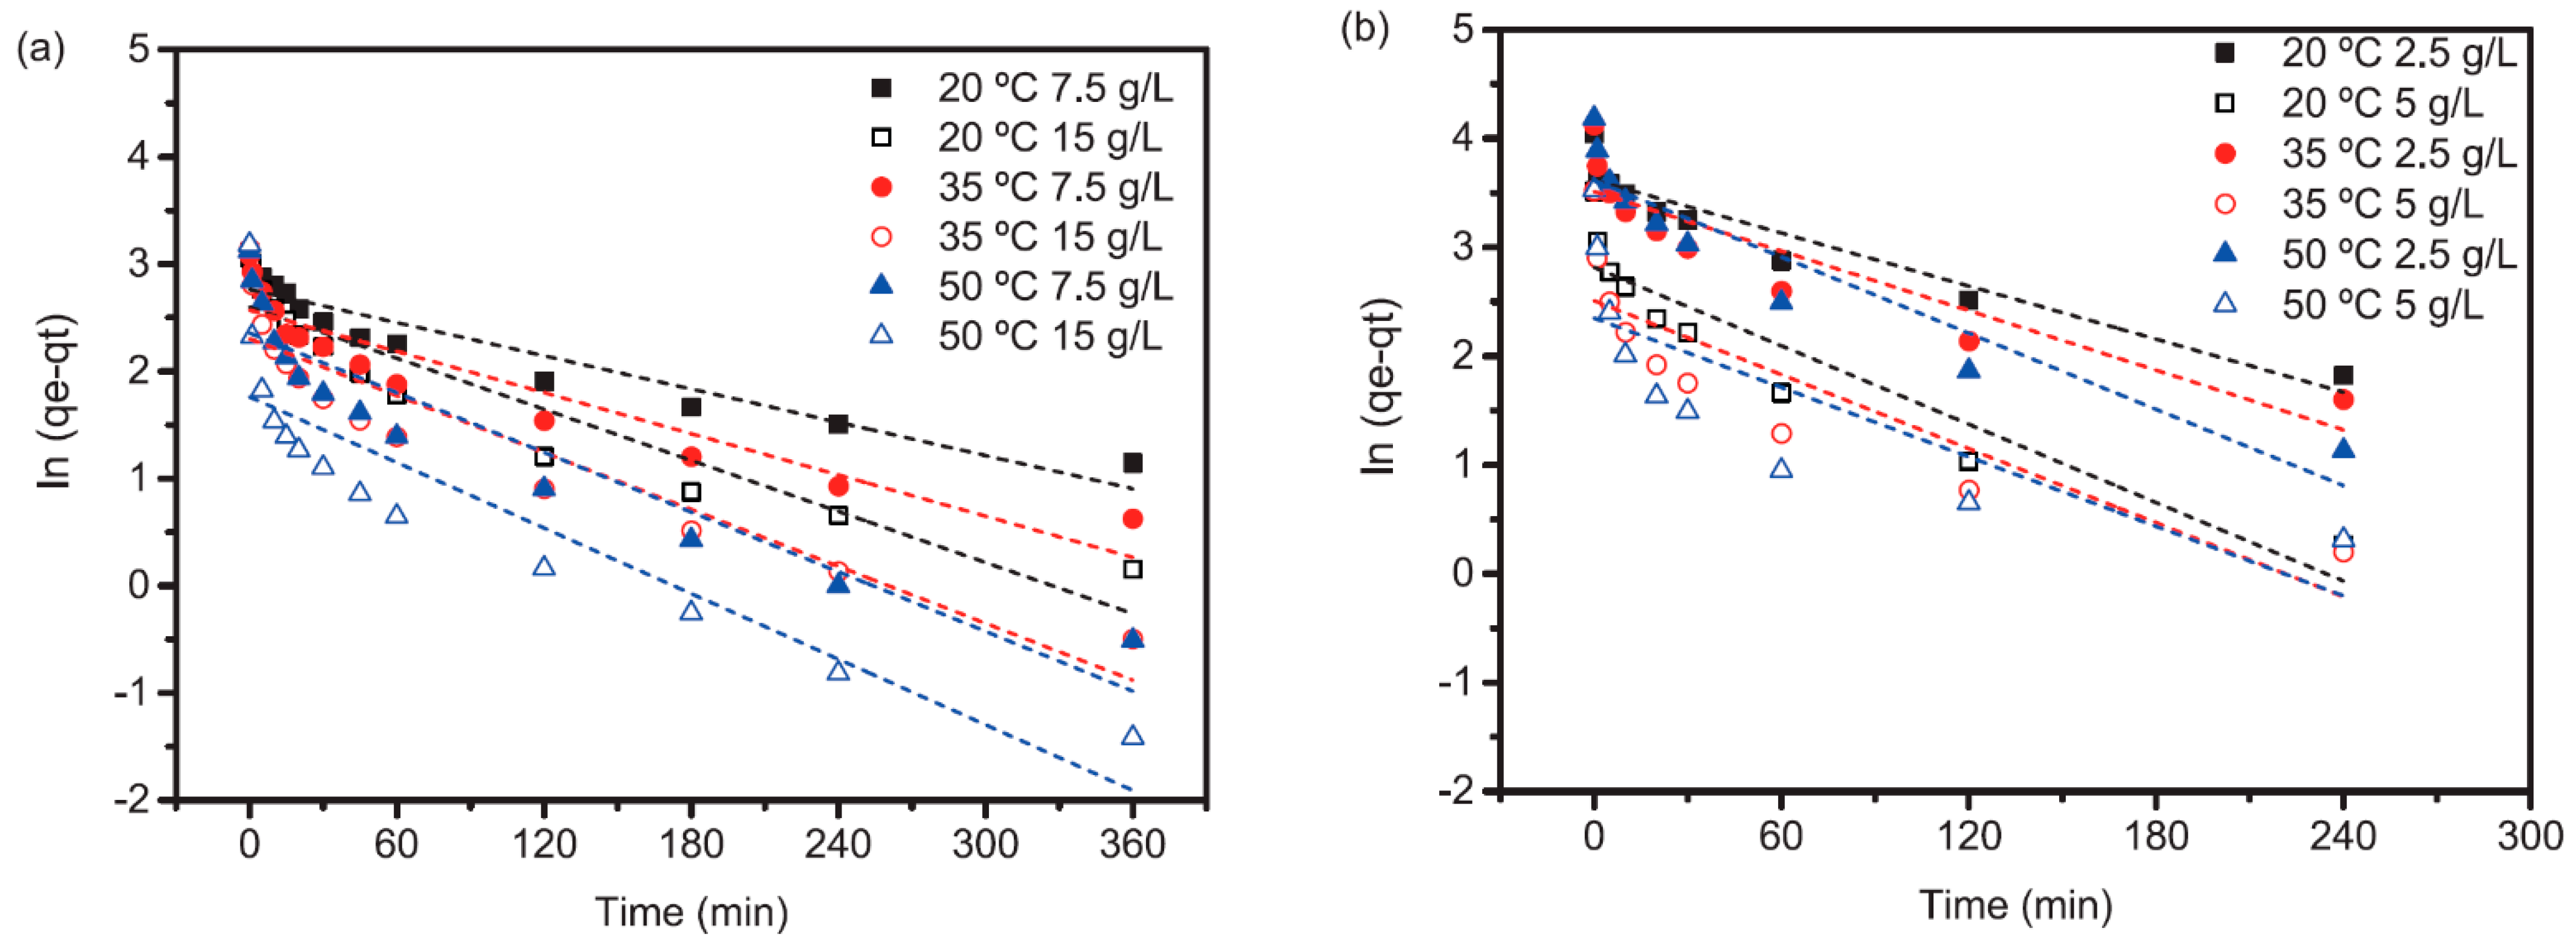
The kinetic data were analyzed by Lagergren’s pseudo first-order (Figure 6) and pseudo second-order rate (Figure 7) models. The Lagergren’s pseudo second-order kinetics always gave the best fit to the experimental data with R2 > 0.99 compared to R2 in the 0.57–0.90 range for Lagergren’s pseudo-first-order (Table 3). This means that silica removal rate is proportional to the square number of unoccupied sites on the sorbent, and thus the fast initial rate of silica removal is explained by the availability of free adsorption sites on the activated alumina. The pseudo-second-order model also fitted best silica adsorption in the previous literature, either on activated alumina [33] or on activated alumina and hydrotalcites [57]. As expected, kinetics were faster at high sorbent dosages: 2–2.5 times higher for 15 g/L compared to 7.5 g/L pseudoboehmite, and around 4 times higher for 5 g/L compared to 2.5 g/L γ-Al2O3.
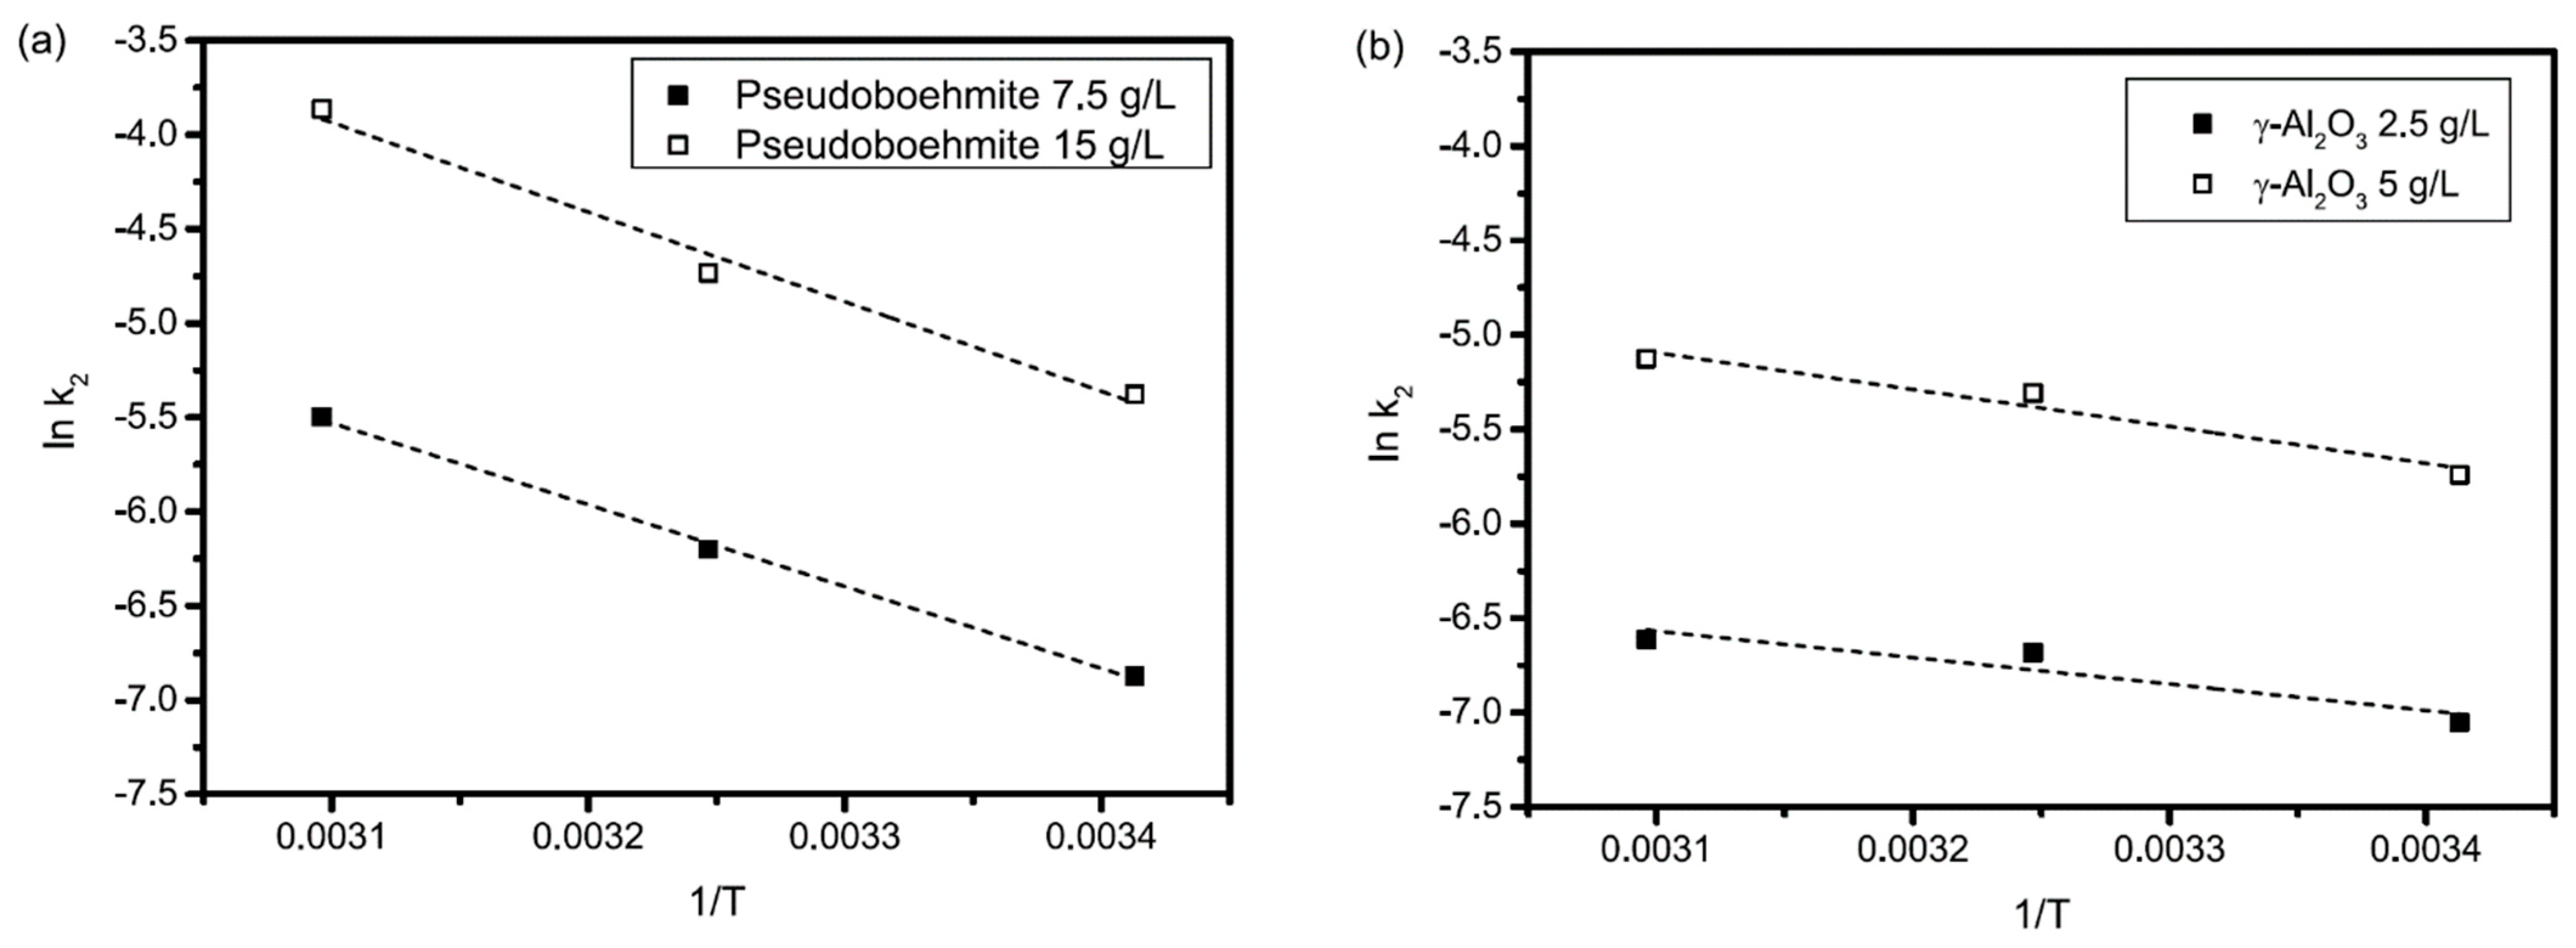
From the pseudo-second-order kinetic constant (k2) and using the Arrhenius equation, the energy of activation for silica adsorption was determined by Equation (11), where A0 is a constant called frequency factor (g/mg·min), Ea is the energy of activation (J/mol), T is the solution temperature (K) and R the gas constant (8.314 J/mol·K).
Figure 8 shows the Arrhenius plots and Table 4 their fit results. The activation energy found at the two dosages tested of each sorbent was similar, around 38 kJ/mol for pseudoboehmite and 14 kJ/mol for γ-Al2O3. The higher activation energy for pseudoboehmite indicated silica was more strongly adsorbed on pseudoboehmite than on γ-Al2O3. Although there is not a sharp distinction between physisorption and chemisorption, the activation energies found, especially for γ-Al2O3, are typical for physical adsorption (5–40 kJ/mol). Chemical sorption usually requires higher activation energies (40–800 kJ/mol).
3.4.2. Intraparticle Diffusion and Boyd Models
Kinetic data were further analyzed by intraparticle diffusion and Boyd models aiming to determine the rate-limiting steps in adsorption. The overall adsorption rate in a porous sorbent is carried out through three consecutive steps: (1) external mass transport, (2) intraparticle diffusion, and (3) adsorption on active sites inside the pores. The third step is usually assumed to be rapid and considered negligible for adsorption kinetics; therefore, the overall rate of adsorption is usually controlled by either external mass transport or intraparticle diffusion, or a combination of both mechanisms.
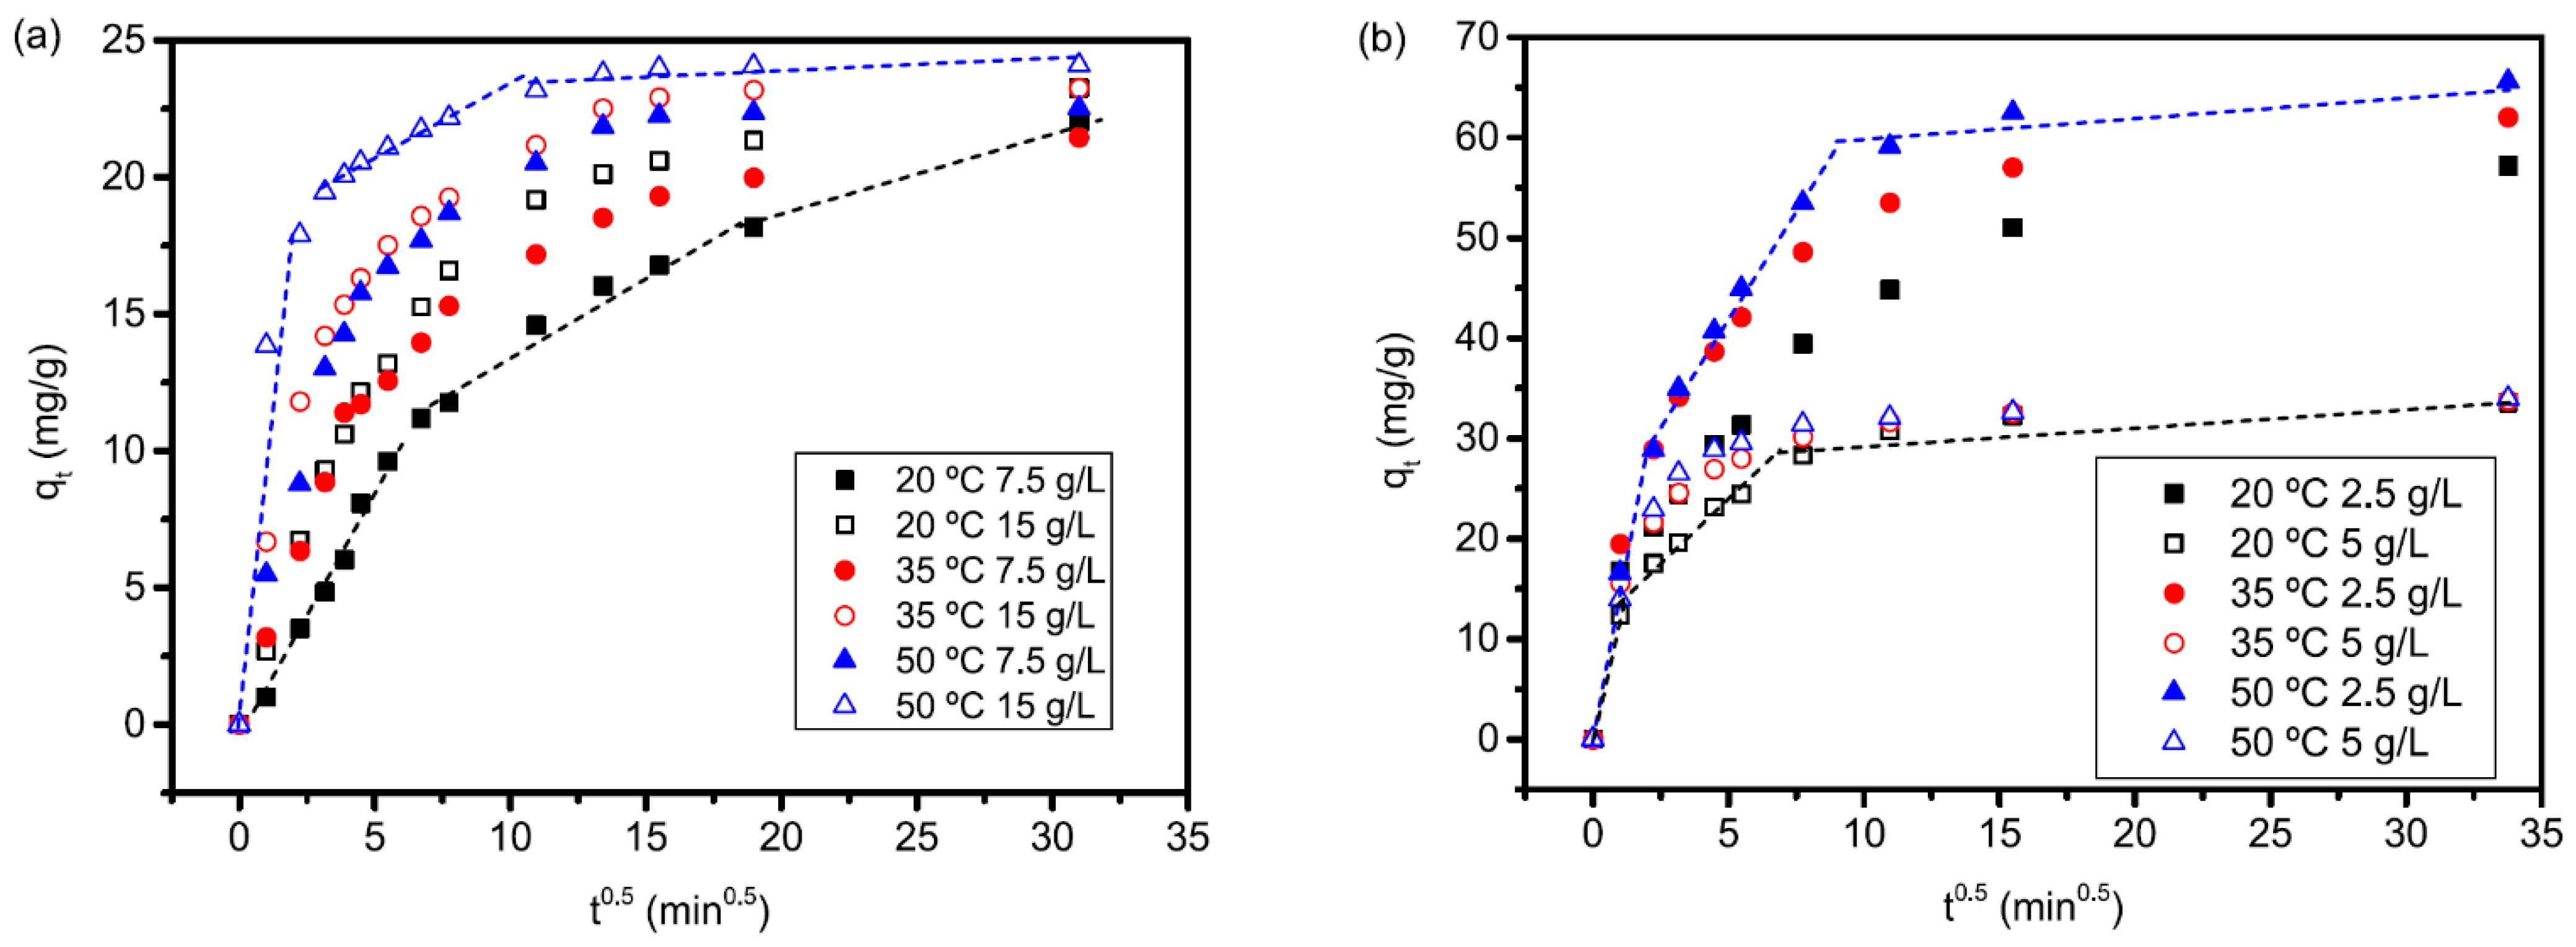
Figure 9 shows the intraparticle diffusion model plots (qt vs. t0.5). If a linear graph which passes through the origin is obtained, then intraparticle diffusion is the only rate-limiting step. However, three main linear regions were identified, the third linear region being more evident for γ-Al2O3 and at the highest temperatures tested (35–50 °C) (the conditions at which the highest silica removals were obtained). For a better visualization, these three linear regions were indicated only in some cases by dashed lines. The three regions found in the qt vs. t0.5 plot suggest the adsorption process proceeds by the following three steps: (a) external mass transport (the first linear region) which was completed within the first 5–25 min, depending on the conditions tested, (b) intraparticle diffusion or pore diffusion (the second linear region), and (c) the adsorption of the adsorbate on the interior surface of the adsorbent (the third linear region); this last step is the final equilibrium step where intraparticle diffusion starts slowing due to the low adsorbate concentration in the solution. If we focus on the second linear region, which is the one related to intraparticle diffusion, the linear plot did not pass through the origin, indicating at this stage intraparticle diffusion was not the only rate-controlling step and the external mass transfer also controlled the silica adsorption to some degree. In summary, external mass transfer is the rate-limiting step at the beginning of the process (first 5–25 min), and then a combination of external mass transfer and intra-particle diffusion were the rate-limiting steps.
Linear fits for the three different steps have been carried out for deeper discussion as proposed by Granados-Correa et al. [29] (Table 5). In all cases, the external transport (kip,1) was faster than the intra-particle diffusion (kip,2) and the latest linear region (kip,3), which indicates that intra-particle diffusion, or, more exactly, the combination of external mass transfer and intra-particle diffusion of the second step, is governing total adsorption rate. In all the cases kip,1 was greater for γ-Al2O3 than for pseudoboehmite, which means external diffusion is faster with γ-Al2O3 than for pseudoboehmite, which could be explained by the significantly greater dosages used for pseudoboehmite, which impaired mixing and thus external mass diffusion. Furthermore, kip,2 and C2 were always greater for γ-Al2O3 than for pseudoboehmite. Greater values of kip,2 mean intraparticle diffusion was faster for γ-Al2O3 than for pseudoboehmite, which is reasonably explained by the greater average pore size of γ-Al2O3 compared to pseudoboehmite. The greater C2 values were obtained for γ-Al2O3 than for pseudoboehmite mean film diffusion had a greater impact in silica adsorption rate on γ-Al2O3 than on pseudoboehmite, which is also reasonably explained by the faster intra-particle diffusion in γ-Al2O3.
The effect of sorbent dosage on kinetics was different for each sorbent. For pseudoboehmite, kip,1 and kip,2 were greater at the highest dosage tested, which means external diffusion was faster and even mixing could be impaired, probably due to the low affinity of adsorbent for adsorbate. The equilibrium silica removal uptake was very similar at the two sorbent dosages tested, thus the driving force in intra-particle diffusion was expected to be very similar; however, a slight increase in kip,2 was observed at 15 g/L compared to 7.5 g/L. In the case of γ-Al2O3, both kip,1 and kip,2 were greater at the lowest dosage tested (2.5 g/L). The faster kinetics in film diffusion are explained by a better mixing while the faster kinetics in intra-particle diffusion are explained by the greater driving force in silica adsorption (silica removal uptake at 2.5 g/L was almost double than at 5 g/L).
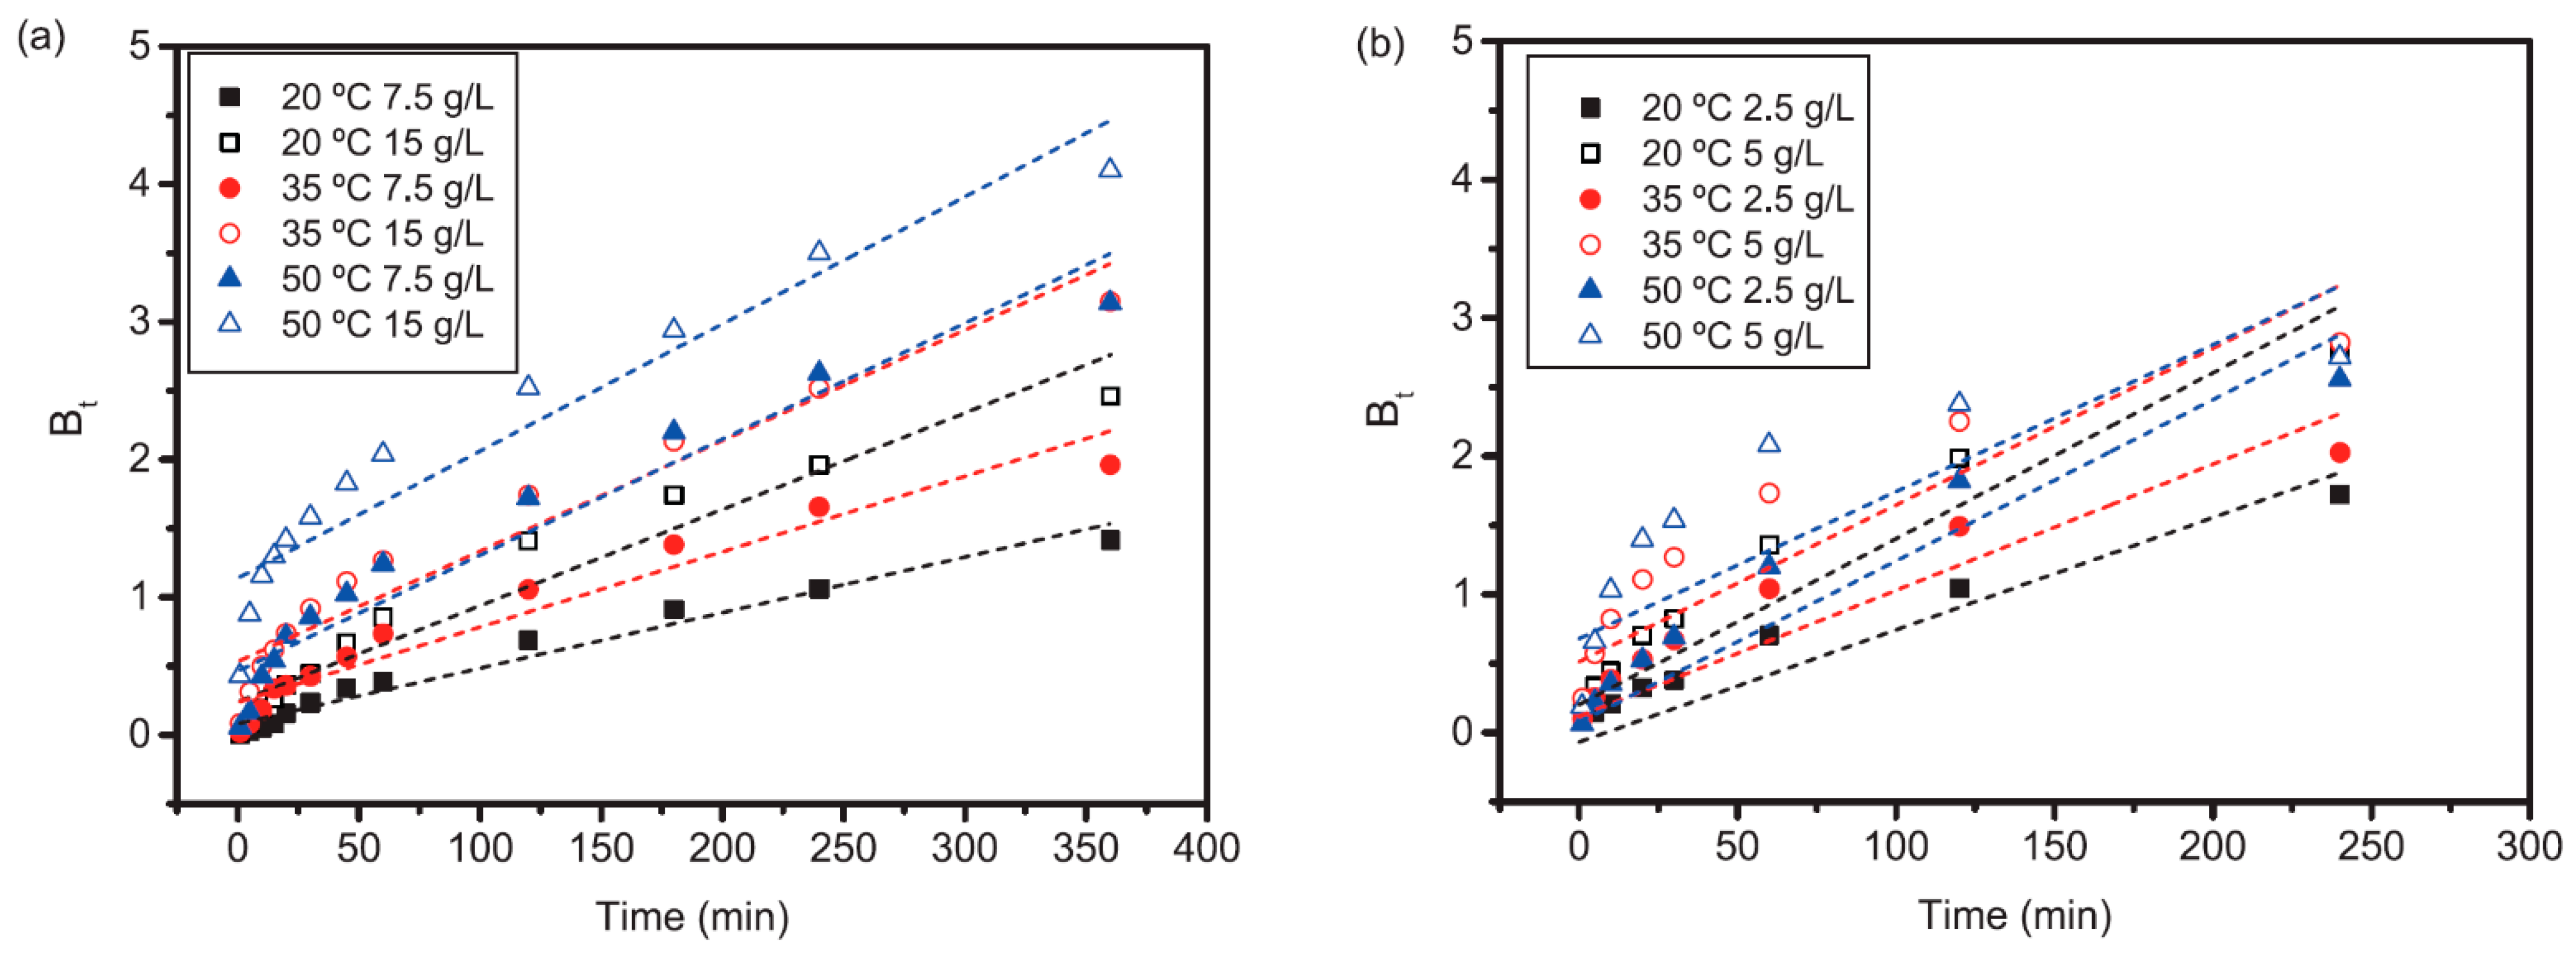
The preliminary conclusions on the rate-limiting step were corroborated by the analysis of the kinetic data with Boyd’s model (Figure 10). If intra-particle pore diffusion is the rate-controlling step, the plot Bt against t is linear and passes through the origin. If the plot is nonlinear or linear but does not pass through the origin, external mass transport controls the adsorption rate [58]. In all the cases, the plots were neither linear nor did they pass through the origin, indicating film diffusion was controlling the adsorption process. Table 6 shows the Boyd fit results for pseudoboehmite and γ-Al2O3.
As could be expected, at all temperatures tested, higher sorbent dosages caused an increase in the intercept of the Boyd plot, thus indicating external mass transfer importance was greater at these conditions. Although the Boyd plots were not linear, the lineal fit had a greater R2 for pseudoboehmite than for γ-Al2O3. This is explained by the fact that intraparticle diffusion is more important as a limiting step for pseudoboehmite than for γ-Al2O3, where the external mass transfer is more important. Additionally, at higher temperatures, the lineal fit gave worse results, indicating the increase in temperature favors intra-particle diffusion, and thus the resistance by external mass transfer became more relevant.
3.5. Equilibrium studies
Results from equilibrium studies are shown in Figure 11. The fit of the experimental data to Langmuir and Freundlich equilibrium isotherms are shown in Figure 12 and Figure 13 for pseudoboehmite and γ-Al2O3, respectively.
Freundlich and Langmuir isotherms fit the experimental data of pseudoboehmite with a correlation coefficient greater than 0.99; however, the Freundlich isotherm fit with a slightly greater coefficient of determination and a lower average relative error than Langmuir isotherm. Langmuir’s qm, which is a measure of the maximum adsorption capacity, increased from 52.3 mg/g (20 °C) to 91.9 mg/g (50 °C), while b, which is a constant related to the affinity of the binding sites, decreased slightly with temperature from 0.00823 (20 °C) to 0.00659 (50 °C). The dimensionless equilibrium parameter RL increased slightly with temperature, from 0.389 at 20 °C to 0.443 at 50 °C, all these values being lower than 1, indicating favorable adsorption. Freundlich’s constants KF and n were also influenced by temperature. An increase in the temperature resulted in a slight increase in KF, from 0.92 mg/g at 20 °C to 1.02 mg/g at 50 °C. The value of 1/n slightly increased with the temperature, indicating the higher adsorption intensity at higher temperatures: from 0.708 at 20 °C to 0.786 at 50 °C. At all the temperatures tested, 1/n values were less than unity, again confirming favorable adsorption.
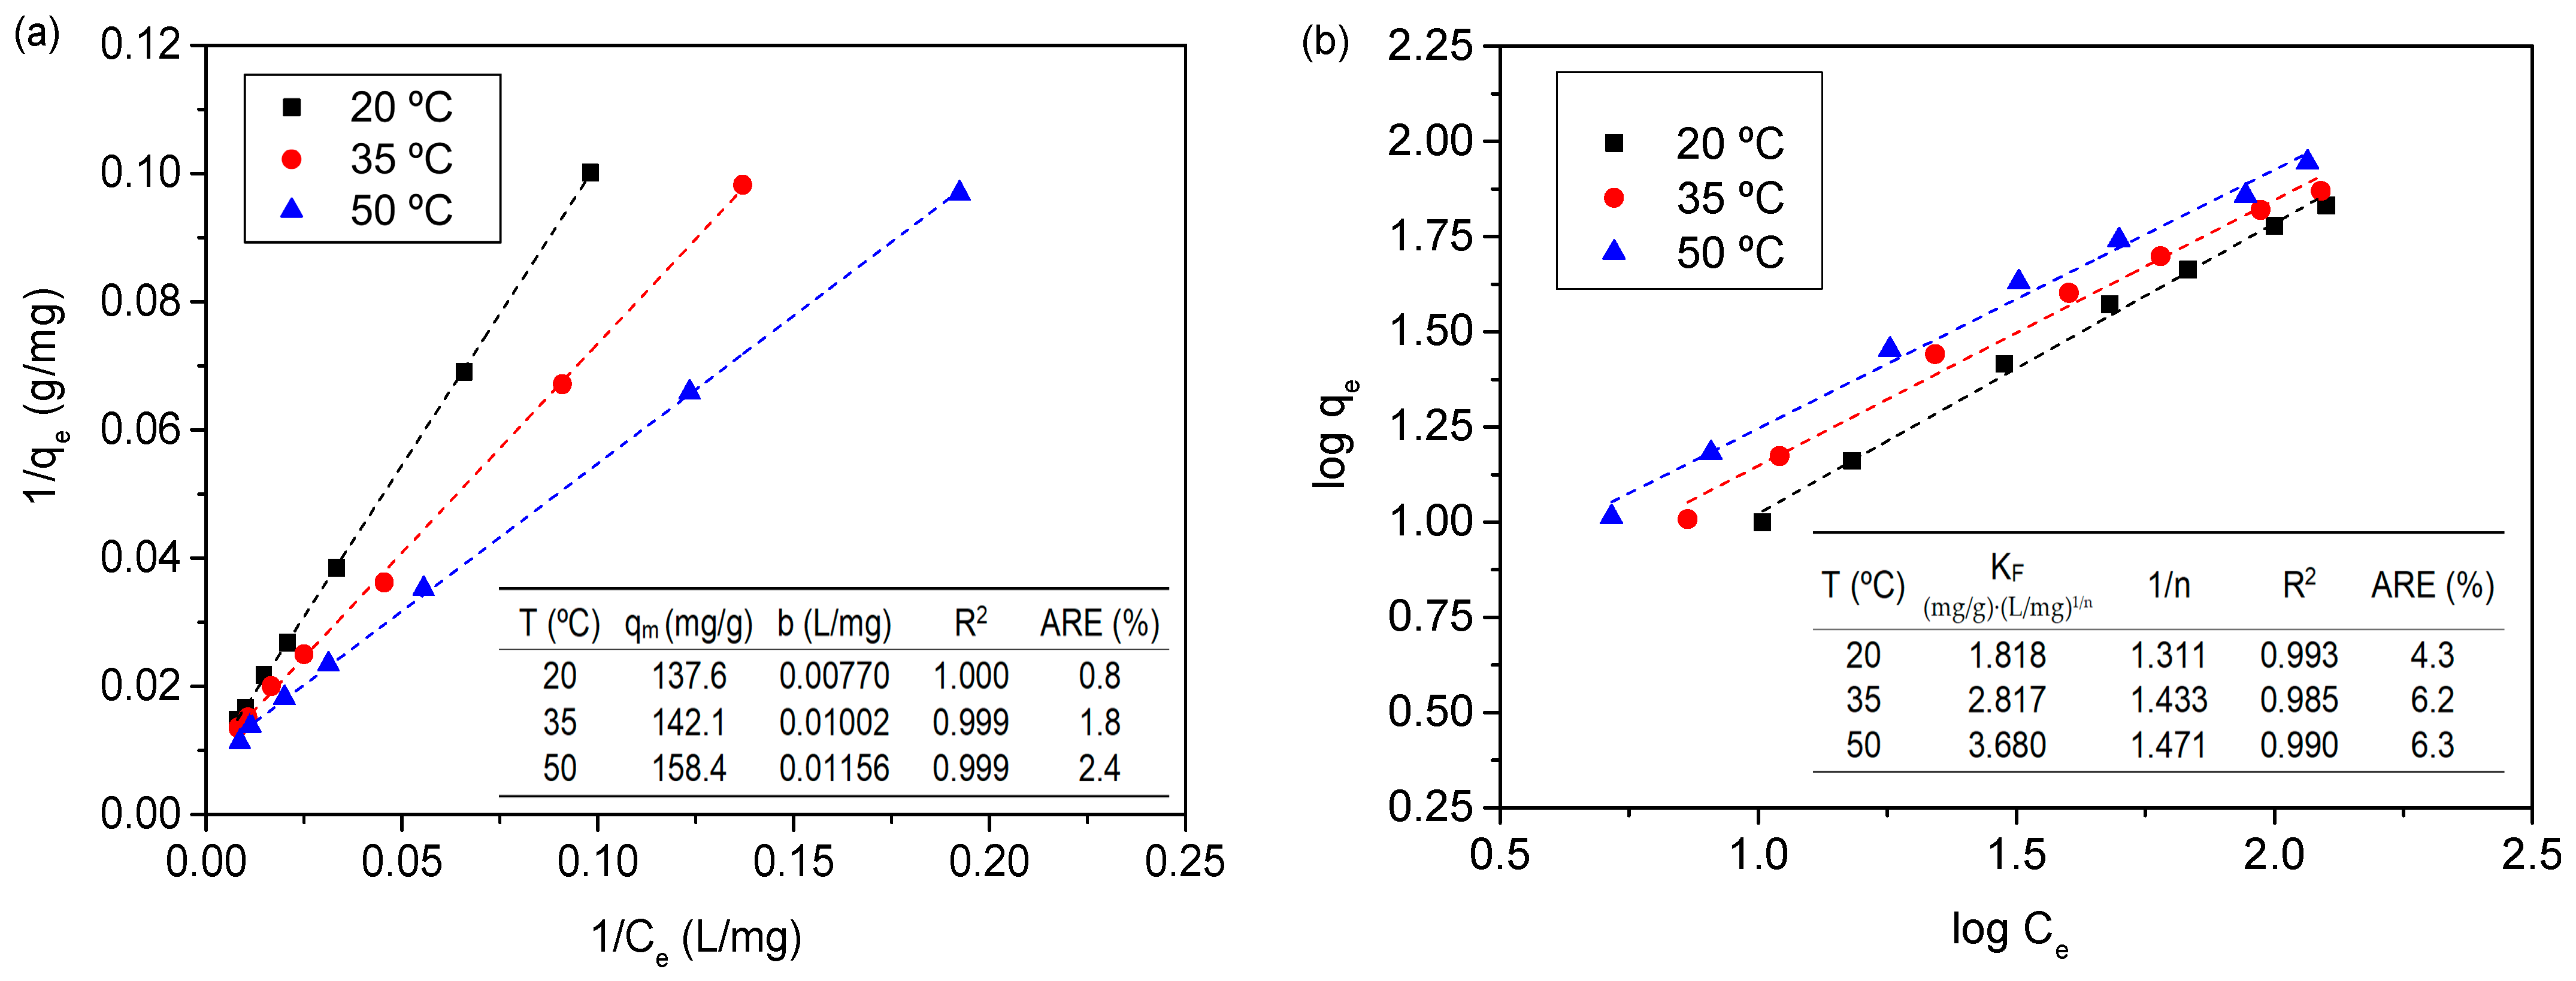
The γ-Al2O3 equilibrium data fit well to Langmuir and Freundlich isotherms (R2 > 0.985), although in this case, Langmuir fit slightly better both in terms of R2 and average relative error. qm increased with temperature, from 138 to 158 mg/g, while b increased from 0.0077 to 0.0116 L/mg. RL varied from in the 0.52–0.58 range, without a clear effect of temperature. On the other hand, Freundlich’s KF increased with temperature from 1.82 to 3.68 mg/g and 1/n decreased slightly from 0.763 to 0.680. Again, at all temperatures tested, 1/n values were less than unity, indicating adsorption is favorable.
Similar results were obtained by Bouguerra et al. [33] and Sasan et al. [26], analyzing silica adsorption on activated alumina and a mixture of magnesium hydrotalcite and activated alumina, respectively. In both cases, they found a similar fit of the experimental data with the Langmuir and Freundlich models, although the Freundlich model fit slightly better. The qm values obtained in the present study both for pseudoboehmites (52–92 mg/g) and γ-Al2O3 (137–158 mg/g) are, however, much greater than in the previous references: 6–9 mg/g at 50 mg/L initial SiO2 using activated alumina [33] and 10 mg/g at 25 mg/L initial SiO2 and 30 mg/g at 100 mg/L initial SiO2 when using a mixture of magnesium hydrotalcite and activated alumina [26].
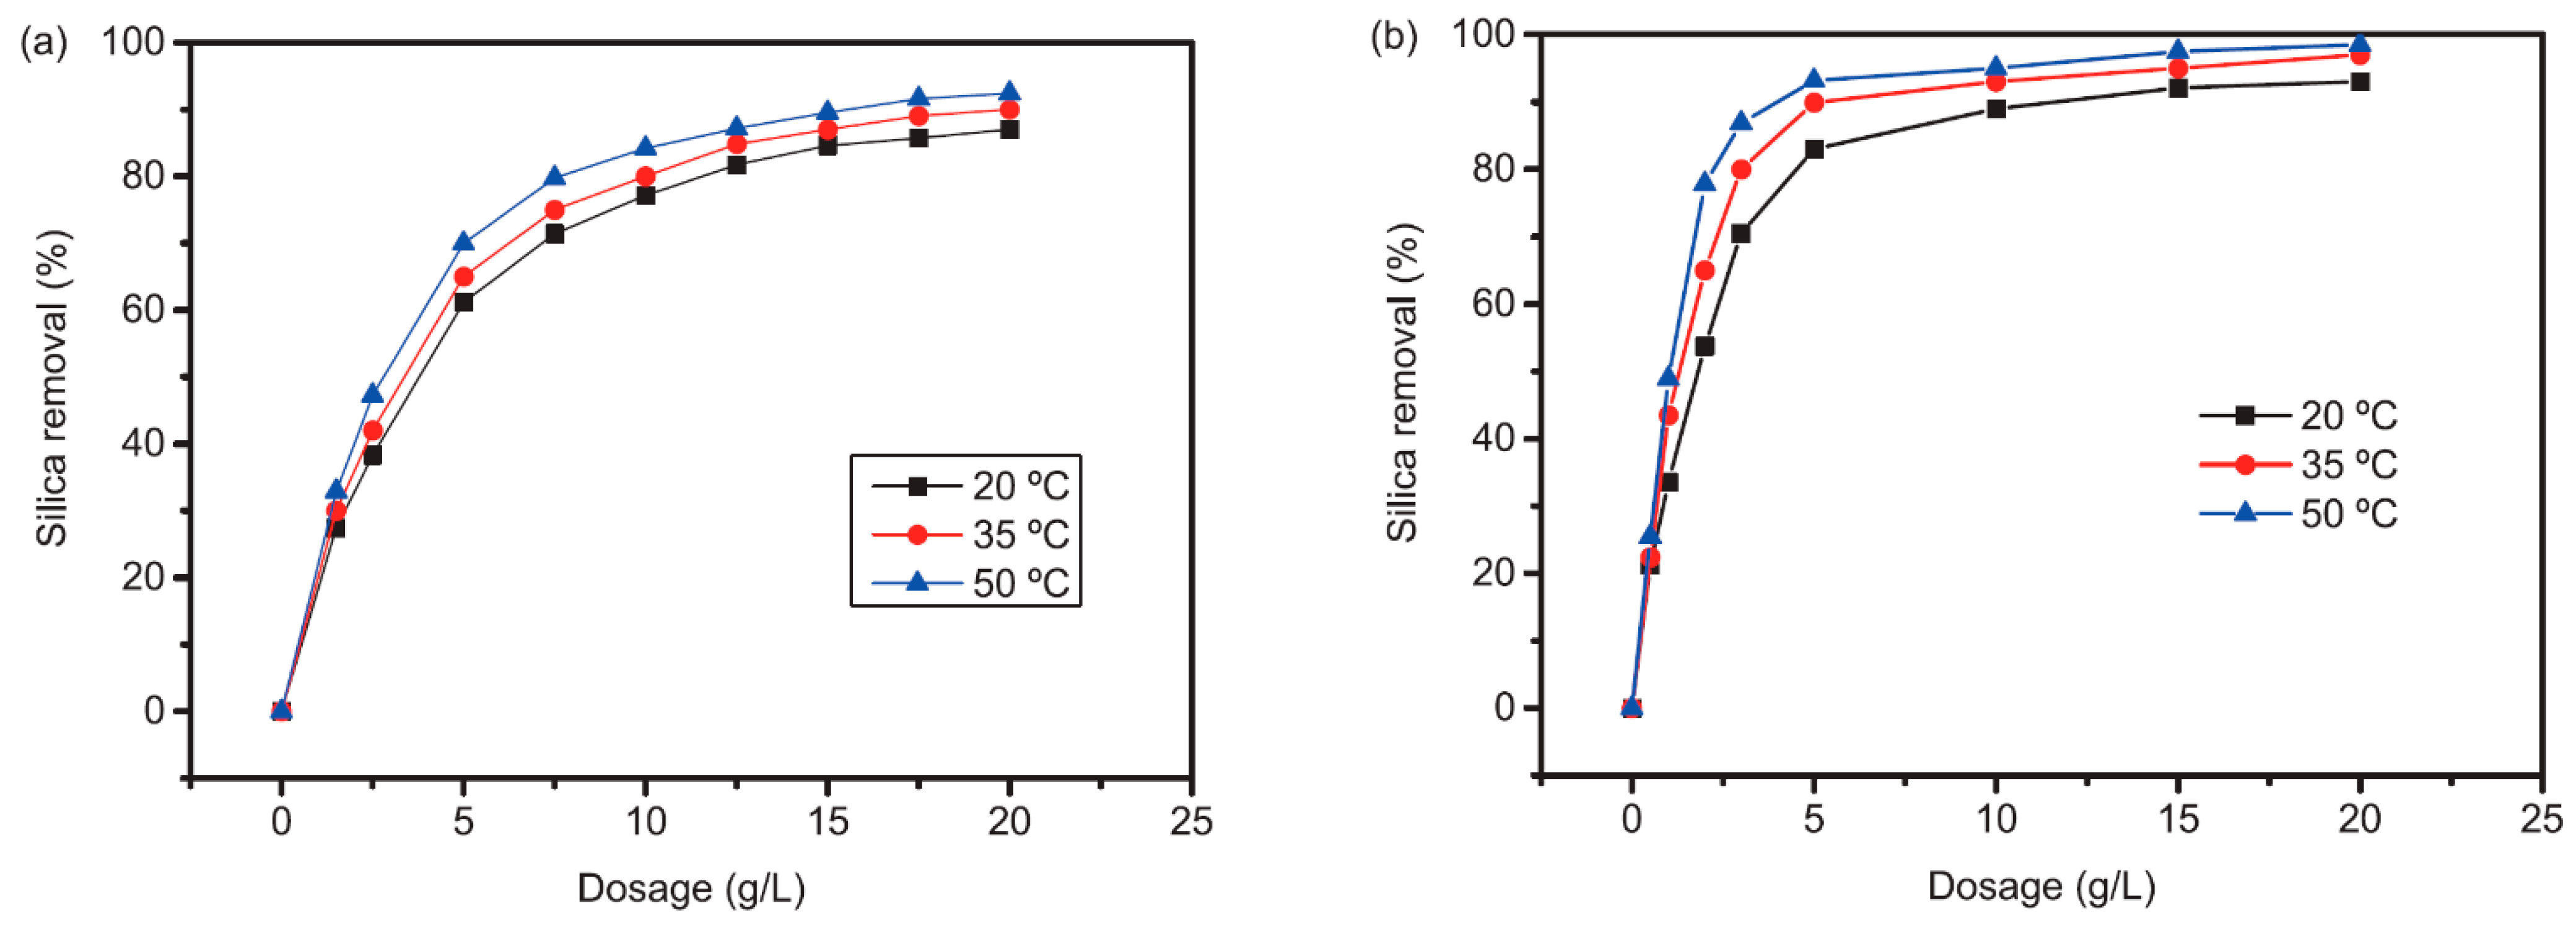
As Figure 11 shows, silica removal increased slightly with the temperature. The solution temperature could theoretically affect many equilibrium constants in which different silica species are involved. For example, silica solubility increases largely with the temperature, i.e., from 100–150 mg/L SiO2 at 20 °C up to 300 mg/L SiO2 at 70 °C [59]; however, virtually all the silica present in wastewater is dissolved. Furthermore, only a marginal amount of silica could be removed by adsorption on fresh precipitates of CaCO3 and Mg(OH)2 or by co-precipitation as calcium and magnesium silicates, and all these salts are inverse solubility salts. However, due to the low initial hardness, these effects are expected to be negligible. Consequently, the reason for this improved efficiency at higher temperatures is the endothermic nature of the adsorption process, which is demonstrated in the next section.
3.6. Adsorption Thermodynamics
Table 7 summarizes the thermodynamic results. The standard free energy changes (ΔG0) were always negative, ranging from −14.8 (20 °C) to −17.2 kJ/mol (50 °C) for pseudoboehmite and from −17.1 kJ/mol (20 °C) to −20.8 kJ/mol (50 °C) for γ-Al2O3. These negative standard free energy changes confirmed that the adsorption of silica was spontaneous for both sorbents, although the adsorption on γ-Al2O3 was slightly more spontaneous. ΔG0 values decreased as the temperature increased, indicating the adsorption is favored at higher temperatures.
For both sorbents ΔH0 is positive, which indicates the endothermic nature of the adsorption. The magnitude of ΔH0 also gives an idea about the type of sorption. The range of ΔH0 for physisorption is usually between 20 and 40 kJ/mol, while for chemisorption it generally falls into 40–400 kJ/mol range, thus, silica adsorption occurred by physisorption. As occurred with energy of activation, ΔH0 is higher for pseudoboehmite than for γ-Al2O3. It is also interesting to notice that the values obtained for ΔH0 and activation energy (Section 3.4) were very similar.
The standard entropy change (ΔS0) for both sorbents was positive, reflecting affinity of the sorbent towards silica and an increased randomness at the solid/liquid interface. Again, ΔS0 was higher for adsorption on γ-Al2O3 than on pseudoboehmite (0.145 vs. 0.123 kJ/mol·K).
3.7. Effect of Competing Ions
The industrial wastewater used in this study contains both inorganic and organic species that can interfere with silica adsorption. Wastewater has a moderate COD (~400 mg/L) and conductivity (3.0 mS/cm) with high levels of sodium (625 mg/L), sulphates (~400 mg/L), chlorides (~130 mg/L), and bicarbonates (~1000 mg/L CaCO3 total alkalinity) (Table 1). As the authors were interested in treating an industrial wastewater of a given composition, instead of modifying the wastewater composition with foreign ions, the effect of competitive ions on silica removal was studied indirectly through the presence of other species in the used sorbents.
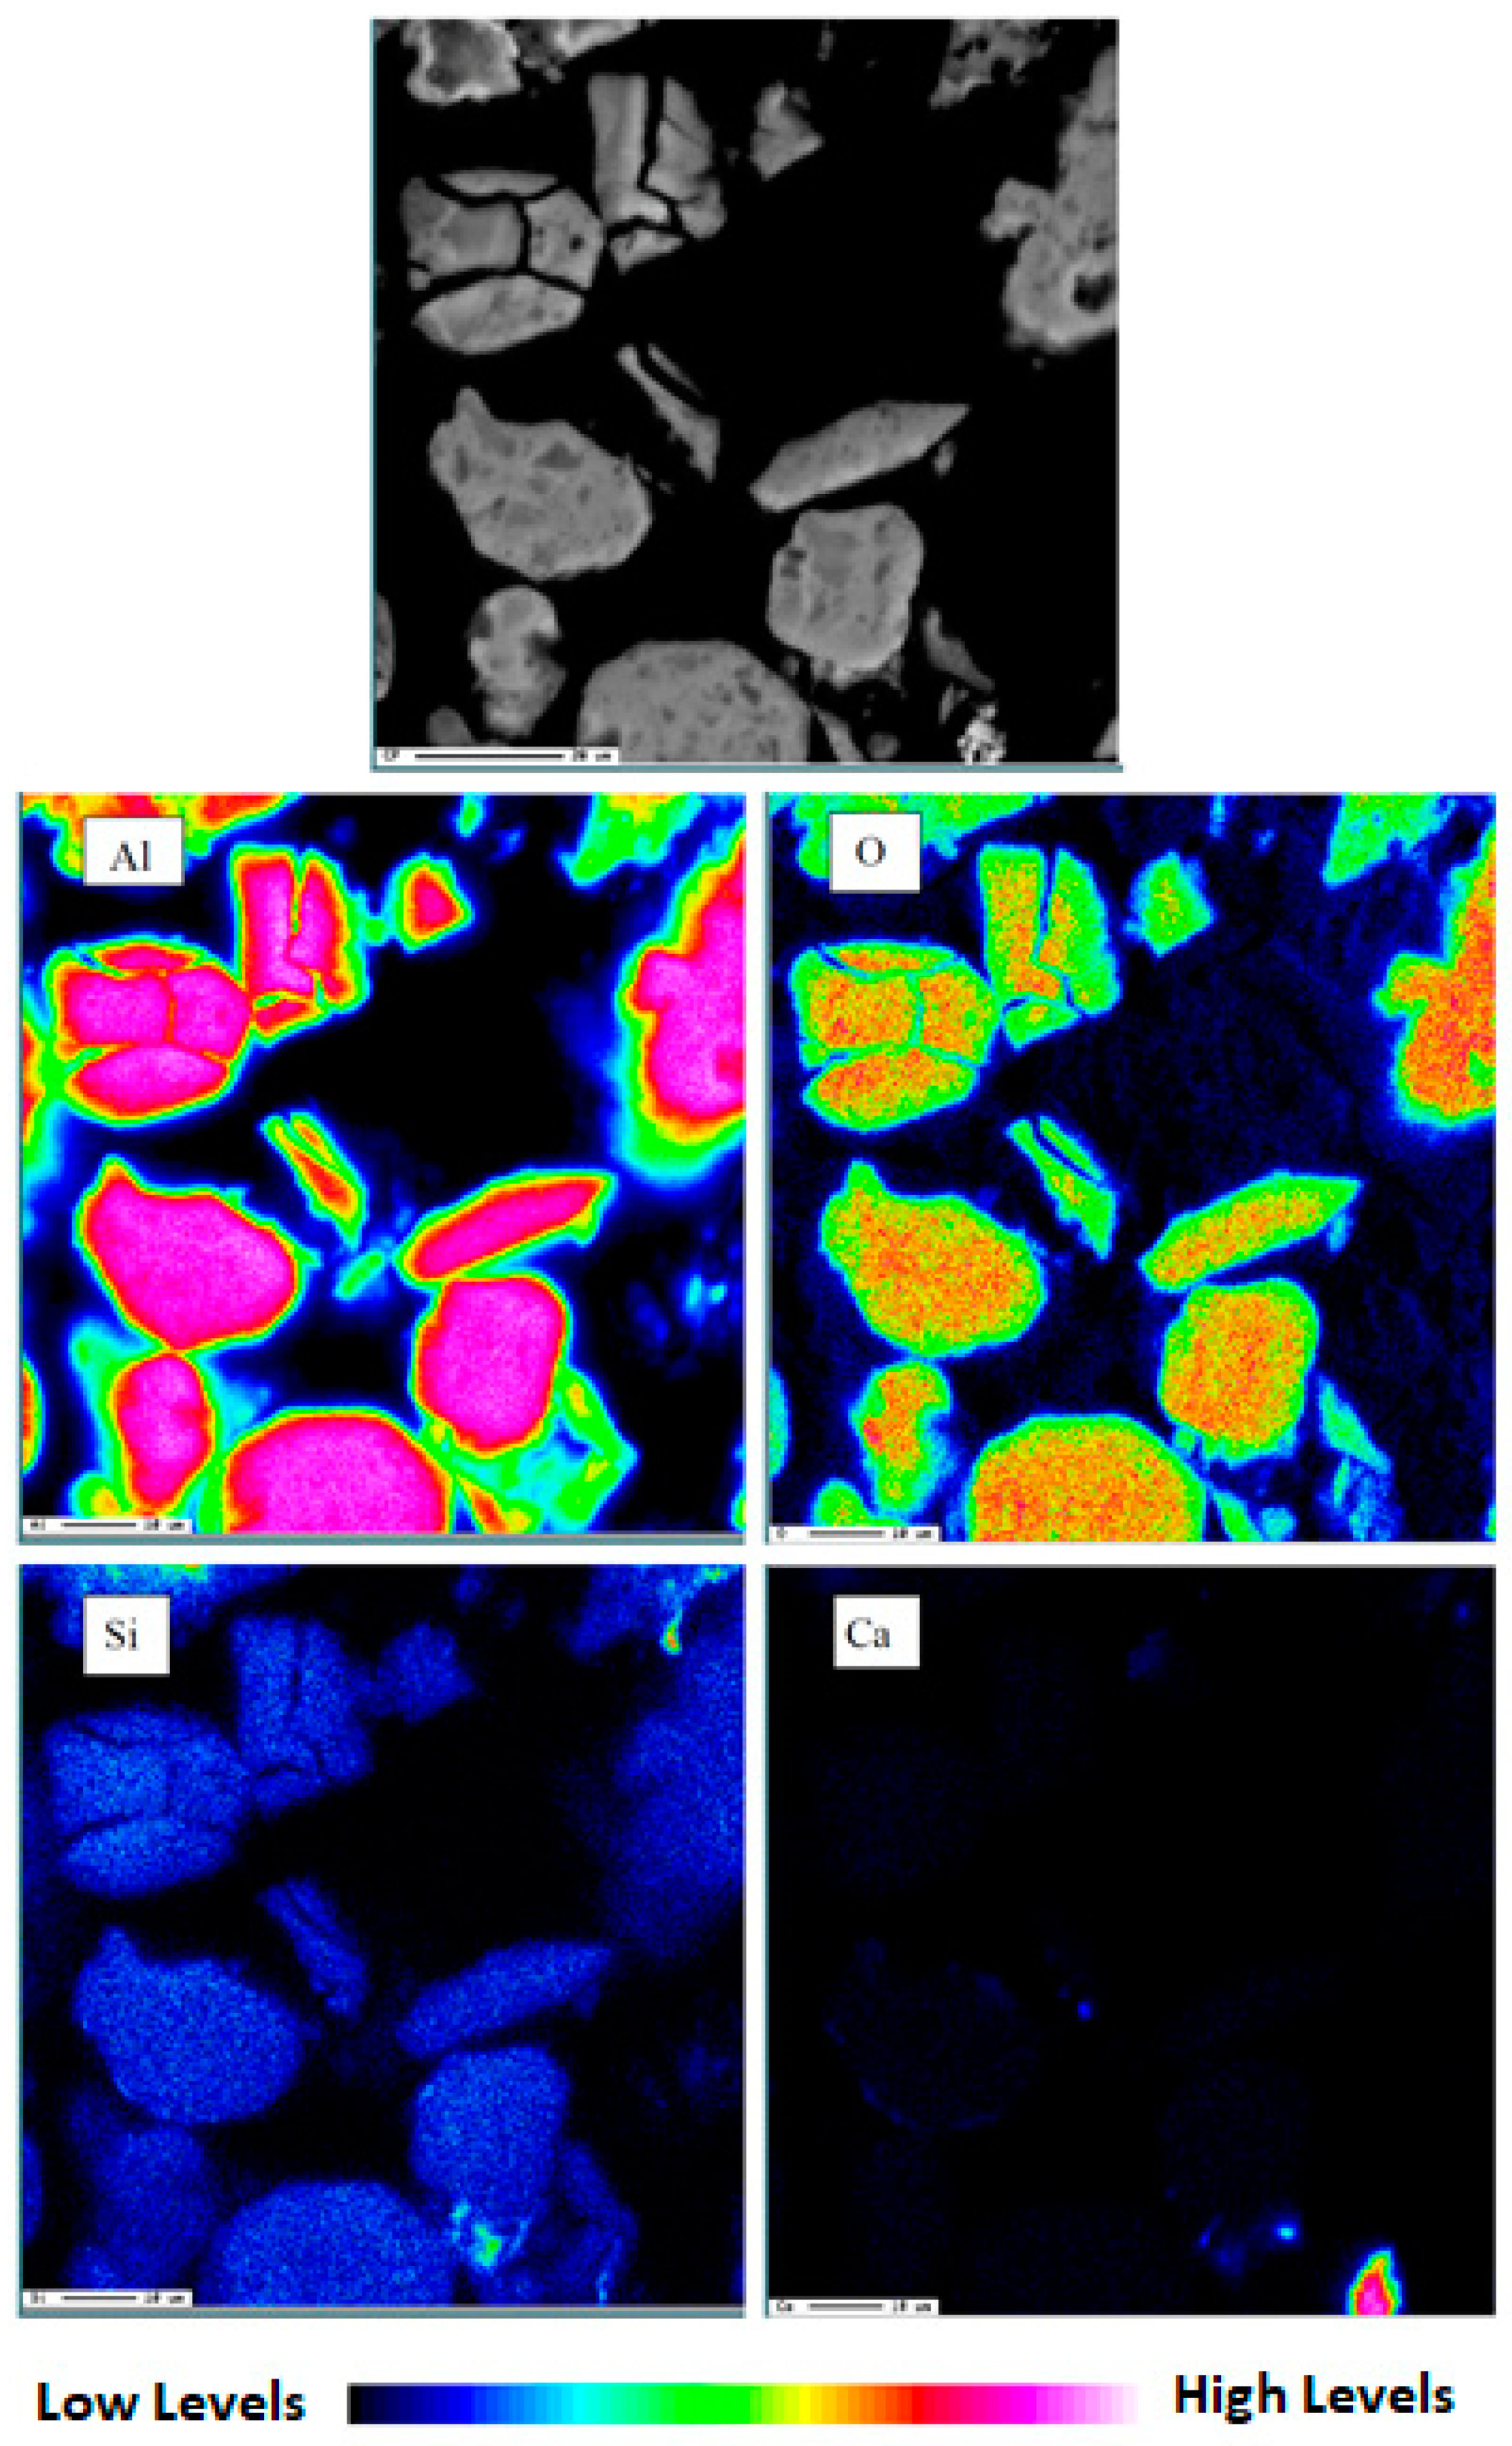
Selected samples of used sorbents were firstly analyzed by SEM-EDX to determine the presence of other inorganics (see Table 8). Apart from aluminum and oxygen from the sorbents and the silicon adsorbed, the used sorbents also contained noticeable amounts of calcium and, in some cases, sodium. Despite the low calcium levels on the wastewater, calcium was present at levels of 0.15–0.50% on used pseudoboehmite and 2.3–2.4% on used γ-Al2O3. Although calcium could theoretically be adsorbed on the sorbent, especially at pHs > PZC, the precipitation of calcium carbonate was the main origin of this calcium. This was confirmed by specific SEM-EDX analyses and elemental mapping of the used sorbents, showing the presence of individual particles of pure calcium carbonate together with sorbent particles (see Figure 14). The amount of calcium present in the used sorbents was always greater at the lowest dosages tested. This is easily explained by the similar amount of CaCO3 precipitated for all the treatments (the calcium removal is almost complete at all the pHs tested), but there were large differences in sorbent dosages tested: 2.5–5 g/L for γ-Al2O3 and 7.5–15 g/L for pseudoboehmite, thus obtaining a higher amount of Ca per g of sorbent in the case of γ-Al2O3. The presence of sodium was only detected in some of the samples. In the effluent, there is a high content of dissolved sodium, mainly coming from the caustic soda used in pulping and the sodium dithionite used for bleaching. It is possible that some sodium ions could interact with the sorbents due to the high amount present (625 mg/L) but also being retained after drying the used sorbents. Apart from calcium and sodium, small amounts of sulfur (from sulfates) and phosphorous (from phosphates) were detected in the used sorbents. This presence was only detected in XRF, not in SEM-EDX measurements. Levels of sulfur in the used sorbent varied in the 0.10–0.13 wt.% range, without any apparent influence of temperature. Although the level of phosphates in wastewater was significantly lower than sulphates (11.4 mg/L), they were detected at similar values (0.05–0.19 wt.%), with no apparent influence of the temperature. This is explained by the greater electrostatic interactions for higher valance anions [33].
According to these results, it is concluded that both sorbents are very selective to silica, which is in agreement with other studies, where only a 5% decrease in silica removal was observed when adding even five or ten times greater concentrations of competing anions than silica, including chlorides, nitrates, fluorides, bicarbonates, or phosphonates [26,33,45].
The presence of organics in used sorbents was also analyzed by TG/DTG experiments. Despite the moderate COD in the effluent, the selection of the optimum pH allowed maximum silica removal with minimum organics interference (see Supplementary Material, Section S3: Characterization of Used Sorbents).
Finally, Figure 14 shows an elemental mapping of used γ-Al2O3 which demonstrates the homogenous distribution of silica on the sorbent particles, while it also appears that a particle of pure calcium carbonate together with the sorbent is observed (down on the right for calcium mapping). According to the observed homogeneous distribution of silica on the sorbents, the main mechanism for silica removal is surface adsorption and not surface precipitation, as proposed by Sanciolo et al. [34] These authors hypothesized that surface precipitation could occur as a result of the reaction of silicate ions with aluminum ions liberated from the alumina at alkaline conditions to form aluminosilicates.
4. Conclusions
Pseudoboehmite and γ-Al2O3 were both highly selective sorbents for silica removal from industrial effluents, having moderate COD and conductivity, but γ-Al2O3 was more efficient. A 75–85% silica removal (35–45 mg/L residual SiO2 in the effluent) was obtained only with 2.5–5 g/L γ-Al2O3, compared to 7.5–15 g/L pseudoboehmite (results obtained without previous pH regulation, pH 8.5), i.e., silica uptake is around 25–50 mg/g for activated alumina compared to 10–20 mg/g for pseudoboehmite. With these silica removal efficiencies, it would be possible to work at regular recoveries in RO membranes (65–80%), avoiding irreversible membrane fouling by silica scaling.
Adsorption followed pseudo-second-order kinetics. At high temperatures and sorbent dosages, around 1 h is necessary to achieve the equilibrium concentration, while at low temperatures and sorbent dosages, up to 3–4 h would be necessary. The energy of activation, as occurred with ΔH0, was around three times higher for pseudoboehmite than γ-Al2O3; however, in both cases, silica was removed by physisorption. Intra-particle diffusion and Boyd models corroborated that the adsorption process is rate limited by a combination of external mass transport and intraparticle diffusion, the rate-liming step changing gradually from external mass transport at the beginning (first 5–20 min) to intraparticle diffusion at longer times. Both Langmuir and Freundlich isotherms fitted well the experimental data. The adsorption process was determined to be favorable and spontaneous. Despite physisorption usually being favored at lower temperatures, the endothermic nature of the adsorption (ΔH0 > 0) made silica adsorption be favored at higher temperatures.
Results show that silica removal by γ-Al2O3 is technically feasible, having the following advantages compared to traditional methods such as coagulation and precipitation at high pHs: no need for pH adjustment, null increase of conductivity of the waters after the treatment, and no sludge generation.
The economic feasibility of the proposed treatment will depend on the results from future regeneration tests for sorbents. Previous studies allow authors to be optimistic since the regeneration using 2% NaOH has been demonstrated to be effective for at least three regeneration cycles [34]. Adsorption tests on columns are also recommended before industrial application.
Supplementary Materials
The following are available online at https://www.mdpi.com/article/10.3390/w13152031/s1. Section S1: Mathematical Modelling (S1.1. Kinetic models and adsorption mechanism, S1.2. Equilibrium isotherms and S1.3. Thermodynamic studies). Section S2: Characterization of the Sorbents (Figure S1: SEM images of pseudoboehmite and activated alumina; Figure S2: TG and DTG curves for pseudoboehmite and γ-Al2O3; Figure S3: FTIR spectra for pseudoboehmite and γ-Al2O3; Figure S4: Point of zero charge determination for pseudoboehmite and γ-Al2O3). Section S3: Characterization of the Sorbents after Adsorption (Figure S5: TG and DTG curves for fresh and used pseudoboehmite; Figure S6: TG and DTG curves for fresh and used γ-Al2O3; Figure S7: SEM images of pseudoboehmite after adsorption (7.5 g/L and 15 g/L); Figure S8: SEM images of γ-Al2O3 after adsorption (2.5 g/L); Figure S9: FTIR spectra for fresh and used pseudoboehmite; Figure S10: FTIR spectra for fresh and used γ-Al2O3; Figure S11: Powder XRD patterns of pseudoboehmite and γ-Al2O3 before and after adsorption).
Author Contributions
Conceptualization, R.M., A.B.; methodology, R.M., I.L.; investigation, R.M., I.L.; data curation, R.M.; writing—original draft preparation, R.M.; writing—review and editing, R.M., A.B.; supervision, A.B.; funding acquisition, A.B. All authors have read and agreed to the published version of the manuscript.
Funding
The authors want to acknowledge the financial support of the Community of Madrid through the program “Producción sostenible y simbiosis industrial en la Comunidad de Madrid (RETO-PROSOST2-CM)” (S2018/EMT-4459) and the Spanish Ministry of Economy, Industry and Competitiveness through the project “Tratamiento de concentrados: extendiendo los límites de la reutilización y el uso sostenible del agua en la industria” (CTM2016-77948-R).
Institutional Review Board Statement
Not applicable.
Informed Consent Statement
Not applicable.
Data Availability Statement
Not applicable.
Conflicts of Interest
The authors declare no conflict of interest. The funders had no role in the design of the study; in the collection, analyses, or interpretation of data; in the writing of the manuscript; or in the decision to publish the results.
References
- Wachinski, A. Membrane Processes for Water Reuse, 1st ed.; McGrawHill: New York, NY, USA, 2012. [Google Scholar]
- Hankis, N.P.; Singh, R. Emerging Membrane Technology for Sustainable Water Treatment, 1st ed.; Elsevier Science: Amsterdam, The Netherlands, 2016. [Google Scholar]
- Blanco, L.; Hermosilla, D.; Blanco, A.; Swinnen, N.; Prieto, D.; Negro, C. MBR+ RO Combination for PVC Production Effluent Reclamation in the Resin Polymerization Step: A Case Study. Ind. Eng. Chem. Res. 2016, 55, 6250–6259. [Google Scholar] [CrossRef]
- Prieto, D.; Swinnen, N.; Blanco, L.; Hermosilla, D.; Cauwenberg, P.; Blanco, Á.; Negro, C. Drivers and economic aspects for the implementation of advanced wastewater treatment and water reuse in a PVC plant. Water Resour. Ind. 2016, 14, 26–30. [Google Scholar] [CrossRef] [Green Version]
- Pinto, H.B.; de Souza, B.M.; Dezotti, M. Treatment of a pesticide industry wastewater mixture in a moving bed biofilm reactor followed by conventional and membrane processes for water reuse. J. Clean. Prod. 2018, 201, 1061–1070. [Google Scholar] [CrossRef]
- Cinperi, N.C.; Ozturk, E.; Yigit, N.O.; Kitis, M. Treatment of woolen textile wastewater using membrane bioreactor, nanofiltration and reverse osmosis for reuse in production processes. J. Clean. Prod. 2019, 223, 837–848. [Google Scholar] [CrossRef]
- Nadeem, K.; Guyer, G.T.; Keskinler, B.; Dizge, N. Investigation of segregated wastewater streams reusability with membrane process for textile industry. J. Clean. Prod. 2019, 228, 1437–1445. [Google Scholar] [CrossRef]
- Ordóñez, R.; Hermosilla, D.; San Pío, I.; Blanco, Á. Evaluation of MF and UF as pretreatments prior to RO applied to reclaim municipal wastewater for freshwater substitution in a paper mill: A practical experience. Chem. Eng. J. 2011, 166, 88–98. [Google Scholar] [CrossRef] [Green Version]
- Ordóñez, R.; Hermosilla, D.; Merayo, N.; Gascó, A.; Negro, C.; Blanco, Á. Application of multi-barrier membrane filtration technologies to reclaim municipal wastewater for industrial use. Sep. Purif. Rev. 2014, 43, 263–310. [Google Scholar] [CrossRef] [Green Version]
- Hubbe, M.A.; Metts, J.R.; Hermosilla, D.; Blanco, A.; Yerushalmi, L.; Haghighat, F.; Lindohlm-Lehto, P.; Khodaparast, Z.; Kamalli, M.; Elliot, A. Wastewater Treatment and Reclamation: A Review of Pulp and Paper Industry Practices and Opportunities. BioResources 2016, 11, 7956–8091. [Google Scholar] [CrossRef] [Green Version]
- Petrinic, I.; Korenak, J.; Povodnik, D.; Hélix-Nielsen, C. A feasibility study of ultrafiltration/reverse osmosis (UF/RO)-based wastewater treatment and reuse in the metal finishing industry. J. Clean. Prod. 2015, 101, 292–300. [Google Scholar] [CrossRef]
- Cristóvão, R.O.; Botelho, C.M.; Martins, R.J.; Loureiro, J.M.; Boaventura, R.A. Fish canning industry wastewater treatment for water reuse—A case study. J. Clean. Prod. 2015, 87, 603–612. [Google Scholar] [CrossRef]
- Milne, N.A.; O’Reilly, T.; Sanciolo, P.; Ostarcevic, E.; Beighton, M.; Taylor, K.; Mullet, M.; Tarquin, A.J.; Gray, S.R. Chemistry of silica scale mitigation for RO desalination with particular reference to remote operations. Water Res. 2014, 15, 107–133. [Google Scholar] [CrossRef]
- Ordóñez, R.; Hermosilla, R.; San Pío, I.; Blanco, A. Replacement of fresh water use by final effluent recovery in a highly optimized 100% recovered paper mill. Water Sci. Technol. 2010, 62, 1694–1703. [Google Scholar] [CrossRef] [Green Version]
- Salvador Cob, S.; Beaupin, C.; Hofs, B.; Nederlof, M.M.; Harmsen, D.J.H.; Cornelissen, E.R.; Zwijnenburg, A.; Gencelli Güner, F.E.; Witkamp, G.J. Silica and silicate precipitation as limiting factors in high-recovery reverse osmosis operations. J. Membr. Sci. 2012, 423–424, 1–10. [Google Scholar] [CrossRef]
- Salvador Cob, S.; Yeme, C.; Hofs, B.; Cornelissen, E.R.; Vries, D.; Gencelli Güner, F.E.; Witkamp, G.J. Towards zero liquid discharge in the presence of silica: Stable 98% recovery in nanofiltration and reverse osmosis. Sep. Purif. Technol. 2015, 140, 23–31. [Google Scholar] [CrossRef]
- Matin, A.; Rahman, F.; Shafi, H.Z.; Zubair, S.M. Scaling of reverse osmosis membranes used in water desalination: Phenomena, impact, and control; future directions. Desalination 2019, 455, 135–157. [Google Scholar] [CrossRef]
- Park, Y.-M.; Yeon, K.-M.; Park, C.-H. Silica treatment technologies in reverse osmosis for industrial desalination: A review. Environ. Eng. Res. 2020, 25, 819–829. [Google Scholar] [CrossRef]
- Rathinam, K.; Abraham, S.; Oren, Y.; Schwahn, D.; Petry, W.; Kaufman, Y.; Kasher, R. Surface-induced silica scaling during brackish water desalination: The role of surface charge and specific chemical groups. Environ. Sci. Technol. 2019, 53, 5202–5211. [Google Scholar] [CrossRef] [PubMed]
- Ni, P.; Fox, J.T. Metal organic frameworks synthesized with green chemistry for the removal of silicic acid from aqueous solutions. Sep. Purif. Technol. 2021, 272, 118118. [Google Scholar] [CrossRef]
- Parks, J.L.; Edwards, M. Boron removal via formation of magnesium silicate solids during precipitative softening. J. Environ. Eng. 2007, 133, 149–156. [Google Scholar] [CrossRef]
- Hsu, H.; Chen, S.; Lin, C.; Chang, T. Silica pretreatment for RO membrane by softening-adsorption. J. Environ. Eng. Manag. 2008, 18, 99–103. [Google Scholar]
- Hermosilla, D.; Ordóñez, R.; Blanco, L.; de la Fuente, E.; Blanco, A. pH and particle structure effects on silica removal by coagulation. Chem. Eng. Technol. 2012, 35, 1632–1640. [Google Scholar] [CrossRef] [Green Version]
- Latour, I.; Miranda, R.; Blanco, A. Silica removal from newsprint mill effluents with aluminum salts. Chem. Eng. J. 2013, 230, 522–531. [Google Scholar] [CrossRef] [Green Version]
- Latour, I.; Miranda, R.; Blanco, A. Silica removal in industrial effluents with high silica content and low hardness. Environ. Sci. Pollut. Res. 2014, 21, 9832–9842. [Google Scholar] [CrossRef] [PubMed] [Green Version]
- Sasan, K.; Brady, P.V.; Krumhansl, J.L.; Nenoff, T.M. Exceptional selectivity for dissolved silicas in industrial waters using mixed oxides. J. Water Process. Eng. 2017, 20, 187–192. [Google Scholar] [CrossRef]
- Yu, M.-J.; Li, X.; Ahn, W.-S. Adsorptive removal of arsenate and ortophosphate anions by mesoporous alumina. Micropor Mesopor Mater. 2008, 113, 197–203. [Google Scholar] [CrossRef]
- Bouguerra, W.; Marzouk, I.; Hamrouni, B. Equilibrium and kinetic studies of adsorption of boron on activated alumina. Water Environ. Res. 2009, 81, 2455–2459. [Google Scholar] [CrossRef]
- Granados-Correa, F.; Jiménez-Becerril, J. Chromium (VI) adsorption on boehmite. J. Hazard. Mater. 2009, 162, 1178–1184. [Google Scholar] [CrossRef] [PubMed]
- Lee, G.; Chen, C.; Yang, S.-T.; Ahn, W.-S. Enhanced adsorptive removal of fluoride using mesoporous alumina. Microporous Mesoporous Mater. 2010, 127, 152–156. [Google Scholar] [CrossRef]
- Poursani, A.S.; Nilchi, A.; Hassani, A.H.; Shariat, M.; Nouri, J. A novel method for synthesis of nano-γ-Al2O3: Study of adsorption behavior of chromium, nickel, cadmium and lead ions. Int. J. Environ. Sci. Technol. 2015, 12, 2003–2014. [Google Scholar] [CrossRef] [Green Version]
- Sharawy, H.; Ossman, M.E.; Mansour, M.S. Kinetics modelling and adsorption isotherm studies for Cr(III) removal using boehmite nano-powder. Int. J. Chem. Biochem. Sci. 2013, 3, 9–18. [Google Scholar]
- Bouguerra, W.; Ben Sik Ali, M.; Hamrouni, B.; Dhahbi, M. Equilibrium and kinetic studies of adsorption of silica on activated alumina. Desalination 2007, 206, 141–146. [Google Scholar] [CrossRef]
- Sanciolo, P.; Milne, N.; Taylor, J.; Mullet, M.; Gray, S. Silica scale mitigation for high recovery reverse osmosis of groundwater for a mining process. Desalination 2014, 340, 49–58. [Google Scholar] [CrossRef] [Green Version]
- Miranda, R.; Nicu, R.; Latour, I.; Lupei, M.; Bobu, E.; Blanco, A. Efficiency of chitosans for the treatment of papermaking process water by dissolved air flotation. Chem. Eng. J. 2013, 231, 304–313. [Google Scholar] [CrossRef] [Green Version]
- Boguniewicz-Zabłocka, J.; & Kłosok-Bazan, I. Sustainable processing of paper industry water and wastewater: A case study on the condition of limited freshwater resources. Pol. J. Environ. Stud. 2020, 29, 2063–2070. [Google Scholar] [CrossRef]
- Huuha, T.S.; Kurniawan, T.A.; Sillanpää, M.E. Removal of silicon from pulping whitewater using integrated treatment of chemical precipitation and evaporation. Chem. Eng. J. 2010, 158, 584–592. [Google Scholar] [CrossRef]
- Latour, I.; Miranda, R.; Blanco, A. Silica removal with sparingly soluble magnesium compounds. Part I. Sep. Purif. Technol. 2014, 138, 210–218. [Google Scholar] [CrossRef] [Green Version]
- Latour, I.; Miranda, R.; Blanco, A. Optimization of silica removal with magnesium chloride in papermaking effluents: Mechanistic and kinetic studies. Environ. Sci. Pollut. Res. 2016, 23, 3707–3717. [Google Scholar] [CrossRef]
- Lv, Y.; Li, D.; Tang, P.; Feng, Y. A simple and promoter free way to synthesize spherical γ-alumina with high hydrothermal stability. Mater. Lett. 2015, 155, 75–77. [Google Scholar] [CrossRef]
- Latour, I. Silica Removal Pretreatment for Effluent Reuse in Graphic Paper Production. Ph.D. Thesis, Universidad Complutense de Madrid, Madrid, Spain, 2016. [Google Scholar]
- Tsukada, T.; Segawa, H.; Yasumori, A.; Okada, K. Crystallinity of boehmite and its effect on the phase transition temperature of alumina. J. Mater. Chem. 1999, 9, 549–553. [Google Scholar] [CrossRef]
- Brühne, S.; Gottlieb, S.; Assmus, W.; Alig, E.; Schmidt, M.U. Atomic structure analysis of nanocrystalline boehmite AlO(OH). Cryst. Growth Des. 2008, 8, 489–493. [Google Scholar] [CrossRef] [Green Version]
- Potdar, H.S.; Jun, K.-W.; Bae, J.W.; Kim, S.-M.; Lee, Y.-J. Synthesis of nano-sized porous γ-alumina powder via a precipitation/digestion route. Appl. Catal. A Gen. 2007, 321, 109–116. [Google Scholar] [CrossRef]
- Park, M.-C.; Lee, S.-R.; Kim, H.; Park, I.; Choy, J.-H. Tailoring porosity of colloidal boehmite sol by crystallite size. Bull. Korean Chem. Soc. 2012, 33, 1962–1966. [Google Scholar] [CrossRef]
- Wilhelm, S.; Kind, M. Influence of pH, temperature and sample size on natural and enforced syneresis of precipitated silica. Polymers 2015, 7, 2504–2521. [Google Scholar] [CrossRef] [Green Version]
- Granados-Correa, F.; Jiménez-Becerril, J. The effect of the calcination temperature of boehmite on its Co (II) adsorption properties. J. Ceram. Process. Res. 2012, 13, 142–148. [Google Scholar] [CrossRef]
- Leyva-Ramos, R.; Medellin-Castillo, N.A.; Jacobo-Azuara, A.; Mendoza-Barron, J.; Landin-Rodriguez, L.E.; Martinez-Rosales, J.M.; Aragon-Piña, A. Fluoride removal from water solution by adsorption on activated alumina prepared from pseudoboehmite. J. Environ. Eng. Manag. 2008, 18, 301–309. [Google Scholar]
- Miranda, R.; Latour, I.; Hörsken, A.; Jarabo, R.; Blanco, A. Enhanced Silica Removal by Polyamine-and Polyacrylamide-Polyaluminum Hybrid Coagulants. Chem. Eng. Technol. 2015, 38, 2045–2053. [Google Scholar] [CrossRef]
- Tombácz, E.; Dobos, Á.; Szekeres, M.; Narres, H.D.; Klump, E.; Dékány, I. Effect of pH and ionic strength on the interaction of humic acid with aluminum oxide. Colloid Polym. Sci. 2000, 278, 337–345. [Google Scholar] [CrossRef]
- Ning, R.Y. Discussion of silica speciation, fouling, control and maximum reduction. Desalination 2003, 151, 67–73. [Google Scholar] [CrossRef]
- Matson, J.V. Industrial Waste-Water Reuse by Selective Silica Removal over Activated Alumina. U.S. Patent 4276180, 1981. Available online: https://patents.google.com/patent/US4276180A/en (accessed on 8 February 2021).
- Chen, S.; Chang, T.; Lin, C. Silica pretreatment for a RO brackish water source with high magnesium. Water Sci Tech. Water Supply 2006, 6, 179–187. [Google Scholar] [CrossRef]
- Latour, I.; Miranda, R.; Blanco, A. Silica removal with sparingly soluble magnesium compounds. Part II. Sep. Purif. Technol. 2015, 149, 331–338. [Google Scholar] [CrossRef]
- Gong, W.X.; Qu, J.H.; Liu, R.P.; Lan, H.C. Adsorption of fluoride onto different types of aluminas. Chem. Eng. J. 2012, 189, 126–133. [Google Scholar] [CrossRef]
- Inglezakis, V.J.; Zorpas, A.A. Heat of adsorption, adsorption energy and activation energy in adsorption and ion exchange systems. Desalin. Water Treat. 2012, 39, 149–157. [Google Scholar] [CrossRef]
- Sasan, K.; Brady, P.V.; Krumhansl, J.L.; Nenoff, T.M. Removal of dissolved silica from industrial waters using inorganic ion exchangers. J. Water Process. Eng. 2017, 17, 117–123. [Google Scholar] [CrossRef] [Green Version]
- Viegas, R.M.; Campinas, M.; Costa, H.; Rosa, M.J. How do the HSDM and Boyd’s model compare for estimating intraparticle diffusion coefficients in adsorption processes. Adsorption 2014, 20, 737–746. [Google Scholar] [CrossRef]
- Le, D.M.; Sørensen, H.R.; Knudsen, N.O.; Meyer, A.S. Implications of silica on biorefineries—Interactions with organic material and mineral elements in grasses. Biofuel. Bioprod. Biotechnol. 2015, 9, 109–121. [Google Scholar] [CrossRef]
Figure 1.
Pseudoboehmite and γ-Al2O3 powder XRD patterns.

Figure 2.
N2 adsorption and desorption isotherms and BJH pore size distribution for pseudoboehmite and γ-Al2O3.
Figure 2.
N2 adsorption and desorption isotherms and BJH pore size distribution for pseudoboehmite and γ-Al2O3.

Figure 3.
Silica removal vs. sorbent dosage (initial pH = 8.5, 20 °C, 4 h contact time).

Figure 4.
Effect of initial pH on silica, soluble COD, and color removal by (a) 15 g/L pseudoboehmite and (b) 5 g/L γ-Al2O3 (experimental conditions: 20 °C, 4 h contact time).
Figure 4.
Effect of initial pH on silica, soluble COD, and color removal by (a) 15 g/L pseudoboehmite and (b) 5 g/L γ-Al2O3 (experimental conditions: 20 °C, 4 h contact time).

Figure 5.
Kinetics of silica adsorption on (a) pseudoboehmite and (b) γ-Al2O3 (experimental conditions: initial pH 8.5, dosages and temperatures in the legend).
Figure 5.
Kinetics of silica adsorption on (a) pseudoboehmite and (b) γ-Al2O3 (experimental conditions: initial pH 8.5, dosages and temperatures in the legend).

Figure 6.
Lagergren’s pseudo-first-order rate fit for (a) pseudoboehmite (b) γ-Al2O3 (experimental conditions: initial pH 8.5, dosages and temperatures in the legend).
Figure 6.
Lagergren’s pseudo-first-order rate fit for (a) pseudoboehmite (b) γ-Al2O3 (experimental conditions: initial pH 8.5, dosages and temperatures in the legend).

Figure 7.
Lagergren’s pseudo-second-order rate fit for (a) pseudoboehmite (b) γ-Al2O3 (experimental conditions: initial pH 8.5, dosages and temperatures in the legend).
Figure 7.
Lagergren’s pseudo-second-order rate fit for (a) pseudoboehmite (b) γ-Al2O3 (experimental conditions: initial pH 8.5, dosages and temperatures in the legend).

Figure 8.
Arrhenius plots for (a) pseudoboehmite and (b) γ-Al2O3.

Figure 9.
Intra-particle diffusion for (a) pseudoboehmite (b) γ-Al2O3 (experimental conditions: initial pH 8.5, dosages and temperatures in the legend).
Figure 9.
Intra-particle diffusion for (a) pseudoboehmite (b) γ-Al2O3 (experimental conditions: initial pH 8.5, dosages and temperatures in the legend).

Figure 10.
Analysis of experimental data with Boyd model for (a) pseudoboehmite (b) γ-Al2O3 (experimental conditions: initial pH 8.5, dosages and temperatures in the legend).
Figure 10.
Analysis of experimental data with Boyd model for (a) pseudoboehmite (b) γ-Al2O3 (experimental conditions: initial pH 8.5, dosages and temperatures in the legend).

Figure 11.
Effect of temperature on silica removal by (a) pseudoboehmite and (b) γ-Al2O3 at different adsorbent dosages (initial pH 8.5, 16 h contact time).
Figure 11.
Effect of temperature on silica removal by (a) pseudoboehmite and (b) γ-Al2O3 at different adsorbent dosages (initial pH 8.5, 16 h contact time).

Figure 12.
(a) Langmuir and (b) Freundlich adsorption isotherms for pseudoboehmite (experimental conditions: adsorbent dosages from 1.5 to 20 g/L, 16 h contact time).
Figure 12.
(a) Langmuir and (b) Freundlich adsorption isotherms for pseudoboehmite (experimental conditions: adsorbent dosages from 1.5 to 20 g/L, 16 h contact time).

Figure 13.
(a) Langmuir and (b) Freundlich adsorption isotherms for γ-Al2O3 (experimental conditions: adsorbent dosages from 1.5 to 15 g/L, 4 h contact time).
Figure 13.
(a) Langmuir and (b) Freundlich adsorption isotherms for γ-Al2O3 (experimental conditions: adsorbent dosages from 1.5 to 15 g/L, 4 h contact time).

Figure 14.
Elemental mapping of used γ-Al2O3 (initial pH 8.5, 5 g/L, 35 °C).


Table 1.
Characteristics of the effluent (raw water and dissolved fraction).
| Raw Water | Dissolved Fraction | ||
|---|---|---|---|
| Parameter | Value | Parameter | Value |
| pH | 8.4 ± 0.2 | Total solids (mg/L) | 2450 ± 60 |
| Conductivity (25 °C) (mS/cm) | 3.0 ± 0.1 | COD (mg/L) | 405 ± 17 |
| Total solids (mg/L) | 2520 ± 120 | Reactive silica (mg/L SiO2) | 175 ± 10 |
| Total suspended solids (mg/L) | 65 ± 15 | Sulphates (mg/L) | 395 ± 25 |
| Color (mg/L Pt) | 740 ± 20 | Chlorides (mg/L) | 128 ± 15 |
| Turbidity (NTU) | 24 ± 2 | Phosphates (mg/L) | 11.4 ± 0.5 |
| Total alkalinity (mg/L CaCO3) | 1060 ± 35 | Nitrates (mg/L) | 2.3 ± 0.1 |
| Total silica (mg/L SiO2) | 177 ± 12 | Nitrites (mg/L) | 1.0 ± 0.1 |
| Ammonium (mg/L) | 17.4 ± 0.4 | ||
| Na (mg/L) | 625 ± 14 | ||
| Ca (mg/L) | 35.8 ± 0.5 | ||
| Mg (mg/L) | 3.1 ± 0.2 | ||
Table 2.
Textural properties of pseudoboehmite and γ-Al2O3.
| Adsorbent | BET Surface Area (m2/g) | BJH Pore Volume (cm3/g) | BJH Average Pore Size (nm) |
|---|---|---|---|
| Pseudoboehmite | 237.2 | 0.362 | 6.1 |
| γ-Al2O3 | 180.0 | 0.476 | 10.6 |
Table 3.
Lagergren’s pseudo-first- and -second-order kinetics fit results.
| Pseudoboehmite | ||||||||||||
| 7.5 g/L | 15 g/L | |||||||||||
| Pseudo-First-Order | Pseudo-Second-Order | Pseudo-First-Order | Pseudo-Second-Order | |||||||||
| T (°C) | qe (mg/g) | k1 (min−1) | Adj-R2 | qe (mg/g) | k1 (min−1) | Adj-R2 | qe (mg/g) | k1 (min−1) | Adj-R2 | qe (mg/g) | k1 (min−1) | Adj-R2 |
| 20 | 15.87 | 0.00517 | 0.893 | 21.80 | 0.001035 | 0.996 | 13.43 | 0.00794 | 0.884 | 11.40 | 0.004626 | 1.000 |
| 35 | 13.06 | 0.00640 | 0.862 | 22.06 | 0.002031 | 0.999 | 10.01 | 0.00885 | 0.861 | 11.68 | 0.008788 | 1.000 |
| 50 | 10.56 | 0.00928 | 0.868 | 22.90 | 0.004103 | 1.000 | 5.81 | 0.01019 | 0.800 | 12.08 | 0.020978 | 1.000 |
| γ-Al2O3 | ||||||||||||
| 2.5 g/L | 5 g/L | |||||||||||
| T (°C) | qe (mg/g) | k1 (min−1) | Adj-R2 | qe (mg/g) | k1 (min−1) | Adj-R2 | qe (mg/g) | k1 (min−1) | Adj-R2 | qe (mg/g) | k1 (min−1) | Adj-R2 |
| 20 | 37.25 | 0.00096 | 0.897 | 58.48 | 0.000866 | 0.999 | 16.69 | 0.00174 | 0.853 | 33.36 | 0.003213 | 0.9989 |
| 35 | 33.54 | 0.00153 | 0.812 | 62.19 | 0.001253 | 0.999 | 12.30 | 0.00244 | 0.719 | 33.68 | 0.004951 | 1.000 |
| 50 | 37.03 | 0.00159 | 0.869 | 65.49 | 0.001344 | 0.999 | 10.48 | 0.00312 | 0.571 | 33.90 | 0.005944 | 1.000 |
Table 4.
Activation energy from Arrhenius plots for pseudoboehmite and γ-Al2O3.
| Adsorbent | Dosage (g/L) | A0 (g/mg·min) | Ea (kJ/mol) | Adj.-R2 |
|---|---|---|---|---|
| Pseudoboehmite | 7.5 | 2750 | 36.1 | 0.998 |
| 15 | 22025 | 39.5 | 0.987 | |
| γ-Al2O3 | 2.5 | 11646 | 11.6 | 0.906 |
| 5 | 16228 | 16.2 | 0.955 |
Table 5.
Results from linear fits of the three main linear regions obtained after applying intra-particle diffusion model for pseudoboehmite and γ-Al2O3.
Table 5.
Results from linear fits of the three main linear regions obtained after applying intra-particle diffusion model for pseudoboehmite and γ-Al2O3.
| T (°C) | Dosage (g/L) | kip,1 (mg/g·min0.5) | kip,2 (mg/g·min0.5) | kip,3(mg/g·min0.5) | C1(mg/g) | C2(mg/g) | C3(mg/g) | R12 | R22 | R32 | |
|---|---|---|---|---|---|---|---|---|---|---|---|
| Pseudoboehmite | 20 | 7.5 | 1.68 | 0.67 | 0.32 | 0 | 6.80 | 12.13 | 0.980 | 0.981 | 1.000 |
| 15 | 2.85 | 1.10 | 0.18 | 0 | 7.48 | 17.87 | 0.995 | 0.975 | 0.994 | ||
| 35 | 7.5 | 2.78 | 0.65 | 0.12 | 0 | 9.62 | 17.67 | 0.990 | 0.967 | 1.000 | |
| 15 | 4.88 | 0.72 | 0.02 | 0 | 13.28 | 22.73 | 0.952 | 0.969 | 0.662 | ||
| 50 | 7.5 | 3.92 | 0.56 | 0.03 | 0 | 17.65 | 22.02 | 0.973 | 0.903 | 0.967 | |
| 15 | 8.98 | 0.67 | 0.02 | 0 | 13.10 | 23.92 | 0.838 | 0.903 | 0.461 | ||
| γ-Al2O3 | 20 | 2.5 | 16.79 | 2.87 | 0.34 | 0 | 15.24 | 22.02 | 0.973 | 0.987 | 0.967 |
| 5 | 12.40 | 2.66 | 0.11 | 0 | 10.74 | 30.05 | 1.000 | 0.967 | 0.864 | ||
| 35 | 2.5 | 14.03 | 2.48 | 0.34 | 0 | 27.61 | 50.63 | 0.918 | 0.970 | 0.945 | |
| 5 | 10.66 | 1.48 | 0.12 | 0 | 19.45 | 30.02 | 0.883 | 0.930 | 0.821 | ||
| 50 | 2.5 | 13.53 | 3.44 | 0.25 | 0 | 24.18 | 57.39 | 0.973 | 0.956 | 0.877 | |
| 5 | 10.88 | 2.00 | 0.09 | 0 | 19.31 | 30.96 | 0.957 | 0.909 | 0.961 |
Table 6.
Boyd fit results for pseudoboehmite and γ-Al2O3.
| T (°C) | Pseudoboehmite | γ-Al2O3 | ||
|---|---|---|---|---|
| 7.5 g/L | 15 g/L | 2.5 g/L | 5 g/L | |
| 20 | 0.0040t + 0.081 (R2 = 0.970) | 0.0070t + 0.239 (R2 = 0.944) | 0.0068t + 0.166 (R2 = 0.983) | 0.0103t + 0.421 (R2 = 0.941) |
| 35 | 0.0055t + 0.236 (R2 = 0.944) | 0.0080t + 0.532 (R2 = 0.940) | 0.0078t + 0.342 (R2 = 0.928) | 0.0098t + 0.758 (R2 = 0.862) |
| 50 | 0.0084t + 0.463 (R2 = 0.936) | 0.0092t + 1.138 (R2 = 0.918) | 0.0103t + 0.304 (R2 = 0.945) | 0.0089t + 0.959 (R2 = 0.714) |
Table 7.
Results from thermodynamic parameters calculation.
| Sorbent | T (°C) | Kd (L/g) | ΔG0 (kJ/mol) | ΔH0 (kJ/mol) | ΔS0 (kJ/mol·K) | R2 |
|---|---|---|---|---|---|---|
| 20 | 228 | −13.23 | 29.5 | 0.145 | 0.976 | |
| Pseudoboehmite | 35 | 353 | −15.02 | |||
| 50 | 705 | −17.61 | ||||
| 20 | 1113 | −17.09 | 18.8 | 0.123 | 0.997 | |
| γ-Al2O3 | 35 | 228 | −13.23 | |||
| 50 | 353 | −15.02 |
Table 8.
Composition of used sorbents by SEM-EDX.
| Sorbent | Dosage (g/L) | T (°C) | Al (wt.%) | O (wt.%) | Si (wt.%) | Ca (wt.%) | Na (wt.%) |
|---|---|---|---|---|---|---|---|
| Fresh | - | 41.40 ± 0.50 | 58.60 ± 0.82 | - | - | - | |
| 7.5 | 20 | 35.18 ± 1.61 | 64.11 ± 1.61 | 0.71 ± 0.00 | - | - | |
| Pseudoboehmite | 7.5 | 50 | 39.88 ± 0.92 | 58.70 ± 1.19 | 0.96 ± 0.18 | 0.46 ± 0.20 | - |
| 15 | 20 | 39.71 ± 1.17 | 59.54 ± 1.45 | 0.52 ± 0.11 | 0.23 ± 0.11 | - | |
| 15 | 50 | 36.08 ± 0.78 | 62.93 ± 0.67 | 0.61 ± 0.03 | 0.13 ± 0.01 | 0.26 ± 0.15 | |
| Fresh | - | 48.3 ± 0.7 | 51.7 ± 0.7 | - | - | - | |
| γ-Al2O3 | 2.5 | 35 | 41.67 ± 0.95 | 52.66 ± 0.65 | 2.42 ± 0.12 | 2.37 ± 0.52 | 0.88 ± 0.55 |
| 5 | 35 | 40.38 ± 1.12 | 55.34 ± 1.20 | 1.97 ± 0.09 | 2.32 ± 0.40 | - |
Publisher’s Note: MDPI stays neutral with regard to jurisdictional claims in published maps and institutional affiliations. |
© 2021 by the authors. Licensee MDPI, Basel, Switzerland. This article is an open access article distributed under the terms and conditions of the Creative Commons Attribution (CC BY) license (https://creativecommons.org/licenses/by/4.0/).
Share and Cite
MDPI and ACS Style
Miranda, R.; Latour, I.; Blanco, A. Silica Removal from a Paper Mill Effluent by Adsorption on Pseudoboehmite and γ-Al2O3. Water 2021, 13, 2031. https://doi.org/10.3390/w13152031
AMA Style
Miranda R, Latour I, Blanco A. Silica Removal from a Paper Mill Effluent by Adsorption on Pseudoboehmite and γ-Al2O3. Water. 2021; 13(15):2031. https://doi.org/10.3390/w13152031
Chicago/Turabian StyleMiranda, Ruben, Isabel Latour, and Angeles Blanco. 2021. "Silica Removal from a Paper Mill Effluent by Adsorption on Pseudoboehmite and γ-Al2O3" Water 13, no. 15: 2031. https://doi.org/10.3390/w13152031
Note that from the first issue of 2016, this journal uses article numbers instead of page numbers. See further details here.