
Effects of the “Grain for Green” Program on Soil Water Dynamics in the Semi-Arid Grassland of Inner Mongolia, China


1
College of Forestry, Henan Agricultural University, Zhengzhou 450002, China
2
Insititute of Land Resources and Sustainable Development, Yunnan University of Finance and Economics, Kunming 650221, China
*
Author to whom correspondence should be addressed.
Water 2021, 13(15), 2034; https://doi.org/10.3390/w13152034
Submission received: 1 June 2021
/
Revised: 16 July 2021
/
Accepted: 20 July 2021
/
Published: 26 July 2021
(This article belongs to the Special Issue Soil–Plant–Water Dynamics on a Field Scale)
Abstract
:The Grain for Green Program (GGP) initiated by Chinese government significantly impacts mitigating environmental degradation. Soil water resources probably constrain large-scale vegetation restoration projects in arid and semi-arid regions. Characterizing soil water dynamics after the GGP’s implementation is essential in assessing whether vegetation restoration can be sustained as part of ecological restoration. In this study, four sites were selected for field investigation: original natural grassland (NG) and grassland that was reconverted from cropland 12 years (12-year site), 8 years (8-year site), and 6 years (6-year site) before. Soil water at five depths was measured continuously at 10 min intervals at four sites. The findings showed that less rainfall infiltrated a deeper soil layer as the time after restoration augmented, and the 12-year site had the shallowest infiltration depth and soil water storage. Younger restored grassland (8-year and 6-year sites) had a higher soil water content than older restored grassland (12-year site) and NG. The soil water content decreased steadily with restoration age after an immediate initial rise, and the highest soil moisture was in the 8-year site. The results suggest that soil water dynamics varied with GGP and a soil water deficit could be formed after the GGP’s implementation for 12 years in semi-arid grassland.
1. Introduction
The Grain for Green Program (GGP) was initiated by the Chinese government in 1999 [1] in order to curtail environmental degradation [2]. The GGP is an essential ecological restoration program in China [1,3,4,5], and is the largest forest ecological construction project in the world [6]. This program has invested over USD 30 billion and has been implemented in more than 2000 counties in China, accounting for 82% of its land area [7]. Its significant environmental effects have important global implications [2,3], and much attention has been paid to their ecological benefits, such as increased soil carbon sequestration [1], soil erosion mitigation [8,9], protection biodiversity, and desertification control [3]. However, the impact of deliberate vegetation restoration on water resources is currently a major source of concern [10,11].
Soil water is an important component of terrestrial water resources and plays a major role in natural systems and biogeochemical cycles [12,13,14,15]. Soil water is a crucial limiting factor for plant productivity in arid and semi-arid regions [12,16,17], and it greatly impacts hydrological processes [18,19] and vegetation distribution [3,20,21]. Therefore, characterizing soil water variations across various spatial and temporal scales has important theory and practice applications and will be fundamental for optimizing re-vegetation [10,22]. Soil water dynamics are greatly influenced by many factors such as vegetation characteristics (plant species, age, and density) [16,23], climatic factors (precipitation, temperature, and evapotranspiration) [24,25], soil properties (soil texture, soil porosity, and soil organic matter, etc.) [26], topography [27,28], and land-use/landcover patterns [8,29]. Vegetation influences soil water dynamics after rainfall by altering interception [13,30], infiltration [31], root water uptake [32], and evaporation processes [33]. Such an impact also changes with plant species and leads to soil water temporal variations. Consequently, it is important to quantify soil water content under different vegetation characters (plant species, coverage, and biomass) across the temporal scale [34].
The GGP has contributed 16,000 km2 of planted vegetation, causing a 25% increase in vegetation cover over the last decade [20]. After the GGP’s implementation, the sediment discharge into the Yellow River massively decreased [35]. However, many negative ecohydrological impacts have been reported because of increasing water consumption by established vegetation. Yang et al. [36] found that the soil water content decreased strongly in semi-arid grasslands that were converted from farmlands, and Wang et al. [37] reported that a dried soil layer was formed during vegetative restoration in the semi-arid region. Newly established vegetation usually has higher net primary productivity and evapotranspiration than native plants [20], and the older restored steppe uses water more efficiently than the younger restored steppe [38]. In addition, increased ET has induced a significant depletion of local soil water resources [10]. One consequence of the GGP is increasingly severe water shortages and soil desiccation [22,37]. Soil water supplies most likely constrain large-scale vegetation restoration projects in arid and semi-arid regions [4].
The semi-arid grassland of Inner Mongolia is a typical pilot area for the GGP. Water is a critical factor for vegetation restoration in this area, because inadequate moisture inhibits sustainable vegetation growth. However, there is little information on the GGP’s effects on soil water dynamics in the semi-arid grasslands of Inner Mongolia, where cropland is being converted to grassland [5,38], and much research was focused on the Loess Plateau of China, where the main purpose of the GGP is forest restoration [1,12,39,40,41]. The objectives of this study were to investigate soil water dynamics as the restoration years increased and difference in soil water content along with the progression of the GGP.
2. Materials and Methods
2.1. Study Area
This study was carried out at the Taipus Banner, Inner Mongolia, China. This area belongs to the typical Eurasian Steppe and has a continental temperate semi-arid climate. Its mean annual temperature and mean annual precipitation are 1.6 °C and 392 mm, respectively. The hottest month is July (17.8 °C on average) and the coldest month is January (−17.6 °C on average). Furthermore, 65% of precipitation occurs from July to September. Annual pan evaporation reaches 1900 mm on average. The annual period of wind velocity >15 m s−1 is 20–80 d, mainly occurring in spring and winter. The zonal soils are mainly light chestnuts and chestnuts (equivalent to Calcic-orthic Aridisol according to USDSA soil taxonomy) [21], which developed from basalt and sand sediments. In the soil profile, caliche resulting from the dissolving and leaching of CaCO3 by rainwater is commonly found in the form of either nodules or layers. Depth of the calcic deposits varies from near the surface to a depth of a meter. Soil textures are mainly sand and sandy loam. The main land uses in this area are farming and grazing. The grazing pressure increased from 0.91 sheep/ha in 1950 to around 4.0 sheep/ha in 2000, and grazing intensity has fallen to 1.21 sheep/ha at the present after the GGP’s implementation. The grassland was converted to cropland as many people migrated into this area in the 1950s, and the grassland was cultivated for about 50 years until the GGP’s implementation.
According to reconversion ages, four experimental sites were selected for field investigation: natural grassland (NG) and grasslands that were reconverted from cropland 12 years (12-year site), 8 years (8-year site), and 6 years (6-year site) before (Figure 1). The four sites have similar soil parent materials, meteorological conditions, and land-use history. No management practices were applied to the reconverted grassland after Korshinsk peashrub (C. korshinskii kom.) was planted. Vegetation usually germinated in late April and started to wilt in early October, with a growing season of approximately 150 days, possibly shorter in drought years.
There were three sampling plots (50 m × 50 m) for each site, and four replicate measurements of each investigated variable were obtained from each sampling plot. At each plot, five 1 m × 1 m quadrats were used to investigate vegetation characteristics, and each quadrat was separated by a minimum distance of 10 m. Total plant coverage, aboveground biomass, belowground biomass, and species emerging in each quadrat were recorded. Total plant coverage within each quadrat was estimated using a gridded quadrat frame. For the aboveground biomass, all living biomass within each quadrat was collected by clipping to the soil surface, oven dried at 65 °C to constant mass, and weighed. Belowground biomass was estimated by sampling five soil cores within each quadrate with a root auger (8 cm in diameter) from the top 40 cm at 10 cm intervals. All the roots were carefully washed over a screen to separate the roots from the soil, oven dried at 65 °C to constant mass, and weighed. The most common plant species in the NG were Cleistogenes squarrosa, Stipa krylovii, and Artemisia frigida, and in the 12-year site they were Potentilla tanacetifolia, Thalictrum petaloideum, Stipa krylovii, and Agropyron cristatum. In the 8-year site, vegetation consisted mainly of Cleistogenes squarrosa, Heteropappus altaicus, and Artemisia capillaris. In the 6-year site, the dominant species were Artemisia sieversiana, Artemisia capillaris, and Erodium stephanianum (Table 1). The aboveground biomass decreased with the GGP implementation years, and in the 6-year site it was the highest (Figure 2). The belowground biomass was much higher than the aboveground biomass in all sites. The belowground biomass of the NG and 12-year site were about 11 times higher than their aboveground biomass, and that of the 8-year and 6-year sites were only about three and four times higher than their aboveground biomass, respectively (Figure 2).
Composite soil samples were collected from four points in each plot in an S-shaped pattern from the top 40 cm and then used for physical and chemical analyses. Particle size composition was determined by the hydrometer method. Soil organic matter (SOM) was measured by the K2Cr2O7-H2SO4 oxidation method of Walkey and Black. Total nitrogen (TN) was measured using a Nitrogen/Carbon Analyzer (NA-1500-NC Series 2) with Eager 200 software (Fisons Instruments, Beverly, MA, USA). Total phosphorus (TP) was measured by molybdenum blue colorimetry, after H2SO4-HClO4 digestion. Table 2 and Table 3 show the characteristics of soil physical and chemical properties of the four study sites. We found that the bulk density in the NG increased and porosity decreased with increasing depth. However, the bulk density in the 12-year, 8-year, and 6-year sites first decreased and then increased from the surface to the deep soil layers. Soil clay and silt contents in the 8-year and 6-year sites were higher than that in the 12-year site. The problem of soil nutrient loss and soil coarsening would happen after the cropland was converted to grassland [42]. Reconverted grasslands had a deeper calcic layer and higher CaCO3 content than NG (Table 3, Figure 3). The NG also had higher levels of SOM and TN than the 12-year, 8-year, and 6-year sites in the surface soil (0–20 cm).
2.2. Experimental Design and Data Collection
Soil water contents (%) were measured by ECH2O 5TE sensors (Decagon Devices, Pullman, WA, USA). The 5TE sensors can precisely and continuously provide measurement and have been widely used in similar research [24,43]. At each site, five 5TE sensors were installed at soil depths of 10, 20, 40, 60, and 100 cm to measure soil moisture at 10-min intervals. According to the empirical calibration equation, we calibrated soil moisture data to get approximately ± 0.02 m3 m−3 = accuracy for a specific soil layer based on the soil bulk density [24]. Soil water content measurements were carried out from June 2011 to May 2012. Precipitation was recorded using a tipping bucket rain gauge (Model TE 525) at 10-min intervals. The average cumulative infiltration was estimated by soil water data using the following equation:
where I means cumulative infiltration (mm), θn’ means volumetric soil water content (%) of layer n measured 2 h after precipitation, θn means initial volumetric soil water content in layer n (%), and kn means layer n thickness (mm).
Soil water storage was calculated as follows:
where SWS means soil water storage (mm), kn means layer n thickness (mm), and θvn means volumetric soil water content in layer n (%).
2.3. Data Analysis
Differences in soil moisture between different group sites were analyzed using the one-way analysis of variance (ANOVA) and Fisher’s protected least significant difference test. All statistical analyses were completed using version 17.0 of SPSS (SPSS Inc., Chicago, IL, USA) at the p = 0.05 level of confidence. Graphic plotting was generated using Origin Pro 2018 (Origin Lab, Northampton, MA, USA).
3. Results
3.1. Soil Water Dynamics
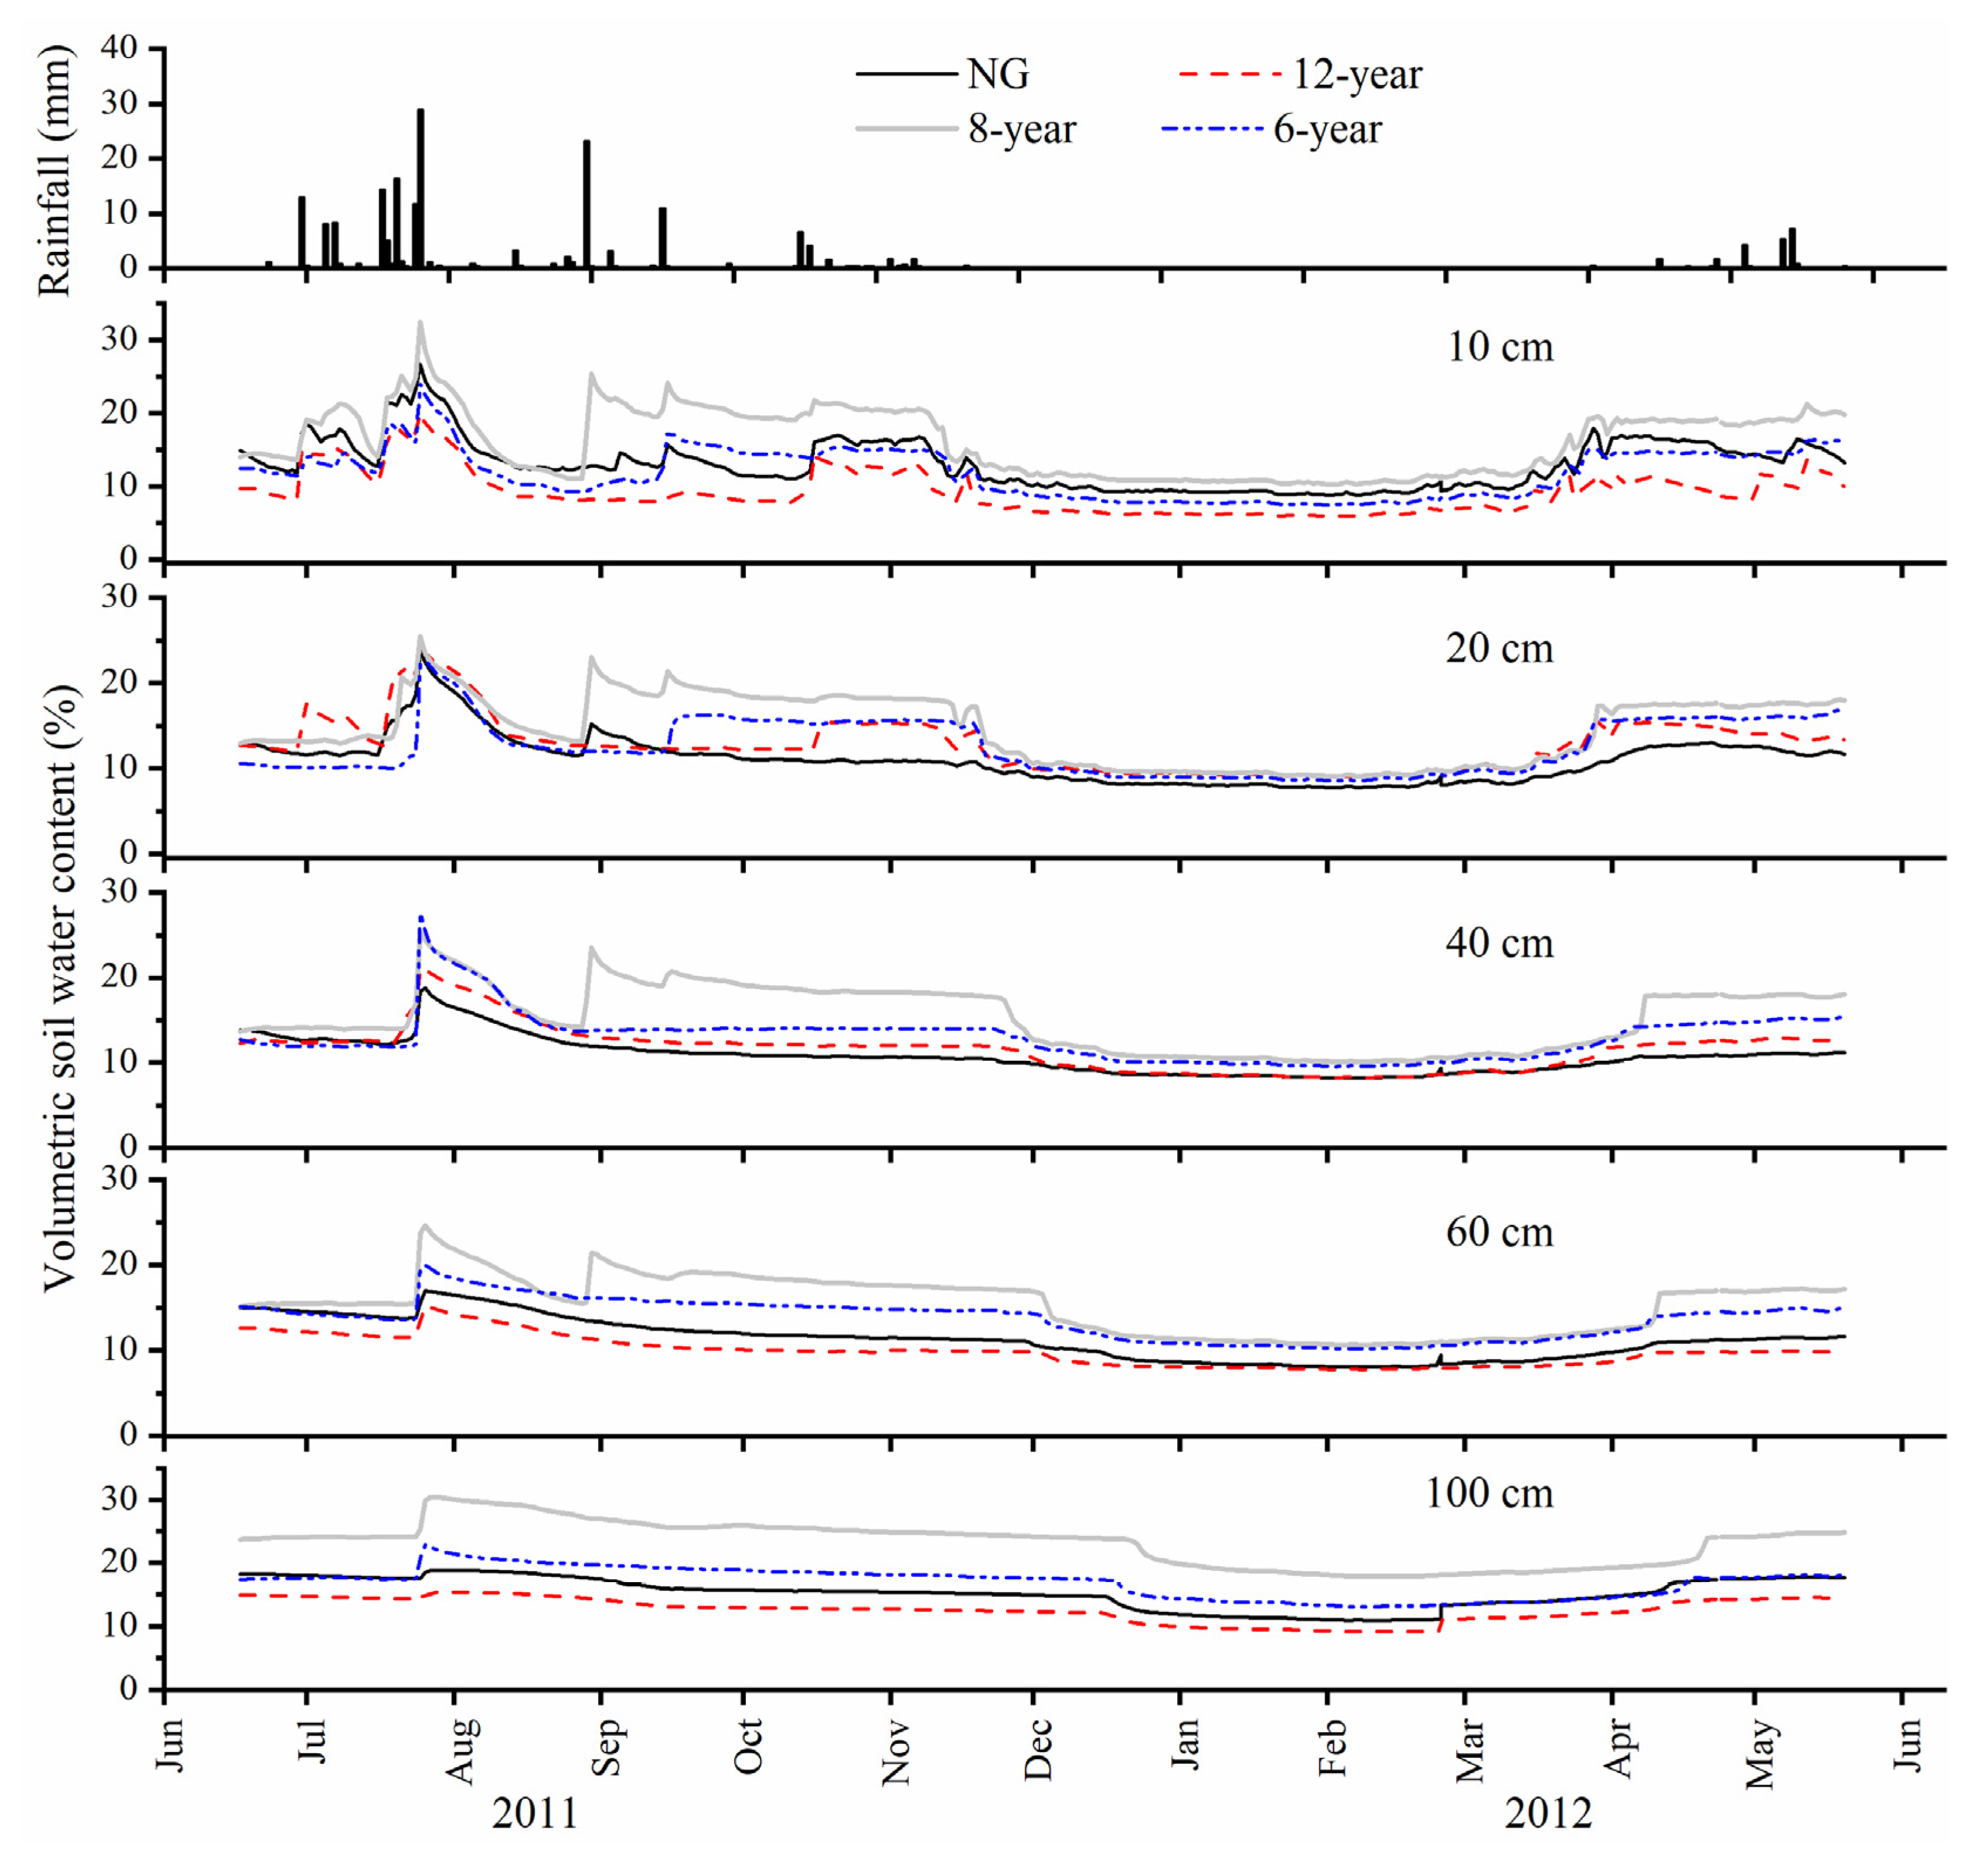
In general, the changes of daily soil water contents were closely related to precipitation in all sites (Figure 4). Soil water content was sensitive and responsive to rainfall pulses in 0–20 cm soil layers. However, the reaction became slow and variability in soil water content reduced dramatically in 40–100 cm soil layers. Furthermore, the temporal decay of the soil water pulse changed with the depths from days (upper layers) to weeks (lower layers). The soil water content at varying soil depths (10–100 cm) had no response to rainfall events of less than 8 mm during the period studied. The soil water contents in 0–60 cm increased abruptly in response to an intense rain on 24–25 July 2011 (40.4 mm) and 29 August 2011 (23.2 mm) (Figure 4). In addition, remarkable increases in soil water were observed at the 100 cm soil depth for the 8-year and 6-year sites after 40.4 mm rainfall on 24–25 July, indicating that rainfall can replenish into deep soil layer in younger reconverted grasslands during rainy seasons. Moreover, we also found that during the long winter period from November to March, the soil was frozen and the liquid soil water content was low in all study sites. Meanwhile, the soil water content revealed a growing tendency at the beginning of April because of the thawing ground and increasing infiltration.
The soil water content in the NG and reconverted grasslands (12-year, 8-year, and 6-year sites) responded differently at varying soil depths (Figure 4 and Figure 5). At a soil depth of 0–10 cm, the soil water content in the 8-year site was the highest, followed by the NG and 6-year site, and then the 12-year site. At 10–20 cm, the average soil water content in the NG was the lowest, and the differences between the 12-year and 6-year sites were not significant. At 20–40 cm, the 8-year site had the highest soil water content, followed by 6-years, and the NG had the lowest soil water content. At 40–100 cm soil depth, the highest soil water content was still in the 8-year site, and the 12-year site had the lowest soil water. The results showed that the 8-year site had the highest average soil water content at 0–100 cm, and the average soil water content in the 12-year site was the lowest at the surface (0–10 cm) and deep soil layers (40–100 cm). The results also manifested that the soil water content first increased, then decreased with reconversion years, and the soil water content reached the maximum and minimum value in the 8-year and 12-year sites, respectively. For example, the annual mean soil moisture (0–100 cm) was 12.14%, 11.60%, 16.89%, and 13.63% in the NG, 12-year, 8-year, and 6-year sites, respectively.
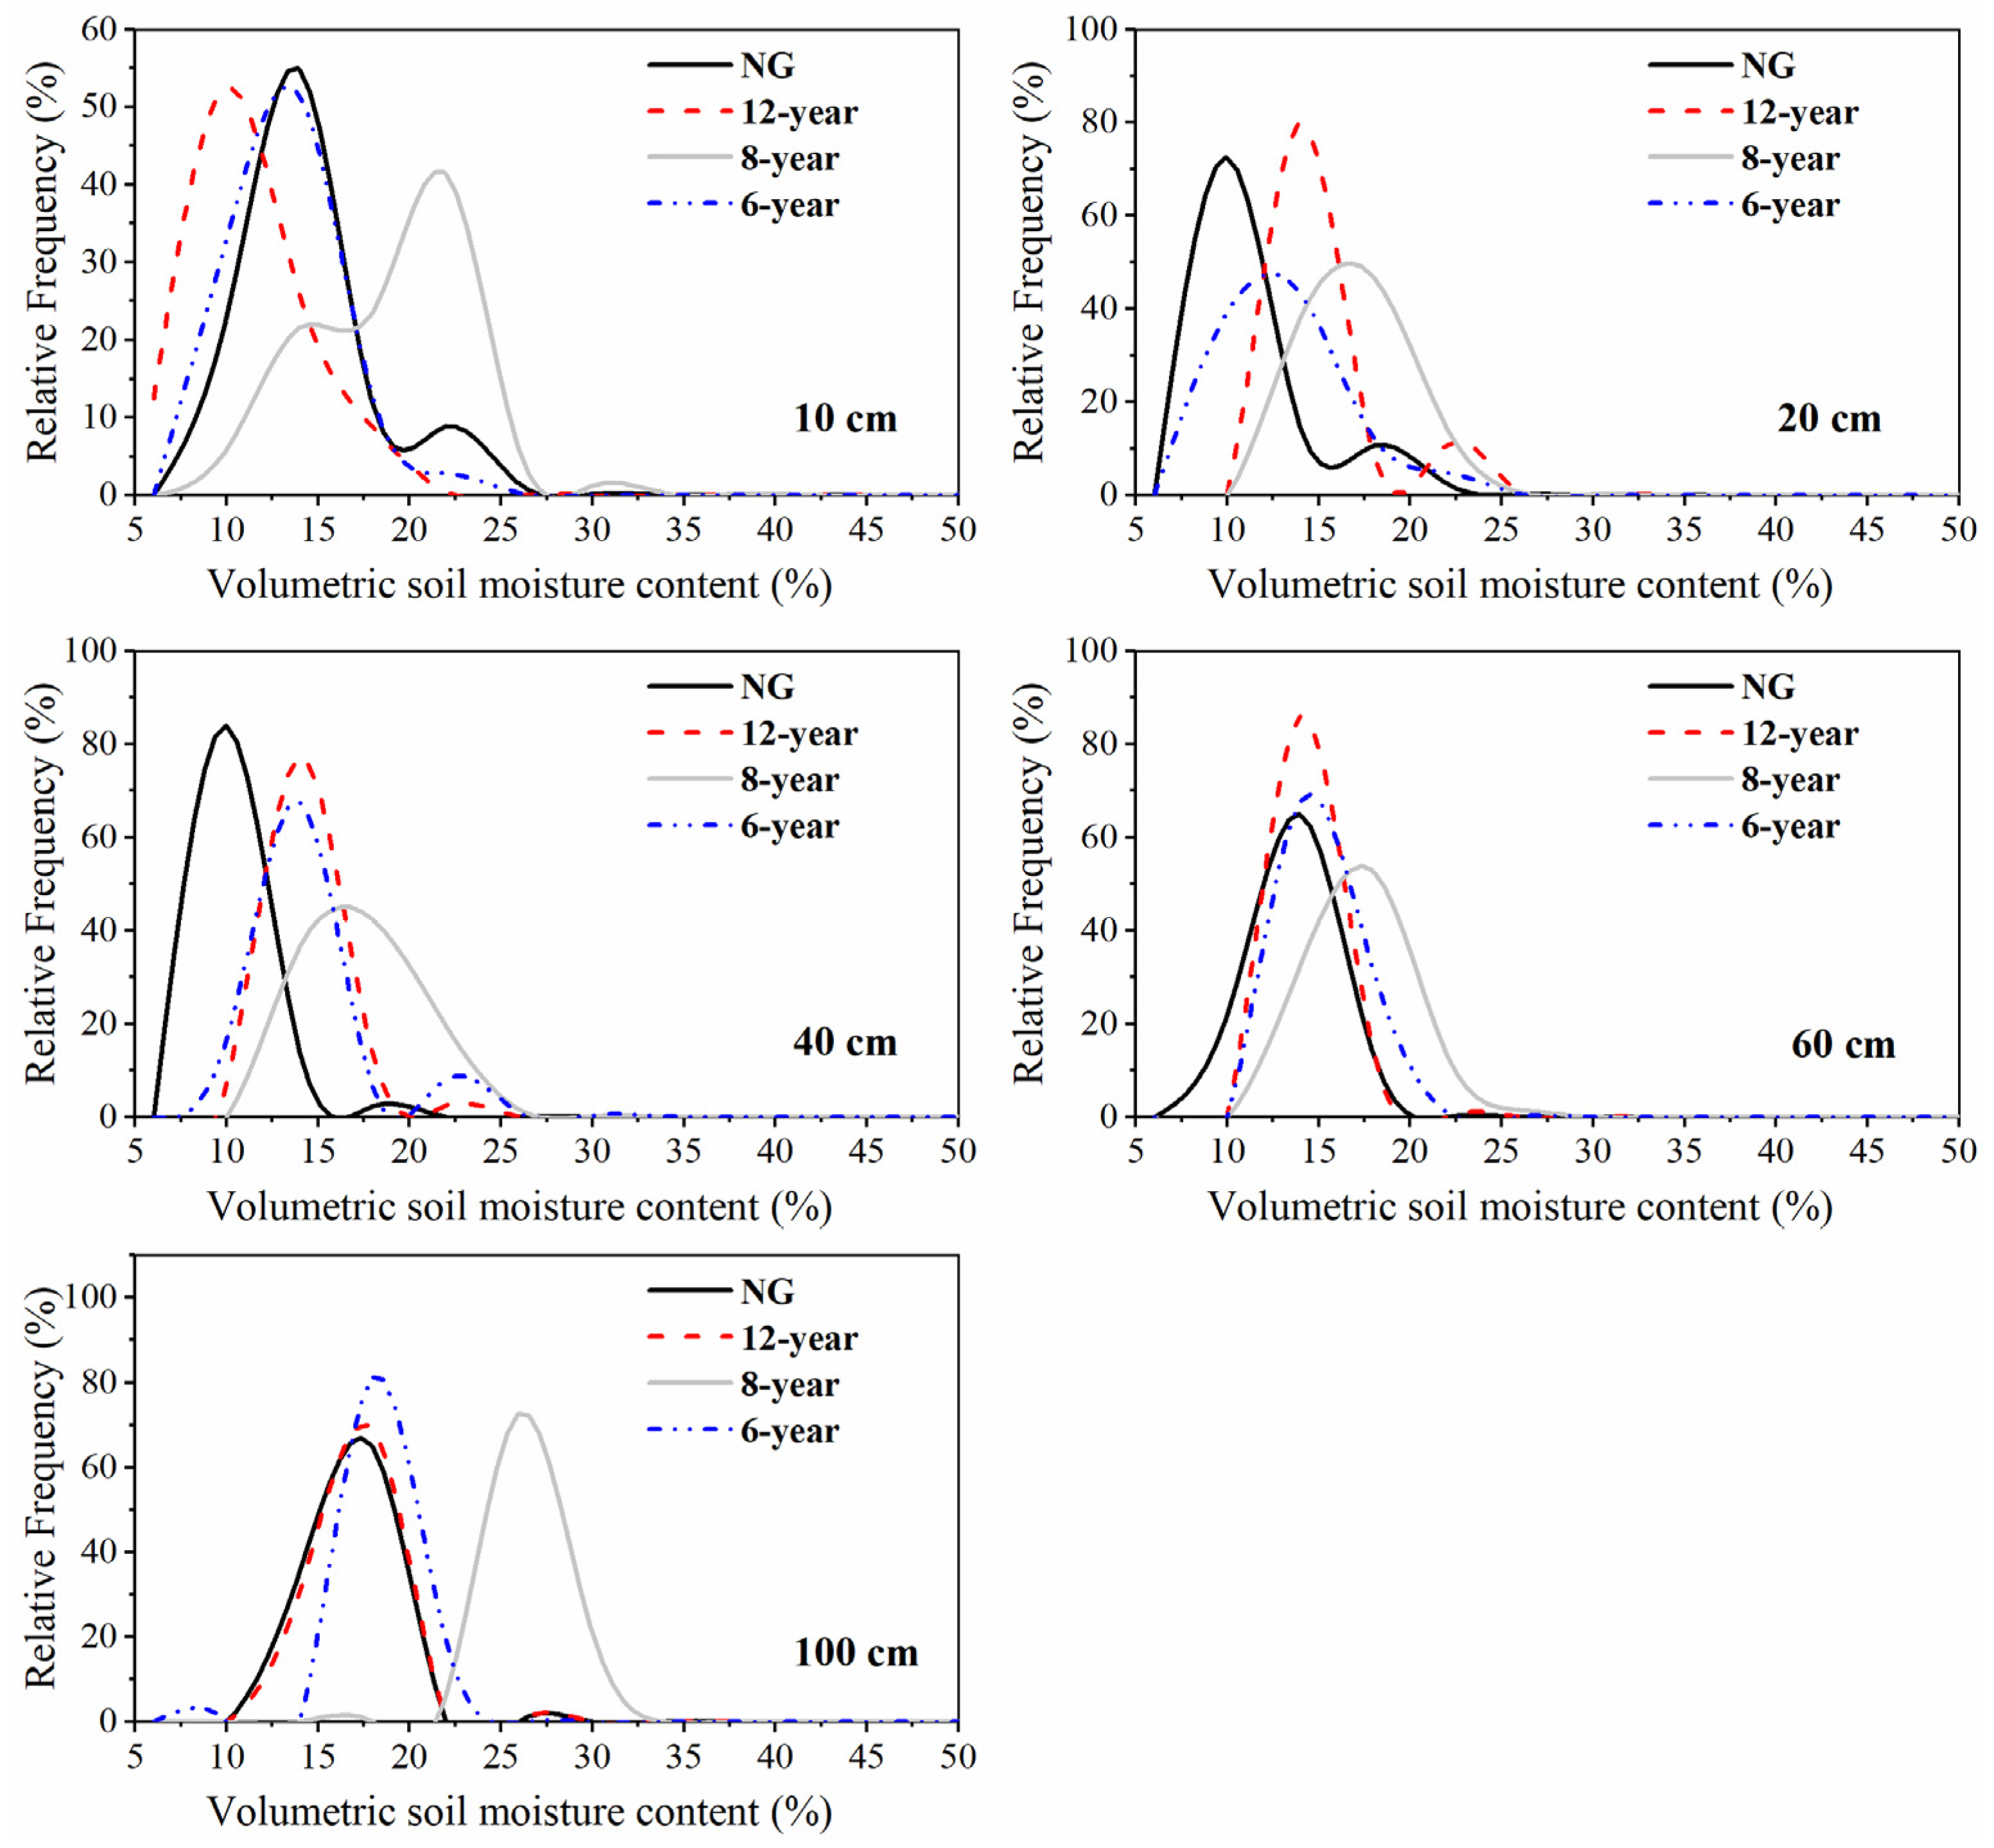
The relative frequency of the soil water content (Figure 6) showed that at 0–10 cm, there was 89%, 87%, 51%, and 97% of soil water in the NG, 12-year, 8-year, and 6-year sites, respectively, in the range of 10–18% during the experimental periods. Over 45% of the soil water in the 8-year site was in the range of 22–26% at 0–10 cm. At 10–20 cm, the soil water content was mainly distributed in 10–18% in the NG, 14–22% in the 12-year and 8-year sites, and 10–22% in the 6-year site. At 20–40 cm, the 8-year and 6-year sites displayed the higher soil water content, almost all ranging from 14% to 22%. By contrast, the NG was the lowest, mainly ranging from 10% to 14%. At 40–60 cm, the soil water was mainly distributed in 10–18% in the NG, 14–18% in the 12-year and 6-year sites, and the 8-year site had the highest soil water content, mainly ranging from 14% to 22%. At 60–100 cm, the soil water was distributed in 14–18% in the NG and 12-year site, 18–22% in the 6-year site, and there was 94% of soil water in the 8-year site in the range of 26–30%. The changes of frequency distributions of the 10 min soil water contents confirm the results of daily time series of soil water dynamics.
3.2. Infiltration Processes
Figure 7 shows that there are positive linear correlations between the rainfall amounts during the 12 individual rainfall events (each with 2.0–40.4 mm rainfall) and the corresponding cumulative infiltrations. The cumulative infiltrations in the NG, 12-year, 8-year, and 6-year sites can be measured using the following equations, respectively:
where ING, I12-years, I8-years, and I6-years are cumulative infiltrations (mm) in the NG, 12-year, 8-year, and 6-year sites, respectively, and p means single rainfall depth (mm). A comparison of Equations (3)–(6) indicates that cumulative infiltrations in the 6-year and 8-year sites were more sensitive to rainfall amounts than that in the NG and 12-year site. The results also showed that differences between the NG and 12-year site were not significant. It was estimated that about 58%, 51%, 76%, and 96% of rain permeated into soil in the NG, 12-year, 8-year, and 6-year sites, respectively.
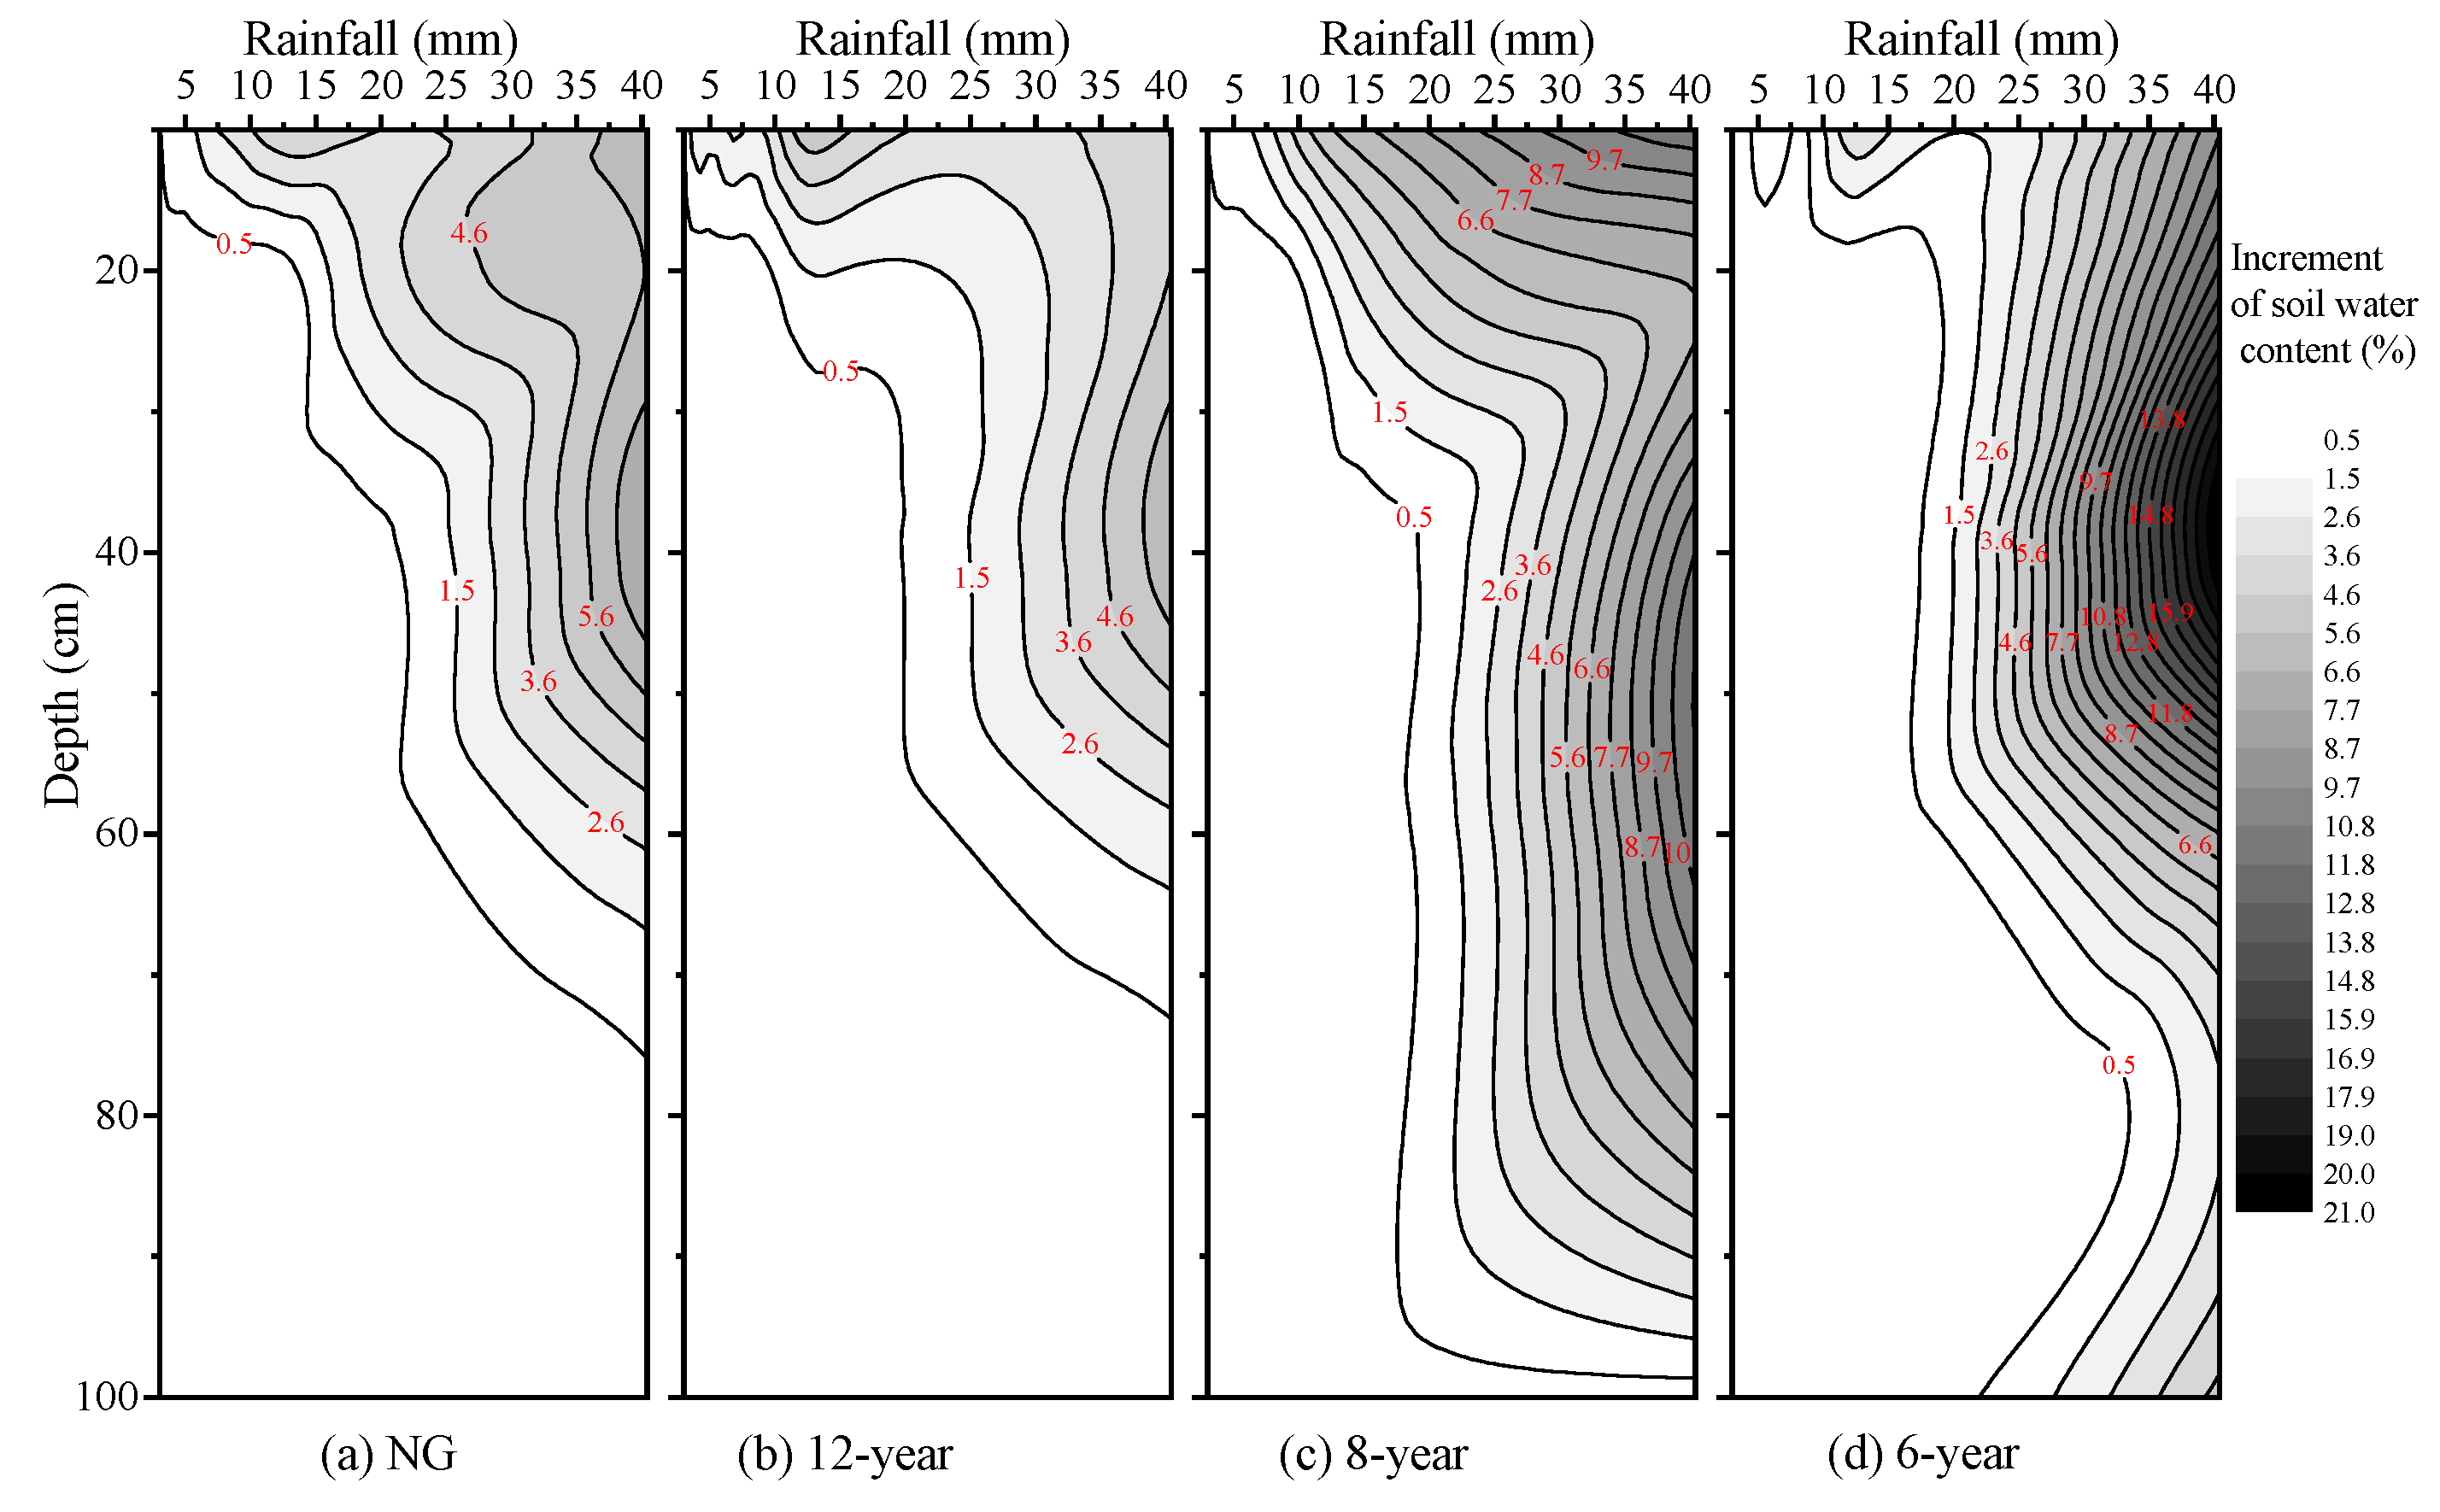
Based on the data of 12 selected rainfall events (2.0–40.4 mm), incremental soil water contents 2 h after rainfall in the soil profile (0–100 cm) were interpolated to unveil the relationships between soil moisture and rainfall amounts under different sites (Figure 8). We got three observations from Figure 8. First, the soil moisture increases in the NG and 12-year site were lower than those in the 8-year and 6-year sites, and even the rainfall larger than 30 mm cannot penetrate to 80 cm soil depth under the NG and 12-year site. Second, compared with the NG and 12-year site, the soil water content in the 8-year and 6-year sites was more immediately responsive to precipitation. Third, soil moisture in the 6-year site was more sensitive to large rainfall events than small rainfall events. When rainfall was lower than 15 mm, the soil moisture only increased within 20 cm soil depth in the 6-year site but increased at 30 cm soil depth in the NG, 12-year, and 8-year sites. When precipitation was about 40 mm, rainfall could penetrate to 100 cm soil depth in the 6-year site, and the increase was most profound at a depth of 40 cm.
3.3. Soil Water Storage
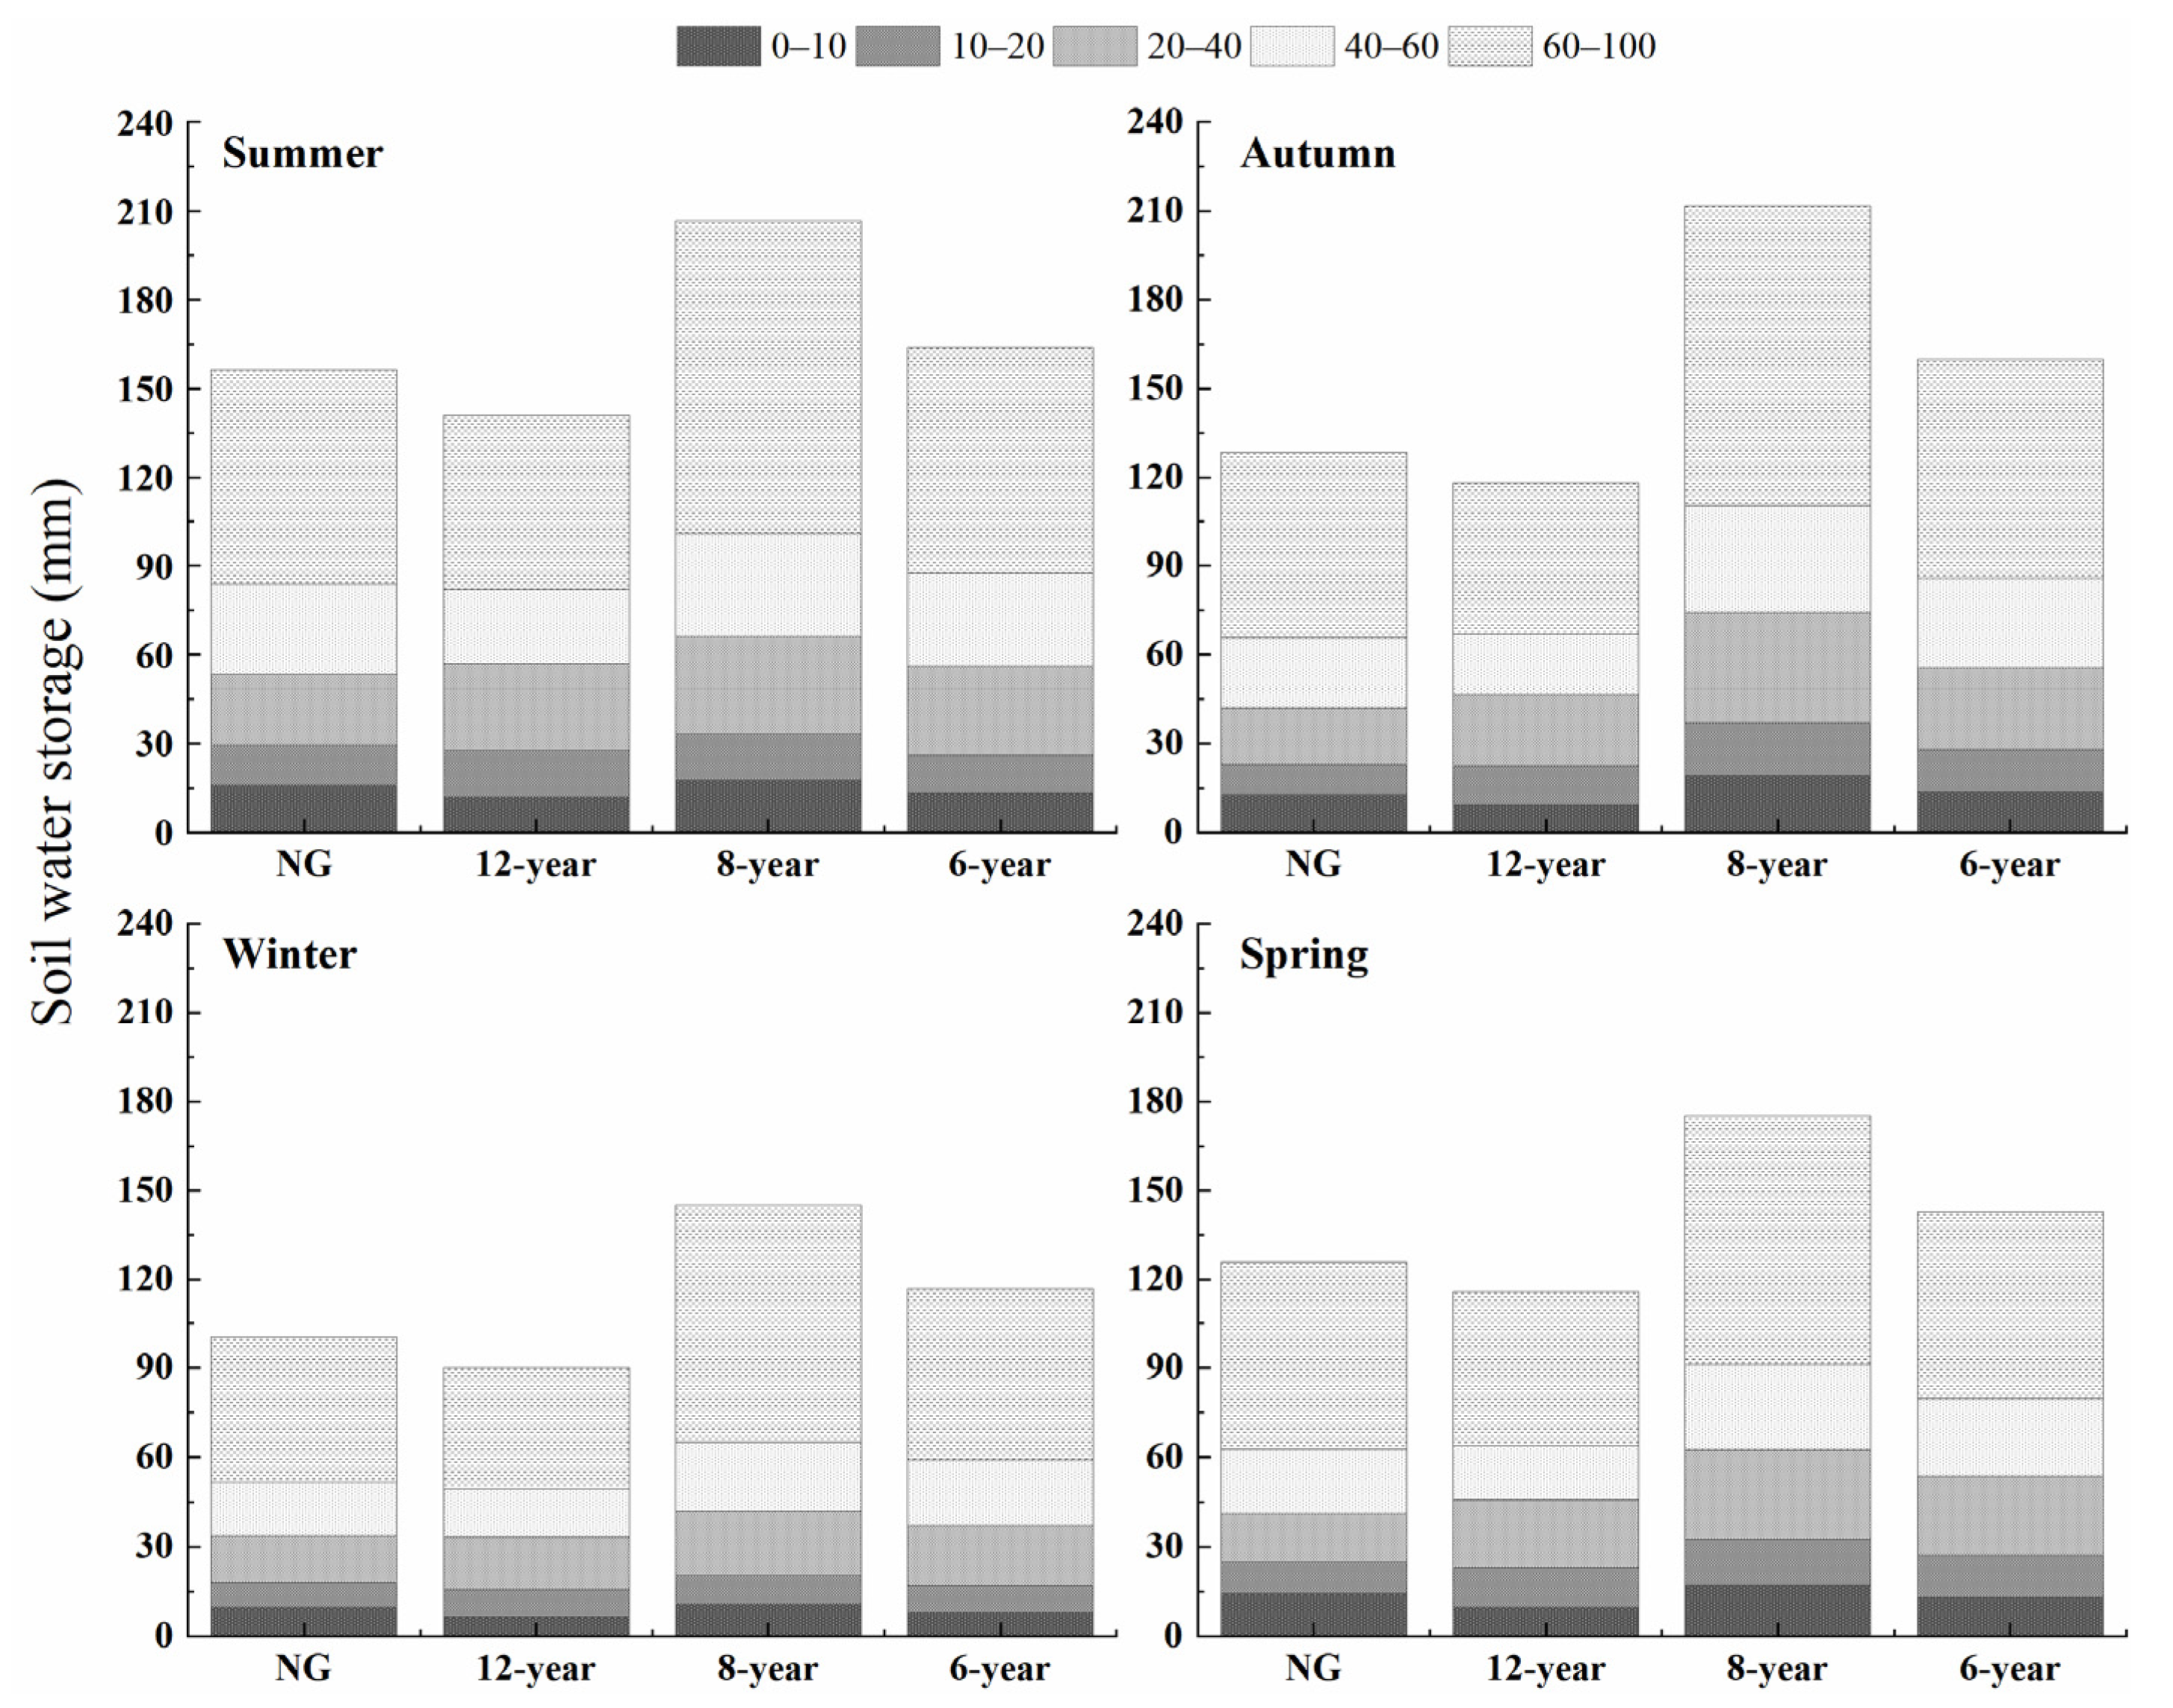
Significant differences were found in the seasonal soil water storage in 0–100 cm of soil depth among all study sites (Figure 9). Soil water storage in summer was the highest, and that in winter was the lowest. From summer to winter, the soil water storage in the NG and 12-year site was decreased by 36%, and that in the 8-year and 6-year sites was decreased by 29%. Generally, the soil water storage in the 8-year site was the highest in 0–100 cm, followed by the 6-year site and NG, and that in 12-year site was the lowest. The differences among all the sites were significant. Compared with the natural grassland, the soil water storage in the 12-year site decreased by 8.86%, and that of the 8-year and 6-year sites increased by 45.55% and 14.79%, respectively. Moreover, the soil water storage difference between the 8-year site and other sites was significant (p < 0.05). These findings are consistent with the dynamic of soil water content, and also demonstrated that human activity still significantly influenced soil water content in the whole profile after reconverted for 12 years.
4. Discussion
Soil moisture differences among natural grassland and reconverted grasslands are likely thought to be a result of adapting to the environmental factors (rainfall, soil, and vegetation conditions) [4,10,22,24]. Small rainfall events usually affect only the uppermost layers of soil and can be directly lost into the atmosphere via evaporation and transpiration, and large rainfall events (>20 mm) hold a critical function in determining soil water storage in the grassland [44]. It was reported that soil moisture in deeper soils increased when a single large rainfall event (>40 mm) or two moderate rainfall events consecutively happened in arid and semi-arid areas [45,46]. Our study shows that in the 8-year and 6-year sites, soil moisture replenishment in deeper horizons was mainly caused by large rainfall events. However, in the NG and 12-year site, soil water in deeper soil layers (>80 cm) failed to replenish, even with rainfall larger than 40.0 mm. In our study, the natural grassland had significantly lower saturated hydraulic conductivity (Ks) in the 0–10 cm layer than the 8-year and 6-year sites, and we found that Ks is the primary determinant for rainfall infiltration differences in the study areas [5]. Compared with younger reconverted sites (the 8-year and 6-year sites), the NG and 12-year site have a dense root system and substantial belowground biomass, impeding soil water from penetrating into the deeper soil [42,47]. The soil characteristics had a significant influence on the soil moisture. Vegetation has been shown to improve soil texture and soil water retention by increasing pedogenic processes [48]. However, in our study area, the effect of vegetation on improving the soil texture was not significant because of heavy wind erosion [49], which resulted in a high percentage of sand particles and a low percentage of clay in the NG and 12-year site (Table 3). This result was in accordance with studies conducted on Minqin Oasis and Xilin River Watershed [42,50]. Higher clay contents and lower sand contents led to more water retaining in the 8-year and 6-year sites. Beyond that, the higher bulk density in the 8-year and 6-year sites in the 0–20 cm soil layers would maintain an udic moisture regime. In arid and semi-arid soil profiles, calcic (calcium carbonate) horizons are very common, and have been reported to dramatically alter soil water distribution patterns by reducing hydraulic conductivity and inhibiting infiltration [47,51]. The 8-year and 6-year sites had deeper and better developed calcic horizons than the NG in our study area (Table 3, Figure 3). This suggested that more water infiltrated into the soil of the 6-year and 8-year sites because calcium deposited in topsoil can be dissolved and washed into deep soil by rainfall. The calcium carbonate in the soil profile of the NG was lower than that in the 6-year and 8-year sites, respectively. Hennessy et al. [52] found that indurated caliche horizons have the potential to rapidly absorb and retain large volumes of soil water, and water did not pass through the layers to soil below. Therefore, we speculated that more soil water could be stored in the soil above and in the calcic layers, causing higher soil moisture in 40–100 cm depths in the 6-year and 8-year sites relative to that in the NG. Li et al. [21] also found that higher soil water content corresponded well to calcic layers’ position in the soil profiles for shrub encroached grassland, consistent with our results.
Vegetation has been found to be a critical factor in determining the dynamics and spatial patterns of soil water. The effects of vegetation on soil water are mainly through intercepting rainfall, stimulating evapotranspiration, and root uptake of water [53]. Generally, younger restored grassland has higher soil water content than older restored grassland and natural grassland, following the results of An et al. [22]. This is probably because natural grassland and older restored grassland have higher transpiration and ET, and younger restored grassland has lower transpiration and ET [38]. Natural grassland could obtain more water for plant growth and use water more efficiently than restored grassland [54]. Many studies show that soil moisture has negative correlations with aboveground biomass [10]. However, there were no significant correlations between aboveground biomass and soil moisture in this study. This probably because aboveground biomass was changed by grazing and mowing. Besides, soil water changes showed good agreement with belowground biomass (Table 1, Figure 1). On the one hand, the dense root system in the NG and 12-years site restrained soil water from penetrating into the deeper soil [43,55]. On the other hand, root water uptake is a main process determining soil moisture dynamics [36]. Therefore, more soil water was consumed by substantial belowground biomass in the NG and 12-year site. It has been reported that re-vegetation will lead to soil moisture deficit and soil desiccation because of high water consumption [22,36]. In this study, we also found that the 12-year site had lower soil water storage than the natural grassland, although differences were not significant. This result indicated that water budget is not balanced in restored grassland, and soil water deficits may be formed after the GGP’s implementation for 12 years in a semi-arid grassland.
Cao et al. [56] found that soil moisture content in the soil in the afforestation plots increased during the first 2 years, but decreased steadily from the third year onwards. Our results also showed that soil water content decreased steadily with restoration age after an immediate initial rise, and the highest soil moisture was in the 8-year site. This effect was probably due to (1) the initial rapid growth supported by the initial stocks of soil moisture [10]; (2) the decline once the initial stocks were used up [57] and there were greater losses through transpiration because of the many annual plants in the 6-year site [58]; and (3) the lower bulk density in the surface soil of the 6-year site, caused by human activities such as tillage management, facilitating rainwater into the soil.
5. Conclusions
In the semi-arid grassland of China, farmland reconversion into grassland plays a very important role in restoration of degraded ecosystems. Soil water content dynamics have a close relation with vegetation, soil properties, and calcic layers. The denser root system and shallower calcic layers resulted in less water from rainfall that could infiltrate the deeper soil layers with the years of restoration. Younger reconverted grassland had a higher soil water content than older reconverted grassland and natural grassland. The soil water content decreased steadily with the restoration age after an initial rise immediately, and the highest soil moisture was in the 8-year site. The soil water storage in the 12-year site was the lowest, suggesting that a soil water deficit may be formed after GGP’s implementation for 12 years in semi-arid grassland.
Author Contributions
Conceptualization, Z.-H.Z.; methodology, Z.-H.Z. and H.-Y.P.; formal analysis, Z.-H.Z.; investigation, Z.-H.Z. and H.-Y.P.; writing—original draft preparation, Z.-H.Z.; writing—review and editing, Y.K. and Z.-H.Z.; visualization, Z.-H.Z. and H.-Y.P.; supervision, Y.K.; project administration, Z.-H.Z.; funding acquisition, Z.-H.Z. and Y.K. All authors have read and agreed to the published version of the manuscript.
Funding
This research was funded by National Natural Science Foundation of China, grant number 41807174.
Institutional Review Board Statement
Not applicable.
Informed Consent Statement
Not applicable.
Data Availability Statement
The data presented in this study are available on request from the corresponding author.
Conflicts of Interest
The authors declare no conflict of interest.
References
- Song, X.; Peng, C.; Zhou, G.; Jiang, H.; Wang, W. Chinese Grain for Green Program led to highly increased soil organic carbon levels: A meta-analysis. Sci. Rep. 2014, 4, 4460. [Google Scholar] [CrossRef] [Green Version]
- Wang, B.; Gao, P.; Niu, X.; Sun, J. Policy-driven China’s Grain to Green Program: Implications for ecosystem services. Ecosyst. Serv. 2017, 27, 38–47. [Google Scholar] [CrossRef]
- Bryan, B.A.; Gao, L.; Ye, Y.; Sun, X.; Connor, J.D.; Crossman, N.D.; Stafford-Smith, M.; Wu, J.; He, C.; Yu, D.; et al. China’s response to a national land-system sustainability emergency. Nature 2018, 559, 193–204. [Google Scholar] [CrossRef]
- Zhang, S.; Yang, D.; Yang, Y.; Piao, S.; Yang, H.; Lei, H.; Fu, B. Excessive afforestation and soil drying on China’s Loess Plateau. J. Geophys. Res. Biogeosci. 2018, 123, 923–935. [Google Scholar] [CrossRef]
- Zhang, Z.-H.; Li, X.-Y.; Jiang, Z.-Y.; Peng, H.-Y.; Li, L.; Zhao, G.-Q. Changes in some soil properties induced by re-conversion of cropland into grassland in the semiarid steppe zone of Inner Mongolia, China. Plant Soil 2013, 373, 89–106. [Google Scholar] [CrossRef]
- Deng, L.; Liu, G.B.; Shangguan, Z.P. Land-use conversion and changing soil carbon stocks in China’s ‘Grain-for-Green’ Program: A synthesis. Glob. Chang. Biol. 2014, 20, 3544–3556. [Google Scholar] [CrossRef]
- Deng, L.; Liu, S.; Kim, D.G.; Peng, C.; Sweeney, S.; Shangguan, Z. Past and future carbon sequestration benefits of China’s Grain for Green Program. Glob. Environ. Chang. 2017, 47, 13–20. [Google Scholar] [CrossRef]
- Wang, H.; Sun, F.; Xia, J.; Liu, W. Impact of LUCC on streamflow based on the SWAT model over the Wei River basin on the Loess Plateau in China. Hydrol. Earth Syst. Sci. 2017, 21, 1929–1945. [Google Scholar] [CrossRef] [Green Version]
- Brown, A.E.; Podger, G.M.; Davidson, A.J.; Dowling, T.I.; Zhang, L. Predicting the impact of plantation forestry on water users at local and regional scales. For. Ecol. Manag. 2007, 251, 82–93. [Google Scholar] [CrossRef]
- Deng, L.; Yan, W.; Zhang, Y.; Shangguan, Z. Severe depletion of soil moisture following land-use changes for ecological restoration: Evidence from northern China. For. Ecol. Manag. 2016, 366, 1–10. [Google Scholar] [CrossRef]
- Jin, T.; Fu, B.; Liu, G.; Wang, Z. Hydrologic feasibility of artificial forestation in the semi-arid Loess Plateau of China. Hydrol. Earth Syst. Sci. Discuss. 2011, 8, 653–680. [Google Scholar]
- Liu, L.; Lukas, G.; Hauser, M.; Qin, D.; Li, S.; Seneviratne, S.I. Soil moisture dominates dryness stress on ecosystem production globally. Nat. Commun. 2020, 11, 1–9. [Google Scholar] [CrossRef]
- Magliano, P.N.; Whitworth-Hulse, J.I.; Baldi, G. Interception, throughfall and stemflow partition in drylands: Global synthesis and meta-analysis. J. Hydrol. 2019, 568, 638–645. [Google Scholar] [CrossRef]
- Whalley, W.R.; Binley, A.; Watts, C.W.; Shanahan, P.; Dodd, I.C.; Ober, E.S.; Ashton, R.W.; Webster, C.P.; White, R.P.; Hawkesford, M.J. Methods to estimate changes in soil water for phenotyping root activity in the field. Plant Soil 2017, 415, 407–422. [Google Scholar] [CrossRef] [PubMed] [Green Version]
- Vereecken, H.; Huisman, J.; Pachepsky, Y.; Montzka, C.; van der Kruk, J.; Bogena, H.; Weihermüller, L.; Herbst, M.; Martinez, G.; Vanderborght, J. On the spatio-temporal dynamics of soil moisture at the field scale. J. Hydrol. 2014, 516, 76–96. [Google Scholar] [CrossRef]
- Fischer, C.; Leimer, S.; Roscher, C.; Ravenek, J.; de Kroon, H.; Kreutziger, Y.; Baade, J.; Beßler, H.; Eisenhauer, N.; Weigelt, A.; et al. Plant species richness and functional groups have different effects on soil water content in a decade-long grassland experiment. J. Ecol. 2018, 107, 127–141. [Google Scholar] [CrossRef] [Green Version]
- Knapp, A.K.; Fay, P.A.; Blair, J.M.; Collins, S.L.; Smith, M.D.; Carlisle, J.D.; Harper, C.W.; Danner, B.T.; Lett, M.S.; McCarron, J.K. Rainfall variability, carbon cycling, and plant species diversity in a mesic grassland. Science 2002, 298, 2202–2205. [Google Scholar] [CrossRef] [Green Version]
- Vereecken, H.; Huisman, J.A.; Hendricks Franssen, H.J.; Brüggemann, N.; Bogena, H.R.; Kollet, S.; Javaux, M.; van der Kruk, J.; Vanderborght, J. Soil hydrology: Recent methodological advances, challenges, and perspectives. Water Resour. Res. 2015, 51, 2616–2633. [Google Scholar] [CrossRef]
- Farrick, K.K.; Branfireun, B.A. Soil water storage, rainfall and runoff relationships in a tropical dry forest catchment. Water Resour. Res. 2014, 50, 9236–9250. [Google Scholar] [CrossRef]
- Feng, X.; Fu, B.; Piao, S.; Wang, S.; Ciais, P.; Zeng, Z.; Lü, Y.; Zeng, Y.; Li, Y.; Jiang, X. Revegetation in China’s Loess Plateau is approaching sustainable water resource limits. Nat. Clim. Chang. 2016, 6, 1019–1022. [Google Scholar] [CrossRef]
- Li, X.-Y.; Zhang, S.-Y.; Peng, H.-Y.; Hu, X.; Ma, Y.-J. Soil water and temperature dynamics in shrub-encroached grasslands and climatic implications: Results from Inner Mongolia steppe ecosystem of north China. Agric. For. Meteorol. 2013, 171–172, 20–30. [Google Scholar] [CrossRef]
- An, W.; Li, Z.; Wang, S.; Wu, X.; Lu, Y.; Liu, G.; Fu, B. Exploring the effects of the “Grain for Green” program on the differences in soil water in the semi-arid Loess Plateau of China. Ecol. Eng. 2017, 107, 144–151. [Google Scholar] [CrossRef]
- Wang, H.; Yue, C.; Mao, Q.; Zhao, J.; Ciais, P.; Li, W.; Yu, Q.; Mu, X. Vegetation and species impacts on soil organic carbon sequestration following ecological restoration over the Loess Plateau, China. Geoderma 2020, 371, 114389. [Google Scholar] [CrossRef]
- Yu, X.; Huang, Y.; Li, E.; Li, X.; Guo, W. Effects of rainfall and vegetation to soil water input and output processes in the Mu Us Sandy Land, northwest China. Catena 2018, 161, 96–103. [Google Scholar] [CrossRef]
- Lawrence, D.; Vandecar, K. Effects of tropical deforestation on climate and agriculture. Nat. Clim. Chang. 2014, 5, 27–36. [Google Scholar] [CrossRef]
- Salter, P.J.; Williams, J.B. The influence of texture on the moisture characteristics of soils. Eur. J. Soil Sci. 2010, 16, 310–317. [Google Scholar] [CrossRef]
- Jiang, Z.-Y.; Wang, X.-D.; Zhang, S.-Y.; He, B.; Zhao, X.-L.; Kong, F.-L.; Feng, D.; Zeng, Y.-C. Response of soil water dynamics to rainfall on a collapsing gully slope: Based on continuous multi-depth measurements. Water 2020, 12, 2272. [Google Scholar] [CrossRef]
- Qiu, Y.; Fu, B.; Wang, J.; Chen, L. Soil moisture variation in relation to topography and land use in a hillslope catchment of the Loess Plateau, China. J. Hydrol. 2001, 240, 243–263. [Google Scholar] [CrossRef]
- Wang, S.; Fu, B.; Gao, G.; Liu, Y.; Zhou, J. Responses of soil moisture in different land cover types to rainfall events in a re-vegetation catchment area of the Loess Plateau, China. Catena 2013, 101, 122–128. [Google Scholar] [CrossRef]
- Li, X.-Y.; Hu, X.; Zhang, Z.-H.; Peng, H.-Y.; Zhang, S.-Y.; Li, G.-Y.; Li, L.; Ma, Y.-J. Shrub hydropedology: Preferential water availability to deep soil layer. Vadose Zone J. 2013, 12. [Google Scholar] [CrossRef] [Green Version]
- Rossi, M.J.; Ares, J.O.; Jobbágy, E.G.; Vivoni, E.R.; Vervoort, R.W.; Schreiner-Mcgraw, A.P.; Saco, P.M. Vegetation and terrain drivers of infiltration depth along a semiarid hillslope. Sci. Total Environ. 2018, 644, 1399–1408. [Google Scholar] [CrossRef]
- Jackson, R.B.; Sperry, J.S.; Dawson, T.E. Root water uptake and transport: Using physiological processes in global predictions. Trends Plant Sci. 2000, 5, 482–488. [Google Scholar] [CrossRef]
- Jian, S.; Zhao, C.; Fang, S.; Yu, K. Effects of different vegetation restoration on soil water storage and water balance in the Chinese Loess Plateau. Agric. For. Meteorol. 2015, 206, 85–96. [Google Scholar] [CrossRef]
- Tian, J.; Zhang, B.; He, C.; Han, Z.; Bogena, H.R.; Huisman, J.A. Dynamic response patterns of profile soil moisture wetting events under different land covers in the Mountainous area of the Heihe River Watershed, Northwest China. Agric. For. Meteorol. 2019, 271, 225–239. [Google Scholar] [CrossRef]
- Wang, S.; Fu, B.; Piao, S.; Lü, Y.; Ciais, P.; Feng, X.; Wang, Y. Reduced sediment transport in the Yellow River due to anthropogenic changes. Nat. Geosci. 2016, 9, 38–41. [Google Scholar] [CrossRef]
- Yang, L.; Wei, W.; Chen, L.; Chen, W.; Wang, J. Response of temporal variation of soil moisture to vegetation restoration in semi-arid Loess Plateau, China. Catena 2014, 115, 123–133. [Google Scholar] [CrossRef]
- Wang, Y.; Shao, M.; Zhu, Y.; Liu, Z. Impacts of land use and plant characteristics on dried soil layers in different climatic regions on the Loess Plateau of China. Agric. For. Meteorol. 2011, 151, 437–448. [Google Scholar] [CrossRef]
- Qiu, G.Y.; Xie, F.; Feng, Y.C.; Tian, F. Experimental studies on the effects of the “Conversion of Cropland to Grassland Program” on the water budget and evapotranspiration in a semi-arid steppe in Inner Mongolia, China. J. Hydrol. 2011, 411, 120–129. [Google Scholar] [CrossRef]
- Lv, M.; Ma, Z.; Li, M.; Zheng, Z. Quantitative analysis of terrestrial water storage changes under the grain for green program in the Yellow River Basin. J. Geophys. Res. Atmos. 2019, 124, 1336–1351. [Google Scholar] [CrossRef]
- Ye, L.; Fang, L.; Shi, Z.; Deng, L.; Tan, W. Spatio-temporal dynamics of soil moisture driven by ‘Grain for Green’ program on the Loess Plateau, China. Agric. Ecosyst. Environ. 2019, 269, 204–214. [Google Scholar] [CrossRef]
- Feng, X.; Li, J.; Cheng, W.; Fu, B.; Wang, Y.; Lü, Y. Evaluation of AMSR-E retrieval by detecting soil moisture decrease following massive dryland re-vegetation in the Loess Plateau, China. Remote Sens. Environ. 2017, 196, 253–264. [Google Scholar] [CrossRef]
- Guo, C.; Wang, L.; Han, F.; Ma, J.; He, F.; Liu, S.; Wang, F.; Zhang, Y.; Wei, L. Studies of soil physical property of different abandoned lands in the Minqin Oasis, downstream of the Shiyang river. Chin. Agric. Sci. Bull. 2014, 30, 72–76. [Google Scholar]
- Zhang, S.-Y.; Li, X.-Y. Soil moisture and temperature dynamics in typical alpine ecosystems: A continuous multi-depth measurements-based analysis from the Qinghai-Tibet Plateau, China. Hydrol. Res. 2018, 49, 194–209. [Google Scholar] [CrossRef]
- Yu, X.; Huang, Y.; Li, E.; Li, X.; Guo, W. Effects of vegetation types on soil water dynamics during vegetation restoration in the Mu Us Sandy Land, northwestern China. J. Arid Land 2017, 9, 188–199. [Google Scholar] [CrossRef]
- He, Z.; Zhao, W.; Liu, H.; Chang, X. The response of soil moisture to rainfall event size in subalpine grassland and meadows in a semi-arid mountain range: A case study in northwestern China’s Qilian Mountains. J. Hydrol. 2012, 420–421, 183–190. [Google Scholar] [CrossRef]
- Zhu, X.; He, Z.-B.; Du, J.; Chen, L.-F.; Lin, P.-F.; Li, J. Temporal variability in soil moisture after thinning in semi-arid Picea crassifolia plantations in northwestern China. For. Ecol. Manag. 2017, 401, 273–285. [Google Scholar] [CrossRef]
- Duniway, M.C.; Herrick, J.E.; Monger, H.C. The high water-holding capacity of petrocalcic horizons. Soil Sci. Soc. Am. J. 2007, 71, 812–819. [Google Scholar] [CrossRef] [Green Version]
- Bogner, C.; Borken, W.; Huwe, B. Impact of preferential flow on soil chemistry of a podzol. Geoderma 2012, 175–176, 37–46. [Google Scholar] [CrossRef]
- A, Y.; Wang, G.; Liu, T.; Shrestha, S.; Xue, B.; Tan, Z. Vertical variations of soil water and its controlling factors based on the structural equation model in a semi-arid grassland. Sci. Total Environ. 2019, 691, 1016–1026. [Google Scholar] [CrossRef]
- Li, Y.; Zhao, M.; Han, G.; Jiao, S. Studies on soil physical and chemical properties of abandoned land. Chin. J. Grassland 2012, 34, 61–64+69. [Google Scholar]
- Duniway, M.C.; Herrick, J.E.; Monger, H.C. Spatial and temporal variability of plant-available water in calcium carbonate-cemented soils and consequences for arid ecosystem resilience. Oecologia 2010, 163, 215–226. [Google Scholar] [CrossRef]
- Hennessy, J.; Gibbens, R.; Tromble, J.; Cardenas, M. Water properties of caliche. Rangel. Ecol. Manag. J. Range Manag. Arch. 1983, 36, 723–726. [Google Scholar] [CrossRef] [Green Version]
- Levia, D.F.; Frost, E.E. A review and evaluation of stemflow literature in the hydrologic and biogeochemical cycles of forested and agricultural ecosystems. J. Hydrol. 2003, 274, 1–29. [Google Scholar] [CrossRef]
- Huang, Z.; Liu, Y.; Cui, Z.; Fang, Y.; He, H.; Liu, B.-R.; Wu, G.-L. Soil water storage deficit of alfalfa (Medicago sativa) grasslands along ages in arid area (China). Field Crop. Res. 2018, 221, 1–6. [Google Scholar] [CrossRef]
- Wang, G.; Wang, Y.; Li, Y.; Cheng, H. Influences of alpine ecosystem responses to climatic change on soil properties on the Qinghai–Tibet Plateau, China. Catena 2007, 70, 506–514. [Google Scholar] [CrossRef]
- Cao, S.; Chen, L.; Yu, X. Impact of China’s Grain for Green Project on the landscape of vulnerable arid and semi-arid agricultural regions: A case study in northern Shaanxi Province. J. Appl. Ecol. 2009, 46, 536–543. [Google Scholar] [CrossRef]
- Chen, L.; Huang, Z.; Gong, J.; Fu, B.; Huang, Y. The effect of land cover/vegetation on soil water dynamic in the hilly area of the loess plateau, China. Catena 2007, 70, 200–208. [Google Scholar] [CrossRef]
- Bonet, A. Secondary succession of semi-arid Mediterranean old-fields in south-eastern Spain: Insights for conservation and restoration of degraded lands. J. Arid Environ. 2004, 56, 213–233. [Google Scholar] [CrossRef]
Figure 1.
(a) Map of the experimental sites (revised from Google Earth imaging). On this map, “NG” represents natural grassland, “12-year”, “8-year” and “6-year” represent the grasslands that were reconverted from cropland 12 years, 8 years, and 6 years beforehand, respectively. (b) Landscape of natural grasslands and reconverted grasslands.

Figure 2.
Aboveground (a) and belowground (b) biomass distributions in the NG, 12-year, 8-year, and 6-year sites.
Figure 2.
Aboveground (a) and belowground (b) biomass distributions in the NG, 12-year, 8-year, and 6-year sites.

Figure 3.
Morphology of the studied soil profiles in the (a) NG, (b) 12-year, (c) 8-year, and (d) 6-year sites.
Figure 3.
Morphology of the studied soil profiles in the (a) NG, (b) 12-year, (c) 8-year, and (d) 6-year sites.

Figure 4.
Daily time series of precipitation and volumetric water content (VWC) for NG, 12-year, 8-year, and 6-year sites at soil depths of 10, 20, 40, 60, and 100 cm.
Figure 4.
Daily time series of precipitation and volumetric water content (VWC) for NG, 12-year, 8-year, and 6-year sites at soil depths of 10, 20, 40, 60, and 100 cm.

Figure 5.
Average soil water content for the NG, 12-year, 8-year, and 6-year sites at soil depths of 10, 20, 30, 40, 50, 60, and 100 cm. Different lowercase letters indicate significant differences (p < 0.05) between the reconversion ages at same soil depth.
Figure 5.
Average soil water content for the NG, 12-year, 8-year, and 6-year sites at soil depths of 10, 20, 30, 40, 50, 60, and 100 cm. Different lowercase letters indicate significant differences (p < 0.05) between the reconversion ages at same soil depth.

Figure 6.
Frequency distribution of volumetric soil moisture measured at 10-min intervals in growing seasons from June to October in 2011 at 10, 20, 40, 60, and 100 cm depth in the soil profile.
Figure 6.
Frequency distribution of volumetric soil moisture measured at 10-min intervals in growing seasons from June to October in 2011 at 10, 20, 40, 60, and 100 cm depth in the soil profile.

Figure 7.
Response of cumulative infiltration to rainfall based on 12 rainfall events.

Figure 8.
Increments of volumetric soil water content in soil profile (0–100 cm) for the NG (a), 12-year site (b), 8-year site (c), and 6-year site (d).
Figure 8.
Increments of volumetric soil water content in soil profile (0–100 cm) for the NG (a), 12-year site (b), 8-year site (c), and 6-year site (d).

Figure 9.
Seasonal soil water storage (mm) in the 0–100 cm soil depth for different study sites.


Table 1.
Characteristics of plant communities in the NG, 12-year, 8-year and 6-year sites.
| Sites | Canopy (%) | Total Species | Dominant Species |
|---|---|---|---|
| NG | 60 | 31 | Stipa krylovii; Cleistogenes squarrosa; Artemisia frigida |
| 12-year | 61 | 35 | Stipa krylovii; Artemisia frigida; Thalictrum petaloideum; Agropyron cristatum; Leymus chinensis; Potentilla longifolia |
| 8-year | 56 | 16 | Cleistogenes squarrosa; Artemisia capillaris; Heteropappus altaicus |
| 6-year | 69 | 24 | Artemisia sieversiana; Artemisia capillaris; Erodium stephanianum |
Table 2.
Bulk density, total porosity, and soil layers in the NG, 12-year, 8-year, and 6-year sites.
Table 2.
Bulk density, total porosity, and soil layers in the NG, 12-year, 8-year, and 6-year sites.
| Depth (cm) | Sites | ||||
|---|---|---|---|---|---|
| NG | 12-Year | 8-Year | 6-Year | ||
| Bulk density (g/cm3) | 0–10 | 1.39 | 1.47 | 1.51 | 1.46 |
| 10–20 | 1.44 | 1.43 | 1.51 | 1.47 | |
| 20–40 | 1.5 | 1.43 | 1.42 | 1.46 | |
| 40–60 | 1.57 | 1.53 | 1.45 | 1.45 | |
| 60–100 | 1.67 | 1.74 | 1.51 | 1.55 | |
| Total porosity (%) | 0–10 | 47.55 | 44.53 | 43.02 | 44.91 |
| 10–20 | 45.66 | 46.04 | 43.02 | 44.53 | |
| 20–40 | 43.4 | 46.04 | 46.42 | 44.91 | |
| 40–60 | 40.75 | 42.26 | 45.28 | 45.28 | |
| 60–100 | 36.98 | 34.34 | 43.02 | 41.51 | |
| Soil layers (cm) | A | 0–23 | 0–18 | 0–18 | 0–20 |
| B | 23–98 | 18–103 | 18–120 | 20–110 | |
Table 3.
Soil texture, CaCO3 content, and soil nutrients at different depths in the NG, 12-year, 8-year, and 6-year sites.
Table 3.
Soil texture, CaCO3 content, and soil nutrients at different depths in the NG, 12-year, 8-year, and 6-year sites.
| Depth (cm) | NG | 12-Year | 8-Year | 6-Year | ||
|---|---|---|---|---|---|---|
| Particle size composition (USDA, %) | Sand | 0–10 | 67.41 | 74.57 | 62.45 | 65.01 |
| 10–20 | 70.01 | 73.04 | 63.98 | 64.71 | ||
| 20–40 | 78.08 | 74.12 | 64.91 | 64.42 | ||
| Silt | 0–10 | 23.1 | 11.17 | 19.07 | 18.36 | |
| 10–20 | 18.13 | 11.09 | 17.4 | 18.38 | ||
| 20–40 | 11.93 | 8.69 | 15.74 | 18.35 | ||
| Clay | 0–10 | 13.89 | 14.26 | 18.48 | 16.64 | |
| 10–20 | 11.87 | 15.87 | 18.62 | 16.91 | ||
| 20–40 | 9.99 | 17.19 | 19.35 | 17.23 | ||
| CaCO3 content (%) | 0–10 | 6.13 | 16.43 | 8.91 | 18.41 | |
| 10–20 | 4.86 | 25.82 | 17.61 | 20.93 | ||
| 20–40 | 7.02 | 44.76 | 33.28 | 32.72 | ||
| SOM (g/kg) | 0–10 | 29.03 | 13.87 | 22.8 | 21.07 | |
| 10–20 | 20.63 | 13.55 | 18.43 | 19.3 | ||
| 20–40 | 11.66 | 8.22 | 11.38 | 14.3 | ||
| TN (g/kg) | 0–10 | 1.59 | 0.89 | 1.33 | 1.27 | |
| 10–20 | 1.2 | 0.88 | 1.16 | 1.26 | ||
| 20–40 | 0.69 | 0.54 | 0.74 | 0.96 | ||
| TP (g/kg) | 0–10 | 0.3 | 0.25 | 0.18 | 0.3 | |
| 10–20 | 0.15 | 0.14 | 0.09 | 0.15 | ||
| 20–40 | 0.21 | 0.16 | 0.14 | 0.21 | ||
SOM: soil organic matter, TN: total nitrogen, TP: total phosphorus.
Publisher’s Note: MDPI stays neutral with regard to jurisdictional claims in published maps and institutional affiliations. |
© 2021 by the authors. Licensee MDPI, Basel, Switzerland. This article is an open access article distributed under the terms and conditions of the Creative Commons Attribution (CC BY) license (https://creativecommons.org/licenses/by/4.0/).
Share and Cite
MDPI and ACS Style
Zhang, Z.-H.; Peng, H.-Y.; Kong, Y. Effects of the “Grain for Green” Program on Soil Water Dynamics in the Semi-Arid Grassland of Inner Mongolia, China. Water 2021, 13, 2034. https://doi.org/10.3390/w13152034
AMA Style
Zhang Z-H, Peng H-Y, Kong Y. Effects of the “Grain for Green” Program on Soil Water Dynamics in the Semi-Arid Grassland of Inner Mongolia, China. Water. 2021; 13(15):2034. https://doi.org/10.3390/w13152034
Chicago/Turabian StyleZhang, Zhi-Hua, Hai-Ying Peng, and Yuhua Kong. 2021. "Effects of the “Grain for Green” Program on Soil Water Dynamics in the Semi-Arid Grassland of Inner Mongolia, China" Water 13, no. 15: 2034. https://doi.org/10.3390/w13152034
Note that from the first issue of 2016, this journal uses article numbers instead of page numbers. See further details here.