
Climate Change Projections of Aridity Conditions in the Iberian Peninsula


1
Natural Hazards Research Center (NHRC.ipt), Instituto Politécnico de Tomar, Quinta do Contador, Estrada da Serra, 2300-313 Tomar, Portugal
2
Centre for the Research and Technology of Agro-Environmental and Biological Sciences (CITAB), Universidade de Trás-os-Montes e Alto Douro (UTAD), 5001-801 Vila Real, Portugal
*
Author to whom correspondence should be addressed.
Water 2021, 13(15), 2035; https://doi.org/10.3390/w13152035
Submission received: 21 June 2021
/
Revised: 20 July 2021
/
Accepted: 23 July 2021
/
Published: 26 July 2021
(This article belongs to the Section Water Resources Management, Policy and Governance)
Abstract
:The assessment of aridity conditions is a key factor for water management and the implementation of mitigation and adaptation policies in agroforestry systems. Towards this aim, three aridity indices were computed for the Iberian Peninsula (IP): the De Martonne Index (DMI), the Pinna Combinative Index (PCI), and the Erinç Aridity Index (EAI). These three indices were first computed for the baseline period 1961–1990, using gridded observational data (E-OBS), and subsequently, for the periods 2011–2040 (short range) and 2041–2070 (medium range), using an ensemble of six regional climate model (RCM) experiments generated by the EURO-CORDEX project. Two representative concentration pathways (RCPs) were analyzed, an intermediate anthropogenic radiative forcing scenario (RCP4.5) and a fossil-intensive emission scenario (RCP8.5). Overall, the three indices disclose a strengthening of aridity and dry conditions in central and southern Iberia until 2070, mainly under RCP8.5. Strong (weak) statistically significant correlations were found between these indices and the total mean precipitation (mean temperature) along with projected significant decreasing (increasing) trends for precipitation (temperature). The prevalence of years with arid conditions (above 70% for 2041–2070 under both RCPs) are projected to have major impacts in some regions, such as southern Portugal, Extremadura, Castilla-La Mancha, Comunidad de Madrid, Andalucía, Región de Murcia, Comunidad Valenciana, and certain regions within the Aragón province. The projected increase in both the intensity and persistence of aridity conditions in a broader southern half of Iberia will exacerbate the exposure and vulnerability of this region to climate change, while the risk of multi-level desertification should be thoroughly integrated into regional and national water management and planning.
1. Introduction
Climate variability and change may have significant impacts not only on the environment but also in many important socio-economic sectors, such as agriculture, water availability, or energy production. Temperature and precipitation are fundamental atmospheric variables to define the climate of a region [1]. Numerous climate indices are thereby based upon these two parameters, also playing a relevant role as a diagnostic tool to understand the potential impacts of climate change on a given region. As aridity and continentality are important factors in climate characterization, the assessment of their evolution, in both space and time, is highly relevant to determine the aforementioned impacts.
Under a changing climate, aridity conditions can be modified through a multitude of processes, depending on the study region. For instance, decreases in precipitation, increasing trends in air temperature and evapotranspiration, and higher thermal contrasts associated with increases in air temperature ranges, occurring from the daily to the seasonal timescales, may have a deep impact on aridity conditions, particularly when acting synergistically. In this case, several studies consistently referred to the Iberian Peninsula (IP) as a climate change “hotspot” within the Mediterranean region [2,3,4,5]. Therefore, assessing the potential impact of climate change on aridity conditions within this region is of the foremost relevance [6]. This will require systematic updates of the existing knowledge, as well as the integration into the decision-making processes of different perspectives provided by diverse methodologies, which will contribute to defining the uncertainty level of regional climate change projections.
Many previous studies have used aridity indices in different regions, as they measure the degree to which a region’s climate lacks effective and life-promoting moisture [7]. Spatial and temporal variations of several indices were analyzed for Bahrain [8], Bangladesh [9], Turkey [10,11,12,13], Greece [7], Romania [14,15,16,17], Ethiopia [18,19], Iran [20,21,22], Pakistan [23], IP [24,25,26], Iraq [27,28], Extremadura in southwestern Spain [29], Serbia [30,31,32], India [33,34], the Middle East and North Africa [35], Calabria in Southern Italy [36], and southeastern Europe [37]. However, these studies were conducted over historical periods and do not project potential shifts under future climate change scenarios. Therefore, climate change projections for these indices are highly pertinent, since they will help to identify and implement suitable and timely adaptation measures to cope with land degradation and desertification, as well as to delineate better water resource management policies.
Along the previous lines, this study aims at assessing the spatial and temporal evolution of the aridity conditions over the IP. More specifically, the spatial evolution of De Martonne [38], Pinna Combinative [39], and Erinç [40] aridity indices will allow determining the boundaries of dry land types in IP. Furthermore, they will enable assessing aridity conditions. The three indices are computed for a baseline period (1961–1990), as well as for a short-range (2011–2040) and a long-range (2041–2070) future period to determine the projected shifts in aridity conditions, under two representative concentration pathways (RCPs). An intermediate anthropogenic radiative forcing scenario (RCP4.5) and a fossil-intensive emission scenario (RCP8.5) are selected for this purpose. A gridded observation-based dataset is used for the historical period, whereas a six-member ensemble of bias-corrected regional climate model (RCM) experiments is used for assessing climate change projections in the future periods.
2. Materials and Methods
2.1. Data and Bias Correction
In this study, projections for daily accumulated precipitation (P, in mm), daily mean (T, in °C), and maximum temperatures (TX, in °C) for the historical period 1951–2005 and two scenarios between 2011 and 2070 were retrieved from the EURO-CORDEX project platform (http://www.euro-cordex.net/, accessed on 5 January 2020). This initiative provides RCM runs covering a European sector at ~12.5 km (EUR-11) grid resolution. The regional simulations result from dynamical downscaling (global–regional model chains) derived from the Coupled Model Intercomparison Project 5 (CMIP5) global climate projections [41]. EURO-CORDEX scenario simulations use the RCPs [42,43]. In this research, two scenarios were taken into consideration: RCP4.5 that corresponds to a stabilization of the additional anthropogenic radiative forcing relative to the pre-industrial levels, without overshoot pathway, at 4.5 W/m2 by the end of the 21st century; RCP8.5 that corresponds to an increase in radiative forcing of 8.5 W/m2 by the end of the 21st century.
All regional changes were analyzed within the 35.25° N–44.75° N and 10.25° W–5.75° E geographical sector comprising the IP (Figure S1), using daily data for three time periods: 1961–1990, 2011–2040, and 2041–2070. The analysis was carried out using a six-member ensemble of bias-corrected RCM data under both RCPs (Table 1). More information regarding each model can be found in the relevant references provided in Table 1. All calculations are undertaken for all grid points and will only be clipped for the figures presented herein, thus excluding grid boxes in the Atlantic Ocean and the Mediterranean Sea.
For bias-correction of RCM data, daily accumulated precipitation (P), daily mean (T), and maximum (TX) air temperatures from the E-OBS gridded dataset (version 23.1e) were retrieved from the EU-FP6 project UERRA (http://www.uerra.eu, accessed on 1 March 2021) between January 1961 and December 1990, on a 0.1° regular grid [51]. Bias correction was applied using the quantile–quantile bias correction method, which assumes that the distribution function of a variable may change in the future. This methodology was already used in other publications, such as Andrade and Contente [1] (for further details see Amengual et al., [52]; Maraun, [53]), and allows for the correction of the complete distribution, tails included. Subsequently, all variables were bias-corrected for all periods, and an ensemble of the six bias-corrected RCMs was eventually used to compute the aridity indices. For the sake of succinctness, in the following sections, P, T, and TX will refer to the bias-corrected ensemble-mean variables, unless otherwise stated.
2.2. Aridity Indices
The analysis carried out in this study involved the computation of three aridity indices, namely, the De Martonne Index (DMI), the Pinna Combinative Index (PCI), and the Erinç’s Aridity Index (EAI). De Martonne in 1926 [38] developed the DMI, which is based on annual total precipitation and annual mean temperature. Although DMI is one of the oldest and simplest aridity indices, it is still widely used due to its efficiency and relevance in identifying dry/humid climates in several regions worldwide [7,12,15,21,25,35,54].
DMI (in mm/°C) is defined by the following equation:
in which P is the total annual precipitation (in mm) and the annual mean air temperature (in °C). Its corresponding climatic classification is detailed in Table 2.
The PCI (in mm/°C) was developed by Pinna [39] and takes into consideration not only the total annual precipitation (P, in mm) and the annual mean air temperature (, in °C) as DMI, but also the total precipitation and mean air temperature of the driest month (P’d and T’d, respectively). This index is computed by:
and the climate types are described in Table 2.
The EAI (in mm/°C) [40] is attained using the total annual precipitation (, in mm) and the annual mean of the daily maximum air temperature (, in °C), according to the following equation:
for which the climate types are also depicted in Table 2.
The frequencies of occurrence (in %) of the most severe climates within the D or A climates for the three indices were computed for 2041–2070 (30-year period) under both RCPs. For example, the frequency of occurrence for PCI was computed as follows:
in which the total number of dry months is attained for each grid point where PCI < 10 (Table 2). This same procedure was applied for the remaining indices and climate types.
2.3. Statistical Analysis
For the three aridity indices, a comparison between the short-range period of 2011–2040, a medium-range period of 2041–2070, under both RCPs, and the past conditions of 1961–1990 (baseline climate) was carried out. The anomalies were computed as the differences between the two later periods and the baseline climate. The statistically significant anomalies (S.S.) were assessed by the Mann–Whitney–Wilcoxon test (MWW), at a 5% significance level [55,56], using the 30-year mean values for each period and at each location of the study area. This nonparametric test assumes that the null hypothesis indicates whether the data have equal medians, against the alternative hypothesis (Ha). Therefore, Ha = 1 implies the rejection of the null hypotheses, thus highlighting different medians. These locations will be identified by a grey pattern in all related figures.
Aiming at assessing which climatic variable (P or T) has more influence in the indices and where this influence is more relevant, statistically significant correlations, at a 5% significance level, were calculated between the three indices and the total annual precipitation or annual mean air temperature for all periods and indices. Only the statistically significant correlations (rejection of the null hypothesis) by the corresponding determination coefficient (values between 0 and 1) are analyzed. The respective figures will be provided as Supplementary Materials (Figures S2–S4).
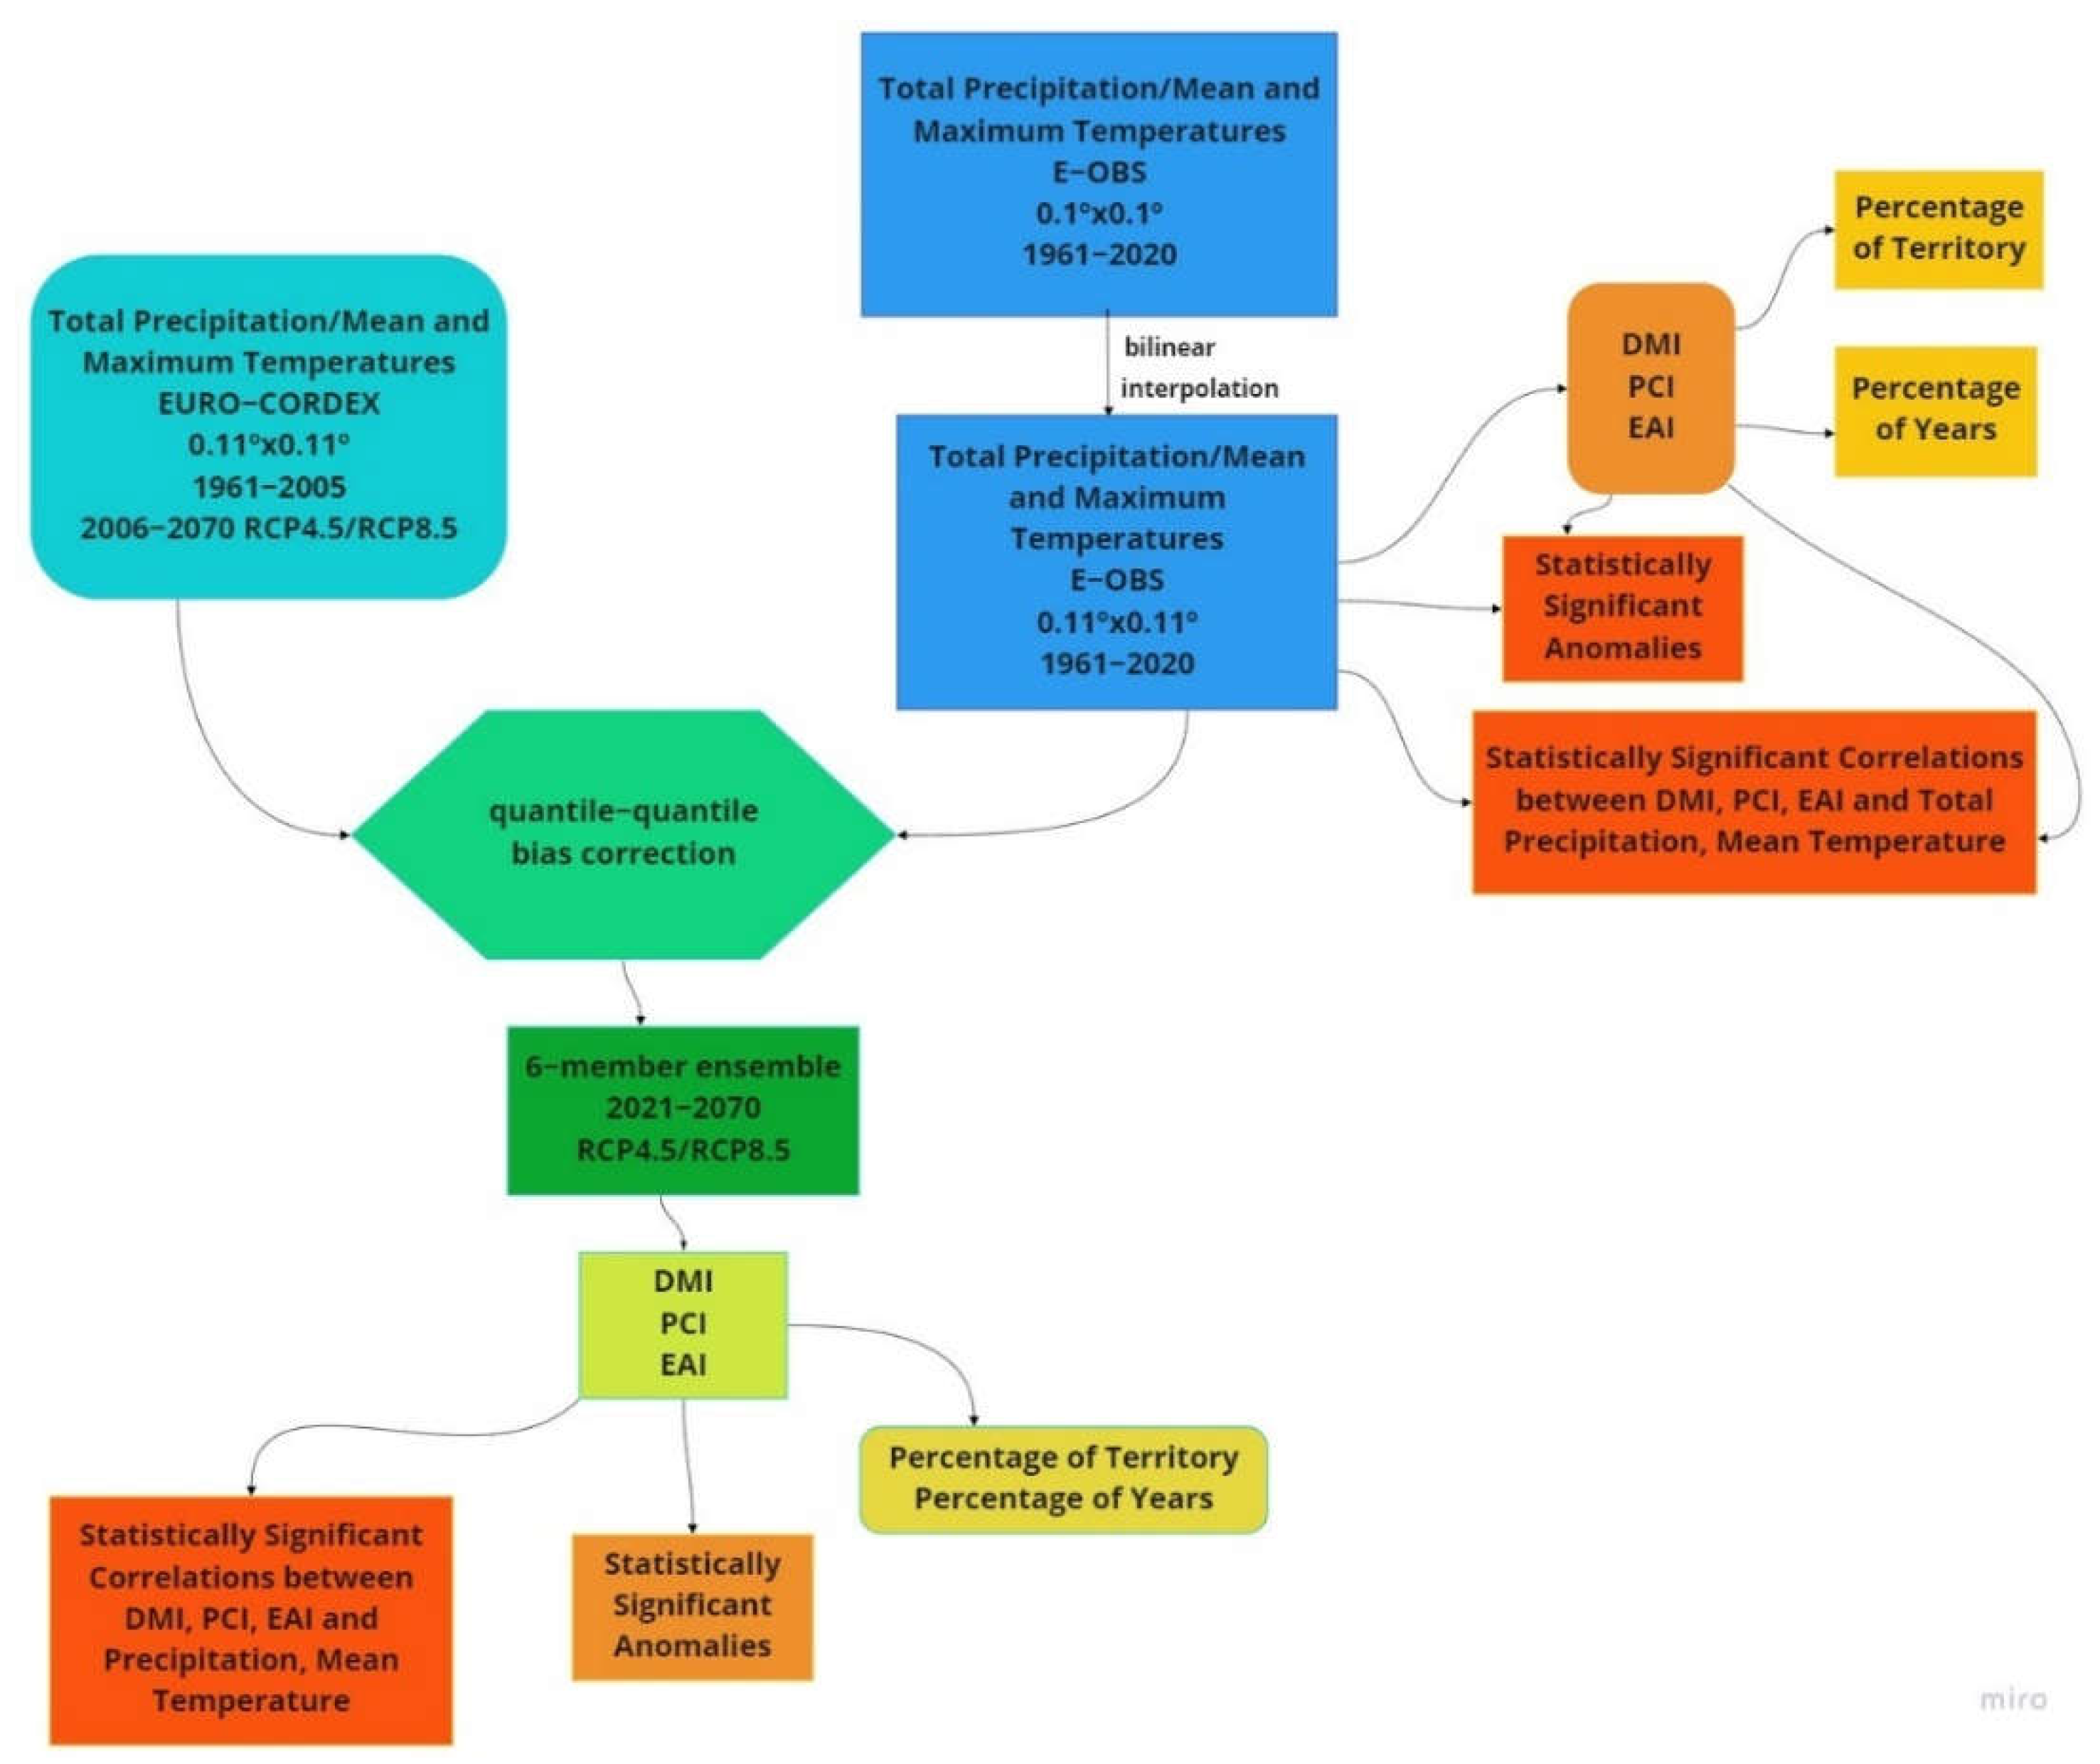
The overall methodological framework of this study is represented in Figure 1.
All maps are projected onto the GCS ETRS 1989 Geographical Coordinate System.
3. Results
3.1. Projections of Total Annual Precipitation and Annual Mean Temperature
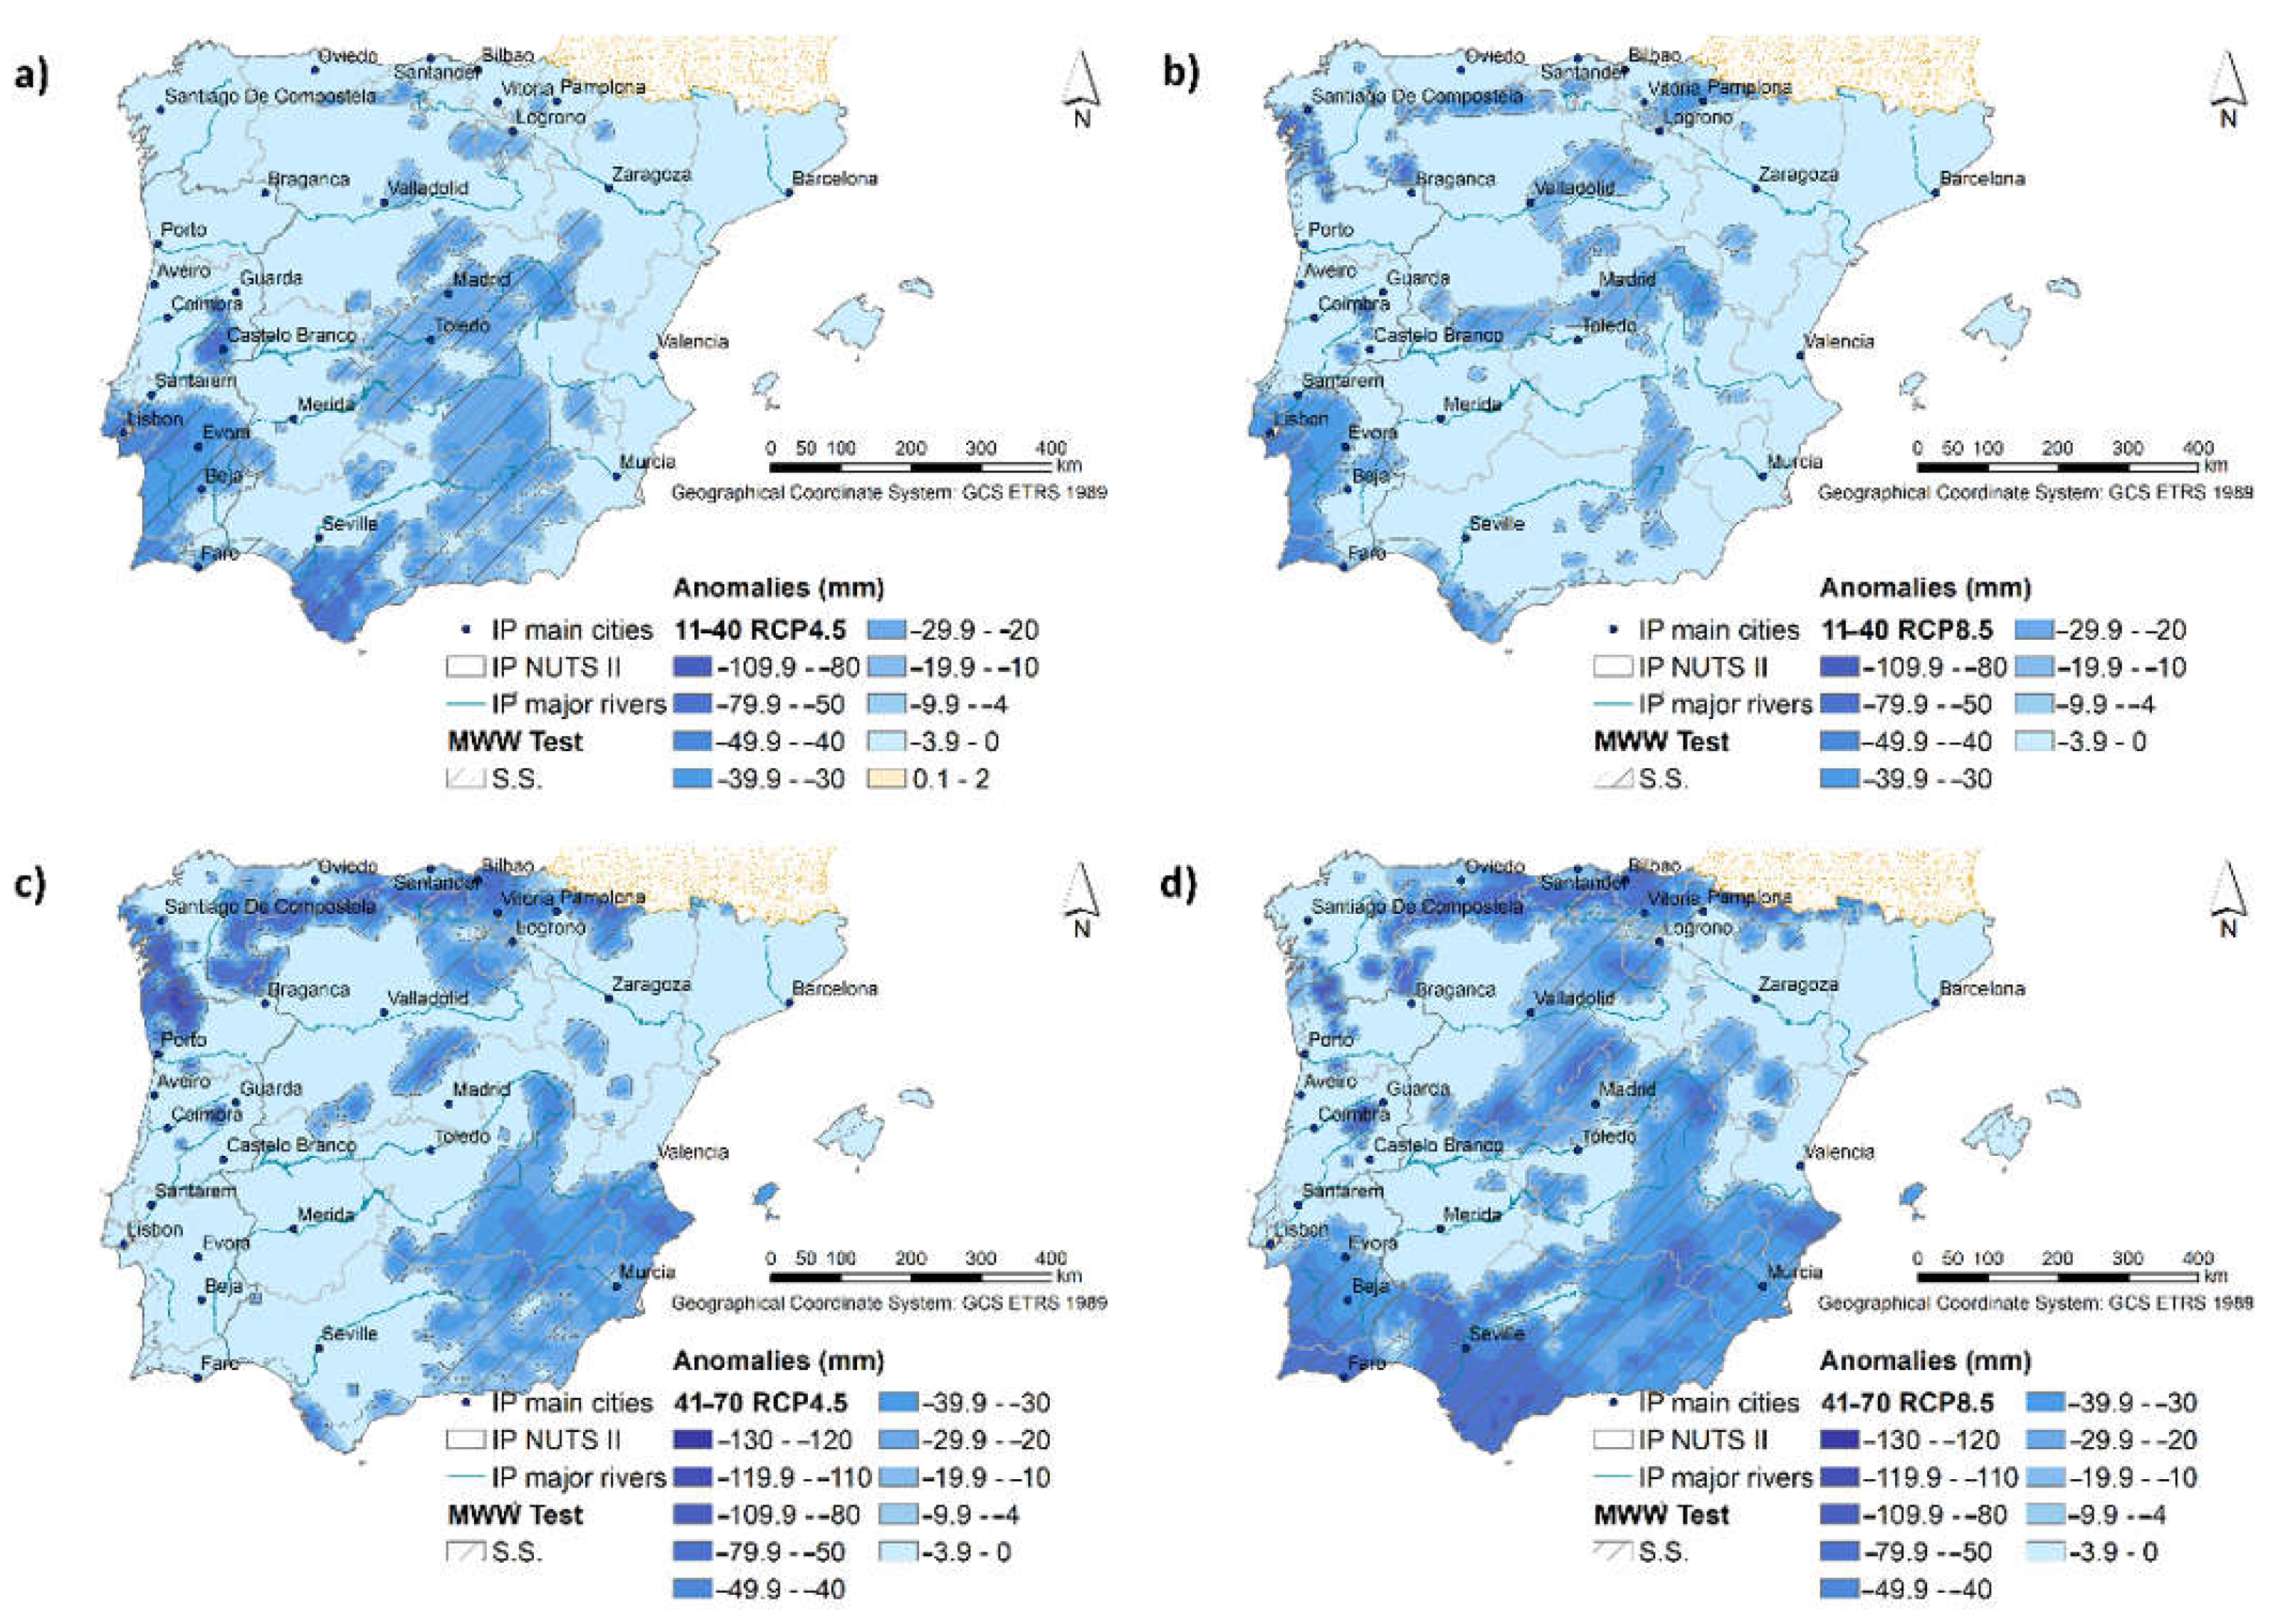
As the total annual precipitation and annual mean air temperature are key variables in the computation of DMI, PCI, and EAI, the statistical significance of their anomalies at the 5% significance level will be first analyzed. For the total annual precipitation, averaged over the pre-defined 30-year periods, the results show negative anomalies throughout the IP. For 2011–2040, the statistically significant anomaly regions comprise areas with values ranging from −109.9 mm to −20 mm, mainly in southern Portugal under both RCPs (Figure 2a,b). For 2041–2070, the statistically significant anomalies are in the southeastern and northernmost regions under RCP4.5 (Figure 2c) and comprise areas with anomalies between −130 mm and −20 mm per year. Under RCP8.5, however, these regions are broader and comprise the southernmost regions of IP, as well as in the north, with anomalies ranging between −130 mm and −20 mm per year (Figure 2d). The mean values for precipitation for the total mean area were computed, and the anomalies between the future periods under RCP4.5 and RCP8.5 and the baseline climate were also computed. The results show a decrease of 346 mm (346 mm) for 2011–2040 and 349 mm (350 mm) for 2041–2070 under RCP4.5 (under RCP8.5) in comparison with 1961–1990 for the study area.
Overall, it can be concluded that projections point out to a progressive decrease in total mean precipitation in IP, particularly in 2041–2070 and under RCP8.5, though with high spatial heterogeneity and relatively low coherency among periods and scenarios. This finding highlights the relatively large uncertainties in the precipitation projections at a finer-grid scale over the IP, thus being an important limitation for developing local-scale climate projections of precipitation and precipitation-based indicators.
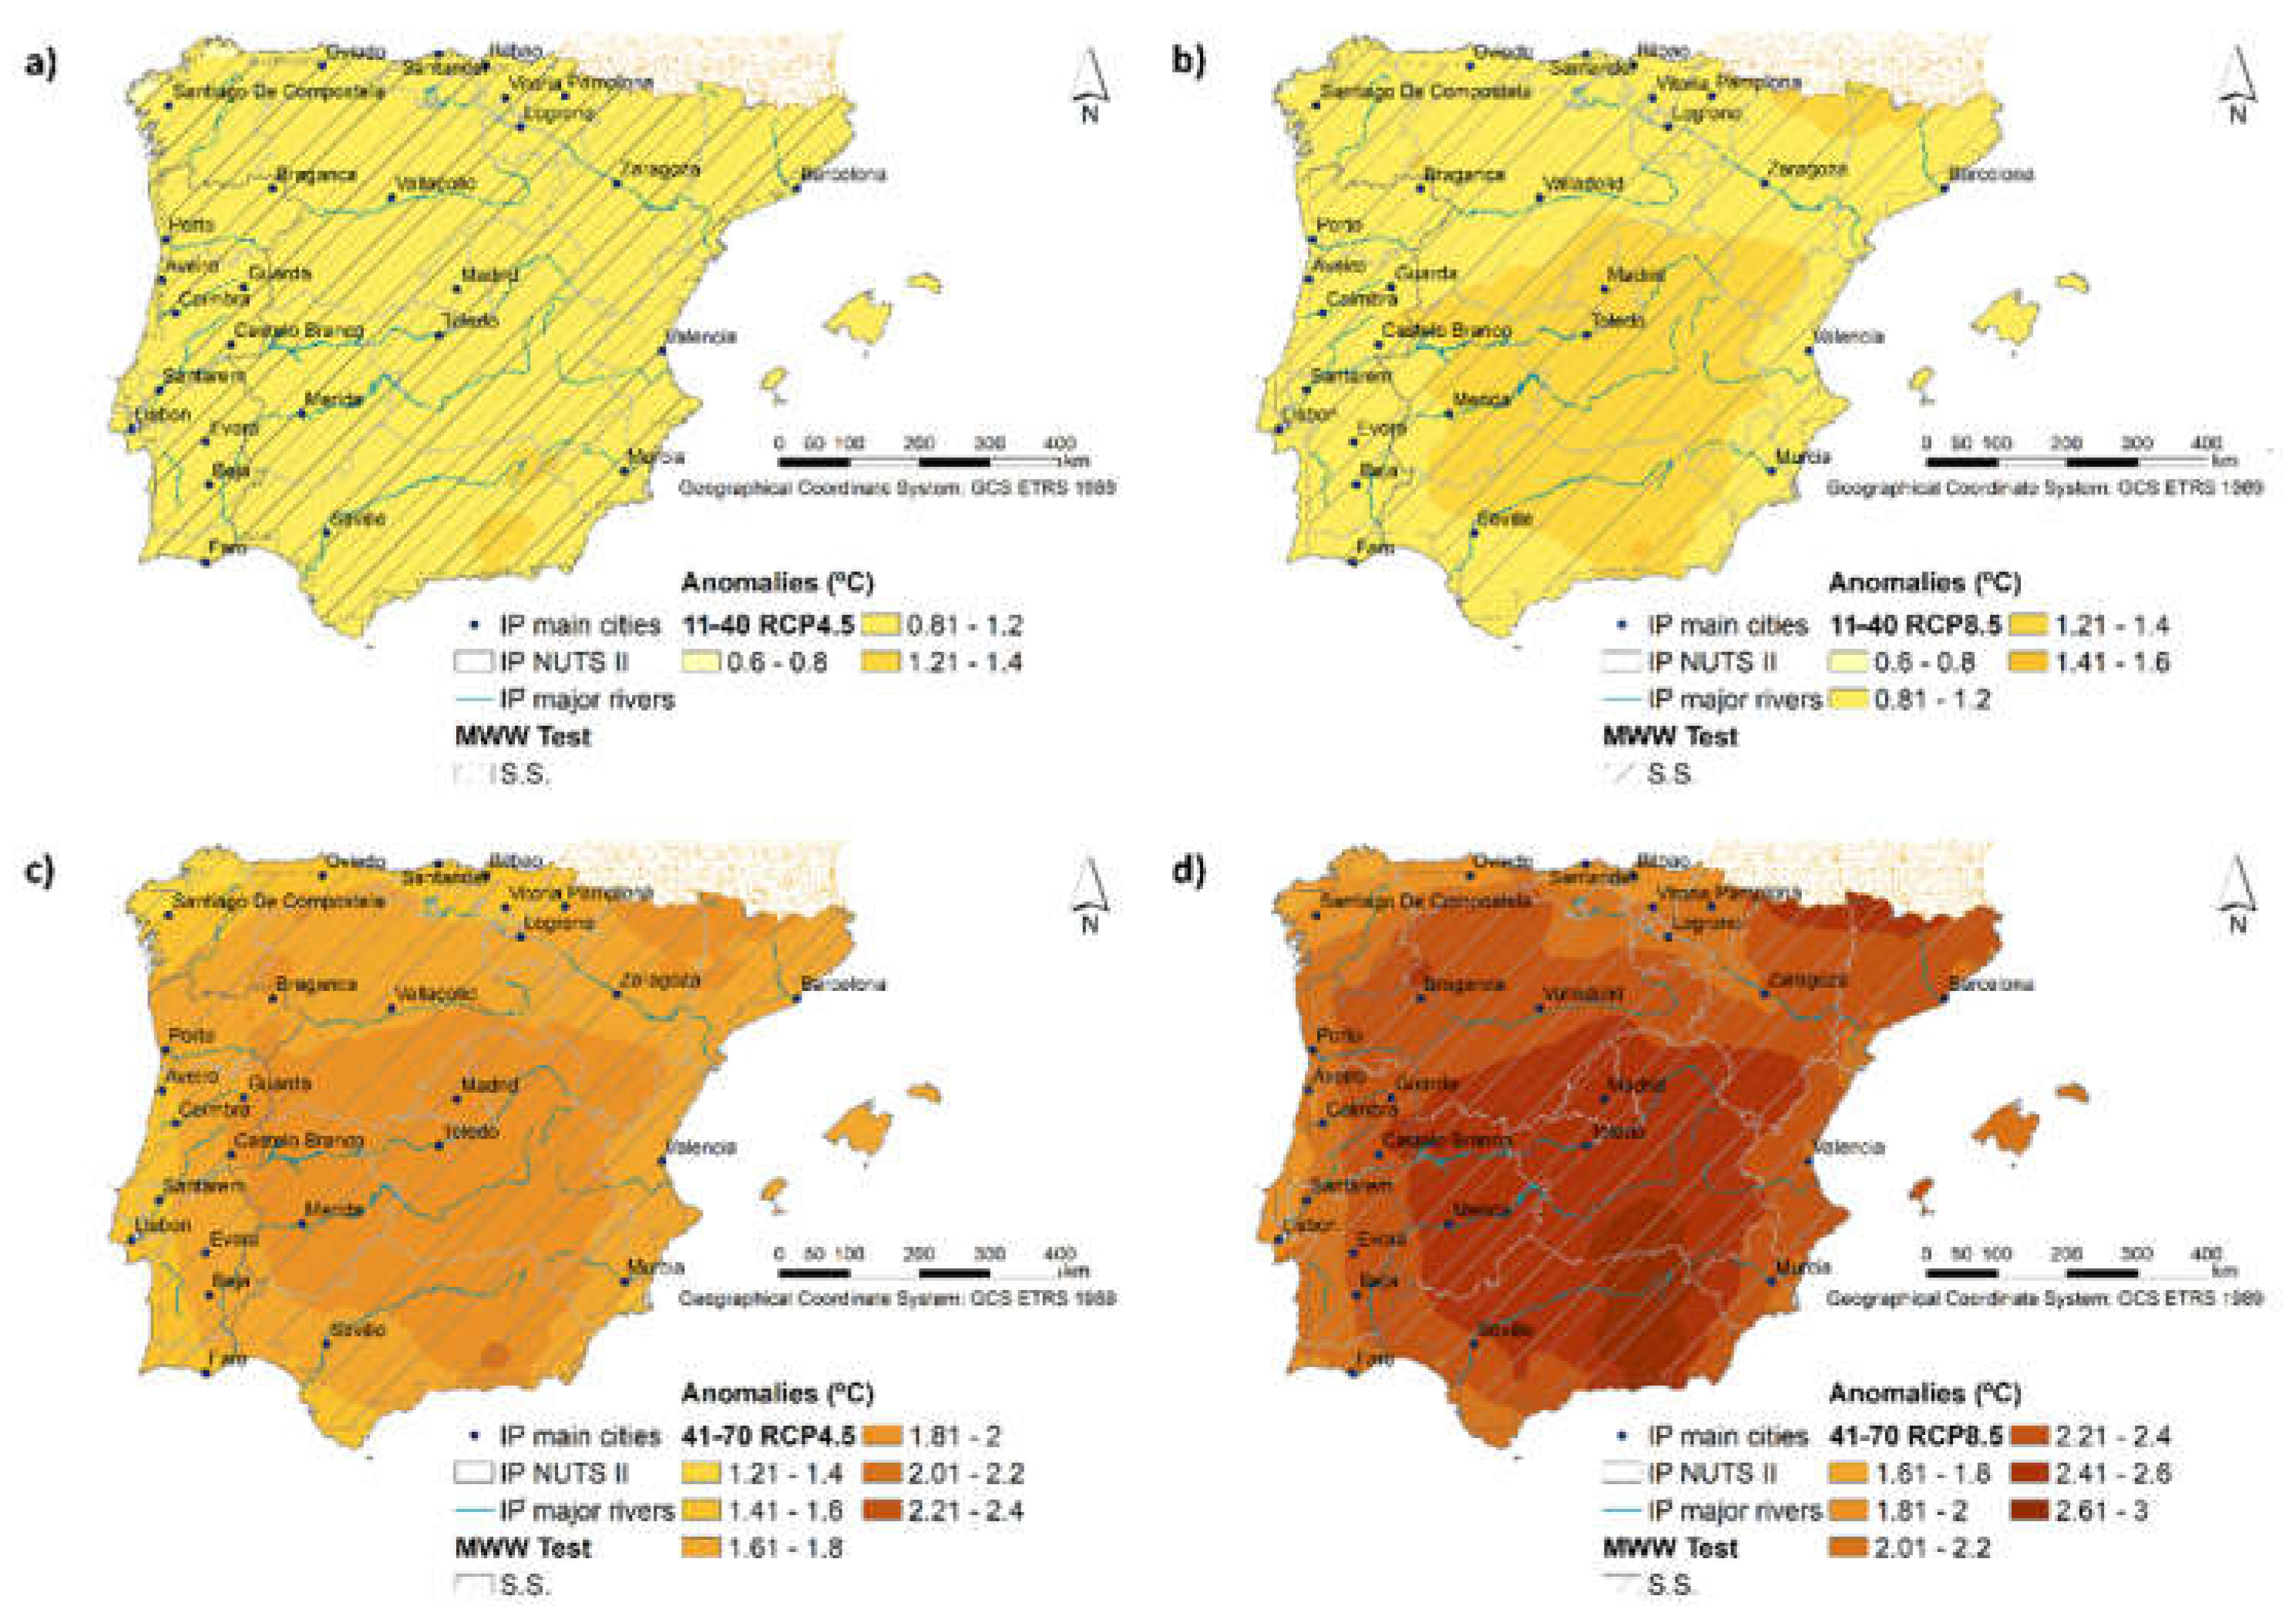
Concerning the annual mean temperature anomalies for 2011–2040, statistically significant positive values throughout the IP are projected, with values ranging from 0.6 °C to 1.4 °C under RCP4.5 (Figure 3a) and from 0.6 °C to 1.6 °C under RCP8.5 (Figure 3b). For 2041–2070, the anomalies range between 1.2 °C and 2.4 °C under RCP4.5 (Figure 3c) and from 1.6 °C to 3.0 °C under RCP8.5 (Figure 3d). In all cases, higher anomalies are found in central-southern Iberia.
As for precipitation, the mean temperature values for the total mean area and related anomalies were also computed. The results show an increase of 1.2 °C (1.3 °C) for 2011–2040 and 1.9 °C (2.5 °C) for 2041–2070 under RCP4.5 (under RCP8.5) in comparison with 1961–1990 for the study area
3.2. Projections for the Aridity Indices
For 1961–1990 (Figure 4a) and DMI, results show a prevalence of D and SD climatic conditions in the northeastern and central regions of IP (34.3%; Table 3), a transitional M zone prominent in the southern half of Portugal, in the Guadiana and Guadalquivir River basins and between Valencia and Madrid in central Spain (23%; Table 3). The remaining of the territory in the north and northwestern presents humid climate (HC) types, from SH to EH (42.7%; Table 3). An increase in dry climate (DC) types is projected for 2011–2040 (Figure 4b,c) and 2041–2070, rising to 12.9% (16.3%) by 2041–2070 under RCP4.5 (RCP8.5), more pronounced in the southeastern regions of IP (Figure 4d,e). Consequently, it is predicted a decrease in HC types (−6.6% and −7.7% under RCP4.5 and RCP8.5, respectively) in the northern and northwestern regions. This decrease is also projected for both periods on the Mediterranean (M) type, particularly in 2041–2070 (−6.3% and −8.6% under RCP4.5 and RCP8.5, respectively) and more noticeable in southwestern regions (Figure 4d,e).
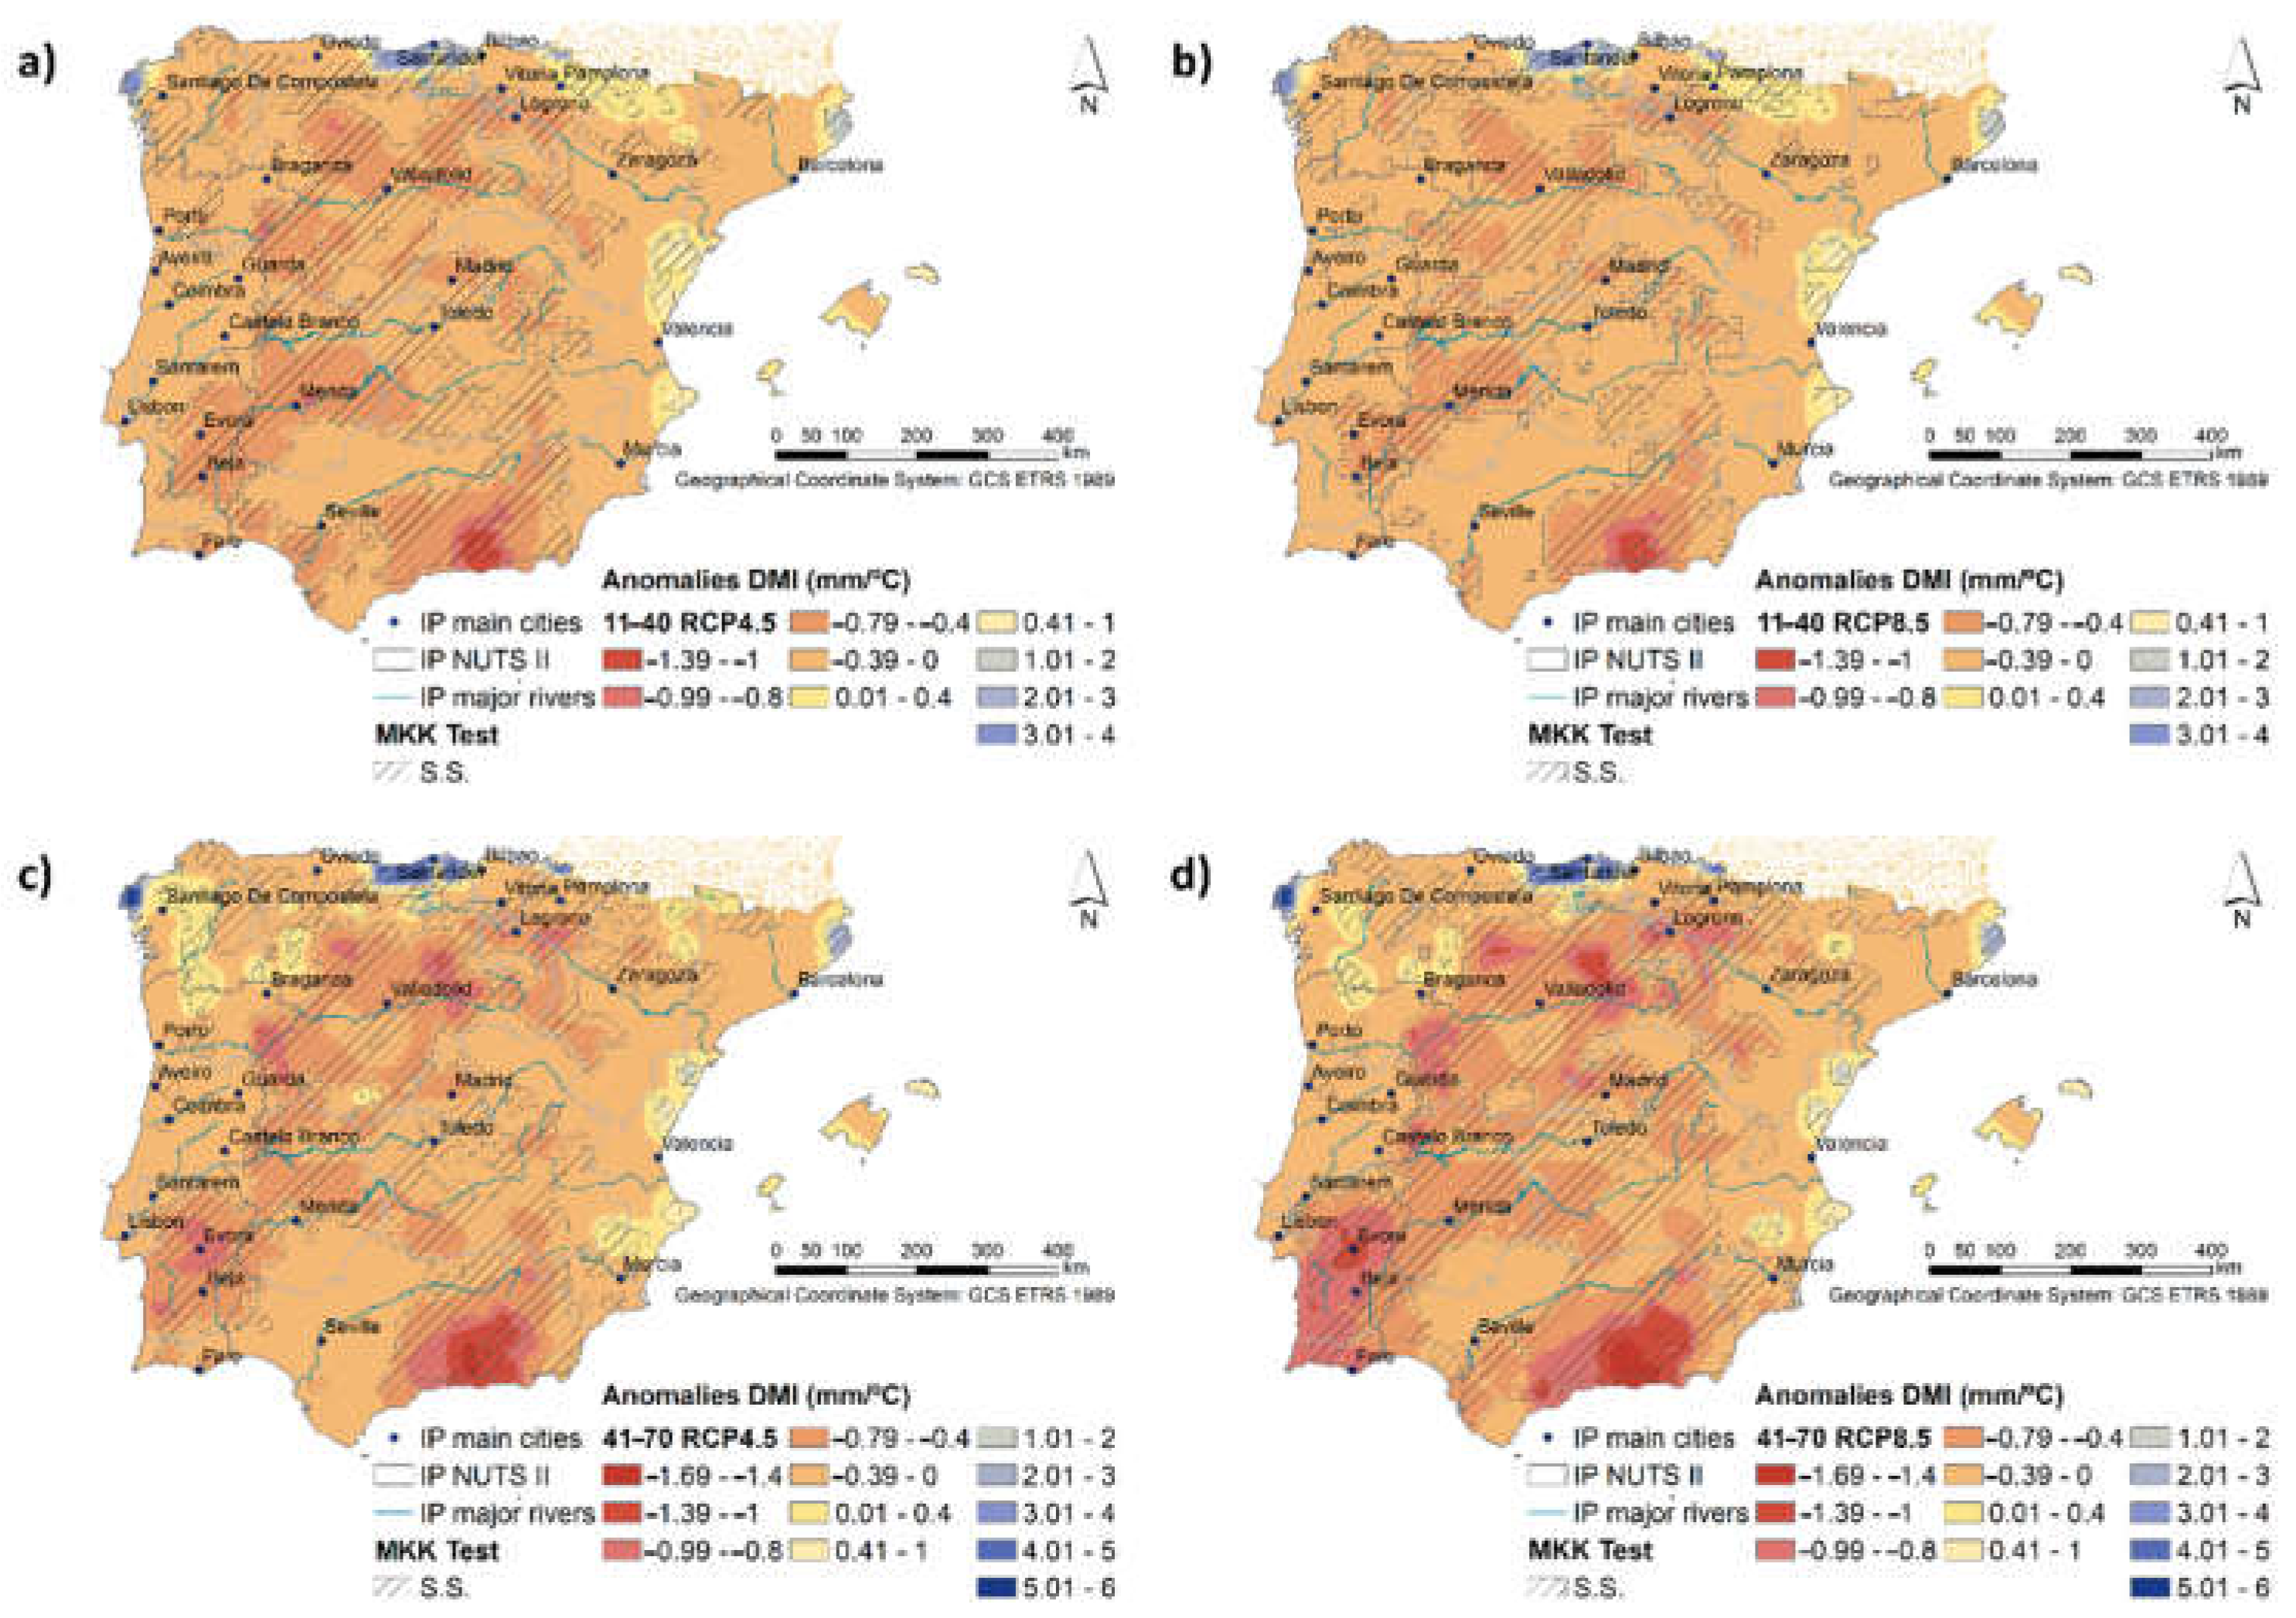
These changes are corroborated by the analysis of the statistically significant DMI anomalies between 2011–2040 or 2041–2070, under both RCPs, and the baseline climate (Figure 5). Statistically significant negative anomalies are predicted for central, southeastern, and southwestern regions, more prominent in the latter area and higher for 2041–2070 under RCP8.5 (Figure 5d). Conversely, statistically significant positive anomalies are projected in the north, nearby Santander, again reaching higher values by 2041–2070 under RCP8.5 (Figure 5d). These results hint at an intensification of DC in the southeastern areas until 2070 under RCP8.5.
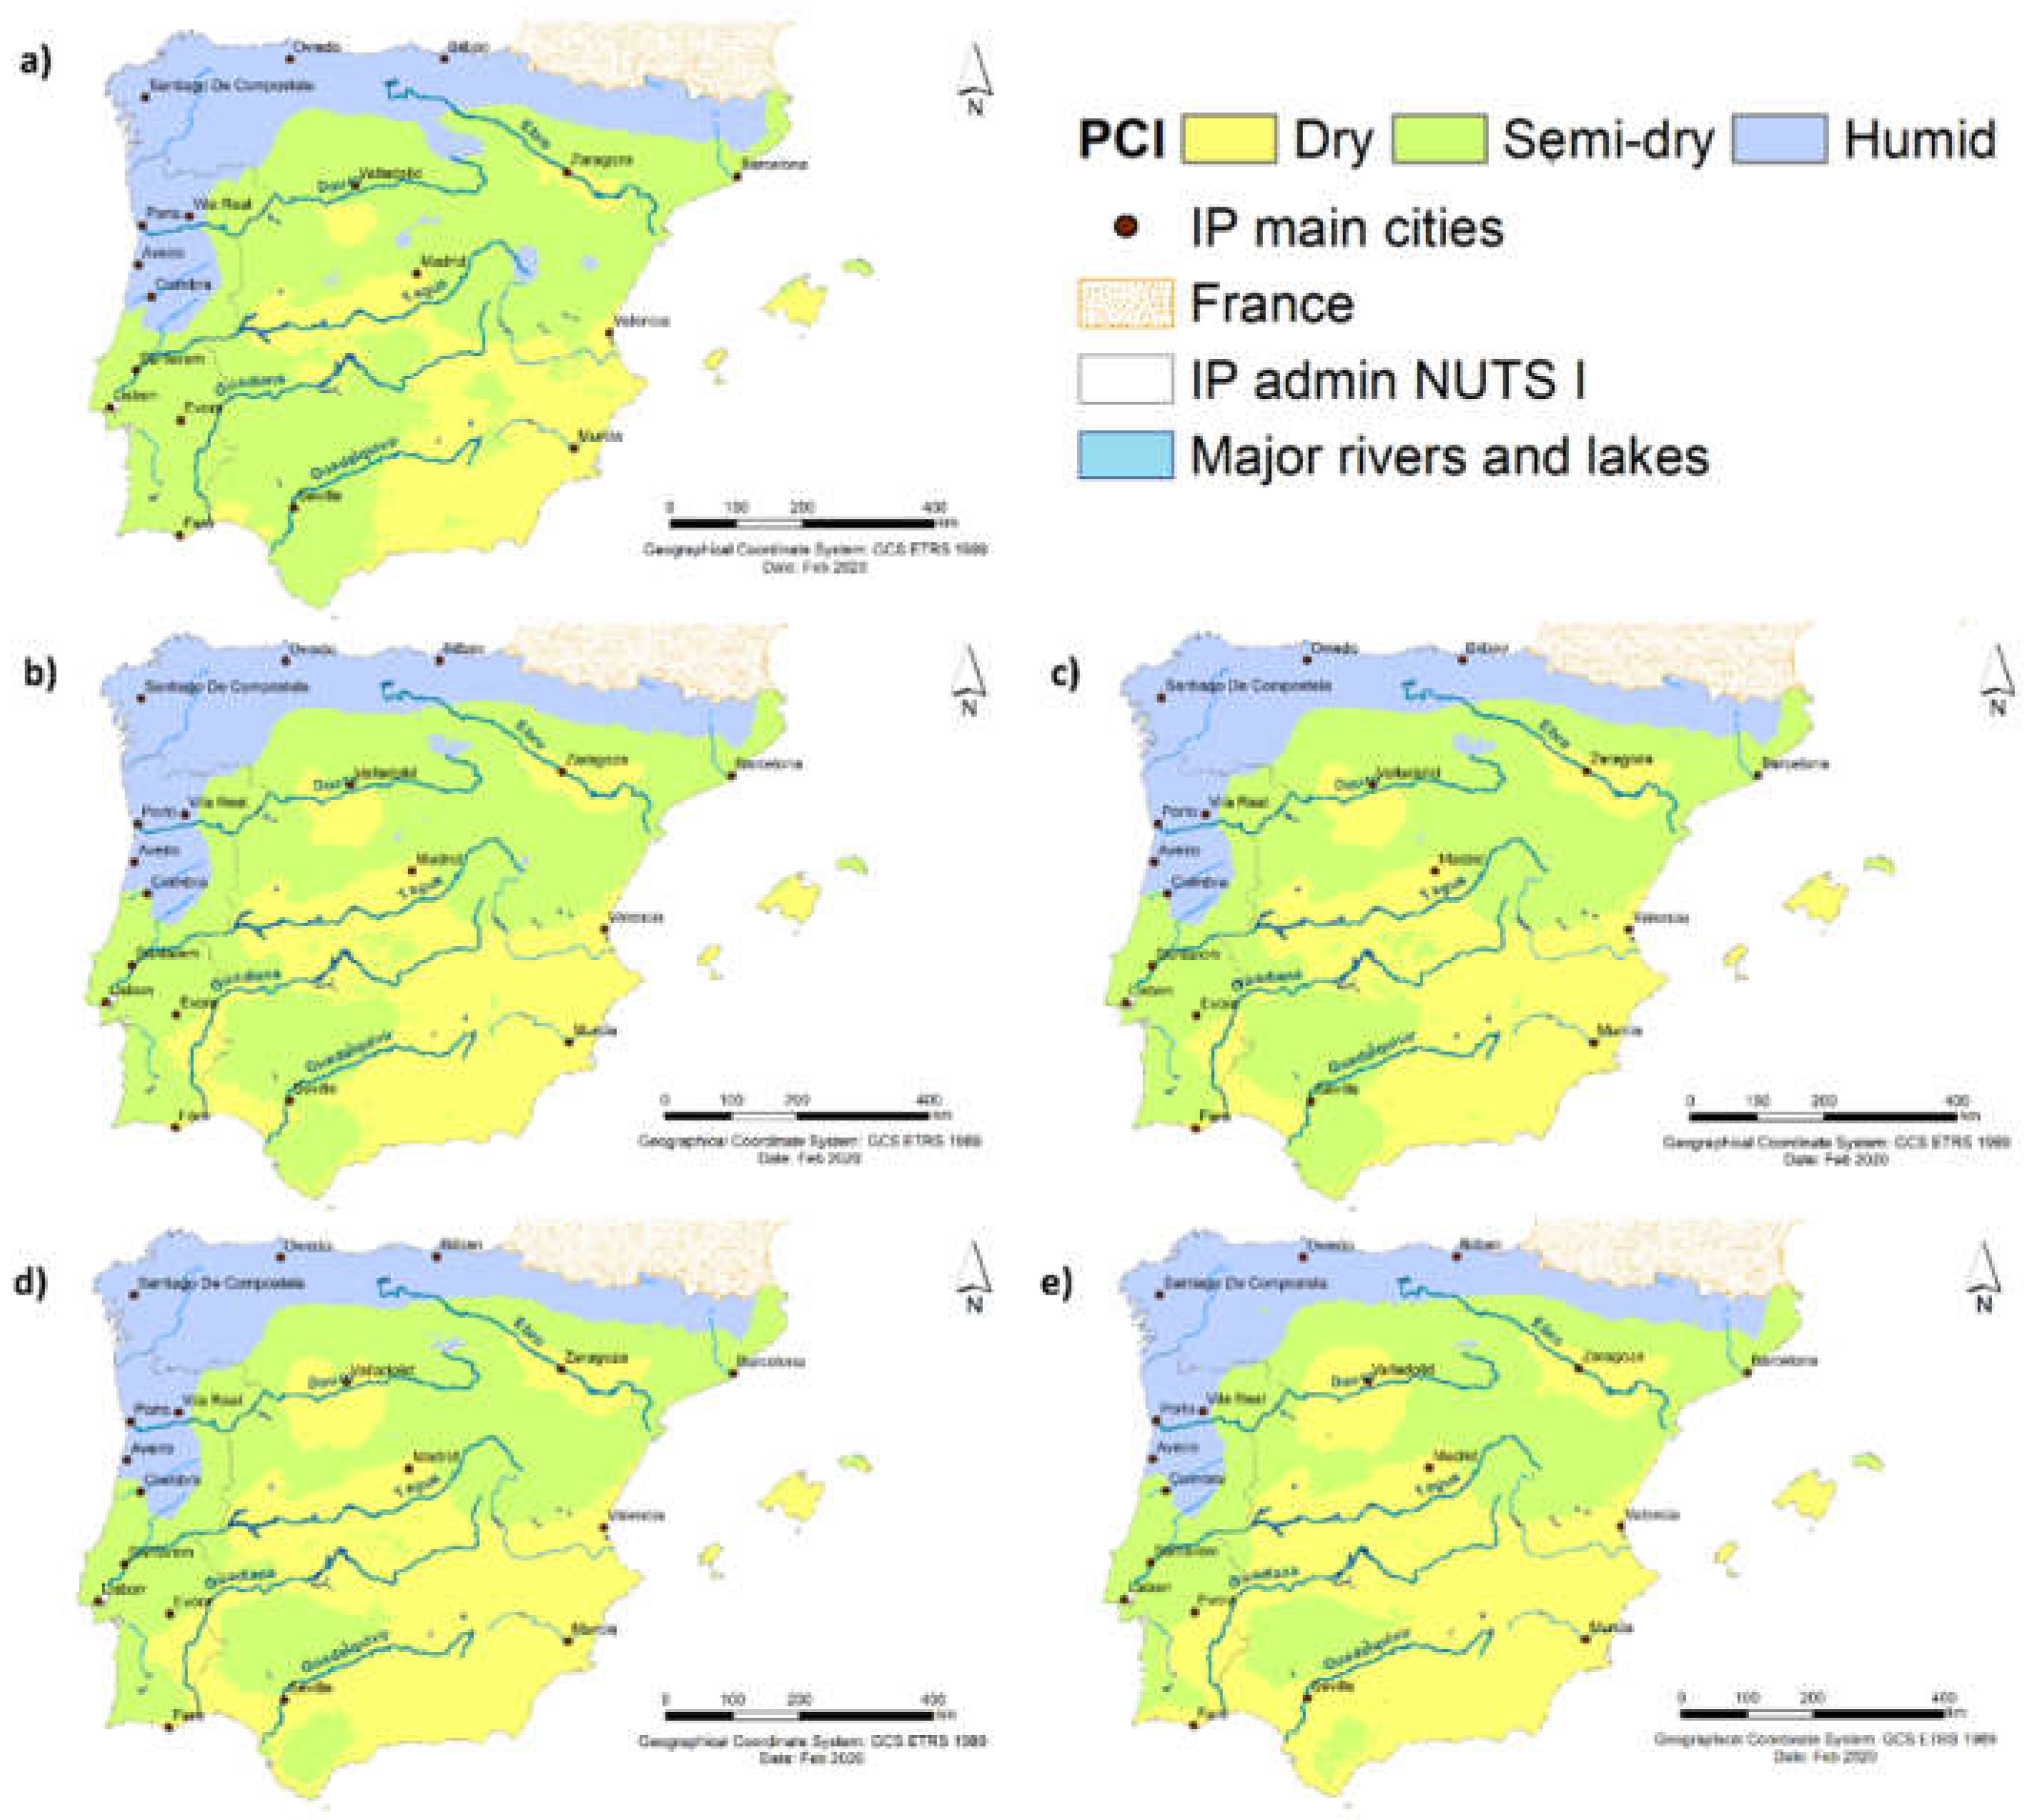
Regarding the spatial patterns of PCI for 1961–1990 (Figure 6a), the DC prevail in central and southeastern regions (80.7%; Table 3), whereas the HC occurs in the north and northwesternmost areas (19.3%; Table 3), with the SD in between. These patterns are in clear accordance with the ones observed for the related climatic conditions for DMI. However, conversely to DMI, PCI does not present transitional climatic classes like M or SH. Therefore, it seems that the DC characteristics are projected to decrease −4.4% and −3.9% under RCP4.5 and RCP8.5, respectively. This projected decrease is influenced by SD areas. Nonetheless, there is a clear projected increase in DC conditions of 1.2% under RCP4.5 (Figure 6d) and 5.8% under RCP8.5 (Figure 6e). It is still noteworthy that this index has only three climate types. Hence, these transitional climates are superimposed in areas within SD and H regions.
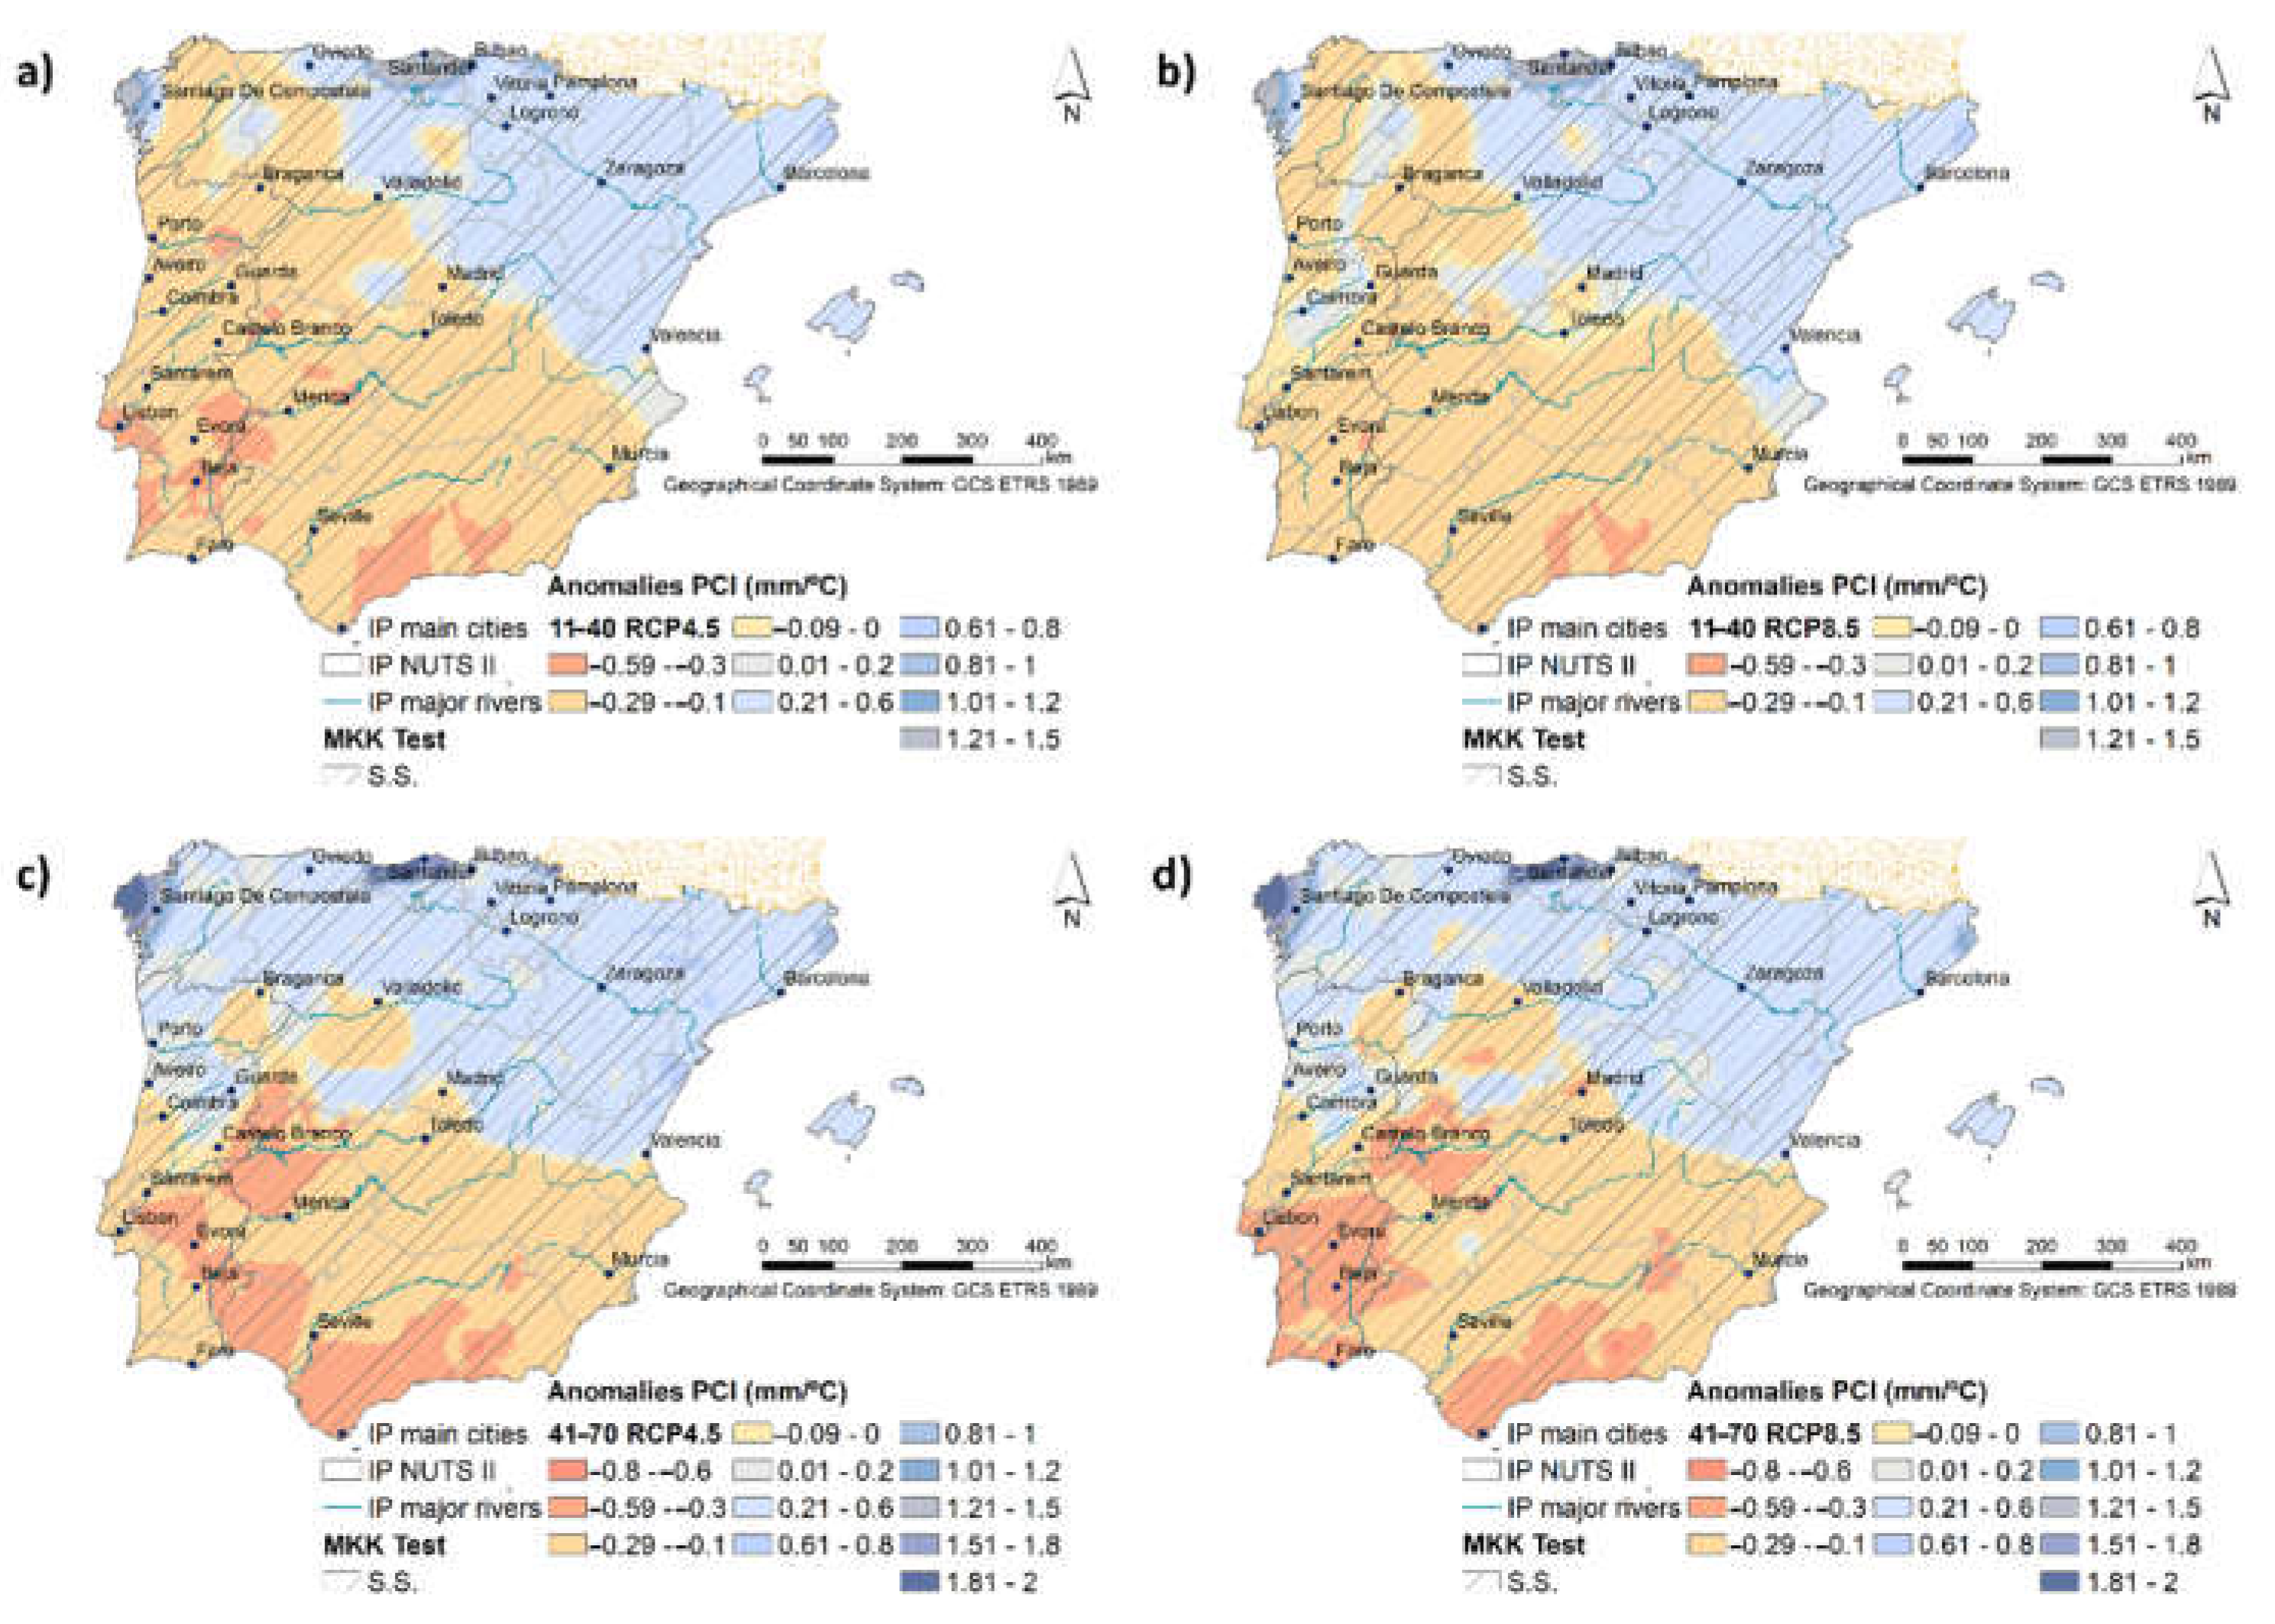
For 2011–2040, under both RCPs, the statistically significant anomalies occur in the entire territory, with a northeast–southwest axis dividing the negative anomalies (dryness increase) towards the south and the positive anomalies towards the north (Figure 7a,b). For 2041–2070, under both RCPs, this axis is more zonally tilted (west–east), diving the IP into a northern half with positive anomalies and southern half with negative anomalies (Figure 7c,d). As for DMI, PCI anomalies tend to be higher for the latter period and under RCP8.5 (Figure 5d and Figure 7d). These results are in clear accordance with DMI, since they hint at an enhancement of DC in the south and southeastern areas until 2070 under RCP8.5.
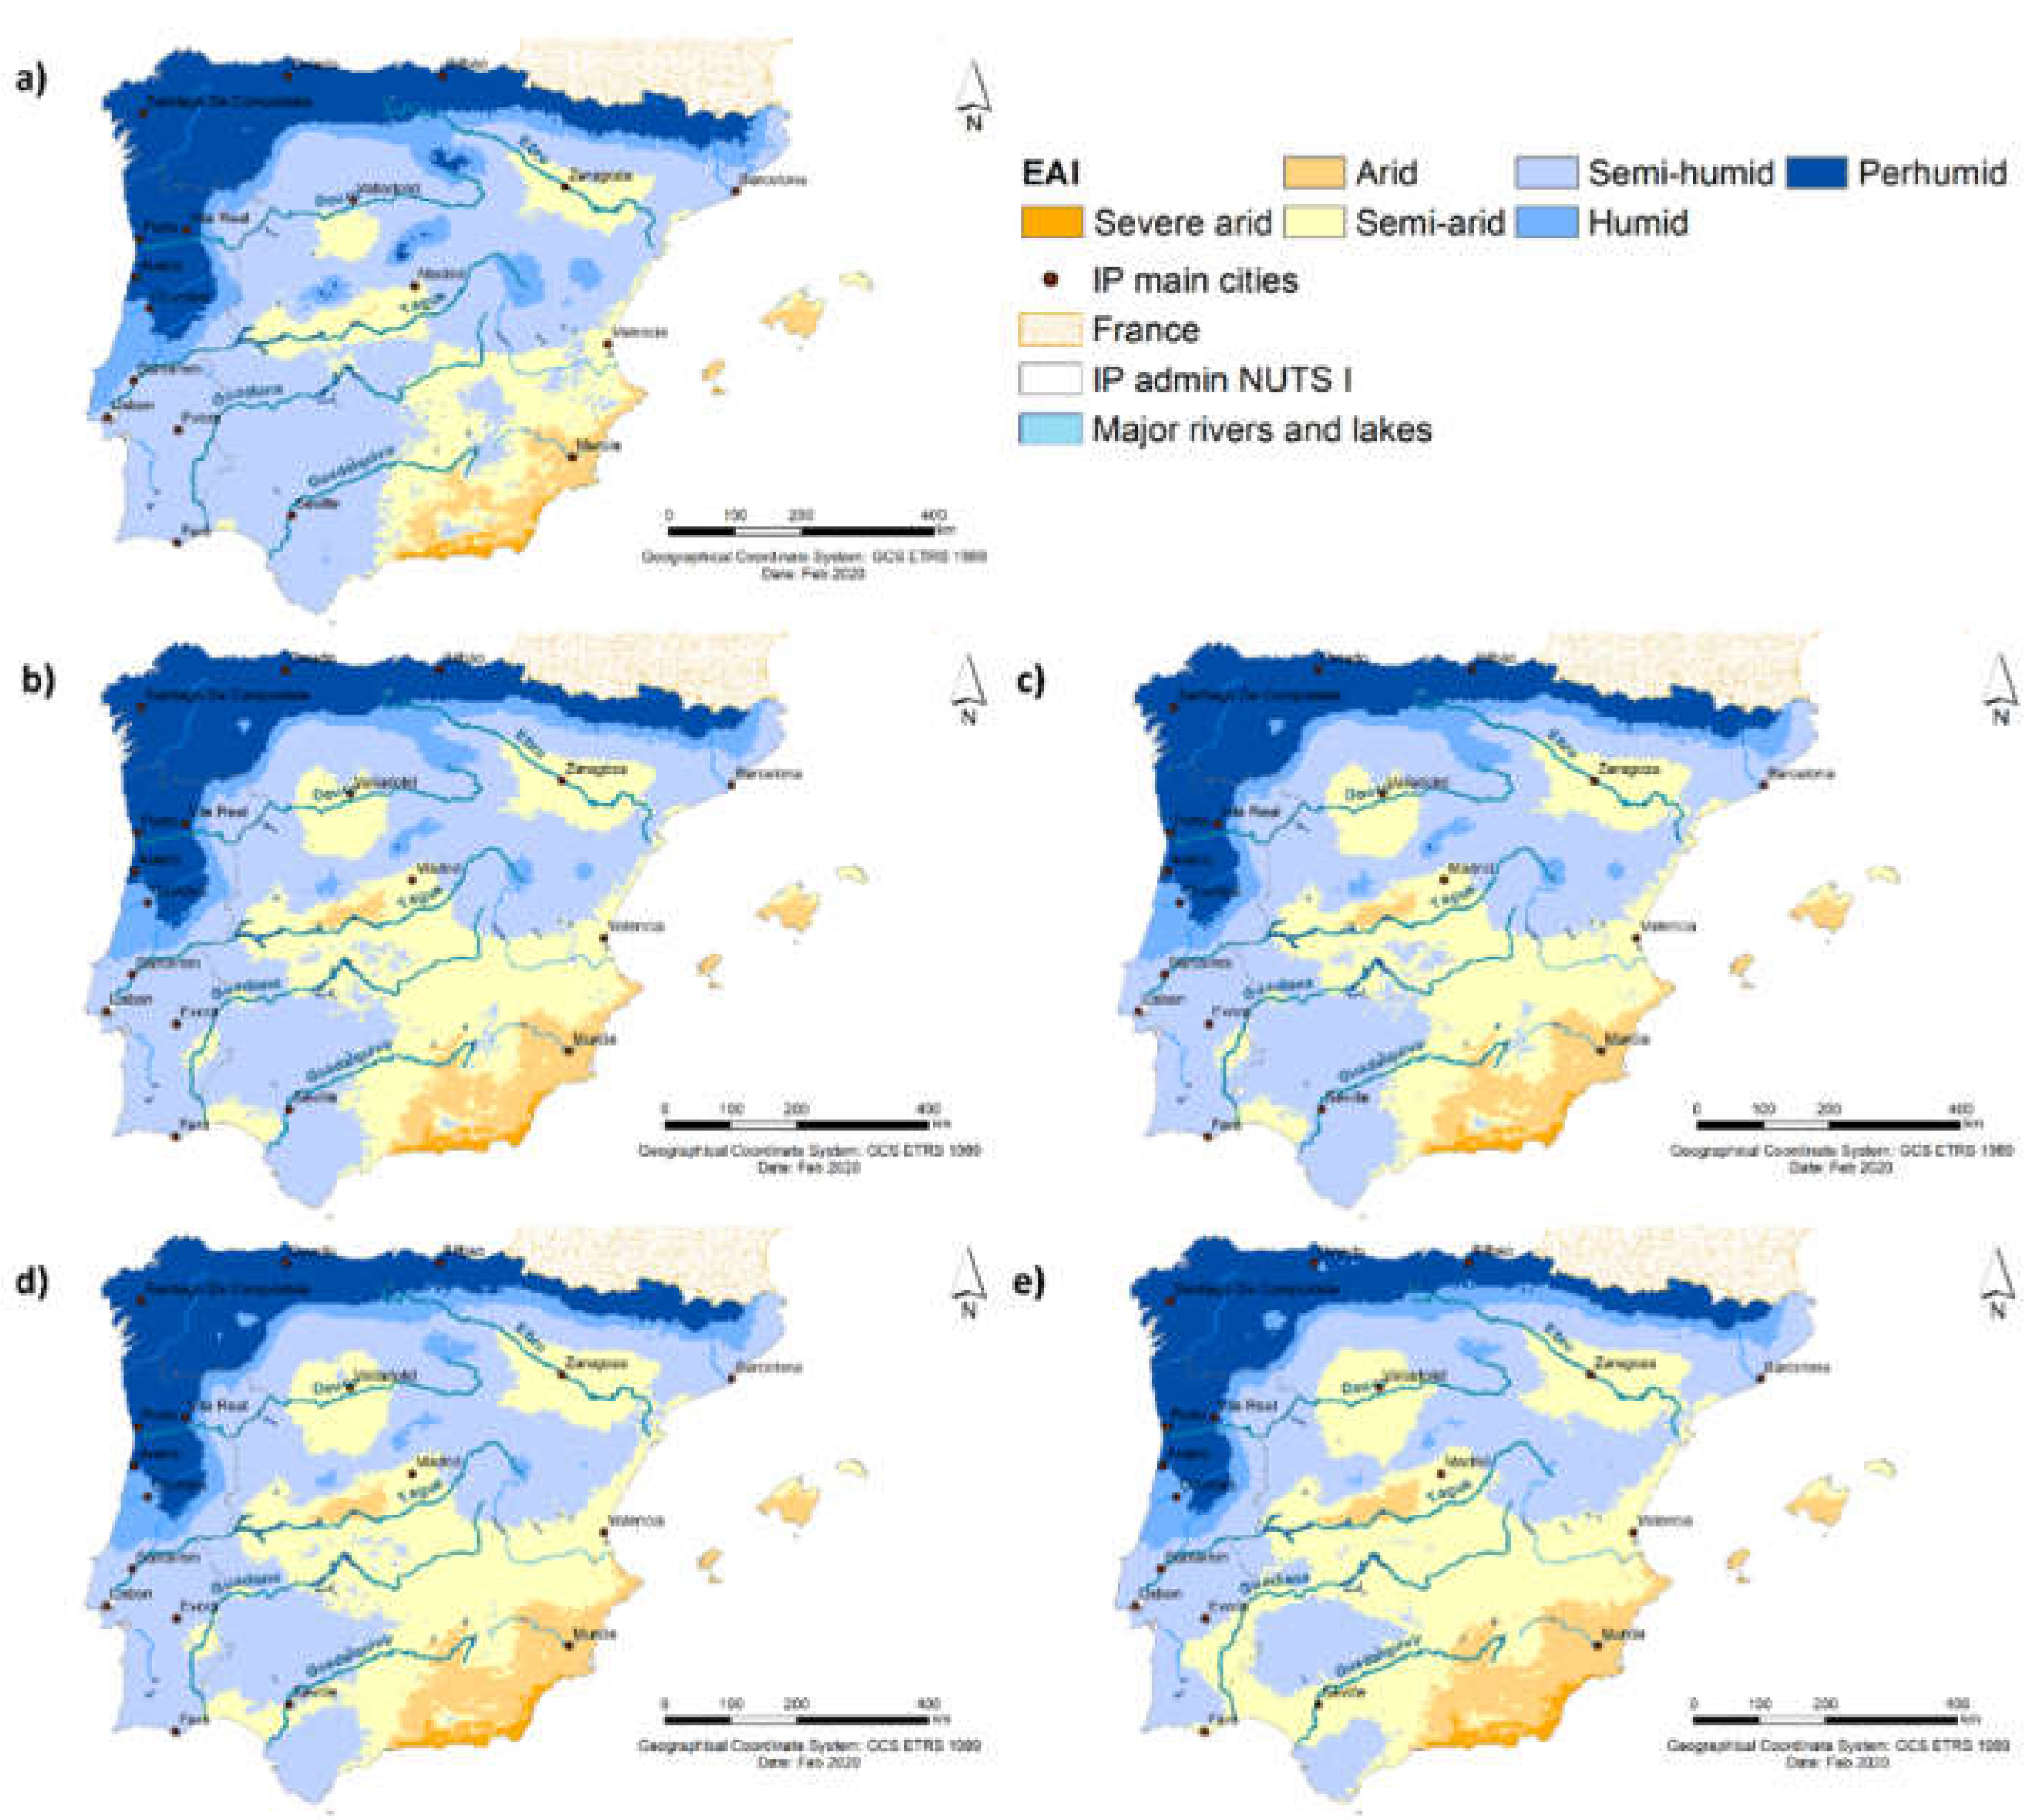
Similar to the previous indices, the spatial patterns for EAI in 1961–1990 (Figure 8a) show a prevalence of SvA to SA climates in central and southeastern regions, in this case in 28.4% of the territory. Conversely, for the remaining 71.6%, SH to PH climates are depicted, with prevailing PH climate in the north and northwesternmost portions of the IP (Figure 8a). It is worth mentioning that no SvA conditions were found for 1961–1990 (Figure 8a). The climate change projections for the whole IP in 2041–2070 reveal an increase in AC of 5.4% under RCP4.5 and 10.7% under RCP8.5, whilst for the HC, a decrease is predicted. The EAI patterns generally maintain spatial coherence with the previous indices. The AC prevails in central and southeastern IP (Figure 8d,e), while the HC can be found in the north and northwest (Figure 8). A closer inspection of the patterns reveals that in 2041–2070, the extension of the most extreme climates SvA and A (H and PH) undergoes an increase (decrease) of 3.2% and 4.1% under RCP4.5 and RCP8.5 (−0.8% and −2% under RCP4.5 and RCP8.5, respectively (Table 3). Furthermore, for the transitional climates, SA experiences an increase of 2.2% and 6.6% under RCP4.5 and RCP8.5, respectively), whereas for SH the reverse is projected, i.e., −4.6% and −8.4% under RCP4.5 and RCP8.5, respectively (Table 3).
Concerning the EAI anomalies (Figure 9), negative values are projected over the entire IP, increasingly higher from 2011–2040 to 2041–2070, mainly under RCP8.5. The statistically significant regions comprise most of the central and southeastern regions, hinting at an enhancement of AC until 2070 and under RCP8.5, which is in line with the previous outcomes for DMI and PCI.
The determination coefficients between P or T and the three indices were also computed and are provided as Supplementary Materials (Figures S2–S4). Overall, strong to moderate statistically significant correlations are projected between all aridity indices and P, mainly in the south and southwestern regions of Iberia. Conversely, for T, only weak statistically significant correlations are predicted until 2070 for both RCPs. This might hint at a more profound influence of changes in P in all indices in comparison with T.
4. Discussion
This study analyses the climate change projections of three well-documented aridity indices, namely, DMI, PCI, and EAI, thus providing different, but complementary, perspectives of the evolution of aridity conditions over the IP. Although a direct comparison between these indices is not always possible (e.g., the PCI has only three climate divisions), a general agreement between their outcomes was found, hinting at a coherent warming and drying trend in the IP. A comparison of their patterns between the baseline climate (1961–1990) and short-range (2011–2040) or medium-range (2041–2070) future climates, under RCP4.5 and RCP8.5, was undertaken. Although these three indices are not novel, to our knowledge, no previous studies applied them in the Iberian Peninsula and for climate change impact assessment purposes. Furthermore, despite providing information on aridity conditions, our study highlights their complementary, which is critical to support scientifically solid decision making. This is critical in a region that is highly exposed and vulnerable to dryness, strengthened by recent past drying trends, and threatened by their projected intensification in the upcoming decades.
The results indicate a decrease in total annual precipitation (up to 130 mm per year), mainly over southern Iberia, particularly for 2041–2070 and under RCP8.5, the severest scenario. In effect, while annual precipitation is projected to increase in northern Europe, drying trends are projected over southern Europe and the Mediterranean Basin [57], thus also affecting the IP. Similar decreases in the annual precipitation over the IP were previously identified [57]. These projected changes also reveal seasonal variability, with major decreases projected for Southern Europe during the summer months. Our findings are also in accordance with Santos et al. [58] who highlighted a statistically significant decrease in Spring precipitation, mainly in northern and central Portugal, but also projected an overall decrease in precipitation, particularly in the northernmost regions. These outcomes are also supported by several studies for Europe that have analyzed the variability of precipitation, as well as of extreme precipitation [59] and its relationship with the large-scale circulation patterns [60,61,62].
It is also known that there is an association between the weather types and precipitation, more robust in winter for the westernmost areas, much weaker in the summer and for eastern Iberia [63,64]. These overall changes can be attributed to fluctuations in the jet stream flow and the accompanying changes in the cyclone activity and blocking frequency, hinting at an increase in the frequency of the driest in detrimental to the rainiest types [64]. Additionally, these changes will impact the frequency and intensity of extreme events that also reveal considerable spatial and seasonal heterogeneity across Europe. A recent study suggested that projected increases in extreme precipitation events may become more pronounced at a sub-daily timescale over Iberia, mainly in summer [65].
Regarding the mean temperature, results point to an increase (up to 3 °C) until 2070, mainly under RCP8.5, which is in line with Viceto et al. [66]. The association between large-scale dynamics can also be linked to the predicted changes in mean temperature [62,67]. The outcomes of this study are supported by the EURO-CORDEX projections across Europe, which show that temperatures will continue to increase, at a higher rate than the global average. In fact, the mean annual temperature increased between 1.7 and 1.9 °C in comparison to the pre-industrial period [5]. Furthermore, these high warming trends are particularly relevant in certain European regions, which include the Mediterranean region and especially in the IP, already considered a climatic hotspot [2,3,4]. Our findings are consistent with Jacob et al. [57] who project for different European regions an increase between 1.4 and 4.2 °C under RCP4.5 (2.7 and 6.2 °C under RCP8.5) by 2071–2100 in comparison to 1971–2000, again higher in southern Europe.
In conclusion, the conjunction of these factors leads to an increase in the area, intensity and persistence of aridity conditions in a broader southern half of Iberia until 2070, mainly under RCP8.5. Therefore, these predicted conditions can be considered as a real hazard, increasing the threat of desertification of these areas, since projections also indicate a significant decrease in summertime soil moisture in the Mediterranean region, especially in northeastern Spain between 2021 and 2050 [68]. These changes also imply a significantly increasing interannual variability in the future, with consequences in climate classification. Indeed, the predicted changes in Köppen’s climate classification points towards the increase in desert (BW) and semi-desert (BS) climates in the Iberian southeast [1]. Furthermore, recent studies also project an increase in intermediate to severe dry events until 2070, mainly under RCP8.5 and in the southern region of the IP [69]. These climatic changes will have deep impacts on agriculture [63,70], such as in Mediterranean olive orchards [71,72], in wheat yield [73], and viticulture [74,75], among other crops.
5. Conclusions
In general, the shifts in the spatial variability of the three indices hint at an overall increase in aridity or dry conditions until 2070, mainly under RCP8.5, and in central and southern Iberia. An increase in DMI DC types, growing 12.9% (16.3%) by 2041–2070 under RCP4.5 (RCP8.5), is foreseen and is more pronounced in the southeastern regions. Consequently, a decrease in H type (−6.6% and −7.7% under RCP4.5 and RCP8.5, respectively) is projected in the north and northwestern regions. Regarding the PCI, an increase in D conditions of 1.2% under RCP4.5 and of 5.8% under RCP8.5 is also projected for 2041–2070. Concomitantly, the EAI reveals, for 2041–2070, an increase in AC of 5.4% under RCP4.5 and 10.7% under RCP8.5, whilst a decrease is predicted for HC.
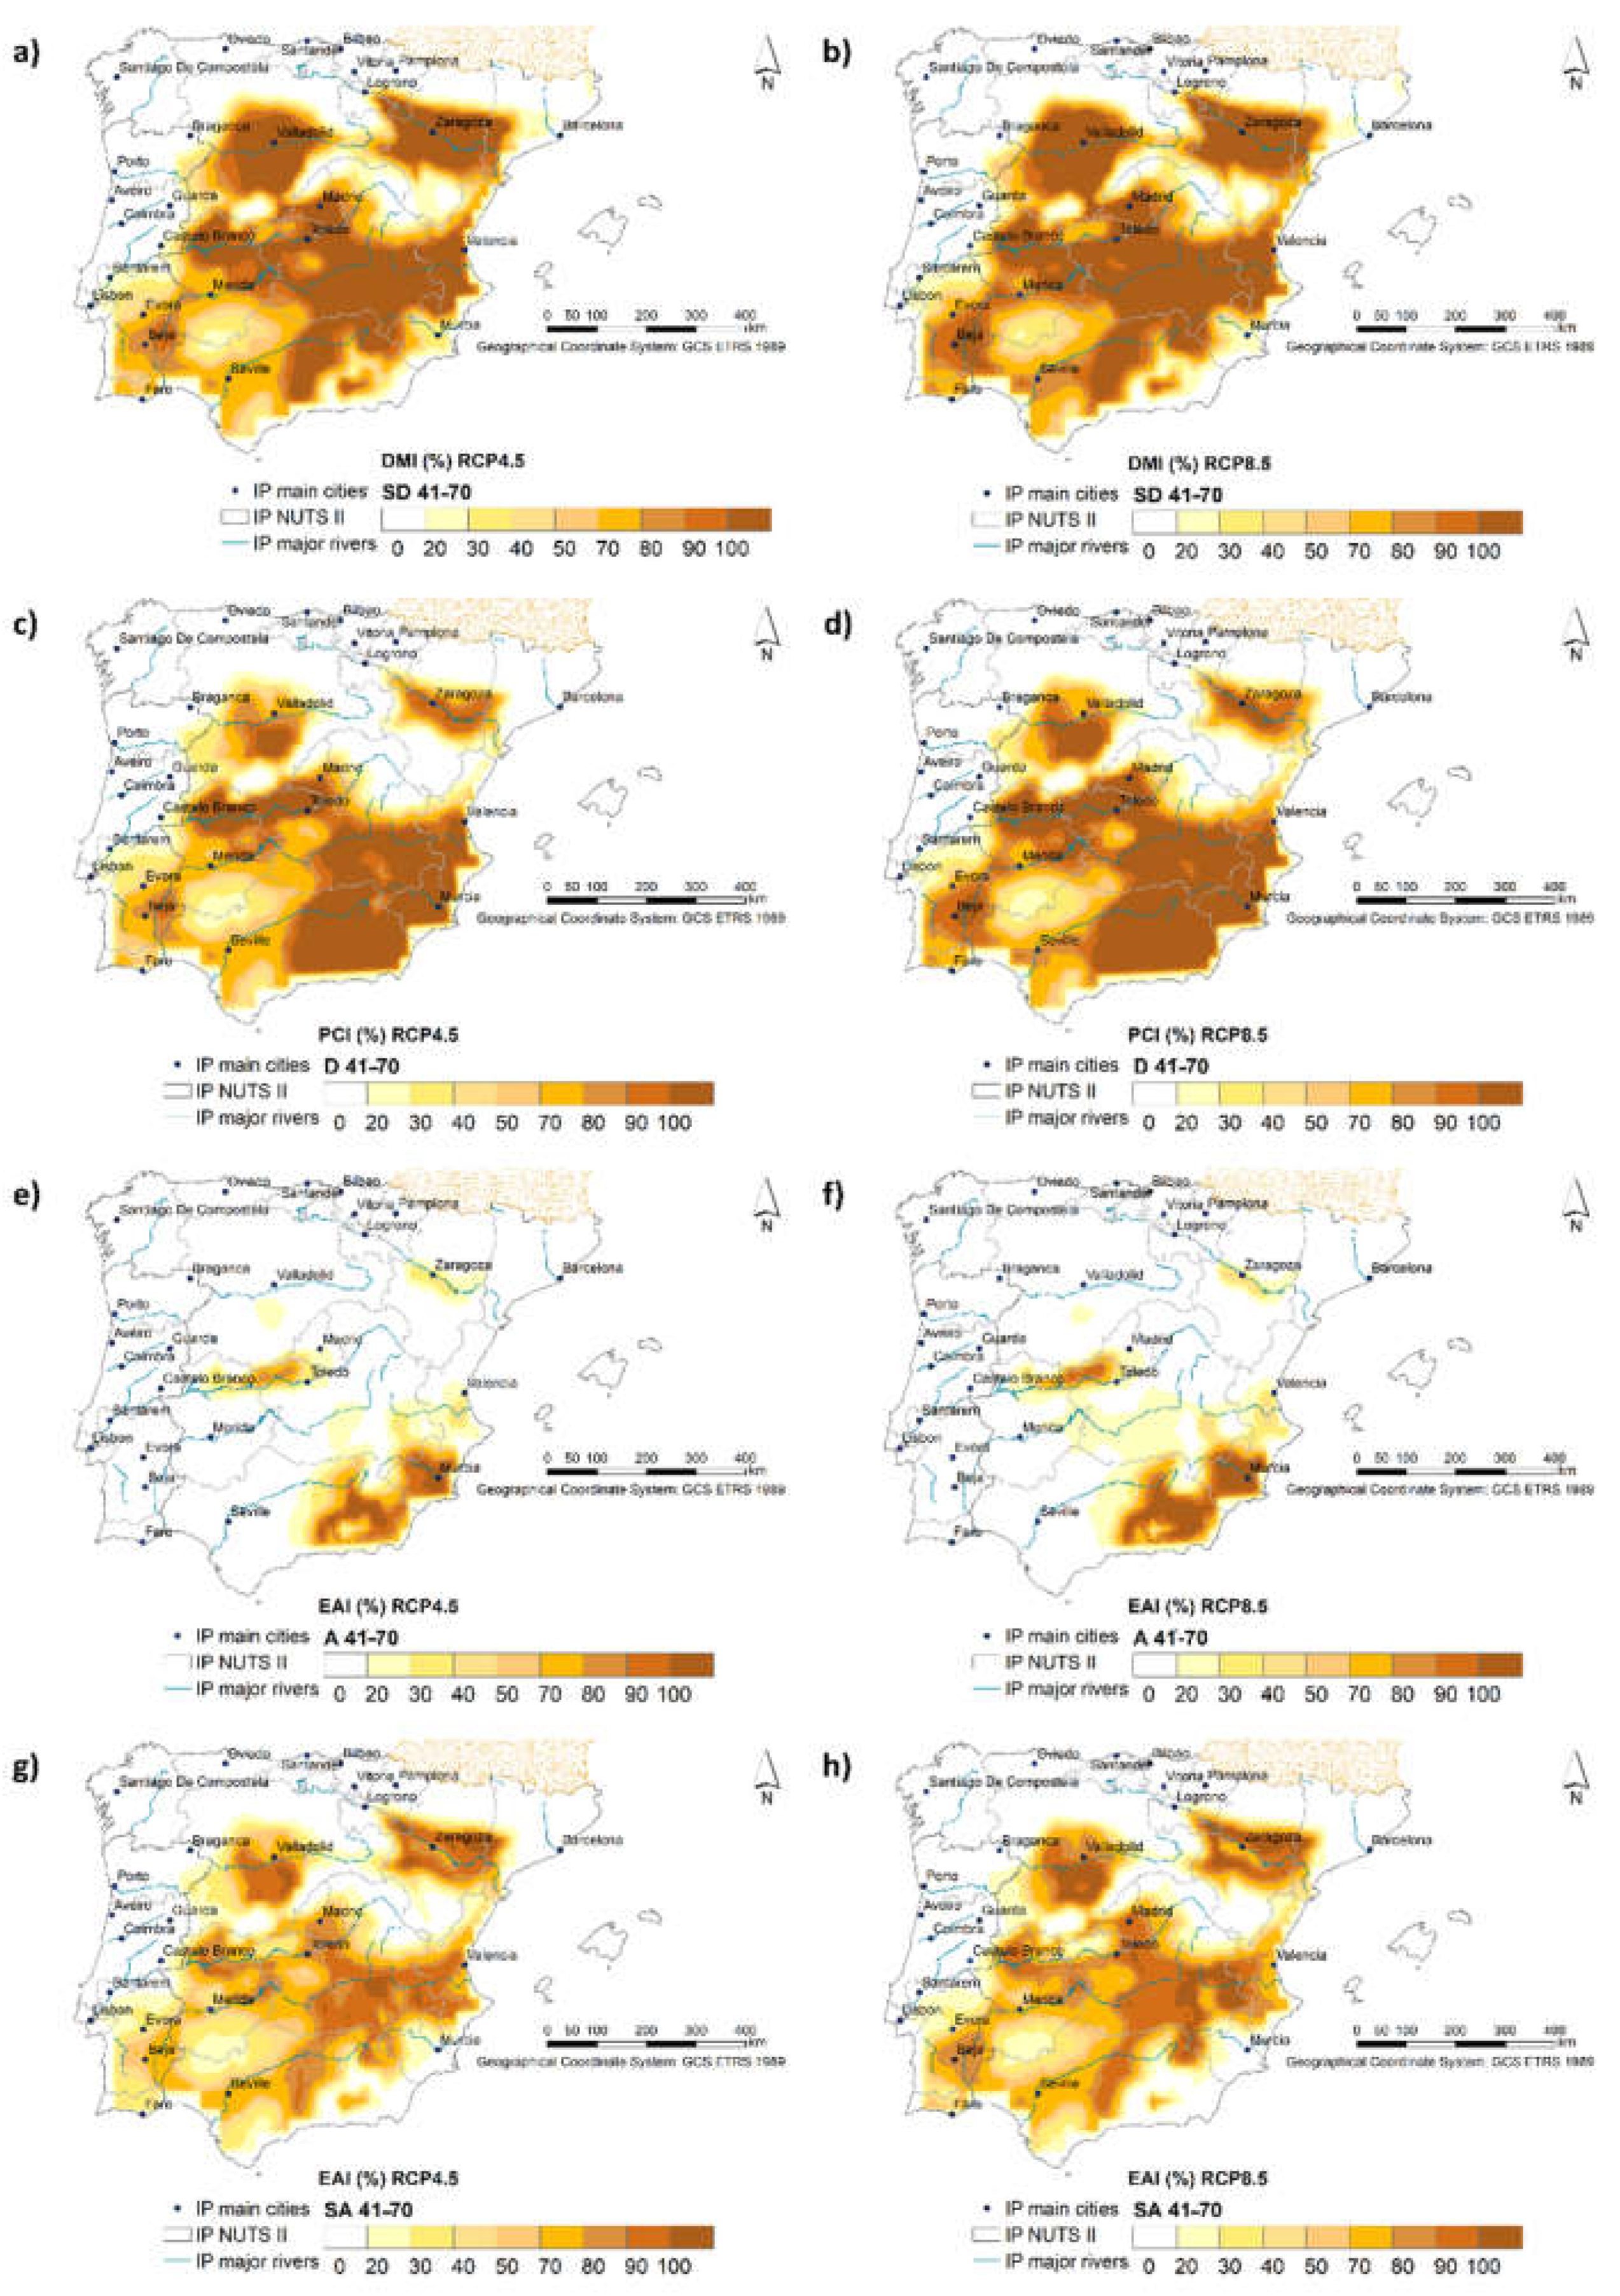
These increasingly higher AC are particularly relevant between 2041 and 2070 (Figure 10), for which the spatial patterns of the frequency of occurrence (in %) of SD (for DMI, Figure 10a,b), D (for PCI, Figure 10c,d), and A and SvA (for EAI, Figure 10e–h) reveal areas in the provinces of Aragón, Castilla-Léon, Comunidad de Madrid, Castilla-La Mancha, Extremadura, Región de Múrcia, and Andalucía, mostly located in central and southeastern Spain, as well as Alentejo and Algarve, in southern Portugal (Figure S1), as the most impacted.
For the abovementioned areas, projections highlight the persistence of dry/arid conditions above 70% (over 21 years) by 2041–2070, more pronounced mainly in southern Portugal under RCP8.5 (Figure 10). These outcomes are coherent with the strong statistically significant correlations found between these three indices and the climate mean total annual precipitation. Weaker correlations were found for the mean annual temperature.
The projected increases in both the intensity and persistence of aridity conditions in southern and central Iberia will strengthen the exposure and vulnerability of this region to climate change, with a real risk of multi-level desertification. Therefore, a thorough review of the adaptation potential of the different strategies and options is of the utmost relevance, as water supply not only for human consumption, energy, or industry, but also for agriculture, can be a limiting factor, with likely severe and irreversible socio-economic and environmental implications.
Supplementary Materials
The following are available online at https://www.mdpi.com/article/10.3390/w13152035/s1, Figure S1: Iberian Peninsula (IP) study area with the respective Nomenclature of Territorial Units for Statistics (NUTS) NUTS 2 boundaries, Figure S2: Statistically significant correlations (at a 5% significance level) between DMI and P and respective determination coefficient between (a) 1961–1990, (b) 2011–2040 and (d) 2041–2070 under RCP4.5; (c) 2011–2040 and (e) 2041–2070 under RCP8.5. For (f–j) the same as to (a–e) but between DMI and T, Figure S3: Statistically significant correlations (at a 5% significance level) between PCI and P and respective determination coefficient between (a) 1961–1990, (b) 2011–2040 and (d) 2041–2070 under RCP4.5; (c) 2011–2040 and (e) 2041–2070 under RCP8.5. For (f–j) the same as to (a–e) but between PCI and T, Figure S4: Statistically significant correlations (at a 5% significance level) between EAI and P and respective determination coefficient between (a) 1961–1990, (b) 2011–2040 and (d) 2041–2070 under RCP4.5; (c) 2011–2040 and (e) 2041–2070 under RCP8.5. For (f–j) the same as to (a–e) but between EAI and T.
Author Contributions
For this study, the author’s contribution was conceptualization, C.A.; methodology, C.A. and J.A.S.; software, C.A. and J.C.; validation, C.A. and J.A.S.; formal analysis, C.A.; investigation, C.A.; data curation, J.C.; writing—original draft preparation, C.A.; writing—review and editing, C.A. and J.A.S.; visualization, C.A. and J.C.; supervision, J.A.S. All authors have read and agreed to the published version of the manuscript.
Funding
This research was funded by National Funds by FCT-Portuguese Foundation for Science and Technology, under the project UIDB/04033/2020. This study was funded by the European Commission-funded project “Climate change impact mitigation for European viticulture: knowledge transfer for an integrated approach-Clim4Vitis” [grant 810176].
Institutional Review Board Statement
Not applicable.
Informed Consent Statement
Not applicable.
Data Availability Statement
Not applicable.
Acknowledgments
We acknowledge the E-OBS dataset from the EU-FP6 project UERRA (https://www.uerra.eu, accessed on 1 March 2021), the Copernicus Climate Change Service, and the data providers in the ECA&D project (https://www.ecad.eu, accessed on 1 March 2021).
Conflicts of Interest
The authors declare no conflict of interest.
References
- Andrade, C.; Contente, J. Köppen’s Climate Classification Projections for the Iberian Peninsula. Clim. Res. 2020, 81, 71–89. [Google Scholar] [CrossRef]
- Giorgi, F. Climate Change Hot-Spots. Geophys. Res. Lett. 2006, 33, L08707. [Google Scholar] [CrossRef]
- Diffenbaugh, N.S.; Pal, J.S.; Giorgi, F.; Gao, X. Heat Stress Intensification in the Mediterranean Climate Change Hotspot. Geophys. Res. Lett. 2007, 34, L11706. [Google Scholar] [CrossRef] [Green Version]
- Diffenbaugh, N.S.; Giorgi, F. Climate Change Hotspots in the CMIP5 Global Climate Model Ensemble. Clim. Chang. 2012, 114, 813–822. [Google Scholar] [CrossRef] [PubMed] [Green Version]
- Hoegh-Guldberg, O.; Jacob, D.; Taylor, M.; Bindi, M.; Brown, S.; Camilloni, I.; Diedhiou, A.; Djalante, R.; Ebi, K.L.; Engelbrecht, F.; et al. Impacts of 1.5 °C of Global Warming on Natural and Human Systems. In Global Warming of 1.5 °C. An IPCC Special Report on the Impacts of Global Warming of 1.5°C above Pre-Industrial Levels and Related Global Greenhouse Gas Emission Pathways, in the Context of Strengthening the Global Response to the Threat of Climate Change, Sustainable Development, and Efforts to Eradicate Poverty; IPCC: Geneva, Switzerland, 2018; p. 138. [Google Scholar]
- IPCC. Climate Change 2014: Synthesis Report. Contribution of Working Groups I, II and III to the Fifth Assessment Report of the Intergovernmental Panel on Climate Change; Core Writing Team, Pachauri, R.K., Meyer, L.A., Eds.; IPCC: Geneva, Switzerland, 2014; p. 151. [Google Scholar]
- Baltas, E. Spatial distribution of climatic indices in northern Greece. Meteorol. Appl. 2007, 14, 69–78. [Google Scholar] [CrossRef]
- Elagib, N.A.; Addin Abdu, A.S. Climate Variability and Aridity in Bahrain. J. Arid Environ. 1997, 36, 405–419. [Google Scholar] [CrossRef]
- Chowdhury, M.A. Assessment of Intensity and Distribution of Aridity over Bangladesh Using Different Climate Indices with GIS. Clim. Chang. 2018, 4, 743–749. [Google Scholar]
- Türkeş, M. Vulnerability of Turkey to Desertification With Respect to Precipitation and Aridity Conditions. Turk. J. Eng. Environ. Sci. 1999, 23, 363–380. [Google Scholar]
- Önder, D.; Aydin, M.; Berberoğlu, S.; Önder, S.; Yano, T. The use of aridity index to assess implications of climatic change for land cover in Turkey. Turk. J. Agric. For. 2009, 33, 305–314. [Google Scholar]
- Deniz, A.; Toros, H.; Incecik, S. Spatial Variations of Climate Indices in Turkey. Int. J. Climatol. 2011, 31, 394–403. [Google Scholar] [CrossRef]
- Türkeş, M.; Akgündüz, A.S. Assessment of the Desertification Vulnerability of the Cappadocian District (Central Anatolia, Turkey) Based on Aridity and Climate-Process System. J. Hum. Sci. 2011, 8, 1234–1268. [Google Scholar]
- Paltineanu, C.; Tanasescu, N.; Chitu, E.; Mihailescu, I.F. Relationships between the De Martonne Aridity Index and Water Requirements of Some Representative Crops: A Case Study from Romania. Int. Agrophys. 2007, 21, 81–93. [Google Scholar]
- Croitoru, A.-E.; Piticar, A.; Imbroane, A.M.; Burada, D.C. Spatiotemporal Distribution of Aridity Indices Based on Temperature and Precipitation in the Extra-Carpathian Regions of Romania. Theor. Appl. Climatol. 2013, 112, 597–607. [Google Scholar] [CrossRef]
- Nistor, M.M. Spatial Distribution of Climate Indices in the Emilia-Romagna Region. Meteorol. Appl. 2016, 23, 304–313. [Google Scholar] [CrossRef] [Green Version]
- Vlăduţ, A.Ș.; Licurici, M. Aridity Conditions within the Region of Oltenia (Romania) from 1961 to 2015. Theor. Appl. Climatol. 2020, 140, 589–602. [Google Scholar] [CrossRef]
- Gebremedhin, M.A.; Kahsay, G.H.; Fanta, H.G. Assessment of Spatial Distribution of Aridity Indices in Raya Valley, Northern Ethiopia. Appl. Water Sci. 2018, 8, 217. [Google Scholar] [CrossRef] [Green Version]
- Gebremedhin, M.A.; Abraha, A.Z.; Fenta, A.A. Changes in Future Climate Indices Using Statistical Downscaling Model in the Upper Baro Basin of Ethiopia. Theor. Appl. Climatol. 2018, 133, 39–46. [Google Scholar] [CrossRef]
- Some’E, B.S.; Ezani, A.; Tabari, H. Spatiotemporal Trends of Aridity Index in Arid and Semi-Arid Regions of Iran. Theor. Appl. Climatol. 2013, 111, 149–160. [Google Scholar] [CrossRef]
- Tabari, H.; Hosseinzadeh Talaee, P.; Mousavi Nadoushani, S.S.; Willems, P.; Marchetto, A. A Survey of Temperature and Precipitation Based Aridity Indices in Iran. Quat. Int. 2014, 345, 158–166. [Google Scholar] [CrossRef]
- Araghi, A.; Martinez, C.J.; Adamowski, J.; Olesen, J.E. Spatiotemporal Variations of Aridity in Iran Using High-Resolution Gridded Data. Int. J. Climatol. 2018, 38, 2701–2717. [Google Scholar] [CrossRef]
- Haider, S.; Adnan, S. Classification and Assessment of Aridity Over Pakistan Provinces (1960–2009). Int. J. Environ. 2014, 3, 24–35. [Google Scholar] [CrossRef] [Green Version]
- Andrade, C.; Corte-Real, J.A. Spatial Distribution of Climate Indices in the Iberian Peninsula. AIP Conf. Proc. 2015, 1648, 110006. [Google Scholar] [CrossRef]
- Andrade, C.; Corte-Real, J. Aridity Conditions in the Iberian Peninsula During the XX Century. Int. J. Environ. Sci. 2016, 1, 52–58. [Google Scholar]
- Paniagua, L.L.; García-Martín, A.; Moral, F.J.; Rebollo, F.J. Aridity in the Iberian Peninsula (1960–2017): Distribution, Tendencies, and Changes. Theor. Appl. Climatol. 2019, 138, 811–830. [Google Scholar] [CrossRef]
- Abdulla, H.J. Evaluation of Moisture Deficit Index in Dry Land in Iraq. Middle-East J. Sci. Res. 2008, 3, 116–119. [Google Scholar]
- Şarlak, N.; Mahmood, O.M.A. Spatial and Temporal Variations of Aridity Indices in Iraq. Theor. Appl. Climatol. 2018, 133, 89–99. [Google Scholar] [CrossRef]
- Moral, F.J.; Rebollo, F.J.; Paniagua, L.L.; García-Martín, A.; Honorio, F. Spatial Distribution and Comparison of Aridity Indices in Extremadura, Southwestern Spain. Theor. Appl. Climatol. 2016, 126, 801–814. [Google Scholar] [CrossRef]
- Milentijević, N.; Dragojlović, J.; Ristić, D.; Cimbaljević, M.; Demirović, D.; Valjarević, A. The Assessment of Aridity in Leskovac Basin, Serbia (1981–2010). J. Geogr. Inst. Jovan Cvijic SASA 2018, 68, 249–264. [Google Scholar] [CrossRef]
- Radaković, M.G.; Tošić, I.; Bačević, N.; Mladjan, D.; Gavrilov, M.B.; Marković, S.B. The Analysis of Aridity in Central Serbia from 1949 to 2015. Theor. Appl. Climatol. 2018, 133, 887–898. [Google Scholar] [CrossRef]
- Gavrilov, M.B.; An, W.; Xu, C.; Radaković, M.G.; Hao, Q.; Yang, F.; Guo, Z.; Perić, Z.; Gavrilov, G.; Marković, S.B. Independent Aridity and Drought Pieces of Evidence Based on Meteorological Data and Tree Ring Data in Southeast Banat, Vojvodina, Serbia. Atmosphere 2019, 10, 586. [Google Scholar] [CrossRef] [Green Version]
- Ramachandran, A.; Praveen, D.; Jaganathan, R.; Palanivelu, K. Projected and Observed Aridity and Climate Change in the East Coast of South India under RCP 4.5. Sci. World J. 2015, 2015, e169761. [Google Scholar] [CrossRef] [PubMed]
- Sarma, R.; Singh, D.K. Spatio-Temporal Analysis of Drought and Aridity in Gomti Basin. Curr. Sci. 2019, 116, 919–925. [Google Scholar] [CrossRef]
- El Kenawy, A.M.; McCabe, M.F.; Vicente-Serrano, S.M.; Robaa, S.M.; Lopez-Moreno, J.I. Recent Changes in Continentality and Aridity Conditions over the Middle East and North Africa Region, and Their Association with Circulation Patterns. Clim. Res. 2016, 69, 25–43. [Google Scholar] [CrossRef] [Green Version]
- Pellicone, G.; Caloiero, T.; Guagliardi, I. The De Martonne Aridity Index in Calabria (Southern Italy). J. Maps 2019, 15, 788–796. [Google Scholar] [CrossRef]
- Cheval, S.; Dumitrescu, A.; Birsan, M.-V. Variability of the Aridity in the South-Eastern Europe over 1961–2050. Catena 2017, 151, 74–86. [Google Scholar] [CrossRef]
- De Martonne, E. Aerisme, et Índices d’aridite. C. R. Acad. Sci. 1926, 182, 1395–1398. [Google Scholar]
- Zambakas, J. General Climatology; Department of Geology, National & Kapodistrian University of Athens: Athens, Greece, 1992. [Google Scholar]
- Erinç, S. An Attempt on Precipitation Efficiency and a New Index; Istanbul University Institute Release, Baha Press: Istanbul, Turkey, 1965. [Google Scholar]
- Taylor, K.E.; Stouffer, R.J.; Meehl, G.A. An Overview of CMIP5 and the Experiment Design. Bull. Am. Meteorol. Soc. 2012, 93, 485–498. [Google Scholar] [CrossRef] [Green Version]
- Moss, R.H.; Edmonds, J.A.; Hibbard, K.A.; Manning, M.R.; Rose, S.K.; van Vuuren, D.P.; Carter, T.R.; Emori, S.; Kainuma, M.; Kram, T.; et al. The next Generation of Scenarios for Climate Change Research and Assessment. Nature 2010, 463, 747–756. [Google Scholar] [CrossRef]
- Van Vuuren, D.P.; Edmonds, J.; Kainuma, M.; Riahi, K.; Thomson, A.; Hibbard, K.; Hurtt, G.C.; Kram, T.; Krey, V.; Lamarque, J.-F.; et al. The Representative Concentration Pathways: An Overview. Clim. Chang. 2011, 109, 5–31. [Google Scholar] [CrossRef]
- Colin, J.; Déqué, M.; Radu, R.; Somot, S. Sensitivity Study of Heavy Precipitation in Limited Area Model Climate Simulations: Influence of the Size of the Domain and the Use of the Spectral Nudging Technique. Tellus Dyn. Meteorol. Oceanogr. 2010, 62, 591–604. [Google Scholar] [CrossRef] [Green Version]
- Baldauf, M.; Seifert, A.; Förstner, J.; Majewski, D.; Raschendorfer, M.; Reinhardt, T. Operational Convective-Scale Numerical Weather Prediction with the COSMO Model: Description and Sensitivities. Mon. Weather Rev. 2011, 139, 3887–3905. [Google Scholar] [CrossRef]
- Rockel, B.; Will, A.; Hense, A. The Regional Climate Model COSMO-CLM (CCLM). Meteorol. Z. 2008, 347–348. [Google Scholar] [CrossRef]
- Bøssing Christensen, O.; Drews, M.; Christensen, J.H.; Dethloff, K.; Ketelsen, K.; Hebestadt, I.; Rinke, A. Technical Report 06-17 The HIRHAM Regional Climate Model Version 5 (β); Danish Meteorological Institute: Copenhagen, Denmark, 2007; p. 22. [Google Scholar]
- van Meijgaard, E.; van Ulft, L.H.; van de Berg, W.J.; Bosveld, F.C.; van den Hurk, B.J.J.M.; Lenderink, G.; Siebesma, A.P. The KNMI Regional Atmospheric Climate Model RACMO, Version 2.1; Koninklijk Nederlands Meteorologisch Instituut: Utrecht, The Netherlands, 2008; p. 50. [Google Scholar]
- Teichmann, C.; Eggert, B.; Elizalde, A.; Haensler, A.; Jacob, D.; Kumar, P.; Moseley, C.; Pfeifer, S.; Rechid, D.; Remedio, A.R.; et al. How Does a Regional Climate Model Modify the Projected Climate Change Signal of the Driving GCM: A Study over Different CORDEX Regions Using REMO. Atmosphere 2013, 4, 214–236. [Google Scholar] [CrossRef] [Green Version]
- IIPSL-INERIS. Cordex EUR-11 IPSL-INERIS WRF331F. World Data Center for Climate (WDCC) at DKRZ. 2017. Available online: http://cera-www.dkrz.de/WDCC/ui/Compact.jsp?acronym=CXEU11IPWF (accessed on 19 July 2021).
- Cornes, R.C.; van der Schrier, G.; van den Besselaar, E.J.M.; Jones, P.D. An Ensemble Version of the E-OBS Temperature and Precipitation Data Sets. J. Geophys. Res. Atmos. 2018, 123, 9391–9409. [Google Scholar] [CrossRef] [Green Version]
- Amengual, A.; Homar, V.; Romero, R.; Alonso, S.; Ramis, C. A Statistical Adjustment of Regional Climate Model Outputs to Local Scales: Application to Platja de Palma, Spain. J. Clim. 2012, 25, 939–957. [Google Scholar] [CrossRef] [Green Version]
- Maraun, D. Bias Correction, Quantile Mapping, and Downscaling: Revisiting the Inflation Issue. J. Clim. 2013, 26, 2137–2143. [Google Scholar] [CrossRef] [Green Version]
- Hrnjak, I.; Lukić, T.; Gavrilov, M.B.; Marković, S.B.; Unkašević, M.; Tošić, I. Aridity in Vojvodina, Serbia. Theor. Appl. Climatol. 2014, 115, 323–332. [Google Scholar] [CrossRef]
- Wilcoxon, F. Individual Comparisons by Ranking Methods. Biom. Bull. 1945, 1, 80–83. [Google Scholar] [CrossRef]
- Mann, H.B.; Whitney, D.R. On a Test of Whether One of Two Random Variables Is Stochastically Larger than the Other. Ann. Math. Stat. 1947, 18, 50–60. [Google Scholar] [CrossRef]
- Jacob, D.; Petersen, J.; Eggert, B.; Alias, A.; Christensen, O.B.; Bouwer, L.M.; Braun, A.; Colette, A.; Déqué, M.; Georgievski, G.; et al. EURO-CORDEX: New High-Resolution Climate Change Projections for European Impact Research. Reg. Environ. Chang. 2014, 14, 563–578. [Google Scholar] [CrossRef]
- Santos, M.; Fonseca, A.; Fragoso, M.; Santos, J.A. Recent and Future Changes of Precipitation Extremes in Mainland Portugal. Theor. Appl. Climatol. 2019, 137, 1305–1319. [Google Scholar] [CrossRef]
- Hertig, E.; Maraun, D.; Bartholy, J.; Pongracz, R.; Vrac, M.; Mares, I.; Gutiérrez, J.M.; Wibig, J.; Casanueva, A.; Soares, P.M.M. Comparison of Statistical Downscaling Methods with Respect to Extreme Events over Europe: Validation Results from the Perfect Predictor Experiment of the COST Action VALUE. Int. J. Climatol. 2019, 39, 3846–3867. [Google Scholar] [CrossRef]
- Santos, J.A.; Andrade, C.; Corte-Real, J.; Leite, S. The Role of Large-Scale Eddies in the Occurrence of Winter Precipitation Deficits in Portugal. Int. J. Climatol. 2009, 29, 1493–1507. [Google Scholar] [CrossRef]
- Casanueva, A.; Rodríguez-Puebla, C.; Frías, M.D.; González-Reviriego, N. Variability of Extreme Precipitation over Europe and Its Relationships with Teleconnection Patterns. Hydrol. Earth Syst. Sci. 2014, 18, 709–725. [Google Scholar] [CrossRef] [Green Version]
- Fleig, A.K.; Tallaksen, L.M.; James, P.; Hisdal, H.; Stahl, K. Attribution of European Precipitation and Temperature Trends to Changes in Synoptic Circulation. Hydrol. Earth Syst. Sci. 2015, 19, 3093–3107. [Google Scholar] [CrossRef] [Green Version]
- Cortesi, N.; Gonzalez-Hidalgo, J.C.; Trigo, R.M.; Ramos, A.M. Weather Types and Spatial Variability of Precipitation in the Iberian Peninsula. Int. J. Climatol. 2014, 34, 2661–2677. [Google Scholar] [CrossRef]
- Santos, J.A.; Belo-Pereira, M.; Fraga, H.; Pinto, J.G. Understanding Climate Change Projections for Precipitation over Western Europe with a Weather Typing Approach. J. Geophys. Res. Atmospheres 2016, 121, 1170–1189. [Google Scholar] [CrossRef] [Green Version]
- Scoccimarro, E.; Villarini, G.; Vichi, M.; Zampieri, M.; Fogli, P.G.; Bellucci, A.; Gualdi, S. Projected Changes in Intense Precipitation over Europe at the Daily and Subdaily Time Scales. J. Clim. 2015, 28, 6193–6203. [Google Scholar] [CrossRef]
- Viceto, C.; Cardoso Pereira, S.; Rocha, A. Climate Change Projections of Extreme Temperatures for the Iberian Peninsula. Atmosphere 2019, 10, 229. [Google Scholar] [CrossRef] [Green Version]
- Andrade, C.; Leite, S.M.; Santos, J.A. Temperature Extremes in Europe: Overview of Their Driving Atmospheric Patterns. Nat. Hazards Earth Syst. Sci. 2012, 12, 1671–1691. [Google Scholar] [CrossRef] [Green Version]
- Heinrich, G.; Gobiet, A. The Future of Dry and Wet Spells in Europe: A Comprehensive Study Based on the ENSEMBLES Regional Climate Models. Int. J. Climatol. 2012, 32, 1951–1970. [Google Scholar] [CrossRef]
- Andrade, C.; Contente, J.; Santos, J.A. Climate Change Projections of Dry and Wet Events in Iberia Based on the WASP-Index. Climate 2021, 9, 94. [Google Scholar] [CrossRef]
- Georgieva, V.; Shopova, N.; Kazandjiev, V. Assessment of Conditions in South Bulgaria for Spring Crop Growing Using Agrometeorological Indices. AIP Conf. Proc. 2019, 2075, 120014. [Google Scholar] [CrossRef]
- Fraga, H.; Pinto, J.G.; Viola, F.; Santos, J.A. Climate Change Projections for Olive Yields in the Mediterranean Basin. Int. J. Climatol. 2020, 40, 769–781. [Google Scholar] [CrossRef] [Green Version]
- Fraga, H.; Moriondo, M.; Leolini, L.; Santos, J.A. Mediterranean Olive Orchards under Climate Change: A Review of Future Impacts and Adaptation Strategies. Agronomy 2021, 11, 56. [Google Scholar] [CrossRef]
- Yang, C.; Fraga, H.; van Ieperen, W.; Santos, J.A. Assessing the Impacts of Recent-Past Climatic Constraints on Potential Wheat Yield and Adaptation Options under Mediterranean Climate in Southern Portugal. Agric. Syst. 2020, 182, 102844. [Google Scholar] [CrossRef]
- Fraga, H.; García de Cortázar Atauri, I.; Santos, J.A. Viticultural Irrigation Demands under Climate Change Scenarios in Portugal. Agric. Water Manag. 2018, 196, 66–74. [Google Scholar] [CrossRef]
- Santos, J.A.; Fraga, H.; Malheiro, A.C.; Moutinho-Pereira, J.; Dinis, L.-T.; Correia, C.; Moriondo, M.; Leolini, L.; Dibari, C.; Costafreda-Aumedes, S.; et al. A Review of the Potential Climate Change Impacts and Adaptation Options for European Viticulture. Appl. Sci. 2020, 10, 3092. [Google Scholar] [CrossRef]
Figure 1.
Methodological schematics of this study.

Figure 2.
Total annual precipitation (mm) anomalies (Mann–Whitney–Wilcoxon test at a 5% significance level) for the period (a,b) 2011–2040, (c,d) 2041–2070, with respect to the baseline climate (1961–1990), under RCP4.5 (left) and RCP8.5 (right).
Figure 2.
Total annual precipitation (mm) anomalies (Mann–Whitney–Wilcoxon test at a 5% significance level) for the period (a,b) 2011–2040, (c,d) 2041–2070, with respect to the baseline climate (1961–1990), under RCP4.5 (left) and RCP8.5 (right).

Figure 3.
Annual mean temperature (°C) anomalies (Mann–Whitney–Wilcoxon test at a 5% significance level) for the period (a,b) 2011–2040, (c,d) 2041–2070, with respect to the baseline climate (1961–1990), under RCP4.5 (left) and RCP8.5 (right).
Figure 3.
Annual mean temperature (°C) anomalies (Mann–Whitney–Wilcoxon test at a 5% significance level) for the period (a,b) 2011–2040, (c,d) 2041–2070, with respect to the baseline climate (1961–1990), under RCP4.5 (left) and RCP8.5 (right).

Figure 4.
The De Martonne Aridity Index (DMI) spatial distribution for the Iberian Peninsula for the period (a) 1961–1990, (b,c) 2011–2040, and (d,e) 2041–2070, under RCP4.5 (left) and RCP8.5 (right).
Figure 4.
The De Martonne Aridity Index (DMI) spatial distribution for the Iberian Peninsula for the period (a) 1961–1990, (b,c) 2011–2040, and (d,e) 2041–2070, under RCP4.5 (left) and RCP8.5 (right).

Figure 5.
DMI anomalies (Mann–Whitney–Wilcoxon test at a 5% significance level) for the period (a,b) 2011–2040, (c,d) 2041–2070, with respect to the baseline climate (1961–1990), under RCP4.5 (left) and RCP8.5 (right).
Figure 5.
DMI anomalies (Mann–Whitney–Wilcoxon test at a 5% significance level) for the period (a,b) 2011–2040, (c,d) 2041–2070, with respect to the baseline climate (1961–1990), under RCP4.5 (left) and RCP8.5 (right).

Figure 6.
The Pinna Combinative Index (PCI) spatial distribution for the Iberian Peninsula for the period (a) 1961–1990, (b,c) 2011–2040, and (d,e) 2041–2070 under RCP4.5 (left) and RCP8.5 (right) scenarios.
Figure 6.
The Pinna Combinative Index (PCI) spatial distribution for the Iberian Peninsula for the period (a) 1961–1990, (b,c) 2011–2040, and (d,e) 2041–2070 under RCP4.5 (left) and RCP8.5 (right) scenarios.

Figure 7.
PCI anomalies (Mann–Whitney–Wilcoxon test at a 5% significance level) for the period (a,b) 2011–2040, (c,d) 2041–2070, with respect to the baseline climate (1961–1990), under RCP4.5 (left) and RCP8.5 (right).
Figure 7.
PCI anomalies (Mann–Whitney–Wilcoxon test at a 5% significance level) for the period (a,b) 2011–2040, (c,d) 2041–2070, with respect to the baseline climate (1961–1990), under RCP4.5 (left) and RCP8.5 (right).

Figure 8.
The Erinç Aridity Index (EAI) spatial distribution for the Iberian Peninsula for the period (a) 1961–1990, (b,c) 2011–2040, and (d,e) 2041–2070 under RCP4.5 (left) and RCP8.5 (right) scenarios.
Figure 8.
The Erinç Aridity Index (EAI) spatial distribution for the Iberian Peninsula for the period (a) 1961–1990, (b,c) 2011–2040, and (d,e) 2041–2070 under RCP4.5 (left) and RCP8.5 (right) scenarios.

Figure 9.
EAI anomalies (Mann–Whitney–Wilcoxon test at a 5% significance level) for the period (a,b) 2011–2040, (c,d) 2041–2070, with respect to the baseline climate (1961–1990), under RCP4.5 (left) and RCP8.5 (right).
Figure 9.
EAI anomalies (Mann–Whitney–Wilcoxon test at a 5% significance level) for the period (a,b) 2011–2040, (c,d) 2041–2070, with respect to the baseline climate (1961–1990), under RCP4.5 (left) and RCP8.5 (right).

Figure 10.
Frequency of occurrence (in %) of (a) SD conditions for DMI, (b,c) D conditions for PCI, (d,e) A, and (f,g) SA conditions for EAI for 2041–2070, under RCP4.5 (left) and RCP8.5 (right).
Figure 10.
Frequency of occurrence (in %) of (a) SD conditions for DMI, (b,c) D conditions for PCI, (d,e) A, and (f,g) SA conditions for EAI for 2041–2070, under RCP4.5 (left) and RCP8.5 (right).


Table 1.
Acronyms of the selected regional climate models (RCM) and their corresponding driving global climate models (GCM), along with the contributor institutions for the simulations.
Table 1.
Acronyms of the selected regional climate models (RCM) and their corresponding driving global climate models (GCM), along with the contributor institutions for the simulations.
| RCM, References | GCM | Contributor |
|---|---|---|
| ALADIN53, [44] | CNRM-CM5 | Météo France, CNRM |
| CCLM4-8-17, [45,46] | ICHEC-EC-EARTH | Climate Limited-area Modelling Community, CLMcom |
| HIRHAM5, [47] | ICHEC-EC-EARTH | Danish Meteorological Institute, DMI |
| RACMO22E, [48] | ICHEC-EC-EARTH | Royal Netherlands Meteorological Institute, KNMI |
| REMO2009, [49] | MPI-ESM-LR | Max Planck Institute for Meteorology, MPI-CSC |
| WRF331F, [50] | IPSL-CM5A-MR | Institute Pierre-Simon Laplace, IPSL-INERIS |
Table 2.
Climatic classification for the De Martonne Aridity Index (DMI), the Pinna Combinative Index (PCI), and the Erinç Aridity Index (EAI).
Table 2.
Climatic classification for the De Martonne Aridity Index (DMI), the Pinna Combinative Index (PCI), and the Erinç Aridity Index (EAI).
| Index | Climate Type | Abbr. | Index Values | P Values (mm) |
|---|---|---|---|---|
| DMI | Dry | D | DMI < 10 | P < 200 |
| Semi-dry | SD | 10 ≤ DMI < 20 | 200 ≤ P < 400 | |
| Mediterranean | M | 20 ≤ DMI < 24 | 400 ≤ P < 500 | |
| Semi-humid | SH | 24 ≤ DMI < 28 | 500 ≤ P < 600 | |
| Humid | H | 28 ≤ DMI < 35 | 600 ≤ P < 700 | |
| Very humid | VH | 35 ≤ DMI ≤ 55 | 700 ≤ P < 800 | |
| Excessively humid | EH | DMI > 55 | P ≥ 800 | |
| PCI | Dry | D | PCI < 10 | |
| Semi-dry | SD | 10 ≤ PCI ≤ 20 | ||
| Humid | H | PCI > 20 | ||
| EAI | Severe arid | SvA | EAI ≤ 8 | |
| Arid | A | 8 < EAI ≤ 15 | ||
| Semi-arid | SA | 15 < EAI ≤ 23 | ||
| Semi-humid | SH | 23 < EAI ≤ 40 | ||
| Humid | H | 40 < EAI ≤ 55 | ||
| Perhumid | PH | EAI > 55 |
Table 3.
Percentage of the territory for each climate of the De Martonne Aridity Index (DMI), the Pinna Combinative Index (PCI), and the Erinç Aridity Index (EAI) for 1961–1990 and 2011–2040 and 2041–2070 under RCP4.5 and RCP8.5 (note that Δ = 2041–2070–1961–1990 in %).
Table 3.
Percentage of the territory for each climate of the De Martonne Aridity Index (DMI), the Pinna Combinative Index (PCI), and the Erinç Aridity Index (EAI) for 1961–1990 and 2011–2040 and 2041–2070 under RCP4.5 and RCP8.5 (note that Δ = 2041–2070–1961–1990 in %).
| Index | Climatic Classification | Climatic Characteristics | 1961–1990 | 2011–2040 | 2041–2070 | |||||||
|---|---|---|---|---|---|---|---|---|---|---|---|---|
| RCP4.5 | RCP8.5 | RCP4.5 | RCP8.5 | |||||||||
| (a) | (b) | % (a) | % (b) | % (a) | % (a) | % (a) | % (b) | % Δ(a) | % (b) | % (a) | % Δ(a) | |
| DMI | D | DC | 0.9 | 34.3 | 1.8 | 1.5 | 2.5 | 47.2 | 12.9 | 3.2 | 50.6 | 16.3 |
| SD | 33.4 | 41.4 | 41.3 | 44.7 | 47.4 | |||||||
| M | MC | 23.0 | 23.0 | 18.3 | 18.8 | 16.7 | 16.7 | −6.3 | 14.4 | 14.4 | −8.6 | |
| SH | HC | 9.8 | 42.7 | 7.7 | 7.6 | 7.2 | 36.1 | −6.6 | 7.2 | 35.0 | −7.7 | |
| H | 9.0 | 8.1 | 8.2 | 7.1 | 6.5 | |||||||
| VH | 16.4 | 15.9 | 16.1 | 16.3 | 16.4 | |||||||
| EH | 7.5 | 6.8 | 6.5 | 5.5 | 4.9 | |||||||
| PCI | D | DC | 34.3 | 80.7 | 30.4 | 30.5 | 35.5 | 76.3 | −4.4 | 40.1 | 76.8 | −3.9 |
| SD | 46.4 | 44.2 | 44.7 | 40.8 | 36.7 | |||||||
| H | HC | 19.3 | 19.3 | 25.4 | 24.8 | 23.7 | 23.7 | 4.4 | 23.2 | 23.2 | 3.9 | |
| EAI | SvA | AC | 0 | 28.4 | 0 | 0 | 0 | 33.8 | 5.4 | 0.1 | 39.1 | 10.7 |
| A | 2.1 | 4.6 | 4.5 | 5.3 | 6.1 | |||||||
| SA | 26.3 | 25.0 | 24.8 | 28.5 | 32.9 | |||||||
| SH | HC | 43.4 | 71.6 | 41.2 | 41.7 | 38.8 | 66.2 | −5.4 | 34.7 | 60.9 | −10.7 | |
| H | 10.4 | 9.1 | 9.2 | 8.7 | 8.4 | |||||||
| PH | 17.8 | 20.1 | 19.8 | 18.7 | 17.8 | |||||||
Publisher’s Note: MDPI stays neutral with regard to jurisdictional claims in published maps and institutional affiliations. |
© 2021 by the authors. Licensee MDPI, Basel, Switzerland. This article is an open access article distributed under the terms and conditions of the Creative Commons Attribution (CC BY) license (https://creativecommons.org/licenses/by/4.0/).
Share and Cite
MDPI and ACS Style
Andrade, C.; Contente, J.; Santos, J.A. Climate Change Projections of Aridity Conditions in the Iberian Peninsula. Water 2021, 13, 2035. https://doi.org/10.3390/w13152035
AMA Style
Andrade C, Contente J, Santos JA. Climate Change Projections of Aridity Conditions in the Iberian Peninsula. Water. 2021; 13(15):2035. https://doi.org/10.3390/w13152035
Chicago/Turabian StyleAndrade, Cristina, Joana Contente, and João Andrade Santos. 2021. "Climate Change Projections of Aridity Conditions in the Iberian Peninsula" Water 13, no. 15: 2035. https://doi.org/10.3390/w13152035
Note that from the first issue of 2016, this journal uses article numbers instead of page numbers. See further details here.