
A Numerical Study of the Flow and Sediment Interaction in the Middle Reach of the Huai River

Key Laboratory of Water Conservancy and Water Resources in Anhui Province, Anhui & Huai River Institute of Hydraulic Research, Bengbu 233000, China
*
Author to whom correspondence should be addressed.
†
Current address: Environmental Systems Engineering, University of Regina, Regina, SK S4S 0A2, Canada.
Water 2021, 13(15), 2041; https://doi.org/10.3390/w13152041
Submission received: 28 May 2021
/
Revised: 14 July 2021
/
Accepted: 22 July 2021
/
Published: 27 July 2021
(This article belongs to the Special Issue Fluvial Hydraulics Affected by River Ice and Hydraulic Structures)
Abstract
:In recent years, the incoming sediments from upstream of the Huai River have continuously decreased. The relationship between flow and sediment has significantly changed. Therefore, the erosion and deposition characteristics of the river could be affected. To investigate this interaction between flow and sediment, the present study was conducted using the Wanglin section in the middle reach of the Huai River as the study site. A 1D hydrodynamic model was developed and validated using field data. Data from 1985–2014 were used as a continuous series while data from 2004–2014 were used as a repetitive series. The sediment variation and distribution processes at different locations were discussed. It was found that the river channel displayed several notable characteristics. In the flow direction, the channel had frontal erosion and backward deposition. The variation rate was relatively slow. With reduced sediment, the overall deposition at the Wanglin section was significantly mitigated. Future recommendations are provided based on the present simulation for flood mitigation along the Huai River.
1. Introduction
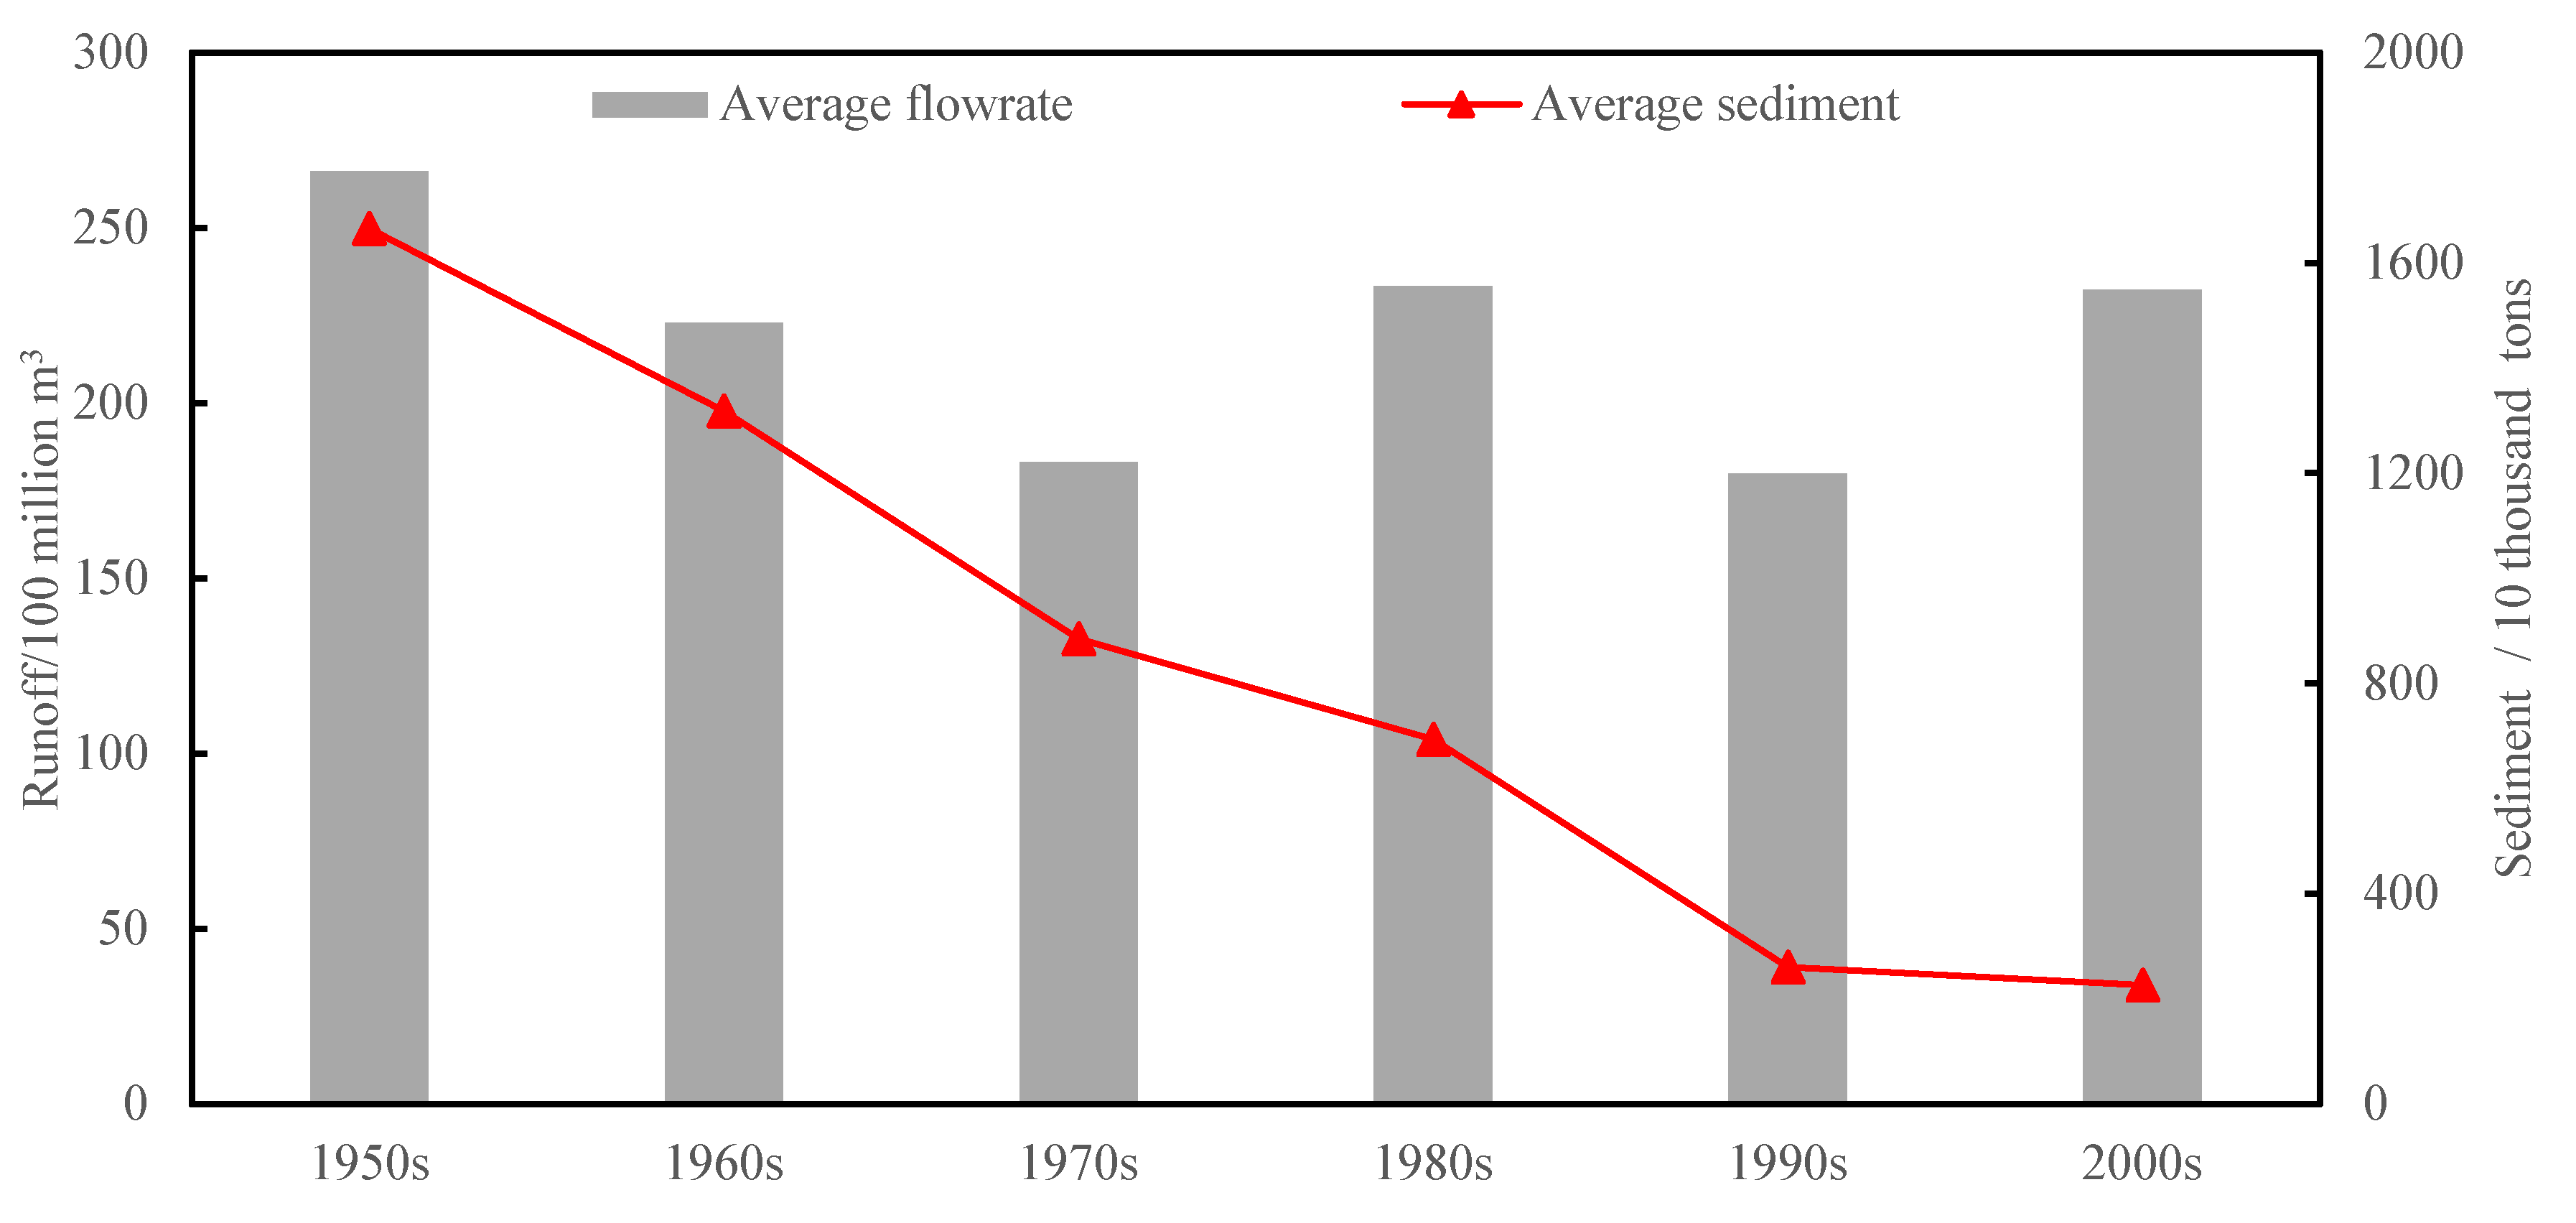
Predicting the response of natural or man-made channels to imposed supplies of flow and sediment is one of the most difficult practical problems faced by hydraulic engineers. The flow of the river moves the sediment and the channel bed is altered by erosion and the deposition of sediment. The shape of the river channel further modifies the flow. The interaction between flow and sediment is one of the primary dynamic factors in shaping riverbed channels. This complex interaction has been a continuous interest for river researchers and engineers. It plays an important role in determining erosion and deposition characteristics in natural river channels [1]. Much work has been conducted globally in the past to study the interaction between vegetation, flow and sediment [2,3,4], over grassed areas [5], and through numerical simulations [6,7]. However, few studies can be found which investigate the interaction of flow and sediment in China. A research gap was noted. In recent years, significant changes have been noted in flow and sediment interaction due to the combined effects of climate change and human activities. Some changes are noted along the middle reach of Yangtze River and the estuary of the Yellow River. The riverine ecosystems have been affected by the changes in the flow and sediment relationship. Additionally, as a major river in China, the Huai River is also notoriously vulnerable to flooding. The interaction between flow and sediment along the Huai River has been significantly changed. A significant reduction in sediment has been noted in the middle reach of the Huai River [8]. The main reasons for the reduction in sediment include: the construction of hydraulics structures, such as dams and sluices; soil conservation practice; and high-intensity sand mining. As shown in Figure 1, the average annual sediment runoff in the mainstream station of Lutaizi has decreased from 18 million tons in the 1950s to 3 million tons in 2000. However, the flow rate has remained relatively constant over the years. The decrease in sediment can have a significant impact to river channel development in the Huai River, which has received wide attention. Yu and Yu et al. [9,10,11] analyzed the erosion and deposition characteristics of the mainstream channel based on field data. It was noted that the deposition from Wangjiaba to Lutaizi was reduced, while from Lutaizi to Bengbu, the sediment movement changed from deposition to erosion. Between Bengbu and Fushan, further erosion was noted. Liu and Yang et al. [12,13], used topographic data of river cross-sections in the mainstream of the Huai River gathered over the past 70 years. It was found that the river channel erosion had been significantly increased due to sediment mining activities, which caused an uneven channel cutting in many sections of the Huai River. Moreover, with a deep cut and steep slope, river banks have a high potential of collapse, which poses a significant threat to flood control, navigation and shoreline utilizations. The behavior of sediment transport could potentially increase the flooding risk and pose a significant threat to public safety [14]. From the 1990s onwards, flood disasters in the Huai River have shown an increasing trend [15]. Investigation into the flow and water interaction in the Huai River is thus urgently needed.
Previous studies focused on the relationship between flow and sediment along the Huai River are mainly based on field data analysis or the temporal evolution of sediment movement. It is difficult to predict the long-term equilibrium sediment variation considering the many influencing parameters. The detailed characteristics of the river channel variation are not well understood. To date, many numerical models of river sedimentation have been developed. Some of the models, such as Deflt3D and EFDC, have been well applied to rivers. However, none of these models have been applied to the middle reach of the Huai River. It is also noted that in many cases, it is not reasonable to apply a 3D model to a river with a width of several hundred channels and very limited cross-sections. A 1D flow model is more appropriate [16]. In the present study, a 1D hydrodynamic model was used to investigate the interaction of flow and sediment along the Huai River using scenario analysis. The impacts of flow variation on sediment were numerical simulated, which could provide a direct insight to allow decision makers to better manage the Huai River.
2. Study Site
The middle reach of the Huai River, from Wangjiaba to Linhuagang (Wanglin section), was used as the study site for this simulation. This section is located at the transition zone between the upstream and middle reach of the river, in a region comprising mountains and plains. A higher concentration of sediment was noted in this region due to the changes in the river channel slope and velocity [13]. Additionally, a basin-wide flood occurred in this section in July 2020, with overland flooding reaching heights of 0.22–0.46 m. The flooding had a significant impact on the local economy and communities. The current flow capacity from Wangjiaba to Nanzhaoji is around 6000 m3/s, which is below the designed flow rate of 7400 m3/s. Urgent action is required to investigate the relationship between flow and sediment in order to mitigate flooding risk.
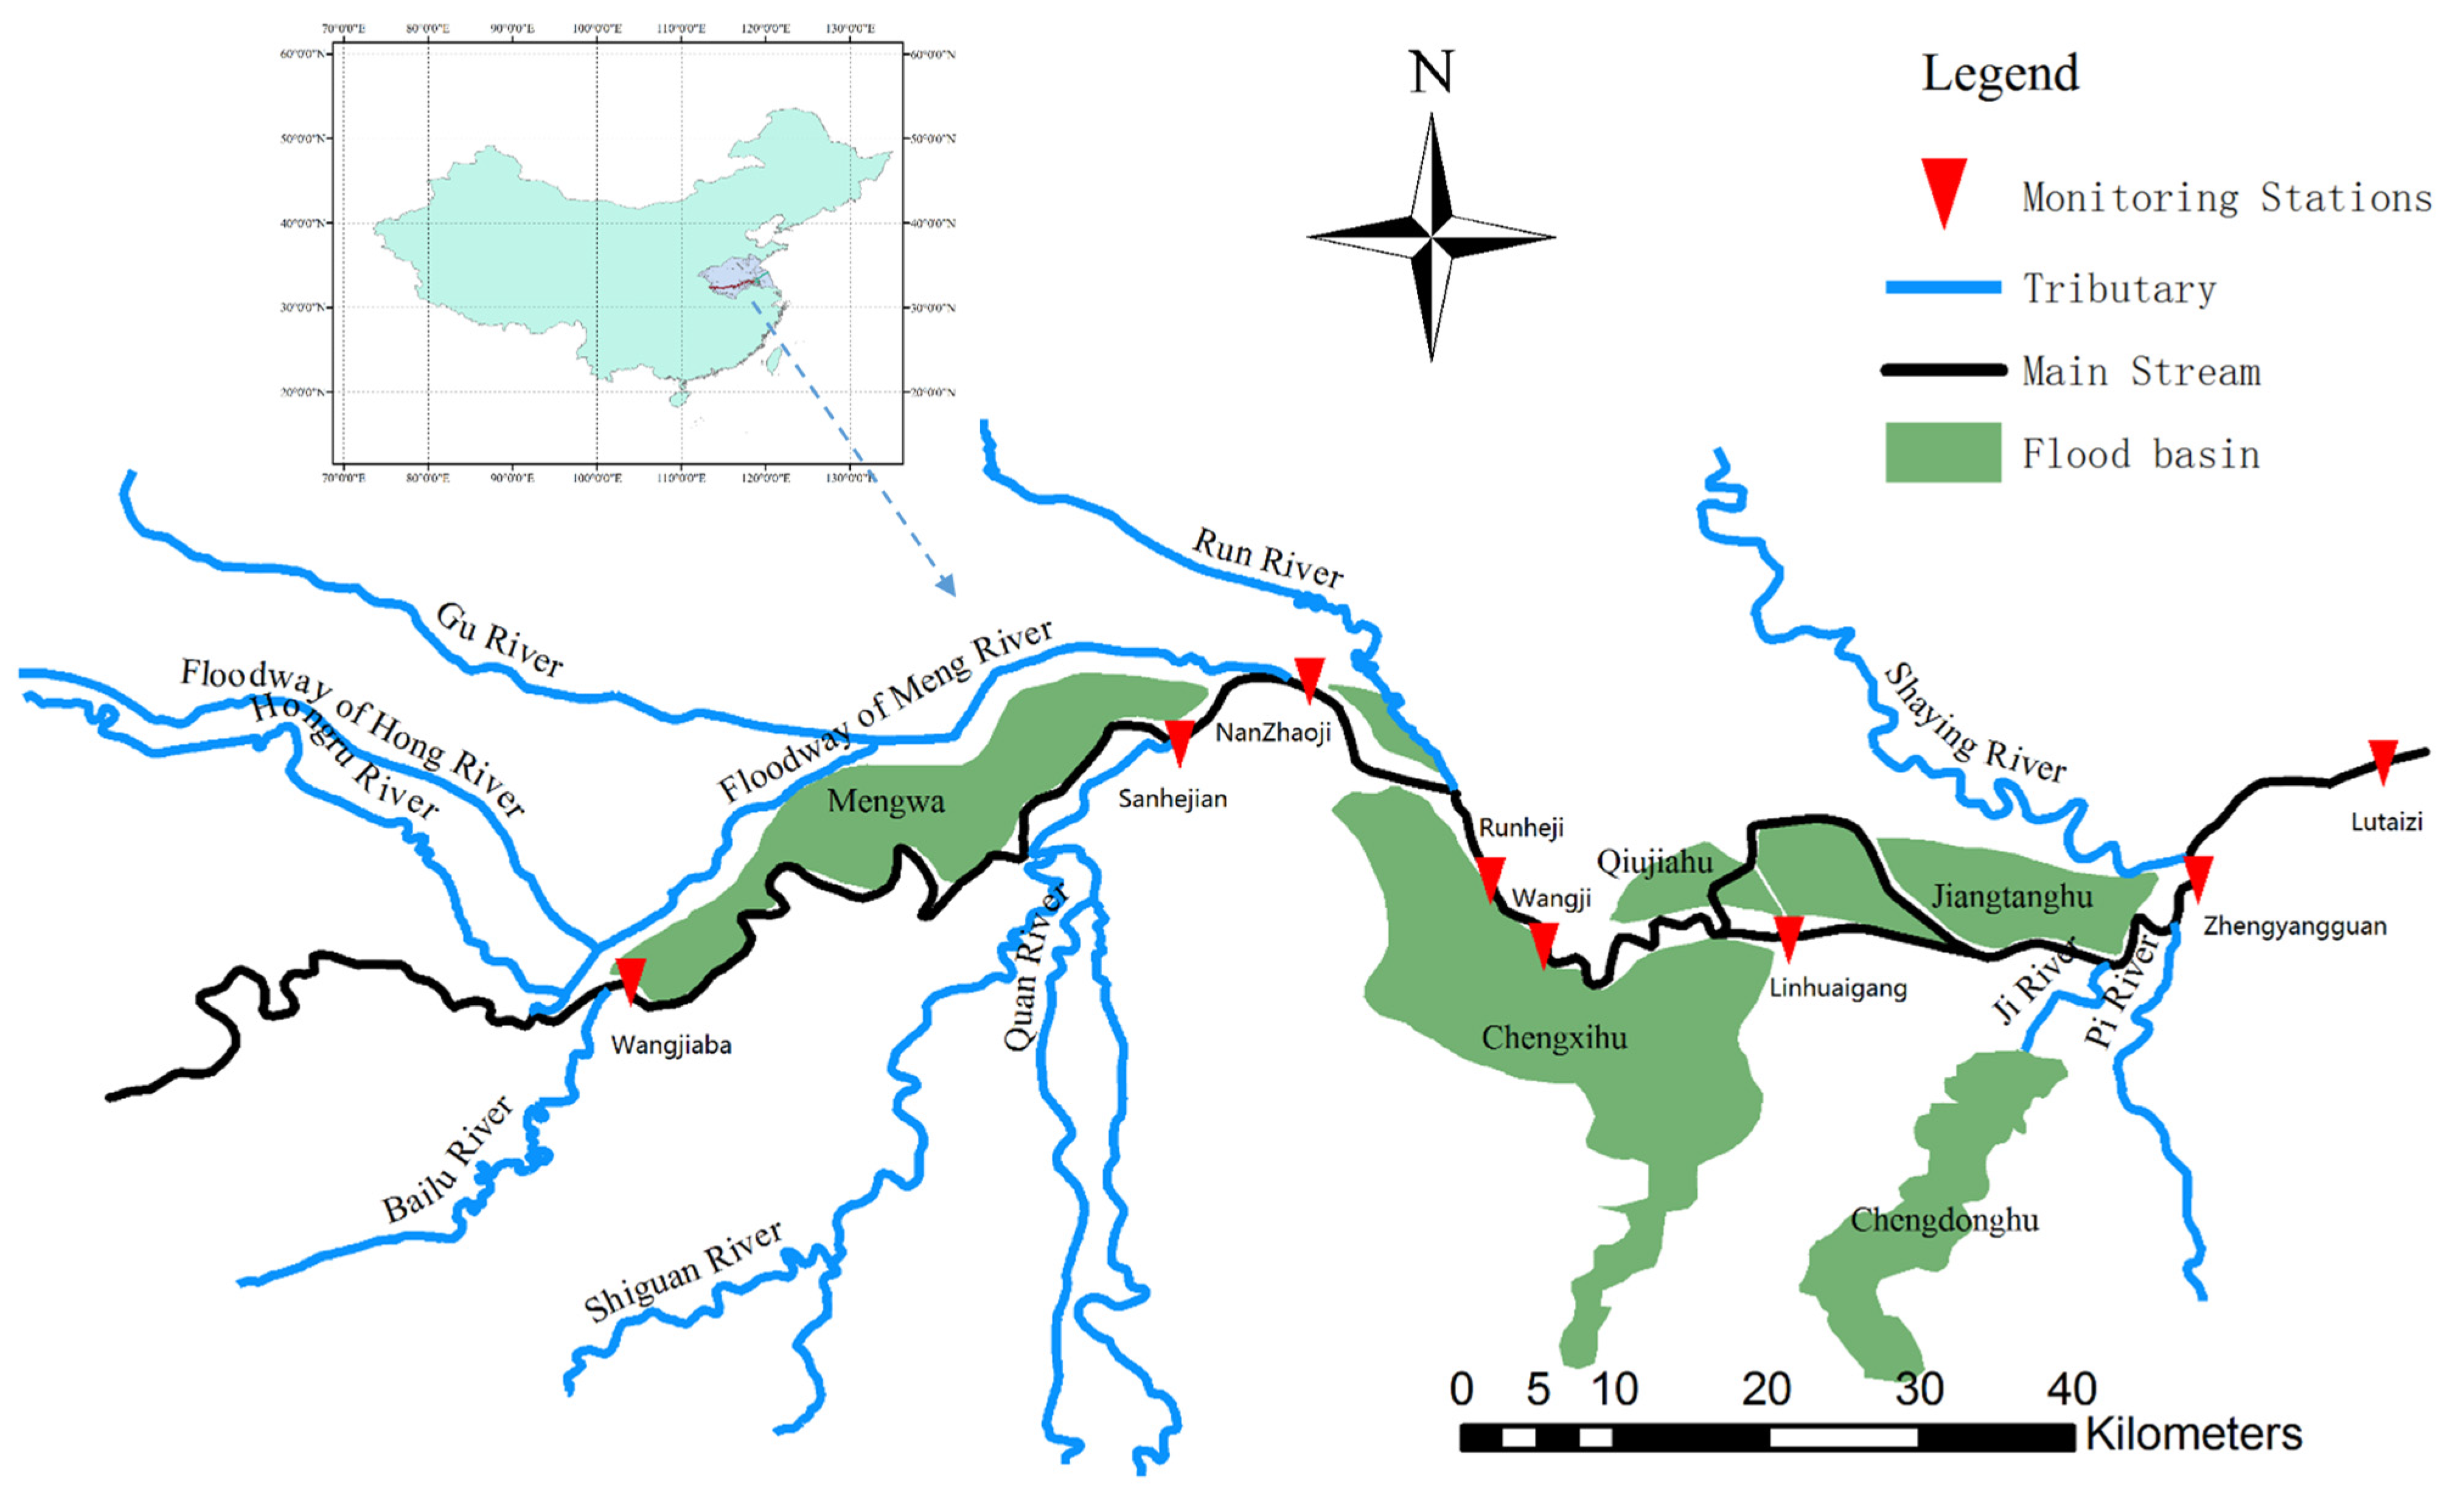
The location of the study site can be found in Figure 2. In total, the Wanglin section is 110.98 km in length, with high elevations on both sides and low elevations in the middle. The tributaries include the Hong River, the Hong River Flood Diversion Channel, the Gu River, the Run River, the Bailu River and the Shiguan River. Most of these branches are relatively short in length, but high in velocities. Both the Hong River and the Shiguan River have large watersheds compared to the other branches. In the study area, the section between Wangjiaba to Nanzhaoji is treated as a flooding basin, as shown in Figure 2. From Nanzhaoji to Linhuagang, the river channel is relatively straight. Linhuagang station is the largest water control station along the middle reach of the Huai River.
To understand the relationship between flow and incoming sediment, data from between 1985 and 2014 were collected from the following stations: Wangjiaba, Shangang, Dili and Jiangjiaji. It was found that the multiyear average flow rate at Wangjiaba is 318 m3/s, with 2.99 million tons of sediment. The flood season is from June to September, which accounts for 61% of the annual flow and 75% of the annual sediment [17,18]. To further present the relationship between flow rate and sediment yield in the study site, the K-mean method was used, which can be seen in Table 1. A relationship between flow rate and sediment can be observed. The rich/medium/poor vs. rich/medium/poor is used to indicate the relationship between flow rate and sediment. A high flow rate normally has a higher sediment yield. The numerical study was conducted in order to understand the relationship between flow rate and sediment in the study site.
3. Numerical Models
3.1. Governing Equations
Many branches have been noted at the Wanglin section, as seen in Figure 2. The unsteady flow model was selected, as it achieved better accuracy in the flooding simulation and sediment calculation. Additionally, the flow in this section was dominated by suspended sediment transport. Therefore, the unsteady flow and sediment model was applied. The governing equations can be found below.
where Q is the flow rate (m3/s); Z is the water level (m); B is the water surface width (m); x is the flow path (m); t is the time (s); q is the side inflow flow rate, positive for inflow and negative for outflow (m3/s); A is the cross-sectional area (m2); n is roughness factor; α is the coefficient of momentum correction; is the component of side inlet velocity on the mainstream (m/s); and are the sediment concentration and sediment holding capacity of the group k particle size (kg/m3); is settling velocity of the group k particle size(m/s); and m are calibration parameters of sediment transport formula—gain and exponent; . is coefficient of saturation recovery; is the dry capacity of sediment (kg/m3); . is the area of deposition (m2); L(n) and M(n) are the total numbers of inlet and outlet reaches connected with branching point; and n. . and are the sediment concentration of the group k sediment grain size (kg/m3).
The model uses Visual C#2013 as the platform. The SQL Server 2012 is used as the database. The two modules used are a flow calculation module and sediment transport module. The two modules are connected using a non-coupling approach. The flow is calculated first to provide hydraulic parameters for the sediment module. The discrete solution of each module can be found in the references [19,20,21,22,23].
3.2. Model Calibration and Validation
The model was calibrated using field data from Honghekou to Lutaizi in the mainstream of the Huai River, which covers the study area of the Wanglin section. The flow rate, water level and sediment concentration data from 1999 to 2008 were used. In the present study, the aerial survey map of 1999 was adopted for model calculation.
The application of erosion and deposition in the reach of the mainstream of the Huai River below Bengbu showed that the values of some parameters in the model were relatively stable. The sediment carrying capacity index m had a value of around 0.92; the average value of is between 0.5 and 0.6. Empirical values were used for such parameters to reduce uncertainty. From the debugging and calculation, the roughness of the main channel was 0.0215 and the roughness of the bank regions was 0.034. The sediment carrying capacity coefficient ks changed with the erosion and deposition of the river channel. When sand content S was near the sand carrying capacity S*, a value of ks = 0.025 was used. Under other conditions, , in which Δk is the adjustment coefficient, which can be expressed as follows:
The perpendicular method was used to allocate the erosion and deposition area, which can be seen below [20].
In which are the thickness and width of erosion and deposition in the perpendicular direction; is the calculated erosion and deposition are of the cross-section; is the perpendicular flow depth; and c is the adjustment index, which equals to 1.5 for scouring and 0.5 for deposition.
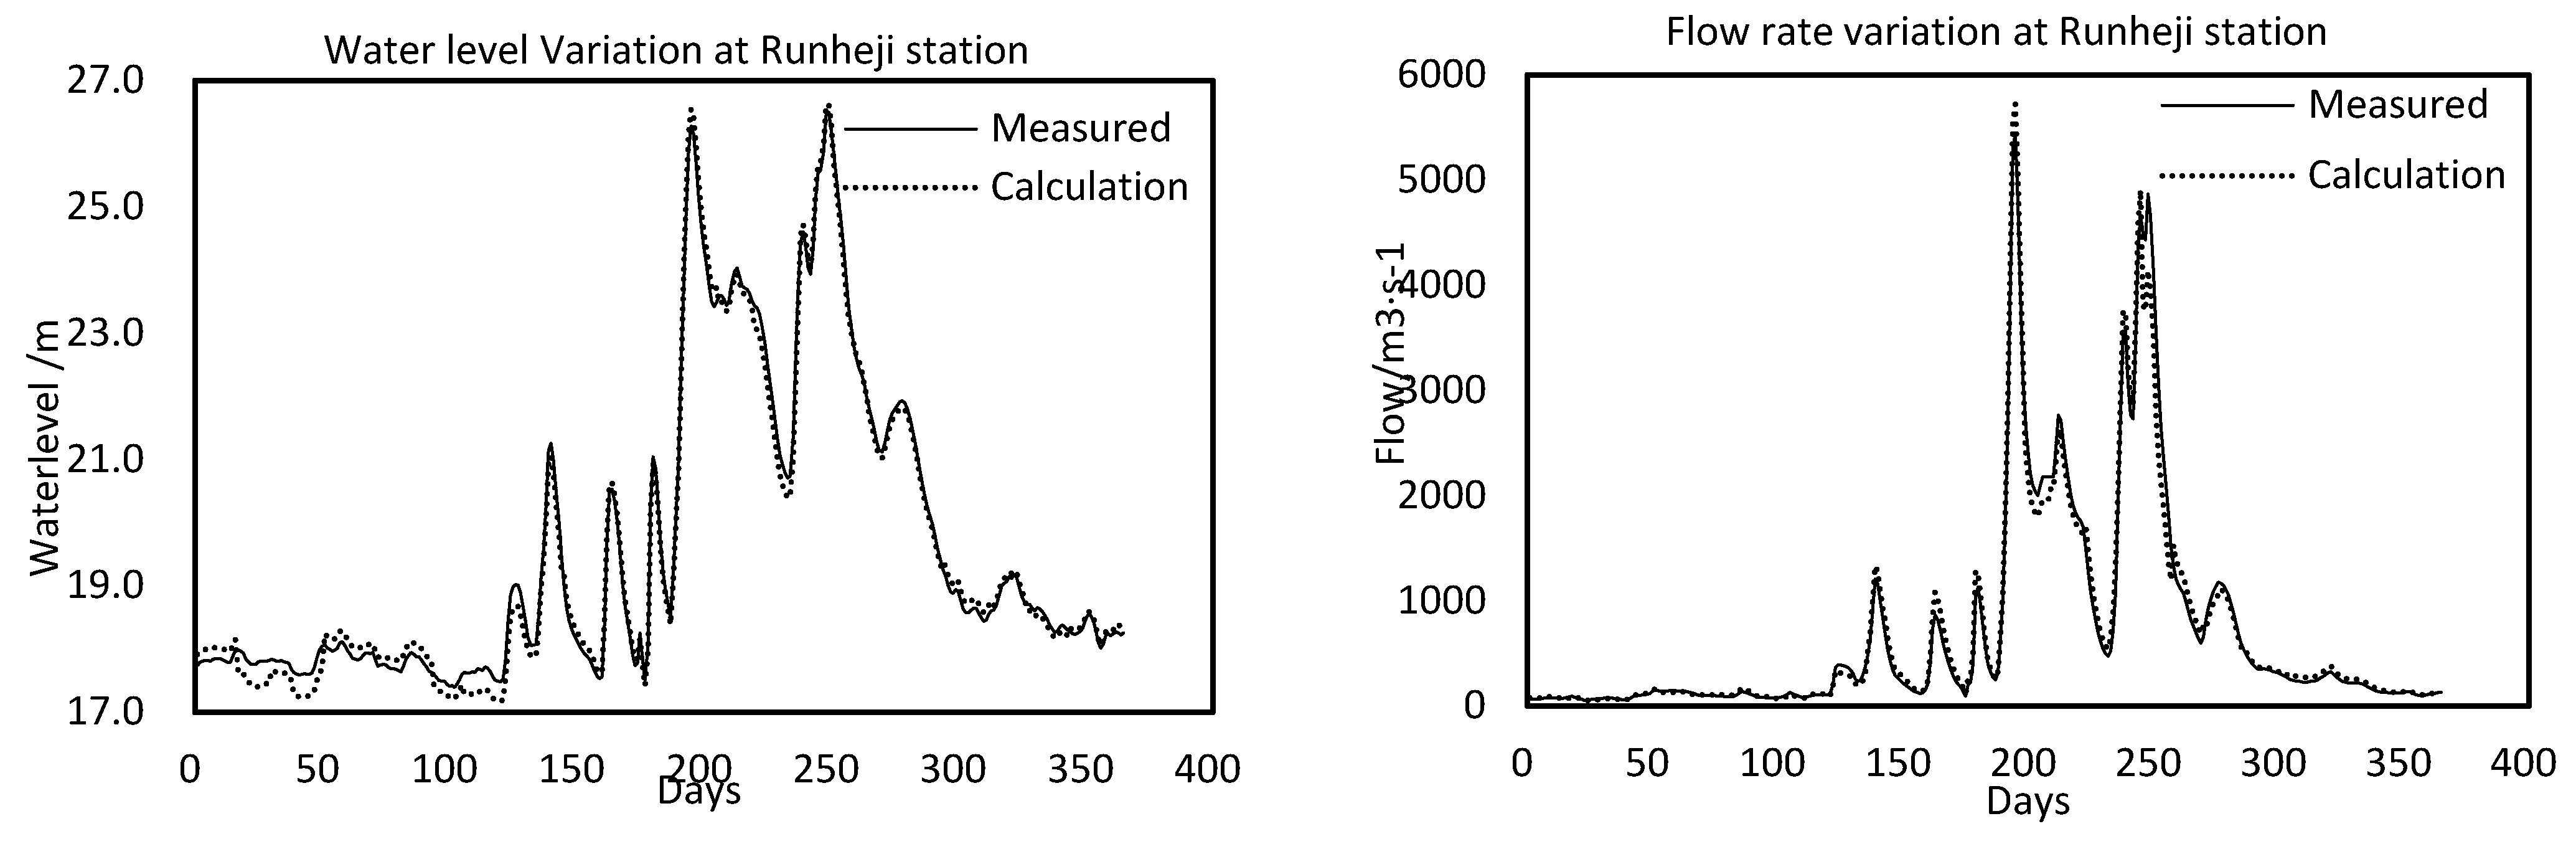
The comparison between the field data and simulation can be found in Table 2. It should be noted that for both calibration and validation, the difference between the field data and simulation is below 15%, with the exception of 2001. The 2005 data are used in Figure 3 to demonstrate the simulation results. A good agreement was reached between the simulation and field data regarding both water level and flow rate. The present model was then applied to the Wanglin section for erosion and deposition simulation.
3.3. Boundary Conditions
The computational boundary conditions were determined using a typical flow and sediment relationship for the analysis of long-term river channel variation. It was noted that the incoming sediment to the Huai River continuously decreased from 1950 onwards. After 2000, this decreasing trend stabilized. It was further analyzed, using statistical analysis, that the incoming sediment to the Huai River would be low in the next few years [24].
In the present study, the following two scenarios of flow and sediment transport rate were conducted, as shown in Table 3. Scenario 1 was a continuous series considering the flow–sediment interaction from 1985 to 2014. In this scenario, 30 years of data were used to investigate the impacts of flow–sediment interaction to river channel morphology. Scenario 1 can be used as a baseline study. Scenario 2 was a repetitive series using field data from 2000 to 2014. The collected data were repeated once to form a 30-year flow–sediment interaction. This set of data were based on the field data which showed a good indication of current situations in the Huai River, with a 17% reduction in the incoming sediment. Using this scenario, the future river channel morphology can be further predicted.
The modeling region from Wangjiaba to Linhuaigang is shown in Figure 1. From Wangji to the Meng River station, the initial topography was constructed based on the most recent measurement from 2018 with cross-sections 500 m apart. From Wangji to the Linhuagang station, the cross-section measurements from 2011 300 m apart were used. The proposed two scenarios were used regarding upstream boundary conditions, while downstream boundary condition can be analyzed using the stage-discharge relation curve at Linhuaigang station. The sediment diameter was selected from a field measurement in 2008, with d50 equal to 0.04 mm.
To ensure the stability of calculation, 300 s was used as time step. For each time step, daily data were used to calculate the flow and sediment boundary. It is noted that using the time period of 30 years was very time consuming in regard to the calculation. A threshold was used for erosion and deposition. The file was only updated when the cumulative elevation change exceeded the threshold. In the present research, a threshold of 0.05 m was used.
4. Results and Analysis
4.1. Erosion and Deposition Process
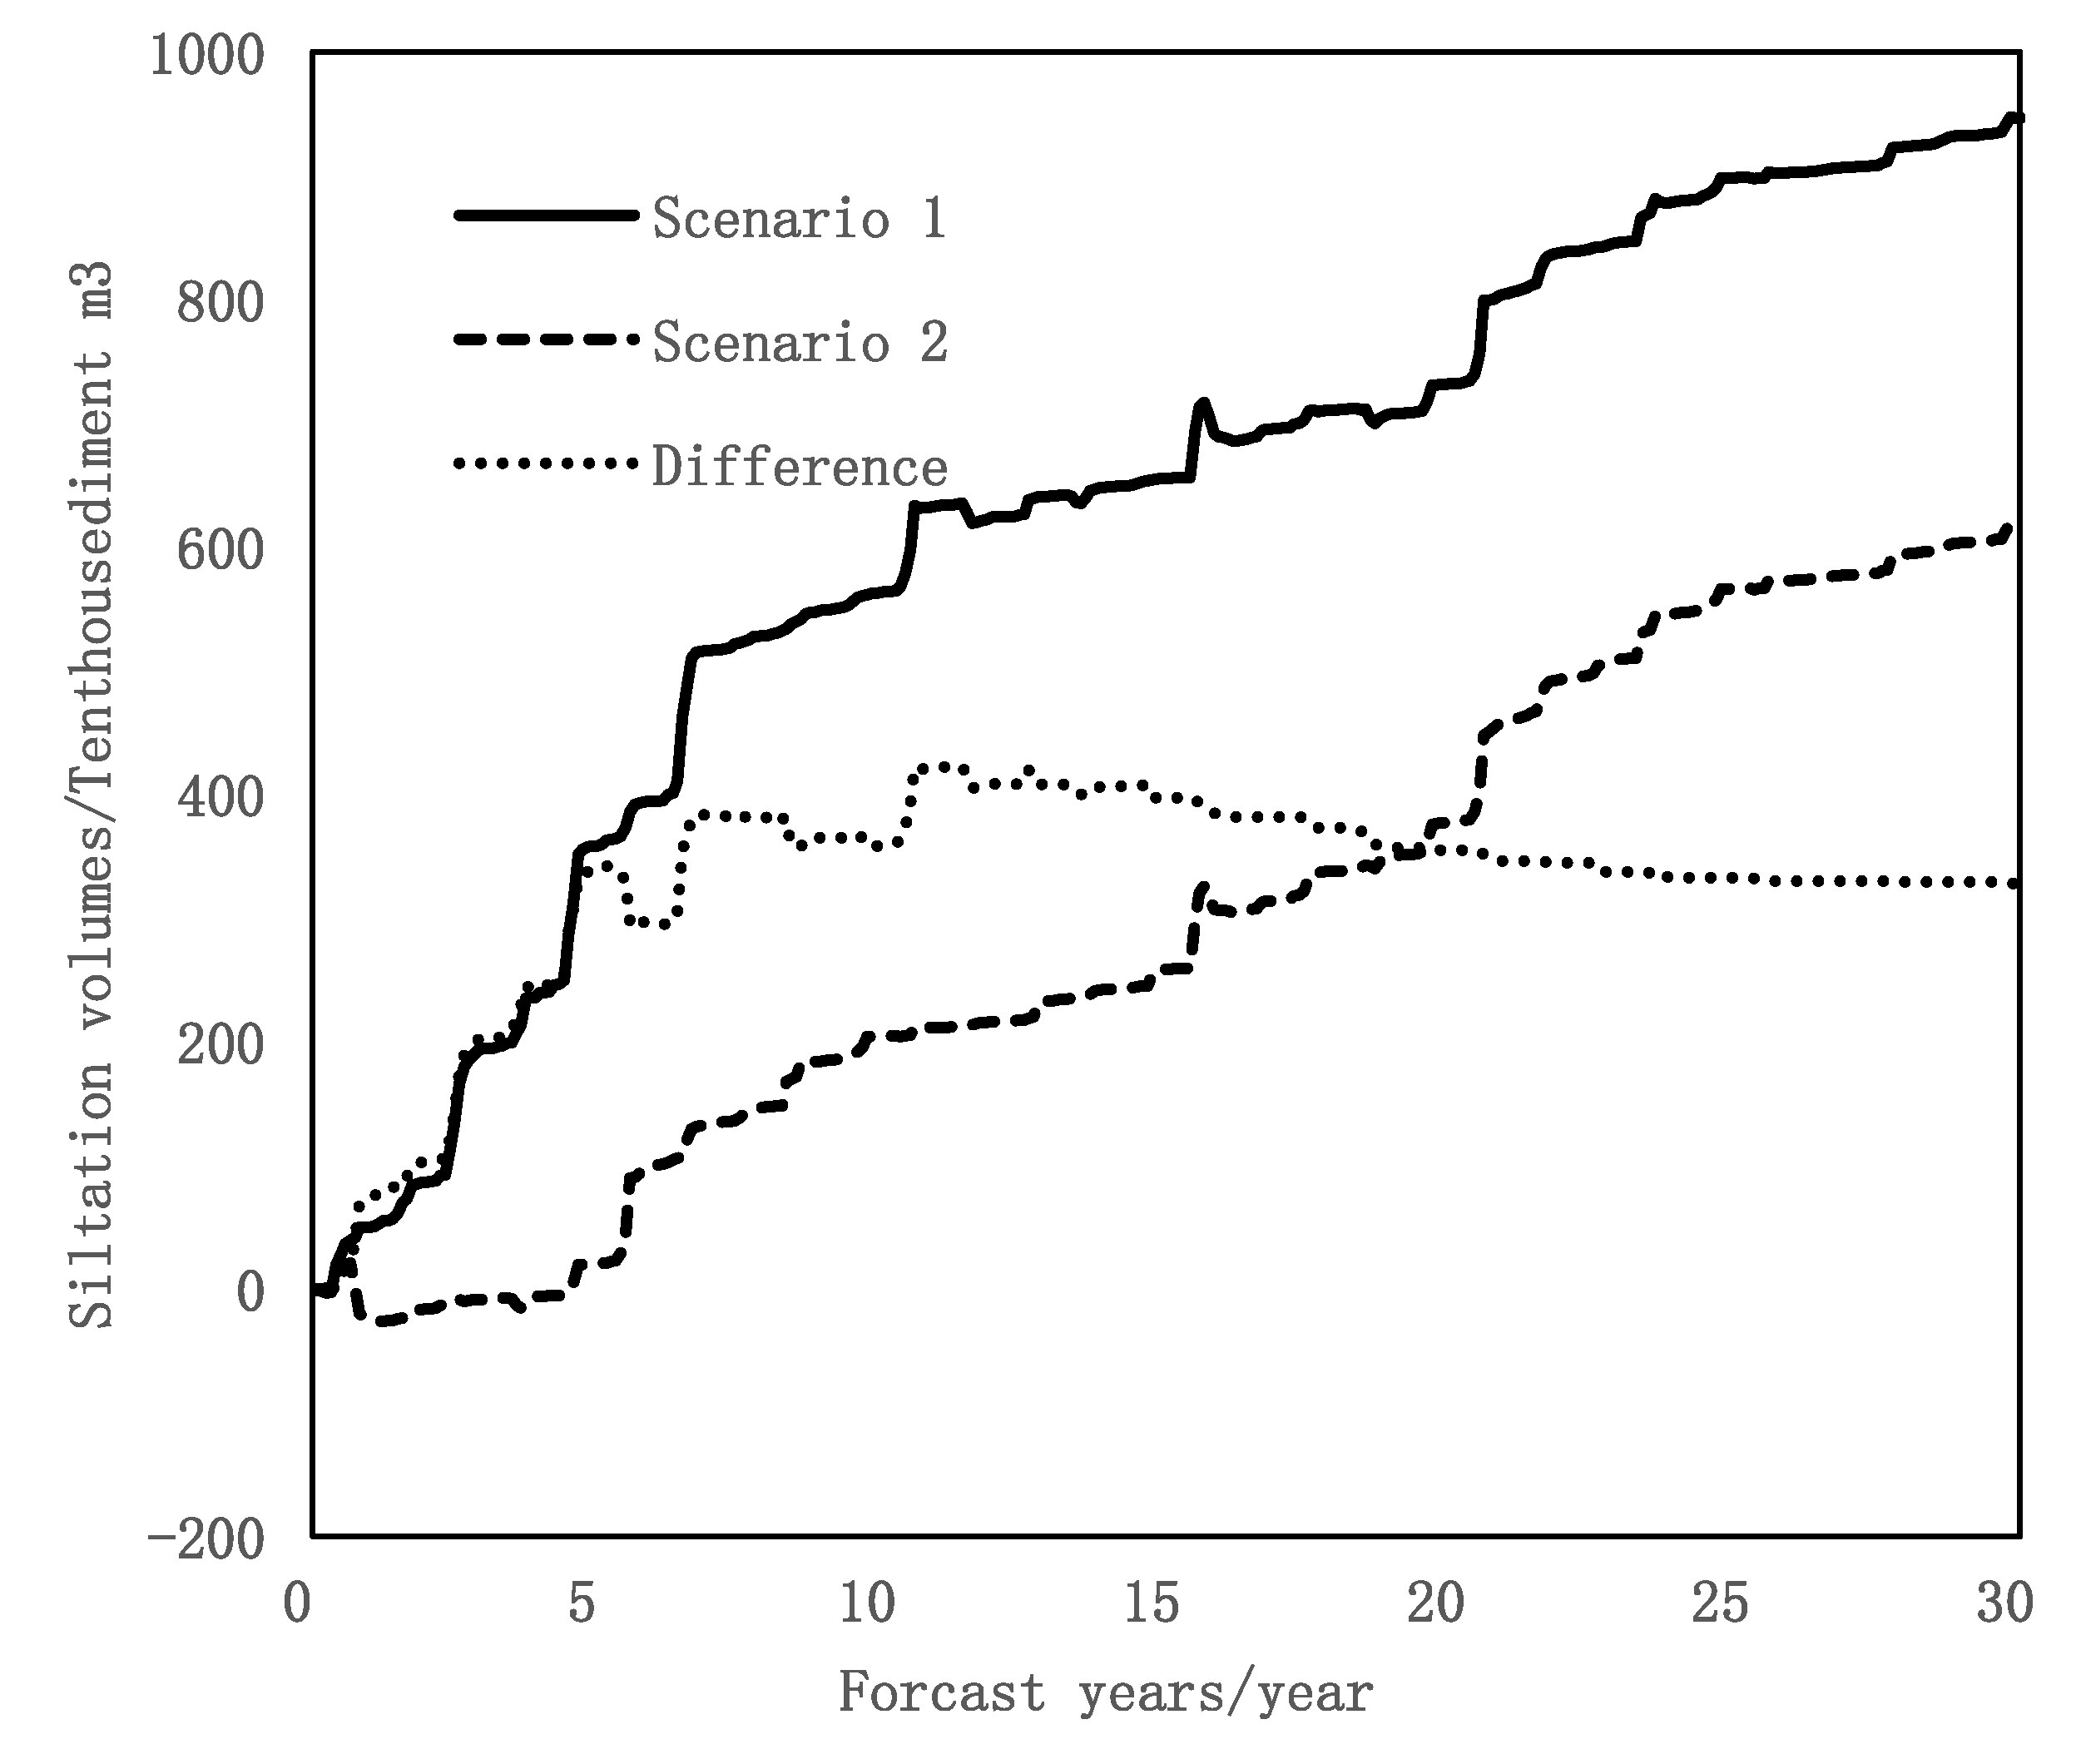
The sediment deposition under the simulated scenarios was numerically simulated. From the simulation, it was found that the deposition at the Wanglin station could be significantly reduced at Scenario 2, as shown in Figure 4. At the end of 10 years, the sediment deposition under Scenario 2 was 2.01 million m3, which is 63.7% less compared to that of Scenario 1. At the end of the 30-year calculation period, the sediment deposited at the Wanglin station was calculated to be 6.19 million m3 under Scenario 2, which is 34.6% less compared to that of Scenario 1. The main difference between the two scenarios is in the first 15 years. Due to the increased incoming sediment from 1987 to 1991, the sediment concentration was accumulated rapidly in Scenario 1. The largest difference was regarding the value at the end of 12 years, with an amount of 4.23 million m3.
From the simulation, Wanglin station shows a continuous accumulation of sediment under both scenarios. After 30 years, no equilibrium state was reached. It is extremely hard to transform the river channel to stabilized conditions considering the many human activities undertaken in this section. Sediment mining should be prohibited at this section. It may take hundreds of years for the river channel to reach an equilibrium state under natural flow conditions.
Table 4 is used to show the relationship between flow rate and sediment concentration in the past 30 years. The relationships between deposition and erosion at different years are presented using the maximum value and average value. It is found that a higher flow rate can result in a relative larger deposition value. Overall, the erosion is more favorable at a larger flow rate and lower incoming sediment, which can avoid deposition. From the table, the average ratio of incoming sediment to transported sediment is around 0.97 for Data Number 2, which indicates a state of relative equilibrium. In certain years—for example, Data Number 5 in Table 4—with limited flow and large amounts of incoming sediment, the sediment deposition could become more obvious. In the repetitive series, it may take a shorter period of time to reach a state of equilibrium.
4.2. Deposition Distribution
The simulated deposition at the end of the 30 years is presented in Table 5. From the numerical modeling, it can be found that the section from Wangjiaba to Sanhejian is dominated by erosion, with an amount of 1.05 million m3. The section from Runheji to Wangji shows an equilibrium state. The other sections in the middle reach of the Huai River have a major deposition with an amount of 7.01 million m3 of sediment, which accounts for 74% of the total deposition. In the transverse direction, all the sections have erosion in the main channel and deposition along the bank. The average erosion depth is around 30 cm, while the deposition height is 15 cm. In Scenario 2, with repetitive series, the main reach of the Huai River shows erosion in the upper reach and deposition in the downstream of Sanhejian station. Further analysis indicates that the upstream has a larger reduction in deposition, especially from Wangjiaba station to Sanhejian station. The middle reach of the Huai River shows dominated erosion behavior in the main channel under the continuous series of Scenario 1. Although the changes are not significant, the impacts of incoming sediment are very clear. Overall, the main reach of the Huai River shows increasing erosion and decreasing deposition from the simulation.
4.3. Recommendations
The recommendations for flooding mitigation in the middle reach of the Huai River are presented. The Wanglin section is used as the test site. For flooding mitigation, it is important to maintain stabilization of the bank. From the simulation, it is found that the overall trend of the Huai River is erosion. Some recommendations are provided, as follows:
- (1)
- Main channel dredging
The simulation indicates that the Wanglin section will be dominated by erosion. However, the main channel in this section is around 250 m in width. The flow capacity in the main channel is around 1500 m3/s, which is less than 1/5 of the bankfull value. The main channel is relatively small, which presents a larger threat to overland flooding. Dredging the main channel is thus recommended. The present study indicates that dredging the channel is preferable to widening the main channel.
- (2)
- Floodplain protection
The beach bank along this section is close to 1500 m in length and has many functions, including water drainage, water storage, and sediment deposition. From the simulation, less incoming sediment results in a reduction in sediment deposition, which may impact the stability of the banks. The recommendation is to construct bank protection to mitigate the threat of bank failure. Additionally, sediment mining should be well-managed to avoid the potential impacts on bank stability.
5. Conclusions
The present study was conducted to investigate the flow rate and sediment relationship in the middle reach of the Huai River. The Wanglin section was used as an example for numerical simulation. The model is well validated and calibrated. In total, 30 years of data were used for modeling sediment behavior. Due to the special geophysical characteristics of the Wanglin section, the overall trend in this section is erosion in the main channel. Two scenarios were used to investigate the flow–sediment behavior at the Wanglin section. It was found that in the flow–sediment type of rich to medium, an equilibrium sediment transport could be reached. Based on the simulation results, recommendations were provided for flood mitigation in this section, including main channel dredging and bank protection.
Author Contributions
Conceptualization, J.N., B.Y., P.W.; methodology, J.N.; writing—original draft preparation, J.N.; writing—review and editing, P.W. and J.N.; supervision, B.Y. All authors have read and agreed to the published version of the manuscript.
Funding
This research was funded by the National Key Research and Development Program of China, grant number 2017YFC0405602 and the Hydraulic Science and Technology Program of Anhui Province, grant number SLKJ202001-07, and NSERC Discovery Grant.
Institutional Review Board Statement
Not applicable.
Data Availability Statement
Not applicable.
Acknowledgments
The authors are thankful for the financial support provided by the National Key Research and Development Program of China (2017YFC0405602), the Hydraulic Science and Technology Program of Anhui Province (SLKJ202001-07), and NSERC Discovery Grant.
Conflicts of Interest
The authors declare no conflict of interest.
References
- Nelson, J.M.; James; Bennett, P.; Stephen, W.M. Flow and sediment–transport modeling. Tools Fluv. Geomorphol. 2003, 539–576. [Google Scholar] [CrossRef]
- Chao, W.; Zheng, S.; Wang, P.; Hou, J. Interactions between vegetation, water flow and sediment transport: A review. J. Hydrodyn. 2015, 27, 24–37. [Google Scholar]
- Nowacki, D.J.; Andrea, S.O. Water and sediment transport of channel-flat systems in a mesotidal mudflat: Willapa Bay, Washington. Cont. Shelf Res. 2013, 60, S111–S124. [Google Scholar] [CrossRef]
- Restrepo, J.D.; Kjerfve, B. The Pacific and Caribbean rivers of Colombia: Water discharge, sediment transport and dissolved loads. In Environmental Geochemistry in Tropical and Subtropical Environments; Springer: Berlin/Heidelberg, Germany, 2004; pp. 169–187. [Google Scholar]
- Deletic, A. Modelling of water and sediment transport over grassed areas. J. Hydrol. 2001, 248, 168–182. [Google Scholar] [CrossRef]
- Papanicolaou, N.A.T.; Elhakeem, M.; Krallis, G.; Prakash, S.; Edinger, J. Sediment transport modeling review—current and future developments. J. Hydraul. Eng. 2008, 134, 1–14. [Google Scholar] [CrossRef]
- Simpson, G.; Sébastien, C. Coupled model of surface water flow, sediment transport and morphological evolution. Comput. Geosci. 2006, 32, 1600–1614. [Google Scholar] [CrossRef] [Green Version]
- Hongling, S.; Chunhong, H.; Yangui, W.; Qingqi, T. Variation trend and cause of runoff and sediment load variation in Huaihe River. J. Hydraul. Eng. 2012, 43, 71–579. (In Chinese) [Google Scholar]
- Bangyi, Y.U.; Yusuo, Y.U.; Jin, N.I. Analysis on sediment erosion and deposition of Huaihe River main Stream from WuJiadu to XiaoLiuxiang. J. Sediment Res. 2009, 4, 12–16. (In Chinese) [Google Scholar]
- Bangyi, Y.U.; Yusuo, Y.U. Analysis on sediment transport balance of Huaihe River main stream from Lutaizi to Wujiadu. J. Nanchang Univ. (Eng. Technol. Ed.) 2009, 31, 162–166. (In Chinese) [Google Scholar]
- Yusuo, Y.U.; Bangyi, Y.U. Analysis on sediment transport balance of Huaihe River main stream from Wangjiaba to Lutaiji. Jianghuai Water Resour. Sci. Technol. 2009, 2, 41–42. (In Chinese) [Google Scholar]
- Yunian, L.I.U.; Huasong, H.E.; Bangyi, Y.U. Study on Characteristics and Regulation of Middle Reaches of Huaihe River; Water & Power Press: Beijing, China, 2012. (In Chinese) [Google Scholar]
- Xingju, Y.; Bangyi, Y.; Jin, N. Analysis on recent evolution of main stream of reach from Bengbu to Fushan of Huaihe River. Water Resour. Hydropower Eng. 2010, 41, 70–72+86. (In Chinese) [Google Scholar]
- Donglai, L.; Jingming, H.; Xinhong, W.; Jin, Q. Influence of morphological variation on flood propagation evaluated by a hydro-morphological model. J. Sediment Res. 2018, 43, 13–20. [Google Scholar]
- Ping, Z.; Jun, X.; Lei, Z.; Xieyi, M. An Analysis of Temporal and Spatial Variation of Rainfall in Huaihe Watershed above Bengbu in Recent 50 Years. Hydropower Water Resour. Rural. China 2017, 3, 1–8. (In Chinese) [Google Scholar]
- Nelson, J.M.; Bennett, J.P.; Wiele, S.M. Flow and sediment-transport modeling. In Tools in Fluvial Geomorphology; Wiley: Hoboken, NJ, USA, 2003; pp. 539–576. [Google Scholar]
- Jing, Y.; Quanxi, X.; Bingjiang, D. Differece Between sediment-transport balance and topographic change methods and applicability in the Three Gorges reservior. J. China Hydrol. 2011, 31, 87–91. (In Chinese) [Google Scholar]
- Yanqun, Y.; Xiaomei, Y. River regulation from Wangjiaba to Linhuaigang in Huaihe River. Water Resour. Planning Des. 2013, 11, 62–65. (In Chinese) [Google Scholar]
- James, G.; Witten, D.; Hastie, T.; Tibshirani, R. An Introduction to Statistical Learning: With Application in R; Springer: Berlin/Heidelberg, Germany, 2013. [Google Scholar]
- Feldman, A.D. Hec Models for Water Resources System Simulation: Theory and Experience. Adv. Hydrosci. 1981, 12, 297–423. [Google Scholar]
- Zhilin, W.; Lianggui, Z.; Xiaoping, F. Research on mathematical model for sediment in Yellow River. J. Wuhan Univ. Hydraul. Electr. Eng. 1997, 5, 22–26. (In Chinese) [Google Scholar]
- Zhou, J.; Lin, B. One-Dimensional Mathematical Model for Suspended Sediment by Lateral Integration. J. Hydraul. Eng. 1998, 124, 712–717. [Google Scholar] [CrossRef]
- Qiwei, H. Non-Equilibrium Transport of Non-Uniform Sediment Load; Science Press: Beijing, China, 2014. (In Chinese) [Google Scholar]
- Hui, Z.; Bangyi, Y.; Jin, N. Susceptibility and periodicity of water and sediment characteristics of the Huaihe River in recently 66 Years. J. Yangtze River Sci. Res. Inst. 2020, 37, 6–11. (In Chinese) [Google Scholar]
Figure 1.
Changes of hydro-sediment in the mainstream of Huai River at Lutaizi station.

Figure 2.
The branches of the Huai River and flood basins in the present study.

Figure 3.
Comparison of water level and flow process at Run River station in 2005.

Figure 4.
Cumulative deposition process in Wanglin section under two flow–sediment series.


Table 1.
The flow and sediment at Wanglin section from 1985–2014.
| Year | Annual Flow Rate/m3·s−1 | Annual Sediment/10,000 Tons | Flow–Sediment Type | Year | Annual Flow Rate/m3·s−1 | Annual Sediment/10,000 Tons | Flow–Sediment Type |
|---|---|---|---|---|---|---|---|
| 1985 | 323.25 | 349.53 | both medium | 2000 | 512.11 | 525.85 | rich–medium |
| 1986 | 190.64 | 256.21 | poor–medium | 2001 | 117.10 | 34.15 | both poor |
| 1987 | 613.71 | 1028.33 | both high | 2002 | 359.43 | 314.32 | both medium |
| 1988 | 149.86 | 196.76 | both poor | 2003 | 768.90 | 477.67 | rich–medium |
| 1989 | 402.21 | 700.72 | medium–rich | 2004 | 290.81 | 184.51 | medium–poor |
| 1990 | 300.77 | 281.38 | both medium | 2005 | 637.24 | 759.56 | both rich |
| 1991 | 670.35 | 939.31 | both rich | 2006 | 518.74 | 167.98 | rich–poor |
| 1992 | 125.03 | 69.84 | both poor | 2007 | 419.33 | 391.54 | both medium |
| 1993 | 206.02 | 119.25 | both poor | 2008 | 376.84 | 354.99 | both medium |
| 1994 | 140.06 | 66.49 | both poor | 2009 | 176.53 | 98.30 | both poor |
| 1995 | 167.90 | 301.27 | poor–medium | 2010 | 312.79 | 150.73 | medium–poor |
| 1996 | 478.98 | 419.31 | rich–medium | 2011 | 81.62 | 12.36 | both poor |
| 1997 | 185.38 | 112.77 | both poor | 2012 | 104.55 | 76.97 | both poor |
| 1998 | 543.51 | 408.26 | rich–medium | 2013 | 85.20 | 26.59 | both poor |
| 1999 | 76.71 | 21.44 | both poor | 2014 | 206.59 | 109.60 | both poor |
Table 2.
Comparison of annual sediment transport rate at Lutaizi station (unit: 10,000 t/year).
| Calibration | Validation | ||||||||
|---|---|---|---|---|---|---|---|---|---|
| Year | Measured | Simulation | Absolute Error | Relative Error/% | Year | Measured | Simulation | Absolute Error | Relative Error/% |
| 1999 | 48.6 | 57.6 | 9.0 | 18.4 | 2004 | 248.7 | 276.8 | 28.1 | 11.3 |
| 2000 | 509.0 | 565.9 | 56.8 | 11.2 | 2005 | 340.4 | 385.8 | 45.4 | 13.3 |
| 2001 | 23.2 | 19.0 | −4.2 | −18.1 | 2006 | 129.6 | 108.3 | −21.3 | −16.4 |
| 2002 | 191.1 | 212.5 | 21.4 | 11.2 | 2007 | 235.1 | 269.2 | 34.1 | 14.5 |
| 2003 | 449.8 | 485.1 | 35.3 | 7.8 | 2008 | 235.0 | 266.9 | 32.0 | 13.6 |
Table 3.
Statistics of hydro-sediment volume in the river under different flow–sediment scenarios.
| Name | Series Composition | Runoff Flow Rate | Sediment | ||
|---|---|---|---|---|---|
| Annual Flow Rate/m3·s−1 | Percentage of Flood Season/% | Annual Average Value/10,000 Tons | Percentage of Flood Season/% | ||
| Continuous series | 1985–2014 | 318.0 | 61.7 | 298.5 | 76.1 |
| Repetitive series | 2000–2014 | 331.1 | 62.8 | 245.7 | 78.7 |
Table 4.
Deposition and sediment delivery ratio of different flow–sediment year types.
| Flow–Sediment Type | Deposition Volume /10,000 m3·year−1 | Incoming/Outgoing Sediment Ratio | ||||
|---|---|---|---|---|---|---|
| Maximum | Minimum | Average | Maximum | Minimum | Average | |
| both rich | 122.04 | 73.23 | 101.09 | 0.84 | 0.79 | 0.82 |
| rich- medium | 33.23 | −9.04 | 7.07 | 1.04 | 0.90 | 0.97 |
| both medium | 50.1 | 7.87 | 28.49 | 0.97 | 0.76 | 0.86 |
| Medium–poor | 24.22 | 4.16 | 14.19 | 0.95 | 0.78 | 0.86 |
| Poor–medium | 69.7 | 36.19 | 52.94 | 0.77 | 0.62 | 0.69 |
| both poor | 45.12 | 4.48 | 15.54 | 0.79 | 0.40 | 0.67 |
Table 5.
Distribution of river erosion and deposition at the end of the simulated scenarios (unit: 10,000 m3).
Table 5.
Distribution of river erosion and deposition at the end of the simulated scenarios (unit: 10,000 m3).
| River Section | Continuous Series | Repetitive Series | |||||
|---|---|---|---|---|---|---|---|
| Main Channel | Beach | Full Cross-Section | Main Channel | Beach | Full Cross-Section | ||
| The mainstream of Huai River | Wangjiaba–Sanhejian | −301.2 | 196 | −105.2 | −390.7 | 194.4 | −196.3 |
| Sanhejian–Nanzhaoji | 14 | 124.9 | 138.8 | 2.6 | 120.9 | 123.5 | |
| Nanzhaoji–Runheji | 86.3 | 108.4 | 194.7 | 48.4 | 86.5 | 134.9 | |
| Runheji–Wangji | −36.3 | 54.3 | 18 | −53.5 | 51.8 | −1.7 | |
| Wangji–Linhuagang | 64 | 291.1 | 355.1 | 36.1 | 272.8 | 308.9 | |
| Floodway | Meng River Floodway | 7.4 | 338.1 | 345.5 | 4.8 | 244.9 | 249.7 |
| Total | −165.9 | 1112.7 | 946.8 | −352.2 | 971.2 | 619 | |
Publisher’s Note: MDPI stays neutral with regard to jurisdictional claims in published maps and institutional affiliations. |
© 2021 by the authors. Licensee MDPI, Basel, Switzerland. This article is an open access article distributed under the terms and conditions of the Creative Commons Attribution (CC BY) license (https://creativecommons.org/licenses/by/4.0/).
Share and Cite
MDPI and ACS Style
Ni, J.; Yu, B.; Wu, P. A Numerical Study of the Flow and Sediment Interaction in the Middle Reach of the Huai River. Water 2021, 13, 2041. https://doi.org/10.3390/w13152041
AMA Style
Ni J, Yu B, Wu P. A Numerical Study of the Flow and Sediment Interaction in the Middle Reach of the Huai River. Water. 2021; 13(15):2041. https://doi.org/10.3390/w13152041
Chicago/Turabian StyleNi, Jin, Bangyi Yu, and Peng Wu. 2021. "A Numerical Study of the Flow and Sediment Interaction in the Middle Reach of the Huai River" Water 13, no. 15: 2041. https://doi.org/10.3390/w13152041
Note that from the first issue of 2016, this journal uses article numbers instead of page numbers. See further details here.