
Effects of Two-Stage Ditch and Natural Floodplains on Sediment Processes Driven by Different Hydrological Conditions
by
 , and
, and
Damiano Baldan
1,2, 
Matthias Pucher
1,2,
Elmira Akbari
1,2,
Thomas Hein
1,2 and
Gabriele Weigelhofer
1,2,* 1
Institute of Hydrobiology and Aquatic Ecosystem Management, University of Natural Resources and Life Sciences (BOKU), 1180 Vienna, Austria
2
Wassercluster Lunz-Biologische Station, 3293 Lunz am See, Austria
*
Author to whom correspondence should be addressed.
Water 2021, 13(15), 2046; https://doi.org/10.3390/w13152046
Submission received: 27 May 2021
/
Revised: 15 July 2021
/
Accepted: 23 July 2021
/
Published: 27 July 2021
(This article belongs to the Special Issue The Role of Carbon and Nutrient Cycling in Wetlands)
Abstract
:The two-stage ditch is a river restoration technique that aims at improving the sediment regime and lateral channel connectivity by recreating a small floodplain alongside a stream reach. This study aimed to analyze the efficiency of a two-stage ditch in improving the stream sediment structure and functions under different hydrological conditions (baseflow, post-bankfull, post-flood). Stream sediments were collected in channel sections adjacent to the two-stage ditch, adjacent to a natural floodplain along channelized reaches without inundation areas. Grain sizes, organic matter content and phosphorous (P) fractions were analyzed along with functional parameters (benthic respiration rate and P adsorption capacity, EPC0). The reach at the two-stage ditch showed no changes in sediment texture and stocks, while the floodplain reach showed higher fines and organic matter content under all hydrological conditions. The sediments in degraded reaches were more likely to be P sources, while they were more in equilibrium with the water column next to the natural floodplains and the two-stage ditch. Only functional parameters allowed for assessing the restoration effects on improving the sediment stability and functionality. Due to its sensitivity, the use of P adsorption capacity is recommended in future studies aiming at evaluating the response of river sediments to restoration measures under different hydrological conditions.
1. Introduction
River restoration is a widespread strategy to mitigate the negative impacts of human alterations on freshwater ecosystems [1,2] by improving disrupted hydrologic, geomorphic, and ecological processes in degraded reaches [3,4,5]. The monitoring of river restoration supports the evaluation of restoration effectiveness and allows for more efficient planning in the future [3]. A common approach to assess restoration effectiveness is to measure the spatiotemporal variation of physico-chemical, hydromorphological, and biological parameters [6,7]. Such structural parameters provide insights into the structure of the studied ecosystem [8] but do not inform on the recovery of ecosystem functions and processes [9], showing a poor alignment with the overall aims of river restorations. Parameters measuring ecosystem functions (i.e., functional parameters) can inform on the integrity and health of the ecosystem, complementing structural parameters [8], and providing additional information on the trajectory of the recovery. For instance, primary production, ecosystem respiration, and phosphorous adsorption are recognized as sensitive indicators to multiple pressures, including land use, water quality, and local hydrodynamics [10,11,12]. Functional indicators facilitate better insight into aquatic ecosystems’ viability and functionality than structural indicators [13], thus being good candidates for informing on post-restoration ecosystem changes [5].
Excessive sediment input from the catchment and a disrupted sediment cycle are two major pressures river systems face worldwide [14]. Land use and climate change can trigger excessive soil erosion [15], cascading into accumulations of fine bed material deposits (FBMDs), i.e., sediments that are transported and deposited selectively [16]. Excessive FBMDs can drastically alter the river morphology by reducing the heterogeneity of mesohabitat structures (pool-riffle, plain bed [17]). The fine particles can clog the hyporheic zone matrix composed of coarser substrates, lead to accumulations of toxic substances [18,19,20], and impair fish spawning [21]. When FBMDs are mobilized, the collisions among the grains lead to reduced macroinvertebrate abundances [22,23,24,25] and impaired biofilm functionalities [11]. Minimizing FBMDs is challenging, as they are controlled by multiple catchment-scale factors (e.g., soil erosion) and reach scale factors (e.g., reach transport capacity [26]).
Diffuse pressures such as soil erosion and the resulting FBMDs are difficult to control with high-maintenance technical solutions [14]. During the past years, small-scale nature-based solutions have thus moved increasingly into the focus of river managers as tools to restore stream functions in anthropic landscapes [14]. Two-stage ditches are examples of small-scale nature-based solutions recreating narrow floodplains alongside straightened stream channels in spatially restricted areas [27]. These ditches are created by lowering the terrain immediately adjacent to the channel to facilitate flooding of parts of former riparian areas. The overall aim is to restore the connectivity of the stream with the surrounding land, mimicking processes occurring at larger scales in river-wetland corridors [28,29,30,31,32]. However, while river-wetland corridors can have a width of several kilometers and occupy lengths of up to hundreds of kilometers [28], the two-stage ditch is generally employed in already modified reaches, with lengths limited to a few hundreds or thousands of meters [33,34] and a small upstream catchment. The constructed floodplain improves the bank stability by increasing the wetted channel width, slowing water velocity, and decreasing shear stress during floodplain inundation [35]. Two-stage ditches may enhance sedimentation and nutrients retention [27,34,36], and increase substrate stability [34]. Thus, two-stage ditches are increasingly considered viable options to restore mountainous streams suffering from altered sediment cycles and river bed aggradation due to FBMDs [17,37,38]. However, the local effects of two-stage ditches on sediment structure and related functions are not always clear. For instance, the effects of different hydrological conditions (i.e., baseflow, bankfull, flood) on streambed structures and functions may obscure both positive and negative restoration effects [34,36].
Our study aimed to analyze the efficiency of a two-stage ditch in improving the sediment structure and functions at the local scale and under different hydrological conditions. We investigated a channelized reach of an agricultural/forested river, heavily impacted by FBMDs and featuring a one-kilometer-long two-stage ditch. A meandering stream section approximately 1 km downstream of the two-stage ditch featuring remnants of a small floodplain enabled us to compare the effects of the constructed ditch with those of a small semi-natural floodplain. We conducted field monitoring under different hydrological conditions to investigate the changes of both structural and functional parameters, aiming to identify the parameters that can show these changes best. We used sediment texture, organic matter, and phosphorus (P) content of the sediments as structural parameters indicating changes in sediment conditions. As functional parameters, we selected the P adsorption capacity and benthic respiration as they are both closely linked to sediment structure and stability. The P adsorption capacity, expressed as zero equilibrium P concentration (EPC0), informs about the potential of sediments being a P source or sink for the stream ecosystem [37,38,39]. The benthic respiration rate measures the net sediment metabolism due to oxygen consumption by biofilms, thus partly reflecting, among others, sediment mechanical stability [40,41]. Both parameters are sensitive to multiple local, reach, and catchment factors [11,42] and flow conditions [37,43] and may also provide information on past environmental conditions [44].
For the study, we defined an improvement of stream conditions as a lower fraction of fine sediments, lower P contents, and a higher sediment P adsorption capacity (i.e., a lower likelihood for sediments to act as a P source or a sink) in the channel beside or immediately downstream of the ditch/floodplain than in the stream sections above. We also considered higher benthic respiration rates as an improvement given the linkage with sediment mechanical stability. Based on the existing knowledge on the functioning of the two-stage ditch, we hypothesized the studied system to behave as follows:
- Channel sections adjacent to the two-stage ditch and the natural floodplains will show improved sediment conditions compared to channelized sections by having larger grain sizes and lower P contents;
- Benthic respiration rates will be higher in the channel sections adjacent to the two-stage ditch and the natural floodplains than in the channels without riparian zones;
- EPC0 will be lower in the channel adjacent to the two-stage ditch and the natural floodplain than in the channelized sections.
- Functional parameters will respond stronger to flow conditions in sites located in channelized sections than structural parameters.
2. Materials and Methods
2.1. The Maltsch River
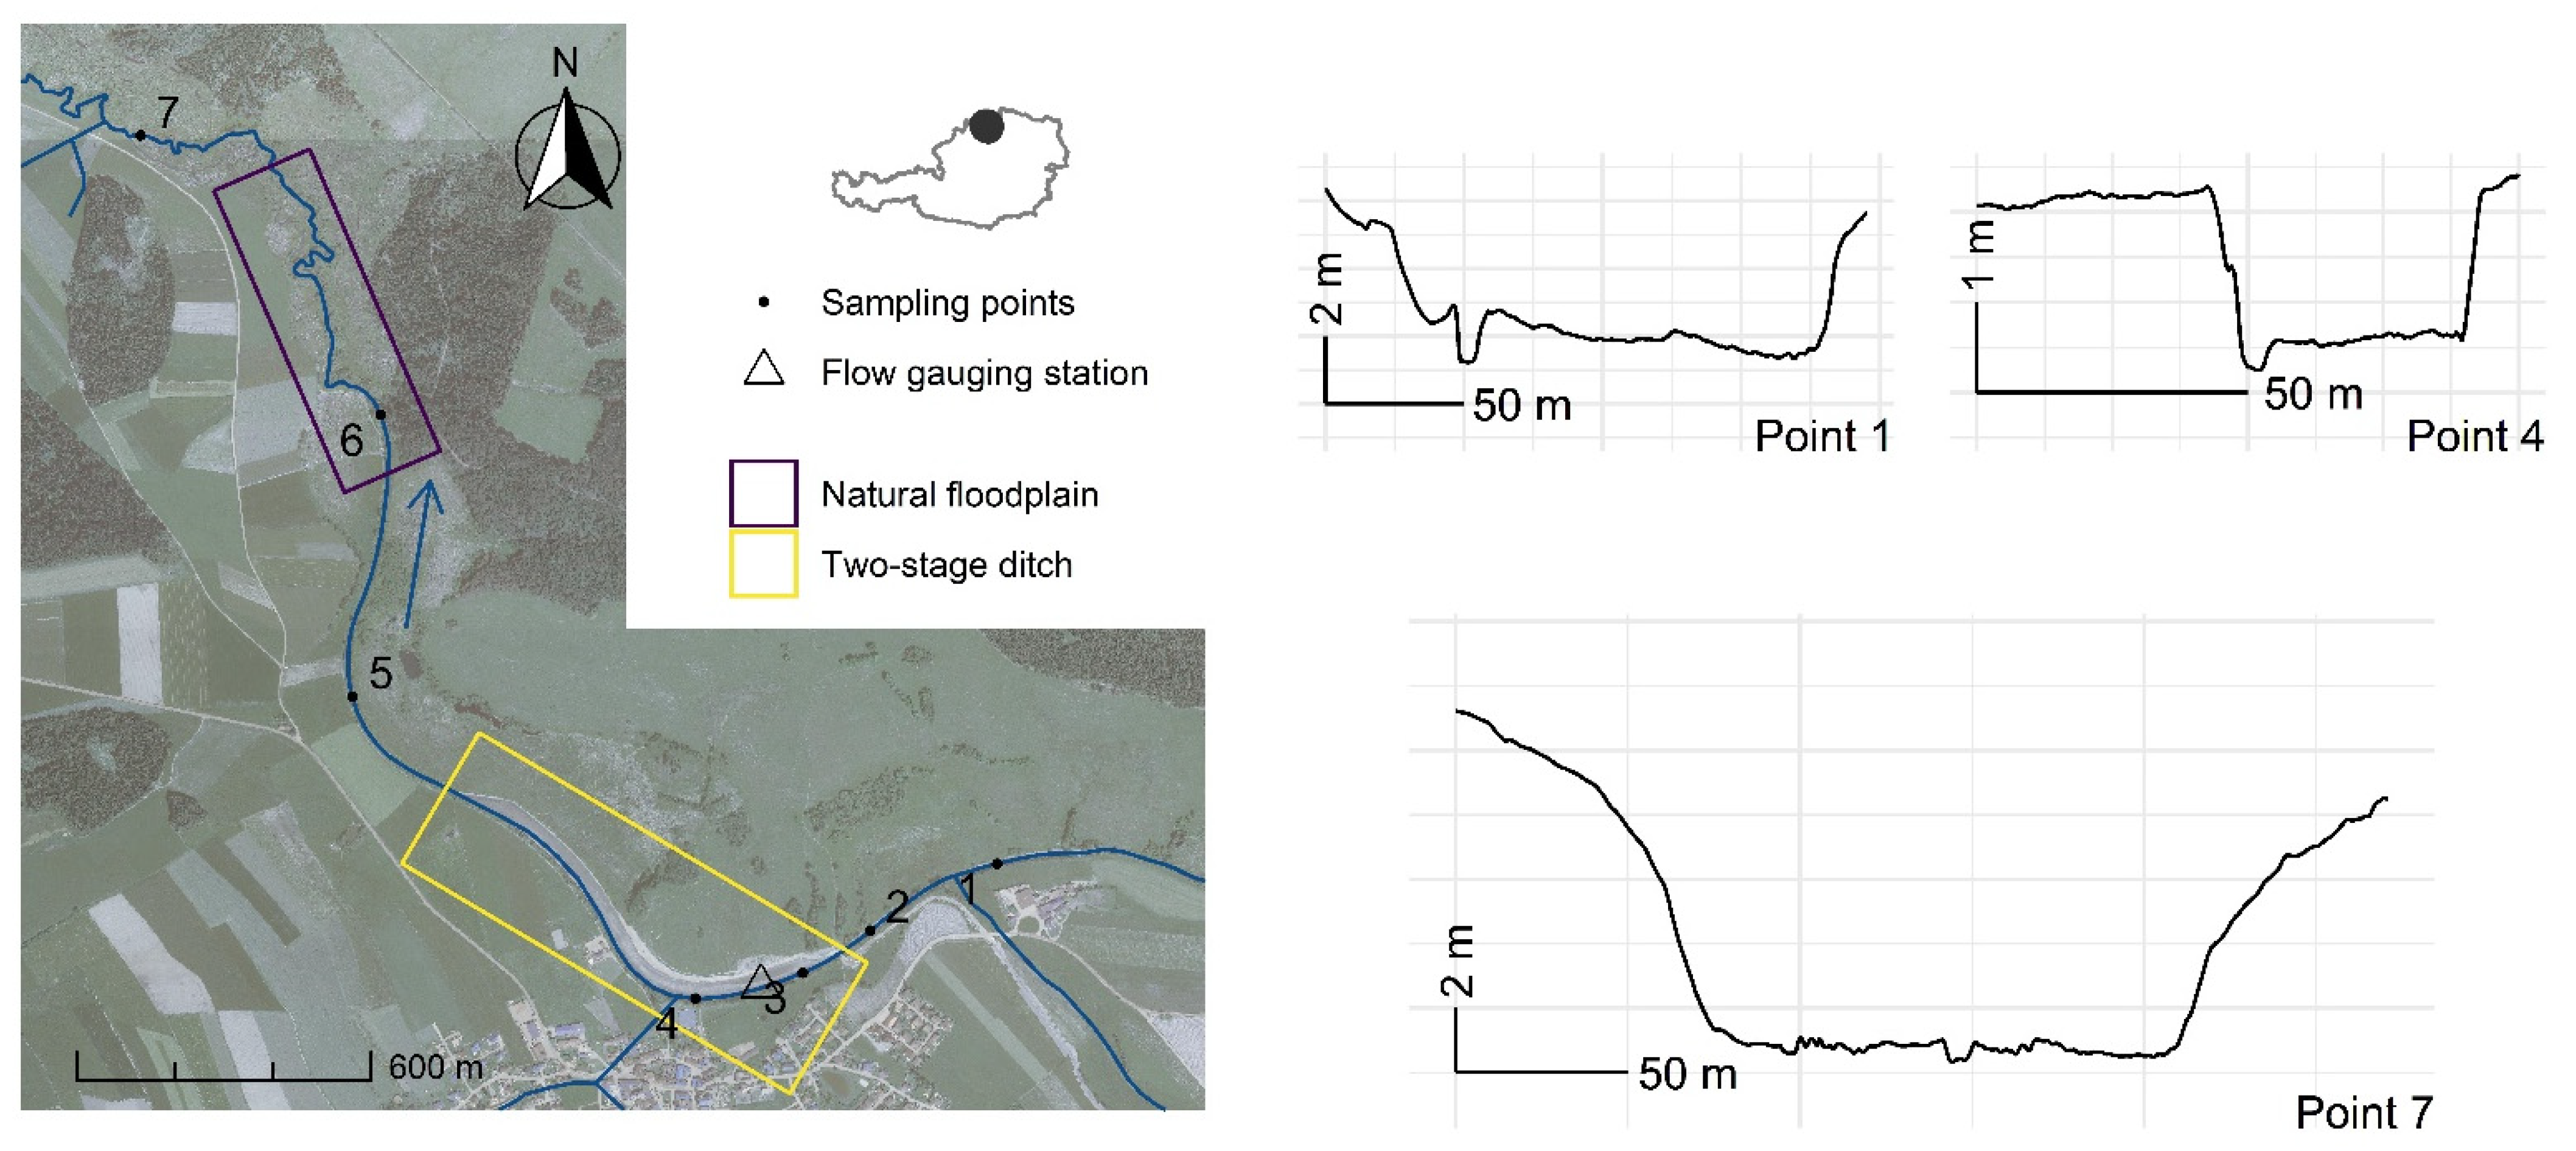
The Maltsch river is located on the southern edge of the Elbe catchment and constitutes the border between Austria and the Czech Republic (Figure 1). The river originates in the Bohemian Massif, with granite and gneiss bedrock [45]. The catchment land use is mixed, with pastures and forestry as dominating land uses [46]. Rivers in the Bohemian Massif have a mainly “plane bed” morphology with cobbles and sands as dominating substrates [23], while steep sections are classified as “cascade type” with a boulder substrate [17]. Many sections of the Maltsch river were modified and channelized in the past, but some semi-natural meandering sections still exist. Due to soil erosion, increased FBMDs (modal diameter: 1–10 mm) are transported in the stream and therein accumulate [17,47].
To protect the settlement of Leopoldschlag from floods, a two-stage ditch was built between January and June 2014 by lowering the right banks of the Maltsch river. The constructed two-stage ditch has a length of 1000 m and a width of approximately 35 m (Figure 1). The Maltsch river has an artificially straightened stream course at this stretch. Eight hundred meters downstream of the two-stage ditch, a short meandering stream section exists with a small natural floodplain (approx. length 1 km, width 20 m). While regularly cut grasses and herbs vegetate the ditch′s homogeneous terrain, the semi-natural floodplain features a heterogeneous terrain vegetated with shrubs and trees. The Maltsch river at Leopoldschlag has an upstream area of 95 km2 and a mean elevation of 620 m a.m.s.l. [48]. The modal discharge is 0.74 m3/s, the low flow discharge (10th percentile) is 0.38 m3/s, and the high flow discharge (90th percentile) is 2 m3/s (hourly data from the Leopoldschlag gauging station 1991–2016 [48]).
2.2. Field Sampling
Samples were collected in spring/summer 2018 and 2019 after the stream experienced different hydrological conditions (Table 1, Figure 2). Samples were collected after two bankfull events (i.e., discharge comparable with the 90th percentile of the annual discharge [49]), two baseflow events (i.e., average discharge in a two month time window before the sampling occurred resembled the 10th percentile of the annual discharge), and a small flood (1.2 years return period calculated with a generalized exponential probability density function based on 1980–2015 yearly extremes data [48]). Annual flow percentiles to characterize high and low flows were obtained from the 1980–2015 daily discharge time series [48].
Sediment samples were collected at seven sites (Table 2) following an approach similar to Mahl et al. [33]. The sites were distributed along a 5 km long section and represent all the different stream morphologies observed in the Maltsch river in the proximity of the village Leopoldschlag (Figure S1). Sites 1 and 2 were located upstream of the two-stage ditch in the channelized sections without riparian areas (Table 2, Figure 1). Sites 3 and 4 were at the upstream and middle part of the channelized section with the two-stage ditch. Site 5 was located at the channelized reach between the two-stage ditch and the semi-natural floodplain section. Between sites 4 and 5, a small tributary joined the river. Site 6 was upstream of the naturally meandering section surrounded by a semi-natural floodplain, and site 7 was downstream of the floodplain. There, the channel was still meandering but incised, without riparian areas. For each site, five samples were collected by shoveling the upper sediment layer (2 cm).
For each site, dissolved oxygen, water temperature, pH, and conductivity were measured in-situ with an HQ40d portable meter (Hach Lange, Düsseldorf, Germany). Water samples were collected for each sampling site. Sediments and water samples were stored in the fridge at 4 °C. All the chemical analyses were performed within the next 48 hours.
2.3. Lab Analyses
Sediment samples were dried at 75 °C for dry weight (DW) determination. All results are reported as normalized per gram sediment DW. Grain size distributions were determined according to the standard ÖNORM B 4412. Dry sediments were sieved with mesh sizes of 20, 6.3, 2, 1, 0.5, and 0.125 mm. The 14th, 50th, and 84th quantile of the empirical grain size distribution were extrapolated as representative grain size (respectively: d14, d50, and d84). Additionally, the specific surface of a unit mass of sediments (namely Ss; units: cm2 gDW−1) was calculated as:
where rf is the ratio of the weight retained by the sieve with mesh size f to the total sample weight, df is the mesh size (mm), and ρs is the density of the grains, assumed equal to 2.75 g cm−3. The organic matter (OM) content was estimated via the ash-free dry weight of the sediments after combustion at 450 °C for 4 h on the fractions coarser than 1 mm (coarse organic matter, OMc) and smaller than 1 mm (fine organic matter, OMf).
Ss = 6000 ∑f rf df−1 ρs−1
Soluble reactive P (SRP) and inorganic P (Pinorg) were extracted from the sediments via ultra pure water and 1 M HCl, respectively [50]. Total phosphorus (Ptot) in sediments was determined via combustion at 450 °C in a muffle furnace and digestion with H2SO4 in the microwave (CEM MarsXpress; [51] ).
Phosphorus adsorption characteristics were studied via five-point batch equilibrium experiments [39]. Ten grams of fresh sediments were incubated in 50 mL nutrient-poor untreated well water enriched with KH2PO4 (4, 10, 40, 150, 300 μg P L−1). The well water was chosen as it presents the ionic composition of surface waters in the study region but shows a much more stable chemical composition over time than stream water [52,53]. The sediment samples were gently shaken at 20 °C in the dark for 24 h. After the incubation, the extract was centrifuged for 15 min at 3000 rpm, and the supernatant was analyzed for SRP concentrations with a continuous flow analyzer (CFA, Systema Analytical Technology). The amounts of adsorbed or desorbed SRP per gram of sediment was calculated via a mass balance:
where SRPi and SRPf are the initial and final concentrations of SRP in the water, V is the volume of the solution (50 ml), and w is the dry weight of the sediment (gDW). Psorb was plotted against SRPf and fitted with a linear isotherm because of the small initial SRP range. The equilibrium phosphorous concentration (EPC0), i.e., the SRP concentration in the water column for which no net adsorption or desorption occurs, was calculated as the intersect at zero SRP concentration change of the adsorption curve [39,54].
Psorb = (SRPi – SRPf) V/w
The respiration rates of the sediments were determined optically via the oxygen consumption in the water above sediments [55]. First, oxygen-sensitive optical sensor spots were attached to the inner wall of 200 mL air-tight beakers with silicone glue. The beakers were filled with 10–20 g of fresh sediments and successively filled with in-situ collected water. Reference beakers filled only with water were prepared as well. The beakers were gently shaken and incubated in the dark at 20 °C. The variation of dissolved oxygen concentration in the water was measured with a Fibox 3 optode system (PreSens GmbH, Regensburg, Germany), calibrated with a two-point calibration before the experiment. The temporal development of dissolved oxygen concentration was monitored by repeating the measurements at defined time intervals (1, 2, 3, 4, 5, 6, 12, 18, and 24 hours after the beginning of the incubation). Since the system is closed, the respiration rate of sediment was determined for each beaker with a mass balance approach:
where RRsed is the respiration rate of the sediment (µg O2 gDW−1 h−1), RRbeaker is the respiration rate measured in the beaker (µg O2 h−1), RRw is the respiration rate of the water alone (µg O2 gwater−1 h−1), mw is the mass of water contained in the beaker (g), and ms is the mass of sediment contained in the beaker (gDW). Negative sediment respiration rates were set to zero. To compare the respiration rate with literature values, units were converted to g O2 m2 d−1 assuming a sediment density of 1.3 g cm3, and an active sediment depth of 5 cm.
RRsed = (RRbeaker – RRw mw)/ms
2.4. Data Analysis
A principal component analysis (PCA) was used to inspect the clustering of physical and chemical parameters visually. The data were log-transformed before the PCA to limit the leverage of excessive skewness.
The sensitivity of the measured parameters to the hydrological conditions was assessed by testing the effect of the hydrological conditions on the response variable for each sampling site with multiple analysis of variance (ANOVA) tests, after checking that the assumptions of normal distribution (Shapiro–Wilk test), equal sample size, and homogeneity of variance (Bartlett test) were met. Tukey′s HSD post-hoc test was used to identify the significantly different groups. For the response variables that are not affected by the hydrological event, data were pooled by sampling site, and the difference in the means across sampling sites was assessed with ANOVAs on the pooled data. All the statistical analyses were carried out with the statistical software R v4.0.2 [56].
3. Results
3.1. Background Water Quality
The water quality showed slight variation across sites during each sampling event (Table 3). Overall, the stream was characterized by average dissolved oxygen concentrations of about 9 mg O2 L−1, relatively low water temperature (range: 13.3–17.9 °C), and low electrical conductivity values (90–130 µS cm−1). The SRP concentrations were lowest in the post-flood sampling (22–26 μg P L−1) and highest in the baseflow sampling (33–86 μg P L−1). Ptot ranged between 34 and 82 μg P L−1, independent of the hydrological event.
3.2. Effect of the Site on the Structural Parameters
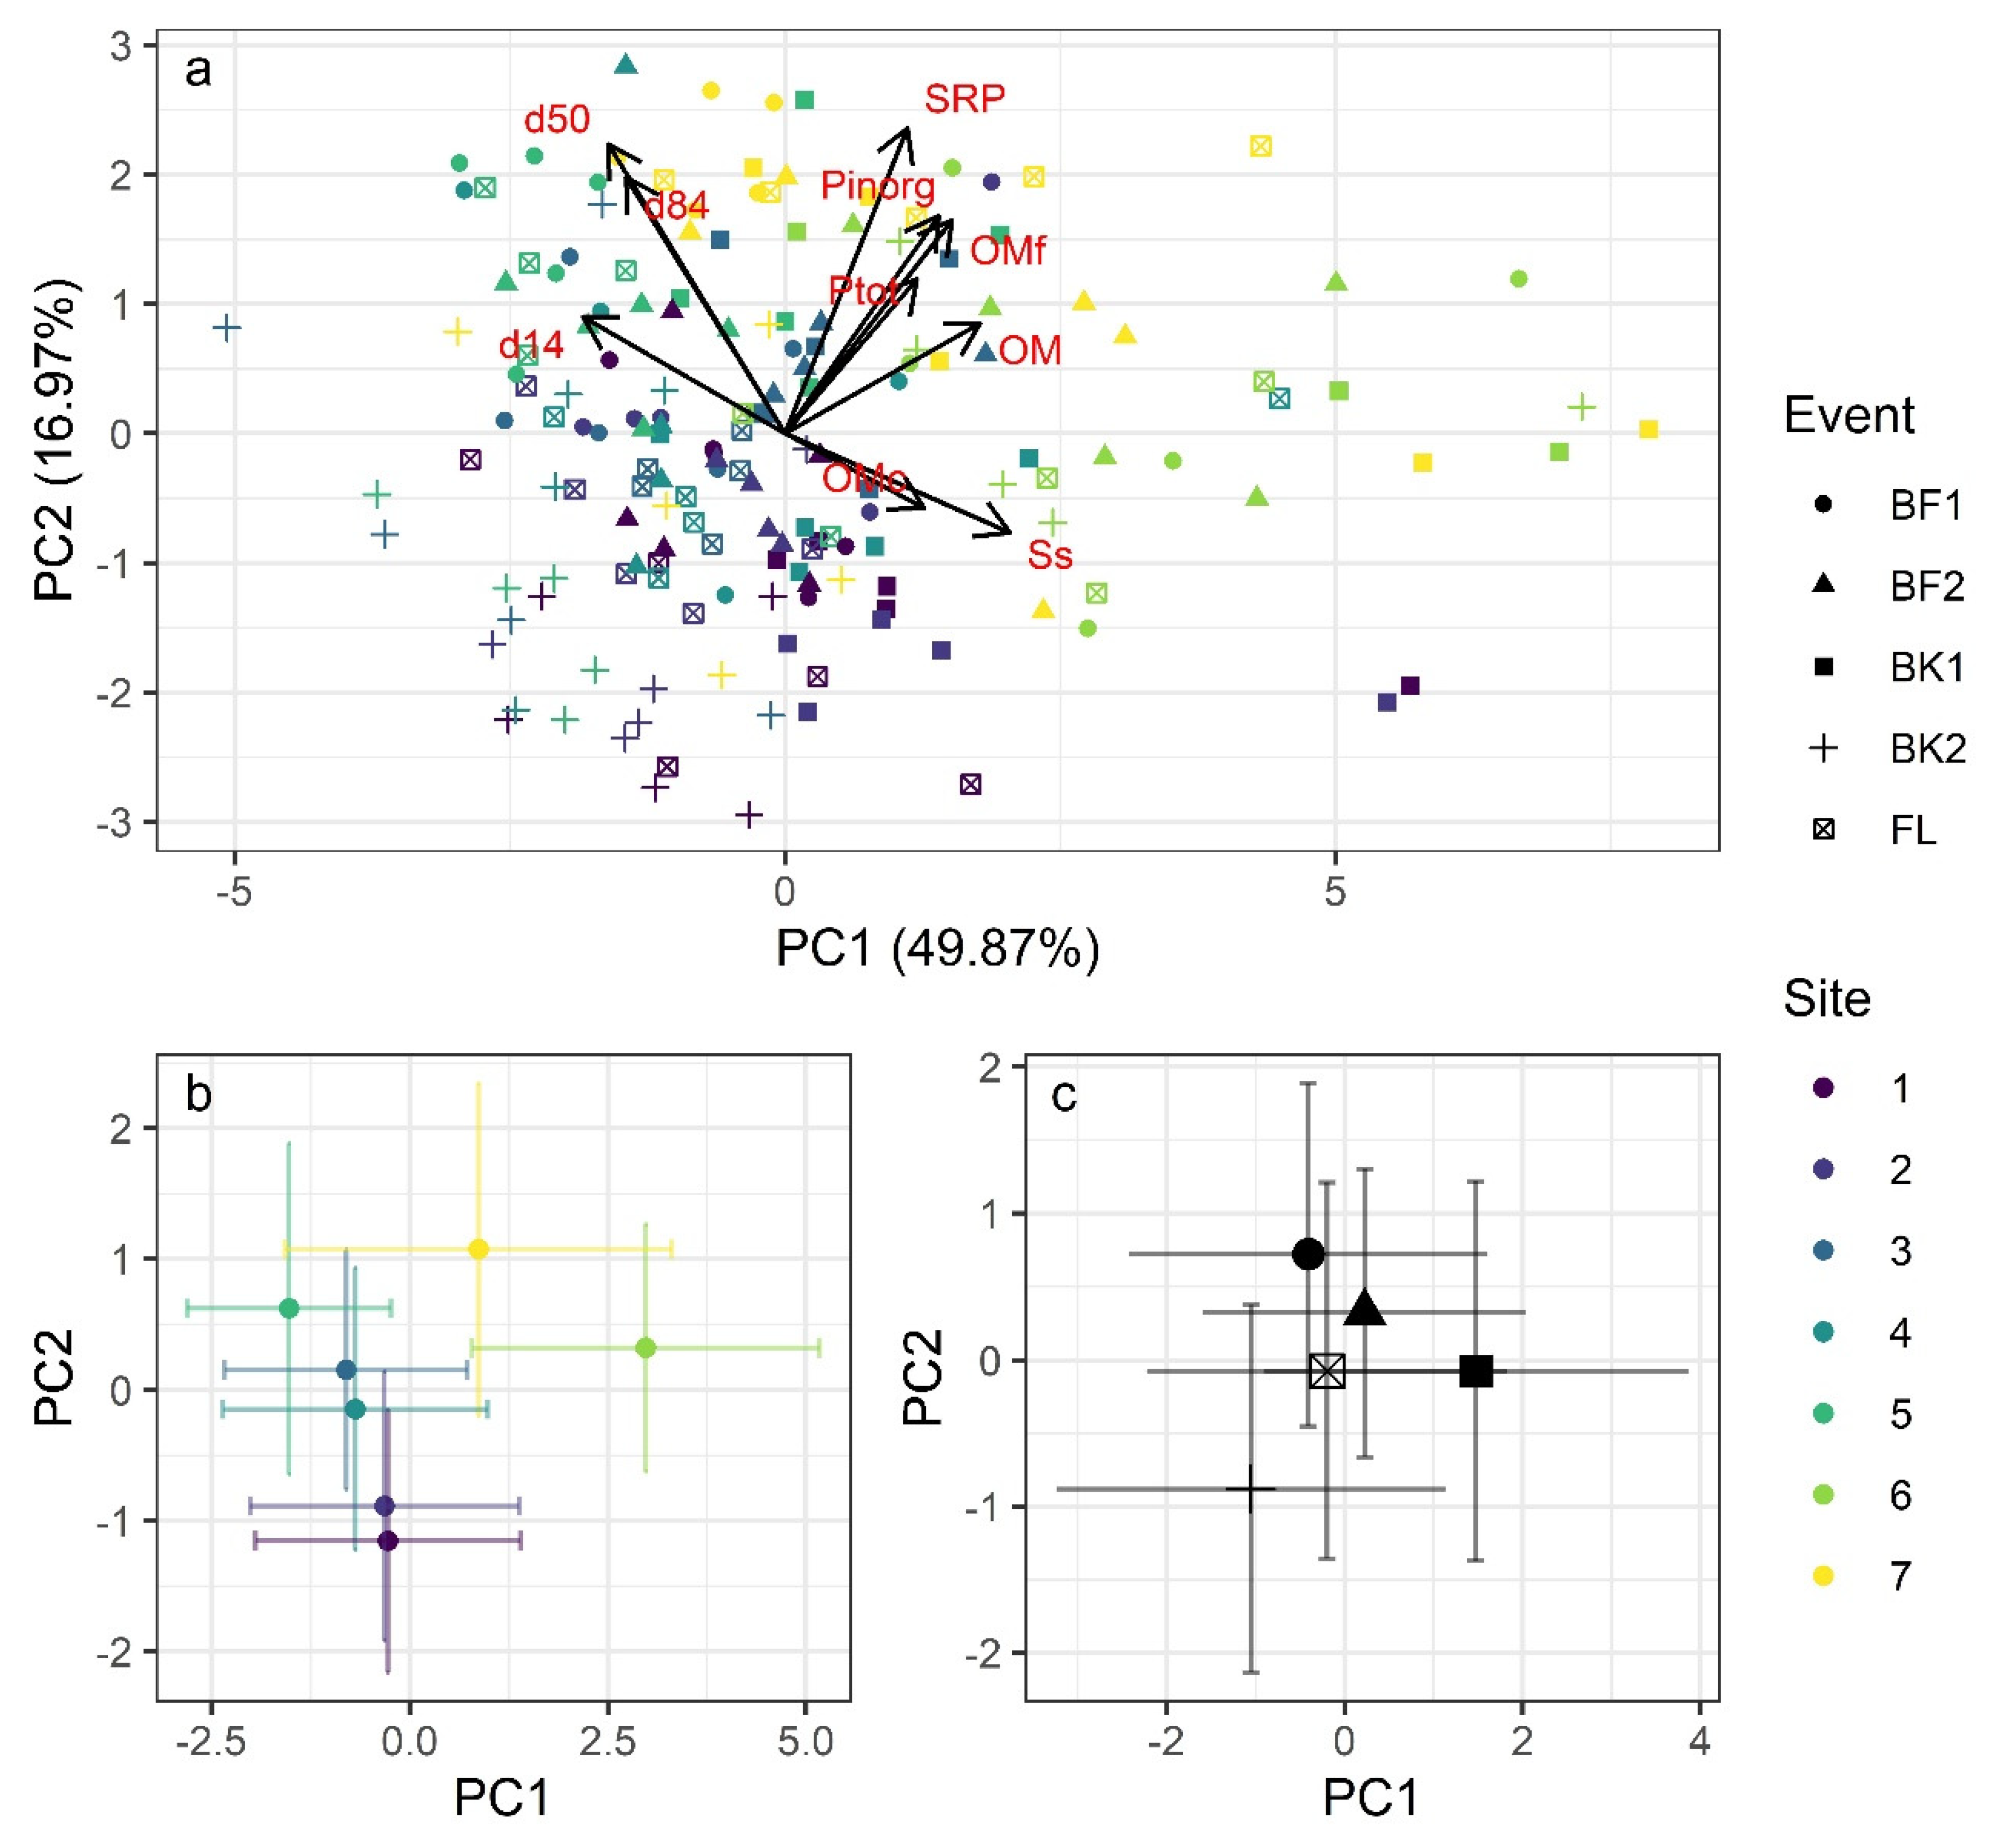
The first two PCA axes (PC1 and PC2) explained 66.8% of the multivariate variance (Figure 3a). The specific surface and the organic matter had the highest loadings on PC1 (49.9% of the multivariate variance), while the SRP and the d50 had the highest loadings on PC2 (17.0%). A general pattern towards clustering of sites could be detected (Figure 3b), with sites in the channelized upstream section (sites 1 and 2) and sites in the two-stage ditch channel (sites 3 and 4) having close centroids. The centroids of sites 6 and 7 within and downstream of the natural floodplain are separated due to the higher fraction of organic matter and higher specific sediment surfaces (i.e., higher share of fine fractions). No distinctions of the centroids were observed when the data were grouped according to the hydrological event (Figure 3c).
The univariate analysis of the structural parameters confirmed the pattern detected by the PCA (Table 4). As most of the stocks were not affected by hydrology (Section 3.5), the quantities were pooled by the sampling site. The fines fraction (d14) was significantly lower for the channel adjacent to the natural floodplain (0.30 ± 0.17 mm; mean ± standard deviation), and did not show significant differences between the two-stage ditch and the channel (e.g., 0.52 ± 0.20 mm for point 1). A lack of pattern was detected for both d50 and d84, Pinorg and Ptot. The highest d50 was measured in sampling site 5 (2.60 ± 0.99 mm). Although affected by hydrology (Figure S1), SRP in the sediments showed consistently higher values for sampling sites 6 and 7 (1.26 ± 0.55 μg P gDW−1 for site 6) than for the other sites (0.56 ± 0.18 μg P gDW−1 for site 1). The organic matter content was constant for sites 1 –5 (0.74 ± 0.48 mg gDW−1 for site 1) and significantly higher for site 6 (2.52 ± 2.01 mg gDW−1), and with intermediate values for site 7. The fine organic matter content followed the same pattern.
3.3. Effect of the Site on Respiration Rate
Respiration rate showed little variability (IQR = 0.64–1.68 µg O2 gDW−1 h−1, corresponding to 1.00–2.62 g O2 m2 d−1). Also, the respiration rate was not affected by hydrology (Section 3.5). Thus data were pooled by site. The Tukey′s HSD test showed no significant differences in respiration rates between points 1–5 within the straightened channel course (1.05 ± 0.69 µg O2 gDW−1 h−1 for site 1; Figure 4; S2). Site 6 (meandering section within natural floodplain) showed a respiration rate (2.71 ± 1.90 µg O2 gDW−1 h−1) significantly higher than all the upstream points, while the most downstream point had intermediate rates. A linear regression model showed that the sediment organic matter content could explain 35.2% of the benthic respiration rate variance (as computed by R2). Additional terms, including the sampling site and the hydrological event, were not significant (ANOVA, F(134, 168) = 0.98, p = 0.55).
3.4. Effect of the Site on EPC0
On the contrary, EPC0 was affected by hydrological conditions at sites 1, 2, 5, and 7 (Figure 5). For the sites located in channelized sections, the highest EPC0 values were measured in the post-flood sampling, respectively 93 ± 16 μg P L−1 for site 1, 67 ± 5 μg P L−1 for site 2, and 87 ± 27 μg P L−1 for site 5. For sites located in the channel adjacent to the two-stage ditch, EPC0 was below 50 μg P L−1 for point 3, and 75 μg P L−1 for point 4 and was not significantly influenced by the hydrological event. At site 6, EPC0 ranged from 13 to 86 μg P L−1, showing no hydrological influence. At site 7, EPC0 showed a significantly decreasing trend from baseflow to post-bankfull and post-flood samplings. Overall, sediments were either in equilibrium or acted as an SRP source for the water column. Sites located in channelized reaches without riparian areas were more likely to be a source, while sites located next to the floodplain were more likely to be in equilibrium. Sites adjacent to the two-stage ditch showed both conditions.
3.5. Effect of Hydrology on Stocks and Processes
Analyzed stocks and processes showed different sensitivity to the hydrological condition (the detailed results of the statistical analyses are reported in Table S1). Among the grain size parameters, only the coarse fraction (d84, interquartile range IQR = 3.01–6.15 mm) showed significant hydrological impacts at most sites (for sites 2, 3, 4, 5, and 7; p < 0.05). The median grain size (d50, IQR = 0.96–2.24 mm) and the specific surface (Ss, IQR = 0.11–0.20 m2 gDW−1) were only affected at sites 2 and 5 (p < 0.05), while the fine fraction (d14, interquartile range, IQR = 0.37–0.70 mm) did not show any significant effects of the hydrological condition (p > 0.05 for all sites). Similarly, neither organic matter content (OM, IQR = 0.58–1.21 mg gDW−1) and its fractions (OMf, IQR = 0.76–2.04 mg gDW−1; OMc, IQR = 0.48–0.73 mg gDW−1) nor Pinorg (IQR = 208.9–295.4 μg P gDW−1) and Ptot (IQR = 311.5–580.8 μg P gDW−1) were strongly affected by hydrology (p > 0.05 for most sites; Table S1). SRP concentrations in the sediments (IQR = 0.51–1.09 μg P gDW−1) showed hydrological impacts at the sites 1, 2, 3, 5, and 7, whereby the SRP values were significantly lower during BK2 than during the other sampling dates (p < 0.05; Table S1, Figure S1). Likewise, EPC0 (IQR = 36.4–67.1 μg P L−1) was affected by hydrology at sites 1, 2, 5, and 7 (p < 0.05; Table S1). While EPC0 was highest at sites 1, 2, 4, and 5 during the flood, the opposite pattern could be observed at site 7 (Figure 5). Benthic respiration rates (IQR = 0.64–1.68 mg O2 gDW−1 h−1) were mostly not affected by hydrology, with the only exception of site 5 (p < 0.05; Table S1). Overall, sites 2 (upstream of the ditch), 3 (upper end of ditch), and 5 (channel between ditch and floodplain) were mostly affected by hydrology, while sites 6 (within floodplain) and 4 (middle part of ditch) were not or hardly affected.
4. Discussion
4.1. Effects of the Two-Stage Ditch and the Floodplain on Structural Parameters
Contrary to our assumptions, neither sediment texture nor the sediments’ OM or P stocks differed significantly between the channel within the two-stage ditch and the sampling sites up- and downstream of the ditch. Only the meandering reach at the natural floodplain showed significant differences to the other sampling sites by featuring smaller grain sizes and higher OM and SRP concentrations in the sediments, contrary to our expectation of improved sediment conditions. Thus, we assume the local channel morphology to be more important than the riparian areas’ morphology and vegetation. Meandering sections are characterized by reduced stream power and thus accumulations of fine sediments and OM. On the contrary, fines and OM are mainly washed out in channelized sections. In this regard, the two-stage ditch keeps the flow constrained in the channel with a low wetted perimeter until bankfull discharge is reached, thus resembling more a channelized section [57]. Here, high-energy instream hydraulic conditions may mask the effects of reduced lateral inputs and increased sedimentation on floodplains.
The limited effects of both the sampling sites and hydrological events on sediment characteristics can also be explained by coarse sand being the dominant substrate type of the Maltsch river. This grain size class has the lowest critical velocity for incipient motion compared to coarser and finer materials [58], and substrate instability can also occur during low flows [17,47]. However, mobilized sediments are locally replaced by either freshly eroded sediment or sediment located in the upstream channel [47]. Thus, the FBMDs show both high stability and high sediment turnover. Their occurrence is determined by local hydrodynamic equilibrium conditions. To effectively halt FBMDs, actions in the catchments can be more effective than the two-stage ditch. For instance, sediment retention ponds can be located strategically in areas subjected to high soil erosion to trap sediments [59]. Alternatively, vegetated filter strips can be located on the river banks to prevent sediments carried by overland flows from being transported in the stream [60].
Consistent with sediment texture, inorganic P and total P did not differ significantly among sites and events, indicating high sediment turnover in the study area coupled with a relatively homogeneous sediment source [47]. On the contrary, SRP concentrations in the sediments were affected by hydrology. SRP represents the most labile P fraction in the sediments contained in the pore water or loosely attached to particles. Sedimentary SRP tends to equilibrate with stream water SRP during periods of low biological activity and is an important P source for sediment biofilms during high biological activity [44,61]. Thus, SRP concentrations in the sediments may change independently of sediment turnover and dependently on hydrology [62], making it a non-ideal parameter for monitoring restoration effects on sediment texture.
The limited effects of hydrology and site on the structural parameters can also be explained with the limited spatial extent covered by the two-stage ditch. Implementing this restoration technique over longer channel reaches can result in higher sediment trapping during high flows [34], and improved channel transport capacity over low flows [57]. Hydrological models can significantly support the planning process at the catchment scale, especially when the information gained in the field monitoring is used to inform the models [60,63].
4.2. Effects of the Two-Stage Ditch and the Floodplain on Sediment Processes
Benthic respiration has been used in stream health monitoring because of its sensitivity to catchment disturbances (such as nutrient and organic matter loads) and site-specific parameters such as sediment texture and organic matter content [11,64,65]. At the reach scale, the sediment stability affects the respiration rate by disrupting the biofilms [41]. The measured values were in line with reported literature values of 1–5 g O2 m2 d−1 typical of first- to third-order streams [64]. However, similar to the sediment characteristics, only the meandering channel within the natural floodplain differed significantly from the other sites due to higher benthic respiration rates, corresponding to our expectations. The increased benthic respiration could be explained by the smaller grain sizes and the higher organic matter content at this site, offering aquatic microbes a larger area for colonization and more carbon resources [65,66]. The lack of response to either the two-stage ditch restoration or the hydrological event is probably due to the same two stream-specific factors as for the sediment texture, i.e., sediment type and its mobility. Increased instream habitat heterogeneity and increased lateral connectivity with floodplains are recognized to be key drivers for an increased benthic respiration rate [67,68]. Restoration actions aiming at mimicking the lateral connectivity and the habitat heterogeneity of the natural floodplains could be helpful to this end.
The EPC0 is a common tool to assess P sorption interactions between sediments and the water column in streams, as it estimates the phosphorus buffering capacity of benthic sediments [44,69]. EPC0 is sensitive to hydrological events [37,44], fresh sediment inputs [70,71], and excessive SRP loads due to point source and diffuse pollution [70]. Furthermore, EPC0 can incorporate information on past biogeochemical changes in the stream network, affecting in-stream P cycling [44]. In our study, EPC0 showed clear site-specific differences depending on the hydrological event. According to our expectations, EPC0 showed a tendency to be lower at the sites within the two-stage ditch and the natural floodplain than at the other sites in the post-flood period and (partly) during baseflow. Furthermore, the sites within the two-stage ditch and the natural floodplain were characterized by generally low EPC0 values independent of the hydrological events and sediment texture, indicating that the sediments had a generally higher adsorption potential at the other sites. The low EPC0 at these sites can be explained by protection from lateral terrestrial inputs (for the two-stage ditch) and increased deposition of P-loaded sediments from upstream reaches on the floodplain areas (for both the two-stage ditch and the natural floodplain) during flooding [72,73]. In the post flood-sampling, EPC0 showed the highest differences to water column SRP concentrations in the channelized sections, suggesting that eroded soil from the catchment presents the main P source for the Maltsch river. Increased EPC0 after rain events has also been observed in other studies [37,74]. Flood dynamics can be related to heavy precipitation and the introduction of freshly eroded sediments from P-rich sources or remobilization of formerly deposited P-rich sediments from the stream bed [38]. The pre-event history can explain the variation in EPC0 among supposedly similar hydrological events in our study. For instance, the baseflow and bankfull events sampled in 2018 (BF1 and BK1) occurred after an extended period of low discharge. On the contrary, the periods before the baseflow and bankfull events sampled in 2019 (BF2 and BK2) were interrupted by several small to medium discharge peaks. Overall, EPC0 showed to be sensitive to site-specific behavior to current and past hydrological conditions.
4.3. Responses of Structural and Functional Parameters to Restoration Measures
Contrary to our expectations, we did not observe that functional parameters responded stronger to the restoration measures than the structural parameter. Only EPC0 showed an improvement of sediment conditions in the sections adjacent to the two-stage ditch and the floodplain. However, the monitoring of sediment structure and stocks was in line with the observed high sediment mobility and turnover in this and similar surrounding catchments. The proposed monitoring scheme combines structural and functional parameters to provide complementary information on the system [8,12]. This study also shows that preliminary information on the system is required to set up an efficient program for monitoring restoration measures. In our study area, monitoring sediment textural responses to different flow conditions would not be an efficient strategy, given the sediments′ mobility. Monitoring different hydrological conditions allowed for an in-depth understanding of the functioning of the investigated system. In fact, we show how some of the monitored processes depend on the recent hydrological history: a monitoring program involving occasional sampling regardless of the flow conditions would most likely fail in detecting the flow-dependent trends in phosphorous adsorption capacity [44]. Our sampling scheme could however be further improved. For instance, disentangling the longitudinal and lateral connectivity patterns would allow for precise estimates of the retention potential of the two-stage ditch and the natural floodplains [29]. Estimating the lateral connectivity of the two-stage ditch would also allow for optimizing the design, e.g., by identifying the optimal ditch elevation that maximizes the connectivity with the constrain of maximizing the stream transport capacity [36].
The effects of the two-stage ditch were limited in space, as the reduced EPC0 during flooding was not observed in the channelized reach downstream. On the contrary, the effects of the natural floodplain were also detected in downstream sites. While river restoration aims at restoring entire stream systems, measures are generally implemented in few spatially restricted sections [75]. Land availability and other constraints (e.g., flood protection) limit the selection of sections where restoration measures are implemented, yielding sub-optimal spatial configurations [76]. The monitoring of restoration as done in this study can support the restoration planning by determining the length of the downstream reach for which the impacts of restoration are still visible, supporting the definition of a minimum density of actions that improve the entire river system [60].
5. Conclusions
In this paper, we measured the potential of a two-stage ditch in improving the sediment conditions employing both functional and structural parameters under different hydrologic conditions. Only the phosphorus adsorption capacity was affected by the presence of a floodplain, whether artificial (two-stage ditch) or natural. The sediments in the channelized reaches were more likely to be P sources, while they were more in equilibrium with the water column next to the natural floodplains and the two-stage ditch. Structural parameters and respiration only changed due to the diverse channel morphology at the natural floodplain site, showing a higher fraction of fines and higher benthic respiration rates. However, structural parameters helped explain the lack of sediment improvement by the two-stage ditch. Thus, river restoration monitoring can significantly benefit from both structural parameters framing the context and functional parameters providing information about key ecosystem processes and services.
Functional parameters such as the EPC0 may respond fast to even small increases in the discharge and may need longer to equilibrate than structural parameters. Of the two functional parameters measured, the phosphorous adsorption capacity proved to be the most sensitive parameter to assess sediment changes due to altered riparian zones and hydrology. Thus, we recommend this parameter to be selected in future studies aiming to study the response of river sediments to restoration under different hydrological conditions.
Supplementary Materials
The following are available online at https://www.mdpi.com/article/10.3390/w13152046/s1, Figure S1: Photos of the sampling sites, Figure S2: Soluble reactive Phosphorous grouped by sampling sites and hydrological event, Figure S3: Benthic respiration rate grouped by sampling sites and hydrological event, Table S1: Full ANOVA table.
Author Contributions
Conceptualization, D.B. and G.W.; Data curation, D.B.; Formal analysis, M.P.; Funding acquisition, T.H. and G.W.; Investigation, D.B.; Methodology, G.W.; Project administration, T.H. and G.W.; Resources, T.H. and G.W.; Software, D.B.; Supervision, T.H. and G.W.; Validation, D.B.; Visualization, D.B.; Writing—original draft, D.B. and G.W.; Writing—review and editing, D.B., M.P., E.A., T.H., and G.W. All authors have read and agreed to the published version of the manuscript.”
Funding
DB received support from the EU-INTERREG project FRAMWAT (grant number CE983), the Gesellschaft für Forschungsförderung Niederösterreich m.b.H scholarship (NFB grant number SC17-002), and the Doctoral School “Human River Systems in the 21st Century (HR21)” of the University of Natural Resources and Life Sciences (BOKU), Vienna.
Institutional Review Board Statement
Not applicable.
Informed Consent Statement
Not applicable.
Data Availability Statement
The data presented in this study are available upon request.
Acknowledgments
The authors are thankful also to Laura Emily Coulson for proofreading the manuscript, Simon Vitecek for the useful statistics suggestions, Christoph Hauer and Peter Flödl for providing the information on the cross sections.
Conflicts of Interest
The authors declare no conflict of interest. The funders had no role in the design of the study; in the collection, analyses, or interpretation of data; in the writing of the manuscript, or in the decision to publish the results.
References
- Palmer, M.A.; Bernhardt, E.S.; Allan, J.D.; Lake, P.S.; Alexander, G.; Brooks, S.; Carr, J.; Clayton, S.; Dahm, C.N.; Follstad Shah, J.; et al. Standards for ecologically successful river restoration. J. Appl. Ecol. 2005, 42, 208–217. [Google Scholar] [CrossRef]
- Bernhardt, E.S.; Palmer, M.A.; Allan, J.D.; Alexander, G.; Barnas, K.; Brooks, S.; Carr, J.; Clayton, S.; Dahm, C.; Follstad-Shah, J. Synthesizing US river restoration efforts 2005. Science 2005, 308, 636–637. [Google Scholar] [CrossRef] [PubMed]
- Wohl, E.; Lane, S.N.; Wilcox, A.C. The science and practice of river restoration. Water Resour. Res. 2015, 51, 5974–5997. [Google Scholar] [CrossRef] [Green Version]
- Palmer, M.; Ruhi, A. Linkages between flow regime, biota, and ecosystem processes: Implications for river restoration. Science 2019, 365. [Google Scholar] [CrossRef] [PubMed] [Green Version]
- Lin, Q.; Zhang, Y.; Marrs, R.; Sekar, R.; Luo, X.; Wu, N. Evaluating ecosystem functioning following river restoration: The role of hydromorphology, bacteria, and macroinvertebrates. Sci. Total Environ. 2020, 743, 140583. [Google Scholar] [CrossRef] [PubMed]
- Pander, J.; Geist, J. Ecological indicators for stream restoration success. Ecol. Indic. 2013, 30, 106–118. [Google Scholar] [CrossRef]
- Haase, P.; Hering, D.; Jähnig, S.C.; Lorenz, A.W.; Sundermann, A. The impact of hydromorphological restoration on river ecological status: A comparison of fish, benthic invertebrates, and macrophytes. Hydrobiologia 2013, 704, 475–488. [Google Scholar] [CrossRef]
- Sandin, L.; Solimini, A.G. Freshwater ecosystem structure-function relationships: From theory to application. Freshw. Biol. 2009, 54, 2017–2024. [Google Scholar] [CrossRef]
- Bunn, S.E.; Davies, P.M. Biological processes in running waters and their implications for the assessment of ecological integrity. Hydrobiologia 2000, 422–423, 61–70. [Google Scholar] [CrossRef] [Green Version]
- Clapcott, J.E.; Collier, K.J.; Death, R.G.; Goodwin, E.O.; Harding, J.S.; Kelly, D.; Leathwick, J.R.; Young, R.G. Quantifying relationships between land-use gradients and structural and functional indicators of stream ecological integrity. Freshw. Biol. 2012, 57, 74–90. [Google Scholar] [CrossRef]
- Fellows, C.S.; Clapcott, J.E.; Udy, J.W.; Bunn, S.E.; Harch, B.D.; Smith, M.J.; Davies, P.M. Benthic metabolism as an indicator of stream ecosystem health. Hydrobiologia 2006, 572, 71–87. [Google Scholar] [CrossRef] [Green Version]
- Young, R.G.; Collier, K.J. Contrasting responses to catchment modification among a range of functional and structural indicators of river ecosystem health. Freshw. Biol. 2009, 54, 2155–2170. [Google Scholar] [CrossRef] [Green Version]
- Ryder, D.S.; Miller, W. Setting goals and measuring success: Linking patterns and processes in stream restoration. Hydrobiologia 2005, 552, 147–158. [Google Scholar] [CrossRef]
- Keesstra, S.; Nunes, J.; Novara, A.; Finger, D.; Avelar, D.; Kalantari, Z.; Cerdà, A. The superior effect of nature based solutions in land management for enhancing ecosystem services. Sci. Total Environ. 2018, 610–611, 997–1009. [Google Scholar] [CrossRef] [PubMed] [Green Version]
- Borrelli, P.; Robinson, D.A.; Panagos, P.; Lugato, E.; Yang, J.E.; Alewell, C.; Wuepper, D.; Montanarella, L.; Ballabio, C. Land use and climate change impacts on global soil erosion by water (2015–2070). Proc. Natl. Acad. Sci. USA 2020, 117, 21994–22001. [Google Scholar] [CrossRef] [PubMed]
- Lisle, T.E.; Hilton, S. Fine bed material in pools of natural gravel bed channels. Water Resour. Res. 1999, 35, 1291–1304. [Google Scholar] [CrossRef]
- Hauer, C. Review of hydro-morphological management criteria on a river basin scale for preservation and restoration of freshwater pearl mussel habitats. Limnologica 2015, 50, 40–53. [Google Scholar] [CrossRef]
- Geist, J.; Auerswald, K. Physicochemical stream bed characteristics and recruitment of the freshwater pearl mussel (Margaritifera margaritifera). Freshw. Biol. 2007, 52, 2299–2316. [Google Scholar] [CrossRef]
- Mueller, M.; Pander, J.; Wild, R.; Lueders, T.; Geist, J. The effects of stream substratum texture on interstitial conditions and bacterial biofilms: Methodological strategies. Limnologica 2013, 43, 106–113. [Google Scholar] [CrossRef]
- Scheder, C.; Lerchegger, B.; Flödl, P.; Csar, D.; Gumpinger, C.; Hauer, C. River bed stability versus clogged interstitial: Depth-dependent accumulation of substances in freshwater pearl mussel (Margaritifera margaritifera L.) habitats in Austrian streams as a function of hydromorphological parameters. Limnologica 2015, 50, 29–39. [Google Scholar] [CrossRef]
- Sternecker, K.; Geist, J. The effects of stream substratum composition on the emergence of salmonid fry. Ecol. Freshw. Fish 2010, 19, 537–544. [Google Scholar] [CrossRef]
- Larsen, S.; Vaughan, I.P.; Ormerod, S.J. Scale-dependent effects of fine sediments on temperate headwater invertebrates. Freshw. Biol. 2009, 54, 203–219. [Google Scholar] [CrossRef]
- Leitner, P.; Hauer, C.; Ofenböck, T.; Pletterbauer, F.; Schmidt-Kloiber, A.; Graf, W. Fine sediment deposition affects biodiversity and density of benthic macroinvertebrates: A case study in the freshwater pearl mussel river Waldaist (Upper Austria). Limnologica 2015, 50, 54–57. [Google Scholar] [CrossRef]
- Baldan, D.; Piniewski, M.; Funk, A.; Gumpinger, C.; Flödl, P.; Höfer, S.; Hauer, C.; Hein, T. A multi-scale, integrative modeling framework for setting conservation priorities at the catchment scale for the Freshwater Pearl Mussel Margaritifera margaritifera. Sci. Total Environ. 2020, 718. [Google Scholar] [CrossRef] [PubMed]
- Baldan, D.; Kiesel, J.; Hauer, C.; Jähnig, S.C.; Hein, T. Increased sediment deposition triggered by climate change impacts Freshwater Pearl Mussels habitats and metapopulations. J. Appl. Ecol. 2021. [Google Scholar] [CrossRef]
- Naden, P.S.; Murphy, J.F.; Old, G.H.; Newman, J.; Scarlett, P.; Harman, M.; Duerdoth, C.P.; Hawczak, A.; Pretty, J.L.; Arnold, A.; et al. Understanding the controls on deposited fine sediment in the streams of agricultural catchments. Sci. Total Environ. 2016, 547, 366–381. [Google Scholar] [CrossRef] [Green Version]
- Roley, S.S.; Tank, J.L.; Stephen, M.L.; Johnson, L.T.; Beaulieu, J.J.; Witter, J.D. Floodplain restoration enhances denitrification and reach-scale nitrogen removal in an agricultural stream. Ecol. Appl. 2012, 22, 281–297. [Google Scholar] [CrossRef] [PubMed] [Green Version]
- Wohl, E.; Castro, J.; Cluer, B.; Merritts, D.; Powers, P.; Staab, B. Rediscovering, Reevaluating, and Restoring Lost River-Wetland Corridors. Front. Earth Sci. 2021, 9, 511. [Google Scholar] [CrossRef]
- Scheel, K.; Morrison, R.R.; Annis, A.; Nardi, F. Understanding the Large-Scale Influence of Levees on Floodplain Connectivity Using a Hydrogeomorphic Approach. J. Am. Water Resour. Assoc. 2019, 55, 413–429. [Google Scholar] [CrossRef]
- Morrison, R.R.; Bray, E.; Nardi, F.; Annis, A.; Dong, Q. Spatial Relationships of Levees and Wetland Systems within Floodplains of the Wabash Basin, USA. J. Am. Water Resour. Assoc. 2018, 54, 934–948. [Google Scholar] [CrossRef]
- Li, Y.; Tan, Z.; Zhang, Q.; Liu, X.; Chen, J.; Yao, J. Refining the concept of hydrological connectivity for large floodplain systems: Framework and implications for eco-environmental assessments. Water Res. 2021, 195, 117005. [Google Scholar] [CrossRef]
- Tan, Z.; Li, Y.; Zhang, Q.; Liu, X.; Song, Y.; Xue, C.; Lu, J. Assessing effective hydrological connectivity for floodplains with a framework integrating habitat suitability and sediment suspension behavior. Water Res. 2021, 201, 117253. [Google Scholar] [CrossRef]
- Mahl, U.H.; Tank, J.L.; Roley, S.S.; Davis, R.T. Two-Stage Ditch Floodplains Enhance N-Removal Capacity and Reduce Turbidity and Dissolved P in Agricultural Streams. J. Am. Water Resour. Assoc. 2015, 51, 923–940. [Google Scholar] [CrossRef]
- Davis, R.T.; Tank, J.L.; Mahl, U.H.; Winikoff, S.G.; Roley, S.S. The Influence of Two-Stage Ditches with Constructed Floodplains on Water Column Nutrients and Sediments in Agricultural Streams. J. Am. Water Resour. Assoc. 2015, 51, 941–955. [Google Scholar] [CrossRef]
- Krider, L.; Magner, J.; Hansen, B.; Wilson, B.; Kramer, G.; Peterson, J.; Nieber, J. Improvements in Fluvial Stability Associated with Two-Stage Ditch Construction in Mower County, Minnesota. J. Am. Water Resour. Assoc. 2017, 53, 886–902. [Google Scholar] [CrossRef]
- D’Ambrosio, J.L.; Ward, A.D.; Witter, J.D. Evaluating Geomorphic Change in Constructed Two-Stage Ditches. J. Am. Water Resour. Assoc. 2015, 51, 910–922. [Google Scholar] [CrossRef]
- McDowell, R.W.; Simpson, Z.P.; Stenger, R.; Depree, C. The influence of a flood event on the potential sediment control of baseflow phosphorus concentrations in an intensive agricultural catchment. J. Soils Sediments 2019, 19, 429–438. [Google Scholar] [CrossRef]
- Hoffman, A.R.; Armstrong, D.E.; Lathrop, R.C.; Penn, M.R. Characteristics and influence of phosphorus accumulated in the bed sediments of a stream located in an agricultural watershed. Aquat. Geochem. 2009, 15, 371–389. [Google Scholar] [CrossRef]
- Froelich, P.N. Kinetic control of dissolved phosphate in natural rivers and estuaries: A primer on the phosphate buffer mechanism 1. Limnol. Oceanogr. 1988, 33, 649–668. [Google Scholar] [CrossRef]
- Uehlinger, U.; Naegeli, M.; Fisher, S.G. A heterotrophic desert stream? The role of sediment stability. West. North Am. Nat. 2002, 466–473. [Google Scholar]
- Atkinson, B.L.; Grace, M.R.; Hart, B.T.; Vanderkruk, K.E.N. Sediment instability affects the rate and location of primary production and respiration in a sand-bed stream. J. N. Am. Benthol. Soc. 2008, 27, 581–592. [Google Scholar] [CrossRef]
- Stutter, M.; Kronvang, B.; Ó hUallacháin, D.; Rozemeijer, J. Current insights into the effectiveness of riparian management, attainment of multiple benefits, and potential technical enhancements. J. Environ. Qual. 2019, 48, 236–247. [Google Scholar] [CrossRef] [Green Version]
- Hutchins, M.G.; Harding, G.; Jarvie, H.P.; Marsh, T.J.; Bowes, M.J.; Loewenthal, M. Intense summer floods may induce prolonged increases in benthic respiration rates of more than one year leading to low river dissolved oxygen. J. Hydrol. X 2020, 8, 100056. [Google Scholar] [CrossRef]
- Stutter, M.I.; Lumsdon, D.G. Interactions of land use and dynamic river conditions on sorption equilibria between benthic sediments and river soluble reactive phosphorus concentrations. Water Res. 2008, 42, 4249–4260. [Google Scholar] [CrossRef] [PubMed]
- GBA Geologische Bundesanstalt, Bundesministerium fur Bildung. Wissenschaft un Forshung, Wien. Available online: https://www.geologie.ac.at. (accessed on 26 July 2021).
- Büttner, G. CORINE land cover and land cover change products. In Land use and land cover mapping in Europe; Springer: Berlin/Heidelberg, Germany, 2014; pp. 55–74. [Google Scholar]
- Hauer, C.; Höfler, S.; Dossi, F.; Flödl, P.; Graf, W.; Gstöttenmayr, D.; Gumpinger, C.; Holzinger, J.; Huber, T.; Janecek, B.; et al. Feststoffmanagement im Mühlviertel und im Bayerischen Wald. Endbericht. 2015. Available online: https://www.land-oberoesterreich.gv.at/Mediendateien/Formulare/Dokumente%20UWD%20Abt_WW/Endbericht_Feststoffmanagement.pdf (accessed on 26 July 2021).
- HDLO Discharge for leopoldschlag gauging stationm, Hydrographischer Dienst des Landes Oberösterreich (Linz). Available online: https://hydro.ooe.gv.at/#0150 (accessed on 26 July 2021).
- Doyle, M.W.; Shields, D.; Boyd, K.F.; Skidmore, P.B.; Dominick, D.W. Channel-forming discharge selection in river restoration design. J. Hydraul. Eng. 2007, 133, 831–837. [Google Scholar] [CrossRef]
- Ruban, V.; López-Sánchez, J.F.; Pardo, P.; Rauret, G.; Muntau, H.; Quevauviller, P. Harmonized protocol and certified reference material for the determination of extractable contents of phosphorus in freshwater sediments—A synthesis of recent works. Anal. Bioanal. Chem. 2001, 370, 224–228. [Google Scholar] [CrossRef]
- Malá, J.; Lagová, M. Comparison of digestion methods for determination of total phosphorus in river sediments. Chem. Pap. 2014, 68, 1015–1021. [Google Scholar] [CrossRef]
- Lucci, G.M.; McDowell, R.W.; Condron, L.M. Evaluation of base solutions to determine equilibrium phosphours concentrations [EPC0] in stream sediments. Int. Agrophysics 2010, 24, 157–163. [Google Scholar]
- McDaniel, M.D.; David, M.B.; Royer, T. V Relationships between benthic sediments and water column phosphorus in Illinois streams. J. Environ. Qual. 2009, 38, 607–617. [Google Scholar] [CrossRef] [PubMed]
- House, W.A.; Denison, F.H. Factors influencing the measurement of equilibrium phosphate concentrations in river sediments. Water Res. 2000, 34, 1187–1200. [Google Scholar] [CrossRef]
- Warkentin, M.; Freese, H.M.; Karsten, U.; Schumann, R. New and fast method to quantify respiration rates of bacterial and plankton communities in freshwater ecosystems by using optical oxygen sensor spots. Appl. Environ. Microbiol. 2007, 73, 6722–6729. [Google Scholar] [CrossRef] [PubMed] [Green Version]
- R Core Team. R: A Language and Environment for Statistical Computing 2020; R Core Team: Vienna, Austria, 2020. [Google Scholar]
- Flödl, P.; Hauer, C. Studies on morphological regime conditions of bi-modal grain size rivers: Challenges and new insights for freshwater pearl mussel habitats. Limnologica 2019, 79, 125729. [Google Scholar] [CrossRef]
- Hjülström, F. Studies of the morphological activity of rivers as illustrated by the River Fyris, Bulletin. Geol. Inst. Upsalsa 1935, 25, 221–527. [Google Scholar]
- Mekonnen, M.; Keesstra, S.D.; Stroosnijder, L.; Baartman, J.E.M.; Maroulis, J. Soil Conservation Through Sediment Trapping: A Review. L. Degrad. Dev. 2015, 26, 544–556. [Google Scholar] [CrossRef]
- Baldan, D.; Mehdi, B.; Feldbacher, E.; Piniewski, M.; Hauer, C.; Hein, T. Assessing multi-scale effects of natural water retention measures on in-stream fine bed material deposits with a modeling cascade. J. Hydrol. 2020, 125702. [Google Scholar] [CrossRef]
- McDowell, R.W.; Sharpley, A.N. Uptake and Release of Phosphorus from Overland Flow in a Stream Environment. J. Environ. Qual. 2003, 32, 937–948. [Google Scholar] [CrossRef]
- Preiner, S.; Bondar-Kunze, E.; Pitzl, B.; Weigelhofer, G.; Hein, T. Effect of Hydrological Connectivity on the Phosphorus Buffering Capacity of an Urban Floodplain. Front. Environ. Sci. 2020, 8, 147. [Google Scholar] [CrossRef]
- Christopher, S.F.; Tank, J.L.; Mahl, U.H.; Yen, H.; Arnold, J.G.; Trentman, M.T.; Sowa, S.P.; Herbert, M.E.; Ross, J.A.; White, M.J.; et al. Modeling nutrient removal using watershed-scale implementation of the two-stage ditch. Ecol. Eng. 2017, 108, 358–369. [Google Scholar] [CrossRef]
- Hill, B.H.; Hall, R.K.; Husby, P.; Herlihy, A.T.; Dunne, M. Interregional comparisons of sediment microbial respiration in streams. Freshw. Biol. 2000, 44, 213–222. [Google Scholar] [CrossRef]
- Stutter, M.I.; Cains, J. Changes in aquatic microbial responses to C-substrates with stream water and sediment quality related to land use pressures. Chemosphere 2017, 184, 548–558. [Google Scholar] [CrossRef]
- Bott, T.L.; Newbold, J.D.; Arscott, D.B. Ecosystem metabolism in Piedmont streams: Reach geomorphology modulates the influence of riparian vegetation. Ecosystems 2006, 9, 398–421. [Google Scholar] [CrossRef]
- Hoellein, T.J.; Tank, J.L.; Entrekin, S.A.; Rosi-Marshall, E.J.; Stephen, M.L.; Lamberti, G.A. Effects of benthic habitat restoration on nutrient uptake and ecosystem metabolism in three headwater streams. River Res. Appl. 2012, 28, 1451–1461. [Google Scholar] [CrossRef]
- Roley, S.S.; Tank, J.L.; Griffiths, N.A.; Hall, R.O.; Davis, R.T. The Influence of Floodplain Restoration on Whole-Stream Metabolism in an Agricultural Stream: Insights fa 5-yrom ear Continuous Data Set. Freshw. Sci. 2014, 33, 1043–1059. [Google Scholar] [CrossRef]
- Simpson, Z.P.; McDowell, R.W.; Condron, L.M.; McDaniel, M.D.; Jarvie, H.P.; Abell, J.M. Sediment phosphorus buffering in streams at baseflow: A meta-analysis. J. Environ. Qual. 2021, 50, 287–311. [Google Scholar] [CrossRef] [PubMed]
- Weigelhofer, G.; Ramião, J.P.; Puritscher, A.; Hein, T. How do chronic nutrient loading and the duration of nutrient pulses affect nutrient uptake in headwater streams? Biogeochemistry 2018, 141, 249–263. [Google Scholar] [CrossRef] [Green Version]
- Xu, G.; Song, J.; Zhang, Y.; Lv, Y.; Han, G. Enhancement of phosphorus storage capacity of sediments by coastal wetland restoration, Yellow River Delta, China. Mar. Pollut. Bull. 2020, 150, 110666. [Google Scholar] [CrossRef] [PubMed]
- Moustakidis, I.V.; Schilling, K.E.; Weber, L.J. Soil total phosphorus deposition and variability patterns across the floodplains of an Iowa river. Catena 2019, 174, 84–94. [Google Scholar] [CrossRef]
- Bai, Y.; Zeng, Y. Lateral distribution of sediment and phosphorus in a two-stage ditch with partial emergent vegetation on the floodplain. Environ. Sci. Pollut. Res. 2019, 26, 29351–29365. [Google Scholar] [CrossRef]
- Agudelo, S.C.; Nelson, N.O.; Barnes, P.L.; Keane, T.D.; Pierzynski, G.M. Phosphorus Adsorption and Desorption Potential of Stream Sediments and Field Soils in Agricultural Watersheds. J. Environ. Qual. 2011, 40, 144–152. [Google Scholar] [CrossRef] [PubMed]
- Bernhardt, E.S.; Palmer, M.A. River restoration: The fuzzy logic of repairing reaches to reverse catchment scale degradation. Ecol. Appl. 2011, 21, 1926–1931. [Google Scholar] [CrossRef]
- Langhans, S.D.; Hermoso, V.; Linke, S.; Bunn, S.E.; Possingham, H.P. Cost-effective river rehabilitation planning: Optimizing for morphological benefits at large spatial scales. J. Environ. Manage. 2014, 132, 296–303. [Google Scholar] [CrossRef] [PubMed]
Figure 1.
Study site overview (left), including the drawing of three representative cross sections (right). The blue arrow shows the direction of the flow; the numbers indicate the sampling sites. The channelized cross section is representative of the pre-restoration status.
Figure 1.
Study site overview (left), including the drawing of three representative cross sections (right). The blue arrow shows the direction of the flow; the numbers indicate the sampling sites. The channelized cross section is representative of the pre-restoration status.

Figure 2.
Discharge recorded by the gauging station in Leopoldschlag for the period the sampling was conducted. The dotted vertical lines indicate the day samples were collected. BK = bankfull, BF = baseflow, FL = flood. The horizontal bands indicate the interquartile range of the yearly flow percentiles for low (10th), medium (50th), and high (90th) flow, calculated for the years 1991–2016.

Figure 3.
Principal component analysis with the sampled parameters. In (a), arrows indicate the projection of each multivariate axis on the first two principal component axis (PC1 and PC2). Points represent individual samples. Subplots (b) and (c) represent the centroids of the data points aggregated respectively by sampling site and event. The points in (b) and (c) represent the cloud centroid; the bars represent the standard deviations.

Figure 4.
The boxplots represent the variability of the respiration rate across the sampling sites; the hydrological conditions were pooled (n = 25). Hydrological events are pooled for each sampling site. Letters above the boxplot represent the clusters identified in the Tukey′s HSD post-hoc test. Different letters (e.g., “a”, “b”, or “c”) identify a significant statistical difference. Strings with two letters identify groups that are not statistically different from the parent groups (e.g., “ab” denotes groups that are not statistically different neither from “a” nor from “b”).

Figure 5.
Boxplots represent the variability of EPC0 across sampling sites and hydrological events (n = 5). The seven panels correspond to the seven sampling sites. The letters above the boxplot represent the clusters identified in the post-hoc test. Red symbols represent the SRP values measured in the water column during the field sampling. The shape of the symbol was obtained from a one-way t-test and showed when sediments are acting as a source of SRP (upwards triangle), as a sink (downwards triangle), or are in equilibrium with the water column (circle). Note: BF = baseflow, BK = bankfull, FL = flood. Refer to Table 1 and Figure 2 for the description of the events.


Table 1.
Description of the hydrological events. BK = bankfull, BF = baseflow, FL = flood. Refer to table 3 for the full description of the sampling events.
Table 1.
Description of the hydrological events. BK = bankfull, BF = baseflow, FL = flood. Refer to table 3 for the full description of the sampling events.
| Event | Type | Sampling Date | Discharge (m3 s−1) |
|---|---|---|---|
| BF1 | Baseflow | 04.09.2018 | 0.38 * |
| BF2 | Baseflow | 16.09.2019 | 0.45 ** |
| BK1 | Bankfull | 06.06.2018 | 2.50 |
| BK2 | Bankfull | 12.06.2019 | 3.30 |
| FL | Flood | 10.07.2018 | 4.2 |
* calculated as the mean of the discharge occurring between 4 July 2018 and 4 September 2018 ** calculated as the mean of the discharge occurring between 16 July 2019 and 16 September 2019.
Table 2.
Description of the sampling sites. Refer to Figure 1 for the geographic position of the sampling sites.
Table 2.
Description of the sampling sites. Refer to Figure 1 for the geographic position of the sampling sites.
| Site | Width (m) | Distance from the Closest Upstream Point (m) | Riparian Vegetation (y/n) | Channel Type |
|---|---|---|---|---|
| 1 | 5 | - | y | Straight, fixed banks |
| 2 | 5 | 312 | y | Straight, fixed banks |
| 3 | 5 | 148 | y | Straight, fixed banks |
| 4 | 5 | 226 | y | Straight, fixed banks |
| 5 | 4 | 713 | n | Straight, fixed banks |
| 6 | 8 | 849 | y | Meandering, floodplain |
| 7 | 4 | 1173 | n | Meandering, incised |
Table 3.
Water quality values at the sampling dates. Numbers represent the variation range (min/max, n = 4). Refer to Table 1 for the description of the events.
Table 3.
Water quality values at the sampling dates. Numbers represent the variation range (min/max, n = 4). Refer to Table 1 for the description of the events.
| Event | SRP (μg P L−1) | TP (μg P L−1) | DO (mg O2 L−1) | T (°C) | Cond (μS cm−1) | pH |
|---|---|---|---|---|---|---|
| BF1 | 33/51 | 47/67 | 8.81/9.38 | 14.5/15.2 | 89.6/109.9 | 6.2/7.3 |
| BF2 | 34/86 | n.a. | 9.33/9.85 | 13.3/14.2 | 104.7/129.4 | 6.5/6.9 |
| BK1 | 27/38 | 61/82 | n.a. | n.a. | n.a. | n.a. |
| BK2 | 26/32 | n.a. | 8.7/9.11 | 16.5/17.9 | 104.7/129.4 | 7.0/7.5 |
| FL | 22/26 | 33/75 | 8.72/9.78 | 15.2/16.4 | 102.9/124.6 | 6.6/7.3 |
Table 4.
Characteristics of the sampling sites. Means (standard deviation) of the quantities that are not affected by hydrology are reported (n = 25). Letters in the superscript represent the result of the Tukey′s post-hoc test. Refer to table S1 for the full ANOVA results. Note: SRP does not show the post-hoc test results because it was not aggregated per sampling site for further analyses. Note: d14, d50, d84 = representative grain sizes, OMf = fine organic matter, OM = organic matter, SRP = Soluble Reactive Phosphorous, Pinorg = inorganic phosphorous, Ptot = Total Phosphorous. Refer to Section 2.3 for the explanation of the superscripts.
| Site ID | d14 (mm) | d50 (mm) | d84 (mm) | OMf (mg gDW−1) | OM (mg gDW−1) | SRP (µg P gDW−1) | Pinorg (µg P gDW−1) | Ptot (µg P gDW−1) |
|---|---|---|---|---|---|---|---|---|
| 1 | 0.52 (0.20) a | 1.31 (0.68) a | 3.68 (2.03) b | 0.90 (0.50) a | 0.74 (0.48) ab | 0.56 (0.18) | 227 (67) a | 401 (145) a |
| 2 | 0.55 (0.19) a | 1.27 (0.52) a | 4.45 (2.49) ab | 0.91 (0.42) a | 0.94 (1.0) ab | 0.57 (0.27) | 244 (73) abc | 411 (152) ab |
| 3 | 0.62 (0.26) ab | 2.10 (1.16) bc | 7.26 (4.15) a | 1.80 (1.00) bc | 0.92 (0.42) ab | 0.60 (0.22) | 230 (60) a | 398 (161) a |
| 4 | 0.60 (0.20) ab | 1.67 (0.89) ab | 7.51 (5.86) a | 0.90 (0.34) a | 0.81 (0.46) ab | 0.70 (0.71) | 263 (91) abc | 466 (170) ab |
| 5 | 0.78 (0.21) b | 2.60 (0.99) c | 7.20 (2.86) a | 1.04 (0.54) ab | 0.68 (0.31) a | 0.88 (044) | 241 (69) ab | 436 (226) ab |
| 6 | 0.30 (0.17) c | 1.09 (0.70) a | 3.34 (2.81) b | 4.02 (2.00) d | 2.52 (2.01) c | 1.26 (0.55) | 314 (90) c | 570 (242) b |
| 7 | 0.50 (0.29) a | 2.16 (1.19) bc | 5.59 (2.67) ab | 2.34 (1.29) c | 1.63 (1.60) b | 1.28 (0.44) | 302 (122) bc | 544 (215) ab |
Publisher’s Note: MDPI stays neutral with regard to jurisdictional claims in published maps and institutional affiliations. |
© 2021 by the authors. Licensee MDPI, Basel, Switzerland. This article is an open access article distributed under the terms and conditions of the Creative Commons Attribution (CC BY) license (https://creativecommons.org/licenses/by/4.0/).
Share and Cite
MDPI and ACS Style
Baldan, D.; Pucher, M.; Akbari, E.; Hein, T.; Weigelhofer, G. Effects of Two-Stage Ditch and Natural Floodplains on Sediment Processes Driven by Different Hydrological Conditions. Water 2021, 13, 2046. https://doi.org/10.3390/w13152046
AMA Style
Baldan D, Pucher M, Akbari E, Hein T, Weigelhofer G. Effects of Two-Stage Ditch and Natural Floodplains on Sediment Processes Driven by Different Hydrological Conditions. Water. 2021; 13(15):2046. https://doi.org/10.3390/w13152046
Chicago/Turabian StyleBaldan, Damiano, Matthias Pucher, Elmira Akbari, Thomas Hein, and Gabriele Weigelhofer. 2021. "Effects of Two-Stage Ditch and Natural Floodplains on Sediment Processes Driven by Different Hydrological Conditions" Water 13, no. 15: 2046. https://doi.org/10.3390/w13152046
Note that from the first issue of 2016, this journal uses article numbers instead of page numbers. See further details here.