Article

Impacts of Irrigation Managements on Soil CO2 Emission and Soil CH4 Uptake of Winter Wheat Field in the North China Plain

1
Key Laboratory of Crop Water Use and Regulation, Farmland Irrigation Research Institute, Chinese Academy of Agriculture Sciences, Ministry of Agriculture and Rural Affairs, Xinxiang 453003, China
2
Graduate School, Chinese Academy of Agricultural Sciences, Beijing 100081, China
3
Department of Farm Power and Machinery, Faculty of Agricultural Engineering, Sindh Agriculture University, Tandojam 70050, Pakistan
*
Authors to whom correspondence should be addressed.
Water 2021, 13(15), 2052; https://doi.org/10.3390/w13152052
Submission received: 14 June 2021 / Revised: 13 July 2021 / Accepted: 19 July 2021 / Published: 28 July 2021

Abstract

:
The North China Plain is an important irrigated agricultural area in China. However, the effects of irrigation management on carbon emission are not well documented in this region. Due to the uneven seasonal distribution of rainfall, irrigation is mainly concentrated in the winter wheat growing season in the North China Plain. In this study, we estimated CO2 emission and soil CH4 uptake from winter wheat fields with different irrigation methods and scheduling treatments using the static chamber-gas chromatography method from April to May 2017 and 2018. Treatments included three irrigation methods (surface drip, sprinkler, and border) and three irrigation scheduling levels that initiated as soon as the soil moisture drained to 50%, 60%, and 70% of the field capacity for a 0–100 cm soil profile were tested. The results showed that both the irrigation methods and scheduling significantly influenced (p < 0.05) the cumulative CO2 and CH4 emission, grain yield, global warming potential (GWP), GWP Intensity (GWPI), GWPI per unit irrigation applied, and water use efficiency (WUE). Compared to 60% and 70% FC, 50% FC irrigation scheduling de-creased accumulated CH4 uptake 26.8–30.3% and 17.8–25.4%, and reduced accumulated CO2 emissions 7.0–15.3% and 12.6–19.4%, respectively. Conversely, 50% FC reduced GWP 6.5–13.3% and 12.5–19.4% and lower grain yield 10.4–19.7% and 8.5–16.6% compared to 60% and 70% FC irrigation scheduling in 2017 and 2018, respectively. Compared to sprinkler irrigation and border irrigation, drip irrigation at 60% FC increased the accumulated CH4 uptake 11.3–12.1% and 1.9–5.5%, while reduced the accumulated CO2 emissions from 7.5–8.8% and 10.1–12.1% in 2017 and 2018, respectively. Moreover, drip irrigation at 60% FC increased grain yield 5.2–7.5% and 6.3–6.8%, WUE 0.9–5.4% and 5.7–7.4%, and lowered GWP 8.0–9.8% and 10.1–12.0% compared to sprinkler and border irrigation in 2017 and 2018, respectively. The interaction of irrigation scheduling and irrigation methods significantly impacted accumulated CH4 uptake, cumulative CO2 amount, and GWP in 2018 only while grain yield and WUE in the entire study. Overall, drip irrigation at 60% FC is the optimal choice in terms of higher grain yield, WUE, and mitigating GWP and GWPI from winter wheat fields in North China Plain.

1. Introduction

Agriculture takes place on 37% of the global land surface [1] and results in the emission of a considerable amount of greenhouse gases (GHG), including carbon dioxide (CO2) and methane (CH4), into the atmosphere [2]. CO2 and CH4 account for approximately 64% and 17%, respectively, of the global warming potential (GWP) of the earth [3]. Because of the increasing of human in demand for food sharply, intensive agricultural management had a strong impact on agroecosystem GHG emissions [4]. In recent years, the total GHG emissions were 12,550.2 Mt CO2-eq in China, of which CO2 shared approximately 13.8% from agricultural activities and CH4 emissions comprised approximately 3.2% of the total GHG emissions from agriculture [5].
Irrigation methods and irrigation scheduling affect the distribution of water in soil and the absorption efficiency of water in crops, thus influencing the microbial activities and GHG emissions. Most common water application methods are conventional border, surface, and subsurface drip and sprinkler irrigation. In agricultural water management, irrigation methods and scheduling controls the timing and amount of water applied to the crop, which is essential in arid and semiarid regions [6]. Irrigation influences GHG emissions under different water supply conditions. Wetting and drying of soil released CO2 from the soil via soil respiration, and 99% of the CO2 emitted from the soil microflora was caused by organic matter decomposition [7]. Moreover, soil emits CO2 under a soil aerobic environment, and soil produces CH4 under an anaerobic environment. Farmland may act as a CH4 source or uptake rely on the oxygen supply for microbial community [8]. CH4 is predominantly released from the flooded soils such as rice paddy fields [9]. CH4 is emitted due to soil organic matter decomposition under anaerobic conditions in inundated fields due to over-irrigation or rainfall [10].
Zhou, et al. [11] observed that irrigation application could enhance the soil CO2 emissions by 21.9% under different climates in meta-analysis. Zornoza, et al. [12] estimated 13.4% and 38.8% reduced CO2 emissions from medium (total water applied 457 mm) and moderate (326 mm) irrigation regimes compared to a full irrigation regime treatment (694 mm), respectively, in orchard fields. Moreover, Bowles, et al. [13] estimated 23% lower soil CO2 emissions under a lower irrigation regime (total water applied 187 mm) compared with the control (full) irrigation regime (327 mm) from tomato fields. Drip irrigation under lower irrigation scheduling (total irrigation amount 364 mm) compared with higher irrigation scheduling (364 mm) reduced the cumulative CO2 emissions by 20.3% and a higher cumulative CH4 uptake by 232.1% in melon fields [14]. Similarly, drip irrigation under reduced irrigation scheduling treatment compared with full irrigation scheduling treatment decreased soil CO2 emissions by 13–25% from orchard fields [15]. Moreover, drip irrigation (with applying 4500 m3 ha−1 water) compared with furrow irrigation (with applying 6000 m3 ha−1) produced about three times higher CH4 uptake from cotton fields in Northwestern China [16]. Franco-Luesma, et al. [17] observed that when applying an equal amount of water (1215 mm) under low and higher irrigation scheduling treatment in sprinkler irrigation, CO2 emissions were not substantially higher, while CH4 uptake was higher under low irrigation scheduling (23.5%) from maize fields.
The North China Plain (NCP) is the most significant agricultural region in China and contributes approximately 76% of the total winter wheat (Triticum aestivum L.) yield of China [18]. In the NCP, few studies have been conducted on GHG emissions from irrigated lands, with less in comparing the effect of irrigation methods and scheduling on GHG emission in the crop fields. For example, Li, et al. [19] estimated 4.7% higher CO2 emissions and 8.1% higher CH4 uptake under low irrigation (total irrigation amount 420 mm) compared to higher irrigation (630 mm) from wheat fields in the NCP. Hou, et al. [20] estimated a 10.2–25.5% lower cumulative soil CO2 emissions by reducing the irrigation amount by 5.7–40% in the winter wheat field from a lower irrigation level (total irrigation amount 755.7 m3 hm2) compared with the full irrigation level (1259.4 m3 hm2) in Northwestern China. Wang, et al. [21] observed 3.7% lower CO2 emissions from surface drip irrigation compared with the sprinkler irrigation method when an equal amount of water was applied (800 m3 ha1), while surface drip irrigation lowered CO2 emissions by 2.1% (no significant higher) compared with the flood irrigation method when 50% less water was applied. In contrast, surface drip irrigation compared with sprinkler and flood irrigation showed a 31.3% and 22.9% notably higher CH4 uptake in winter wheat fields, respectively, in the NCP. However, Guo, et al. [22] found drip irrigation (1959.1 g/m2) compared with flood irrigation (1759.1 g/m2) emitted 11.4% higher CO2 emissions when drip irrigation (total irrigation amount 1050 m3 hm2) was performed at a higher frequency with a smaller amount of water compared with flood irrigation in the NCP from maize cropland. The effects of irrigation methods and scheduling on the soil CO2 and CH4 emission are controversial and alter with soil, crops, and climate. Moreover, there is a lack of data on recent estimates of global CO2 and CH4 emissions and a further lack in terms of literature reviews on water management practices. It is uncertain if irrigation intensity and irrigation methods can be employed as effective tools to mitigate soil CO2 and CH4 emissions in winter wheat production. Moreover, there exists a knowledge gap regarding the effects of irrigation methods and scheduling related to CO2 and CH4 emissions from winter wheat in the NCP.
Farmers in the NCP under conventional cultivation practices usually irrigate winter wheat 4–5 times in the growing seasons [23]. Wang, et al. [24] have observed the optimum crop water productivity of winter wheat at 50–60% of the field capacity (FC) under drip irrigation in the NCP. Therefore, this study was designed with three water scheduling levels of 50% (low), 60% (medium), and 70% (high) FC to evaluate the effect on GHG emission and crop grain yield. These irrigation scheduling levels are practically adopted by the local farmers in the NCP to obtain a higher grain yield. Consequently, we compared CO2 and CH4 emissions under three irrigation schedules that initiated at 50%, 60%, and 70% FC and three irrigation methods, surface drip irrigation, sprinkler irrigation, and border irrigation, in winter wheat fields. The objectives of the current study were to investigate soil CO2 emission and soil CH4 emission under three irrigation methods with different irrigation water scheduling, to measure the trade-off between CO2 and CH4 emission and soil environmental variables, and to determine the optimal irrigation practice for winter wheat production in the NCP, which will be helpful for estimating accurately GHG emission from agricultural fields and establishing the optimal farming system in the NCP. Our results will present some valuable data to the farmers and researchers of this region to implement feasible and environmentally sustainable irrigation management.

2. Materials and Methods

2.1. Site Description

The experiment was conducted at the experimental station of the Farmland Irrigation Research Institute, Chinese Academy of Agricultural Science (35°08′ N, 113°45′ E, elevation 81 m), located in Qiliying town, Xinxiang City, Henan Province in the NCP. The experimental fields are irrigated with groundwater. The seedbed was prepared by a tractor-drawn rotary cultivator up to a depth of 20 cm to form a smoothed seedbed. Nitrogen (N): 120 kg ha1 (ammonium nitrate), phosphorous (P2O5): 90 kg ha1 (calcium super-phosphate), and potassium (KO2): 30 kg ha1 (potassium sulphate) was applied as a basal dose of fertilizer in all treatments [25]. N as urea (CO (NH2)2) also was manually broadcasted at 300 kg ha−1 in all treatments on Julian days 98 and 104 in 2017 and 2018, respectively. On 16 October 2016, and 22 October 2017, the winter wheat cultivar “Zhoumai 22” was sown at 180 kg ha1 (20 cm row spacing), using a tractor-drawn seed drill. A randomly selected 1 m2 of plant sample was manually harvested on May 31 in 2017 and 2018 for all experimental plots. The grain was winnowed, solar-dried to a 12% moisture content [25], and weighed using a precise digital balance (Ohaus, AX224 Adventurer, Parsippany, NJ, USA). Weather data were collected from an automatic weather station installed near the experimental fields.

2.2. Soil Physical and Chemical Properties

The soil physical properties (soil texture, bulk density, field capacity (FC), permanent wilting point, saturation capacity, and saturated hydraulic conductivity) and soil chemical properties (pH, electrical conductivity, available soil N, P, K, and soil organic matter content) were measured from a 0–100 cm soil profile before sowing at a 20 cm interval. The soil particle size proportion as determined by the hydrometer method and soil texture were observed using a soil textural triangle. The field capacity (%), permanent wilting point (%), water content at saturation (%), and saturated hydraulic conductivity (cm/day) of the soil were estimated with soil textural triangle hydraulic properties calculator for predetermined soil particle size distribution [26]. Soil bulk density was determined by the core sampler method. Soil pH and electrical conductivity were determined using the portable meter (Thermo Orion Star A221). The Kjeldahl method was employed for measuring available soil nitrogen (N), a visible-ultraviolet spectrophotometer with absorbance under 700 nm wavelength was applied for phosphorus (P), and flame photometry for potassium (K) determination. The average soil texture, physical properties, and hydraulic parameters are shown in Table 1, and the average soil chemical properties are shown in Table 2. The soil pH was 8.7, and soil electrical conductivity was 144.4 μS cm1. The soil available N, P, K, and soil organic matter content were 43.1 mg kg1, 15 mg kg1, 126 mg kg1, and 1.1 g kg1, respectively.

2.3. Experimental Design

A two-factor experimental design was used with the main plots settled as three water scheduling levels (watering while soil moisture reached 50% (1), 60% (2), and 70% (3) of FC for the 0–100 cm soil profile), and subplots contained three irrigation methods (surface drip (D), sprinkler (S), and border (B) irrigation) [27]. The size of the main plot was 98 (length) × 18 (width) m, and the subplot was 10 (length) × 5 (width) m. The experiments were designed and plotted by the split plot design method. Irrigation scheduling treatments were kept in the main plots, and the irrigation methods were arranged randomly in the sub-blocks; overall, there were nine treatments that were replicated three times. The soil moisture readings were taken weekly at a 20 cm interval to a 100 cm depth in the soil profile with a TRIME-PICO (T3/IPH44, IMKO, Germany) time domain reflectometry sensor. Moreover, soil water content (SWC) was also measured just before and after irrigation or heavy rainfall event. Irrigation scheduling was performed as SWC decreased to 50%, 60%, or 70% of FC for three irrigation scheduling treatments, respectively. Precision discharge meters were installed for each treatment to apply the precisely specified irrigation quantity. Drip irrigation and sprinkler irrigation applied a 30 mm water depth, and flood (border) irrigation a 60 mm water depth [28]. The design parameters for drip and sprinkler irrigation were kept the same as by Jha, et al. [29]. The irrigation data and irrigation quota for each treatment in 2017 and 2018 are shown in Table 3.

2.4. CO2, CH4, and Soil Sampling

The static chamber-gas chromatograph method was used to measure the CO2 and CH4 emission [30]. Static chambers (0.5 m × 0.5 m × 0.5 m) had a square stainless steel base (0.5 m width × 0.5 m length × 0.05 m height) with a flange around the upper edge and a cover box with a stainless steel frame [31]. To mix the air inside the chamber, two 12V DC battery-operated fans were used. The chambers were placed on stainless steel frames permanently inserted 0.05 m into the soil during the whole experimental period [32]. The frame had a groove that was filled with water to ensure an airtight seal. Two rows of wheat were sown in the chamber. Fertilization and irrigation events inside the chambers were the same as those in the outside field. Four gas samples were taken at 0, 10, 20, and 30 min after the chambers were water-sealed and attached to the stainless-steel frame using 100 mL plastic syringes attached to a three-way stopcock and then injected into 12-mL evacuated glass tubes. The chamber air temperature was determined using a sensor probe (JM624, Jinming Instrument Co., Ltd., Tianjin, China) from 0–30 min for each sample reading. Gas samples were taken mid-morning (8:00 to 11:00 am local time) because the soil temperature during this period is nearly the average daily soil temperature [33]. CO2 and CH4 sampling were performed from Julian days 96–149 in 2017 and Julian days 96–151 in 2018. In total, there were 9 and 17 sampling events in 2017 and 2018, respectively. CO2 and CH4 samples were analysed using a gas chromatography system (Shimadzu 2010 plus, Shimadzu Co., Ltd., Kyoto, Japan).
Soil samples were taken at a depth of 0–20 cm with an auger immediately after gas sample collection. The SWC was determined with the gravimetrical method immediately after gas sampling and expressed as in percentage (%). Soil temperature on each gas-sampling event was measured manually at 10 cm soil depth. Soil ammonium and nitrate content of 0–20 cm layers were measured by extracting the soil samples for 1 h with 2 M KCL (1:10) mixture using Auto Analyzer (Seal Analytical Inc., AA3-HR, Mequon, Wisconsin, USA).

2.5. CO2 and CH4 Emission Calculation

CO2 and CH4 emissions were determined following the equations provided by Song, et al. [34]:
J = dc dt × M V o × P P o × T o T × H
where J is the CO2 or CH4 emissions (mg m2 h1), dc dt1 is the slope of the linear regression of gas concentration at time approaching zero, M is the mole mass of CO2 or CH4 gas (g mol1), P is the atmospheric pressure (Pa), T is the absolute temperature inside the chamber (K) during sampling; Vo, Po, and To are volume (mL), pressure (Pa), and absolute temperature (K), respectively, under standard conditions, and H is chamber height above the soil surface (cm).
The cumulative seasonal CO2 and CH4 emissions were calculated for each treatment, as explained by Li, et al. [35]:
CE = F i + F i + 1 2 × 10 3 × d × 24 × 10
where CE is the cumulative emission (kg ha1), Fi and Fi+1 are the measured emissions of two consecutive sampling days (mg m2 h1), and d is the number of days between two sampling days.

2.6. Water Use Efficiency and GWP Index Estimates

The crop evapotranspiration (ETC) was measured using the soil water balance equation [36] as follows:
ET c = P + I + U D w R ± Δ S
where ETC is the crop evapotranspiration; P is rainfall; I is the amount of irrigation; U is the upward capillary rise from the soil profile below 100 cm and considered zero because the water table was about 30 m below the soil surface. Dw is the drainage beneath the 100 cm soil profile and measured following Sun, et al. [37]; R is the surface runoff and neglected because of the suitable bund height (25 cm) around the sub-blocks; ΔS is the change in soil water storage (final-initial) in the 100-cm soil profile.
Water-use efficiency (WUE) was calculated as:
WUE = Y ET C
where WUE in kg m−3, Y is the grain yield (kg ha−1), and ETC (m3 ha−1) is crop evapotranspiration during the growing season.
The GWP of CO2 and CH4 emissions (kg CO2-eq ha1) was used to measure the climatic impact of a winter wheat field under different irrigation regimes. The GWP coefficient is 1 for CO2 and 28 for CH4 on a 100-year time scale [3]. The combined GWP for 100 years was calculated using the following equation [38]:
GWP   CO 2 + CH 4 = 1 . CE CO 2 + 28 .   CE CH 4
The global warming potential intensity (GWPI) is the ratio of GWP to grain yield and was calculated by the following equation [39].
GWPI   = GWP   Mg   CO 2 eq   ha 1 Grain   yield   Mg   ha 1
The combined GWPI per unit of irrigation amount (GWPIPIA) was measured using the following equation:
GWPI PIA = GWPI   CO 2 eq   Irrigation   applied   mm

2.7. Statistical Analysis

A two-way analysis of variance (ANOVA) was carried out to analyse the effects of irrigation scheduling and irrigation methods on the cumulative emissions, SWC, soil temperature, soil inorganic N content, grain yield, WUE, GWP, GWPI, and GWPIPIA in a winter wheat field with SPSS 16.0 (SPSS Inc., Chicago, IL, USA) software. A repeated-measures ANOVA was performed with the sample date as the repeated factor to measure the effects of sample date and different treatments for soil CO2 emissions and CH4 uptake only. Stepwise multiple regression analysis was used to identify the relationship between environmental factors and GHG emissions. The statistical significance of all treatments was compared by Duncan’s Multiple New Range Test at a 5% (p < 0.05) significance level.

3. Results

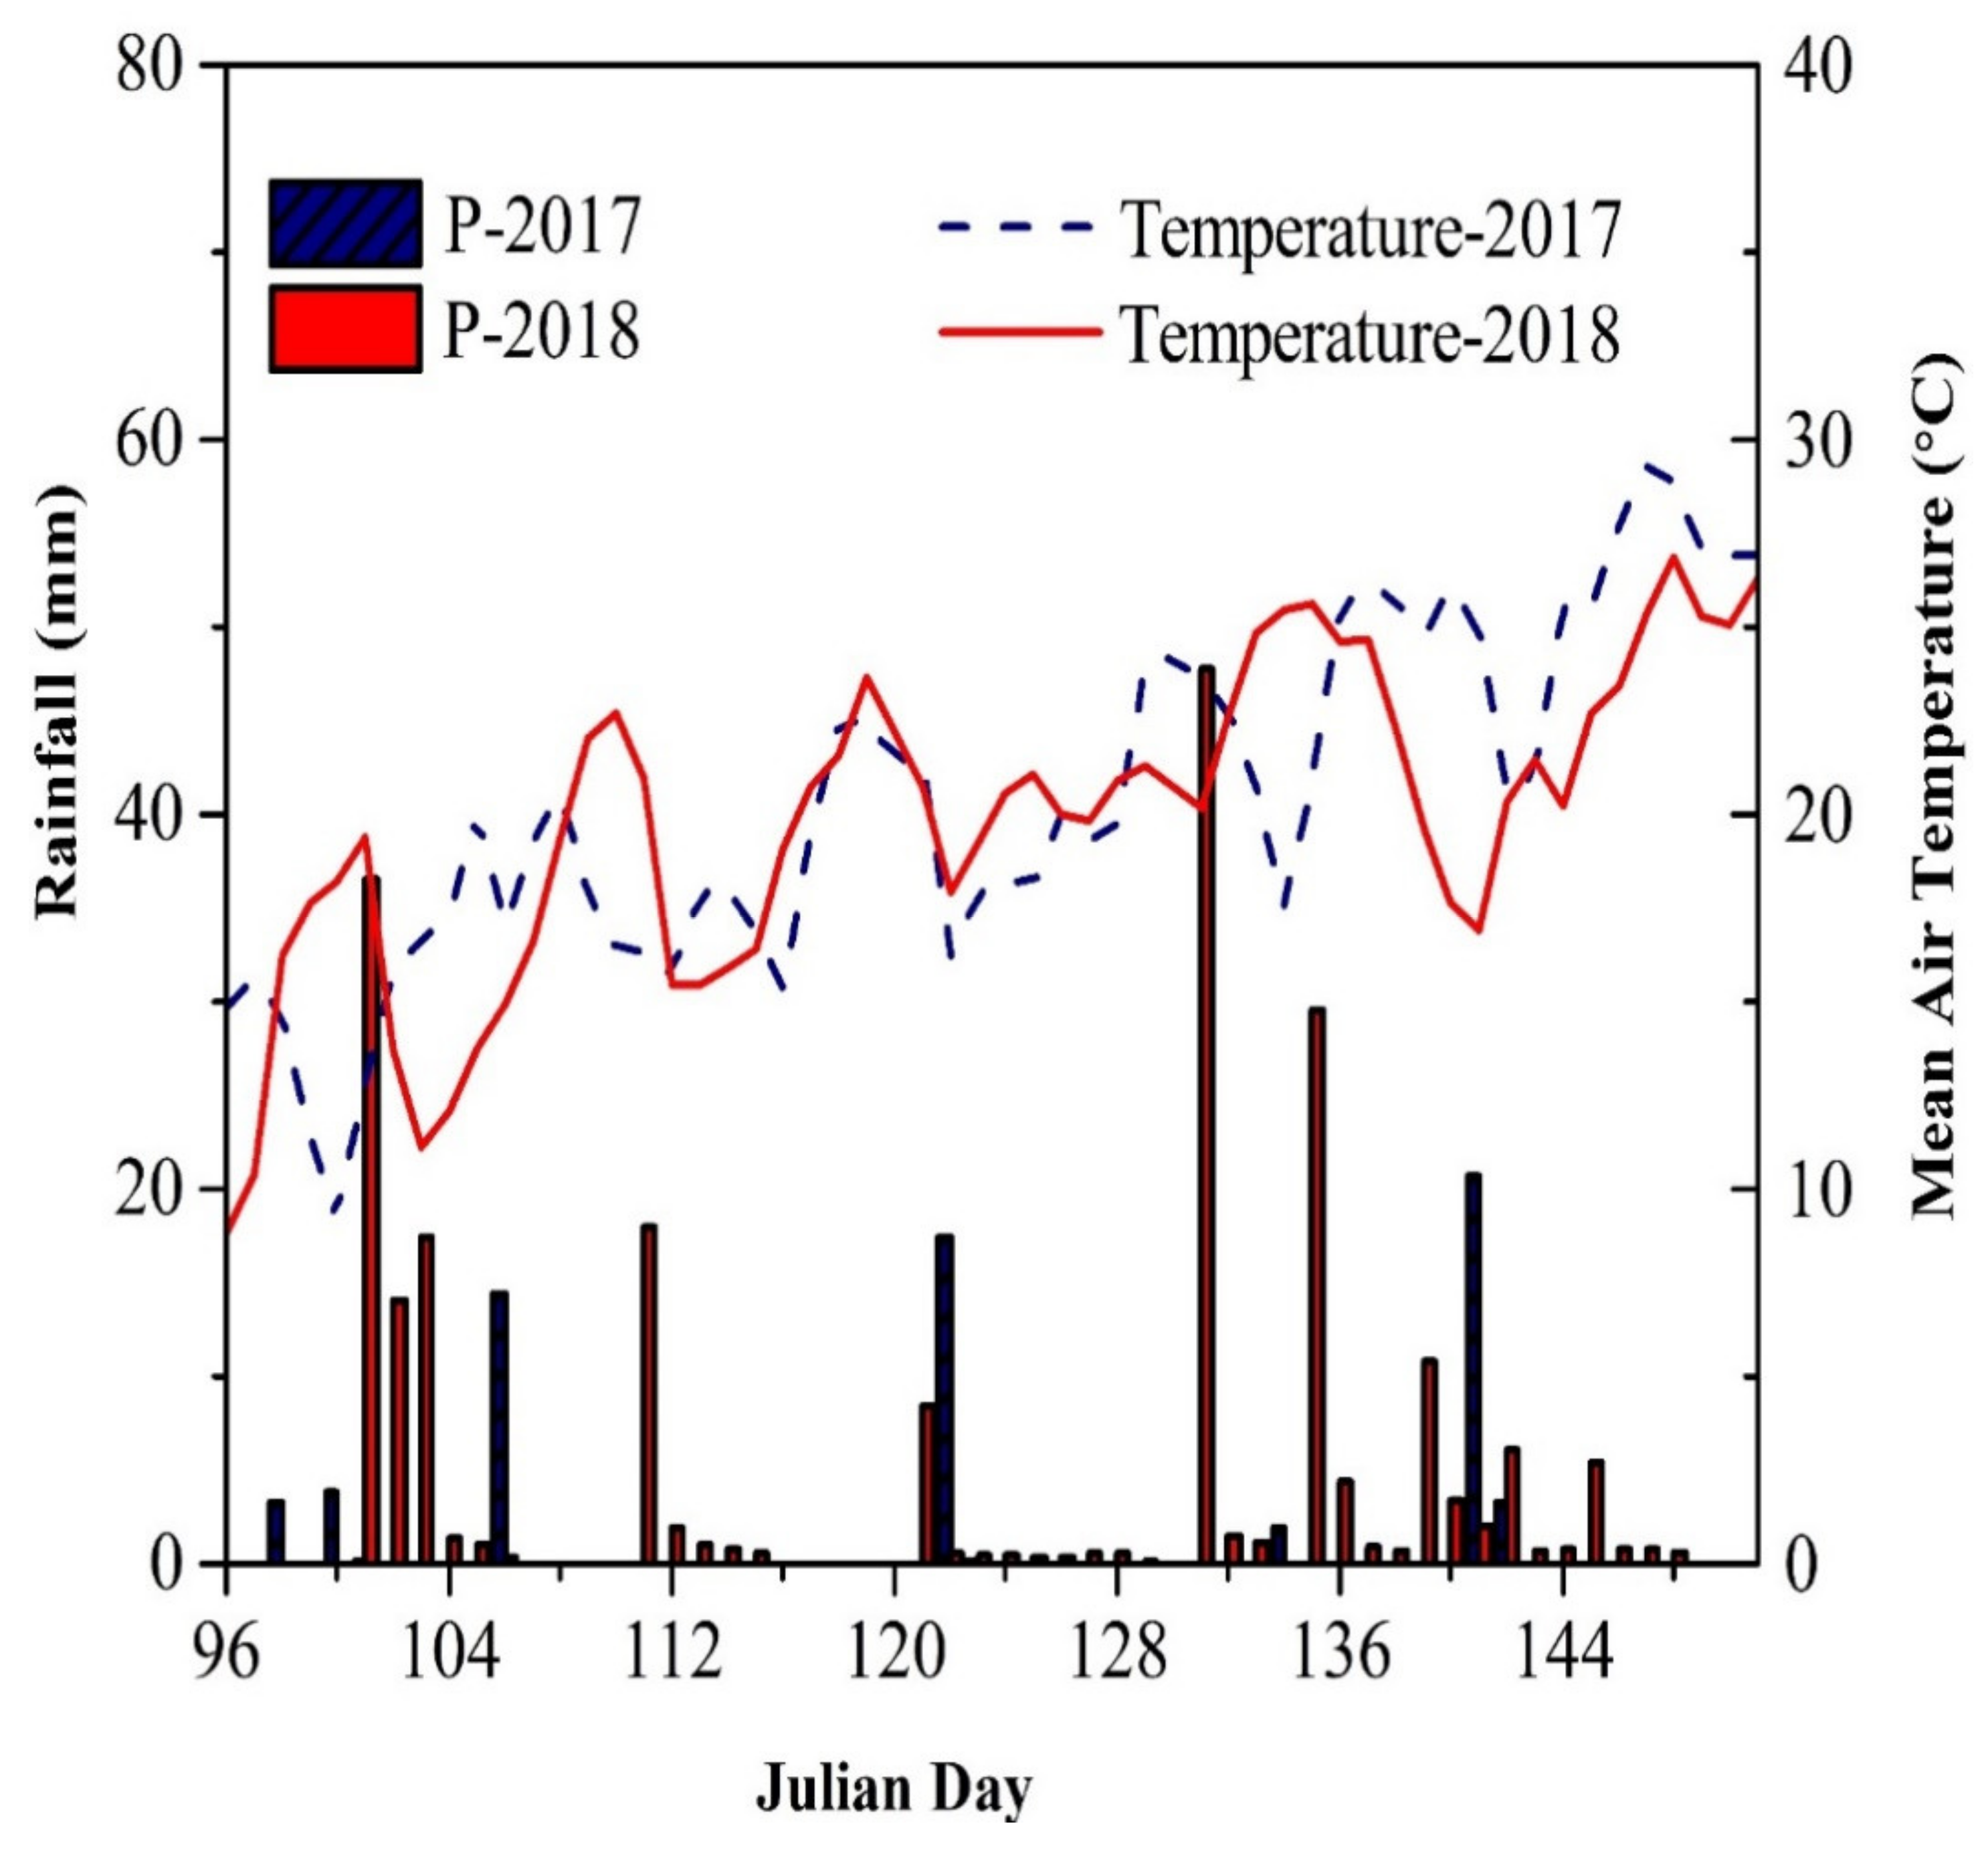
3.1. Basic Weather Infomation during the Two Growing Seasons

The average air temperature and rainfall from the first irrigation to harvest are shown in Figure 1. The overall average temperature during the 2017 and 2018 cropping seasons was 20.1 °C and 19.9 °C, respectively. A cumulative rainfall of 65 mm and 222 mm was measured in 2017 and 2018, respectively. The average relative humidity, wind speed, and solar radiation were 68%, 1.8 m s1, and 17.7 MJ m2 day1 and 75%, 1.7 m s1, and 16.0 MJ m−2 day1 in 2017 and 2018, respectively. Winter wheat season 2016–2017 was categorized as a slightly dry season, and regular winter wheat season 2017–2018 as a good wet season based on climatic data of 1951–2018 (67 years) provided by the Xinxiang weather station. In applying irrigation scheduling and the total irrigation depth for the study, rainfall played an essential role, and border irrigation treatment had two fewer irrigation events, while drip irrigation and sprinkler irrigation treatment had one fewer irrigation event for the 2017–2018 season compared to 2016–2017 dry season under the same water levels (Table 3).

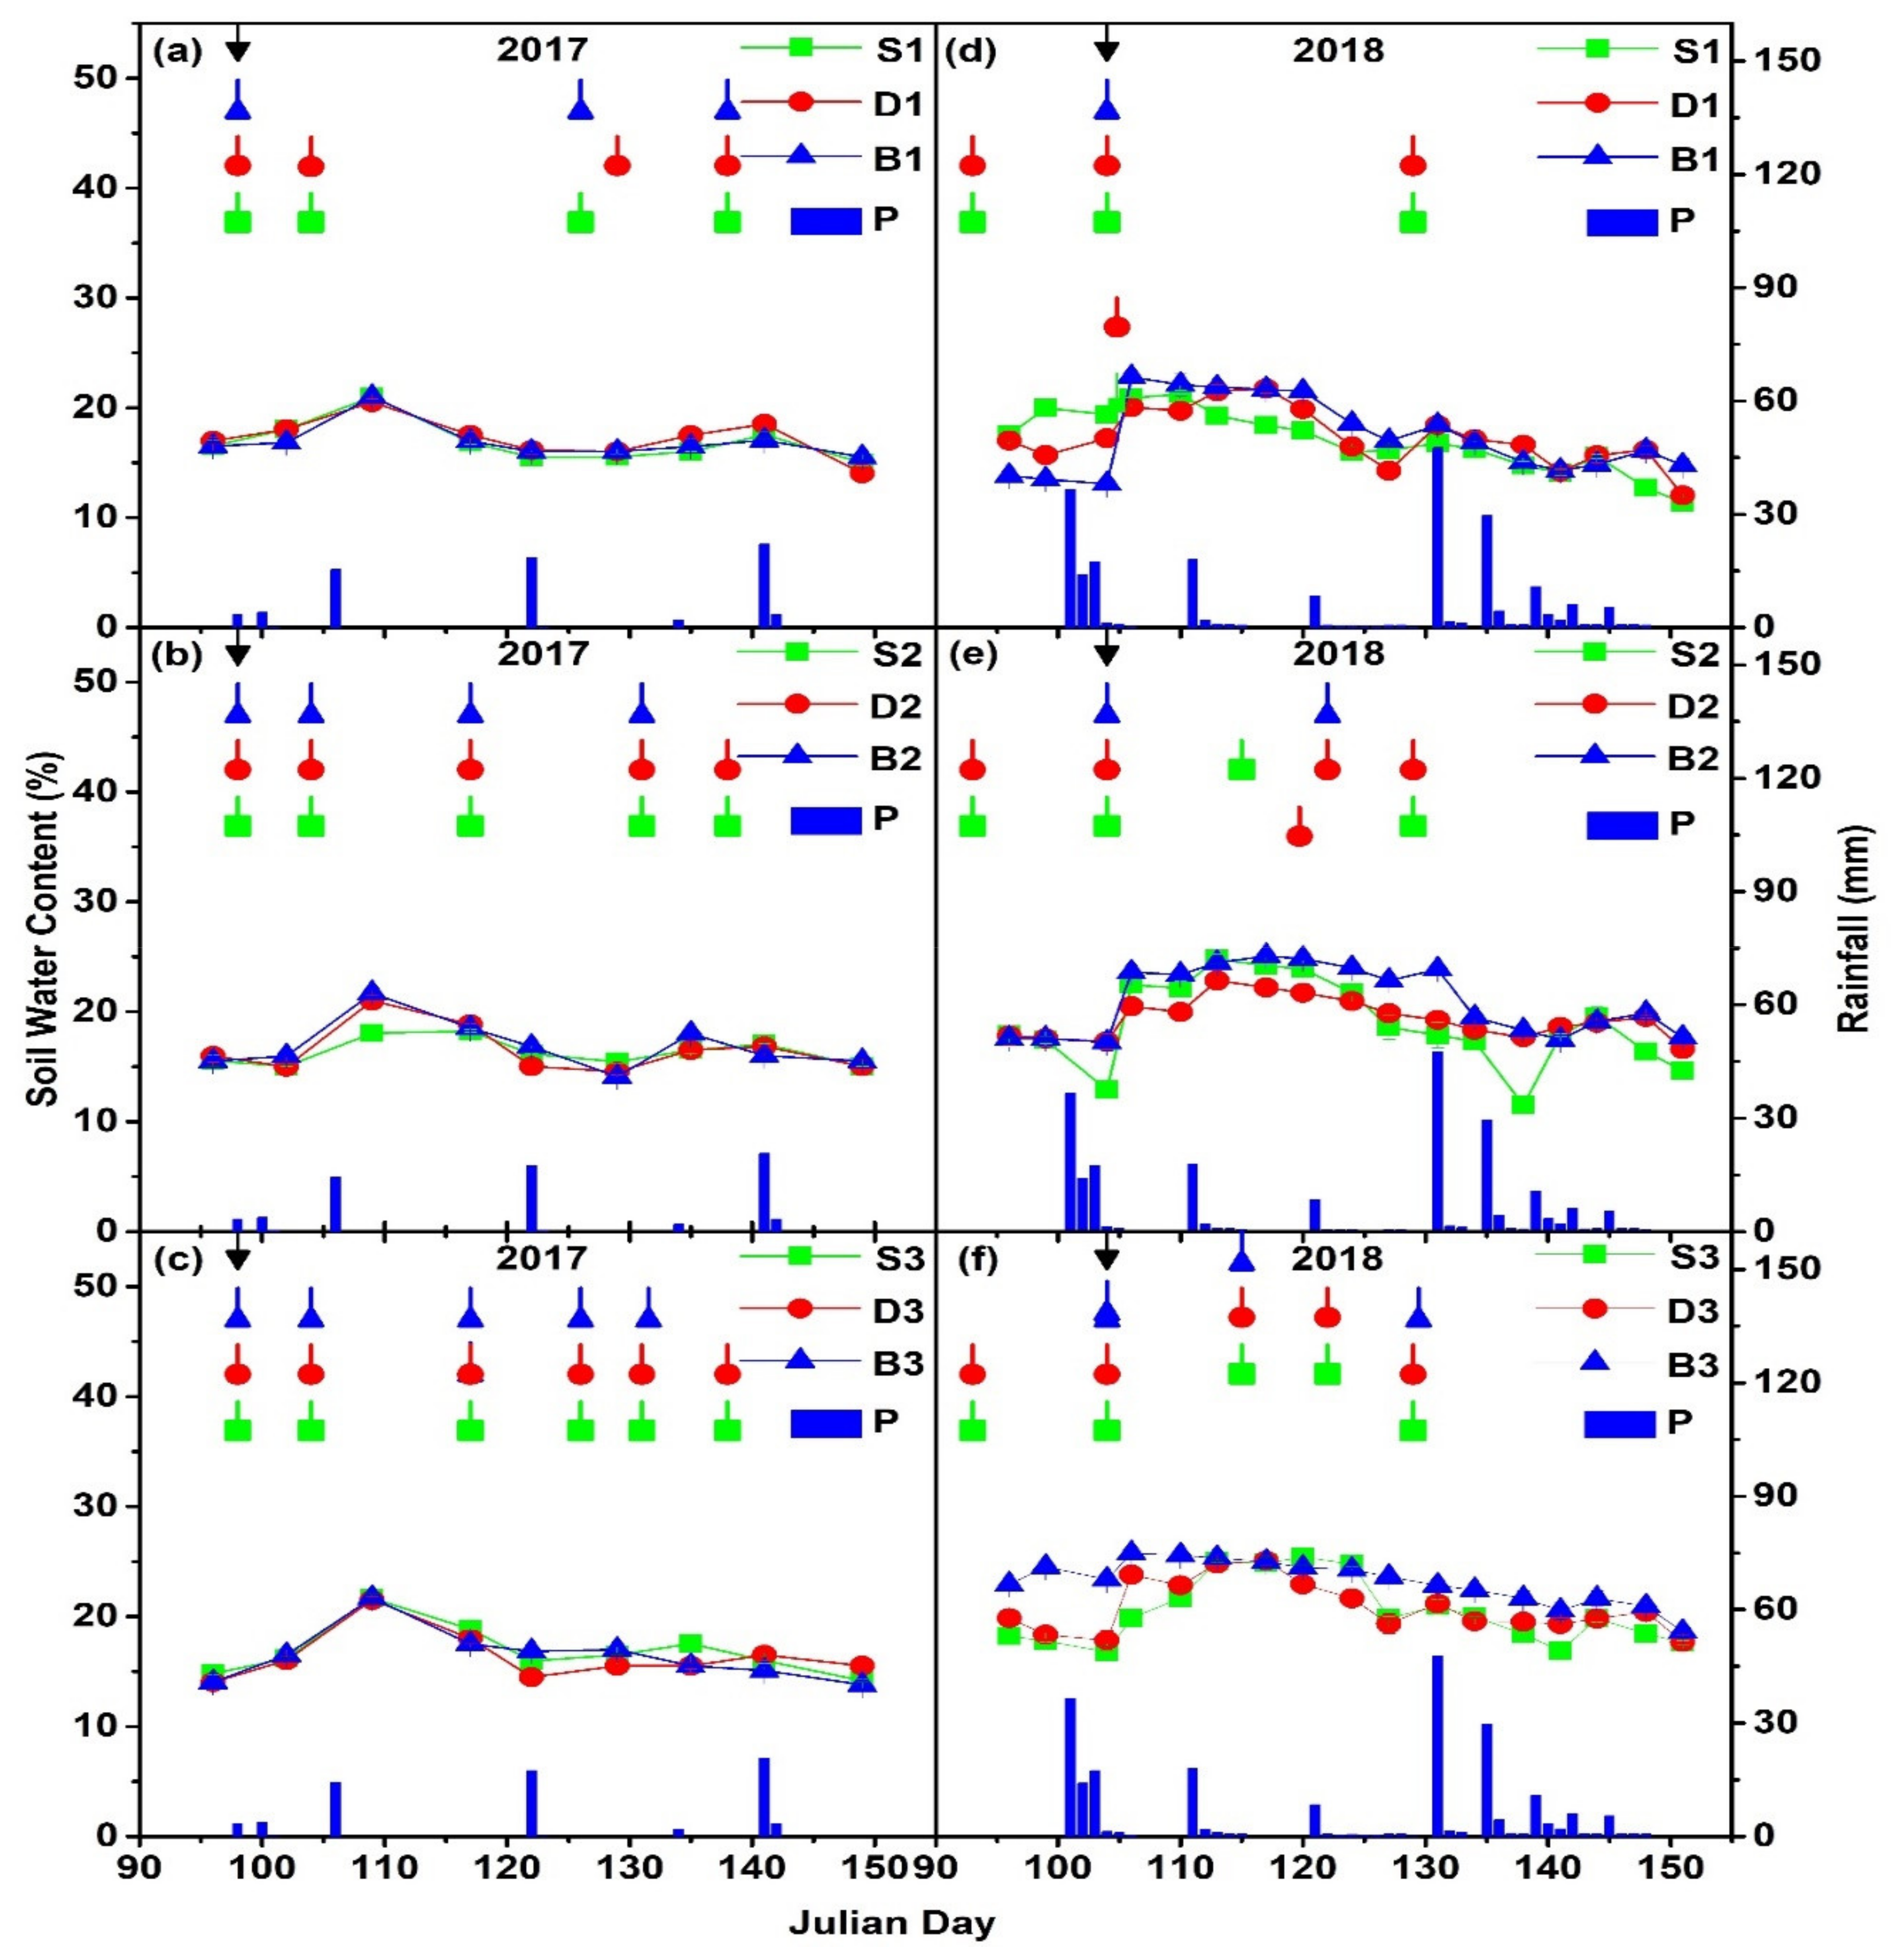
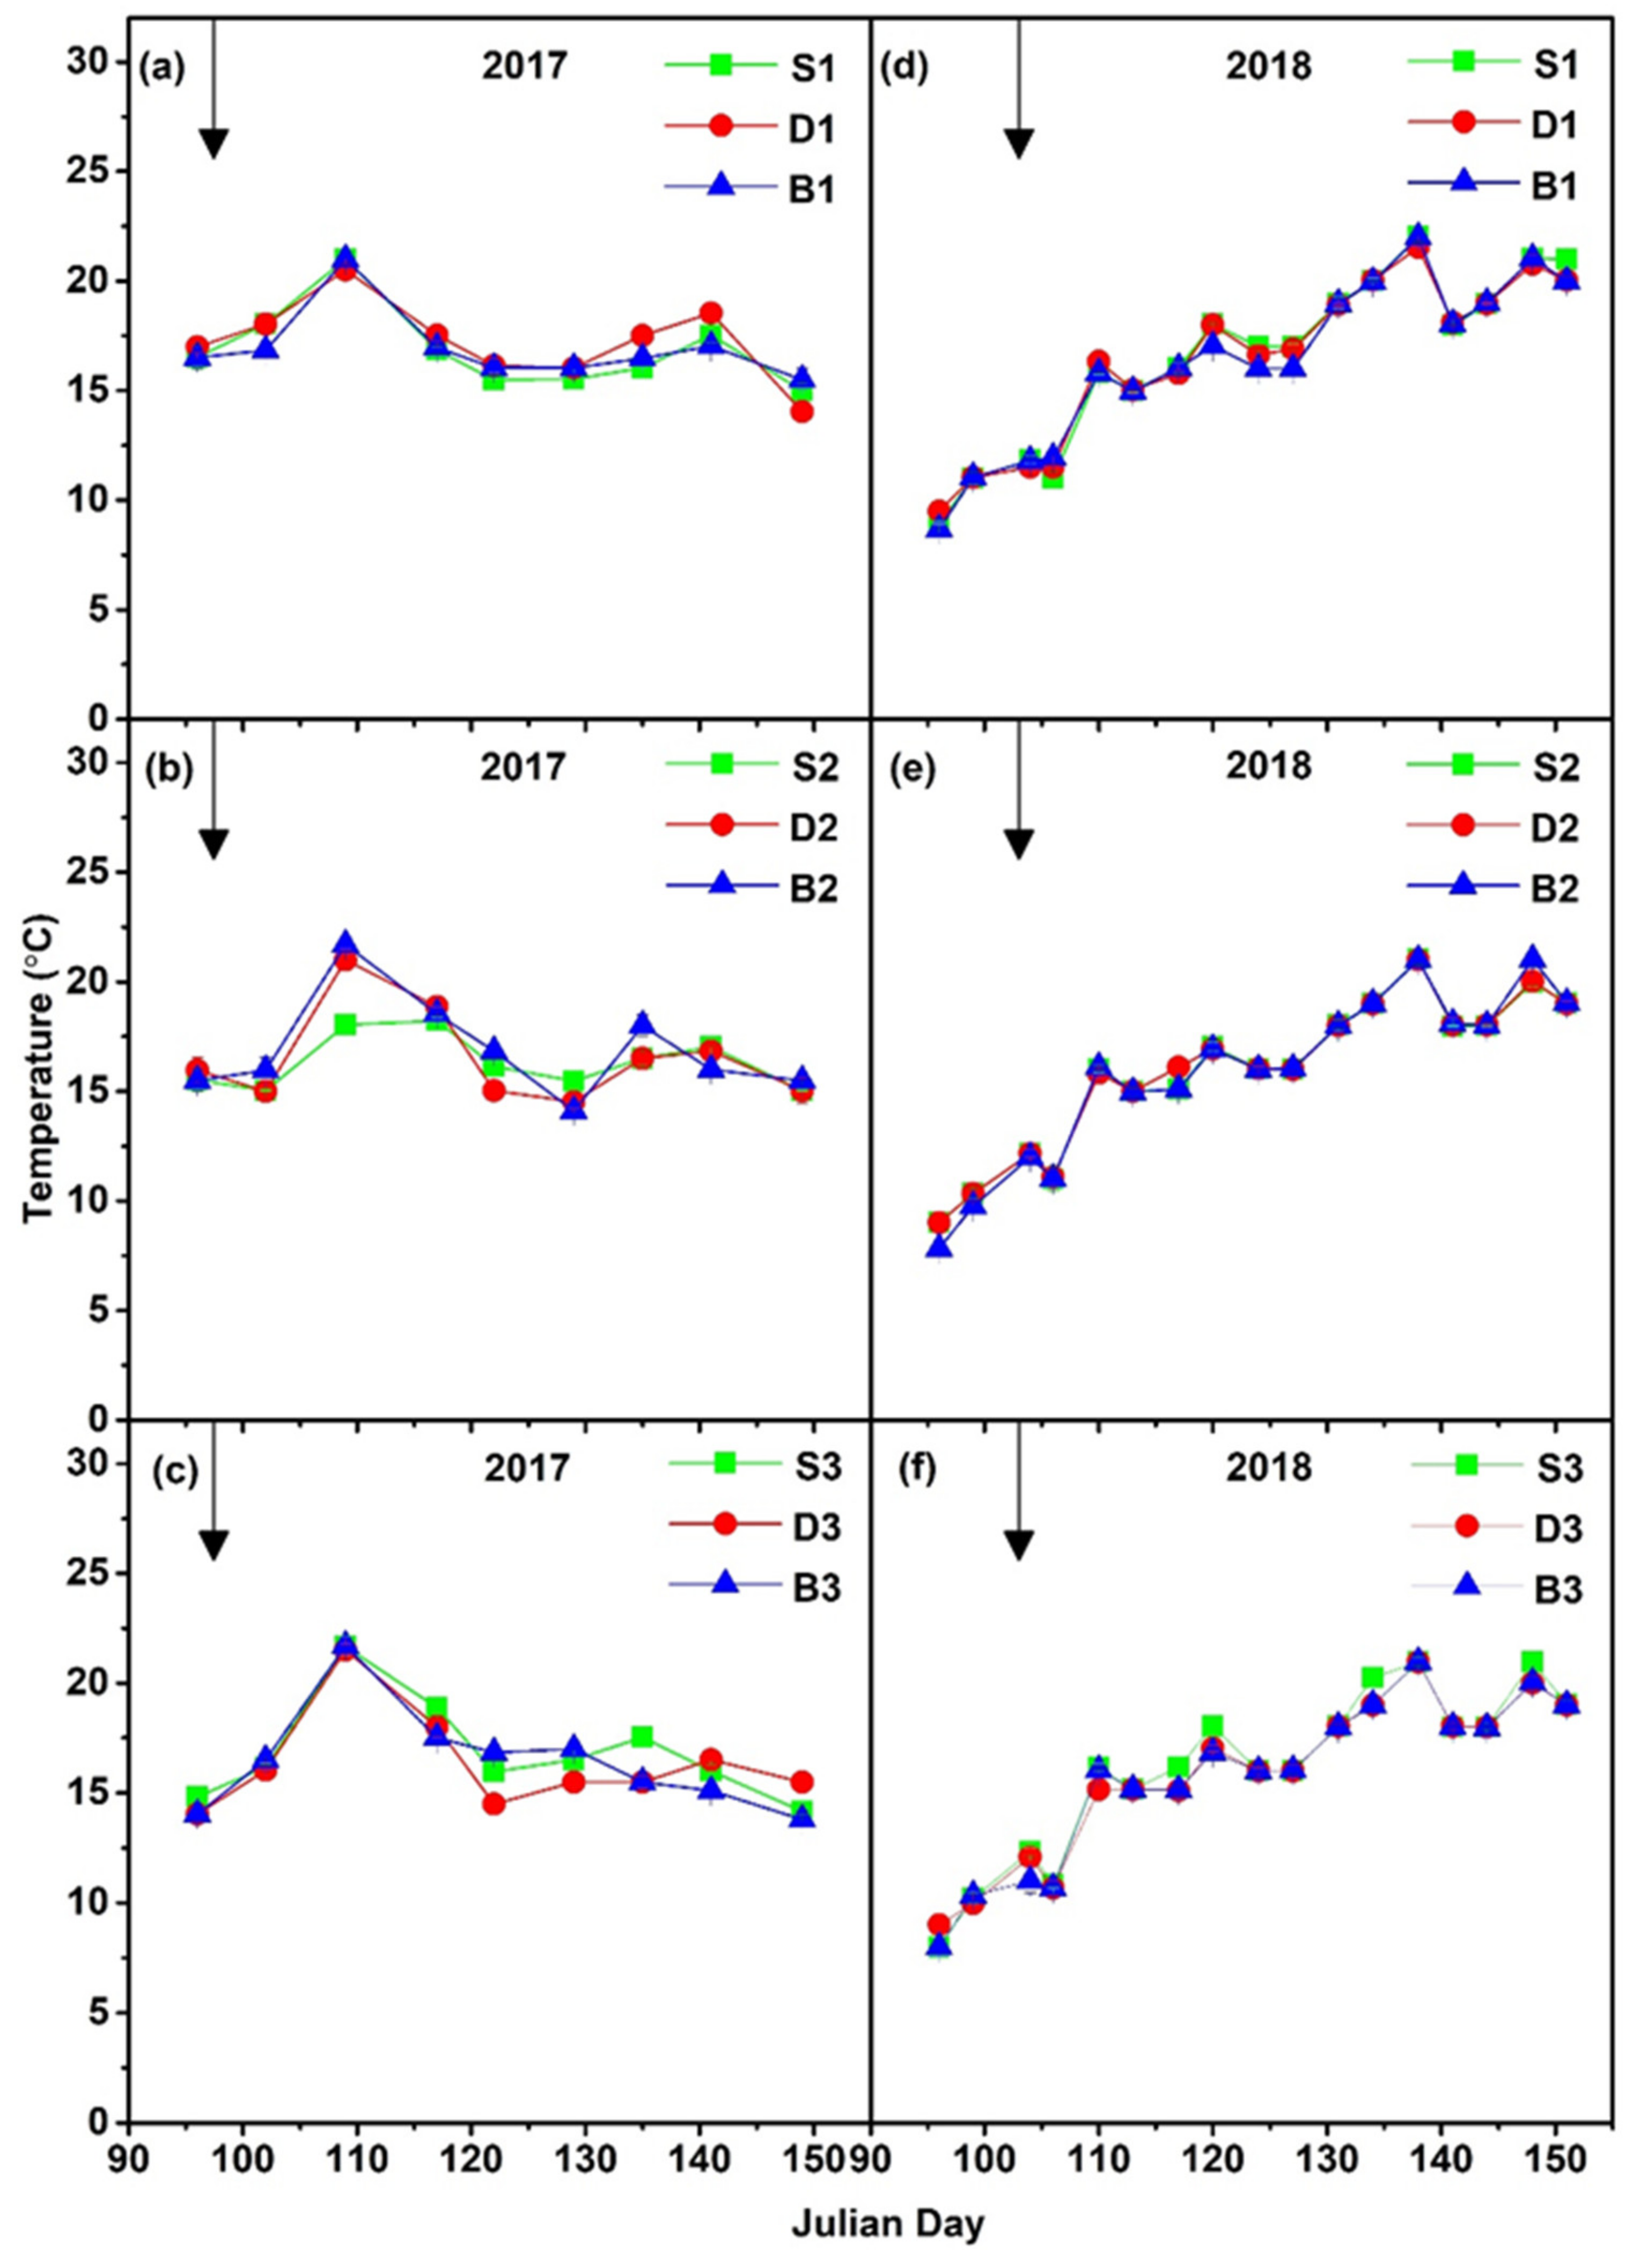
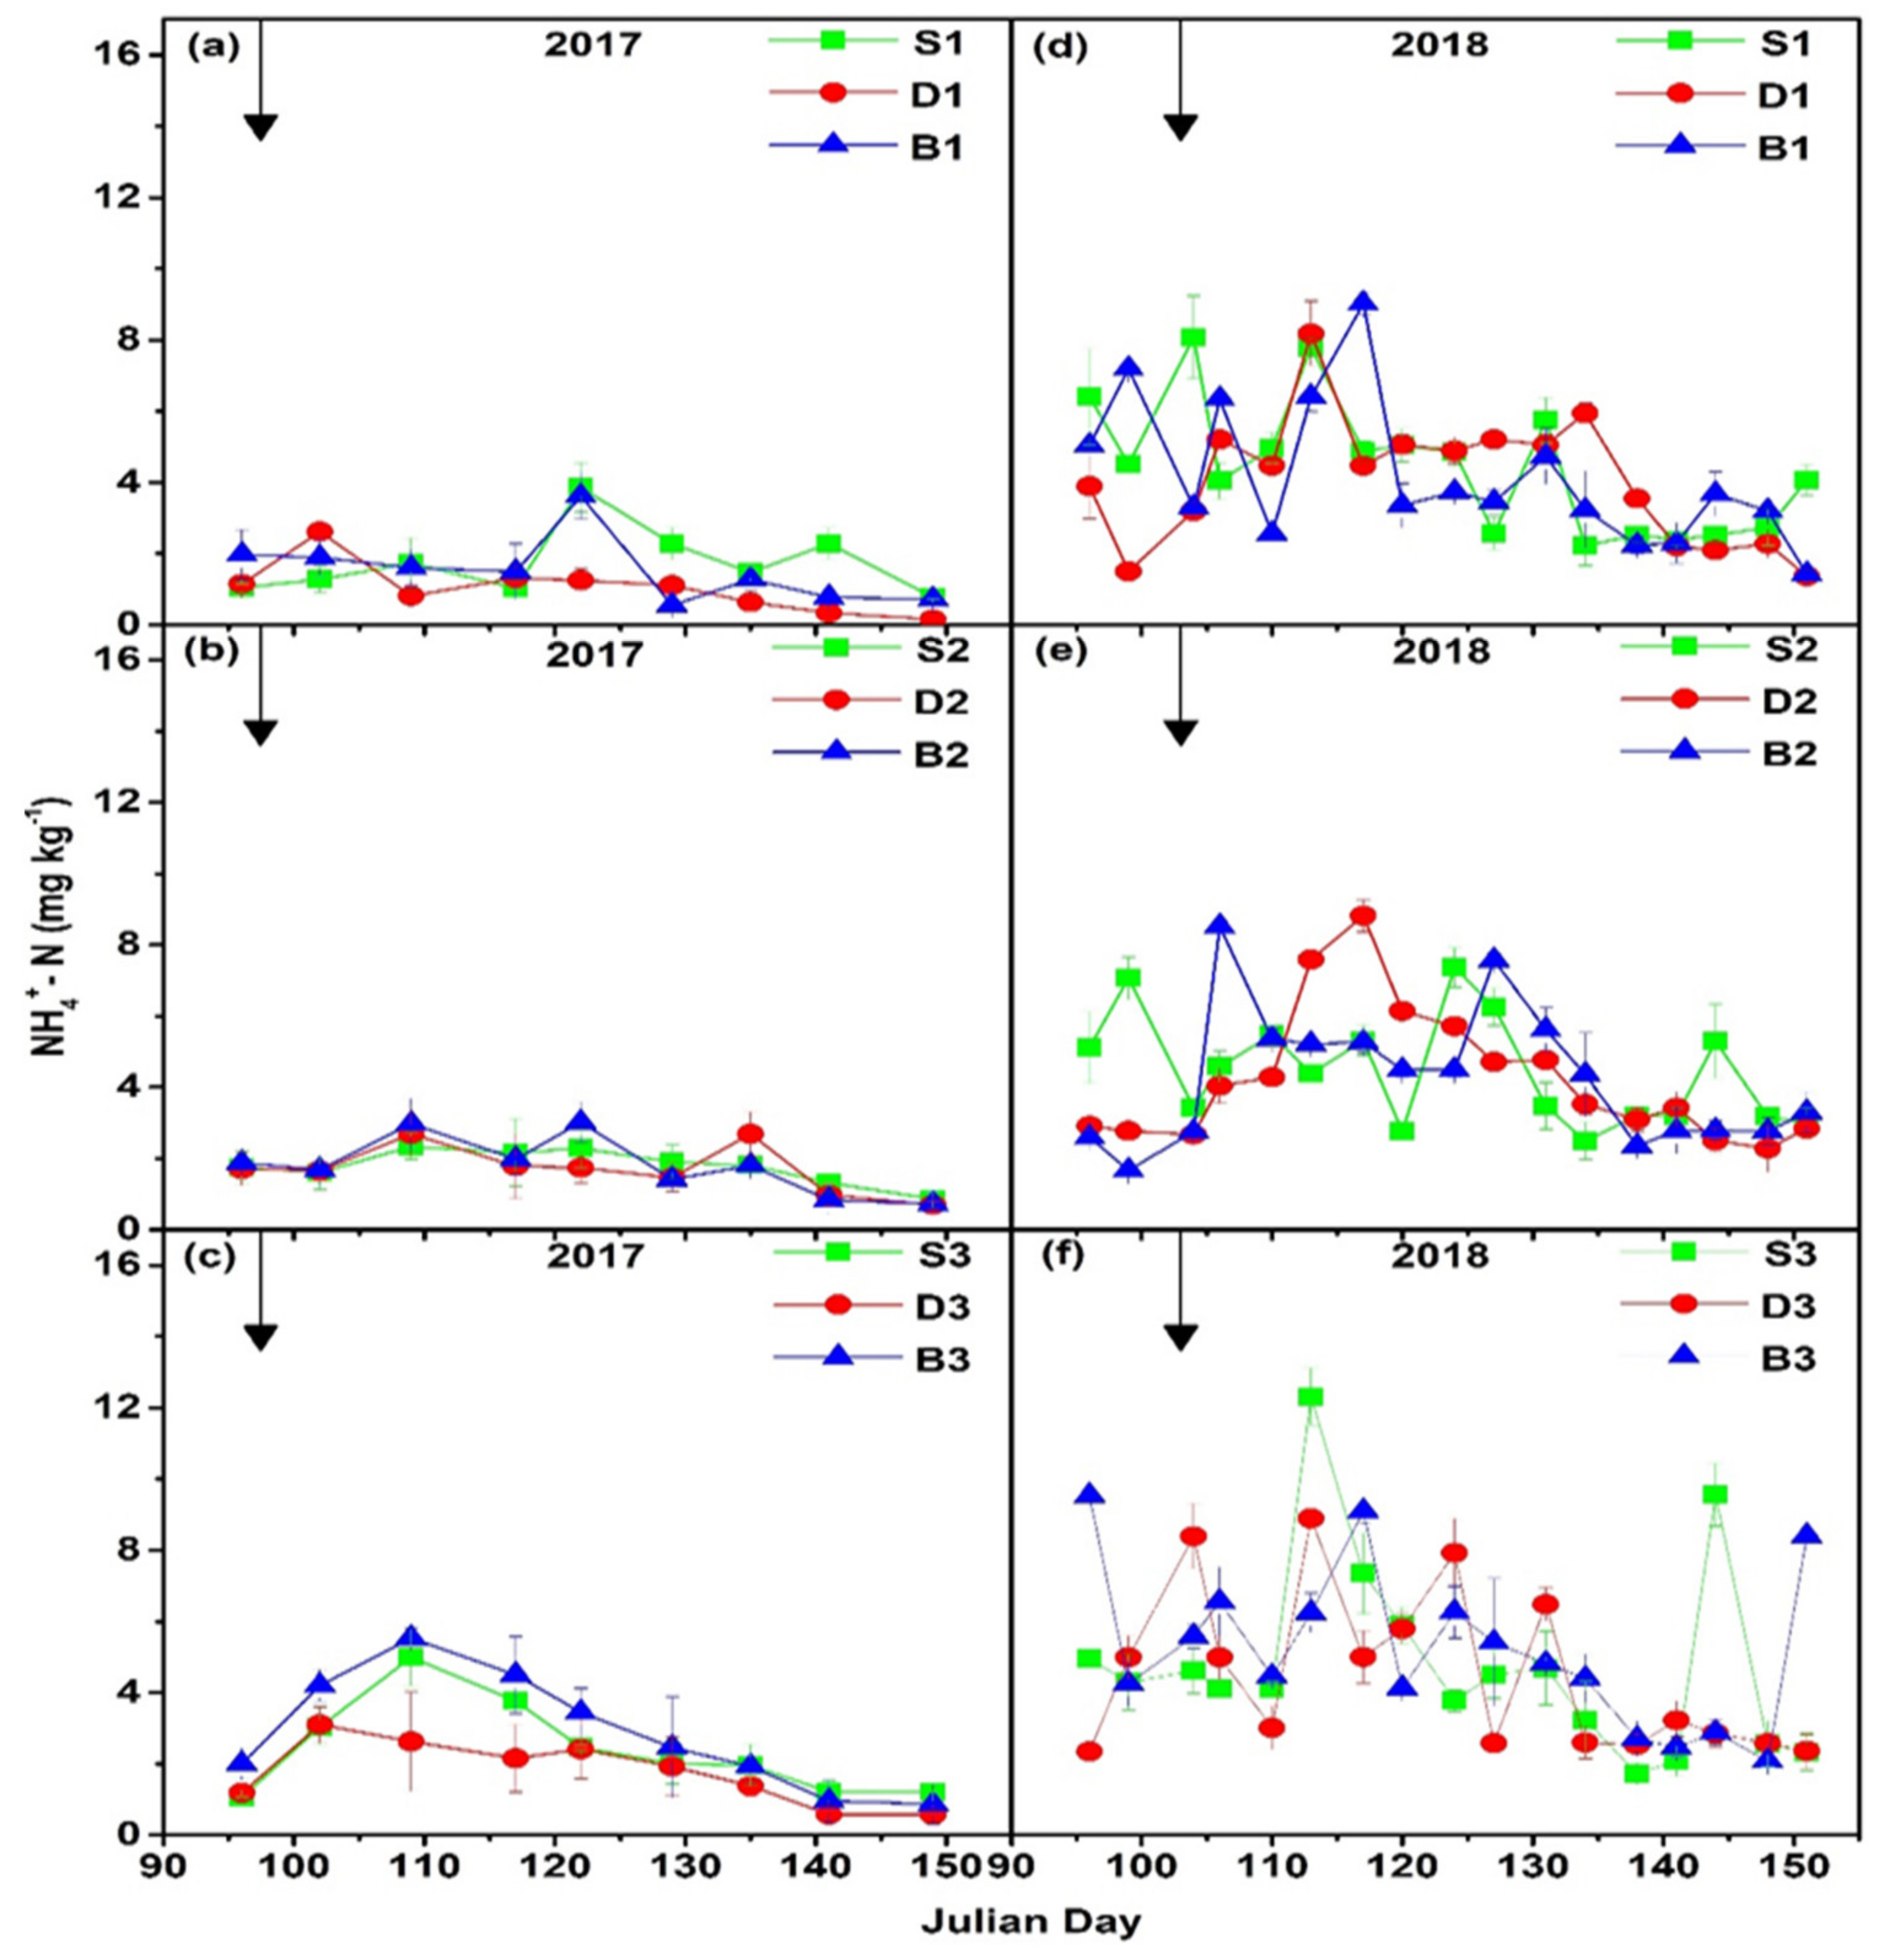
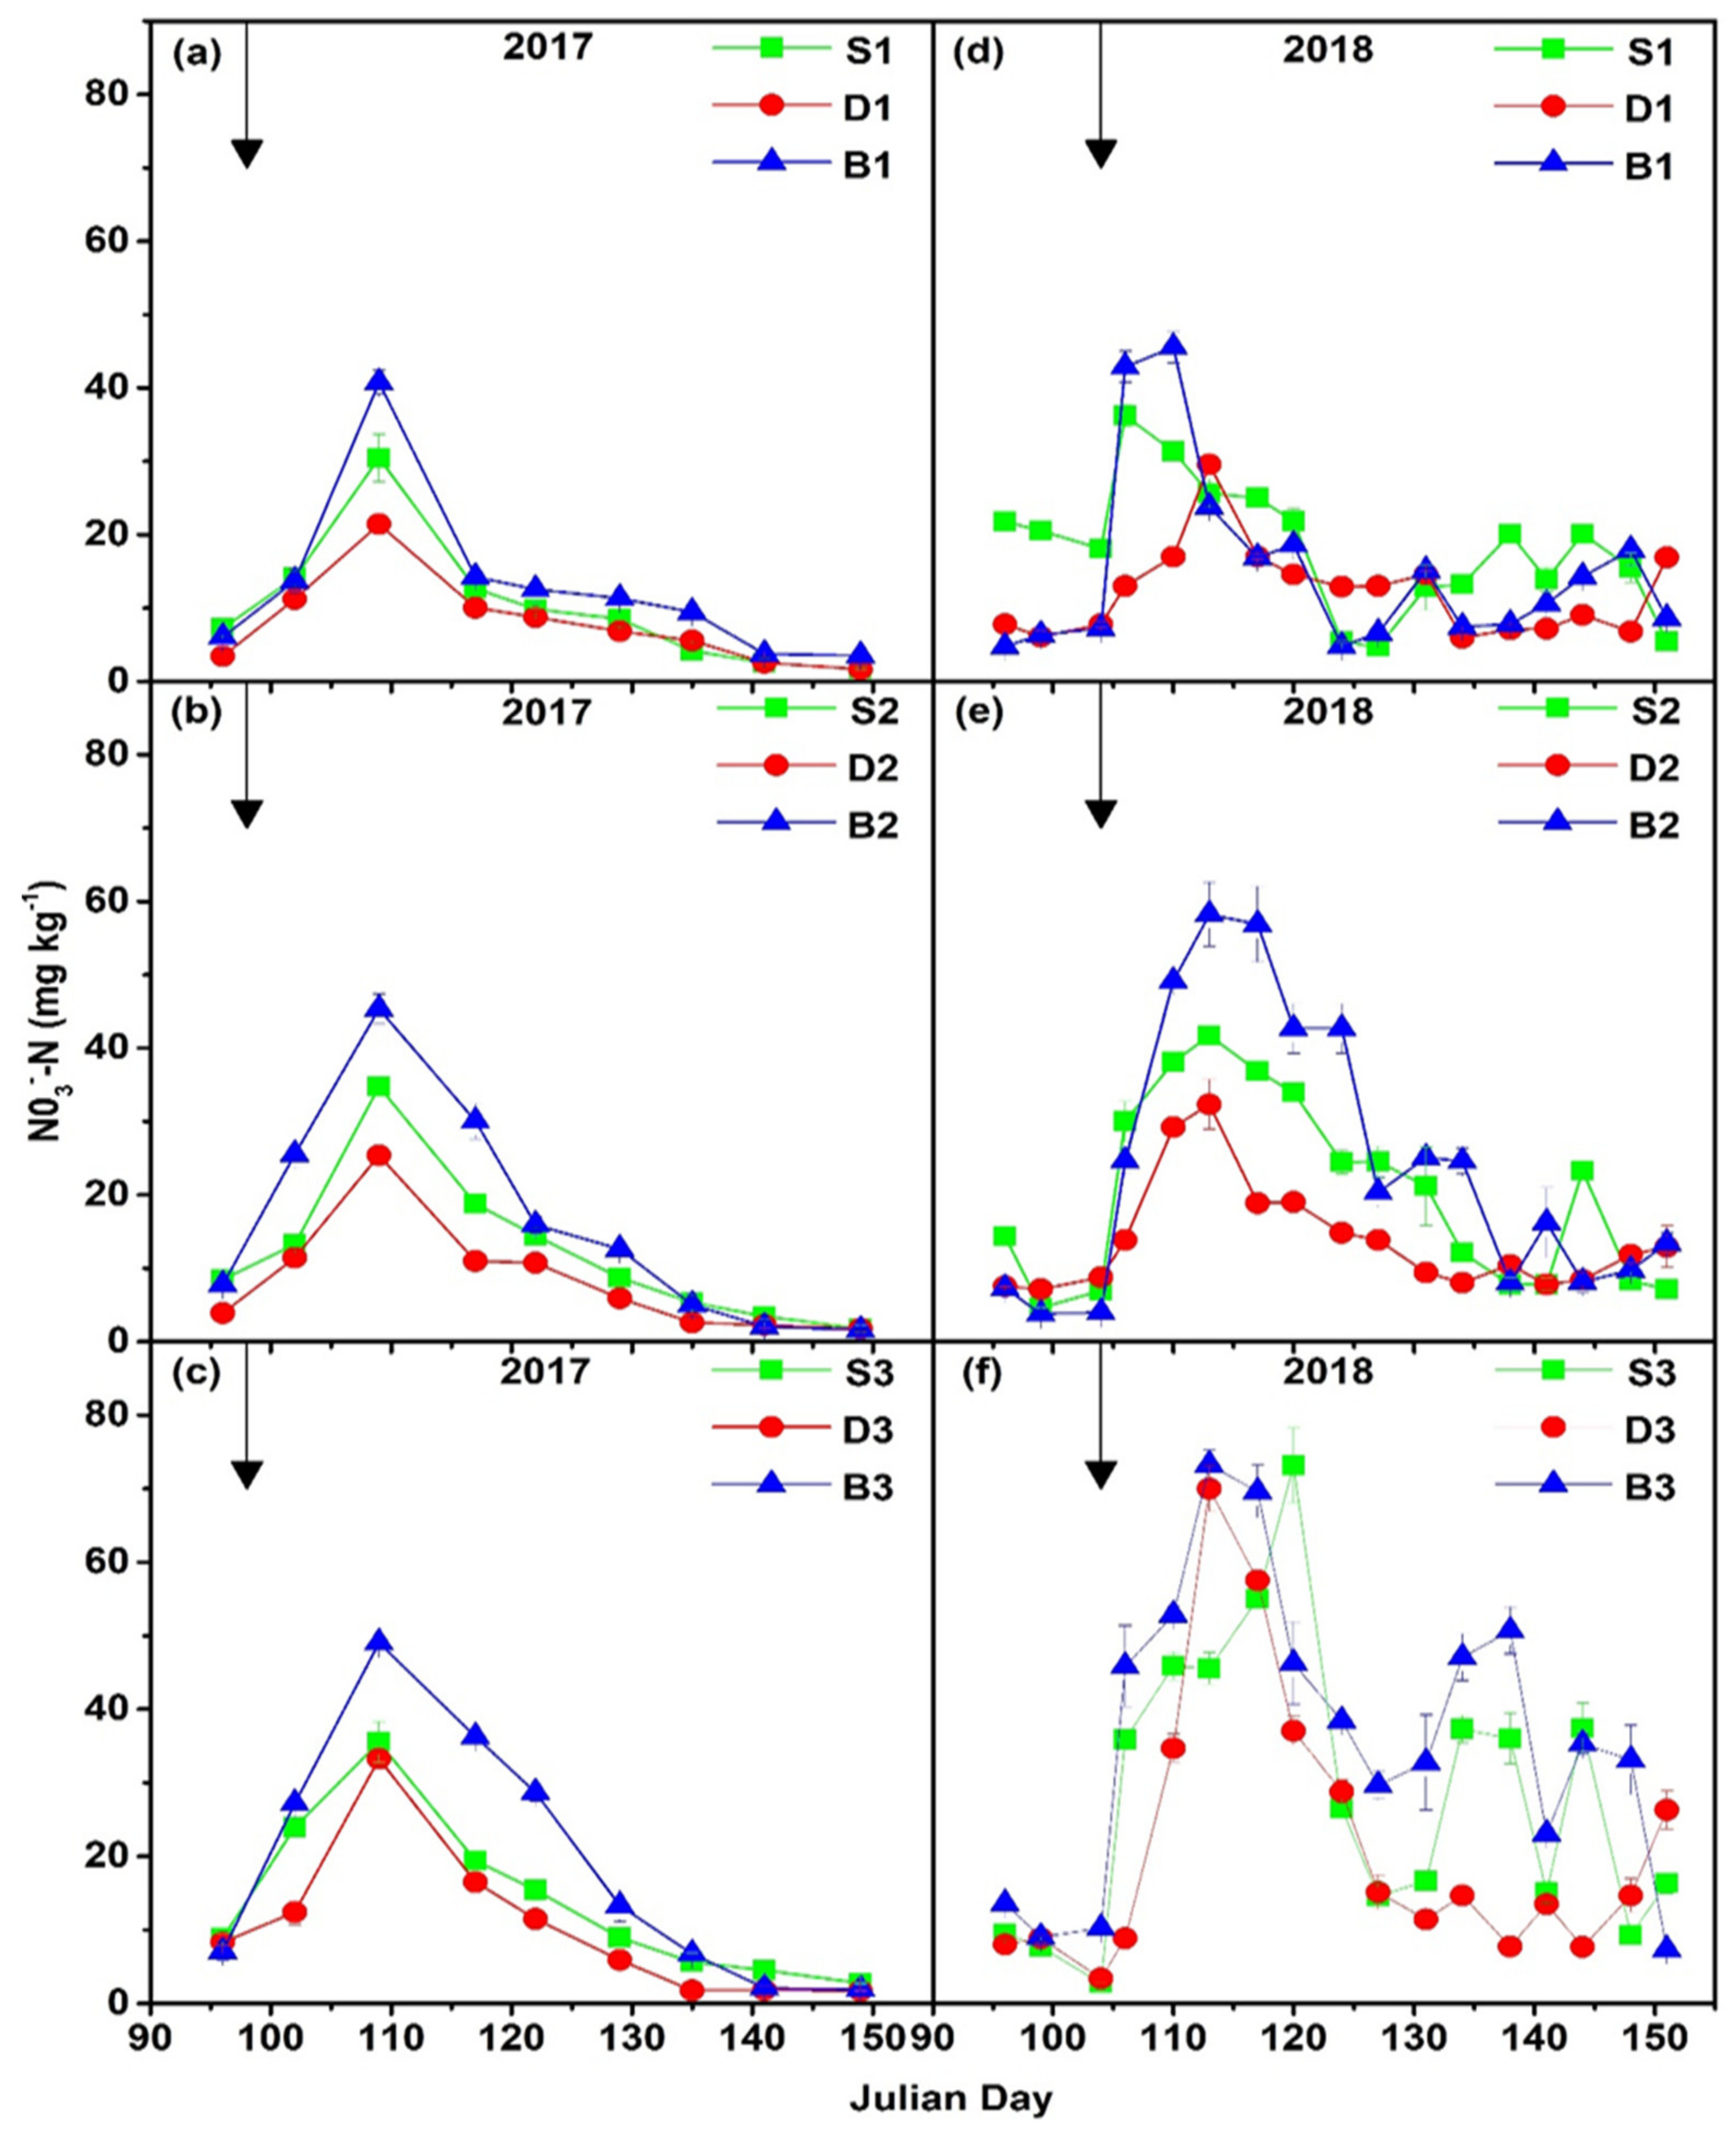
3.2. Dynamics of Soil Environmental Variables

The irrigation and/or rainfall events mainly influenced SWC, and it ranges from 15.5 ± 0.3% (S1) to 21.0 ± 0.3% (S1 and/or B1) and 11.4 ± 0.4% (S1) to 25.7 ± 0.5% (B3) SWC in 2017 and 2018, respectively (Figure 2). In 2018, higher SWC was estimated due to higher seasonal rainfall (222 mm) compared to 2017 (65 mm). SWC followed the trend of 70% FC > 60% FC > 50% FC. Statistical analysis indicated that irrigation scheduling, irrigation methods, and their interaction have a significant (p < 0.05) effect on the SWC (Table 4). In 2018, 50%, 60%, and 70% FC has about 11.7%, 8.3%, and 5.6% higher SWC compared in 2017, respectively. Conversely, sprinkler, drip, and border irrigation have around 4.2%, 9.8%, and 10.8% higher SWC in 2018 compared in 2017, respectively. The higher SWC in 2018 was associated with approximately 3.4 times higher rainfall compared to 2017.
The soil temperature (at 10 cm depth) was significantly affected by the irrigation scheduling, irrigation methods, and the interaction between them (Table 4). Soil temperature ranged from 13.8 ± 0.4 (B3) to 21.7 ± 0.4 °C (B2 and B3) in 2017 and 7.8 ± 0.2 (B2) to 22.0 ± 0.3 °C (S1) in 2018 (Figure 3). The maximum soil temperature was observed at 50% FC. In 2017, soil temperature at 50%, 60%, and 70% FC was about 3.4%, 4.1%, and 3.6% higher soil temperature compared in 2018, respectively. In contrast, sprinkler, drip, and border irrigation was about 3.1%, 3.6%, and 4.5%, higher soil temperature in 2017 compared in 2018, respectively. Relatively higher soil temperature in 2017 was attributed due to the slightly dry season (less rainfall) compared with 2018.
Soil inorganic N concentration in the top 20 cm of the soil profile depicts a seasonal trend in the entire experiment with high concentrations after the fertilization and irrigation events. The NH4+-N content ranged from to 0.1 ± 0.0 (D1) to 5.5 ± 0.3 (B3) mg kg−1 and 1.4 ± 0.2 (D1) to 12.3 ± 0.8 (S3) mg kg−1 in 2017 and 2018, respectively (Figure 4). On the other hand, NO3-N in the soil varied from 1.6 ± 0.1 (B2) to 49.1 ± 1.0 (B3) mg kg−1 in 2017 and 2.8 ± 0.0 (S3) to 73.2 ± 2.0 (B3) mg kg−1 in 2018 (Figure 5). The NH4+-N and NO3-N contents were higher at the highest irrigation scheduling treatments (B3, S3, B2, and D3) compared with the lower level of irrigation (D1, S1, B1, D2, and S2) treatments. There was a significant increase in the soil mineral N (NH4+-N and NO3-N) were recorded after N fertilization following by irrigation in all treatments during the study. ANOVA analysis describes that the irrigation scheduling, irrigation methods, and the interaction of them (except on NH4+-N in 2017 only) had a significant (p < 0.05) effect on the soil mineral N in this study (Table 4).

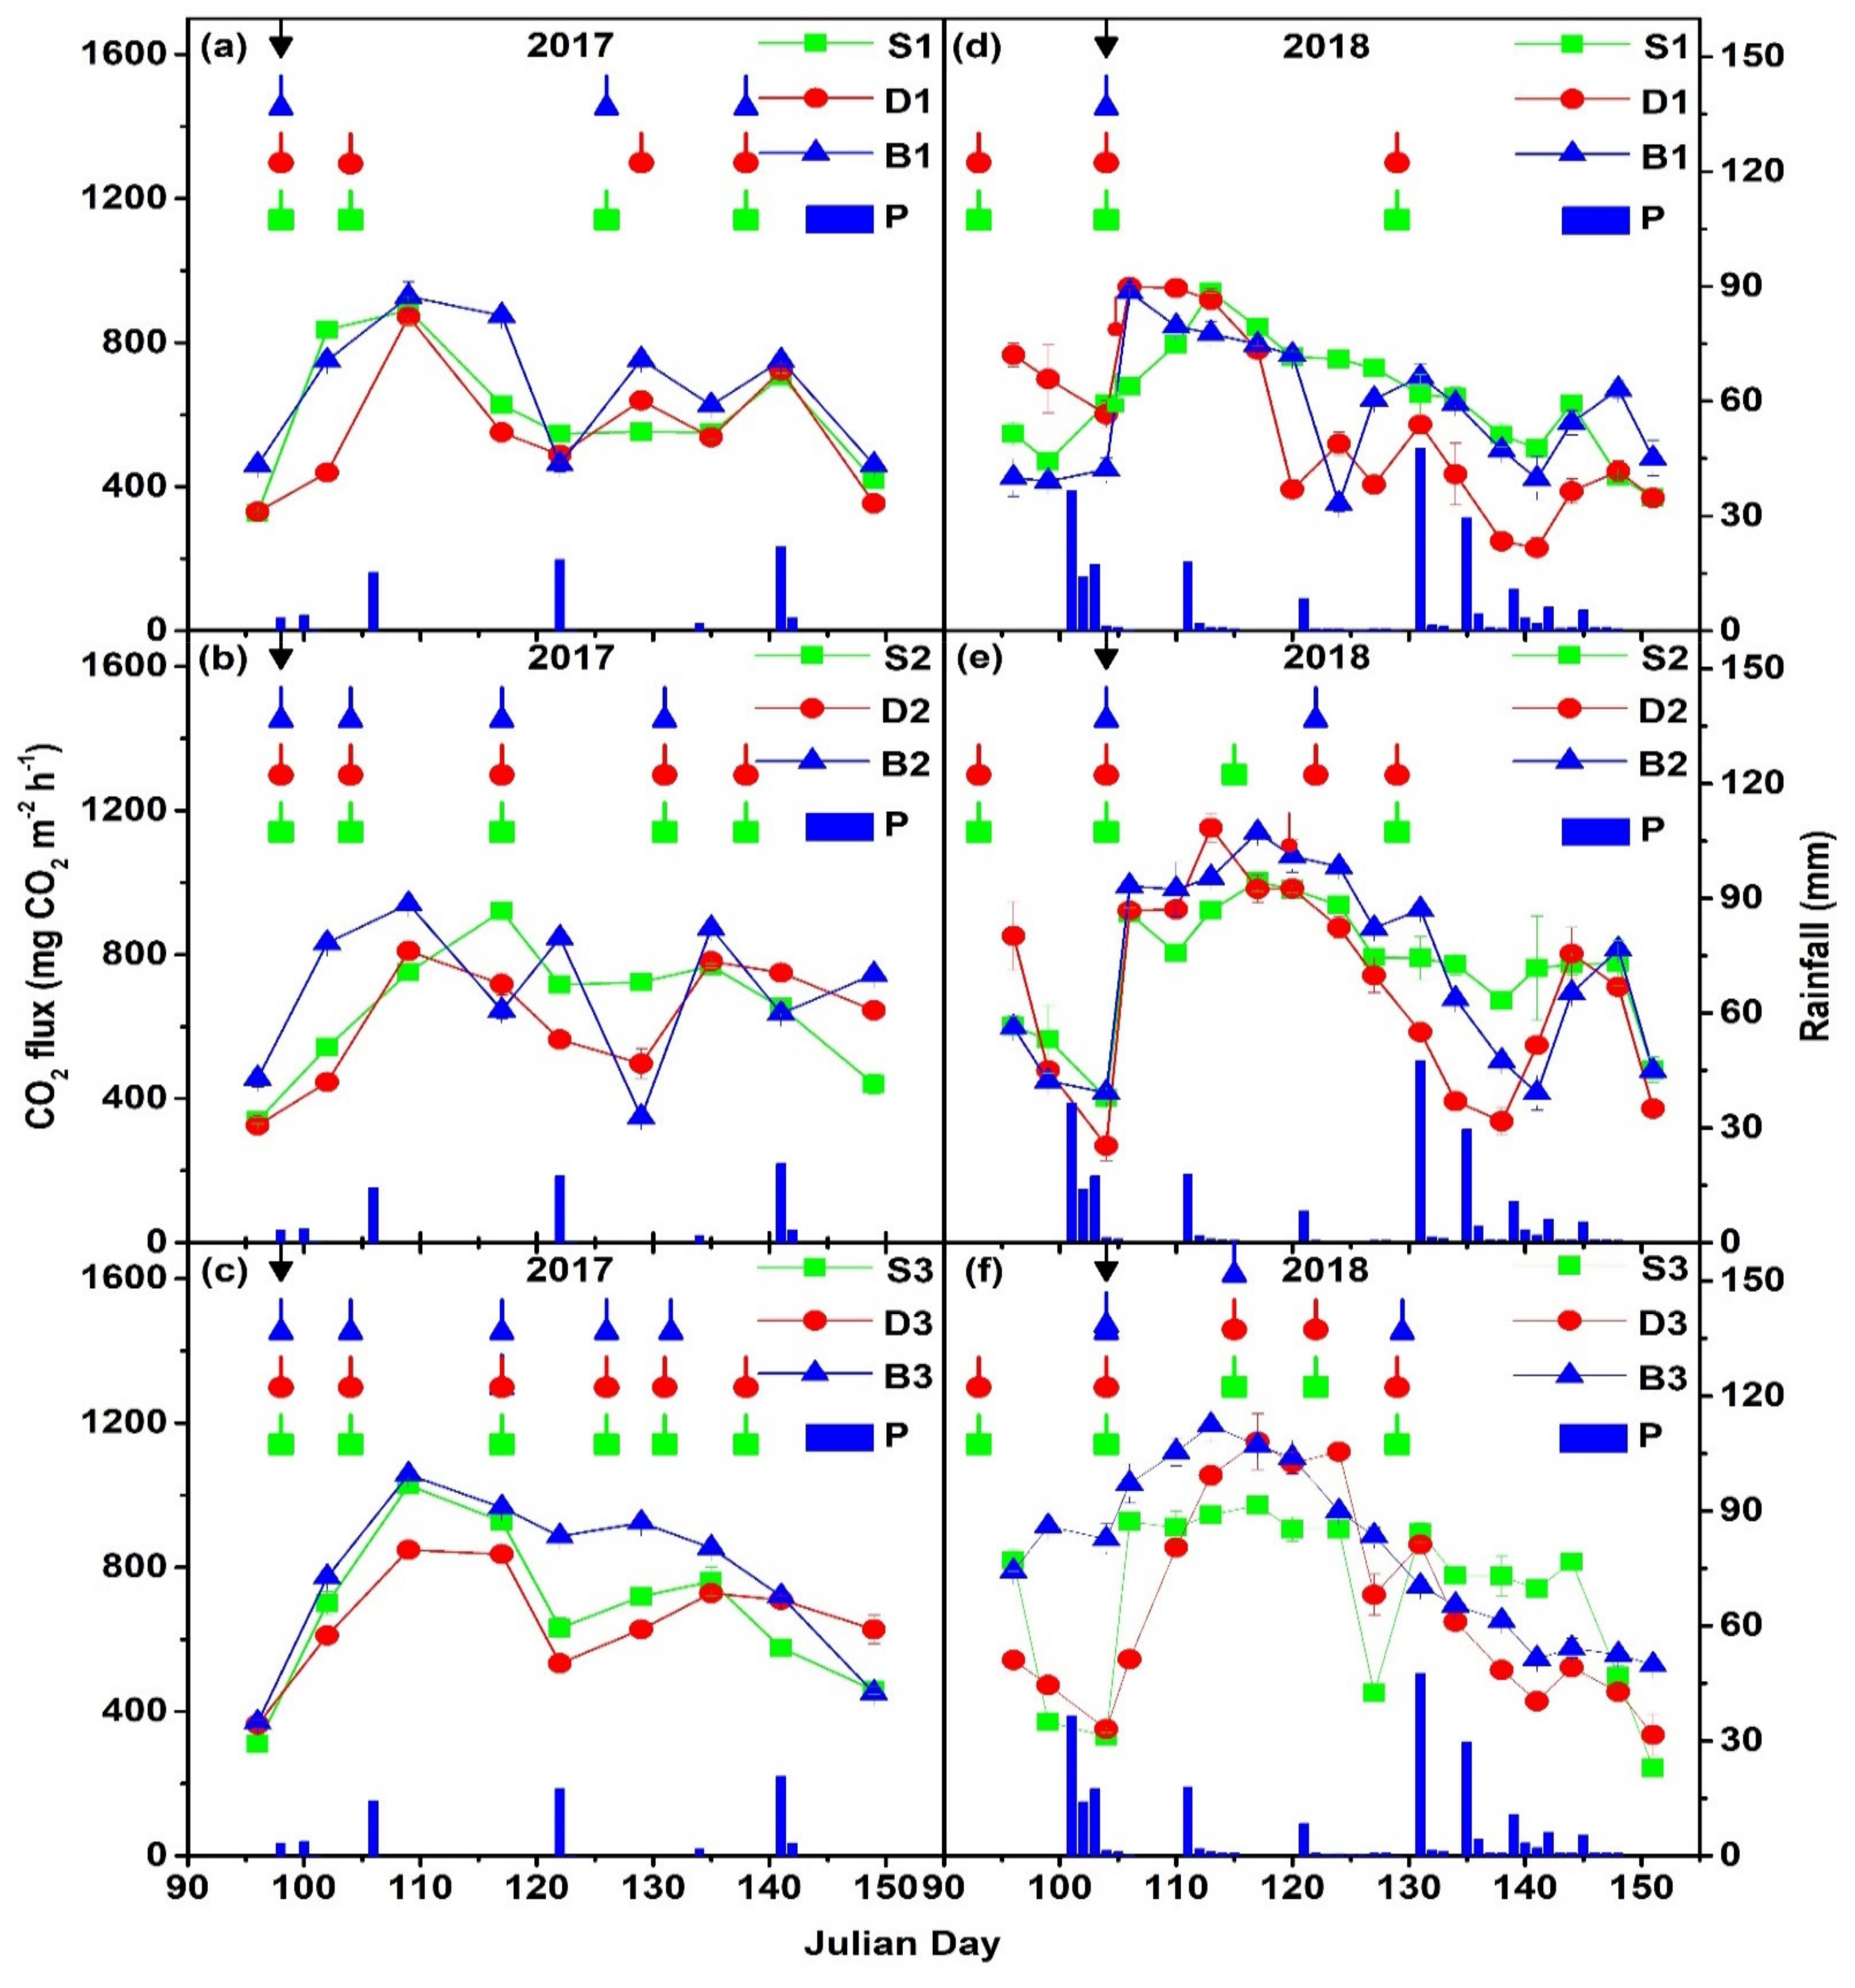
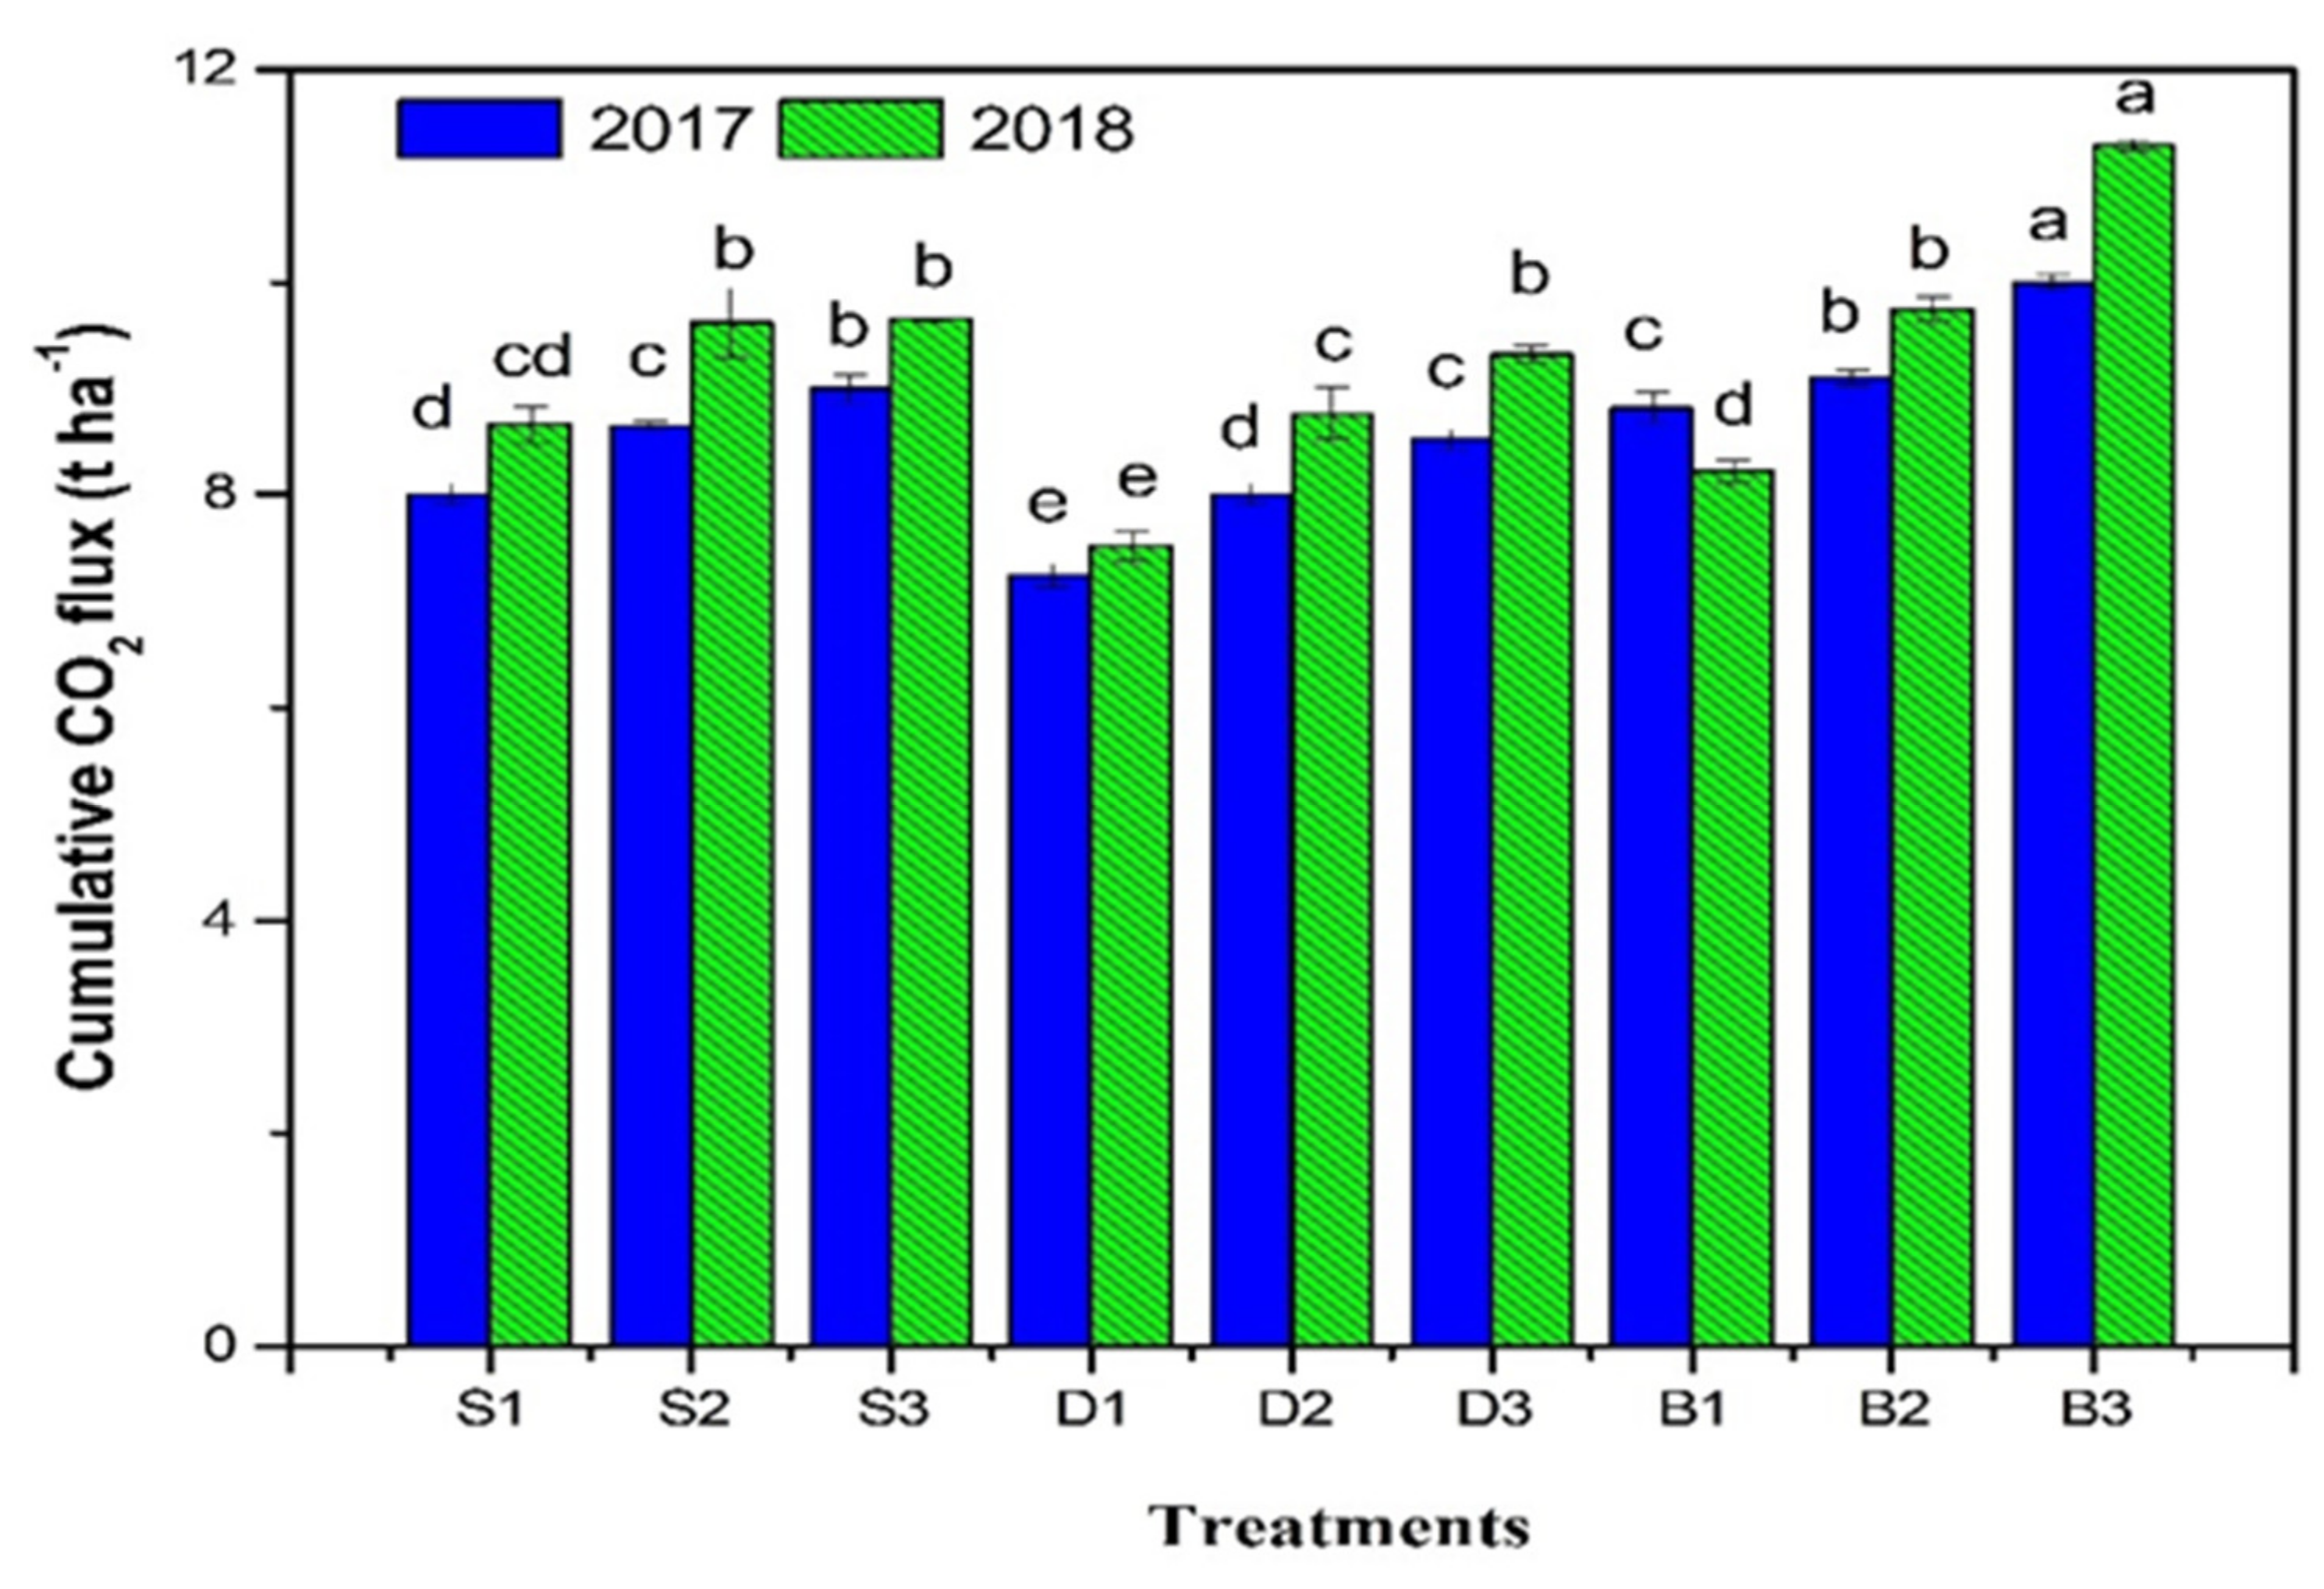
3.3. Effect of Irrigation Scheduling and Irrigation Methods on CO2 Emission

During the growing season of 2017 and 2018, CO2 emission showed clear seasonal dynamics with higher emission after fertilization and irrigation or rainfall events and gradually reduced with decreasing SWC. The seasonal soil CO2 emission ranged from 310.0 ± 4.7 (S3) to 1056.9 ± 18.7 (B3) mg CO2 m2 h1 and 230.2 ± 29.8 (D1) to 1193.1 ± 45.0 (B3) mg CO2 m2 h1 in 2017 and 2018, respectively (Figure 6). In 2017, irrigation scheduling with 50% FC treatment (Figure 6a) resulted in significantly lower CO2 peak fluxes in response to fertilization and irrigation events compared to 60% FC (Figure 6b) and 70% FC (Figure 6c) irrigation scheduling treatments. Drip irrigation (D1, D2, and D3) compared to sprinkler irrigation (S1, S2, and S3) and border irrigation (B1, B2, and B3) had substantially lower peak CO2 emission at all irrigation levels in 2017 and 2018 only at 70% FC treatment (Figure 6f). Similarly, in 2018, the 50% FC (Figure 6d) irrigation scheduling compared to the 60% FC (Figure 6e) and 70% FC (Figure 6f) irrigation scheduling had a notably lower CO2 peak emission in response to fertilization and irrigation events. Moreover, drip irrigation (D3) had substantially lower peak CO2 emissions compared to sprinkler irrigation (S3) and border irrigation (B3) at 70% FC irrigation scheduling only. Irrigation scheduling and methods influenced peak CO2 emission pulses significantly.
The cumulative CO2 amount was substantially (p < 0.01) affected by irrigation scheduling and irrigation method in the overall study, while the interaction between them was only significant in 2018 (Table 4). Sampling dates, as well as the interaction between sampling dates and irrigation scheduling and sampling dates and irrigation methods, all significantly (p < 0.05) affected CO2 emission. Multiple regression analysis shows that SWC (0–20 cm) significantly (p < 0.05) increased the soil CO2 emissions in the entire study (Table 5). Stepwise multiple linear regression observed that SWC explained about 70% of the variance in CO2 emissions while soil temperature and soil inorganic N content had no significant influence on the soil CO2 emissions.
CO2 emissions were summed from Julian days 96–149 in 2017 and 96–151 in 2018 and are shown in Figure 7. The total cumulative CO2 amount varied from 7.2 ± 0.1 (D1) to 10.0 ± 0.1 (B3) t ha1 in 2017 and from 7.5 ± 0.1 (D1) to 11.3 ± 0.1 (B3) t ha1 in 2018. The cumulative CO2 amount pattern in 2017 and 2018 was border > sprinkler > drip irrigation at each irrigation level. Besides that, the cumulative CO2 amount pattern at 50% FC irrigation scheduling treatments was sprinkler > border > drip irrigation in 2018. The cumulative CO2 amount was significantly different in irrigation methods treatments at all water levels in 2017. In 2018, there were no significantly higher accumulated CO2 amounts measured in drip and sprinkler irrigation at the 70% FC irrigation scheduling treatments or in the sprinkler and border irrigation at the 50% FC and 60% FC irrigation scheduling levels. At 50% FC, the soil cumulative CO2 amount was lower by 7.0–15.3% and 12.6–19.4%, compared to 60% and 70% FC in 2017 and 2018, respectively. Border irrigation at a 70% FC irrigation scheduling level has a significantly higher accumulated CO2 amount.

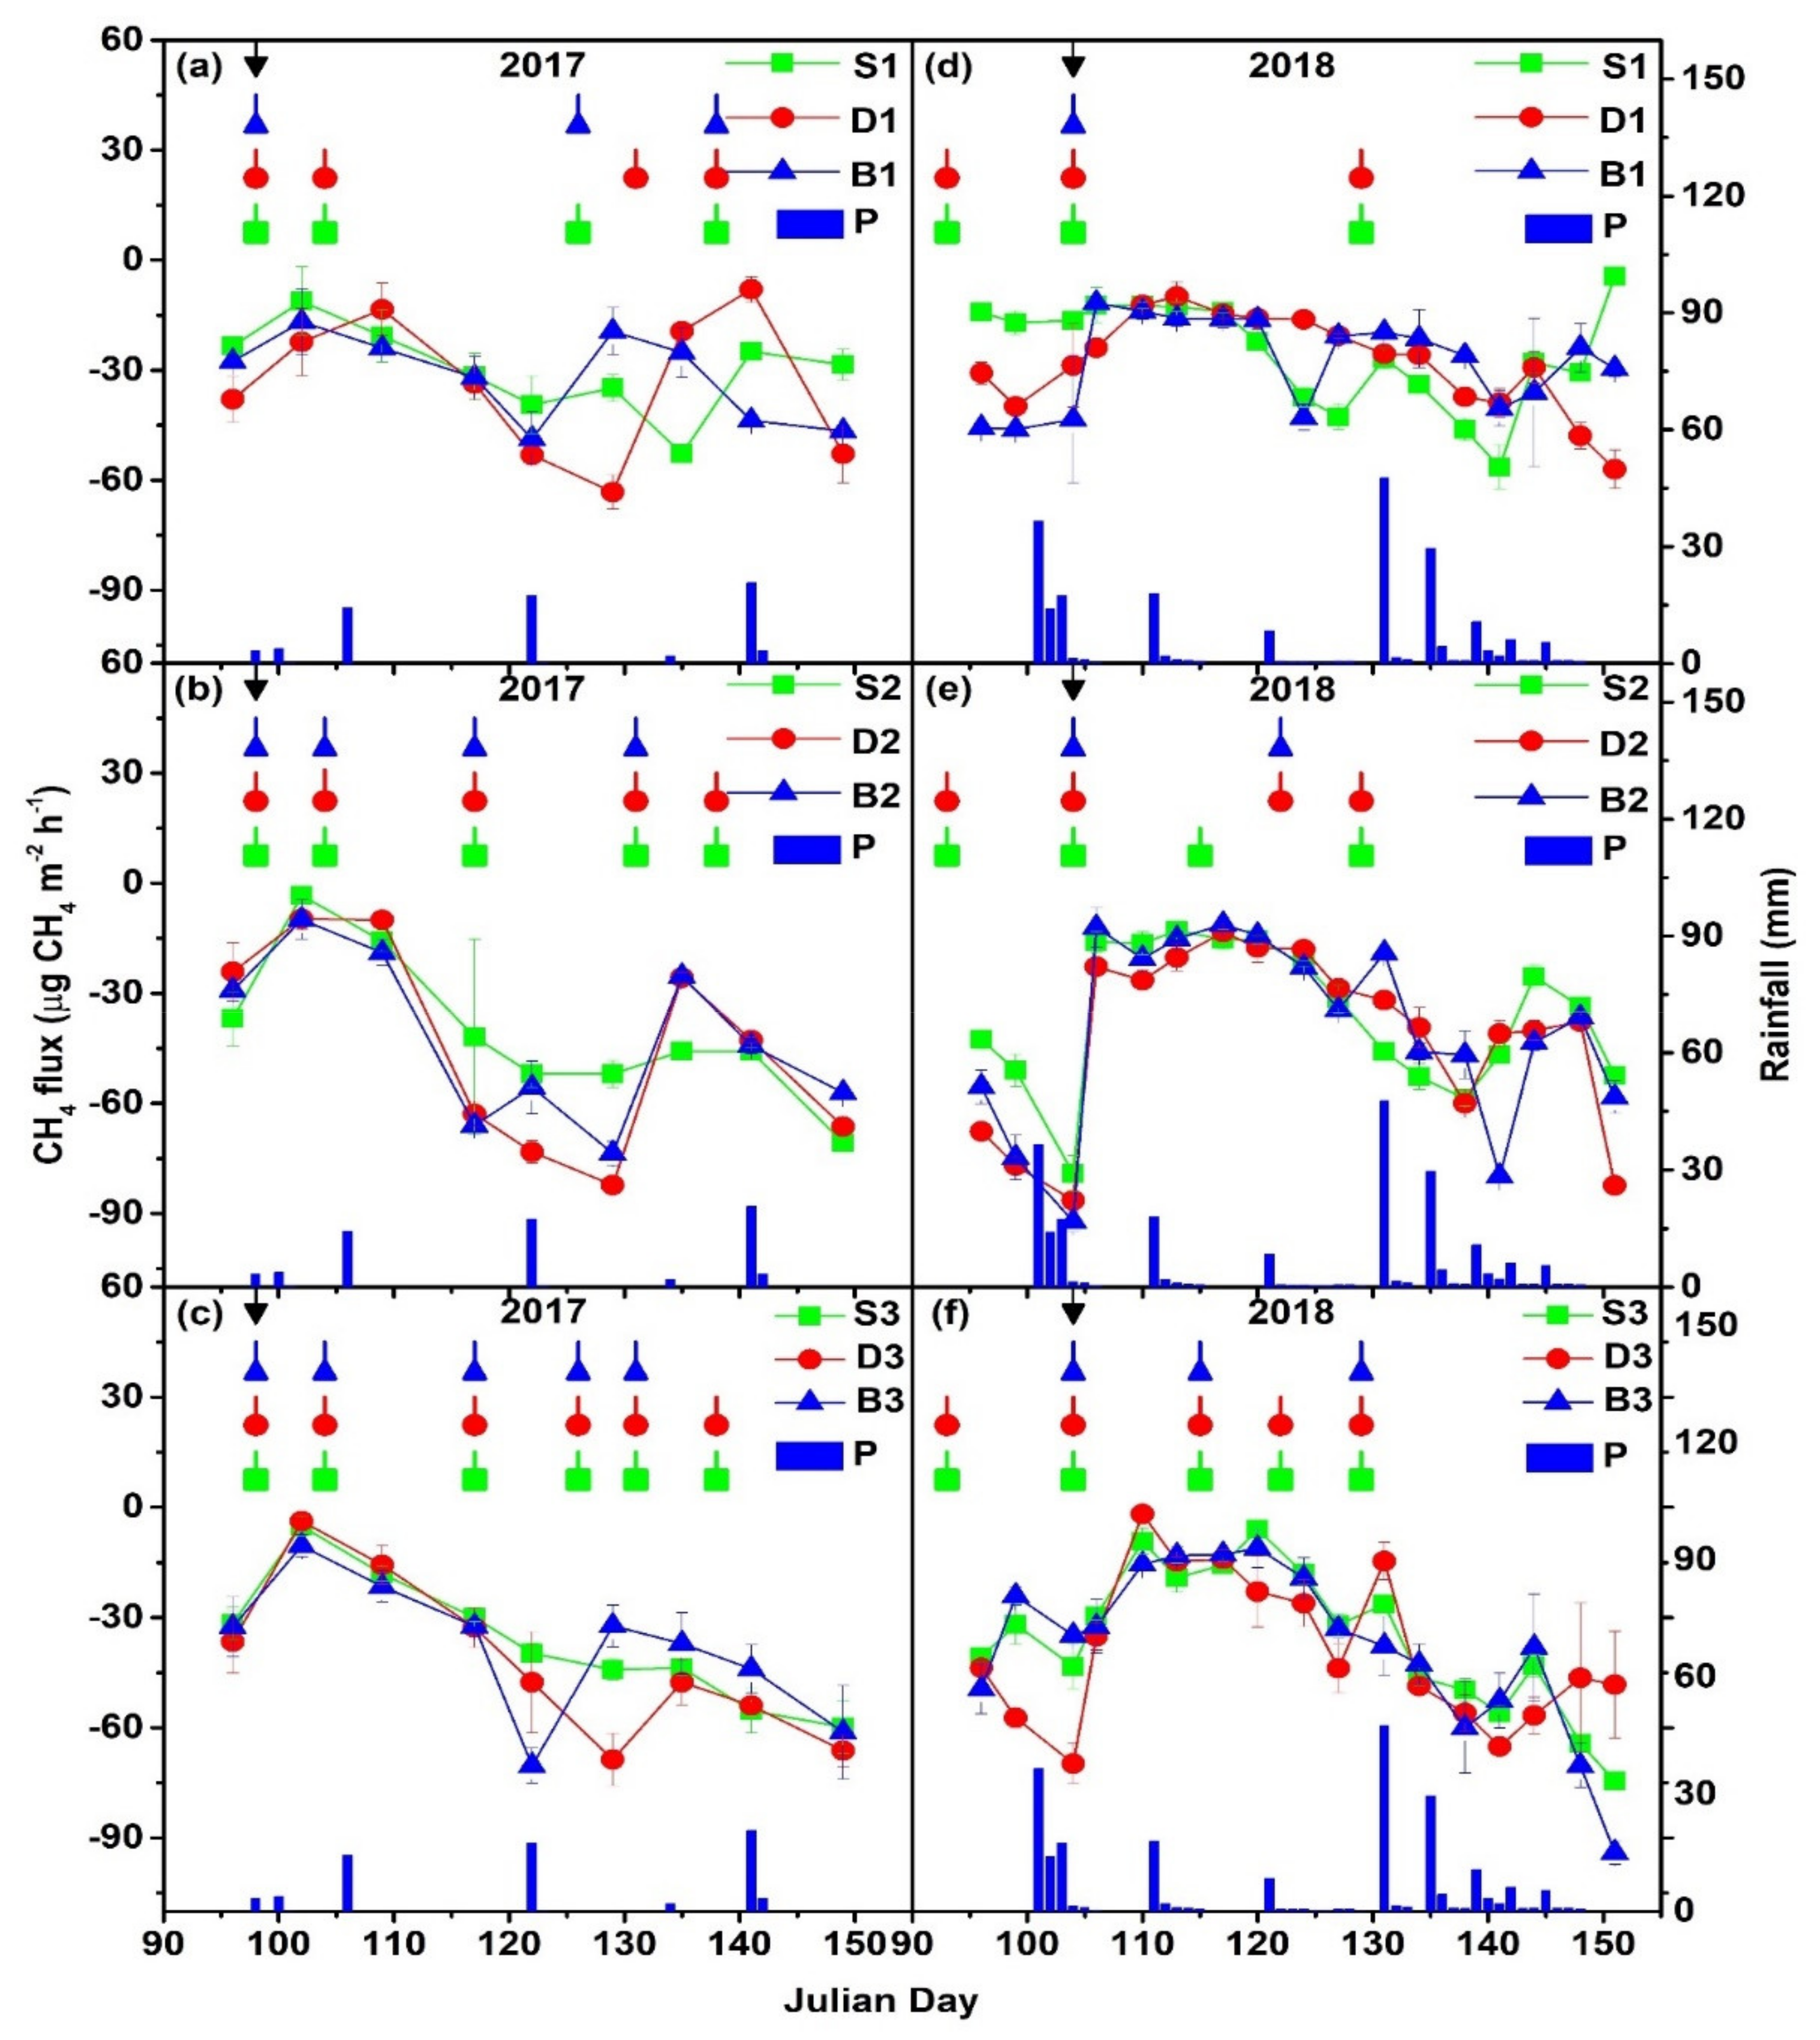
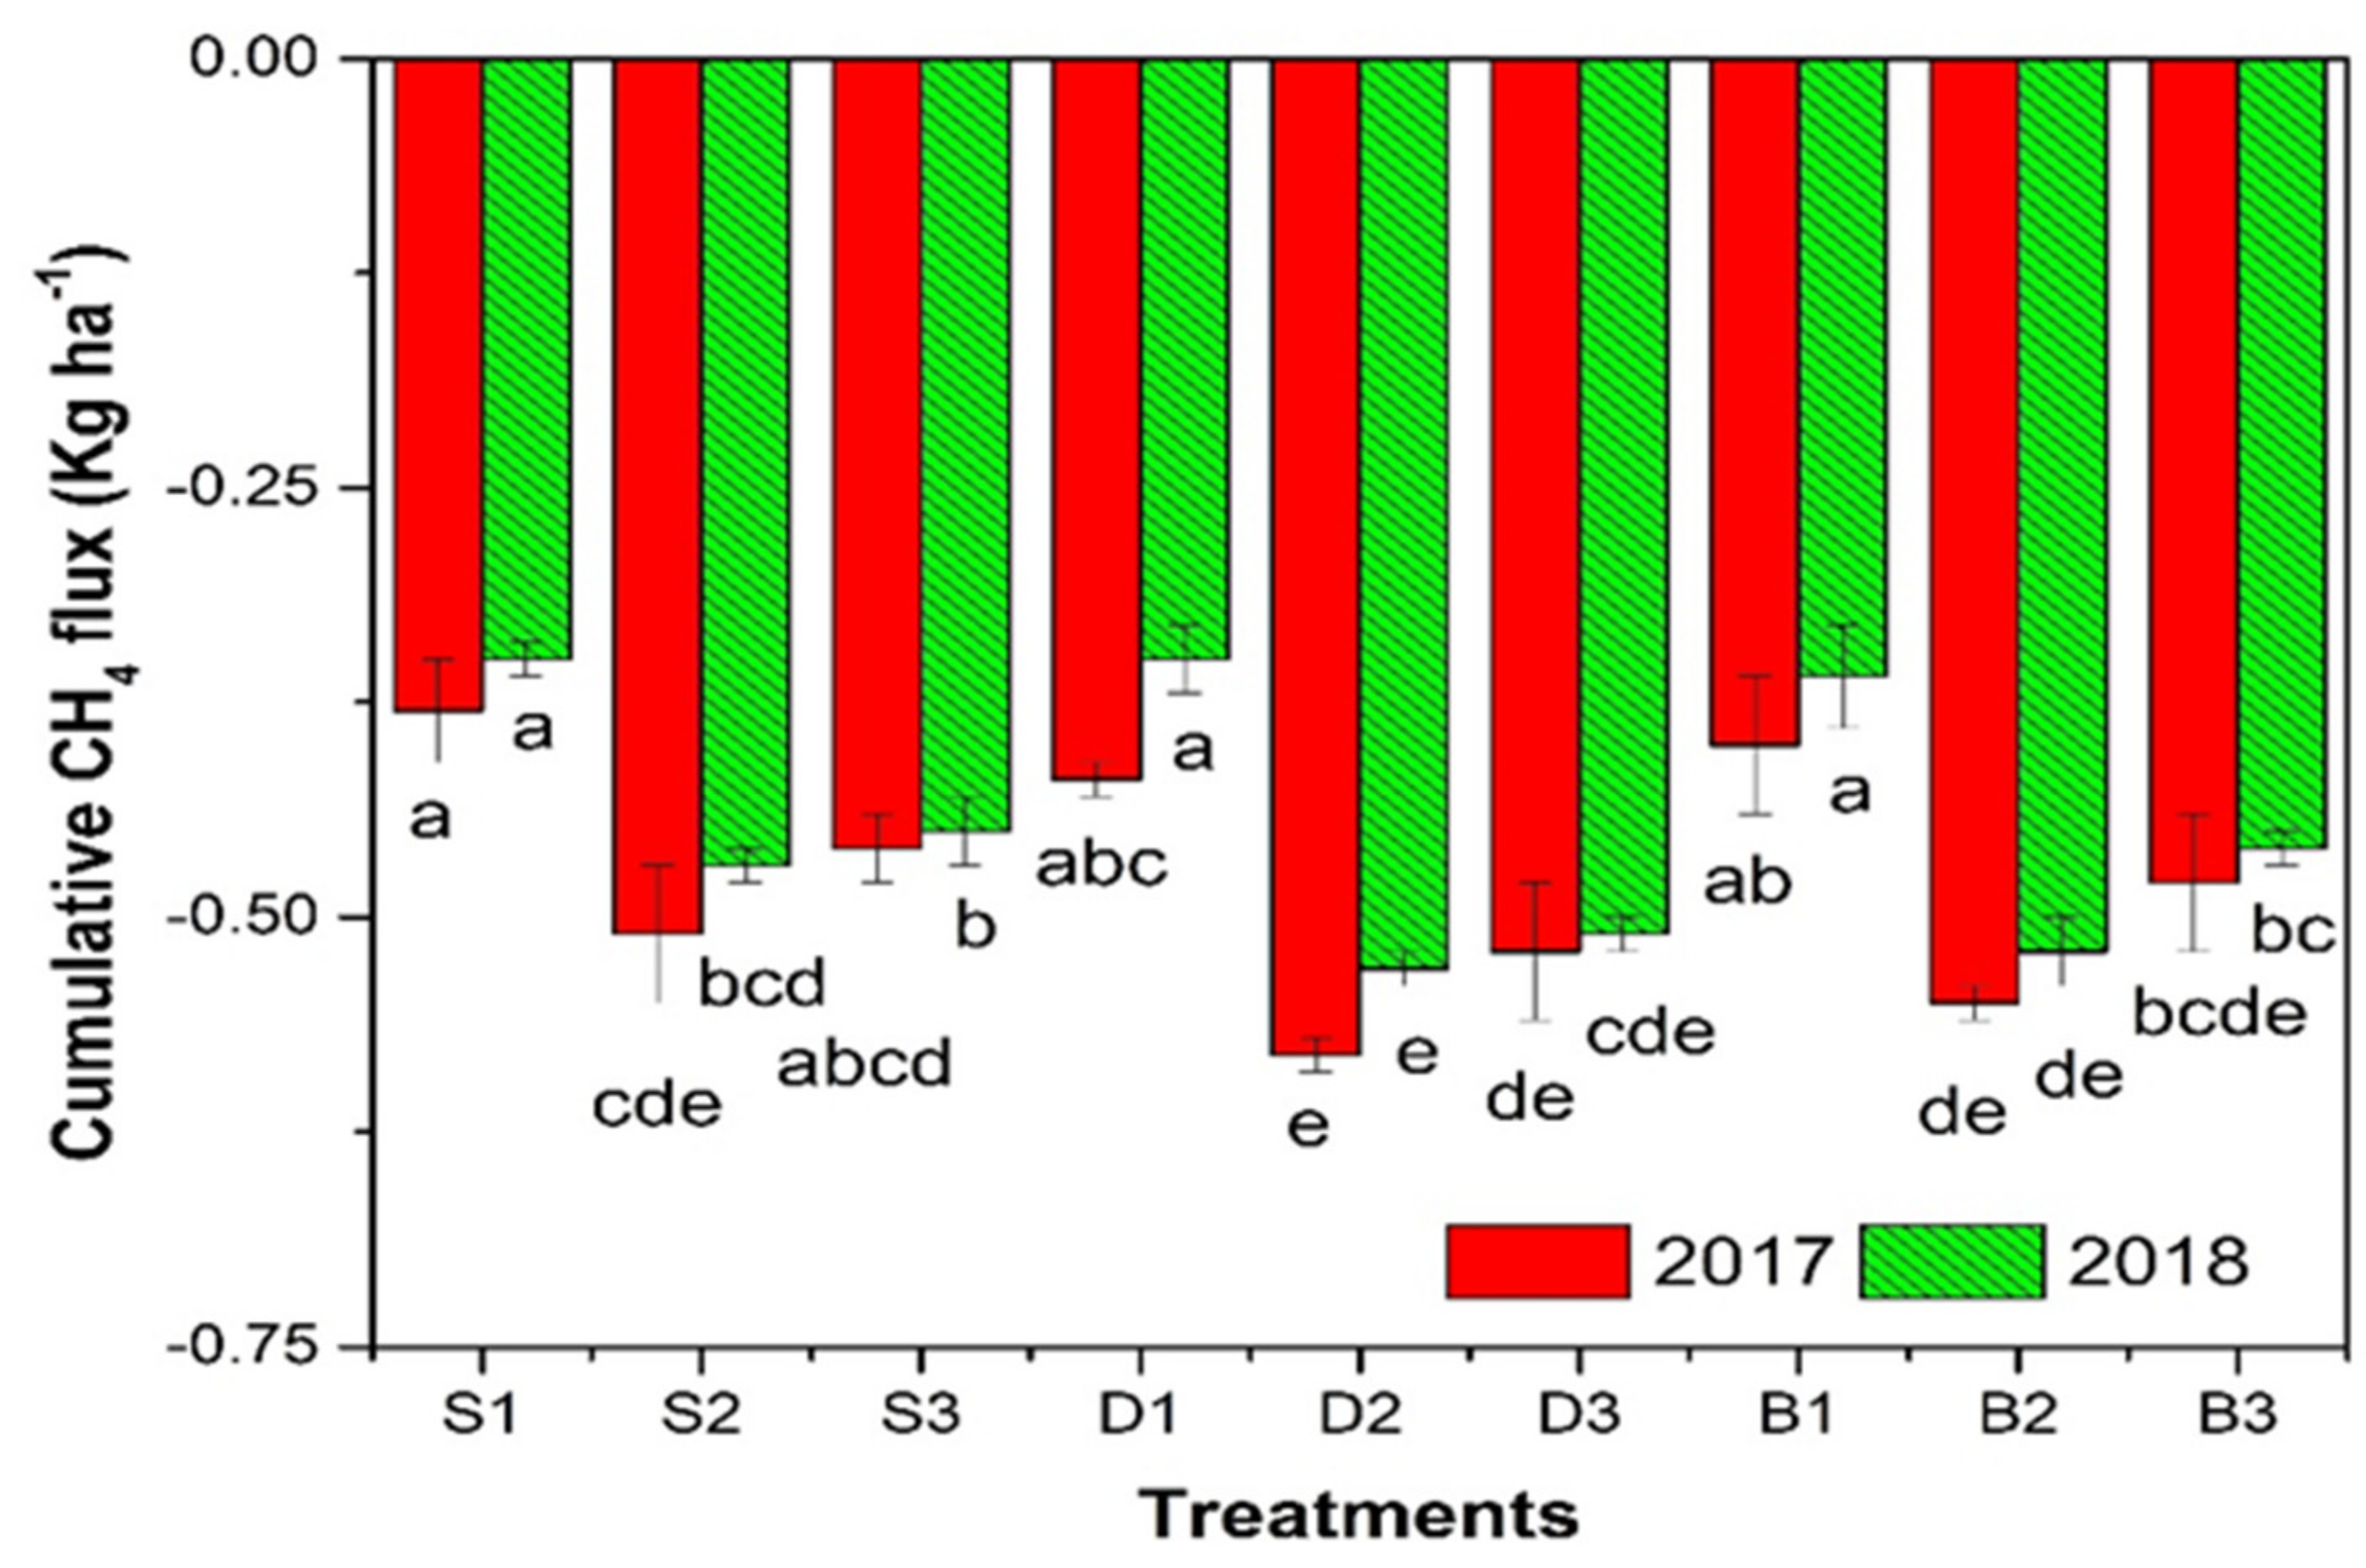
3.4. Effect of Irrigation Scheduling and Irrigation Methods on CH4 Uptake

The winter wheat field acted as a net CH4 sink during the experiment. Soil CH4 uptake showed large fluctuations but no seasonal trends (Figure 8). CH4 uptake was limited and occurred shortly after N fertilization, followed by irrigation or irrigation only. In 2017, the seasonal CH4 uptake varied from −3.3 ± 1.7 (S2) to −82.3 ± 0.8 (D2) µg CH4 m2 h1 and in 2018 −1.8 ± 0.2 (D3) to −92.2 ± 2.8 (B2) µg CH4 m2 h1 (Figure 8). In 2017, the 60% FC irrigation scheduling (Figure 8b) had a higher mean CH4 uptake rate compared to that of the 50% FC (Figure 8a) and 70% FC (Figure 8c) irrigation scheduling treatments. However, drip irrigation (D1, D2, and D3) had relatively higher mean CH4 consumption compared to sprinkler irrigation (S1, S2, and S3) and border irrigation (B1, B2, and B3) in 2017. Similarly, in 2018, the 60% FC (Figure 8e) irrigation scheduling had a notably higher mean CH4 uptake rate compared to that of the 50% FC (Figure 8d) and 70% FC (Figure 8f) irrigation scheduling levels. Moreover, drip irrigation (D1, D2, and D3) had a higher mean CH4 uptake rate in 2018 compared to sprinkler irrigation (S1, S2, and S3) and border irrigation (B1, B2, and B3). Irrigation scheduling significantly (p < 0.001) influenced the mean CH4 uptake rate throughout the entire study, irrigation methods significantly affect in 2018 only, while their interaction has no significance in this study.
The CH4 uptake rate followed a pattern of drip > border > sprinkler irrigation at each irrigation level. CH4 uptake was restricted after irrigation events and intense rainfall, owing to a longer soil wetting duration that resulted in limited oxygen in the soil. Accumulated CH4 uptake ranged from −0.4 ± 0.0 (S1) to −0.6 ± 0.0 (D2) kg ha1 in 2017 and from −0.4 ± 0.0 (S1) and/or −0.4 ± 0.0 (D1) to −0.5 ± 0.0 (D2) kg ha1 in 2018 (Figure 9). The cumulative CH4 consumption was highest in the drip irrigation at 60% FC irrigation scheduling in the overall study and lowest in the sprinkler irrigation in 2017 and the sprinkler and drip irrigation in 2018. The cumulative CH4 uptake did not differ significantly in 2017 or 2018, except among drip and sprinkler irrigation at 60% and 70% FC irrigation scheduling treatments in 2018. Drip irrigation had a higher cumulative CH4 uptake compared to sprinkler irrigation and border irrigation (approximately 6.3–12.6% in 2017 and 3.7–9.5% in 2018). The cumulative CH4 consumption was highest at the 60% FC irrigation scheduling in this study. Irrigation scheduling substantially (p < 0.001) influenced the accumulated CH4 uptake in both seasons, irrigation methods had significant effects in 2018 only, but their interaction had no significant effects in the whole study (Table 4). Statistics analysis results showed that sampling dates, as well as sampling dates and irrigation scheduling, and sampling dates and irrigation methods, all significantly (p < 0.05) affected the CH4 uptake rate. Multiple linear regression analysis showed that the CH4 uptake was significantly (p < 0.05) negatively correlated with the SWC (Table 5). In this study, soil temperature and soil NH4+-N and NO3-N content has no significant correlation (p > 0.05) with soil CH4 uptake.

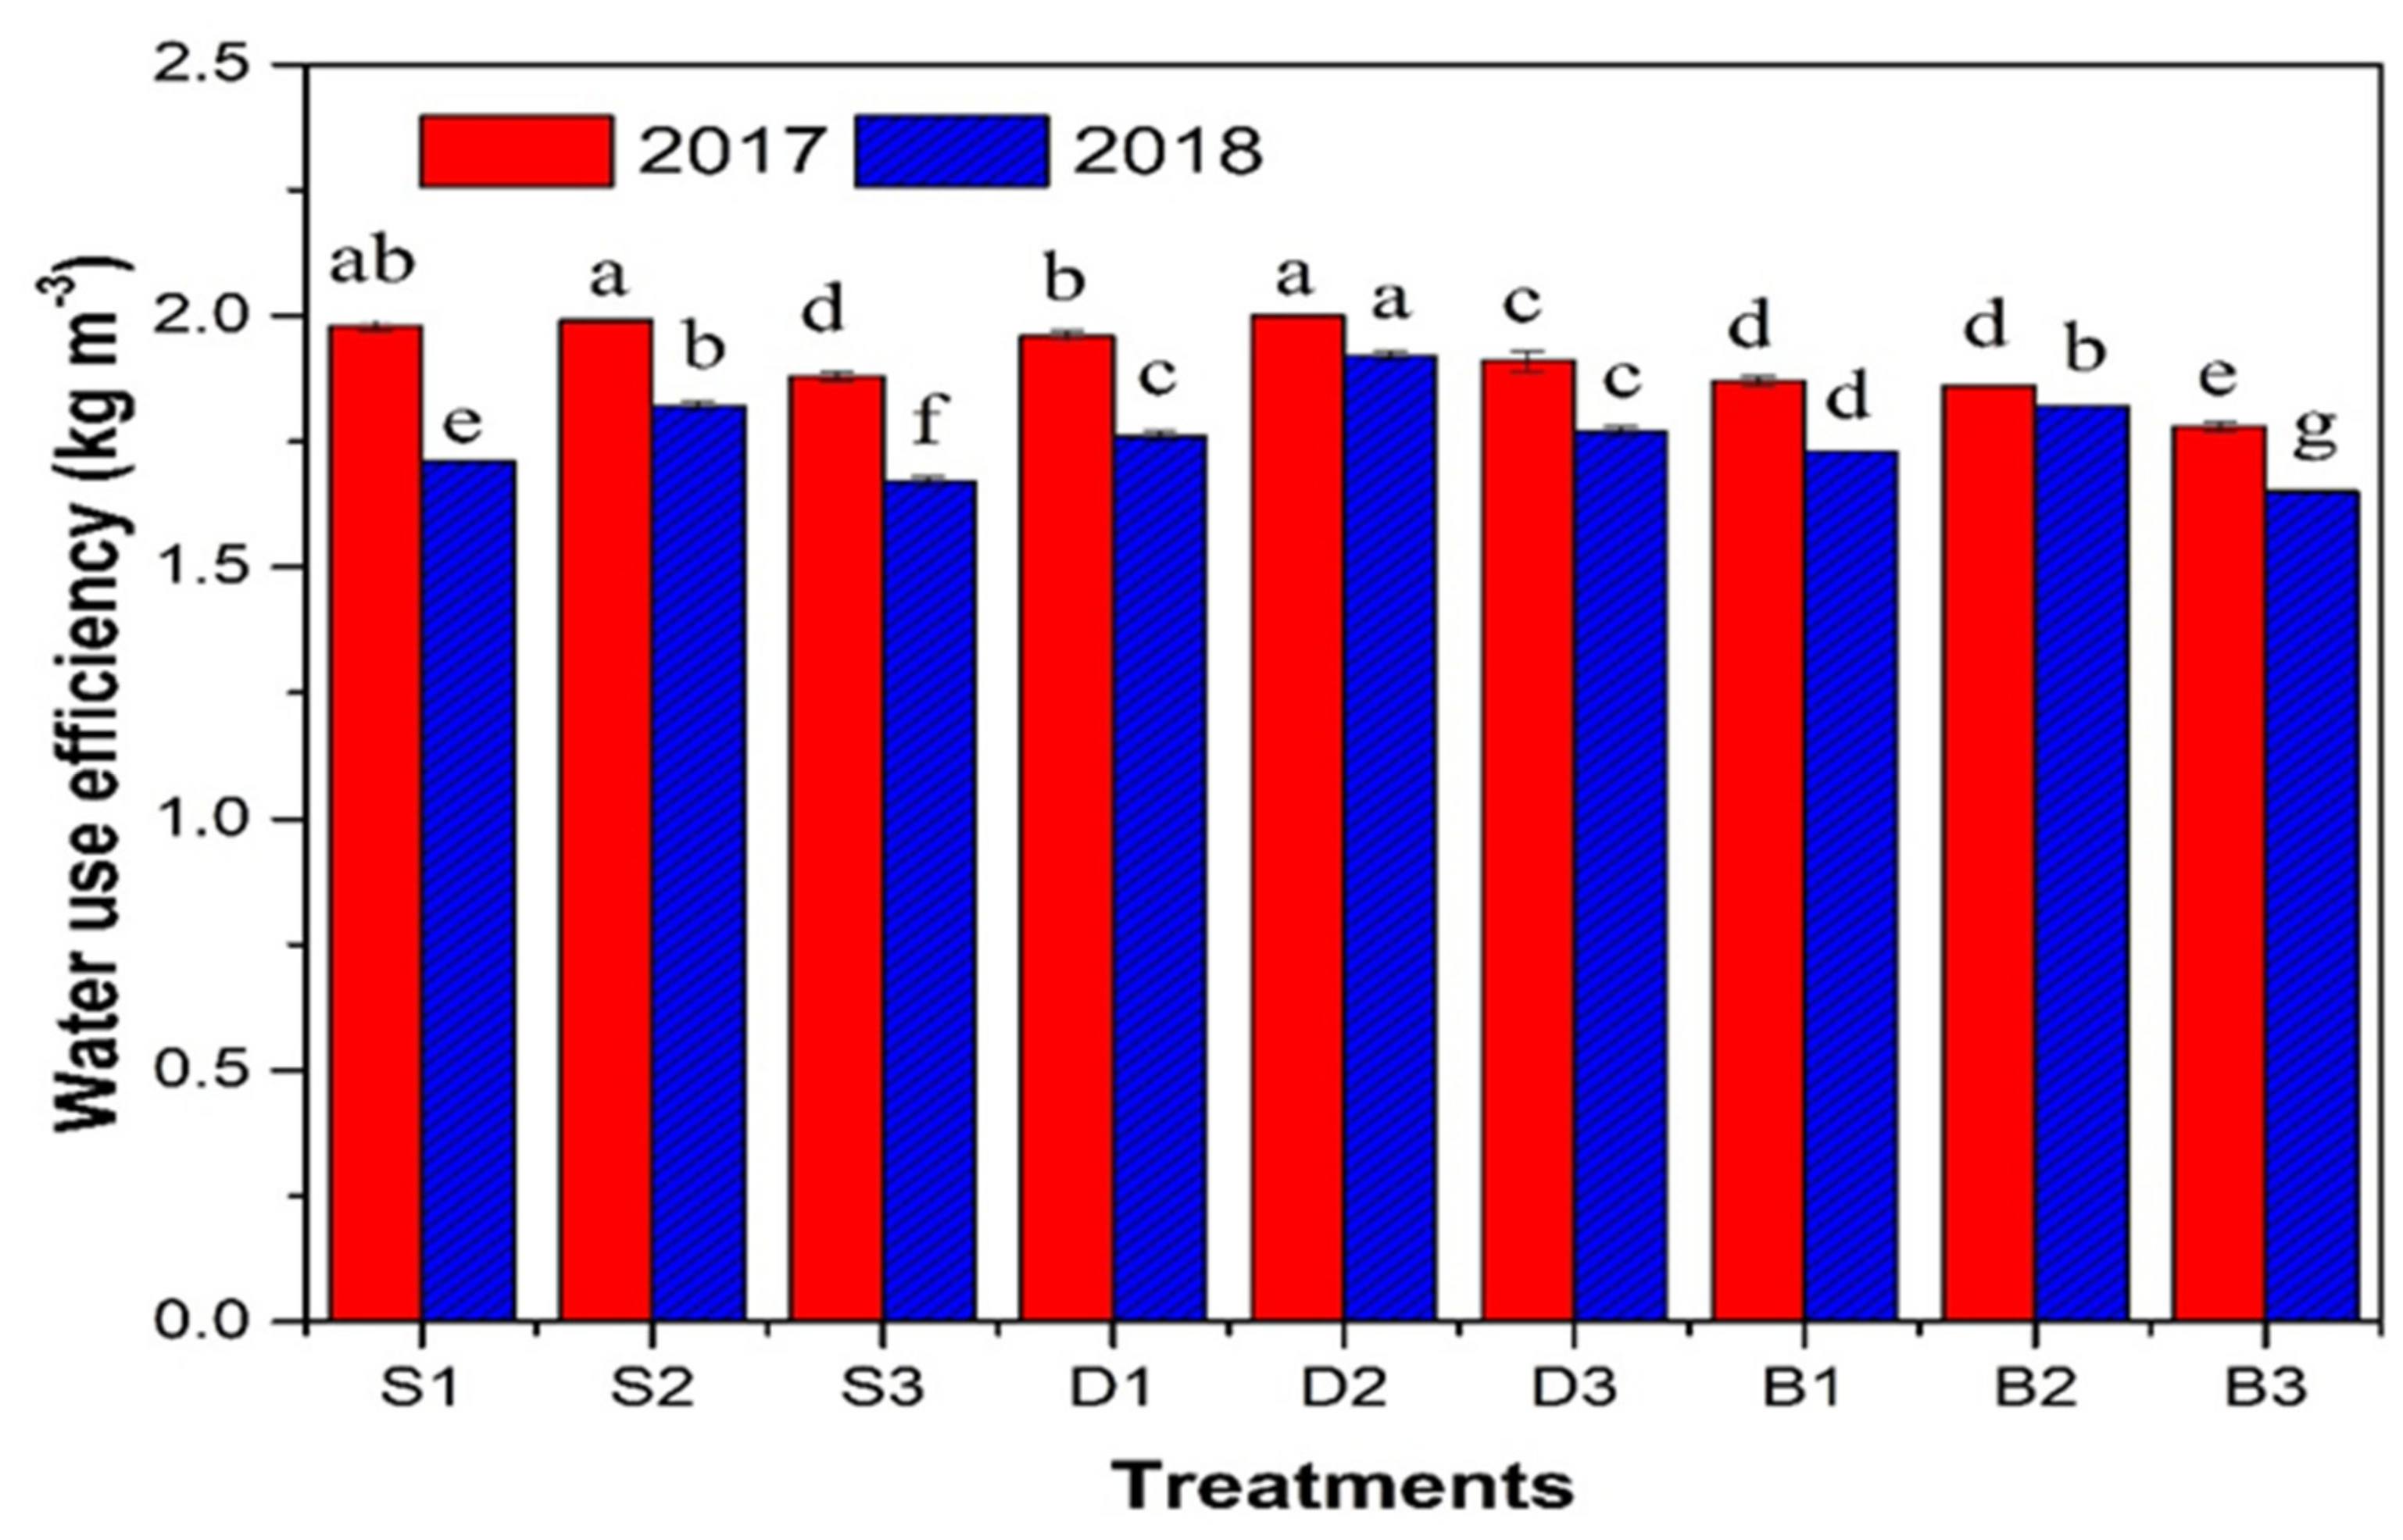
3.5. Grain Yield and WUE

The optimum grain yield was observed in drip irrigation at a 60% FC irrigation scheduling level (9.7 ± 0.0 t ha1 in 2017 and 9.7 ± 0.3 t ha1 in 2018). Further, the minimum grain yield was observed in border irrigation at a 50% FC irrigation scheduling (8.3 ± 0.0 t ha1 in 2017 and 7.1 ± 0.1 t ha1 in 2018) (Table 6). The grain yield of D2 and D3 treatments were significantly higher compared to those of S2, S3, B2, and B3 treatments. The grain yield of D1 was substantially higher compared to that of the B1 treatment but not significantly higher compared to that of the S1 treatment in 2017. In 2018, D1 had a 3.4–15.3% higher grain yield compared to S1 and B1 treatments, respectively. D2, compared to S2 and B2 treatments, produced 5.2–7.5% and 6.3–6.8% higher grain yield in 2017 and 2018, respectively. Grain yield in the drip irrigation system was significantly higher due to the higher number of effective tillers (per m2), 1000-kerenel weight (kg), and lower non-effective tillers (per m2) compared to sprinkler and border irrigation methods (data not shown). The lowest irrigation scheduling level, compared with moderate and higher irrigation scheduling, has substantially lower 9.4–16.5% and 7.8–14.2% grain yield in 2017 and 2018, respectively. Drip and sprinkler irrigation methods produced relatively higher grain yields at the lowest irrigation scheduling treatment compared to the border irrigation method. Irrigation scheduling, irrigation methods, and the interaction between them significantly (p < 0.001) influenced grain yield.
At irrigation scheduling of 60% FC, drip irrigation produced a maximum WUE of 2.0 kg m−3 in 2017 and 1.9 kg m−3 in 2018 (Figure 10). However, at irrigation scheduling of 70% FC, border irrigation produced a minimum WUE of 1.8 kg m−3 in 2017 and 1.7 kg m−3 in 2018. Compared with border irrigation, drip and sprinkler irrigation have significantly higher WUE. In 2017, the overall WUE of lower irrigation scheduling (50% FC) was substantially higher compared with moderate (60% FC) and higher (70% FC) irrigation scheduling. In 2018, the WUE of 60% FC irrigation scheduling was substantially higher compared with 50% FC and 70% FC irrigation scheduling. Irrigation scheduling of 70% FC, compared with 50% FC and 60% FC irrigation scheduling, has a lower WUE of 2.0–4.2% and 5.0–9.2% in 2017 and 2018, respectively. In contrast, border irrigation compared with sprinkler and drip irrigation has a lower WUE of 0–5.6% and 4.6–6.1% in 2017 and 2018, respectively. The WUE of drip irrigation was significantly about 0.5–4.9% and 4.8–6.5% higher compared with sprinkler and border irrigation in 2017 and 2018, respectively. Moderate irrigation scheduling, compared with lower and higher irrigation scheduling, has a higher WUE 0.8–7.1% and 5.0–9.2% in 2017 and 2018, respectively. At a higher irrigation level, the photosynthetic rate of crops would not increase linearly; therefore, the transpiration rate consistently increased [40]. Thus, crops consumed more water at a higher irrigation level. As crop transpiration is considered the non-consumptive use of water for the crop [41]; therefore, higher irrigation caused a lower WUE. The WUE was substantially (p < 0.05) affected by irrigation methods, irrigation scheduling, and the interaction between them.
The mechanisms behind the soil CO2 emissions of dry soils after irrigation is due to: (i) irrigation caused mineralization of soil organic matter caused by microbial activity; (ii) soil wetting disintegrates microbial cells completely or by dropping microbial carbon regulates the water potential [42]. Subsequently, soil microbes uptake microbial carbon released in the soil and mineralized therefore produced higher soil CO2 instantly [43]. Mineralization of microbial carbon could be the main element to elevate the CO2 emission significantly.

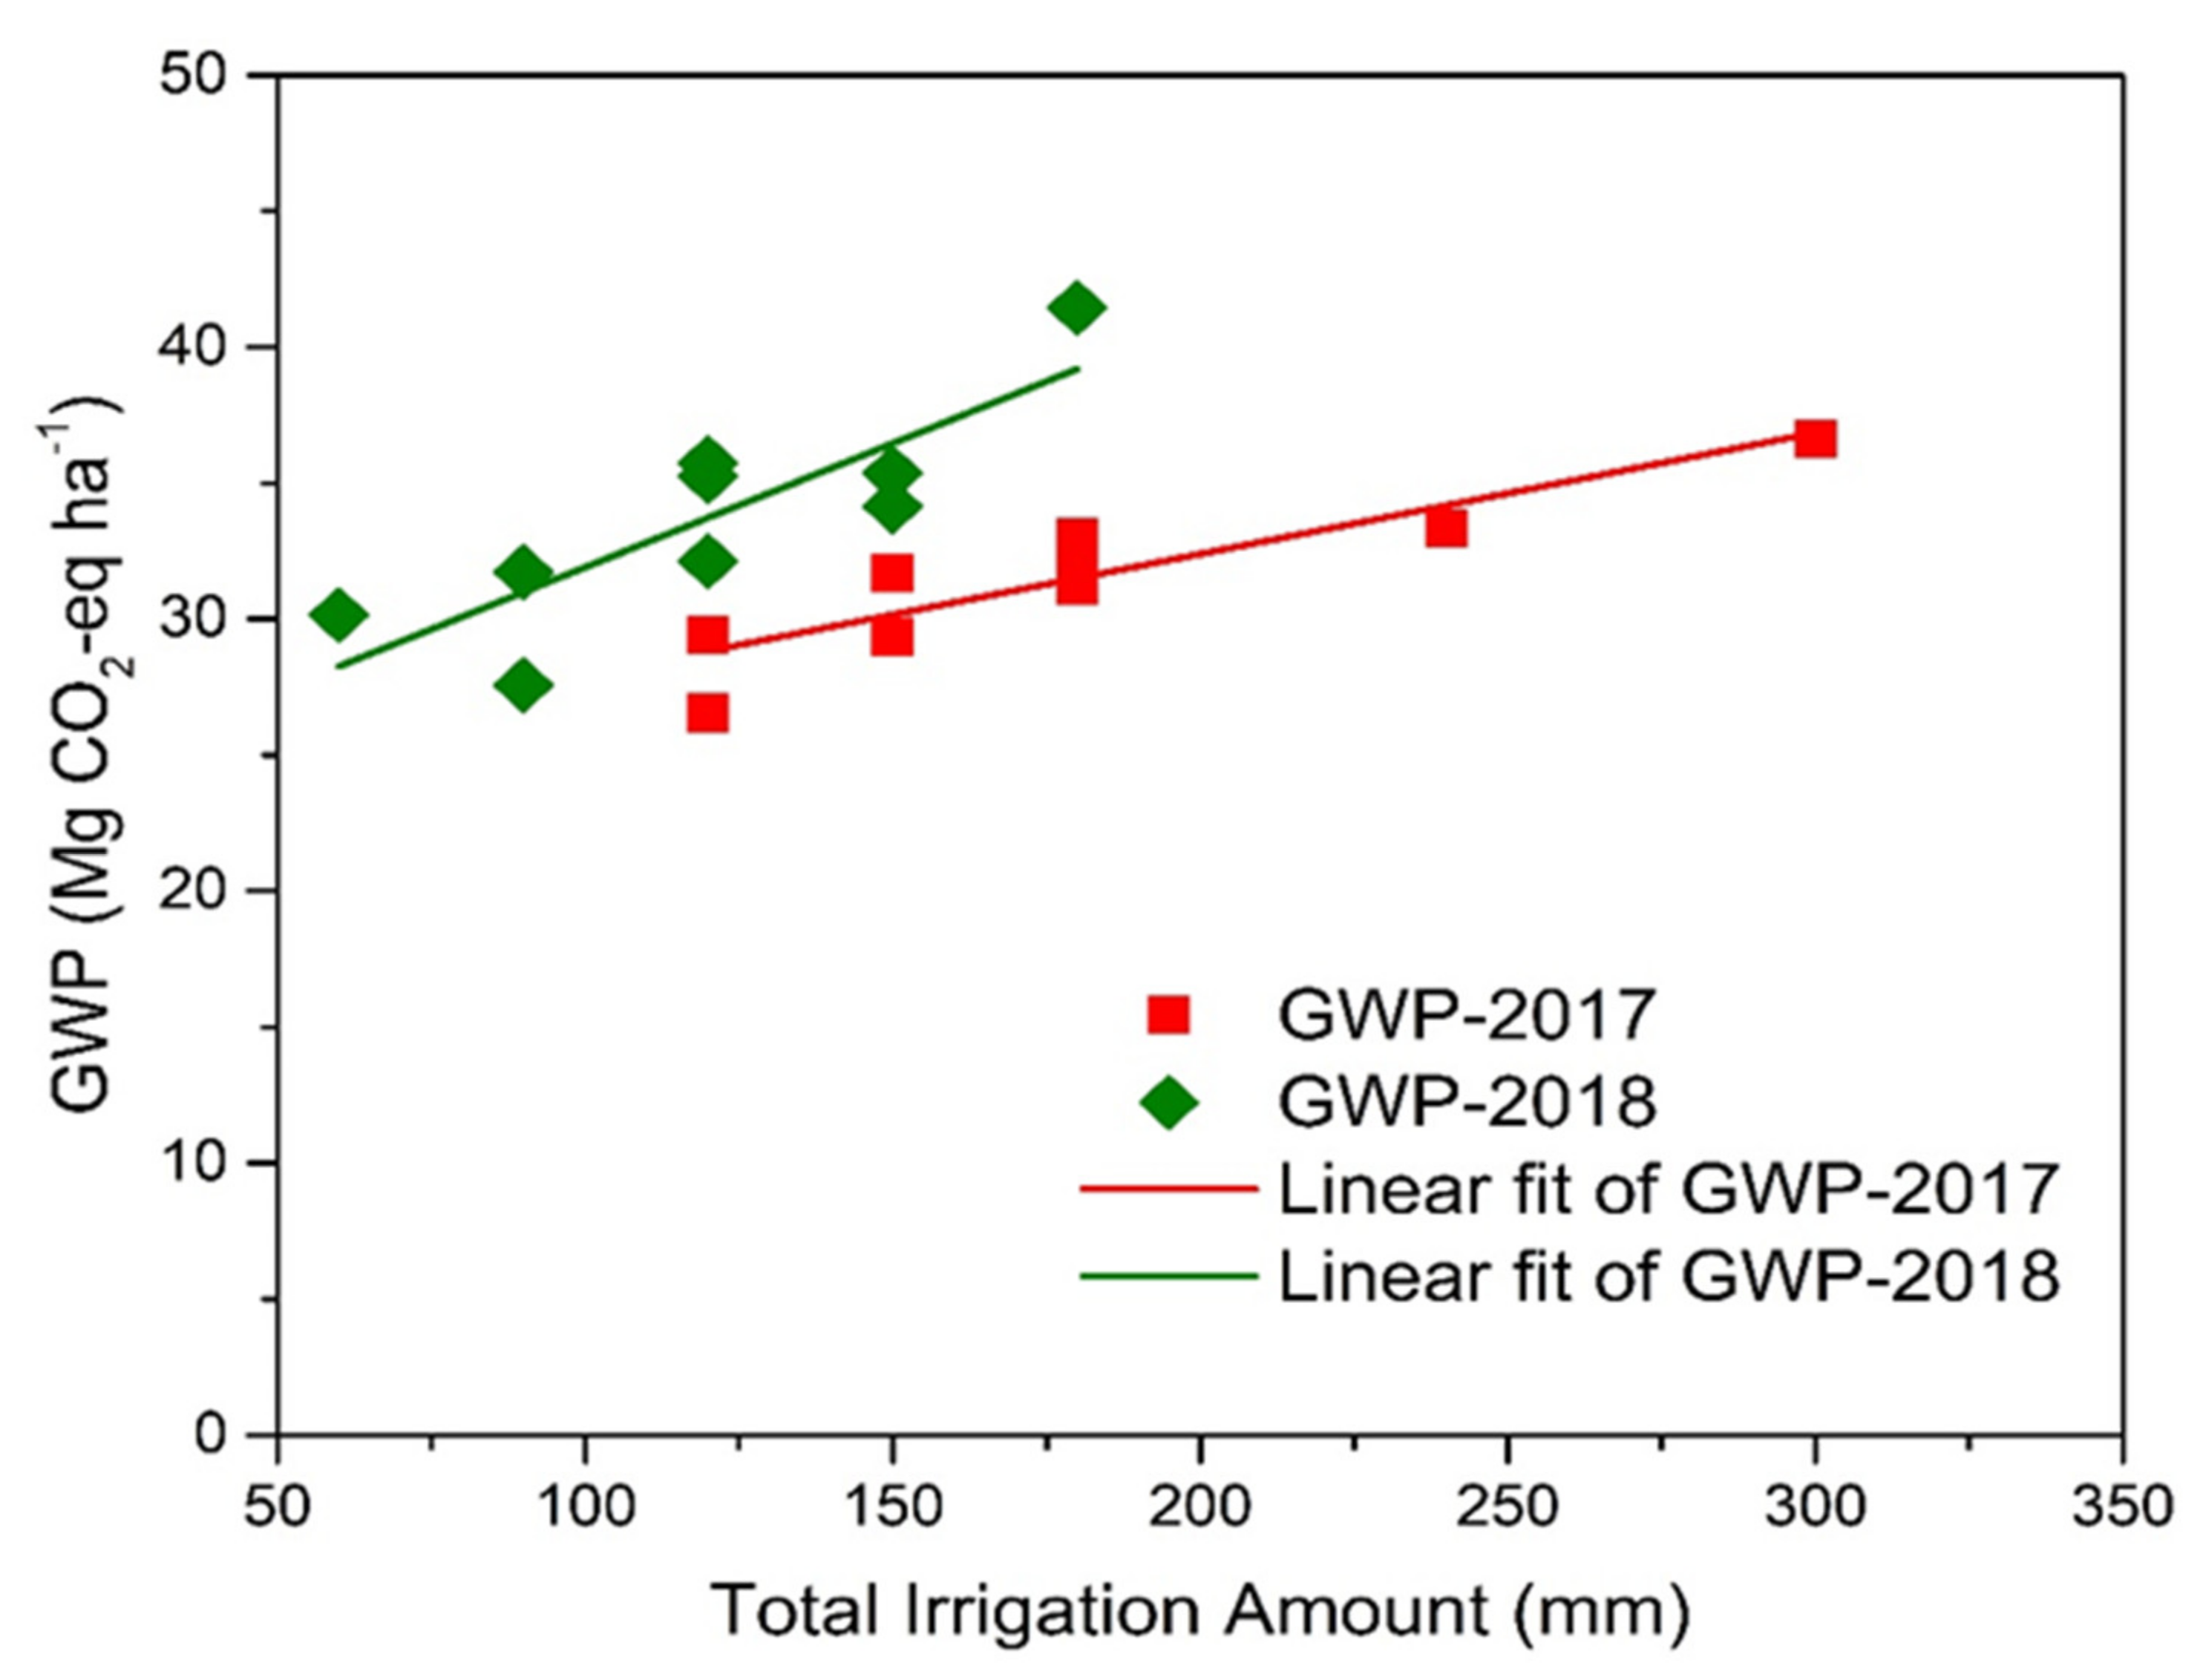
3.6. Global Warming Potential (GWP)

The GWP of CO2 emission and CH4 uptake was lowest in drip irrigation at the 50% FC irrigation scheduling (26.5 ± 0.4 Mg CO2-eq ha1 in 2017 and 27.6 ± 0.5 Mg CO2-eq ha1 in 2018) and highest in border irrigation at the 70% FC irrigation scheduling treatment (36.6 ± 0.3 Mg CO2-eq ha1 in 2017 and 41.5 ± 0.2 Mg CO2-eq ha1 in 2018) (Table 6). In 2018, GWP was 3.9–13.2% higher compared to that in 2017. The winter wheat field acted as a CH4 sink that reduced the CO2 emission contribution to the overall GWP. GWP was significantly different among each three irrigation scheduling levels in 2017, while sprinkler irrigation and drip irrigation at the 70% FC irrigation scheduling, as well as sprinkler and border irrigation at 60% and 50% FC irrigation scheduling, had no substantially higher GWP in 2018. Drip irrigation at all irrigation levels had a lower GWP, followed by sprinkler and border irrigation, except in 2018 at the 50% FC irrigation scheduling, where the order was drip > border > sprinkler irrigation. In 2017, the 60% FC irrigation scheduling did not have a significantly higher GWP compared to the 50% and 70% FC irrigation scheduling, but in 2018, there was a significant (p < 0.05) difference in GWP at all irrigation scheduling levels. Drip irrigation had the lowest GWP compared to sprinkler irrigation and border irrigation (7.4–8.3% and 12.6–14.8% in 2017 and 2018, respectively). The 50% FC irrigation scheduling compared to the 60% FC irrigation scheduling reduced the GWP by approximately 6.5–13.3%, and the 50% FC irrigation scheduling compared to the 70% FC irrigation scheduling had the lowest GWP of 12.5–19.4% in 2017 and 2018, respectively. Irrigation scheduling and irrigation methods had a significant effect on GWP. Moreover, the interaction between irrigation scheduling and irrigation methods only had a significant effect on GWP in 2018.
The effect of the total (T) irrigation amount (IA) on GWP is shown in Figure 11. The relationship between the TIA and GWP can be explained as follows:
G W P 17 = 0.1   T I A 17 + 23.5 ,   R 2 = 0.8 * *   ( Defined   GWP   for   2016 2017 )
G W P 18 = 0.1   T I A 18 + 22.8 ,   R 2 = 0.7 * *   ( Defined   GWP   for   2017 2018 )
A linear correlation was observed between GWP and the TIA applied. GWP increased with higher irrigation depth owing to higher CO2 emissions and lower CH4 uptake. These results indicated that GWP would be minimized by reducing the TIA. Therefore, an optimized irrigation scheduling, along with a suitable irrigation method, is essential to reduce climatic impacts in winter wheat fields.

3.7. GWPI

GWP in terms of the GWPI provides further information to assess the overall GWP. The GWPI ranged from 3.0 ± 0.0 (D2) to 4.1 ± 0.0 (B3) CO2-eq and 3.3 ± 0.1 (D2) to 4.7 ± 0.0 CO2-eq in 2017 and 2018, respectively (Table 6). Compared to sprinkler irrigation and border irrigation methods, drip irrigation had a prominently lower GWPI of 10–12.6% and 18.9–19.4% in 2017 and 2018, respectively. The 60% FC irrigation scheduling, compared to the 50% FC and 70% FC irrigation scheduling treatments, had a 3.1–3.7% and 8.1–9.4% lower GWPI in 2017 and 2018, respectively. GWPI was substantially (p < 0.001) affected by irrigation scheduling and irrigation methods. The interaction between irrigation scheduling and irrigation methods had no significant effect (p > 0.05) on GWPI in 2017 but had a notable (p < 0.05) influence on GWPI in 2018.

3.8. GWPI per Unit IA

GWPIPIA ranged from 1.4 × 10² to 2.9 × 10² CO2-eq mm−1 in 2017 and 7.0 × 10² to 4.4 × 10² CO2-eq mm1 in 2018 (Table 6). In 2018, GWPIPIA was approximately 96.1%, 62.1%, and 48.1% higher at 50%, 60%, and 70% FC irrigation scheduling treatments compared to 2017, respectively. The GWPIPIA in sprinkler irrigation, drip irrigation, and border irrigation methods was approximately 43.1%, 40.6%, and 152.9% higher in 2018, respectively, compared to 2017. Compared to the 60% and 70% FC irrigation scheduling treatments, GWPIPIA at the 50% FC irrigation scheduling was higher by approximately 32.8–60.6% in 2017 and 48.1–96.1% in 2018. In 2017, border irrigation had a lower GWPIPIA of 29.2% and 20.3%, respectively, compared to those of sprinkler and drip irrigation methods. On the contrary, in 2018, border irrigation had a higher GWPIPIA of 25.2% and 43.3% compared to those of sprinkler and drip irrigation, respectively. Variance analysis indicated that irrigation scheduling and irrigation methods significantly influenced the GWPIPIA.

4. Discussion

4.1. Effects of Irrigation Management on CO2 Emissions

4.1.1. Effects of Irrigation Scheduling Levels on CO2 Emissions

Soil CO2 emissions showed distinct seasonal variation throughout the entire study depending on the SWC. Adequate SWC after N fertilization elevates CO2 emission [44]. In the higher irrigation scheduling treatments (70% and 60% FC), the activity of a heterogeneous group of microbes provoked and caused instantaneous organic matter decomposition and higher soil CO2 emissions [45]. Our results are in line with Scheer, et al. [46] from a cotton field in Queensland, Australia, who found that compared to a higher irrigation scheduling (applying total irrigation amount 275 mm) treatment, moderate irrigation scheduling treatment (174 mm) and low irrigation treatment (127 mm) reduced CO2 emissions by 11.3% and 51.3%, respectively. Moreover, Kumar, et al. [38] also measured higher cumulative soil CO2 emissions in the higher irrigation scheduling treatment (total irrigation amount 1452 mm) compared to lower irrigation scheduling treatment (1215 mm) 38.8–39.5% in Eastern India. In this study, CO2 emissions were the sum of microbial soil respiration (heterotrophic) and plant root respiration (autotrophic). Soil CO2 emissions are significantly associated with plant production as root respiration substantially relies on the photosynthetic rate transported from the above-ground portion of the plant [47]. In the present study, higher irrigation scheduling (70% and 60% FC) treatments resulted in substantially higher crop yields and above-ground biomass. Consequently, we assume that irrigation frequency had a considerable effect on soil CO2 emission due to higher crop development that provoked autotrophic root respiration and SWC variation that provoked heterotrophic soil respiration.

4.1.2. Effects of Irrigation Methods on CO2 Emissions

After irrigation events, a soil CO2 emissions increase was observed in all treatments over 2017 and 2018; this observation is supported by the fact that wetting dry soil increases CO2 emission, which ensures a higher soil CO2 rate [48]. Irrigation method effect measurements showed lower CO2 emissions in drip irrigation compared to those of sprinkler and border irrigation methods. The drier surface occurring in drip irrigation compared to those of sprinkler and border irrigation could result in lower CO2 emissions. Moreover, in the border irrigation method, the soil is wet quickly, while the soil is damp in drip irrigation; therefore, soil CO2 emissions are higher in border irrigation. The higher soil CO2 emission in sprinkler irrigation may be linked to the higher plant biomass [49] and higher soil microbial activity than that of drip irrigation [50].
The cumulative CO2 emissions are consistent with those observed by Chen, et al. [51], who found a maximum cumulative CO2 emission of 14.8 t ha−1 in full irrigation treatment (sufficient irrigation water quantity) compared with reduced or deficit irrigation treatment for tomato production in Northwest China.
In this study, cumulative CO2 emission was substantially influenced by irrigation methods. The higher irrigation levels in border irrigation (60 mm) significantly increased the magnitude of CO2 emissions compared to drip irrigation and sprinkler irrigation, where lower levels of irrigation (30 mm) were applied. This study found that both the irrigation scheduling and irrigation methods were the primary factors influencing the magnitude of CO2 emissions. In the NCP, soil CO2 emissions could be substantially mitigated by utilizing water-saving irrigation methods, i.e., drip and sprinkler irrigation [52], in addition to the benefits that result from saving water resources and minimizing NO3 leaching [53].
Under a continuously wet environment, i.e., border irrigation carbon substrate substantially increases in soils [7] and therefore produced higher soil CO2 emissions compared to sprinkler irrigation and drip irrigation. In water, oxygen is slightly soluble and disperses gradually [54]. Under a saturated environment, dissolved oxygen is available in low quantity, which is rapidly exhausted via metabolic activities. Oxygen acts as an electron receiver through respiration by roots and soil microorganisms [55] and is released as CO2 emission. Under flood (border) irrigation treatment impact of SWC on soil microbial population was more clear, possibly due to dominant electron receivers’ deep effect on soil microbial population structure [56].
In China, water-saving irrigation methods made a significant impact on GHG mitigation and reduced CO2 emission by approximately 10.6–12.9 Mt annually and a portion of 21.9–26.6% energy emissions from the agricultural sector [57]. Zou, et al. [58] concluded that in China, water-saving irrigation methods had a positive impact on GHG mitigation, and even higher reductions will be attained by adopting water-saving irrigation methods. Moreover, water-saving irrigation methods compared to traditional practices conserve energy via decreasing the volume of pumping water. In 2020, “National water-saving irrigation planning” reported that about 51 Mhm2 of land would be saved and reduced CO2 emission approximately by 20–25 Mt annually by adopting the water-saving irrigation methods [59]. Zou, et al. [60] estimated the CO2-eq emissions from production and construction of flood irrigation compared to drip irrigation and sprinkler irrigation had 84.5% and 82.2% lowest per unit area emission, respectively. On the contrary, the total CO2-eq emissions from the production and construction of flood irrigation compared to drip and sprinkler irrigation had 186.4% and 130.3% higher due to large irrigated areas, respectively. Even if we consider the CO2-eq emissions from production and operation of water-saving irrigation methods, GHG emissions are proportional to the WUE. Water-saving irrigation methods have a higher WUE; therefore, they are an effective tool to mitigate GHG emissions in irrigated lands.

4.2. Effects of Irrigation Management on CH4 Uptakes

4.2.1. Effect of Irrigation Scheduling Levels on CH4 Uptakes

CH4 emission is the difference between CH4 production (via methanogenesis) and CH4 consumption (via oxidation or methanotrophs); these two actions can take place concurrently within the soil [61]. Soil CH4 and CO2 produced by soil organic matter mineralization under anaerobic conditions via methanogenic fermentation, as explained by the reaction: C 6 H 12 0 6 3 CO 2 + 3 CH 4 . Low sulphate and nitrate concentrations are needed to achieve complete mineralization [62]. SWC is a critical element in CH4 emission/uptake owing to soil diffusivity control by soil moisture.
In this study, the CH4 uptake magnitude was substantially (p < 0.001) influenced by irrigation scheduling. Lower CH4 uptake under a frequent irrigation scheduling (70% FC) compared to an intermediate irrigation scheduling (60% FC) might be linked to variation in soil porosity caused by higher anaerobic microsites in the soil profile. This would increase soil-substrate accessibility for soil micro-organisms and, consequently, increase soil CO2 emissions and decrease methanotrophy [62]. In contrast, the lowest CH4 uptake at the lowest irrigation scheduling (50% FC) caused by prolonged dry periods resulted in lower soil-substrate availability for soil micro-organisms; this would result in lower soil CO2 emissions and methanotrophy. The highest CH4 uptake was observed at an intermediate irrigation scheduling (60% FC), as it provided the optimum environment for soil methanotrophs. Cumulative CH4 uptake was highest at a moderate irrigation scheduling (60% FC), intermediate at the highest irrigation scheduling (70% FC), and lowest at the minimum irrigation scheduling (50% FC). Higher (70% FC) and moderate (60% FC) irrigation scheduling treatments did not have substantially higher CH4 uptake. Compared to the 50% FC irrigation scheduling, 70% FC and 60% FC irrigation scheduling levels had substantially higher CH4 uptake rates.

4.2.2. Effect of Irrigation Methods on CH4 Uptake

Irrigation methods substantially (p < 0.05) influenced CH4 uptake in this study. SWC approaching FC causes higher CH4 uptake [62]; therefore, higher CH4 uptake could be foreseen under drip irrigation owing to the occurrence of more dry areas compared to those resulting from the sprinkler and border irrigation. In sprinkler and border irrigation methods, it is likely that wetter areas decreased the CH4 sink effect. In this study, 30 mm drip irrigation at a moderate irrigation scheduling (60% FC) resulted in higher CH4 uptake. A 60 mm irrigation level using the border irrigation method (except border irrigation at 50% FC in 2018) consumed less CH4 compared to 30 mm drip irrigation. Compared to sprinkler irrigation, drip irrigation had a substantially higher cumulative CH4 uptake (excluding 50% FC in 2018), but drip and border irrigation did not differ significantly.
Different studies have observed the absence of a clear seasonal CH4 uptake pattern [63,64]. Soil acted as a CH4 uptake sink in this study, consistent with previous research [65]. CH4 consumption magnitude ranged from −1.8 ± 0.2 (D3) to −92.2 ± 2.8 (B2) µg CH4 m2 h1 (Figure 8) during the study, in agreement with the CH4 emissions measured in the NCP by Liu, et al. [66]. The cumulative CH4 uptake ranged from −0.4 ± 0.0 to −0.6 ± 0.0 kg ha1, consistent with the cumulative CH4 uptake of −1.8 to −1.0 kg CH4-C ha1 found by Tan, et al. [67] in a cereal cropping system in the NCP. Regardless of whether the soil is a sink or source of CH4, both processes rely on the soil redox settings and dissemination of CH4 from air to soil regulated by the SWC [68]. CH4 uptake was restricted after irrigation events and intense rainfall because the longer soil wetting duration resulted in limited oxygen availability. At both low and high SWC, CH4 oxidation can be restricted by the physiological water stress of methanotrophs or by limiting CH4 diffusion and oxygen transport. Increasing SWC may also reduce CH4 uptake, resulting in an increasingly anaerobic site that results in CH4 emission [69].
In this study, N fertilization, together with irrigation and substantial rainfall occurrence for a short duration, restricted CH4 uptake, as well as observed by Liu, et al. [66], due to the N amendment impeding the methanotrophs [64]. The 300 kg N ha1 applied in this study inhibited CH4 uptake, corroborating the findings proposed by Aronson and Helliker [70], who observed that an N amendment below 100 kg N ha1 yr1 stimulated CH4 uptake, while amendment above 100 kg N ha1 yr1 inhibited CH4 absorption in non-wetland soils. Moreover, the N amendment raises crop water consumption, causing low SWC and a less favourable environment for methanotrophs [66]. Rigler and Zechmeister-Boltenstern [71] have observed that higher NO3- concentrations inhibit CH4 oxidation because NO3 concentration is a sign of higher nitrification rates and osmotic potential [72]. Drip irrigation was a higher CH4 sink compared to sprinkler irrigation and border irrigation and minimized CO2-eq emissions.

4.3. The Regression between Soil Environmental Variables and GHG Emissions

Soil CO2 production and emission rates are regulated by soil temperature, SWC, irrigation management, tillage practices, soil organic matter and nutrients availability, aeration, and microbial activities [73]. In 2018, SWC increased 1.4% to 17.3% compared with 2017 (Figure 2), while CO2 emissions and SWC showed a significant relationship between them in the entire study (Table 4). Our results showed a significant correlation between soil CO2 emissions and SWC only while soil temperature has no substantial effect on CO2 emissions. Similarly, observations were obtained by Li, et al. [6] that SWC significantly (p < 0.05) affected the soil CO2 emissions, while soil temperature has no significant effect on soil CO2 emissions.
Soil temperature is one of the main factors that play an essential role in carbon mineralization. It affects the CO2 emission by disturbing the microorganism and root activity and gas diffusion via soil pores [74]. The temperature had no significant effect on CO2 emission in the entire study. Usually, CO2 emissions have a non-linear positive correlation to rising temperature [74,75] before 30–35 °C, over which the soil respiration rates are restricted [76]. In the current study, the sampling duration was kept mid-morning (0800 to 1100) to regulate the substantial variation in daily temperatures. The average soil temperature was about 17 °C (maximum 22 °C) in two years of study, which is far below the reference temperatures; therefore, the soil temperature has no significant effect on the soil CO2 emissions. Moreover, this research was focused on mid-morning emissions, which restricted the effect of higher temperatures and indicated the mean daily condition [77]. Higher soil CO2 emissions from soils had occurred in a moderate soil moisture environment when the SWC varied between 6% and 17%.
It has been recorded that CH4 oxidation influence slightly by temperature compared with other biological activities such as CO2 production and CH4 production [78]. CH4 oxidation is usually restricted by CH4 diffusion, which is a physical function. CH4 and O2 diffusion into the soil repressed by higher SWC [79]. Low CH4 uptake at high SWC may be due to some CH4 production by methanogens [80]. The optimum range of SWC was 11–17% in this study, beyond which the CH4 uptake decreases. Multiple linear regression analysis shows that from 80% variations in CH4 uptake explained by the SWC. CH4 uptake forms a negative correlation with the SWC in this study is consistent with the Gao, et al. [81] observation that CH4 uptake (p < 0.05) substantially negatively influenced by SWC, and there was no correlation with the soil inorganic N content was measured. Likewise, there was no relationship observed between CH4 consumption with the soil inorganic N (NH4+-N and NO3-N content) in the present study. Moreover, soil temperature had no significant effect on CH4 uptake in this study.

4.4. Global Warming Potential (GWP) Indices

There was a significant difference in all irrigation methods at all irrigation scheduling levels in 2017. In 2018, sprinkler and drip irrigation at 70% FC irrigation scheduling treatments; sprinkler and border irrigation at 60% FC irrigation scheduling treatments; and sprinkler and border irrigation at 50% FC irrigation scheduling treatments had no substantial effect on GWP, as there was no significantly higher cumulative CO2 quantity. In this study, CO2 emissions had a major effect on GWP, while CH4 uptake had a negligible contribution to GWP. These findings indicate that GHG mitigation strategies in the NCP should focus on CO2 emissions.
GWPI explains how much GHG is emitted per unit of grain yield and can be a useful indicator in cropping systems to optimize crop yield and reduce GHG emissions, and provides a useful index for GHG inventories [82]. GWPI increased with increasing irrigation scheduling and was significantly lower in lower irrigation scheduling treatments. Moreover, GWPI was significantly lower in water-saving irrigation methods (drip and sprinkler irrigation) compared to traditional irrigation (border irrigation). GWPI was lowest in drip irrigation at 60% FC (3.0–3.3 CO2-eq in 2017 and 2018, respectively) and highest in border irrigation at 70% FC (4.1–4.7% CO2-eq in 2017 and 2018, respectively) irrigation scheduling level. The 70% FC irrigation scheduling compared to the 60% FC irrigation scheduling had 8.8–10.3% higher (p < 0.05) GWPI and, compared to 50% FC irrigation scheduling, had 5.4–6.2% higher (p < 0.05) GWPI in 2017 and 2018, respectively. Likewise, border irrigation compared to drip irrigation had 23.2–24.1% higher (p < 0.05) and, compared to sprinkler irrigation, had 8.5–10.9% higher GWPI in 2017 and 2018, respectively. Wheat grain yield was substantially affected by irrigation scheduling and irrigation methods, which shows that optimizing irrigation management practices will be cost-effective for farmers and reduce CO2 emissions and increase CH4 consumption simultaneously. These results also show that implementing an appropriate irrigation scheduling is an essential measure to reduce GHG emissions and achieve a higher grain yield. Recommended water-management practices for farmers and irrigation researchers must focus on obtaining higher crop yields while monitoring the possible effect of these practices on the environment. Therefore, water-management practices should meet the following criteria: (i) reduced GWP (lower CO2 emissions and higher CH4 uptake) and (ii) decreased GWPI without decreasing grain yield, leading to optimum use of water resources.
When GWPI was combined with IA, the benefit of 70% and 60% FC irrigation scheduling became increasingly apparent. For example, 60% and 70% FC irrigation scheduling treatments compared to 50% FC irrigation schedule treatments produced a 24.7–37.8% and 32.5–49.0% lower GWPI for each millimetre of IA in 2017 and 2018, respectively. GWPIPIA was highest at the 50% FC irrigation scheduling treatments, moderate at the intermediate irrigation scheduling treatments (60% FC), and lowest at the higher irrigation scheduling treatments (70% FC). GWPIPIA was highest in S1 (2.9 × 10² CO2-eq mm1) treatment in 2017 and B1 (7.1 × 10² CO2-eq mm1) in 2018 treatment, and lowest in B3 (1.4 × 10⁻² CO2-eq mm1) treatment in 2017 and D3 (2.5 × 10² CO2-eq mm1) treatment in 2018. In 2017, border irrigation compared to sprinkler irrigation and drip irrigation had a higher IA level of approximately 50%, 60%, and 67% at 50%, 60%, and 70% FC, respectively, which resulted in a lower GWPIPIA. In 2018, higher rainfall (157 mm) resulted in a lower irrigation amount in border irrigation, which resulted in a higher GWPIPIA. These results illustrated that economic and environmental benefits could be obtained by adopting irrigation scheduling of 60% FC with drip, sprinkler, or border irrigation, which is suitable for reducing GHG emissions and simultaneously producing higher grain yield. Conversely, drip irrigation compared to sprinkler and border irrigation was more effective in terms of higher grain yield and lower GWP, GWPI, and GWPIPIA in this study. Drip or sprinkler irrigation with 3–4 irrigations of 30 mm irrigation dose and border irrigation with 2–4 irrigations of 60 mm irrigation dose (depending upon the seasonal rainfall) are sufficient to attain the higher grain yield and lower GWP emissions.

5. Conclusions

This study found that irrigation scheduling and irrigation methods significantly affected CO2 emission and CH4 uptake in a winter wheat field. Appropriate water management practices have multiple benefits to improve grain yield and WUE and reduce GHG emissions; this study proved that selecting an appropriate irrigation scheduling and irrigation method decreases CO2 emissions and increases CH4 uptake. The significant influence of these factors demonstrates that irrigation management strategies can easily be used to obtain higher grain yield and WUE and reduce GHG emissions. Using drip irrigation at a lower SWC of 60% FC is a feasible choice for the local farmers of the NCP to produce higher winter wheat grain yield and WUE while simultaneously minimizing soil CO2 emission, enhancing CH4 uptake, and lowering both the global warming potential and global warming potential intensity. This study highlights the significance of proper irrigation scheduling and irrigation methods to prevent excessive soil profile wetting. Appropriate irrigation practices should not only decrease GHG emissions but increase grain yield and WUE. Further studies are essential to verify the applicability of these results in different cropping systems. These results provide a basis for the practical application of irrigation scheduling and irrigation methods that reduce GHG emissions and improve yield in various cropping systems.

Author Contributions

Conceptualization, F.M. and G.W.; methodology, F.M., and M.Z.; software, F.M. and S.U.R.; formal analysis, F.M.; investigation, Y.G. and G.W.; resources, Y.G. and Y.L.; data curation, M.Z. and S.U.R.; writing—original draft preparation, F.M.; writing—review and editing, G.W. and A.D.; visualization, A.D. and G.W.; supervision, A.D.; project administration, A.D. and G.W.; funding acquisition, A.D. and G.W. All authors have read and agreed to the published version of the manuscript.

Funding

This research was funded by the Chinese National Natural Science Fund, grant number 51679242 and 51709264, the China Agriculture Research System (CARS-03), and the Central Level, Scientific Research Institutes for Basic R & D Special Fund Business at the Farmland Irrigation Research Institute of Chinese Academy of Agriculture Sciences (FIRI202004-02).

Institutional Review Board Statement

Not applicable.

Informed Consent Statement

Not applicable.

Data Availability Statement

Data supporting reported results can be provided upon request.

Acknowledgments

We are thankful to workers who assisted in extensive fieldwork and provided materials and technical support for conducting field experiments. We are also thankful to the anonymous reviewers and editors for the constructive comments to improve this paper.

Conflicts of Interest

The authors declare no conflict of interest.

References

  1. Smith, P.; Martino, D.; Cai, Z.; Gwary, D.; Janzen, H.; Kumar, P.; McCarl, B.; Ogle, S.; Mara, F.; Rice, C.; et al. Greenhouse gas mitigation in agriculture. Philos. Trans. R. Soc. B Biol. Sci. 2008, 363, 789–813. [Google Scholar] [CrossRef] [Green Version]
  2. Robertson, G.P.; Paul, E.A.; Harwood, R.R. Greenhouse gases in intensive agriculture: Contributions of individual gases to the radiative forcing of the atmosphere. Science 2000, 289, 1922–1925. [Google Scholar] [CrossRef] [Green Version]
  3. IPCC. Climate Change 2013: The Physical Science Basis. Contribution of Working Group I to the Fifth Assessment Report of the Intergovernmental Panel on Climate Change; Stocker, T.F., Qin, D., Plattner, G.K., Tignor, M., Allen, S.K., Boschung, J., Nauels, A., Xia, Y., Bex, V., Midgley, M.P., Eds.; Cambridge University Press: Cambridge, UK; New York, NY, USA, 2013. [Google Scholar]
  4. Peyron, M.; Bertora, C.; Pelissetti, S.; Said-Pullicino, D.; Celi, L.; Miniotti, E.; Romani, M.; Sacco, D. Greenhouse gas emissions as affected by different water management practices in temperate rice paddies. Agric. Ecosyst. Environ. 2016, 232, 17–28. [Google Scholar] [CrossRef]
  5. Ding, T.; Ning, Y.; Zhang, Y. Estimation of greenhouse gas emissions in China 1990–2013. Greenh. Gases Sci. Technol. 2017, 7, 1097–1115. [Google Scholar] [CrossRef]
  6. Li, C.; Xiong, Y.; Huang, Q.; Xu, X.; Huang, G. Impact of irrigation and fertilization regimes on greenhouse gas emissions from soil of mulching cultivated maize (Zea mays L.) field in the upper reaches of Yellow River, China. J. Clean. Prod. 2020, 120873. [Google Scholar] [CrossRef]
  7. Rahman, M.M. Carbon dioxide emission from soil. Agric. Res. 2013, 2, 132–139. [Google Scholar] [CrossRef] [Green Version]
  8. Álvaro-Fuentes, J.; Arrúe, J.L.; Cantero-Martínez, C.; Isla, R.; Plaza-Bonilla, D.; Quílez, D. Fertilization scenarios in sprinkler-irrigated corn under Mediterranean conditions: Effects on greenhouse gas emissions. Soil Sci. Soc. Am. J. 2016, 80, 662–671. [Google Scholar] [CrossRef] [Green Version]
  9. Oertel, C.; Matschullat, J.; Zurba, K.; Zimmermann, F.; Erasmi, S. Greenhouse gas emissions from soils—A review. Chem. Der Erde Geochem. 2016, 76, 327–352. [Google Scholar] [CrossRef] [Green Version]
  10. Sainju, U.M.; Stevens, W.B.; Caesar-Tonthat, T.; Liebig, M.A. Soil greenhouse gas emissions affected by irrigation, tillage, crop rotation, and nitrogen fertilization. J. Environ. Qual. 2012, 41, 1774–1786. [Google Scholar] [CrossRef] [PubMed] [Green Version]
  11. Zhou, X.; Zhou, L.; Nie, Y.; Fu, Y.; Du, Z.; Shao, J.; Zheng, Z.; Wang, X. Similar responses of soil carbon storage to drought and irrigation in terrestrial ecosystems but with contrasting mechanisms: A meta-analysis. Agric. Ecosyst. Environ. 2016, 228, 70–81. [Google Scholar] [CrossRef]
  12. Zornoza, R.; Rosales, R.; Acosta, J.A.; de la Rosa, J.M.; Arcenegui, V.; Faz, Á.; Pérez-Pastor, A. Efficient irrigation management can contribute to reduce soil CO2 emissions in agriculture. Geoderma 2016, 263, 70–77. [Google Scholar] [CrossRef]
  13. Bowles, T.M.; Barrios-Masias, F.H.; Carlisle, E.A.; Cavagnaro, T.R.; Jackson, L.E. Effects of arbuscular mycorrhizae on tomato yield, nutrient uptake, water relations, and soil carbon dynamics under deficit irrigation in field conditions. Sci. Total Environ. 2016, 566, 1223–1234. [Google Scholar] [CrossRef] [Green Version]
  14. Abalos, D.; Sanchez-Martin, L.; Garcia-Torres, L.; van Groenigen, J.W.; Vallejo, A. Management of irrigation frequency and nitrogen fertilization to mitigate GHG and NO emissions from drip-fertigated crops. Sci. Total Environ. 2014, 490, 880–888. [Google Scholar] [CrossRef] [PubMed] [Green Version]
  15. Zornoza, R.; Acosta, J.A.; Gabarrón, M.; Gómez-Garrido, M.; Sánchez-Navarro, V.; Terrero, A.; Martínez-Martínez, S.; Faz, Á.; Pérez-Pastor, A. Greenhouse gas emissions and soil organic matter dynamics in woody crop orchards with different irrigation regimes. Sci. Total Environ. 2018, 644, 1429–1438. [Google Scholar] [CrossRef]
  16. Wu, J.; Guo, W.; Feng, J.; Li, L.; Yang, H.; Wang, X.; Bian, X. Greenhouse gas emissions from cotton field under different irrigation methods and fertilization regimes in arid Northwestern China. Sci. World J. 2014, 2014. [Google Scholar] [CrossRef]
  17. Franco-Luesma, S.; Álvaro-Fuentes, J.; Plaza-Bonilla, D.; Arrúe, J.L.; Cantero-Martínez, C.; Cavero, J. Influence of irrigation time and frequency on greenhouse gas emissions in a solid-set sprinkler-irrigated maize under Mediterranean conditions. Agric. Water Manag. 2019, 221, 303–311. [Google Scholar] [CrossRef]
  18. NBSC. China Statistics Yearbook 2014; China Statistics Press: Beijing, China, 2015. [Google Scholar]
  19. Li, J.; Dong, W.; Oenema, O.; Chen, T.; Hu, C.; Yuan, H.; Zhao, L. Irrigation reduces the negative effect of global warming on winter wheat yield and greenhouse gas intensity. Sci. Total Environ. 2019, 646, 290–299. [Google Scholar] [CrossRef] [PubMed]
  20. Hou, H.; Yang, Y.; Han, Z.; Cai, H.; Li, Z. Deficit irrigation effectively reduces soil carbon dioxide emissions from wheat fields in Northwest China. J. Sci. Food Agric. 2019, 99, 5401–5408. [Google Scholar] [CrossRef]
  21. Wang, G.; Liang, Y.; Zhang, Q.; Jha, S.K.; Gao, Y.; Shen, X.; Sun, J.; Duan, A. Mitigated CH4 and N2O emissions and improved irrigation water use efficiency in winter wheat field with surface drip irrigation in the North China Plain. Agric. Water Manag. 2016, 163, 403–407. [Google Scholar] [CrossRef]
  22. Guo, S.; Qi, Y.; Peng, Q.; Dong, Y.; He, Y.; Yan, Z.; Wang, L. Influences of drip and flood irrigation on soil carbon dioxide emission and soil carbon sequestration of maize cropland in the North China Plain. J. Arid Land 2017, 9, 222–233. [Google Scholar] [CrossRef] [Green Version]
  23. Li, J.; Inanaga, S.; Li, Z.; Eneji, A.E. Optimizing irrigation scheduling for winter wheat in the North China Plain. Agric. Water Manag. 2005, 76, 8–23. [Google Scholar] [CrossRef]
  24. Wang, J.; Gong, S.; Xu, D.; Yu, Y.; Zhao, Y. Impact of drip and level-basin irrigation on growth and yield of winter wheat in the North China Plain. Irrig. Sci. 2012, 31, 1025–1037. [Google Scholar] [CrossRef]
  25. Gao, Y.; Yang, L.; Shen, X.; Li, X.; Sun, J.; Duan, A.; Wu, L. Winter wheat with subsurface drip irrigation (SDI): Crop coefficients, water-use estimates, and effects of SDI on grain yield and water use efficiency. Agric. Water Manag. 2014, 146, 1–10. [Google Scholar] [CrossRef]
  26. Saxton, K.; Rawls, W.J.; Romberger, J.S.; Papendick, R. Estimating generalized soil-water characteristics from texture. Soil Sci. Soc. Am. J. 1986, 50, 1031. [Google Scholar] [CrossRef]
  27. Mehmood, F.; Wang, G.; Gao, Y.; Liang, Y.; Chen, J.; Si, Z.; Ramatshaba, T.S.; Zain, M.; Duan, A. Nitrous oxide emission from winter wheat field as responded to irrigation scheduling and irrigation methods in the North China Plain. Agric. Water Manag. 2019, 222, 367–374. [Google Scholar] [CrossRef]
  28. Li, Q.; Dong, B.; Qiao, Y.; Liu, M.; Zhang, J. Root growth, available soil water, and water-use efficiency of winter wheat under different irrigation regimes applied at different growth stages in North China. Agric. Water Manag. 2010, 97, 1676–1682. [Google Scholar] [CrossRef]
  29. Jha, S.K.; Gao, Y.; Liu, H.; Huang, Z.; Wang, G.; Liang, Y.; Duan, A. Root development and water uptake in winter wheat under different irrigation methods and scheduling for North China. Agric. Water Manag. 2017, 182, 139–150. [Google Scholar] [CrossRef]
  30. Zhao, J.; Yun-She, D.; Yu-Chun, Q.; Domroes, M. Precipitation pulses and soil CO2 emission in desert shrubland of Artemisia ordosica on the Ordos Plateau of Inner Mongolia, China. Pedosphere 2009, 19, 799–807. [Google Scholar] [CrossRef]
  31. Shi, Y.; Wu, W.; Meng, F.; Zhang, Z.; Zheng, L.; Wang, D. Integrated management practices significantly affect N2O emissions and wheat-maize production at field scale in the North China Plain. Nutr. Cycl. Agroecosyst. 2013, 95, 203–218. [Google Scholar] [CrossRef]
  32. Baker, J.; Doyle, G.; McCarty, G.; Mosier, A.; Parkin, T.; Reicosky, D.; Smith, J.; Venterea, R. Chamber-Based Trace Gas Flux Measurement Protocol; United States Department of Agriculture: Washington, DC, USA, 2003. [Google Scholar]
  33. Zou, J.; Huang, Y.; Jiang, J.; Zheng, X.; Sass, R.L. A 3-year field measurement of methane and nitrous oxide emissions from rice paddies in China: Effects of water regime, crop residue, and fertilizer application. Glob. Biogeochem. Cycles 2005, 19. [Google Scholar] [CrossRef]
  34. Song, C.; Yan, B.; Wang, Y.; Wang, Y.; Lou, Y.; Zhao, Z. Fluxes of carbon dioxide and methane from swamp and impact factors in Sanjiang Plain, China. Chin. Sci. Bull. 2003, 48, 2749–2753. [Google Scholar] [CrossRef]
  35. Li, C.; Zhang, Z.; Guo, L.; Cai, M.; Cao, C. Emissions of CH4 and CO2 from double rice cropping systems under varying tillage and seeding methods. Atmos Environ. 2013, 80, 438–444. [Google Scholar] [CrossRef]
  36. Hillel, D. Environmental Soil Physics: Fundamentals, Applications, and Environmental Considerations; Elsevier: Amsterdam, The Netherlands, 1998. [Google Scholar]
  37. Sun, H.Y.; Liu, C.M.; Zhang, X.Y.; Shen, Y.J.; Zhang, Y.Q. Effects of irrigation on water balance, yield and WUE of winter wheat in the North China Plain. Agric. Water Manag. 2006, 85, 211–218. [Google Scholar] [CrossRef]
  38. Kumar, A.; Nayak, A.K.; Mohanty, S.; Das, B.S. Greenhouse gas emission from direct seeded paddy fields under different soil water potentials in Eastern India. Agric. Ecosyst. Environ. 2016, 228, 111–123. [Google Scholar] [CrossRef]
  39. Shang, Q.; Yang, X.; Gao, C.; Wu, P.; Liu, J.; Xu, Y.; Shen, Q.; Zou, J.; Guo, S. Net annual global warming potential and greenhouse gas intensity in Chinese double rice-cropping systems: A 3-year field measurement in long-term fertilizer experiments. Glob. Chang. Biol. 2011, 17, 2196–2210. [Google Scholar] [CrossRef]
  40. Fang, Q. Effect of irrigation on water use efficiency of winter wheat. Trans. CSAE 2004, 20, 34–39. [Google Scholar]
  41. Hu, T.; Kang, S.; Li, F.; Zhang, J. Effects of partial root-zone irrigation on the nitrogen absorption and utilization of maize. Agric. Water Manag. 2009, 96, 208–214. [Google Scholar] [CrossRef]
  42. Halverson, L.J.; Jones, T.M.; Firestone, M.K. Release of intracellular solutes by four soil bacteria exposed to dilution stress. Soil Sci. Soc. Am. J. 2000, 64, 1630–1637. [Google Scholar] [CrossRef]
  43. Fierer, N.; Schimel, J.P. A proposed mechanism for the pulse in carbon dioxide production commonly observed following the rapid rewetting of a dry soil. Soil Sci. Soc. Am. J. 2003, 67, 798–805. [Google Scholar] [CrossRef]
  44. Sainju, U.; Jabro, J.; Stevens, W. Soil carbon dioxide emission as influenced by irrigation, tillage, cropping system, and nitrogen fertilization. J. Environ. Qual. 2008, 37, 98–106. [Google Scholar] [CrossRef] [Green Version]
  45. Buyanovsky, G.; Wagner, G. Annual cycles of carbon dioxide level in soil air. Soil Sci. Soc. Am. J. 1983, 47, 1139–1145. [Google Scholar] [CrossRef]
  46. Scheer, C.; Grace, P.R.; Rowlings, D.W.; Payero, J. Soil N2O and CO2 emissions from cotton in Australia under varying irrigation management. Nutr. Cycl. Agroecosystems 2013, 95, 43–56. [Google Scholar] [CrossRef] [Green Version]
  47. Han, G.; Zhou, G.; Xu, Z.; Yang, Y.; Liu, J.; Shi, K. Biotic and abiotic factors controlling the spatial and temporal variation of soil respiration in an agricultural ecosystem. Soil Biol. Biochem. 2007, 39, 418–425. [Google Scholar] [CrossRef]
  48. Orchard, V.A.; Cook, F. Relationship between soil respiration and soil moisture. Soil Biol. Biochem. 1983, 15, 447–453. [Google Scholar] [CrossRef]
  49. Bai, W.-M.; Li, L.-H. Effect of irrigation methods and quota on root water uptake and biomass of alfalfa in the Wulanbuhe sandy region of China. Agric. Water Manag. 2003, 62, 139–148. [Google Scholar] [CrossRef]
  50. Entry, J.A.; Mills, D.; Mathee, K.; Jayachandran, K.; Sojka, R.E.; Narasimhan, G. Influence of irrigated agriculture on soil microbial diversity. Appl. Soil Ecol. 2008, 40, 146–154. [Google Scholar] [CrossRef]
  51. Chen, H.; Hou, H.J.; Wang, X.Y.; Zhu, Y.; Saddique, Q.; Wang, Y.F.; Cai, H. The effects of aeration and irrigation regimes on soil CO2 and N2O emissions in a greenhouse tomato production system. J. Integr. Agric. 2018, 17, 449–460. [Google Scholar] [CrossRef]
  52. Zhang, W.F.; Dou, Z.X.; He, P.; Ju, X.T.; Powlson, D.; Chadwick, D.; Norse, D.; Lu, Y.L.; Zhang, Y.; Wu, L.; et al. New technologies reduce greenhouse gas emissions from nitrogenous fertilizer in China. Proc. Natl. Acad. Sci. USA 2013, 110, 8375–8380. [Google Scholar] [CrossRef] [Green Version]
  53. Zhu, J.; Li, X.; Christie, P.; Li, J. Environmental implications of low nitrogen use efficiency in excessively fertilized hot pepper (Capsicum frutescens L.) cropping systems. Agric. Ecosyst. Environ. 2005, 111, 70–80. [Google Scholar] [CrossRef] [Green Version]
  54. Schlesinger, W.H.; Bernhardt, E.S. Biogeochemistry: An Analysis of Global Change; Academic Press: Cambridge, MA, USA, 2013. [Google Scholar]
  55. Sylvia, D.M.; Fuhrmann, J.J.; Hartel, P.G.; Zuberer, D.A. Principles and Applications of Soil Microbiology; Pearson: London, UK, 2005. [Google Scholar]
  56. Sylvia, D.; Fuhrmann, J.; Hartel, P.; Zuberer, D. Habitat and organisms. Princ. Appl. Soil Microbiol. Prentice Hall Up. Saddle River N. J. 1999, 72–92. [Google Scholar]
  57. NDRCC (National Development and Reform Commission of China). The People’s Republic of China: Initial National Communication on Climate Change; China Planning Press: Beijng, China, 2004. [Google Scholar]
  58. Zou, X.; Li, Y.-E.; Gao, Q.; Wan, Y. How water saving irrigation contributes to climate change resilience-a case study of practices in China. Mitig. Adapt. Strateg. Glob. Chang. 2012, 17, 111–132. [Google Scholar] [CrossRef] [Green Version]
  59. MWRC (The Ministry of Water Resources of China). National Water-Saving Irrigation Planning; The Ministry of Water Resources of China: Beijing, China, 2006.
  60. Zou, X.; Li, K.; Cremades, R.; Gao, Q.; Wan, Y.; Qin, X. Greenhouse gas emissions from agricultural irrigation in China. Mitig. Adapt. Strateg. Glob. Chang. 2015, 20, 295–315. [Google Scholar] [CrossRef] [Green Version]
  61. Conrad, R. Soil microbial processes and the cycling of atmospheric trace gases. Phil. Trans. R. Soc. Lond. A 1995, 351, 219–230. [Google Scholar]
  62. Le Mer, J.; Roger, P. Production, oxidation, emission and consumption of methane by soils: A review. Eur. J. Soil Biol. 2001, 37, 25–50. [Google Scholar] [CrossRef]
  63. Jonsson, L.M.; Dighton, J.; Lussenhop, J.; Koide, R.T. The effect of mixing ground leaf litters to soil on the development of pitch pine ectomycorrhizal and soil arthropod communities in natural soil microcosm systems. Soil Biol. Biochem. 2006, 38, 134–144. [Google Scholar] [CrossRef]
  64. Jang, I.; Lee, S.; Zoh, K.D.; Kang, H. Methane concentrations and methanotrophic community structure influence the response of soil methane oxidation to nitrogen content in a temperate forest. Soil Biol. Biochem. 2011, 43, 620–627. [Google Scholar] [CrossRef]
  65. Pareja-Sánchez, E.; Cantero-Martínez, C.; Álvaro-Fuentes, J.; Plaza-Bonilla, D. Tillage and nitrogen fertilization in irrigated maize: Key practices to reduce soil CO2 and CH4 emissions. Soil Tillage Res. 2019, 191, 29–36. [Google Scholar] [CrossRef]
  66. Liu, L.; Hu, C.; Yang, P.; Ju, Z.; Olesen, J.E.; Tang, J. Effects of experimental warming and nitrogen addition on soil respiration and CH4 fluxes from crop rotations of winter wheat-soybean/fallow. Agric. For. Meteorol. 2015, 207, 38–47. [Google Scholar] [CrossRef]
  67. Tan, Y.; Xu, C.; Liu, D.; Wu, W.; Lal, R.; Meng, F. Effects of optimized N fertilization on greenhouse gas emission and crop production in the North China Plain. Field Crop. Res. 2017, 205, 135–146. [Google Scholar] [CrossRef]
  68. Shrestha, B.; Sitaula, B.; Singh, B.; Bajracharya, R. Fluxes of CO2 and CH4 in soil profiles of a mountainous watershed of Nepal as influenced by land use, temperature, moisture and substrate addition. Nutr. Cycl. Agroecosyst. 2004, 68, 155–164. [Google Scholar] [CrossRef]
  69. Yavitt, J.; Fahey, T.; Simmons, J. Methane and carbon dioxide dynamics in a northern hardwood ecosystem. Soil Sci. Soc. Am. J. 1995, 59, 796–804. [Google Scholar] [CrossRef]
  70. Aronson, E.; Helliker, B. Methane flux in non-wetland soils in response to nitrogen addition: A meta-analysis. Ecology 2010, 91, 3242–3251. [Google Scholar] [CrossRef] [PubMed]
  71. Rigler, E.; Zechmeister-Boltenstern, S. Oxidation of ethylene and methane in forest soils—effect of CO2 and mineral nitrogen. Geoderma 1999, 90, 147–159. [Google Scholar] [CrossRef]
  72. Meijide, A.; Cárdenas, L.M.; Sánchez-Martín, L.; Vallejo, A. Carbon dioxide and methane fluxes from a barley field amended with organic fertilizers under Mediterranean climatic conditions. Plant Soil 2010, 328, 353–367. [Google Scholar] [CrossRef]
  73. Mielnick, P.; Dugas, W.A. Soil CO2 flux in a tallgrass prairie. Soil Biol. Biochem. 2000, 32, 221–228. [Google Scholar] [CrossRef]
  74. Smith, K.A.; Ball, T.; Conen, F.; Dobbie, K.E.; Massheder, J.; Rey, A. Exchange of greenhouse gases between soil and atmosphere: Interactions of soil physical factors and biological processes. Eur. J. Soil Sci. 2003, 54, 779–791. [Google Scholar] [CrossRef] [Green Version]
  75. Schaufler, G.; Kitzler, B.; Schindlbacher, A.; Skiba, U.; Sutton, M.; Zechmeister-Boltenstern, S. Greenhouse gas emissions from European soils under different land use: Effects of soil moisture and temperature. Eur. J. Soil Sci. 2010, 61, 683–696. [Google Scholar] [CrossRef]
  76. Lee, J.; Hopmans, J.W.; van Kessel, C.; King, A.P.; Evatt, K.J.; Louie, D.; Rolston, D.E.; Six, J. Tillage and seasonal emissions of CO2, N2O and NO across a seed bed and at the field scale in a Mediterranean climate. Agric. Ecosyst. Environ. 2009, 129, 378–390. [Google Scholar] [CrossRef]
  77. Mosier, A.; Wassmann, R.; Verchot, L.; King, J.; Palm, C. Methane and nitrogen oxide fluxes in tropical agricultural soils: Sources, sinks and mechanisms. Environ. Dev. Sustain. 2004, 6, 11–49. [Google Scholar] [CrossRef]
  78. Dunfield, P.; Dumont, R.; Moore, T.R. Methane production and consumption in temperate and subarctic peat soils: Response to temperature and pH. Soil Biol. Biochem. 1993, 25, 321–326. [Google Scholar] [CrossRef]
  79. Dunfield, P.F. The Soil Methane Sink. Greenh. Gas Sink. 2007, 152. [Google Scholar]
  80. Van den Pol-van Dasselaar, A.; Corre, W.; Prieme, A.; Klemedtsson, Å.; Weslien, P.; Klemedtsson, L.; Stein, A.; Oenema, O. Spatial variability of methane, nitrous oxide, and carbon dioxide emissions from drained grasslands. Soil Sci. Soc. Am. J. 1998, 62, 810–817. [Google Scholar] [CrossRef]
  81. Gao, B.; Ju, X.; Su, F.; Meng, Q.; Oenema, O.; Christie, P.; Chen, X.; Zhang, F. Nitrous oxide and methane emissions from optimized and alternative cereal cropping systems on the North China Plain: A two-year field study. Sci. Total Environ. 2014, 472, 112–124. [Google Scholar] [CrossRef] [PubMed]
  82. Venterea, R.T.; Bijesh, M.; Dolan, M.S. Fertilizer source and tillage effects on yield-scaled nitrous oxide emissions in a corn cropping system. J. Environ. Qual. 2011, 40, 1521–1531. [Google Scholar] [CrossRef] [Green Version]
Figure 1. The daily mean air temperature (°C) and rainfall (mm) from the first irrigation to harvest in the 2016–2017 and 2017–2018 winter wheat growing seasons.
Water 13 02052 g001
Figure 2. Soil water content (SWC) in (a) 50% FC, (b) 60% FC, and (c) 70% FC irrigation scheduling during 2016–2017 and in (d) 50% FC, (e) 60% FC, and (f) 70% FC irrigation scheduling in the top 0–20 cm during 2017–2018 growing season in all treatments. Note: S1, S2, and S3 represents sprinkler irrigation at 50%, 60%, and 70% FC, respectively. D1, D2, and D3 represent drip irrigation at 50%, 60%, and 70% FC, respectively. B1, B2, and B3 represent border irrigation at 50%, 60%, and 70% FC, respectively. Error bars represent standard errors of three replicates. P represents rainfall. Error bars represent standard errors of three replicates. Square, circular, and triangular arrows denote irrigation dates of sprinkler, drip, and border irrigation, respectively. The solid arrow indicates the day of fertilization.
Water 13 02052 g002
Figure 3. Soil temperature (°C) in (a) 50% FC, (b) 60% FC, and (c) 70% FC irrigation scheduling during 2016–2017 and in (d) 50% FC, (e) 60% FC, and (f) 70% FC irrigation scheduling during 2017–2018 growing season at 10 cm soil layer in all treatments. Note: S1, S2, and S3 represent sprinkler irrigation at 50%, 60%, and 70% FC, respectively. D1, D2, and D3 represent drip irrigation at 50%, 60%, and 70% FC, respectively. B1, B2, and B3 represent border irrigation at 50%, 60%, and 70% FC, respectively. Error bars represent standard errors of three replicates. The solid arrow indicates the day of fertilization.
Water 13 02052 g003
Figure 4. Soil ammonium nitrogen content (mg kg1) in (a) 50% FC, (b) 60% FC, and (c) 70% FC irrigation scheduling during 2016–2017 and in (d) 50% FC, (e) 60% FC, and (f) 70% FC irrigation scheduling during 2017–2018 growing season at top 0–20 cm soil layer in all treatments. Note: S1, S2, and S3 represent sprinkler irrigation at 50%, 60%, and 70% FC, respectively. D1, D2, and D3 represent drip irrigation at 50%, 60%, and 70% FC, respectively. B1, B2, and B3 represent border irrigation at 50%, 60%, and 70% FC, respectively. Error bars represent standard errors of three replicates. The solid arrow indicates the day of fertilization.
Water 13 02052 g004
Figure 5. Soil nitrate nitrogen content (mg kg1) in (a) 50% FC, (b) 60% FC, and (c) 70% FC irrigation scheduling during 2016–2017 and in (d) 50% FC, (e) 60% FC, and (f) 70% FC irrigation scheduling during 2017–2018 growing season at top 0–20 cm soil layer in all treatments. Note: S1, S2, and S3 represents sprinkler irrigation at 50%, 60%, and 70% FC, respectively. D1, D2, and D3 represents drip irrigation at 50%, 60%, and 70% FC, respectively. B1, B2, and B3 represents border irrigation at 50%, 60%, and 70% FC, respectively. Error bars represents standard errors of three replicates. The solid arrow indicates the day of fertilization.
Water 13 02052 g005
Figure 6. The seasonal CO2 emission flux (mg CO2 m−2 h−1) in (a) 50% FC, (b) 60% FC, and (c) 70% FC irrigation scheduling during 2016–2017 and in (d) 50% FC, (e) 60% FC, and (f) 70% FC irrigation scheduling during 2017–2018 growing season in all treatments. Note: S1, S2, and S3 represent sprinkler irrigation at 50%, 60%, and 70% FC, respectively. D1, D2, and D3 represent drip irrigation at 50%, 60%, and 70% FC, respectively. B1, B2, and B3 represent border irrigation at 50%, 60%, and 70% FC, respectively. P represents rainfall. Error bars represent standard errors of three replicates. Square, circular, and triangular arrows denote irrigation dates of sprinkler, drip, and border irrigation, respectively. The solid arrow indicates the day of fertilization.
Water 13 02052 g006
Figure 7. The cumulative CO2 amount (t ha1) in all treatments for 2016–2017 and 2017–2018 winter wheat growing seasons. Note: S1, S2, and S3 represent sprinkler irrigation at 50%, 60%, and 70% FC, respectively. D1, D2, and D3 represent drip irrigation at 50%, 60%, and 70% FC, respectively. B1, B2, and B3 represent border irrigation at 50%, 60%, and 70% FC, respectively. Error bars represent standard errors of three replicates.
Water 13 02052 g007
Figure 8. Seasonal CH4 uptake flux (µg CH4 m−2 h−1) in (a) 50% FC, (b) 60% FC, and (c) 70% FC irrigation scheduling during 2016–2017 and in (d) 50% FC, (e) 60% FC, and (f) 70% FC irrigation scheduling during the 2017–2018 growing season in all treatments. Note: S1, S2, and S3 represent sprinkler irrigation at 50%, 60%, and 70% FC, respectively. D1 D2, and D3 represent drip irrigation at 50%, 60%, and 70% FC, respectively. B1, B2, and B3 represent border irrigation at 50%, 60%, and 70% FC, respectively. P represents rainfall. Error bars represent standard errors of three replicates. Square, circular, and triangular arrows denote irrigation dates of sprinkler, drip, and border irrigation, respectively. The solid arrow indicates the day of fertilization.
Water 13 02052 g008
Figure 9. The cumulative CH4 amount (kg ha1) for the 2016–2017 and 2017–2018 winter wheat growing seasons in all treatments. Error bars represent standard errors of three replicates. Different letters show significant differences (p < 0.05) between treatments.
Water 13 02052 g009
Figure 10. The water use efficiency (WUE) for the 2016–2017 and 2017–2018 winter wheat growing seasons in all treatments. Error bars represent standard errors of three replicates. Different letters show significant differences (p < 0.05) between treatments.
Water 13 02052 g010
Figure 11. The relationship between global warming potential GWP (Mg CO2-eq ha−1) and the total irrigation amount (mm) for the 2016–2017 and 2017–2018 winter wheat seasons.
Water 13 02052 g011
Table 1. Soil texture, physical properties, and hydraulic parameters of the experimental site.
Soil Depth (cm)Particle
Size Distribution
Soil
Texture
Bulk Density (g/cm3)Field Capacity (%)Permanent Wilting Point (%)Saturation Capacity (%)Saturated Hydraulic Conductivity (cm/day)
Clay (%)Silt (%)Sand (%)
0–203.843.153.1Sandy Loam1.632.29.736.8119.0
20–406.645.448.0Loam1.630.610.240.293.6
40–606.148.345.6Sandy Loam1.531.413.039.997.7
60–804.647.448.0Sandy Loam1.428.89.638.1110.0
80–1001.616.981.5Loamy Sand1.529.84.729.8228.2
Average4.540.355.2Sandy Loam1.530.69.536.9129.7
Table 2. Soil chemical properties of the experimental site.
Soil
Depth (cm)
pHEC
(µs cm−1)
Available N
(mg kg−1)
Available P
(mg kg−1)
Available K
(mg kg−1)
Organic
Carbon
(g kg−1)
0–208.5132.444.616.1128.81.9
20–408.6140.344.615.0126.21.6
40–608.7146.342.714.4128.31.0
60–808.8155.641.814.2124.10.7
80–1008.9147.641.815.3122.10.5
Average8.7144.443.115.0126.01.1
Table 3. The irrigation scheduling date and total irrigation amount during the 2016–2017 and 2017–2018 growing wheat seasons for all treatments.
20172018
TreatmentsDate
(Julian Day)
Total Irrigation Amount
(mm)
Date
(Julian Day)
Total Irrigation Amount
(mm)
S198, 104, 126, 13812093, 104, 12990
S298, 104, 117, 131, 13815093, 104,115, 129120
S398, 104, 117, 126, 131, 13818093, 104, 115, 122, 129150
D198, 104, 131, 13812093, 104, 12990
D298, 104, 117, 131, 13815093, 104, 122, 129120
D398, 104, 117, 126, 131, 13818093, 104, 115, 122, 129150
B198, 126, 13818010460
B298, 104, 117, 131240104, 122120
B398, 104, 117, 126, 131300104, 115, 129180
Table 4. Analysis of variance (ANOVA) of soil water content (SWC %), soil temperature (°C), soil ammonium nitrogen (mg kg−1) and nitrate nitrogen content (mg kg−1), cumulative soil CO2 emission, and soil CH4 uptake as affected by different irrigation scheduling, irrigation methods, and their interactions during the 2016–2017 and 2017–2018 growing seasons.
VariablesSWC TemperatureNH4+-NNO3-NCumulative CO2 Emission Cumulative CH4 Uptake
(%)(°C)(mg kg−1)(mg kg1)(kg ha1)(kg ha1)
201720182017201820172018201720182017201820172018
Irrigation scheduling***********************************
Irrigation methods***********************ns*
Irrigation scheduling × Irrigation methods*********ns******ns***nsns
Note: The mean soil water content (SWC %) for soil layers of 0–20 cm, soil temperature (°C) at 10 cm soil depth, and mean soil inorganic N pools (NH4+-N and NO3-N) for 0–20 cm. Where Significant level ns p > 0.05, * p < 0.05, ** p < 0.01, *** p < 0.001.
Table 5. Multiple linear regression models for CO2 emissions and CH4 uptake.
Treatment aRegression Equation (p < 0.05) bStandardized
Estimation Regression Coefficient c (p < 0.05)
Number
of Observations d
Adjusted R2
TWAN
CO2FCO2 = −482.8 + 13.7Wns0.7 **nsns1170.8
CH4FCH4 = 167.13 − 1.78W ns−0.8 ***nsns1170.7
Error bars represent standard errors of three replicates. Different letters show significant differences (p < 0.05) between treatments. Units for CO2 emissions are mg CO2 m−2 d−1; CH4 emissions are μg CH4 m−2 d−1; for temperature (T), soil water content (W), NH4-N+ (A), and NO3 -N (N) are °C, SWC (%), and mg N kg−1, respectively. a Treatment data used for multiple linear regression. b Values are mean for all treatments in both growing seasons. c ns, not significant at p < 0.05, ** p < 0.01, *** p < 0.001. d each observation is the mean of three replicates in each treatment.
Table 6. Grain yield, global warming potential (GWP), GWP Intensity (I), and GWPI per unit irrigation amount (GWPIPIA) during the 2016–2017 and 2017–2018 growing seasons in all treatments.
Grain Yield
(t ha−1)
GWP
(Mg CO2-eq ha−1)
GWPI
(CO2-eq)
GWPIPIA
(CO2-eq mm−1)
Treatments20172018201720182017201820172018
S18.6 ± 0.0 e7.9 ± 0.0 g29.4 ± 0.4 d31.7 ± 0.6 cd3.4 ± 0.1 d4.0 ± 0.1 c2.9 × 102 a4.4 × 102 b
S29.2 ± 0.0 c9.0 ± 0.0 cd31.7 ± 0.1 c35.3 ± 0.1 b3.5 ± 0.0 d3.9 ± 0.1 c2.3 × 102 c3.3 × 102 d
S39.1 ± 0.0 c8.9 ± 0.0 de33.0 ± 0.5 b35.4 ± 0.0 b3.6 ± 0.1 c4.0 ± 0.0 c2.0 × 102 e2.6 × 102 d
D18.5 ± 0.0 e8.2 ± 0.4 f26.5 ± 0.4 e27.6 ± 0.5 e3.1 ± 0.1 f3.4 ± 0.1 e2.6 × 102 b3.7 × 102 c
D29.7 ± 0.0 a9.7 ± 0.3 a29.4 ± 0.4 d32.1 ± 0.9 c3.0 ± 0.0 f3.3 ± 0.1 e2.0 × 102 e2.8 × 102 d
D39.4 ± 0.1 b9.3 ± 0.2 b31.2 ± 0.3 c34.2 ± 0.3 b3.3 ± 0.0 e3.7 ± 0.0 d1.8 × 102 f2.5 × 102 e
B18.3 ± 0.0 f7.1 ± 0.1 h32.3 ± 0.5 bc30.2 ± 0.4 d3.9 ± 0.1 b4.2 ± 0.1 b2.2 × 102 d7.1 × 102 a
B29.1 ± 0.0 c9.1 ± 0.0 c33.3 ± 0.2 b35.7 ± 0.4 b3.7 ± 0.0 c3.9 ± 0.1 c1.5 × 102 g 3.3 × 10² d
B38.9 ± 0.0 d8.8 ± 0.0 e36.6 ± 0.3 a41.5 ± 0.2 a4.1 ± 0.0 a4.7 ± 0.0 a1.4 × 102 h2.6 × 102 d
Irrigation scheduling************************
Irrigation methods************************
Irrigation scheduling × Irrigation methods******ns**ns**ns***
where Significant level ns p > 0.05, ** p < 0.01, *** p < 0.001. Values are the means ± standard error of the mean (n = 3). Different letters within a date indicate significant differences (p < 0.05) between treatments.
Publisher’s Note: MDPI stays neutral with regard to jurisdictional claims in published maps and institutional affiliations.

