Article

Automated Targeted Sampling of Waterborne Pathogens and Microbial Source Tracking Markers Using Near-Real Time Monitoring of Microbiological Water Quality

1
Canada Research Chair in Source Water Protection, Department of Civil, Geological and Mining Engineering, Polytechnique Montreal, Montreal, QC H3C 3A7, Canada
2
NSERC Industrial Chair on Drinking Water, Department of Civil, Geological and Mining Engineering, Polytechnique Montreal, Montreal, QC H3C 3A7, Canada
3
School of Environmental Sciences, University of Guelph, Guelph, ON N1G 2W1, Canada
4
Écologie des Systèmes Aquatiques, Campus de la Plaine, Université Libre de Bruxelles, B-1050 Bruxelles, Belgium
*
Author to whom correspondence should be addressed.
Water 2021, 13(15), 2069; https://doi.org/10.3390/w13152069
Submission received: 17 June 2021 / Revised: 20 July 2021 / Accepted: 22 July 2021 / Published: 29 July 2021

Abstract

:
Waterborne pathogens are heterogeneously distributed across various spatiotemporal scales in water resources, and representative sampling is therefore crucial for accurate risk assessment. Since regulatory monitoring of microbiological water quality is usually conducted at fixed time intervals, it can miss short-term fecal contamination episodes and underestimate underlying microbial risks. In the present paper, we developed a new automated sampling methodology based on near real-time measurement of a biochemical indicator of fecal pollution. Online monitoring of β-D-glucuronidase (GLUC) activity was used to trigger an automated sampler during fecal contamination events in a drinking water supply and at an urban beach. Significant increases in protozoan parasites, microbial source tracking markers and E. coli were measured during short-term (<24 h) fecal pollution episodes, emphasizing the intermittent nature of their occurrence in water. Synchronous triggering of the automated sampler with online GLUC activity measurements further revealed a tight association between the biochemical indicator and culturable E. coli. The proposed event sampling methodology is versatile and in addition to the two triggering modes validated here, others can be designed based on specific needs and local settings. In support to regulatory monitoring schemes, it should ultimately help gathering crucial data on waterborne pathogens more efficiently during episodic fecal pollution events.

Graphical Abstract

1. Introduction

Acquiring meaningful data for microbial risk assessments in water is paramount and requires representative samples [1]. Given the inherent variability in microbiological water quality in groundwater and surface water [2,3,4,5,6]), inadequate sampling strategies can miss intermittent contamination events [7]. Yet, as illustrated by past and recent waterborne outbreaks, such hazardous events can have significant implications for public health if they occur during drinking water treatment failures [8,9]. Rainfall has long been identified as a major trigger of waterborne outbreaks [10], as well as for the incidence of gastrointestinal illness during recreational exposure [11]. During wet weather events, enteric pathogens are released into waterways through agricultural and urban runoff as well as untreated sewage discharges, and they can ultimately reach drinking water intakes or recreational areas. Because the direct measurement of pathogens is cumbersome and expensive, regulatory water quality monitoring mostly relies on fecal indicator bacteria (FIB) such as E. coli or enterococci (ENT), and only in a limited number of countries such as in the USA, regulatory monitoring of the protozoan pathogen Cryptosporidium is performed in source waters of large drinking water supply systems [12]. The monitoring of FIB (or Cryptosporidium in some instances) in drinking water supplies is usually carried out periodically (weekly to monthly), at predefined days [12,13]. At best, the daily monitoring of FIB may be performed locally, but usually during weekdays only. Periodic sampling of FIB is also common rule for the regulatory monitoring of recreational water quality [14,15]. Given that fecal contamination events can appear and disappear within less than 24 h at any time, even daily monitoring can miss such short-term episodes. Appropriate tools and assays are therefore needed to enable the collection of representative data accounting for (short-term) fluctuations in microbial water quality [16], which should ultimately help improve microbial risk assessment within the framework of water safety planning [1,17]. In a recreational context, targeted assessments of the microbial risk associated with intermittent contamination events that may be missed by routine monitoring schemes would help avoid the unintended direct exposure of bathers to potential gastrointestinal-illness-causing agents.
Event-based sampling is not a recent topic, and it has been carried out in hydrology with the aim to collect samples for total suspended sediment analyses using turbidity as a trigger [18]. In the area of water microbiology, studies have reported rainfall, water level or flow rate as the triggers for event sampling and the subsequent analysis of fecal indicator bacteria or pathogens, usually in small rivers/streams [19,20] or groundwater systems [21]. Such targeted sampling strategies (as opposed to routine sampling at fixed time intervals) can provide crucial data on microorganism loads during hazardous events while optimizing the resources and costs invested in complex analyses such as those required for pathogens. Recent studies in a large urban river in Quebec, Canada, have led to the observation that microbiological peak concentrations (FIB, protozoan pathogens) preceded turbidity or flowrate peaks by several hours [22,23], making the latter parameters inappropriate triggers for the event sampling of pathogens or other microbiological variables in such field conditions.
With the technological development and validation of automated tools for (near) real-time monitoring of microbiological water quality, it has become possible to fully describe short-term variations using optical, enzymatic-based or flow cytometry-based online instruments [2,24,25,26,27,28]. Although similar tools are not yet available for the continuous monitoring of pathogenic microorganisms, the current technologies offer unprecedented possibilities to unravel the fine temporal dynamics of (fecal) bacteria in water, and thereby guide the sample collection for pathogens across the drinking water supply chain and in recreational waters.
Among the available online measurement technologies, enzyme-based assays involving the beta-D-glucuronidase (GLUC) enzyme have proven to be suitable for the characterization of fecal pollution dynamics over several time scales and in various field settings [22,28,29]. GLUC is an enzyme that is specific to E. coli [30], and it has been used for several decades in standard microbiological assays for the confirmation of E. coli presence. Being expressed by culturable, but also viable but not culturable (yet metabolically active), E. coli cells [31], it is considered as a conservative biochemical indicator of fecal pollution [26]. Recently, the online monitoring of GLUC activity was used alongside meteorological forecasting to initiate the manual event-based sampling of fecal pathogens at drinking water intakes in the Greater Montreal Area [23]. Such manual sampling during intermittent contamination events and over several hours is complex, although it cannot practically be implemented on a regular basis.
In the present study, we propose a fully automated event-based sample collection system that uses online GLUC activity measurement as a trigger. The automated sampling system was validated in two rivers in the Greater Montreal Area, which serve as a drinking water supply and a recreational area. Water samples were autonomously collected following rainfall-induced fecal contamination peaks for the detection of the protozoan pathogens Cryptosporidium and Giardia as well as E. coli and microbial source tracking markers. The proposed methodology can be further developed to expand the range of event-based sampling possibilities needed in other contexts and environments.

2. Material and Methods

2.1. Sampling Sites

Site 1 is a drinking water treatment plant (DWTP) that draws water from a 42 km-long river located in the Greater Montreal Area, in southwestern Quebec, Canada, and serves >556,000 people. Samples were collected at the inlet of the drinking water treatment plant. Further description of the catchment area and land use can be found in [22]. Site 2 is an urban beach in the Greater Montreal Area. Both sites 1 and 2 are impacted by several combined sewer overflow (CSO) discharges located within a <1 km to >10 km stretch upstream from both sampling stations. Temporal series of online GLUC activity measurements have been recently reported for both sites [22,32] and demonstrate vulnerability of the latter to intermittent fecal pollution inputs.

2.2. Online Monitoring of β-D-Glucuronidase (GLUC) Activity

Online, near real-time measurements of β-D-glucuronidase (GLUC) activity were performed with a ColiMinder Industrial instrument (VWM Solutions, Vienna, Austria). Additional information on the technology can be found in [33]. At site 1, samples were collected at the raw water inlet as described earlier [22]. At site 2, samples were drawn 20 m from the shore at approximately 50 cm below the surface. For both sites, the instrument collected a sample from a continuous flow of surface water. Measurement data were continuously recorded by the ColiMinder instrument, transmitted via a wireless modem and accessed remotely through a secured internet connection. Measurement frequency was set at 2 h, resulting in 12 measurements per day except for selected peak contamination events, during which GLUC activity measurements were performed on an hourly basis. Measurement frequency was adjusted either on-site or remotely through a dedicated virtual private network (VPN) access. Automatic calibration of instrument sensor and amplification as well as checking of measurement chamber cleanliness was performed every 24 measurements. Blanks were automatically carried out with Milli-Q water after 24 measurements to correct for any offset in GLUC activity measurements.

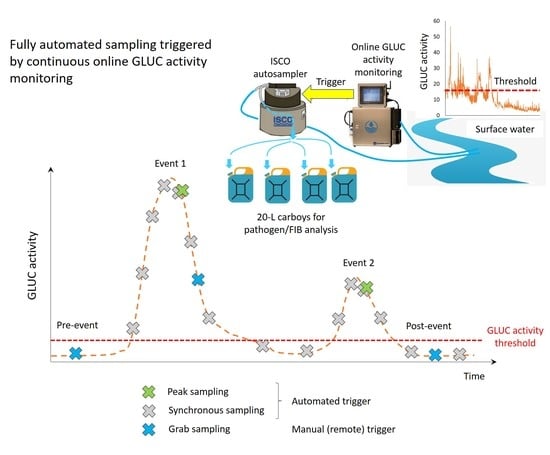
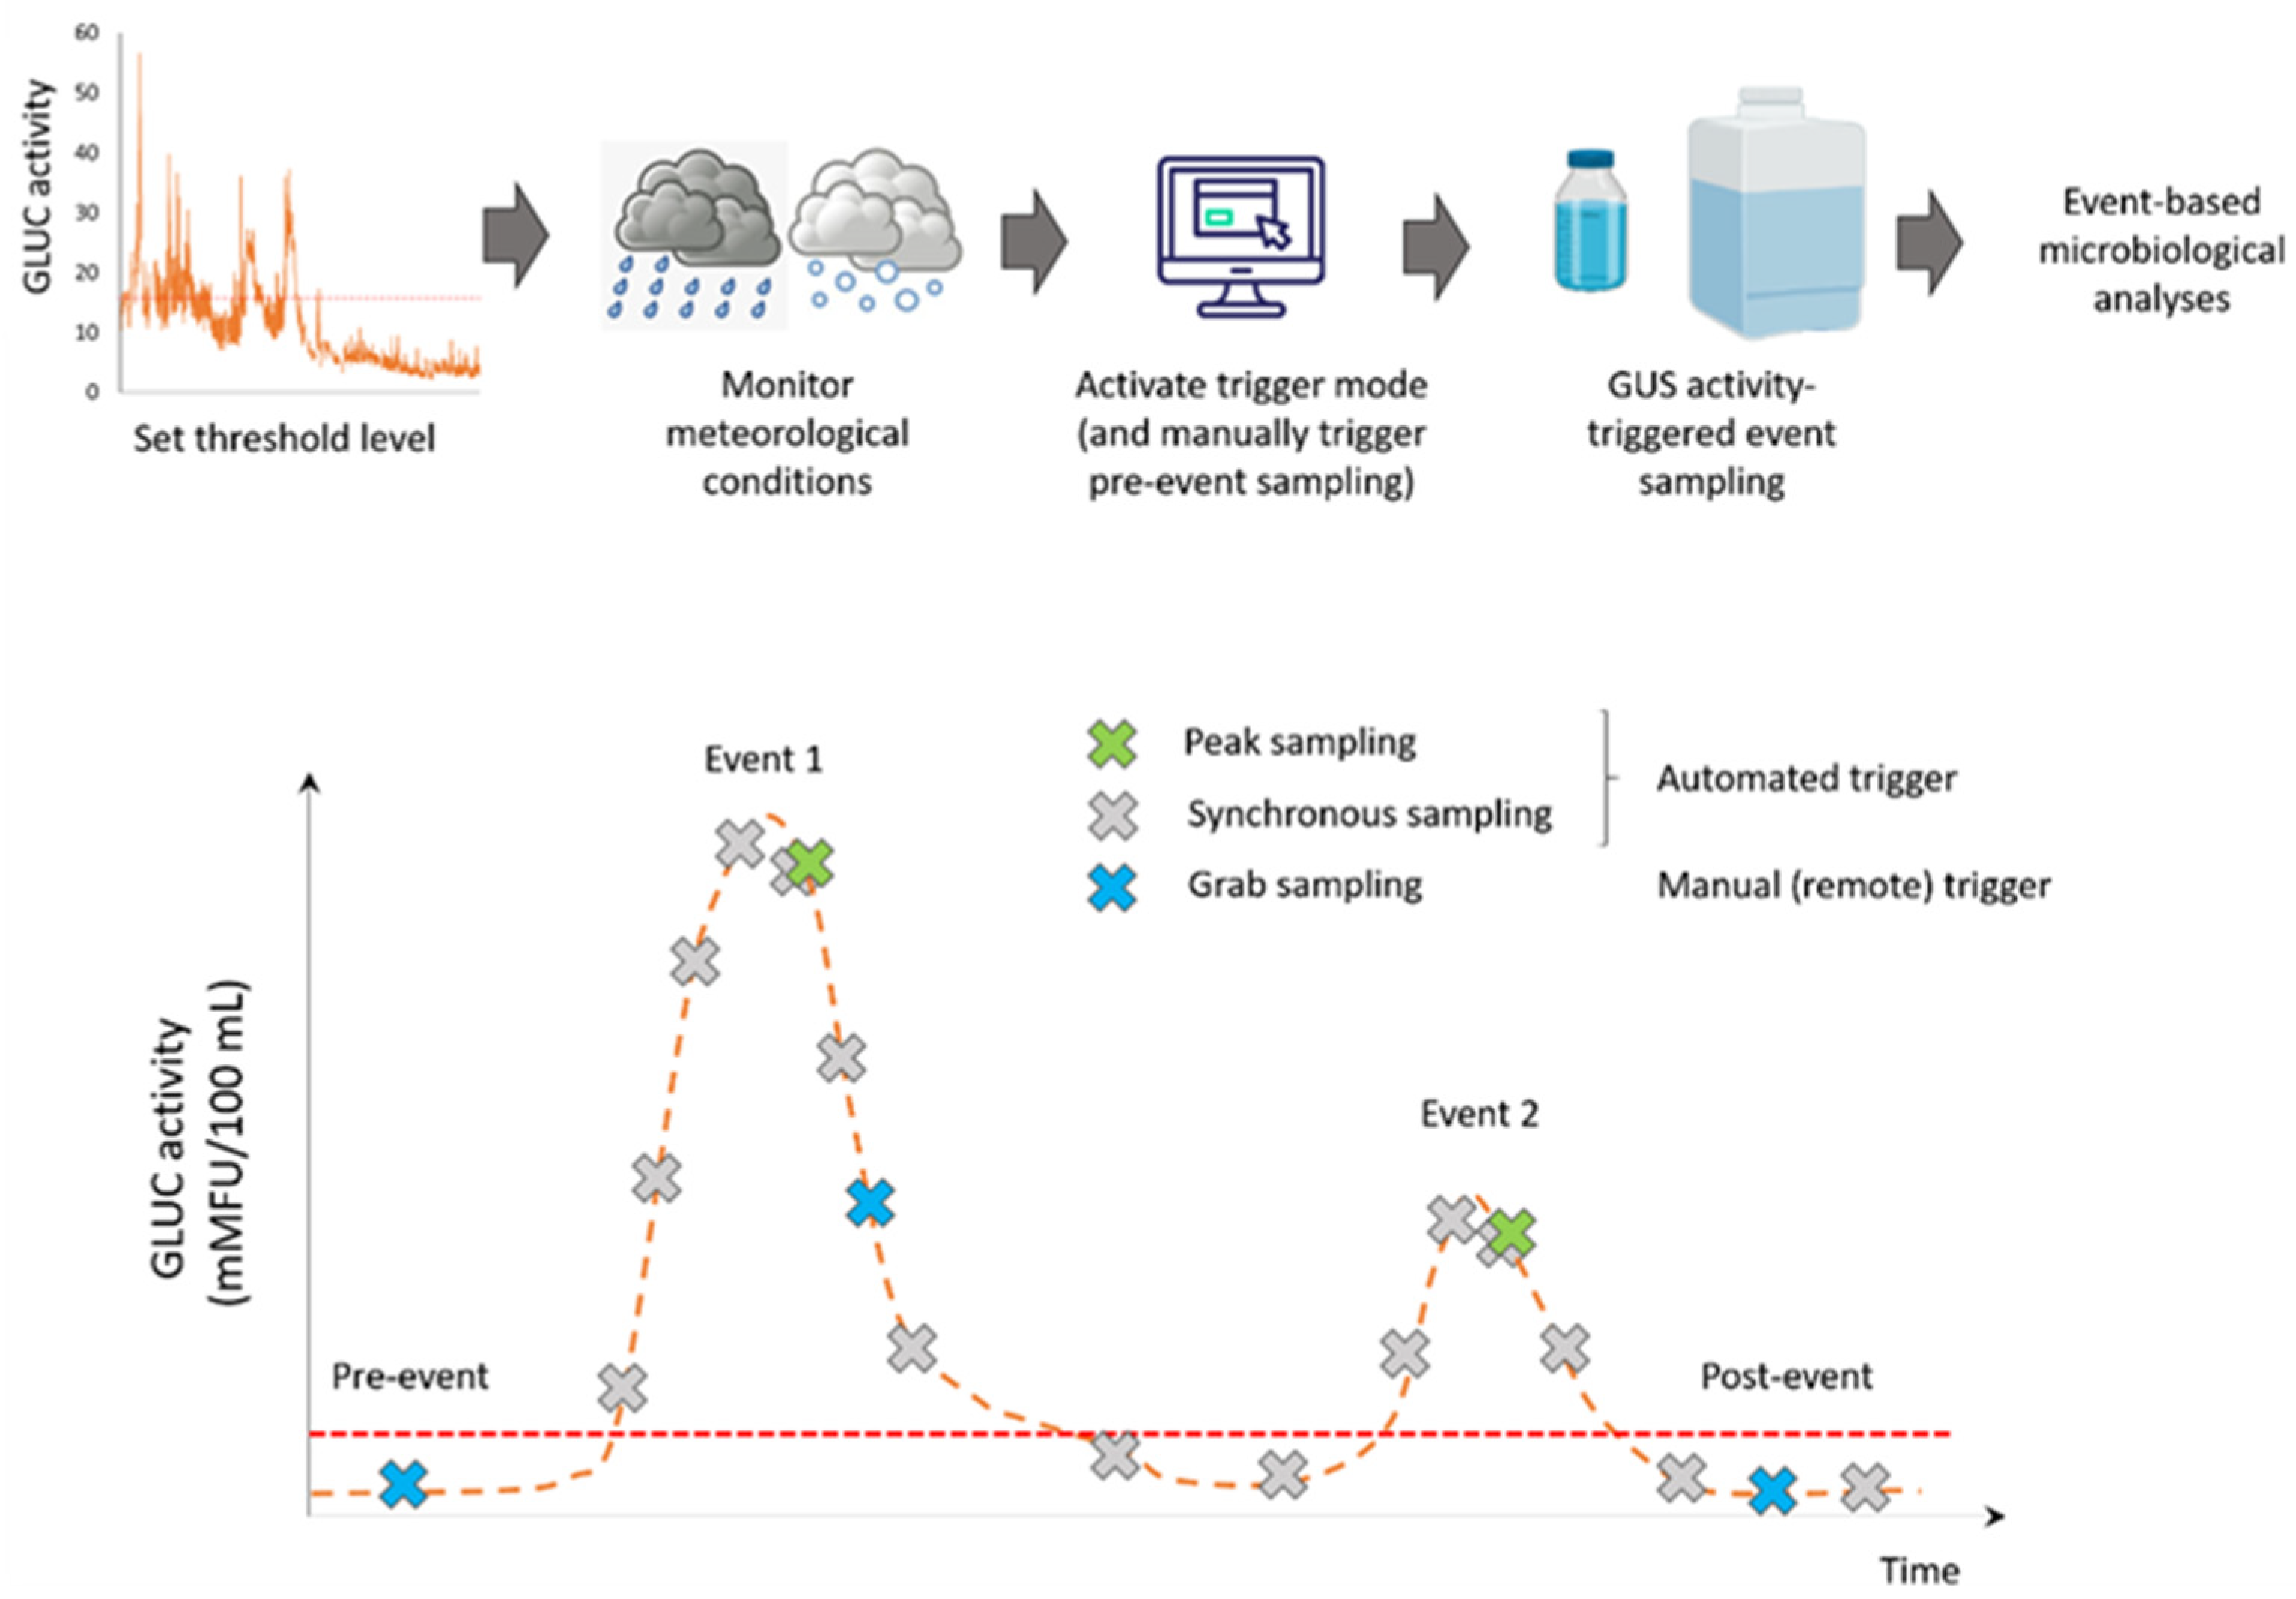
2.3. Triggering ISCO Autosampler by Online In Situ GLUC Activity Measurements

2.3.1. Communication between ISCO Autosampler and GLUC Activity Online Monitoring Instrument

The connectors (Rain Gauge and Flow Meter) and interfaces were used to control and monitor the status of an ISCO 6712 autosampler (Teledyne, Lincoln, NE, USA). The ColiMinder instrument was directly connected to the corresponding inputs of the autosampler using a dedicated cable. To establish a communication between the autosampler and the online instrument, an electronic hardware module was developed by the manufacturer of the ColiMinder. The electronic circuit is galvanically separated from the online instrument, using the power supply of the autosampler for its operation. Using the hardware module, the instrument automatically triggers the autosampler and continuously monitors its status during sample collection. Manual trigger of the ISCO can further be performed using the online instrument interface (either on-site or through remote control using a VPN connection). For each trigger (automatic or manual), the online instrument generates a CSV file storing the following entries:
  • UnixTrigger: Unix timestamp when sampling starts;
  • UnixFinished: Unix timestamp when sampling is completed;
  • UID (unique identifier): UID of the measurement that triggered the ISCO (if trigger was not manual);
  • Status message
    SUCCESS (0): Sampling successful;
    PROGINACTIVE (1): Program on ISCO not started or not started/configured correctly;
    RUNTIMEERROR (2): ISCO reports runtime errors during sampling;
    PUMPERROR (3): ISCO reports pump faults;
    NOUSBDEVICE (4): FTDI chip not found—ISCO module not connected;
    PROGNOTFOUND (5): Program for ISCO control not found/not installed.

2.3.2. Triggering and Sampling Modes

The following triggering modes were implemented in the present study:
  • Manual trigger, either on-site or through remote control.
  • Automated trigger, synchronous with the next autonomous measurement of GLUC activity.
  • Automated trigger, immediately when a GLUC activity measurement result is provided (15 min after sampling for GLUC activity measurement) and a predefined trigger condition is fulfilled. For sampling at the peak of a GLUC activity pollutograph, the predefined conditions were set as follows:
    Below GLUC activity (GA) threshold: no trigger;
    Above GA threshold:
    If GAn ≥ GAn − 1: no trigger;
    If GAn < GAn − 1: immediate trigger of ISCO autosampler upon GAn result acquisition (15 min after sampling for GLUC activity measurement);
    Above GA threshold and after the peak GA (GAmax):
    If GAn exceeds GAmax: the same algorithms described above do apply.
These algorithms imply that in case of a subsequent larger contamination peak measured by the automated GLUC activity measurement device, that second peak will be sampled, too. In case of a second peak of lower contamination, it will not be sampled based on the current algorithm.

2.3.3. Field Validation of the Triggering Modes

Peak sampling was preliminarily tested and validated in the laboratory by the manufacturer of the online instrument using solutions of various GLUC activity. Synchronous and peak sampling were then performed in the field following rainfall and/or snowmelt episodes that generated GLUC activity pollutographs resulting from upstream raw sewage discharges at both study sites.
For each trigger, a 1 L bottle was collected by the ISCO autosampler. For higher sample volumes (20–40 L) needed for protozoan parasites analysis, automated multi-trigger was carried out by repeating the trigger as often as set in the ISCO program to enable collection of the needed volume. In addition, the ISCO autosampler structure was adapted by installing the ISCO autosampler control head and pump arm onto a housing containing 4 autoclaved 20 L polypropylene carboys.
At site 1, synchronous sampling was conducted in February and March 2017 to enumerate E. coli along the GLUC activity pollutograph. Synchronous sampling mode was manually activated following a major rainfall event (24 h cumulated rainfall >25 mm) for which an increase in GLUC activity was expected based on previous observations under similar meteorological conditions. At site 2, the manual trigger of the ISCO autosampler was done remotely for pre- and post-event sampling (under baseline GLUC activities, below the GLUC activity threshold), whereas peak sampling was autonomously conducted by the online GLUC activity instrument above the GLUC activity threshold as described above. Three 40 L samples were collected during this event and analysed in the laboratory for E. coli, protozoan parasites and Bacteroides. The threshold for peak sampling mode activation was set at 10 mMFU/100 mL based on the GLUC activity measured under dry weather conditions (in absence of any contamination event) during the previous bathing season [32].

2.4. Microbiological Analyses

2.4.1. Culture-Based Enumeration of E. coli

For enumeration of culturable E. coli at site 1, the membrane filtration method using MI agar was performed according to USEPA method 1604 [34]. One hundred mL of river water or dilutions of it were filtered through a sterile 47 mm, 0.45 µm pore size cellulose ester membrane filter (Millipore, Oakville, ON, Canada) and placed on a 5 mL plate of MI agar (BD Biosciences, Mississauga, ON, Canada) containing 5 µg/mL cefsulodine (Sigma Aldrich, Oakville, ON, Canada). Plates were incubated at 35 °C for up to 24 h. Colonies of E. coli were identified and counted based on their blue color resulting from the breakdown of IBDG by the E. coli GLUC enzyme, and counts were expressed in colony-forming units per 100 mL (CFU.100 mL−1).
At site 2, E. coli was enumerated using the defined substrate technology Colilert Quanti-Tray/2000 (IDEXX, Westbrook, ME, USA). Colilert reagents were mixed with (diluted or undiluted) samples and poured into Quanti-Trays, which were heat-sealed and incubated at 35 ± 1 °C during 24 h. After the incubation period, positive wells (yellow for total coliforms, yellow and fluorescent for E. coli) were counted and transformed into most probable numbers per 100 mL−1 (MPN.100 mL−1) using the IDEXX MPN conversion table. In a previous evaluation of E. coli enumeration methods, the membrane filtration method and defined substrate technology gave the most similar results [24].

2.4.2. Enumeration of Protozoan Parasites

Enumeration of Cryptosporidium oocysts and Giardia cysts was performed following USEPA method 1623.1 by filtering 20 to 40 L on Envirochek HV filter capsules (Pall, Mississauga, ON, Canada) before centrifugation and purification of the packed pellet by immunomagnetic separation (IMS), staining and examination under epifluorescence microscopy [34]). Sample-specific analytical recoveries were not measured during the present study, but ongoing precision recovery (OPR) samples consisting in tap water spiked with 98–100 flow cytometry-sorted fluorescently labeled (oo)cysts (Colorseed, BTF, Australia) were done on a regular basis following standard method recommendations [15]. On average, OPR samples yielded 43% and 44% for Cryptosporidium and Giardia, respectively. The data on the average analytical recovery rates were obtained from a recent study [23], and based on 43 Cryptosporidium and Giardia matrix spike recovery experiments in 10-L raw water samples, the recovery rates were 46% ± 14% and 50% ± 17%, respectively. Samples from this study and the previous one were all analyzed at the Centre d’expertise en analyse environnementale du Québec (CEAEQ).

2.4.3. Bacteroides Quantification

Samples (100 mL) were filtered through a sterile 47 mm, 0,45 µm pore size cellulose ester membrane filter (Millipore) and prepared and analyzed as described in Lee et al. (2010, 2014). Each filter was placed in a sterile 3 mL disposable tube containing 1.5 mL of 5 M GITC lysis buffer (5 M guanidine isothiocyanate, 100 mM EDTA at pH 8.0, and 0.5% (w/v) sarkosyl [35]. Lysis was conducted by shaking the tube on a sample mixer for 1 h at 37 °C and 70 rpm. The lysates were transferred into sterile 1.5 mL microcentrifuge tubes and large impurities were removed by centrifugation for 10 min at 10,000× g. The supernatants were transferred into DNeasy Mini Spin Columns (QIAgen Canada Inc., Mississauga, ON, Canada) for genomic DNA extraction. The protocol followed method E3499 [36] which modifies the manufacturer’s protocol by incorporating 2 additional AW1 and 4 additional AW2 wash steps prior to elution. All samples were analyzed by quantitative PCR assays evaluating the order Bacteroidales (BacGeneral), cattle-specific (BacBovine) and human-specific (BacHuman) markers in singleplex mode, as detailed in Lee et al. 2014 (Table S1). Template genomic DNA, primers, and hydrolysis probes were added to a PCR master mix (SsoFast Universal Probes mix (BioRad, Mississauga, ON, Canada) to final concentrations of 176 nM for probes and 500 nM for each primer. Real-time PCR assays were performed with a temperature profile of 95 °C for 3 min, followed by 40 cycles at 95 °C for 15 s and at 60 °C for 60 s each. The inhibitory effect of environmental samples on PCR efficiency was tested and corrected for each sample as described previously [37]. For each assay, quantification was determined using triplicate standard curves prepared using plasmid standards containing a single copy of the gene target [38]) and no template controls were performed. All assays met specific criteria: (1) efficiency between 90 and 105%, (2) R2 > 0.99 and (3) slopes between −3.334 and −3.496.

2.5. Hydrometeorological Measurements and Online Physico-Chemistry

Raw water turbidity (Surface Scatter sc turbidimeter, HACH, London, ON, Canada) was measured online at the drinking water intake and operated by the DWTP staff at site 1. No turbidity measurements were available at the urban beach (site 2).
Flow rate data were extracted from the public repository of Environment Canada [39]. Daily rainfall data was obtained from the municipal partner for the closest rain gauge.

3. Results and Discussion

A new tool was developed to enable an autonomous and targeted sample collection for microbiological water quality parameters, including enteric pathogens during intermittent fecal contamination events. Its operationality was tested on two water sources: a drinking water supply and an urban recreational area. The collected samples are intended for the measurement of waterborne pathogens and/or microbial source tracking markers to help assess the associated microbial risks and identifying contamination sources during fecal pollution episodes. We present two different collection modes for acquisition of event-based microbiological water quality data. Other modes can be tailored to the specific needs of end-users and are discussed more generally at the end of this section.

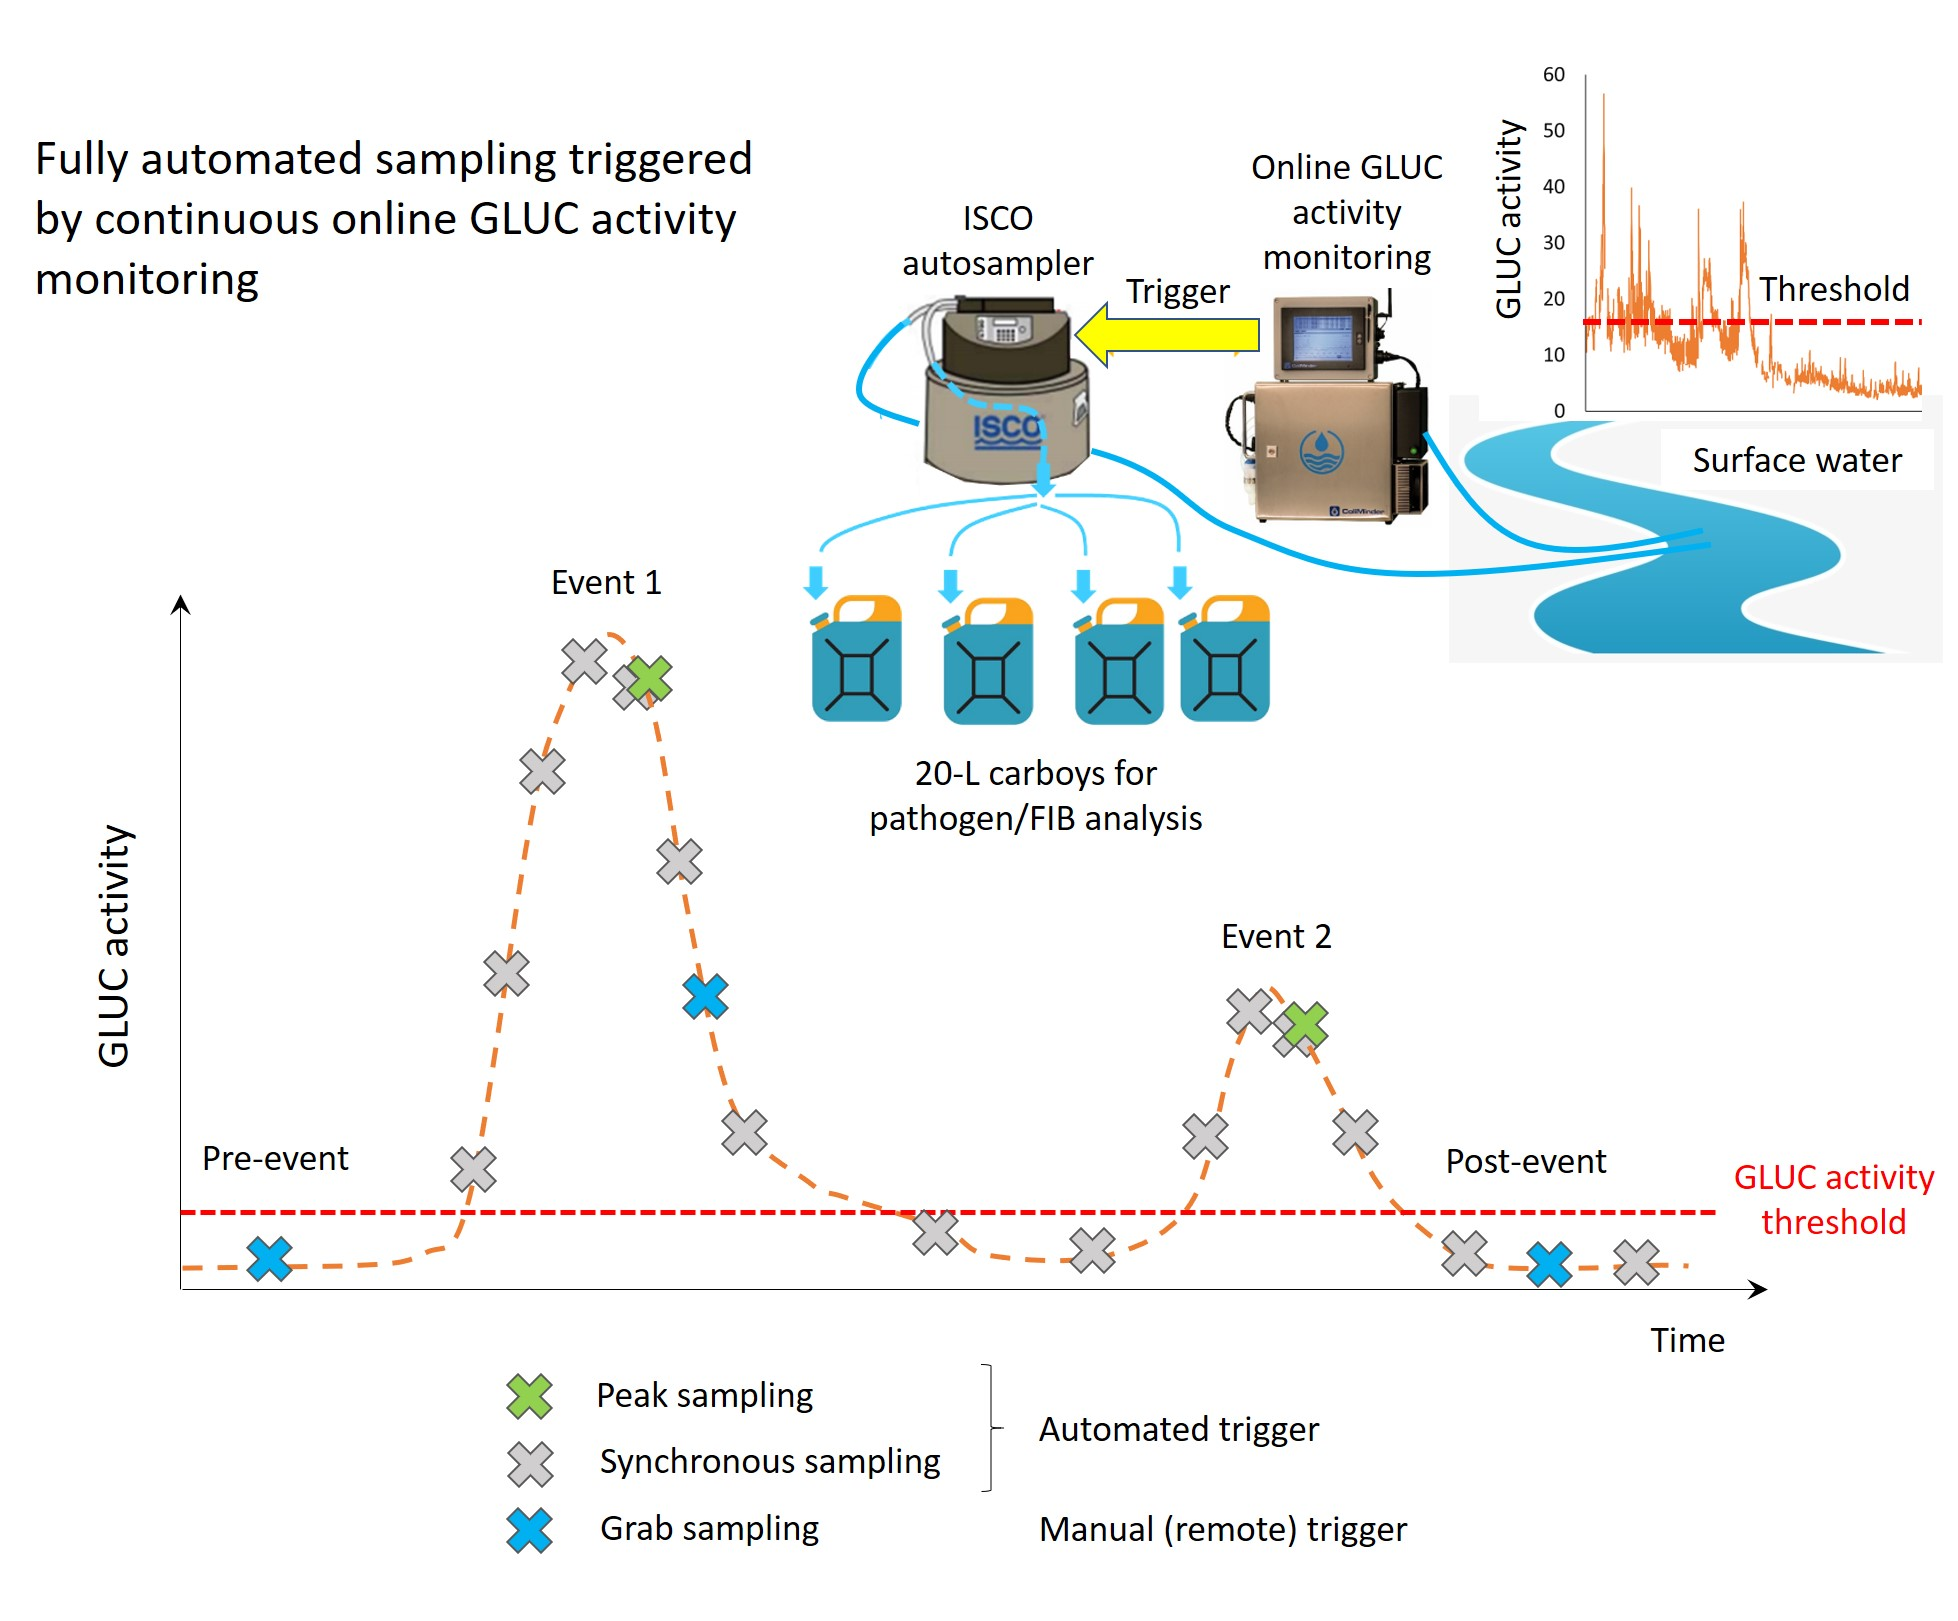
3.1. Synchronous Sampling
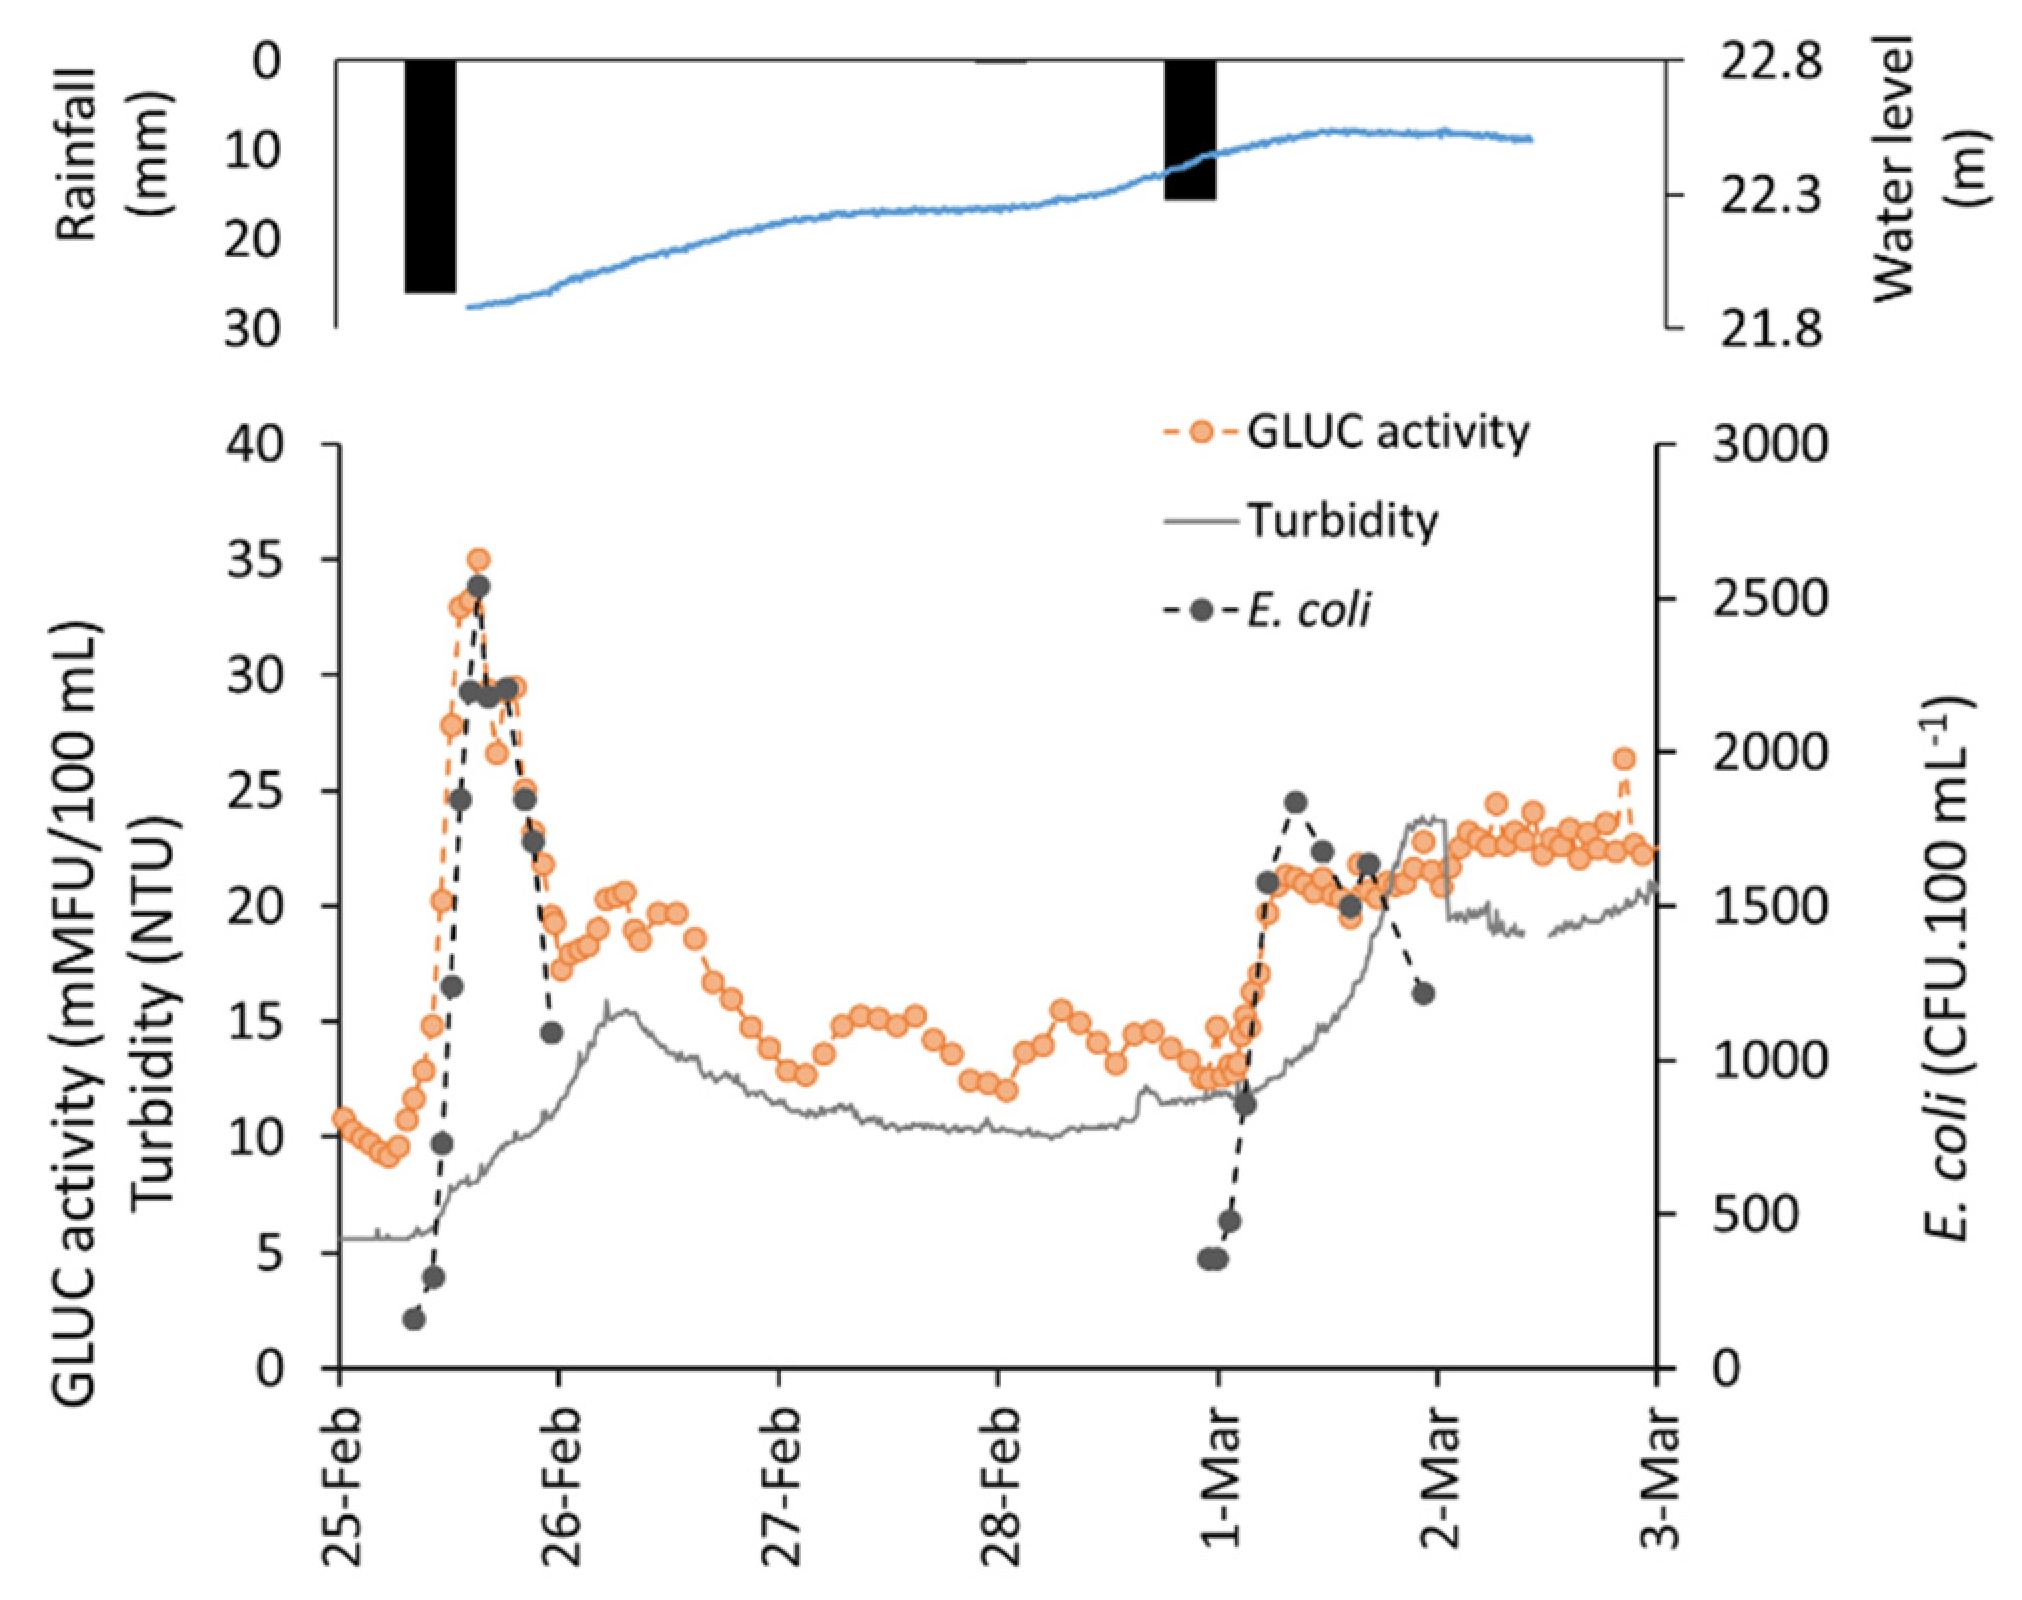
When activating the synchronous sampling mode, the ISCO autosampler was triggered each time the online instrument took a sample for autonomous measurement of GLUC activity. As such, the in situ autonomous measurement of GLUC activity was paired with the enumeration of E. coli, which was subsequently performed in the laboratory using a standard culture-based assay. Two successive contamination events were investigated between 25 February and 3 March 2017 at the intake of a drinking water treatment plant (site 1) following a combined snowmelt-rainfall episode. As illustrated in Figure 1, the GLUC activity dynamics very closely followed those of the culturable E. coli concentrations during both events.
Compared to weekly E. coli data at this site [40], the measured E. coli concentrations (>1000 CFU/100 mL) were indicative of peak contamination events of a low probability of occurrence for this drinking water intake. Burnet et al. [22] demonstrated that these GLUC activity peaks were directly related to the release of untreated sewage into the river by an upstream water resource recovery facility and local combined sewer overflows, which would explain the tight temporal association between GLUC activity and E. coli. Using the synchronous mode, that relationship can be thoroughly assessed under various field settings and for multiple contamination events, and it can be further compared to other online parameters such as the turbidity or the flow rate.
As previously reported by Sylvestre et al. [23], turbidity and flow rate peaks were delayed by 18 and >48 h, respectively, compared to the FIB peak. The turbidity and fecal indicator bacteria can correlate during runoff events in surface waters (e.g., [41]). In other cases, the turbidity is poorly correlated with FIB, suggesting different sources and transport dynamics within a catchment (e.g., [42]). Here, the reactivity of the large watershed to rainfall was lower than that of the local discharges of untreated sewage, which caused a delay in the turbidity peak compared to the sewage-derived FIB peak. Flow rate has been previously used to (automatically) trigger sampling for microbiological analyses [19,20,21]). However, in our settings, the flow rate peak was even more delayed than the turbidity peak (Figure 1). As a consequence, neither the flowrate nor the turbidity would be appropriate triggers to collect samples for microbiological investigations and associated risk assessment. Instead, GLUC activity appears to be a more suitable trigger for this purpose under the present settings.

3.2. Peak Sampling

Peak contamination sampling was carried out at site 2, following the definition of a threshold of 10 mMFU/100 mL−1. The latter was based on online GLUC activity monitoring data collected under dry and wet weather conditions (in absence of contamination events or following rainfall-induced untreated sewage discharges, respectively) during the 2018 bathing season [32]. Using the algorithm developed for the peak sampling mode, a 40 L sample was collected by the autosampler at the GLUC activity peak. Enzymatic activity was measured on an hourly basis and the trigger was sent to the autosampler immediately after the GLUC activity started decreasing, i.e., it had reached a peak (see material and methods for details).
Protozoan parasite levels increased during the GLUC activity peak, especially for Giardia. Pre-event Giardia densities (0.3 cyst/L) rose by more than two orders of magnitude (43 cysts/L) within less than 24 h at the peak GLUC activity, before dropping back to pre-event densities (0.4 cysts/L) when GLUC activity had returned to baseline levels (Figure 2). The previous monitoring of protozoa in the Greater Montreal Area showed that the prevalence of Cryptosporidium (55%) is lower than that of Giardia (95%) and that Cryptosporidium oocyst densities are, on average, 1 log unit lower than Giardia cyst densities [40]). The oocyst densities were below the limit of detection (<0.03 oocyst. L−1) in the pre- and post-event samples, but the GLUC activity peak sample contained 0.5 oocysts. L−1.
Culturable E. coli concentrations increased by more than three orders of magnitude between the pre-event sample (10 CFU.100 mL−1) and the GLUC activity peak sample (1.7 × 10⁴ CFU.100 mL−1) and dropped to 123 CFU.100 mL−1 after the GLUC activity peak. Similarly, concentrations of the human-specific Bacteroides marker (BacHuman) increased (3.9 × 10⁵ cells.L−1) during the GLUC activity peak compared to the pre- and post-event samples (2.4 × 10³ and 8.4 × 10³ cells.L−1, respectively). A somewhat lower increase was observed for the BacGeneral marker, from 5.2 × 10⁵ to 1.5 × 10⁶ cells-L−1, and back to 6.5 × 10⁵ cells-L−1. Unlike the human and general markers, the bovine marker (BacBovine) remained constant (between 5.3 and 7.3 × 10⁵ cells.L−1). The substantial increase in BacHuman, E. coli and Giardia collectively highlights the impact of upstream CSOs that discharged raw sewage into the river after the rainfall episode. The constant but high concentrations of BacBovine likely reflected a substantial input from slaughterhouse effluents and/or upstream land application of manure, although potential cross-reactions cannot be excluded. Although the purpose of the study was not to characterize the origin of fecal pollution sources at site 2, it nevertheless illustrates the type of field data that can be gathered autonomously through the proposed sampling methodology towards more thorough source tracking investigations during specific contamination events.

3.3. Event-Based Sampling Triggered by Online Monitoring of Microbiological Water Quality

Targeted sampling for the measurement of microbiological water quality is a crucial component of a representative assessment of hazards and risks in a specific area and water usage [1]. It is well acknowledged that the microbiological quality of surface waters significantly deteriorates during rainfall-induced runoff events [4,20,43,44,45], but these events are difficult to capture by fixed time sampling strategies. Automation of the sampling process is therefore a first step towards collection of samples during periods that are usually not covered by routine sampling frameworks. The other key step consists in the selection of a representative surrogate that is continuously measured in real-time and that can trigger sample collection at the right time. Based on a sound knowledge of the temporal dynamics of that surrogate, an appropriate threshold can be set to delimitate the triggering conditions (Figure 3). Weather forecasts are the starting point of the event-based sampling strategy and one or several pre-event samples should be collected prior to the expected fecal pollution peak event. These samples are collected by the autosampler after manual trigger, before activating event sampling modes (peak or synchronous sampling). The actions can be carried out either onsite or remotely using the online interface of the instrument, which further enables users to monitor the GLUC activity measurements and triggering actions remotely and in real-time. In the case of high-volume samples (>10 L) for enteric pathogen analyses, samples can be filtered onsite before laboratory analyses.
Implementing event-based physical sampling is logistically complex, but infrequent routine monitoring fails at providing early detection of contaminants [46]. The proposed automated event-based sampling strategy offers new possibilities for targeted sample collection and should be used as a complement to traditional routine monitoring. It can be tailored to the specific needs of a utility or beach manager to capture the relevant hazardous periods and it can be adapted for various sampling volumes or frequencies. Because of the rapid responses of local raw sewage discharges to rainfall events [47,48]), the automated sampling system is particularly suited for urban waters affected by these fecal pollution sources.
The described peak sampling program collects a sample as soon as GLUC measurement n + 1 < n following a steady increase above the defined GLUC activity threshold (see Section 2.3.2). As a result, the triggered ISCO autosampler collects the event sample slightly after the GLUC activity peak. Given the high measurement frequency, though, this is not expected to affect the representativity of the collected sample (Figure 2). It is possible to increase the GLUC activity measurement frequency up to 30 min, which would further reduce the delay between peak GLUC activity and autosampler trigger. However, the shorter the time between two consecutive measurements, the higher the probability to observe a slight fluctuation in GLUC activity within the rising limb of the pollutograph. Given that a drop in GLUC activity for the n + 1 measurement directly triggers the autosampler, a sample may be unintentionally collected before the actual GLUC activity peak. By increasing the number of carboys, more samples can be handled per event. As such, samples could be retrospectively selected for further processing after analysis of the GLUC activity pollutograph.
As conceptualized in Figure 3, a multi-peak event can be sampled. Using the synchronous sampling mode, the event mean concentrations of a given microbiological analyte [19,20,49] can further be determined by this approach. Additional adjustments can be made to the automated event sampling methodology. For instance, higher sampling volumes could be collected, which would enable users to perform other pathogen analyses such as enteric viruses.
In addition, using the programming capabilities of ISCO autosamplers, composite sampling may also be performed along the GLUC activity pollutograph to obtain an “event-weighted load” of microbiological parameters. Finally, whereas the present study focused on FIB and pathogens, any water quality-related parameter related to runoff (e.g., pesticides) or sewage (antimicrobial resistance genes, hormones, microplastics, PFAs, chemical source tracers) can be assessed during specific pollution events using online GLUC activity as indicator of fecal pollution. The information acquired through the targeted sampling of hazardous events should ultimately aid decision makers to define priorities in catchment management, source remediation as well as risk management and water treatment system design within the framework of water safety planning.

Supplementary Materials

The following are available online at https://www.mdpi.com/article/10.3390/w13152069/s1, Table S1: Primers and probes for Bacteroides qPCR assays.

Author Contributions

Conceptualization, J.-B.B., S.D.; methodology, J.-B.B.; investigation, J.-B.B., M.H. (Marc Habash), M.H. (Mounia Hachad), Z.K., E.S.; data curation, J.-B.B.; writing—original draft preparation, J.-B.B.; writing—review and editing, M.H. (Marc Habash), M.P., E.S., P.S., S.D.; supervision, S.D., M.P.; project administration, J.-B.B.; funding acquisition, J.-B.B., S.D., M.P. All authors have read and agreed to the published version of the manuscript.

Funding

This research was funded by MITACS Acceleration Grants (FR16028, FR18335, FR21507), NSERC Strategic Grant Project (STGP 494607-16) and the Canada Research Chair (CRC) on Source Water Protection. The APC was funded by NSERC Strategic Grant Project (STGP 494607-16).

Institutional Review Board Statement

Not applicable.

Informed Consent Statement

Not applicable.

Data Availability Statement

The data presented in this study is available on request from the corresponding author.

Acknowledgments

We would like to thank Yves Fontaine and municipal partners for their valuable logistic support in the field as well as the CEAEQ team of biology and microbiology for parasites analysis. We also want to acknowledge Wolfgang Vogl, Juri Koschelnik, Lucas Böhm, Georg Schiesser and Bernhard Mathias (Vienna Water Monitoring Solutions, GmbH) for the development of the event sampling module as well as for their scientific inputs and technical support with the ColiMinder instrument.

Conflicts of Interest

The authors declare no conflict of interest.

References

  1. WHO. Quantitative Microbial Risk Assessment: Application for Water Safety Management; WHO Press: Geneva, Switzerland, 2016. [Google Scholar]
  2. Besmer, M.D.E.; Epting, J.; Page, R.M.; Sigrist, J.A.; Huggenberger, P.; Hammes, F. Online flow cytometry reveals microbial dynamics influenced by concurrent natural and operational events in groundwater used for drinking water treatment. Sci. Rep. 2016, 6, 38462. [Google Scholar] [CrossRef]
  3. Boehm, A.B. Enterococci concentrations in diverse coastal environments exhibit extreme variability. Environ. Sci. Technol. 2007, 41, 8227–8232. [Google Scholar] [CrossRef] [Green Version]
  4. Burnet, J.-B.; Penny, C.; Ogorzaly, L.; Cauchie, H.-M. Spatial and temporal distribution of Cryptosporidium and Giardia in a drinking water resource: Implications for monitoring and risk assessment. Sci. Total. Environ. 2014, 472, 1023–1035. [Google Scholar] [CrossRef] [PubMed]
  5. Dorner, S.; Anderson, W.; Gaulin, T.; Candon, H.; Slawson, R.; Payment, P.; Huck, P. Pathogen and indicator variability in a heavily impacted watershed. J. Water Health 2007, 5, 241–257. [Google Scholar] [CrossRef]
  6. Partyka, M.L.; Bond, R.F.; Chase, J.A.; Atwill, E.R. Spatial and temporal variability of bacterial indicators and pathogens in six California reservoirs during extreme drought. Water Res. 2018, 129, 436–446. [Google Scholar] [CrossRef] [PubMed]
  7. Madrid, Y.; Zayas, Z.P. Water sampling: Traditional methods and new approaches in water sampling strategy. TrAC Trends Anal. Chem. 2007, 26, 293–299. [Google Scholar] [CrossRef]
  8. Hrudey, S.E.; Hrudey, E.J. Common themes contributing to recent drinking water disease outbreaks in affluent nations. Water Supply 2019, 19, 1767–1777. [Google Scholar] [CrossRef] [Green Version]
  9. Moreira, N.A.; Bondelind, M. Safe drinking water and waterborne outbreaks. J. Water Health 2016, 15, 83–96. [Google Scholar] [CrossRef] [PubMed]
  10. Cann, K.F.; Thomas, D.R.; Salmon, R.L.; Wyn-Jones, A.P.; Kay, D. Extreme water-related weather events and waterborne disease. Epidemiol. Infect. 2012, 141, 671–686. [Google Scholar] [CrossRef]
  11. Soller, J.A.; Schoen, M.; Steele, J.A.; Griffith, J.F.; Schiff, K.C. Incidence of gastrointestinal illness following wet weather recreational exposures: Harmonization of quantitative microbial risk assessment with an epidemiologic investigation of surfers. Water Res. 2017, 121, 280–289. [Google Scholar] [CrossRef]
  12. USEPA. Occurrence and Exposure Assessment for the Final Long Term Enhanced Surface Water Treatment Rule; EPA 815-R-06-002; US Environmental Protection Agency: Washington, DC, USA, 2005.
  13. Gouvernement du Québec. Règlement sur le Prélèvement des Eaux et Leur Protection (Québec, Canada); Gouvernement du Québec: Quebec City, QC, Canada, 2018. [Google Scholar]
  14. EC. European Council Directive 2006/7/EC of 15 February 2006 Concerning the Management of Bathing Water Quality and Repealing Directive 76/160/EEC; Official Journal of the European Union: Strasbourg, France, 2006. [Google Scholar]
  15. USEPA. Recreational Water Quality Criteria; EPA 820-F-12-058 U.S.; Environmental Protection Agency: Washington, DC, USA, 2012; pp. 1–69.
  16. Besmer, M.D.; Hammes, F.; Sigrist, J.A.; Ort, C. Evaluating monitoring strategies to detect precipitation-induced microbial contamination events in karstic springs used for drinking water. Front. Microbiol. 2017, 8, 2229. [Google Scholar] [CrossRef]
  17. Roig, B.; Delpla, I.; Baurès, E.; Jung, A.; Thomas, O. Analytical issues in monitoring drinking-water contamination related to short-term, heavy rainfall events. TrAC Trends Anal. Chem. 2011, 30, 1243–1251. [Google Scholar] [CrossRef]
  18. Lewis, J. Turbidity-controlled suspended sediment sampling for runoff-event load estimation. Water Resour. Res. 1996, 32, 2299–2310. [Google Scholar] [CrossRef]
  19. Åström, J.; Pettersson, T.; Reischer, G.H.; Hermansson, M. Short-term microbial release during rain events from on-site sewers and cattle in a surface water source. J. Water Health 2013, 11, 430–442. [Google Scholar] [CrossRef] [PubMed]
  20. Signor, R.S.; Roser, D.; Ashbolt, N.; Ball, J. Quantifying the impact of runoff events on microbiological contaminant concentrations entering surface drinking source waters. J. Water Health 2005, 3, 453–468. [Google Scholar] [CrossRef] [Green Version]
  21. Stadler, H.; Skritek, P.; Sommer, R.; Mach, R.; Zerobin, W.; Farnleitner, A. Microbiological monitoring and automated event sampling at karst springs using LEO-satellites. Water Sci. Technol. 2008, 58, 899–909. [Google Scholar] [CrossRef] [PubMed]
  22. Burnet, J.-B.; Sylvestre, É.; Jalbert, J.; Imbeault, S.; Servais, P.; Prévost, M.; Dorner, S. Tracking the contribution of multiple raw and treated wastewater discharges at an urban drinking water supply using near real-time monitoring of β-d-glucuronidase activity. Water Res. 2019, 164, 114869. [Google Scholar] [CrossRef] [PubMed]
  23. Sylvestre, É.; Burnet, J.; Dorner, S.; Smeetsc, P.; Medema, G.; Villion, M.; Hachad, M.; Prévost, M. Impact of hydrometeorological events for the selection of parametric models for protozoan pathogens in drinking-water sources. Risk Anal. 2020, 13612. [Google Scholar] [CrossRef]
  24. Burnet, J.B.; Dinh, Q.T.; Imbeault, S.; Servais, P.; Dorner, S.; Prévost, M. Autonomous online measurement of b-D-glucuronidase activity in surface water: Is it suitable for rapid E. coli monitoring? Water Res. 2019, 152, 241–250. [Google Scholar] [CrossRef]
  25. Buysschaert, B.; Vermijs, L.; Naka, A.; Boon, N.; De Gusseme, B. Online flow cytometric monitoring of microbial water quality in a full-scale water treatment plant. npj Clean Water 2018, 1, 16. [Google Scholar] [CrossRef] [Green Version]
  26. Demeter, K.; Burnet, J.-B.; Stadler, P.; Kirschner, A.; Zessner, M.; Farnleitner, A.H. Automated online monitoring of fecal pollution in water by enzymatic methods. Curr. Opin. Environ. Sci. Health 2020, 16, 82–91. [Google Scholar] [CrossRef]
  27. Sorensen, J.; Vivanco, A.; Ascott, M.; Gooddy, D.; Lapworth, D.; Read, D.; Rushworth, C.; Bucknall, J.; Herbert, K.; Karapanos, I.; et al. Online fluorescence spectroscopy for the real-time evaluation of the microbial quality of drinking water. Water Res. 2018, 137, 301–309. [Google Scholar] [CrossRef]
  28. Stadler, P.; Bloschl, G.; Vogl, W.; Koschelnik, J.; Epp, M.; Lackner, M.; Oismüller, M.; Kumpan, M.; Nemeth, L.; Strauss, P.; et al. Real-time monitoring of beta-d-glucuronidase activity in sediment laden streams: A comparison of prototypes. Water Res. 2016, 101, 252–261. [Google Scholar] [CrossRef] [PubMed] [Green Version]
  29. Ender, A.; Goeppert, N.; Grimmeisen, F.; Goldscheider, N. Evaluation of β-d-glucuronidase and particle-size distribution for microbiological water quality monitoring in Northern Vietnam. Sci. Total. Environ. 2017, 580, 996–1006. [Google Scholar] [CrossRef]
  30. Rice, E.W.; Allen, M.J. Efficacy of beta-glucuronidase assay for identification of Escherichia coli by the defined-substrate technology. Appl. Environ. Microbiol. 1990, 56, 1203–1205. [Google Scholar] [CrossRef] [Green Version]
  31. Servais, P.; Prats, J.; Passerat, J.; Garcia-Armisen, T. Abundance of culturable versus viable Escherichia coli in freshwater. Can. J. Microbiol. 2009, 55, 905–909. [Google Scholar] [CrossRef]
  32. Cazals, M.; Stott, R.; Fleury, C.; Proulx, F.; Prévost, M.; Servais, P.; Dorner, S.; Burnet, J.-B. Near real-time notification of water quality impairments in recreational freshwaters using rapid online detection of β-D-glucuronidase activity as a surrogate for Escherichia coli monitoring. Sci. Total. Environ. 2020, 720, 137303. [Google Scholar] [CrossRef] [PubMed]
  33. Koschelnik, J.; Vogl, W.; Epp, M.; Lackner, M. Rapid analysis of β-D-glucuronidase activity in water using fully automated technology. In Water Resources Management VIII; WIT Press: Southamption, UK, 2015; pp. 471–481. [Google Scholar]
  34. USEPA. Method 1604: Total Coliforms and Escherichia coli in Water by Membrane Filtration Using a Simultaneous Detection Technique (MI Medium); USEPA: Washington, DC, USA, 2002. [Google Scholar]
  35. Dick, L.K.; Field, K.G. Rapid estimation of numbers of fecal Bacteroidetes by use of a quantitative PCR assay for 16s rRNA genes. Appl. Environ. Microbiol. 2004, 70, 5695–5697. [Google Scholar] [CrossRef] [PubMed] [Green Version]
  36. Ontario Ministry of the Environment Conservation and Parks. Identification of Fecal Waste Pollution Sources by Real-Time Polymerase Chain Reaction (PCR) Using Bacteroidales 16S rRNA Genetic Markers; Ontario Ministry of the Environment Conservation and Parks: Toronto, ON, Canada, 2016. [Google Scholar]
  37. Lee, D.-Y.; Weir, S.C.; Lee, H.; Trevors, J.T. Quantitative identification of fecal water pollution sources by TaqMan real-time PCR assays using Bacteroidales 16S rRNA genetic markers. Appl. Microbiol. Biotechnol. 2010, 88, 1373–1383. [Google Scholar] [CrossRef]
  38. Lee, D.-Y.; Lee, H.; Trevors, J.T.; Weir, S.C.; Thomas, J.L.; Habash, M. Characterization of sources and loadings of fecal pollutants using microbial source tracking assays in urban and rural areas of the Grand River Watershed, Southwestern Ontario. Water Res. 2014, 53, 123–131. [Google Scholar] [CrossRef]
  39. Environment Canada. Available online: https://eau.ec.gc.ca/mainmenu/historical_data_index_f.html (accessed on 27 July 2021).
  40. Sylvestre, É.; Burnet, J.-B.; Smeets, P.; Medema, G.; Prévost, M.; Dorner, S. Can routine monitoring of E. coli fully account for peak event concentrations at drinking water intakes in agricultural and urban rivers? Water Res. 2020, 170, 115369. [Google Scholar] [CrossRef] [PubMed]
  41. Huey, G.M.; Meyer, M.L. Turbidity as an indicator of water quality in diverse watersheds of the Upper Pecos River basin. Water 2010, 2, 273–284. [Google Scholar] [CrossRef]
  42. Farnleitner, A.; Ryzinska-Paier, G.; Reischer, G.; Burtscher, M.; Knetsch, S.; Kirschner, A.; Dirnböck, T.; Kuschnig, G.; Mach, R.; Sommer, R. Escherichia coli and enterococci are sensitive and reliable indicators for human, livestock and wildlife faecal pollution in alpine mountainous water resources. J. Appl. Microbiol. 2010, 109, 1599–1608. [Google Scholar] [CrossRef] [PubMed] [Green Version]
  43. Atherholt, T.B.; Lechevallier, M.W.; Norton, W.D.; Rosen, J.S. Effect of rainfall on Giardia and crypto. J. Am. Water Work. Assoc. 1998, 90, 66–80. [Google Scholar] [CrossRef]
  44. Dechesne, M.; Soyeux, E. Assessment of source water pathogen contamination. J. Water Health. 2007, 5, 39–51. [Google Scholar] [CrossRef] [PubMed] [Green Version]
  45. Kistemann, T.; Claßen, T.; Koch, C.; Dangendorf, F.; Fischeder, R.; Gebel, J.; Vacata, V.; Exner, M. Microbial load of drinking water reservoir tributaries during extreme rainfall and runoff. Appl. Environ. Microbiol. 2002, 68, 2188–2197. [Google Scholar] [CrossRef] [Green Version]
  46. Janke, R.; Murray, R.; Uber, J.; Taxon, T. Comparison of physical sampling and real-time monitoring strategies for designing a contamination warning system in a drinking water distribution system. J. Water Resour. Plan. Manag. 2006, 132, 310–313. [Google Scholar] [CrossRef]
  47. Madoux-Humery, A.S.A.; Dorner, S.S.; Sauvé, S.; Aboulfadl, K.; Galarneau, M.; Servais, P.; Prévost, M. The effects of combined sewer overflow events on riverine sources of drinking water. Water Res. 2016, 92, 218–227. [Google Scholar] [CrossRef] [PubMed]
  48. Passerat, J.; Ouattara, N.K.; Mouchel, J.-M.; Rocher, V.; Servais, P. Impact of an intense combined sewer overflow event on the microbiological water quality of the Seine River. Water Res. 2011, 45, 893–903. [Google Scholar] [CrossRef]
  49. McCarthy, D.T.; Zhang, K.; Westerlund, C.; Viklander, M.; Bertrand-Krajewski, J.-L.; Fletcher, T.D.; Deletic, A. Assessment of sampling strategies for estimation of site mean concentrations of stormwater pollutants. Water Res. 2018, 129, 297–304. [Google Scholar] [CrossRef] [PubMed]
Figure 1. Enumeration of culturable E. coli (black dots) along the GLUC activity (orange dots) pollutograph using the synchronous triggering mode at site 1. Two microbiological peak events were observed following rainfall episodes. During the synchronous mode, raw water samples were collected by an ISCO6712 autosampler triggered by hourly autonomous GLUC activity measurements in raw water. Turbidity (grey line) was measured online at the drinking water treatment plant intake. Rainfall (black histograms) and water level (blue line) are indicated at the top of the chart.
Water 13 02069 g001
Figure 2. Detection of protozoan parasites (Cryptosporidium, Giardia), E. coli and Bacteroides (BacHuman and BacBovine markers) at the GLUC activity peak using automated peak sampling triggering mode at site 2. This mode was initiated above the pre-defined GLUC activity threshold of 10 mMFU/100 mL. Before and after the GLUC activity peak (baseline activity of 2–3 mMFU.100 mL−1), sample collection was triggered remotely through the online interface of the ColiMinder using a virtual private network (VPN) certificate. The manual trigger was done remotely based on real-time observation of GLUC activity measurements on the online interface.
Water 13 02069 g002
Figure 3. Proposed targeted event-based sampling methodology for microbiological water quality and risk assessment using autonomous near real-time monitoring of GLUC activity in surface waters.
Water 13 02069 g003
Publisher’s Note: MDPI stays neutral with regard to jurisdictional claims in published maps and institutional affiliations.

