Article

Geochemistry of Dissolved Heavy Metals in Upper Reaches of the Three Gorges Reservoir of Yangtze River Watershed during the Flood Season

1
Institute of Earth Sciences, China University of Geosciences (Beijing), Beijing 100083, China
2
State Key Laboratory of Simulation and Regulation of Water Cycle in River Basin, Beijing 100083, China
3
Department of Water Ecology and Environment, China Institute of Water Resources and Hydropower Research, Beijing 100083, China
*
Author to whom correspondence should be addressed.
Water 2021, 13(15), 2078; https://doi.org/10.3390/w13152078
Submission received: 18 July 2021 / Revised: 28 July 2021 / Accepted: 29 July 2021 / Published: 30 July 2021

Abstract

:
Dissolved heavy metals (HMs), derived from natural and anthropogenic sources, are an important part of aquatic environment research and gain more international concern due to their acute toxicity. In this study, the geochemistry of dissolved HMs was analyzed in the upper Three Gorges Reservoir (TGR) of the Yangtze River (YZR) watershed to explore their distribution, status, and sources and further evaluate the water quality and HM-related risks. In total, 57 water samples were collected from the main channel and tributaries of the upper TGR. The concentrations of eight HMs, namely V, Ni, Cu, Zn, As, Mo, Cd, and Pb, were measured by ICP-MS. The mean concentrations (in μg/L) of eight HMs decreased in the order: As (1.46), V (1.44), Ni (1.40), Mo (0.94), Cu (0.86), Zn (0.63), Pb (0.03), and Cd (0.01). The concentrations of most HMs were 1.4~8.1 times higher than that in the source area of the YZR, indicating a potential anthropogenic intervention in the upper TGR. Spatially, the concentrations of V, Cu, As, and Pb along the main channel gradually decreased, while the others were relatively stable (except for Cd). The different degrees of variations in HM concentrations were also found in tributaries. According to the correlation analysis and principal component (PC) analysis, three PCs were identified and explained 75.1% of the total variances. combined with the concentrations of each metal, PC1 with high loadings of V, Ni, As, and Mo was considered as the main contribution of human inputs, PC2 (Cu and Pb) was primarily attributed to the contribution of mixed sources of human emissions and natural processes, and Zn and Cd in PC3 were controlled by natural sources. Water quality assessment suggested the good water quality (meeting the requirements for drinking purposes) with WQI values of 14.1 ± 3.4 and 11.6 ± 3.6 in the main channel and tributaries, respectively. Exposure risk assessment denoted that the health effects of selected HMs on the human body were limited (hazard index, HI < 1), but the potential risks of V and As with HI > 0.1 were non-negligible, especially for children. These findings provide scientific support for the environmental management of the upper TGR region and the metal cycle in aquatic systems.

1. Introduction

With the acceleration of economic globalization, it becomes more and more difficult to balance the excessive utilization of water resources and high-efficiency water environmental protection schemes [1,2]. Given the current status of the global hydrosphere, it is of great significance to evaluate the contamination of river ecosystems (watershed scale), which is beneficial for the arrangement of water resources [3,4,5]. Heavy metal (HM) pollution is one of the most common contamination problems in aquatic environments [6,7]. Characterized by bioaccumulation, non-biodegradability, and acute/chronic toxicity [8,9,10,11,12], HMs are harmful to the aquatic ecological environment and even threaten human health [13]. Both anthropogenic inputs (e.g., industrial/domestic wastes) and natural processes (e.g., rock weathering and soil erosion) can contribute to the riverine HMs [14,15]. Moreover, the occurrences of HMs in water bodies include dissolved loads, riverbed sedimentary loads, and suspended loads [16].
Among these three occurrences, dissolved HMs are considered to be more harmful to humans or aquatic organisms due to more potential exposure pathways [17,18]. The two main exposure routes of HMs are direct ingestion (drinking water) and dermal absorption (via skin) [19,20]. According to previous studies, chemical carcinogens resulted in 90% of cancers, and the ingestion of drinking water is a significant route of these chemicals [21]. Obviously, HM contamination in rivers has a high correlation with the human health risk. In addition, low doses of HMs can also be detrimental to the human body during long-term exposure [22]. Therefore, numerous watershed-scale studies have been carried out on dissolved HMs in rivers all over the world. The results show that there is high heterogeneity with regard to the state of heavy metal compositions and their environmental/risk effects in the aquatic environment [20,23,24,25,26]. Under the background of anthropogenic disturbances, the river becomes quite sensitive to pollution at the watershed scale, which makes the river a reflection of the impact of both human disturbance and natural processes, and it further reflects the potential risks or negative effects on life [27]. Beside this, the re-released processes of HMs from the suspended/bed sediments are also significant if the ambient conditions (e.g., pH) change. Therefore, understanding and identifying the contamination, sources, and risks of HMs in river water is important and beneficial for efficient and sustainable water resources management.
As the largest watershed in Asia, the Yangtze River watershed (YRW) originates from the Tibetan Plateau, breeds a variety of ecosystems, and provides freshwater resources for hundreds of millions of people. However, the YRW is highly sensitive to climate change and human perturbations (pollution) [21,28]. Due to the abundant river flow and appropriate natural elevation drop, YRW is an ideal place for hydropower generation. Therefore, more than 50,000 reservoirs/dams distribute throughout the YRW, such as the Three Gorges Reservoir (TGR) and Gezhouba Dam [29,30], which powerfully support the local economy. Reservoir development and other human activities (e.g., urban emission and agricultural production), have significantly changed hydrodynamic conditions (e.g., hydraulic residence time, HRT) and further affected river environmental processes and biogeochemical cycles [31,32]. For example, the water isotope-based damming effect of intensive reservoirs have not only influenced the water cycle [33], but also changed the biocommunity structure within the watershed. A long-term (>30 years) observation found that the cascade reservoir significantly increased the amount of bioavailable nutrients (mainly N and P) due to the high density of phytoplankton induced by HRT and the nitrate reduction caused by deep hypoxia (nitrate to ammonium) [34]. As another important nutrient, carbon transport and biogeochemistry are also highly controlled by reservoir-influenced hydrodynamic conditions (mainly HRT) [35]. Moreover, the studies on HMs in dissolved loads and sediments exhibited obvious spatial variations of HM concentrations in typical commissioned reservoirs from upstream to downstream [36,37]. Since 2003, the operation of impoundment of the TGR has notably changed the hydrodynamic conditions, which directly led to the alteration of HM distribution and circulation. Therefore, continuous reporting of the current status, contamination, risks, and sources of HMs in the TGR region and the reasonable analysis are necessary.
To determine the distribution, status, and sources of HMs of river water in the upper reaches of the Three Gorges Reservoir in the Yangtze River watershed, 57 river water samples were systematically collected from June to July 2020 in the first flood season after the pandemic. The aims of this study were: (1) to clarify the distribution, status, and contamination of HMs in the upper TGR area; (2) to distinguish the potential sources of HMs; (3) to evaluate water quality and HM-related risks. This study delivers basic data for better management in the upper TGR region and provides a reference for hydropower development and related eco-environmental issues in riverine systems.

2. Materials and Methods
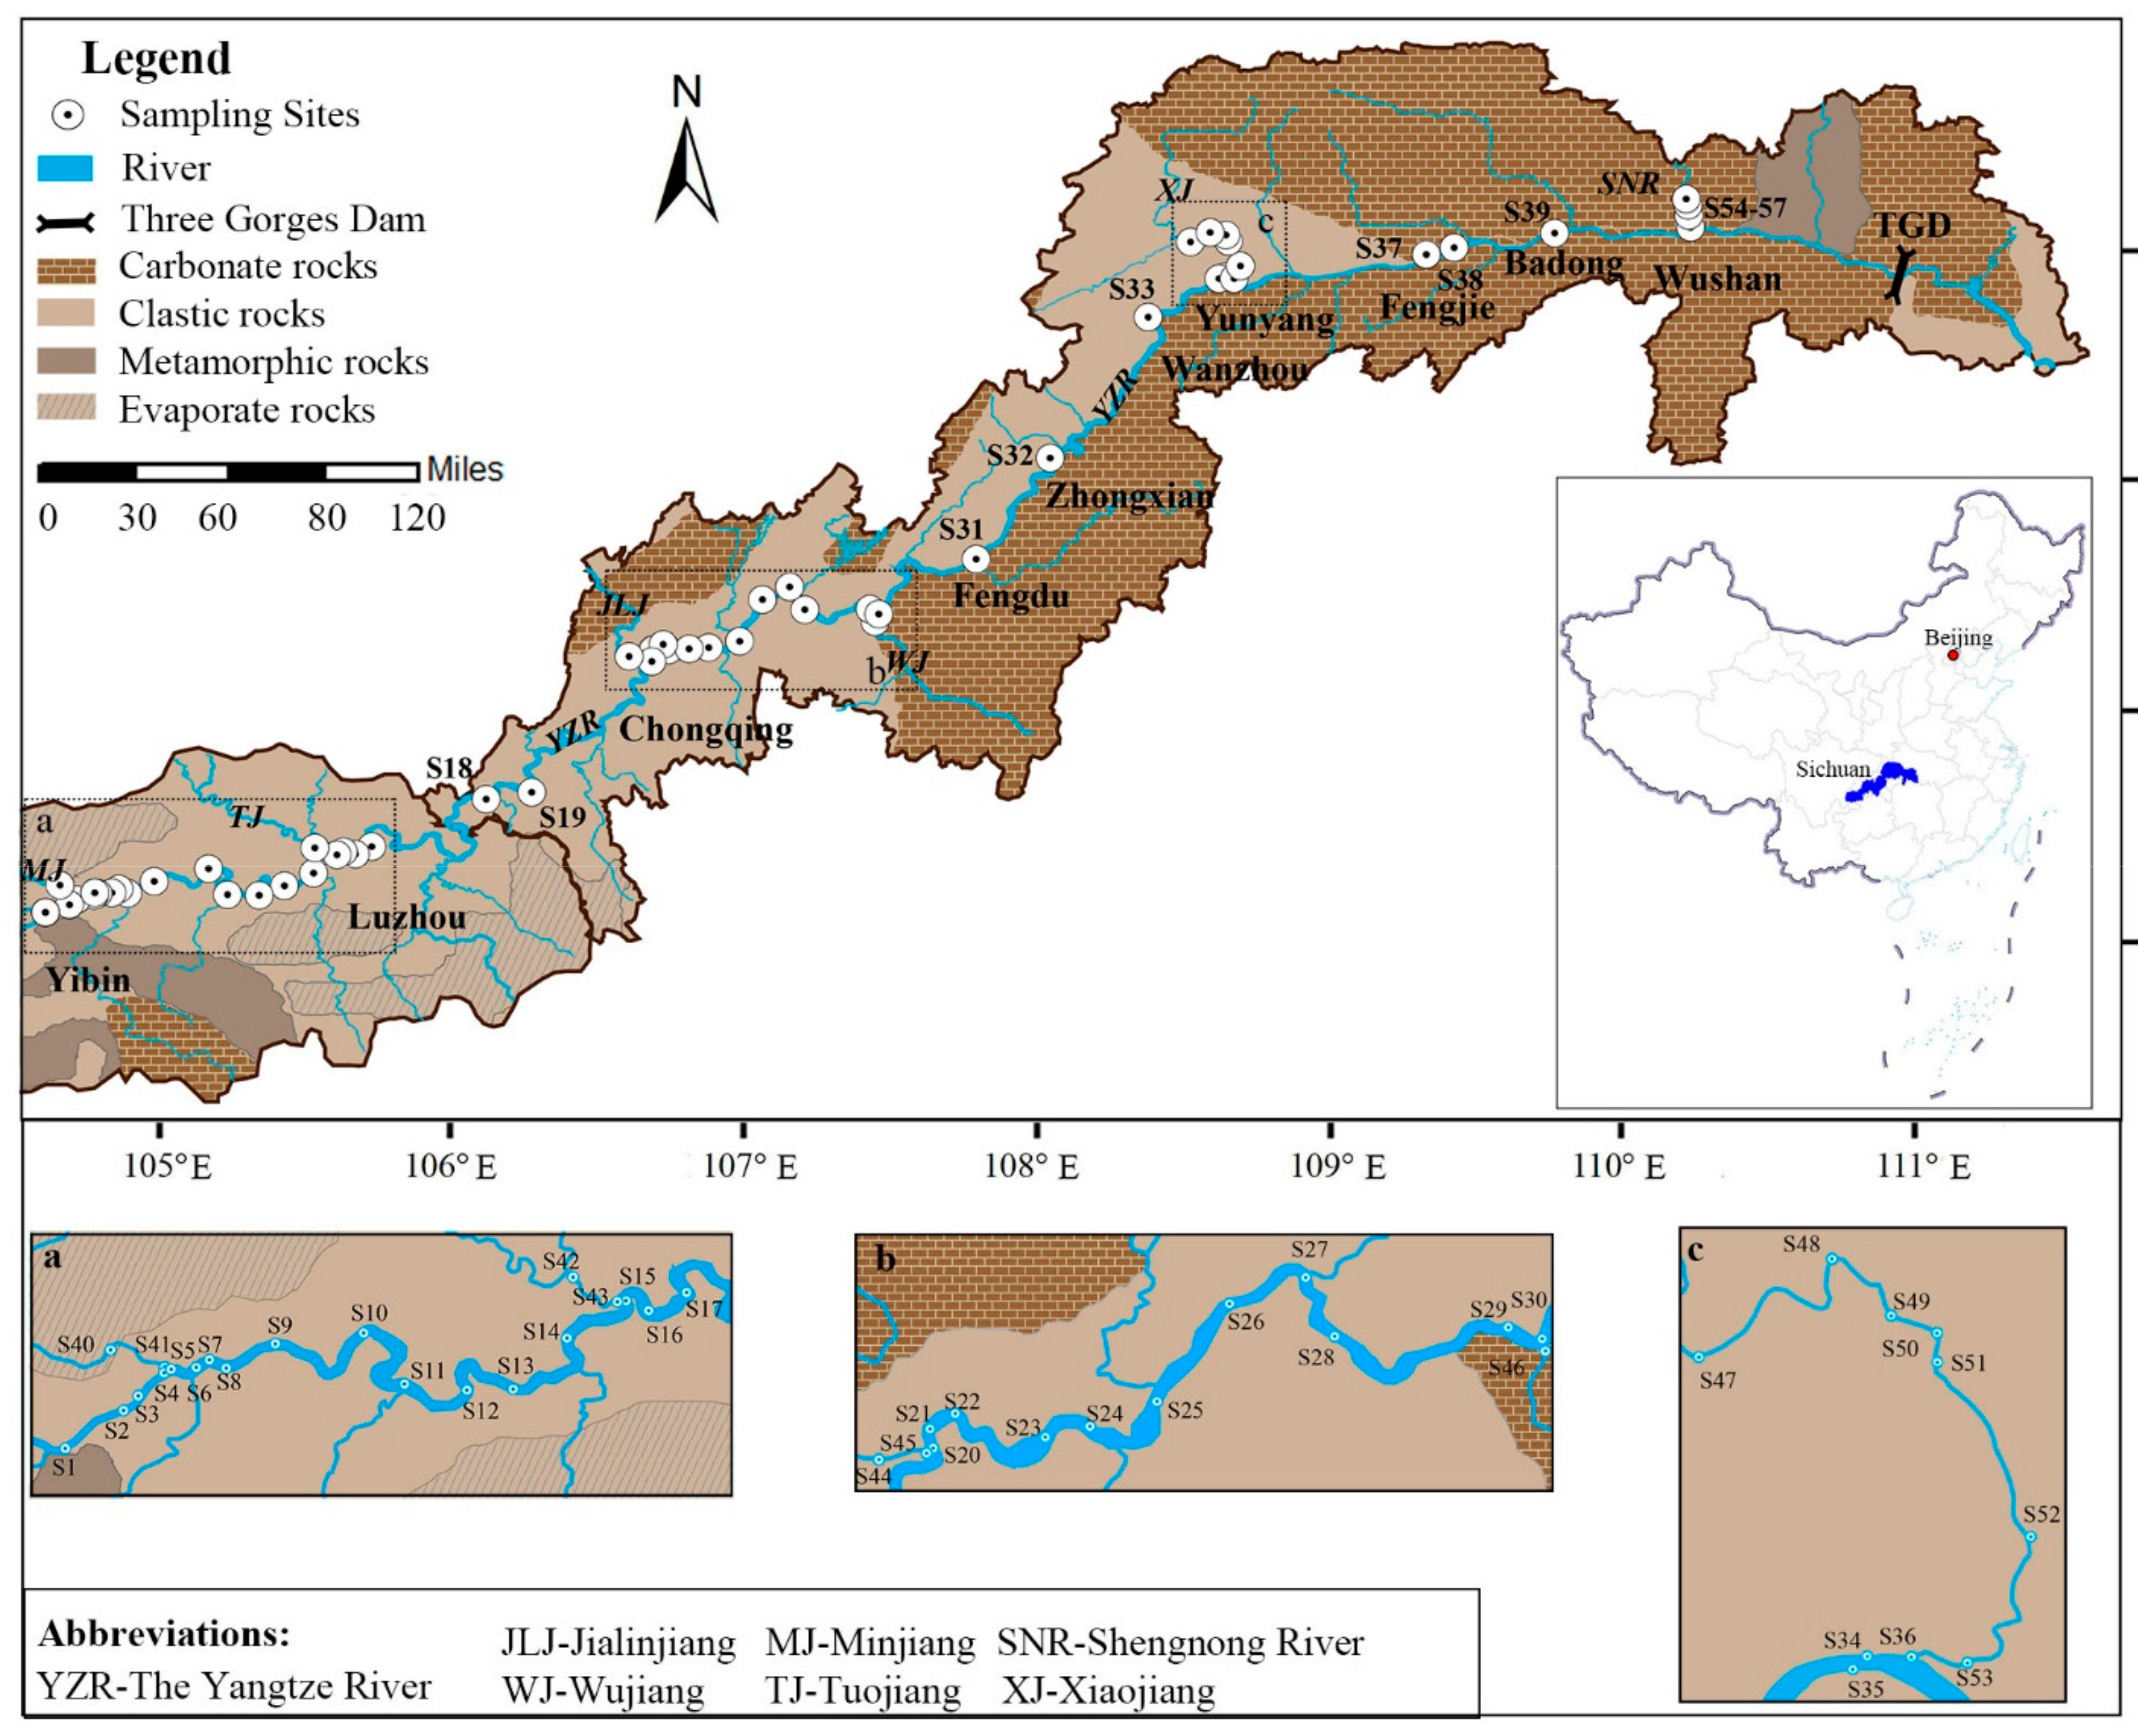
2.1. Study Region

The TGR, the largest hydropower engineering project in the world, was constructed on the Yangtze River (within Yichang City, Hubei Province) with a dam of 2.3 km length and 185 m height [38]. The upper TGR region, from Chongqing City to Yichang City (660 km) was covered by reservoir water (Figure 1) [39]. There are More than 20 cities and counties located within the upper TGR region [21], which are potential pollution sources of HMs and threats due to urbanization and industrialization. The upper TGR region is affected by a humid subtropical monsoonal climate, with the average annual air temperature of 18.9 °C and the annual rainfall from 1000 to 1800 mm [40]. The lithology of the upper TGR region is composed of carbonate rocks, clastic rocks, metamorphic rocks, and evaporate rocks (Figure 1) [40]. The land use of the upper TGR region mainly consists of water area, urban area, grassland, unused land, cropland, and forest land.

2.2. Sampling and Chemical Analysis

A systematic sampling survey was adopted from June 25 to 21 July 2020. In the survey, 57 sampling sites including the main channel (S1–S39 and S57) and tributaries (S40–S56) were selected in the upper TGR region based on natural features (e.g., lithology) and human disturbances. In total, 57 river water samples were collected at the depth of ~50 cm. Then, 0.22 µm cellulose acetate membranes were used to filter the water samples. For HMs analysis, the water samples were acidified to pH < 2 via the pre-purified nitric acid and then sealed in clean polyethylene bottles and kept in a refrigerator until measurement. Eight HMs of river water samples were selected and measured by ICP-MS (Elan DRC-e, PerkinElmer, Waltham, MA, USA), at the IGSNRR, Chinese Academy of Sciences. The analysis was conducted using replicates, standard reference materials, and procedural blanks in order to maintain the standard quality. The measured result of replicate sample suggested acceptable repeatability for HMs (the relative standard deviation was from 0.1% for Ni to 3.5% for V). The standard reference material (GSB04-1767-2004) was applied to ensure the quality assurance for HMs analysis, which presented the recovery percentage range of 98.3% (Cd) to 101.3% (V). The measurement results (all HMs) of procedural blanks were below the limit of detection, which also clearly proved the reliability of measurements during laboratory analysis.

2.3. Assessment Method

The Water quality index (WQI) is a useful method to assess the total quality of surface water and groundwater, particularly for drinking water [25,41]. The WQI is the sum of the water quality index of individual variable (WQIi) and can be calculated as Equation (1):
WQI = Σ[Wi × (Ci/Si) × 100]
where the Wi is the relative weight (Wi = wi/Σwi). Wi ranges from 1 (minimum) to 5 (maximum) based on the relative important effects of variables on human beings and the related aquatic ecological effect [42]. Ci and Si are the concentrations/limited concentrations of variables in river water and drinking water guidelines. The limit values and weights are listed in Table 1. Here, 17 variables, including 10 water quality parameters (EC, TDS, F, Cl, NO3-N, SO4, Na, K, Mg, and Ca) [40] and 7 heavy metals (excluding V due to no official limit value) were incorporated in the WQI calculation. The pH of river water was not applied in the WQI calculation due to the fact that all measured pH levels were within the allowable limit (6.5–8.5).
To evaluate the health risk of HMs in the upper TGR area, the widely used hazard quotient (HQ) and hazard index (HI) were calculated as in previous studies [41,42,43]. Two main exposure pathways, namely ingestion and dermal absorption [44], were integrated in the HQ and HI calculations. HQ is defined as the ratio between exposure dose (single pathway) and reference dose (RfD), while HI s the sum of all pathways’ HQs. If the value HQ or HI is >1, the human health risk/adverse effects are non-negligible. The calculation of HQ and HI were as follows [25] Equations (2)–(6):
ADDingestion = (Cw × IR × EF × ED)/(BW × AT)
ADDdermal = (Cw × SA × Kp × ET × EF × ED × 10−3)/(BW × AT)
HQ = ADD/RfD
RfDdermal = RfD × ABSGI
HI = ΣHQs
ADDingestion and ADDdermal are the mean daily doses by two exposure pathways. Cw, BW, IR, EF, ED, AT, SA, ET, Kp, RfD, and ABSGI are the river metal concentration, body weight of adults/children, ingestion rate, exposure frequency, exposure duration, average time, exposed skin area, exposure time, dermal permeability coefficient (in water) of metal, reference dose, and gastrointestinal absorption factor [25,45], respectively. The detailed values and units of these parameters were obtained from previous studies [25,45,46] and can be found in Table S1.

2.4. Software

The principal component and correlation analyses (PCA/CA) were carried out for statistics and potential HMs sources identification using SPSS 21.0. The detailed operation information of SPSS can be seen in [20,47]. All data were graphed using Microsoft Office 2010 and Origin 8.1.

3. Results and Discussion

3.1. HMs Concentrations and Distribution

3.1.1. HMs Concentrations

The statistical results of selected HM concentrations in the upper TGR area are displayed in Table 2. According to the Kolmogorov–Smirnov statistics test, most HM concentrations are normally distributed, suggesting that the average concentration of each HM is suitable for comparison. This is also supported by the similar mean values and median values of these HMs (Table 2). Therefore, the mean concentrations (in μg/L) of eight HMs in the upper TGR area decreased in the order: As (1.46), V (1.44), Ni (1.40), Mo (0.94), Cu (0.86), Zn (0.63), Pb (0.03), and Cd (0.01). As, V, and Ni are the three most abundant metals in the study area. All HM concentrations are in the range of the allowable concentrations of corresponding metals for drinking purposes recommend by the drinking water guidelines of China and the World Health Organization (WHO), except for V due to the lack of limit value (Table 2). Cu, Zn, As, Cd, and Pb are also of Grade I of Chinese surface water standard (Table 2), suggesting very clean water from the perspective of these metals in the upper TGR area. It is noteworthy that the maximum concentration of As (3.23 μg/L) is relatively close to the limit value of Chinese drinking water guidelines, which can be defined as a potential pollutant at the corresponding sampling site, revealing the relatively high human emissions of the local region [20], such as agriculture-derived As emission [48]. Compared to the background values of eight HMs in the source area of the YRW [49], the V and Ni concentrations in the Upper TGR area are significantly high (Table 2), i.e., 8.0 and 7.8 times higher than the background values. Moreover, the concentrations of Cu, As, and Mo are also relatively high, i.e., 1.4, 1.7, and 1.8 times the background values, revealing the potential anthropogenic inputs of these metals from the source area to the TGR. For historical comparison, we compared our results with the published data of the study area from 2007 to 2015. The Ni concentration in 2020 (1.4 μg/L) was comparable to the historical data, slightly higher than that in 2007 (1.2 μg/L) and 2012 (1.3 μg/L) [28,50]. The Pb concentration in 2020 (0.03 μg/L) significantly decreased from 2007 (0.86 μg/L) but was similar to the one in 2015 (0.04 μg/L) [28,51]. The concentrations of Cu (0.86 μg/L), Zn (0.63 μg/L), and Cd (0.01 μg/L) in 2020 also declined relative to those of Cu (1.2–10.4 μg/L), Zn (3.3–13.0 μg/L), and Cd (0.09–1.48 μg/L) during 2007–2015 [28,50,51,52]. The As concentration in 2020 (1.46 μg/L) was obviously decreased from 2007 to 2012 (2.1–7.2 μg/L), but on par with that of 2013 (1.5 μg/L) [28,50,52].

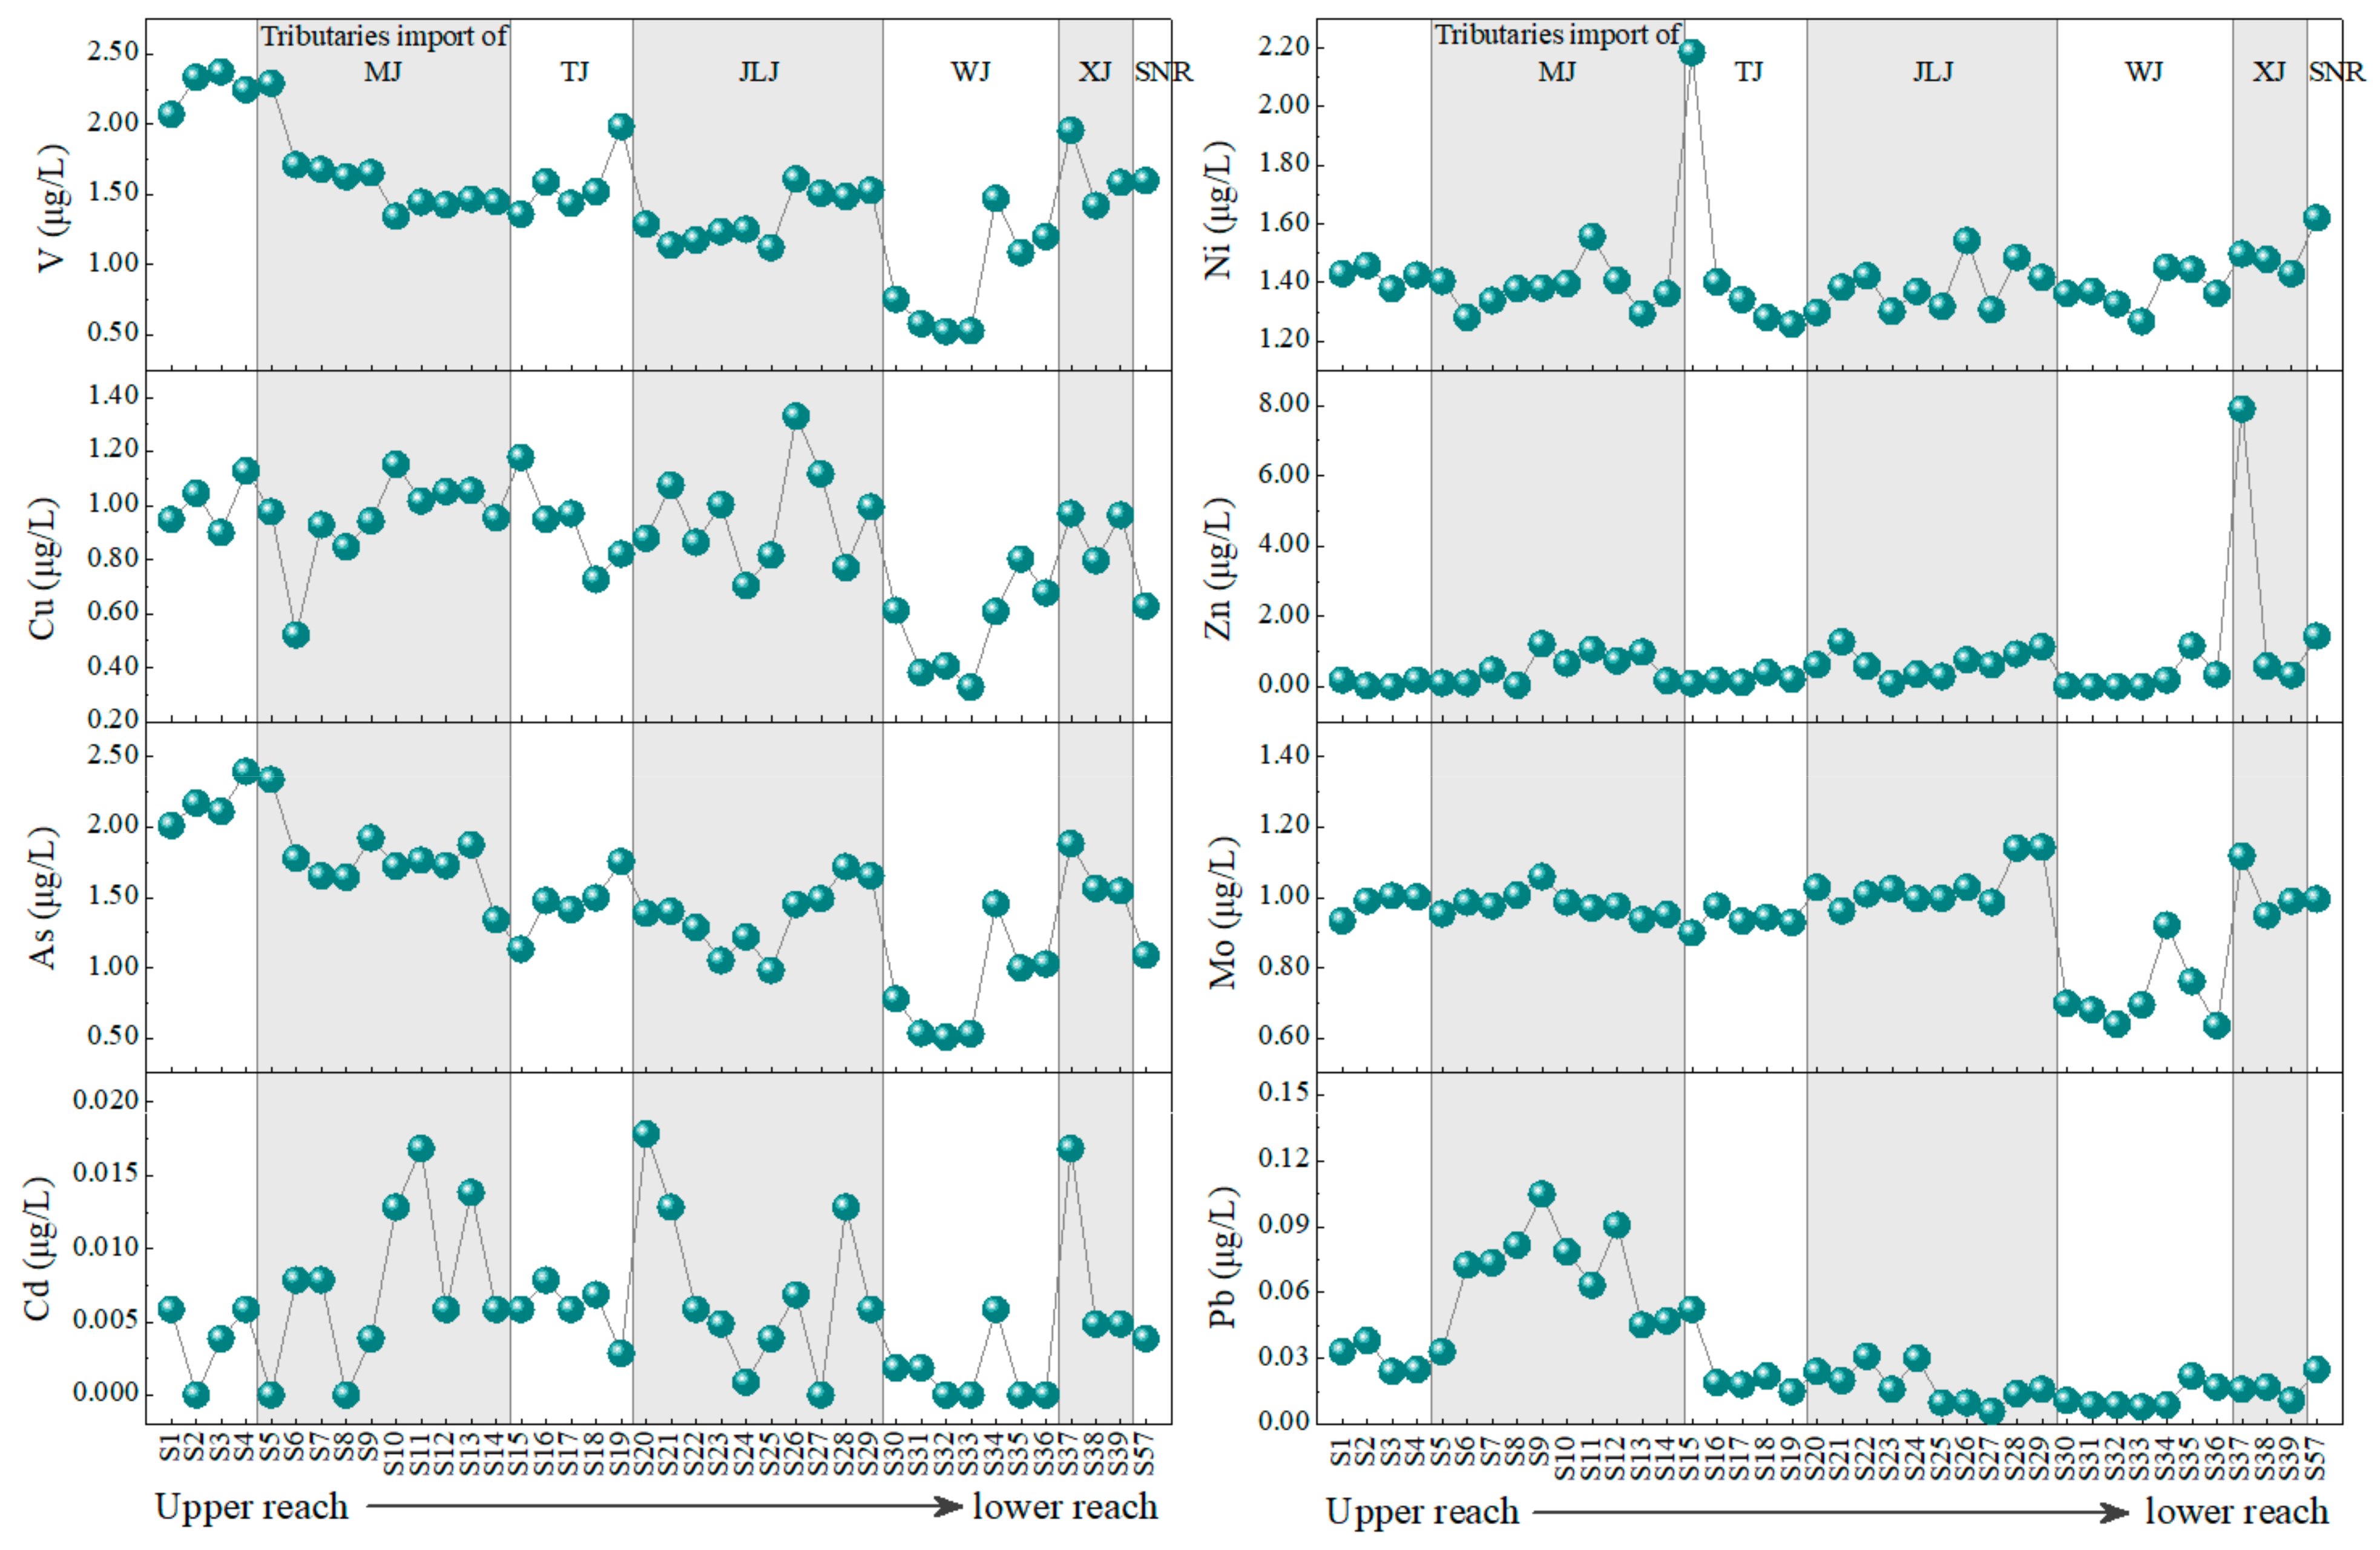
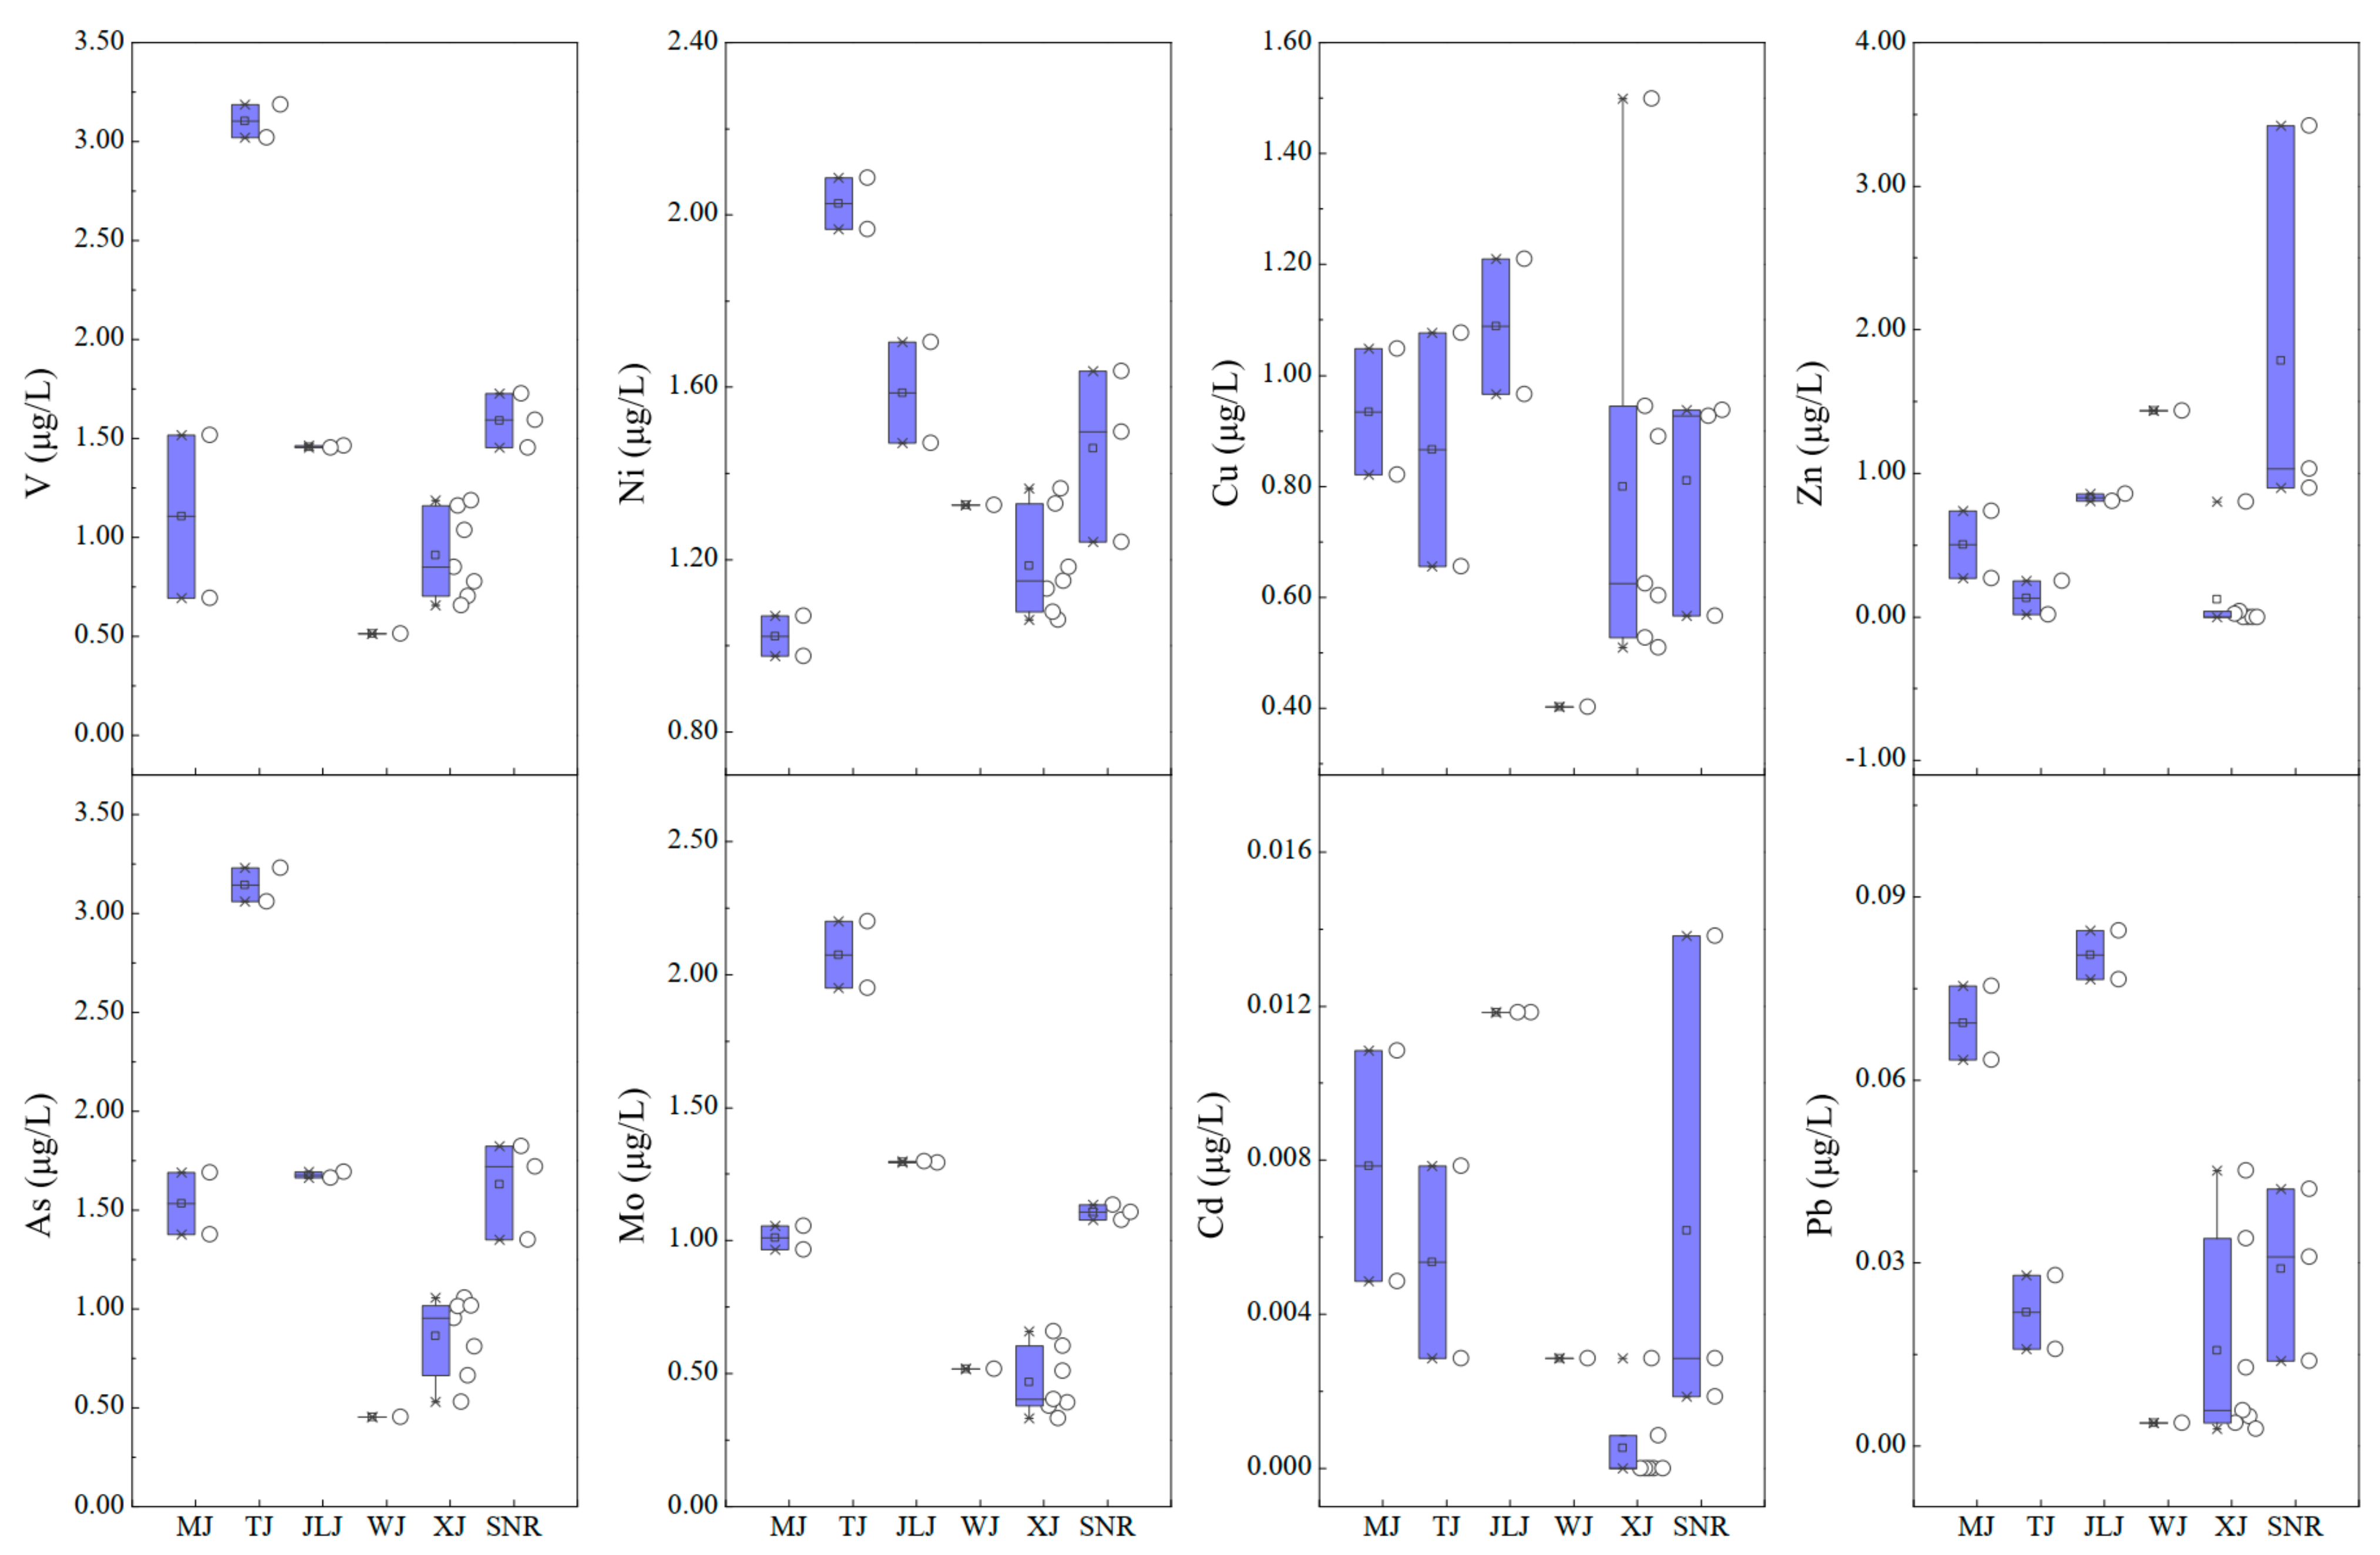
3.1.2. Spatial Distribution

Spatially, the concentrations of the HMseach HM along the main channel of the upper TGR area presented different degrees of variations (Figure 2). Overall, in the river water of the main channel, a gradually decreasing trendstrend of V, Cu, As, and Pb concentrations were observed from upstream to downstream (Figure 2), with higher concentrations in upstream sites (S1–S4, except for the highest Pb at S9). Moreover, the concentrations of V, Cu, and As increased again after the import of tributary XJ. In contrast, the concentrations of Ni and Zn were maintained at a stable level with relatively slight variations, and the highest concentrations of Ni and Zn were observed after the import of tributaries TJ and XJ, respectively. The Mo concentration was also maintained at a stable concentration level and subsequently declined to the lowest concentration after the import of tributary WJ, and then increased again after the import of tributary XJ. The Cd concentration was the most varied metal along the main channel with the highest concentration at S20 (JLJ import). The spatial distributions of the metals in six main tributaries (MJ, TJ, JLJ, WJ, XJ, and SNR) are shown in Figure 3. Compared to the average concentrations of HMs in tributaries, the highest V, Ni, As, and Mo were consistently observed in tributary TJ, indicating the potential input of these metal-related pollutants in TJ. The highest concentrations of Cu, Cd, and Pb were found in tributary JLJ, while the highest Zn concentration was exhibited at SNR. In contrast, the lowest concentrations of V, Cu, As, and Pb were displayed in tributary WJ, Ni in tributary MJ, and Zn, Mo, and Cd in tributary XJ. These results reveal the high heterogeneity of HM concentration distributions and the differences of HM characteristics in each tributary.

3.1.3. Potential Controlling Factors of Spatial Variations of HMs

The dissolved HMs in river water are affected by various factors. For river water pH, lower pH values could increase the competition between metals and hydrogen ions in binding sites and accelerate the dissolution of metal–carbonate complexes in suspended/bed sediments, which further release free metals into the river water [20,53]. In the upper TGR area, the lowest observed pH value was 7.26 (weakly alkaline water) without a significantly low pH value. Therefore, the pH values are not the main factor affecting the distribution of HM concentrations, which can also be supported by the insignificant correlation (p > 0.05) between pH values and the concentrations of individual HMs. Besides, water temperature can affect series of physicochemical processes (e.g., adsorption, formation of complexes, and ion exchange), and it resulted in the variation of dissolved heavy metal concentrations in water [23,54]. However, the significant variations generally occurred between different seasons (e.g., summer and winter). In this study, all samples were collected during the flood season (with negligible temperature variations); thus, the physicochemical process related to temperature was not the predominant factor. Moreover, the secondary tributary hydropower stations/dams in the upper TGR area have potentially changed the hydrodynamic condition, such as the hydraulic residence time (HRT) [29,32], and further caused the re-release of HMs from the suspended/bed sediments or gravels (product of soil erosion) due to the relatively long residence time [55,56,57]. Due to the lack of HRT-related studies, the secondary tributary hydropower stations/dams can only be considered as a potential explanation for the spatial variation of dissolved HMs, which may lead to the variation of concentration of some dissolved HMs in tributaries and even in the main channel.
In addition to the above-mentioned factors, source variation can be considered as the most crucial factor in the spatial distribution of dissolved HMs in river water, and it is a combination of the natural and anthropogenic sources [58,59,60]. In this study, large variations and high heterogeneity of HM concentration distributions were observed in both the main channel and tributaries (Figure 2 and Figure 3), which could be attributed to anthropogenic inputs that alter their distributions or assuage the spatial variations via such a large catchment area with different landscape setting and geologic setting (natural source) in the upper TGR area. Natural sources of HMs are soils and rock weathering [60,61,62], and the anthropogenic sources mainly include the emission of industries, agriculture, and fossil fuel combustion [25,41,63], as discussed below.

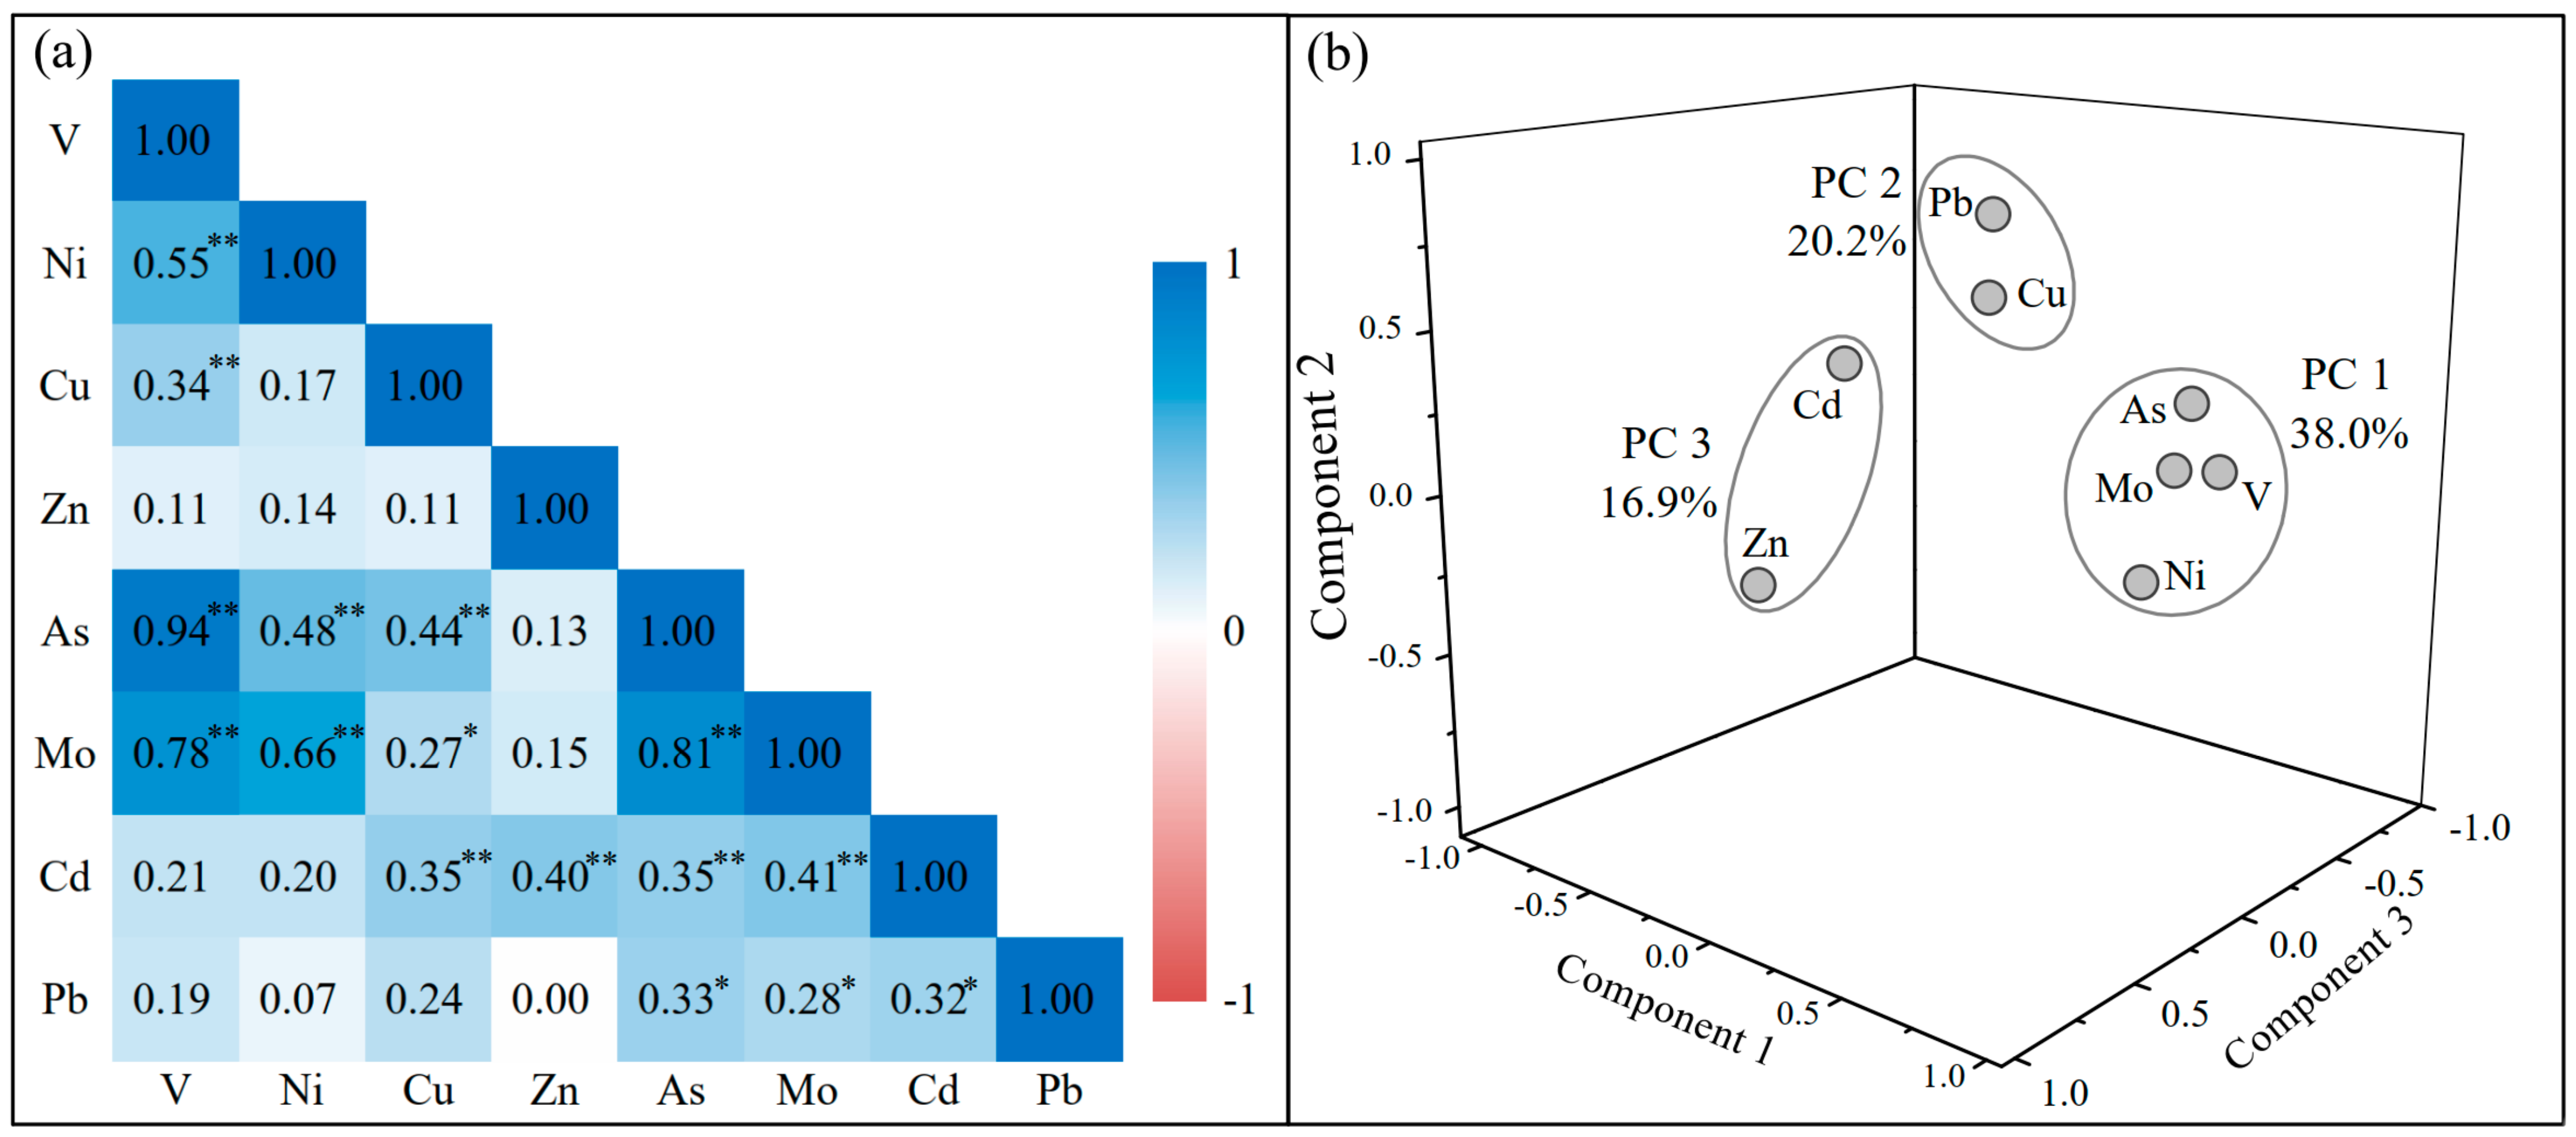
3.2. Sources Identification of HMs

According to the overall coherence of the dataset, the correlation analysis could be applied to explore the relationships between different variables [64]. Here, the correlation matrix was calculated to distinguish associations among the eight HMs of river water in the upper TGR area (Figure 4a). Significant positive correlations (p < 0.01) were found between the V and Ni (R = 0.55), As (R = 0.0.94), and Mo (R = 0.78); Ni and Mo (R = 0.66); As and Mo (R = 0.81). Generally, the dissolved HMs with high correlation coefficients presented similar transport processes, hydrochemical behaviors, and sources [25]. Therefore, V, Ni, As, and Mo are derived from the certain co-emission sources and discharged into the river through similar chemical processes. Moreover, the moderate positive correlations were observed between Cu and V (R = 0.34), As (R = 0.44), Mo (R = 0.27), and Cd (R = 0.35); Zn and Cd (R = 0.40); Pb and As (R = 0.33), Mo (R = 0.28), and Cd (R = 0.32) (Figure 4a), indicating the interaction effect (e.g., mixing processes) of their potential co-origins and the strong spatial heterogeneity of these HMs sources. The relatively low and insignificant correlation coefficients between the pairs of some HMs (e.g., As and Zn; Figure 4a) revealed these HMs may have completely different sources.
PCA was employed to further identify the HMs associations and their potential sources. three principal components (PC) with eigenvalues exceeding 1 were identified, which can totally account for 75.1% of the total variance. The PCA results are plotted in Figure 4b and listed in Table 3. most of the HMs showed a strong loading in their corresponding PC (loading value exceed 0.75 [65]). The first PC accounted for 38.0% of total variance with the significant loading of V (0.92), Ni (0.78), As (0.86), and Mo (0.88). The second PC explained 20.2% of total variance and was mainly contributed by Cu and Pb with high loadings of 0.63 and 0.83, respectively. The third PC including Zn (0.91) and Cd (0.67) accounted for 16.9% of total variance. However, the total PC loadings (75.1%) were slightly lower than those in previous studies, such as 86.4% and 79.3% PC loadings for 14 HMs and 13 HMs in the Dan River and Huaihe River, respectively [25,41]. The significance of KMO and Bartlett’s sphericity test was less than 0.001, indicating the results of PCA were reliable. As mentioned in the correlation analysis, four HMs (V, Ni, As, and Mo) with strong positive loadings in PC1 may from the same sources; combined with the consistently high concentrations (0.94–1.46 μg/L on average, Table 2), we concluded that PC1 is mainly contributed by human inputs in the upper TGR. For example, Ni-containing pollutants were widely distributed in the wastewater of metal-processing dominated industries [63]; coal industry and agricultural activities were the main human sources of dissolved Mo in rivers [66]; As-containing pollutants were mainly derived from agricultural activities (e.g., overuse of fertilizers, pesticides, and herbicides) [48]. In contrast, Zn and Cd in PC3 were weakly correlated to HMs in PC3 (As, Mo, V, and Ni), revealing significantly different sources of HMs in PC1 and PC3. Moreover, the concentrations of Zn and Cd were relatively low (with the average concentrations lower than the background value of the source area of the YRW [49], Table 2); hence, we infer that PC3 is attributed to the contribution of natural sources (e.g., rock weathering). In addition, regarding Cu and Pb in PC2, although Cu could be derived from industrial activities and Pb could come from fossil fuel combustion [63,67], given the moderate positive correlation between these two HMs and other HMs, as well as the moderate concentration of Cu, we attribute Cu and Pb to mixed origins of human emissions and natural processes. In summary, human emission sources controlled or affected most of the HMs in the upper TGR area.

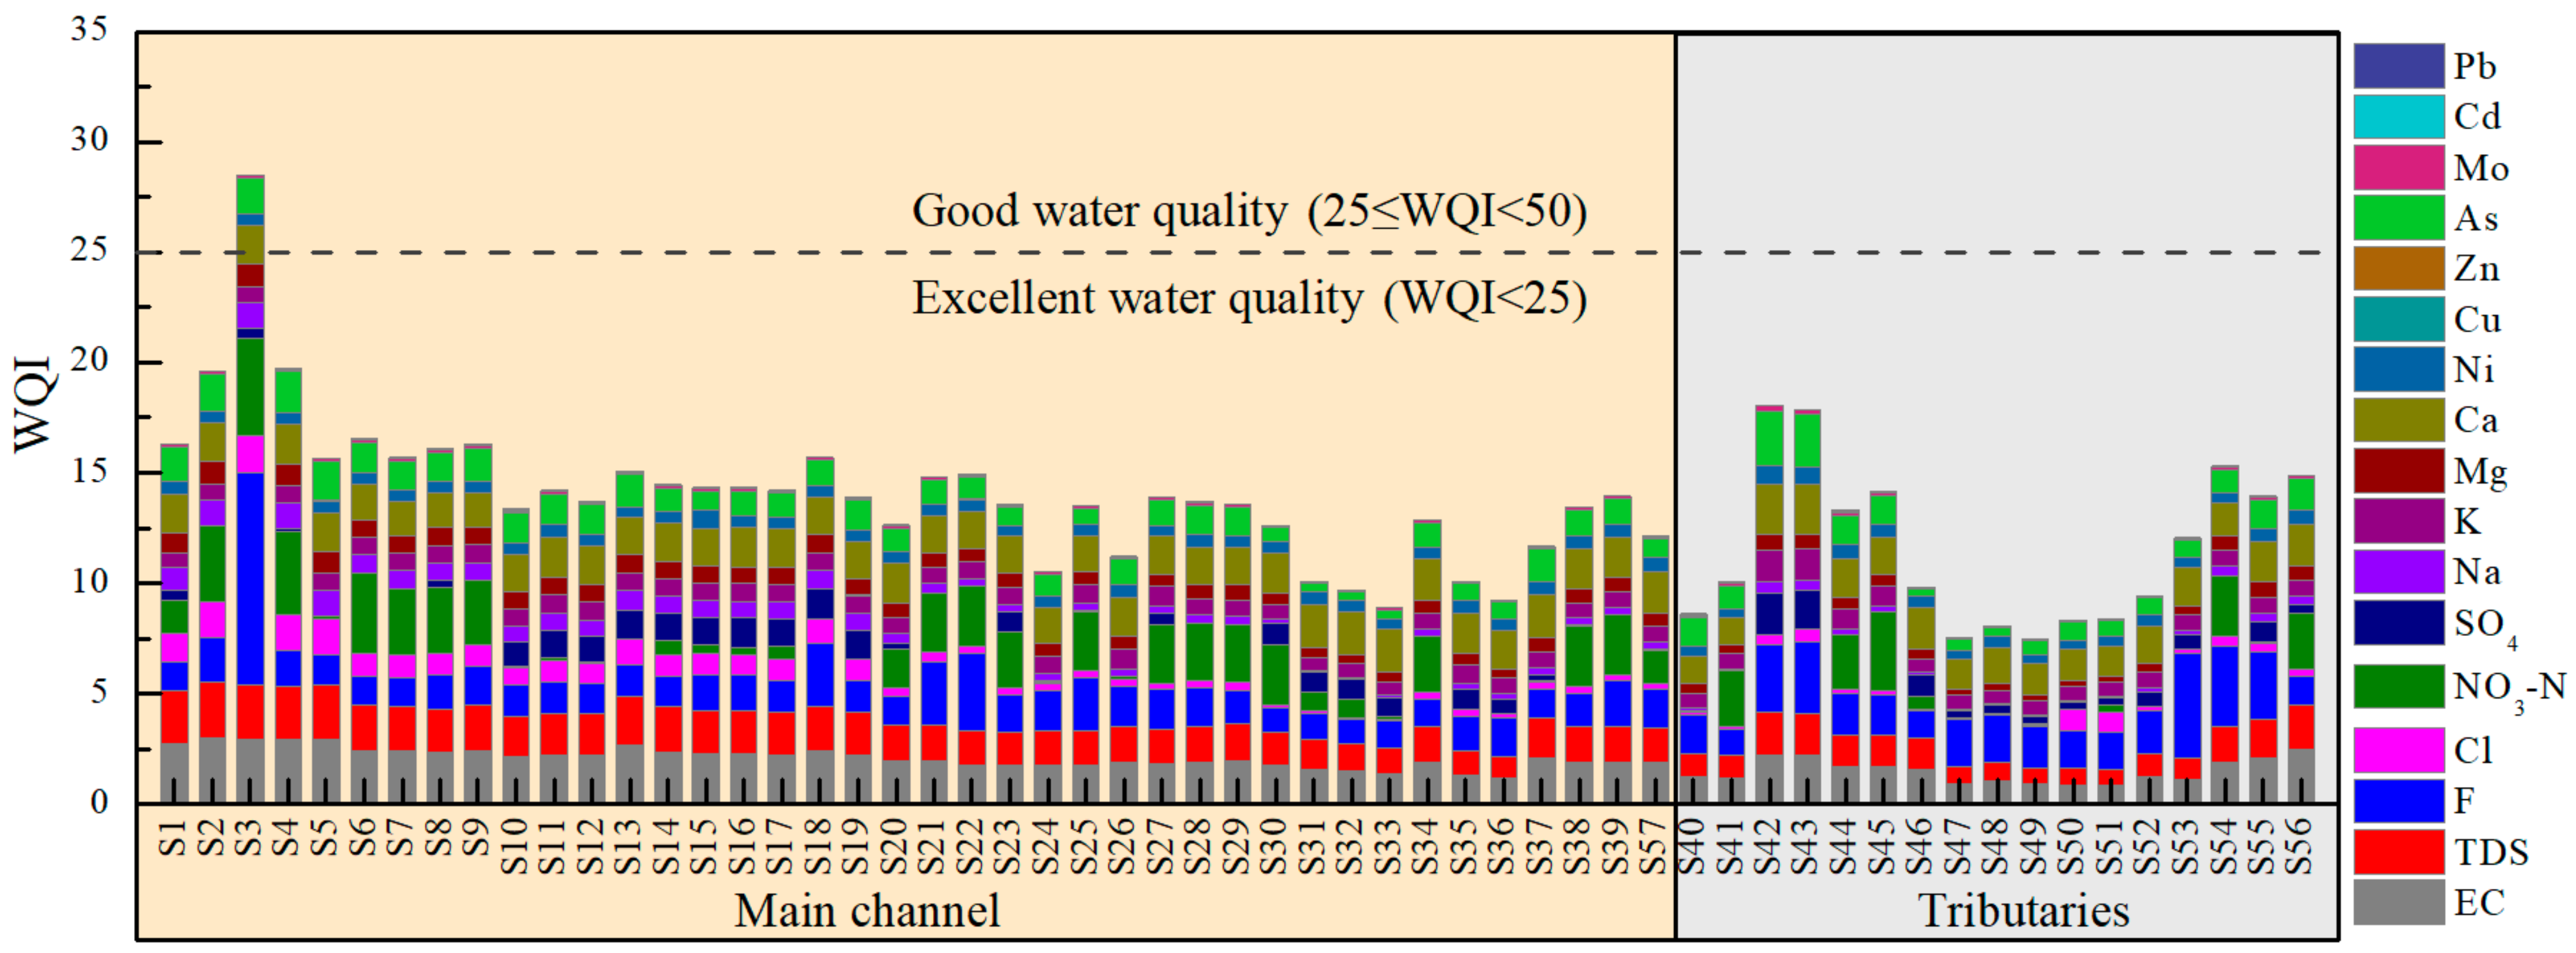
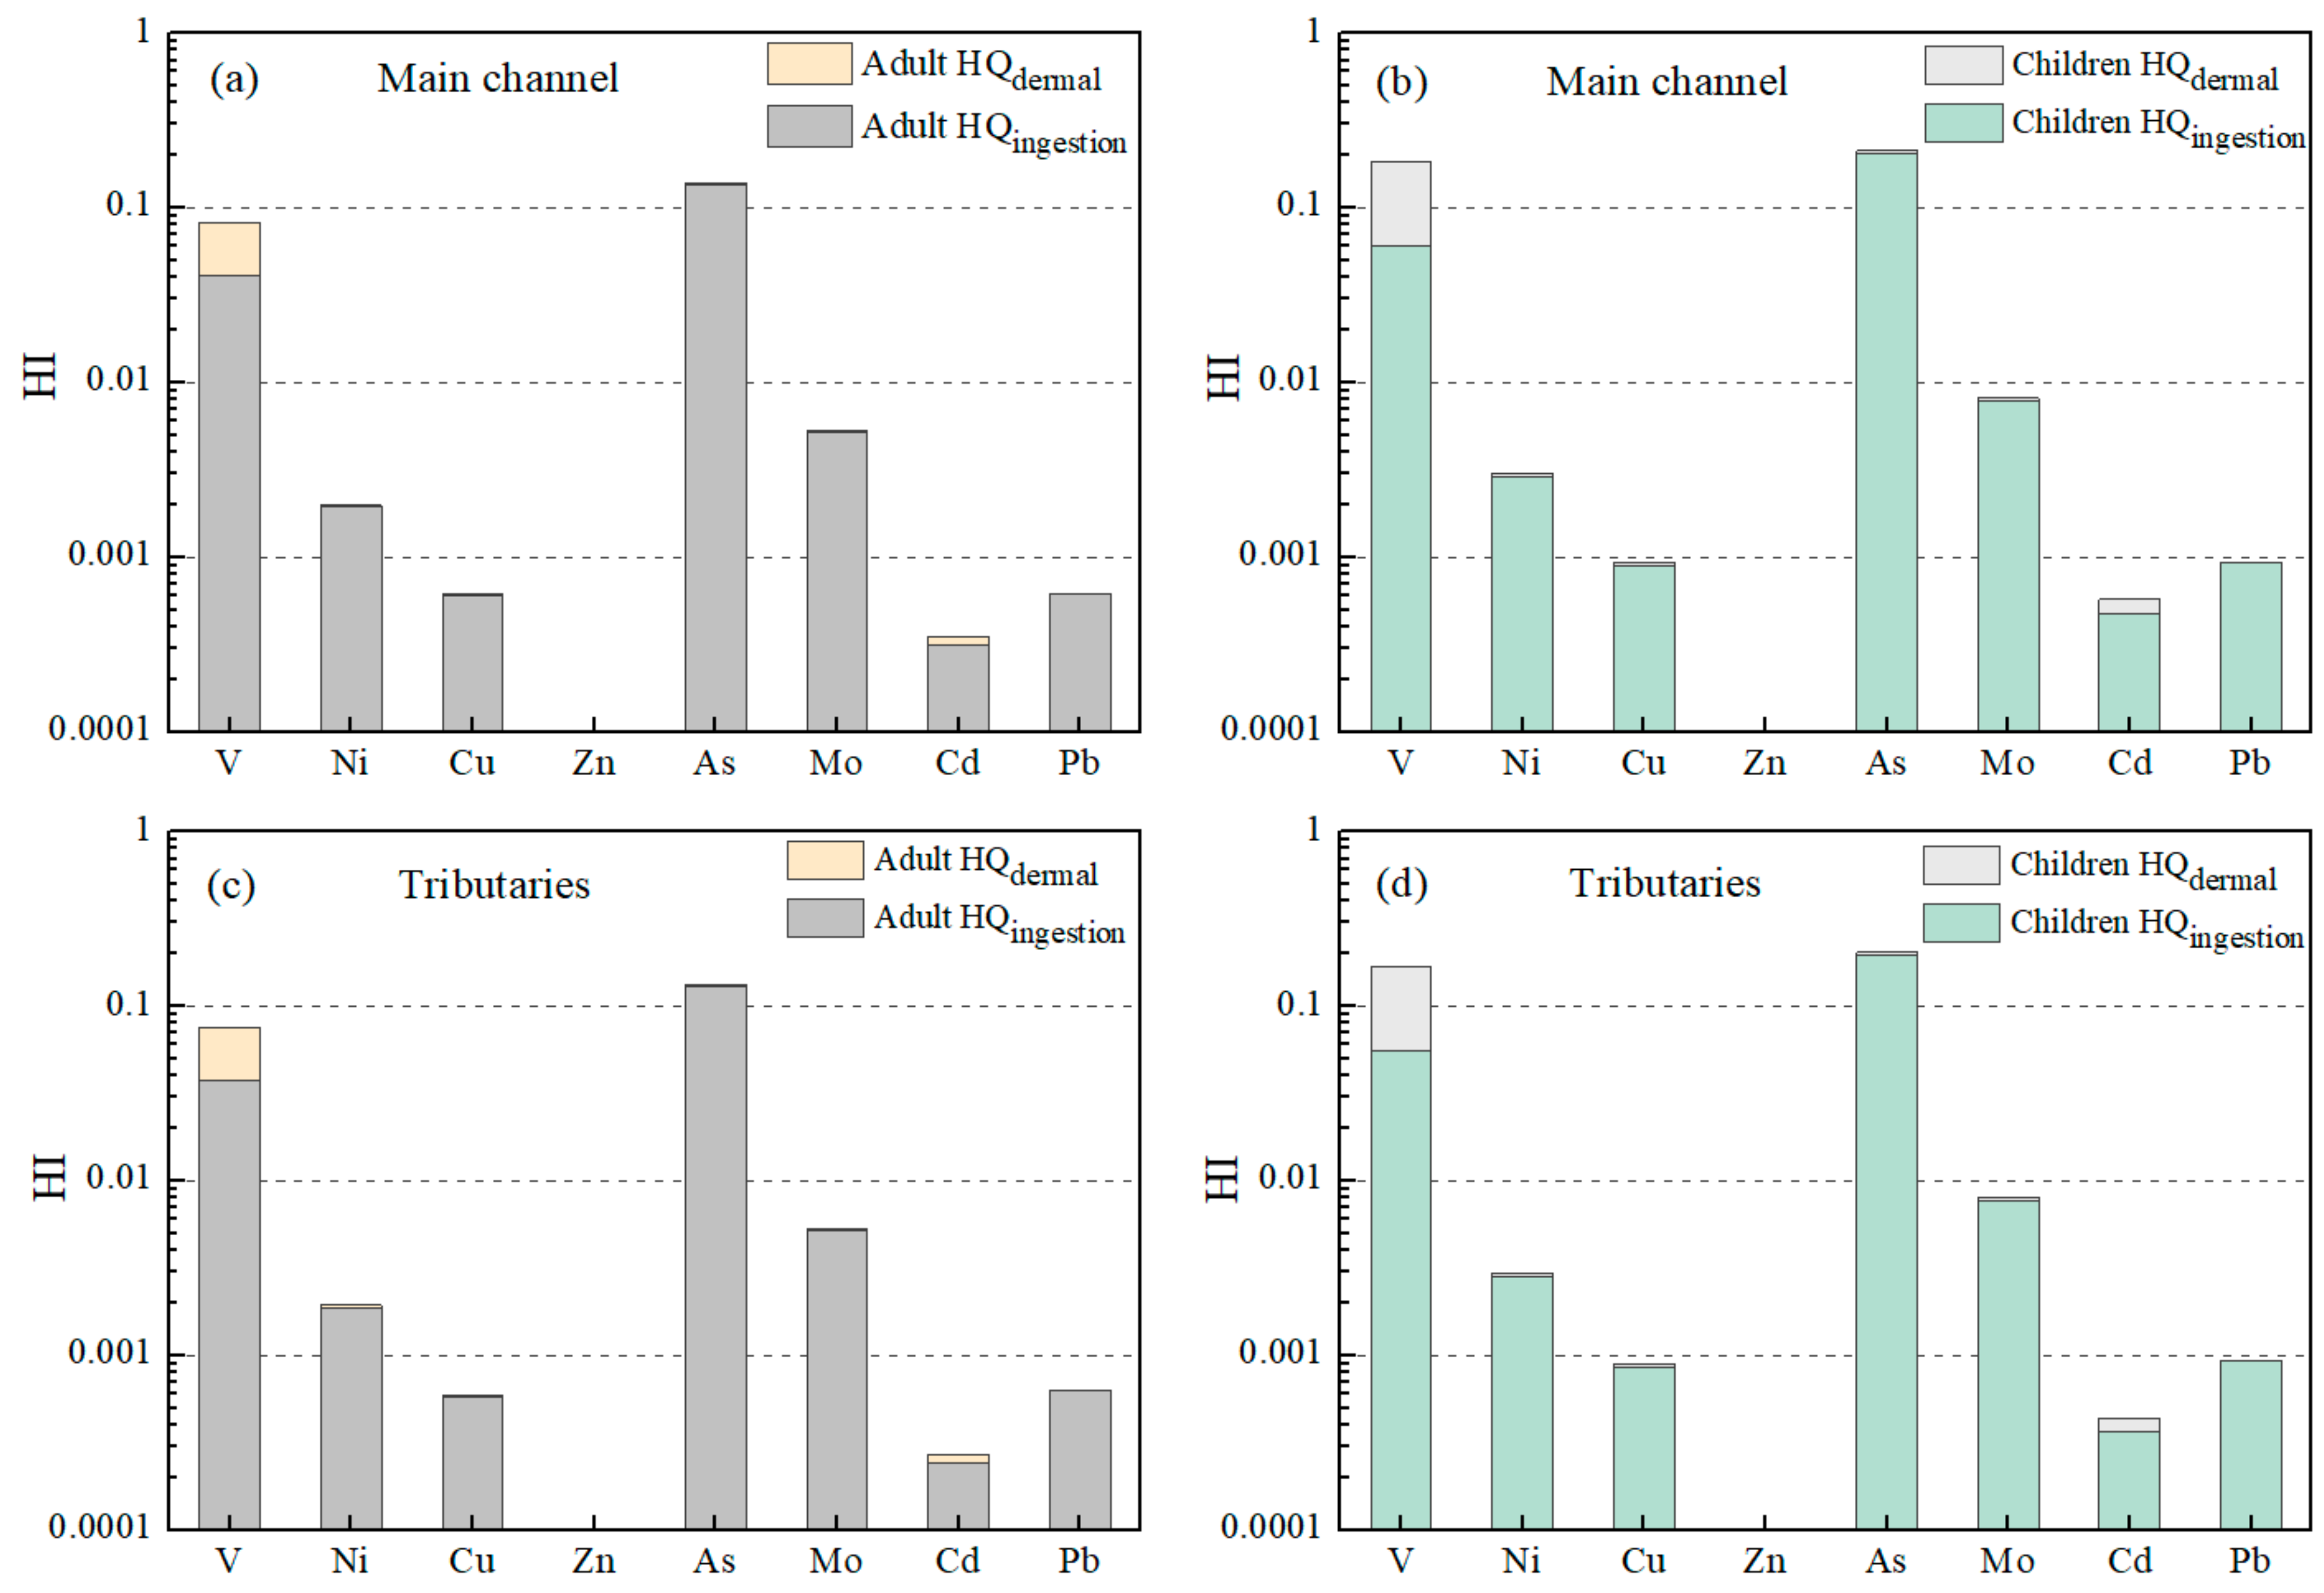
3.3. Assessment of Water Quality and Health Risk

The WQI of different sampling sites in the study area was calculated, as plotted in Figure 5. The average WQI value of the whole upper TGR area was 13.4 ± 3.6, and the site average values of WQI in the main channel and tributaries of upper TGR area were 14.1 ± 3.4 and 11.6 ± 3.6, respectively, indicating a better water quality of tributaries. According to the result of each site, all the sampling sites had excellent water quality (WQI < 25, Figure 5) except for site S3, which presented a WQI that exceeded 25 (good water quality). For the main channel, the WQI values decreased overall from upper to lower reaches with a WQI range from 8.9 (S33) to 28.5 (S3). The WQI values of tributaries also showed a variation from 7.5 to 18.1. The lowest WQI value was observed in tributary XJ (S49), while the highest was found in tributary TJ (S42). These results reveal that the water quality of the main channel was improved with the influx of tributaries (relatively better water quality) due to the potential dilution effects and the assuaging effect of varying landscape setting [20,68]. This dilution can also be supported by the decrease of TDS from the upper (400 mg/L) to lower reaches (200 mg/L) that reported previously [40]. It is noteworthy that the WQI was mainly contributed by the water quality parameters of EC, TDS, F, NO3-N, and Ca (with the site average WQIi value of 1.40–1.97), while the contribution of heavy metals was relatively low, since only As showed an average WQIi value of 1.13 (Table 1). Cl was also an important contributor of the WQI in the main channel (e.g., S1–S19, Figure 5), and the contribution of SO4 to the WQI was also non-negligible at S10–S19, reflecting the source variation characteristics of these components (e.g., the human emission intensity and differences in rock weathering) [40,69]. Compared with large rivers of China and the polluted urban rivers, such as Zhujiang River (WQI = 1.3–43.9) [20], Langcangjiang River (WQI = 1–25) [37], and Terme River (WQI = 37.3–86.0) [42], the assessed results in the upper TGR area during the study period were pretty good. In summary, the river water in the upper TGR area met the requirements for drinking purposes based on the assessment of main water quality parameters and heavy metals, but it is still necessary to pay more attention to As.
The average concentration-based HQ and HI values of the HMs for adults and children in the main channel and tributaries in the upper TGR area were calculated, as plotted in Figure 6. The calculated HQingestion, HQdermal, and HI values of all HMs for adults and children were less than 1, revealing that the investigated metals exposure via ingestion and dermal absorption were all below the harmful level. the health effects of the studied HMs on human beings are limited. Among the calculated results, the HQingestion values of most metals (except V) contributed more to HI than HQdermal values (Figure 6). It is noteworthy that the calculated HQ and HI values of all metals for children were greater than those for adults, indicating that a higher potential exposure risk of HMs for children existed, which was similar to the calculated results in other Chinese large rivers, such as Zhujiang River and Lancangjiang River [20,37]. There were no obvious differences between the HI and HQ values of the main channel and tributaries due the similar average HM concentrations. Moreover, a previous study suggested that the potentially risky effects may also occur if HI for children is >0.1 [44]. The HI values of V and As for children exceeded 0.1 in this study (Figure 6b,d); therefore, the risk of these two metals were not completely negligible, e.g., the nephrotoxic and hepatotoxic properties and reproductive system toxicity of V [70] and the nervous system toxicity of As [45]. Thus, regular observation and appropriate measures need to be carried out to maintain the water quality in the upper TGR area and further provide better support of water resources for the development of the within-watershed economy.

4. Conclusions

The concentrations of heavy metals of river water in the upper TGR area exhibited significant spatial heterogeneity in both the main channel and tributaries. As, V, and Ni were the most abundant metals with the mean concentrations exceeding 1.40 μg/L, which were about eight times higher than the background values of the source area of the Yangtze River. All heavy metal concentrations were within the allowable values of drinking water guidelines. The water quality and health risk assessment indicated a good water quality and low risk level in the study area. Source identification suggested that V, Ni, As, and Mo were mainly contributed by anthropogenic inputs, Cu and Pb were primarily attributed to the contribution of mixed origins of human emissions and natural processes, and Zn and Cd were mainly controlled by the natural sources. Overall, good water quality was observed in the upper TGR area during the flood season, but the estimation of HM fluxes and the seasonal variations of HMs are still unclear. Moreover, the understanding of water/particle interaction of HMs (in dissolved and suspended loads) is also limited. Thus, high-frequency sampling (seasonally or monthly sampling) of both water and suspended load samples is a future concern.

Supplementary Materials

The following are available online at https://www.mdpi.com/article/10.3390/w13152078/s1, Table S1: The detailed values and units of the parameters for the calculation of hazard quotient (HQ) and hazard index (HI).

Author Contributions

Conceptualization, J.Z. and G.H.; Data curation, J.Z. and G.H.; Formal analysis, J.Z. and G.H.; Funding acquisition, G.H., M.H. and Y.W.; Investigation, M.H. and Y.W.; Methodology, J.Z. and G.H.; Project administration, G.H.; Resources, G.H.; Software, J.Z. and G.H.; Supervision, G.H.; Validation, J.Z. and G.H.; Visualization, J.Z., G.H. and D.W.; Writing-original draft, J.Z., G.H., J.L. and S.Z.; Writing-review & editing, J.Z. and G.H. All authors have read and agreed to the published version of the manuscript.

Funding

This research was funded by the National Natural Science Foundation of China (No.U1802241 and No.41325010) and the State Key Laboratory of Simulation and Regulation of Water Cycle in River Basin (SKL2020TS07).

Institutional Review Board Statement

Not applicable.

Informed Consent Statement

Not applicable.

Data Availability Statement

The data presented in this study are available on request from the corresponding author.

Acknowledgments

The authors gratefully acknowledge the group members of Mingming Hu for their assistance with field sampling.

Conflicts of Interest

The authors declare no conflict of interest.

References

  1. Gao, J.; Li, C.; Zhao, P.; Zhang, H.; Mao, G.; Wang, Y. Insights into water-energy cobenefits and trade-offs in water resource management. J. Clean. Prod. 2019, 213, 1188–1203. [Google Scholar] [CrossRef]
  2. Wollheim, W.M.; Bernal, S.; Burns, D.A.; Czuba, J.A.; Driscoll, C.T.; Hansen, A.T.; Hensley, R.T.; Hosen, J.D.; Inamdar, S.; Kaushal, S.S.; et al. River network saturation concept: Factors influencing the balance of biogeochemical supply and demand of river networks. Biogeochemistry 2018, 141, 503–521. [Google Scholar] [CrossRef]
  3. Kamyab, H.; Din, M.F.M.; Ghoshal, S.K.; Lee, C.T.; Keyvanfar, A.; Bavafa, A.A.; Rezania, S.; Lim, J.S. Chlorella Pyrenoidosa Mediated Lipid Production Using Malaysian Agricultural Wastewater: Effects of Photon and Carbon. Waste Biomass Valoriz. 2016, 7, 779–788. [Google Scholar] [CrossRef]
  4. Cai, J.; Varis, O.; Yin, H. China’s water resources vulnerability: A spatio-temporal analysis during 2003–2013. J. Clean. Prod. 2017, 142, 2901–2910. [Google Scholar] [CrossRef]
  5. Liu, J.; Han, G. Tracing Riverine Particulate Black Carbon Sources in Xijiang River Basin: Insight from Stable Isotopic Composition and Bayesian Mixing Model. Water Res. 2021, 194, 116932. [Google Scholar] [CrossRef] [PubMed]
  6. Xu, S.; Lang, Y.; Zhong, J.; Xiao, M.; Ding, H. Coupled controls of climate, lithology and land use on dissolved trace elements in a karst river system. J. Hydrol. 2020, 591, 125328. [Google Scholar] [CrossRef]
  7. Varol, M. Environmental, ecological and health risks of trace metals in sediments of a large reservoir on the Euphrates River (Turkey). Environ. Res. 2020, 187, 109664. [Google Scholar] [CrossRef]
  8. Zhang, J.; Yang, R.; Li, Y.C.; Peng, Y.; Wen, X.; Ni, X. Distribution, accumulation, and potential risks of heavy metals in soil and tea leaves from geologically different plantations. Ecotoxicol. Environ. Saf. 2020, 195, 110475. [Google Scholar] [CrossRef]
  9. Zeng, J.; Han, G. Preliminary copper isotope study on particulate matter in Zhujiang River, southwest China: Application for source identification. Ecotoxicol. Environ. Saf. 2020, 198, 110663. [Google Scholar] [CrossRef]
  10. Chen, L.; Liu, J.-R.; Hu, W.-F.; Gao, J.; Yang, J.-Y. Vanadium in soil-plant system: Source, fate, toxicity, and bioremediation. J. Hazard. Mater. 2021, 405, 124200. [Google Scholar] [CrossRef]
  11. Wang, J.; Wang, L.; Wang, Y.; Tsang, D.C.W.; Yang, X.; Beiyuan, J.; Yin, M.; Xiao, T.; Jiang, Y.; Lin, W.; et al. Emerging risks of toxic metal(loid)s in soil-vegetables influenced by steel-making activities and isotopic source apportionment. Environ. Int. 2021, 146, 106207. [Google Scholar] [CrossRef]
  12. Chen, L.; Liu, J.; Zhang, W.; Zhou, J.; Luo, D.; Li, Z. Uranium (U) source, speciation, uptake, toxicity and bioremediation strategies in soil-plant system: A review. J. Hazard. Mater. 2021, 413, 125319. [Google Scholar] [CrossRef] [PubMed]
  13. Zeng, J.; Han, G. Tracing zinc sources with Zn isotope of fluvial suspended particulate matter in Zhujiang River, southwest China. Ecol. Indic. 2020, 118, 106723. [Google Scholar] [CrossRef]
  14. Visser, A.; Kroes, J.; van Vliet, M.T.H.; Blenkinsop, S.; Fowler, H.J.; Broers, H.P. Climate change impacts on the leaching of a heavy metal contamination in a small lowland catchment. J. Contam. Hydrol. 2012, 127, 47–64. [Google Scholar] [CrossRef]
  15. Viers, J.; Dupré, B.; Gaillardet, J. Chemical composition of suspended sediments in World Rivers: New insights from a new database. Sci. Total Environ. 2009, 407, 853–868. [Google Scholar] [CrossRef]
  16. Islam, M.S.; Ahmed, M.K.; Raknuzzaman, M.; Habibullah-Al-Mamun, M.; Islam, M.K. Heavy metal pollution in surface water and sediment: A preliminary assessment of an urban river in a developing country. Ecol. Indic. 2015, 48, 282–291. [Google Scholar] [CrossRef]
  17. Zhang, N.; Zang, S.; Sun, Q. Health risk assessment of heavy metals in the water environment of Zhalong Wetland, China. Ecotoxicology 2014, 23, 518–526. [Google Scholar] [CrossRef] [PubMed]
  18. Zeng, J.; Han, G.; Wu, Q.; Tang, Y. Heavy Metals in Suspended Particulate Matter of the Zhujiang River, Southwest China: Contents, Sources, and Health Risks. Int. J. Environ. Res. Public Health 2019, 16, 1843. [Google Scholar] [CrossRef]
  19. Liang, B.; Han, G.; Liu, M.; Yang, K.; Li, X.; Liu, J. Source Identification and Water-Quality Assessment of Dissolved Heavy Metals in the Jiulongjiang River, Southeast China. J. Coast. Res. 2020, 36, 403–410. [Google Scholar] [CrossRef]
  20. Zeng, J.; Han, G.; Wu, Q.; Tang, Y. Geochemical characteristics of dissolved heavy metals in Zhujiang River, Southwest China: Spatial-temporal distribution, source, export flux estimation, and a water quality assessment. PeerJ 2019, 7, e6578. [Google Scholar] [CrossRef]
  21. Zhao, L.; Gong, D.; Zhao, W.; Lin, L.; Yang, W.; Guo, W.; Tang, X.; Li, Q. Spatial-temporal distribution characteristics and health risk assessment of heavy metals in surface water of the Three Gorges Reservoir, China. Sci. Total Environ. 2020, 704, 134883. [Google Scholar] [CrossRef] [PubMed]
  22. Jiang, G.; Xu, L.; Song, S.; Zhu, C.; Wu, Q.; Zhang, L.; Wu, L. Effects of long-term low-dose cadmium exposure on genomic DNA methylation in human embryo lung fibroblast cells. Toxicology 2008, 244, 49–55. [Google Scholar] [CrossRef]
  23. Iwashita, M.; Shimamura, T. Long-term variations in dissolved trace elements in the Sagami River and its tributaries (upstream area), Japan. Sci. Total Environ. 2003, 312, 167–179. [Google Scholar] [CrossRef]
  24. Thévenot, D.R.; Moilleron, R.; Lestel, L.; Gromaire, M.-C.; Rocher, V.; Cambier, P.; Bonté, P.; Colin, J.-L.; de Pontevès, C.; Meybeck, M. Critical budget of metal sources and pathways in the Seine River basin (1994–2003) for Cd, Cr, Cu, Hg, Ni, Pb and Zn. Sci. Total Environ. 2007, 375, 180–203. [Google Scholar] [CrossRef]
  25. Wang, J.; Liu, G.; Liu, H.; Lam, P.K. Multivariate statistical evaluation of dissolved trace elements and a water quality assessment in the middle reaches of Huaihe River, Anhui, China. Sci. Total Environ. 2017, 583, 421–431. [Google Scholar] [CrossRef]
  26. Xiao, J.; Jin, Z.; Wang, J. Geochemistry of trace elements and water quality assessment of natural water within the Tarim River Basin in the extreme arid region, NW China. J. Geochem. Explor. 2014, 136, 118–126. [Google Scholar] [CrossRef]
  27. Shil, S.; Singh, U.K. Health risk assessment and spatial variations of dissolved heavy metals and metalloids in a tropical river basin system. Ecol. Indic. 2019, 106, 105455. [Google Scholar] [CrossRef]
  28. Yang, Z.; Xia, X.; Wang, Y.; Ji, J.; Wang, D.; Hou, Q.; Yu, T. Dissolved and particulate partitioning of trace elements and their spatial–temporal distribution in the Changjiang River. J. Geochem. Explor. 2014, 145, 114–123. [Google Scholar] [CrossRef]
  29. Yang, S.L.; Milliman, J.D.; Li, P.; Xu, K. 50,000 dams later: Erosion of the Yangtze River and its delta. Glob. Planet. Chang. 2011, 75, 14–20. [Google Scholar] [CrossRef]
  30. Li, Q.; Yu, M.; Lu, G.; Cai, T.; Bai, X.; Xia, Z. Impacts of the Gezhouba and Three Gorges reservoirs on the sediment regime in the Yangtze River, China. J. Hydrol. 2011, 403, 224–233. [Google Scholar] [CrossRef]
  31. Maavara, T.; Chen, Q.; Van Meter, K.; Brown, L.E.; Zhang, J.; Ni, J.; Zarfl, C. River dam impacts on biogeochemical cycling. Nat. Rev. Earth Environ. 2020, 1, 103–116. [Google Scholar] [CrossRef]
  32. Wang, W.-F.; Li, S.-L.; Zhong, J.; Maberly, S.C.; Li, C.; Wang, F.-S.; Xiao, H.-Y.; Liu, C.-Q. Climatic and anthropogenic regulation of carbon transport and transformation in a karst river-reservoir system. Sci. Total Environ. 2020. [Google Scholar] [CrossRef] [PubMed]
  33. Yang, K.; Han, G.; Zeng, J.; Liang, B.; Qu, R.; Liu, J.; Liu, M. Spatial Variation and Controlling Factors of H and O Isotopes in Lancang River Water, Southwest China. Int. J. Environ. Res. Public Health 2019, 16, 4932. [Google Scholar] [CrossRef]
  34. Chen, Q.; Shi, W.; Huisman, J.; Maberly, S.C.; Zhang, J.; Yu, J.; Chen, Y.; Tonina, D.; Yi, Q. Hydropower reservoirs on the upper Mekong River modify nutrient bioavailability downstream. Natl. Sci. Rev. 2020. [Google Scholar] [CrossRef]
  35. Wang, W.; Li, S.-L.; Zhong, J.; Li, C.; Yi, Y.; Chen, S.; Ren, Y. Understanding transport and transformation of dissolved inorganic carbon (DIC) in the reservoir system using δ13CDIC and water chemistry. J. Hydrol. 2019, 574, 193–201. [Google Scholar] [CrossRef]
  36. Deng, L.; Liu, S.L.; Zhao, Q.H.; Yang, J.J.; Wang, C.; Liu, Q. Variation and accumulation of sediments and associated heavy metals along cascade dams in the Mekong River, China. Environ. Eng. Manag. J. 2017, 16, 2075–2087. [Google Scholar]
  37. Liang, B.; Han, G.; Zeng, J.; Qu, R.; Liu, M.; Liu, J. Spatial Variation and Source of Dissolved Heavy Metals in the Lancangjiang River, Southwest China. Int. J. Environ. Res. Public Health 2020, 17, 732. [Google Scholar] [CrossRef]
  38. Wang, H.; Sun, F.; Liu, W. Characteristics of streamflow in the main stream of Changjiang River and the impact of the Three Gorges Dam. Catena 2020, 189, 104498. [Google Scholar] [CrossRef]
  39. Ma, Y.; Li, S. Spatial and temporal comparisons of dissolved organic matter in river systems of the Three Gorges Reservoir region using fluorescence and UV–Visible spectroscopy. Environ. Res. 2020, 189, 109925. [Google Scholar] [CrossRef]
  40. Wang, D.; Han, G.; Hu, M.; Wang, Y.; Liu, J.; Zeng, J.; Li, X. Major Elements in the Upstream of Three Gorges Reservoir: An Investigation of Chemical Weathering and Water Quality during Flood Events. Water 2021, 13, 454. [Google Scholar] [CrossRef]
  41. Meng, Q.; Zhang, J.; Zhang, Z.; Wu, T. Geochemistry of dissolved trace elements and heavy metals in the Dan River Drainage (China): Distribution, sources, and water quality assessment. Environ. Sci. Pollut. Res. 2016, 23, 8091–8103. [Google Scholar] [CrossRef]
  42. Ustaoğlu, F.; Taş, B.; Tepe, Y.; Topaldemir, H. Comprehensive assessment of water quality and associated health risk by using physicochemical quality indices and multivariate analysis in Terme River, Turkey. Environ. Sci. Pollut. Res. 2021. [Google Scholar] [CrossRef]
  43. Liang, B.; Han, G.; Liu, M.; Li, X.; Song, C.; Zhang, Q.; Yang, K. Spatial and Temporal Variation of Dissolved Heavy Metals in the Mun River, Northeast Thailand. Water 2019, 11, 380. [Google Scholar] [CrossRef]
  44. De Miguel, E.; Iribarren, I.; Chacón, E.; Ordoñez, A.; Charlesworth, S. Risk-based evaluation of the exposure of children to trace elements in playgrounds in Madrid (Spain). Chemosphere 2007, 66, 505–513. [Google Scholar] [CrossRef]
  45. Wu, B.; Zhao, D.Y.; Jia, H.Y.; Zhang, Y.; Zhang, X.X.; Cheng, S.P. Preliminary Risk Assessment of Trace Metal Pollution in Surface Water from Yangtze River in Nanjing Section, China. Bull. Environ. Contam. Toxicol. 2009, 82, 405–409. [Google Scholar] [CrossRef]
  46. Duan, X.-L.; Wang, Z.-S.; Li, Q.; Zhang, W.-J.; Huang, N.; Wang, B.-B.; Zhang, J.-L. Health Risk Assessment of Heavy Metals in Drinking Water Based on Field Measurement of Exposure Factors of Chinese People. Environ. Sci. 2011, 32, 1329–1339. (In Chinese) [Google Scholar]
  47. Liu, J.; Han, G. Major ions and δ34SSO4 in Jiulongjiang River water: Investigating the relationships between natural chemical weathering and human perturbations. Sci. Total Environ. 2020, 724, 138208. [Google Scholar] [CrossRef]
  48. Xiao, R.; Guo, D.; Ali, A.; Mi, S.; Liu, T.; Ren, C.; Li, R.; Zhang, Z. Accumulation, ecological-health risks assessment, and source apportionment of heavy metals in paddy soils: A case study in Hanzhong, Shaanxi, China. Environ. Pollut. 2019, 248, 349–357. [Google Scholar] [CrossRef]
  49. Zhang, L.C.; Zhou, K.H. Backgroud values of trace elements in the source area of the Yangtze river. Sci. Total Environ. 1992, 125, 391–404. [Google Scholar] [CrossRef]
  50. Zhu, Y.; Yang, Y.; Liu, M.; Zhang, M.; Wang, J. Concentration, Distribution, Source, and Risk Assessment of PAHs and Heavy Metals in Surface Water from the Three Gorges Reservoir, China. Hum. Ecol. Risk Assess. Int. J. 2015, 21, 1593–1607. [Google Scholar] [CrossRef]
  51. Lin, L.; Li, C.; Yang, W.; Zhao, L.; Liu, M.; Li, Q.; Crittenden, J.C. Spatial variations and periodic changes in heavy metals in surface water and sediments of the Three Gorges Reservoir, China. Chemosphere 2020, 240, 124837. [Google Scholar] [CrossRef] [PubMed]
  52. Gao, Q.; Li, Y.; Cheng, Q.; Yu, M.; Hu, B.; Wang, Z.; Yu, Z. Analysis and assessment of the nutrients, biochemical indexes and heavy metals in the Three Gorges Reservoir, China, from 2008 to 2013. Water Res. 2016, 92, 262–274. [Google Scholar] [CrossRef]
  53. Papafilippaki, A.K.; Kotti, M.E.; Stavroulakis, G.G. Seasonal variations in dissolved heavy metals in the keritis river, Chania, Greece. Glob. NEST J. 2008, 10, 320–325. [Google Scholar]
  54. Bu, H.; Wang, W.; Song, X.; Zhang, Q. Characteristics and source identification of dissolved trace elements in the Jinshui River of the South Qinling Mts., China. Environ. Sci. Pollut. Res. 2015, 22, 14248–14257. [Google Scholar] [CrossRef]
  55. Li, S.; Xu, Z.; Cheng, X.; Zhang, Q. Dissolved trace elements and heavy metals in the Danjiangkou Reservoir, China. Environ. Geol. 2008, 55, 977–983. [Google Scholar] [CrossRef]
  56. Liu, M.; Han, G.; Li, X. Using stable nitrogen isotope to indicate soil nitrogen dynamics under agricultural soil erosion in the Mun River basin, Northeast Thailand. Ecol. Indic. 2021, 128, 107814. [Google Scholar] [CrossRef]
  57. Han, G.; Tang, Y.; Liu, M.; Van Zwieten, L.; Yang, X.; Yu, C.; Wang, H.; Song, Z. Carbon-nitrogen isotope coupling of soil organic matter in a karst region under land use change, Southwest China. Agric. Ecosyst. Environ. 2020, 301, 107027. [Google Scholar] [CrossRef]
  58. Mohiuddin, K.M.; Otomo, K.; Ogawa, Y.; Shikazono, N. Seasonal and spatial distribution of trace elements in the water and sediments of the Tsurumi River in Japan. Environ. Monit. Assess. 2012, 184, 265–279. [Google Scholar] [CrossRef]
  59. Liu, J.; Li, S.-L.; Chen, J.-B.; Zhong, J.; Yue, F.-J.; Lang, Y.; Ding, H. Temporal transport of major and trace elements in the upper reaches of the Xijiang River, SW China. Environ. Earth Sci. 2017, 76, 299. [Google Scholar] [CrossRef]
  60. Li, S.; Zhang, Q. Spatial characterization of dissolved trace elements and heavy metals in the upper Han River (China) using multivariate statistical techniques. J. Hazard. Mater. 2010, 176, 579–588. [Google Scholar] [CrossRef]
  61. Krishna, A.K.; Satyanarayanan, M.; Govil, P.K. Assessment of heavy metal pollution in water using multivariate statistical techniques in an industrial area: A case study from Patancheru, Medak District, Andhra Pradesh, India. J. Hazard. Mater. 2009, 167, 366–373. [Google Scholar] [CrossRef]
  62. Pekey, H.; Karakaş, D.; Bakoğlu, M. Source apportionment of trace metals in surface waters of a polluted stream using multivariate statistical analyses. Mar. Pollut. Bull. 2004, 49, 809–818. [Google Scholar] [CrossRef]
  63. Wu, H.; Xu, C.; Wang, J.; Xiang, Y.; Ren, M.; Qie, H.; Zhang, Y.; Yao, R.; Li, L.; Lin, A. Health risk assessment based on source identification of heavy metals: A case study of Beiyun River, China. Ecotoxicol. Environ. Saf. 2021, 213, 112046. [Google Scholar] [CrossRef]
  64. Chen, K.; Jiao, J.J.; Huang, J.; Huang, R. Multivariate statistical evaluation of trace elements in groundwater in a coastal area in Shenzhen, China. Environ. Pollut. 2007, 147, 771–780. [Google Scholar] [CrossRef] [PubMed]
  65. Zeng, J.; Han, G.; Yang, K. Assessment and sources of heavy metals in suspended particulate matter in a tropical catchment, northeast Thailand. J. Clean. Prod. 2020, 265, 121898. [Google Scholar] [CrossRef]
  66. Zeng, J.; Han, G.; Zhu, J.-M. Seasonal and Spatial Variation of Mo Isotope Compositions in Headwater Stream of Xijiang River Draining the Carbonate Terrain, Southwest China. Water 2019, 11, 1076. [Google Scholar] [CrossRef]
  67. Li, Y.; Chen, H.; Teng, Y. Source apportionment and source-oriented risk assessment of heavy metals in the sediments of an urban river-lake system. Sci. Total Environ. 2020, 737, 140310. [Google Scholar] [CrossRef]
  68. Chetelat, B.; Liu, C.Q.; Zhao, Z.Q.; Wang, Q.L.; Li, S.L.; Li, J.; Wang, B.L. Geochemistry of the dissolved load of the Changjiang Basin rivers: Anthropogenic impacts and chemical weathering. Geochim. Cosmochim. Acta 2008, 72, 4254–4277. [Google Scholar] [CrossRef]
  69. Li, S.; Zhang, Q. Risk assessment and seasonal variations of dissolved trace elements and heavy metals in the Upper Han River, China. J. Hazard. Mater. 2010, 181, 1051–1058. [Google Scholar] [CrossRef]
  70. Wilk, A.; Szypulska-Koziarska, D.; Wiszniewska, B. The toxicity of vanadium on gastrointestinal, urinary and reproductive system, and its influence on fertility and fetuses malformations. Postepy Hig. I Med. Dosw. 2017, 71, 850–859. [Google Scholar] [CrossRef]
Figure 1. The lithology distribution and sampling sites of the upper TGR region.
Water 13 02078 g001
Figure 2. Spatial variations in concentrations of eight HMs at 40 sampling sites along the main channel of upper TGR area.
Water 13 02078 g002
Figure 3. Spatial distribution of concentrations of eight HMs in tributaries of the upper TGR area.
Water 13 02078 g003
Figure 4. The correlation analysis (a) and principal component analysis (b) of eight HMs of river water in the upper TGR area. ** p < 0.01; * p < 0.05.
Water 13 02078 g004
Figure 5. The spatial variations in the WQI along the main channel and tributaries of the upper TGR area.
Water 13 02078 g005
Figure 6. The HQ and HI values of HMs in the main channel and tributaries of the upper TGR area for adults and children, (a) HI values for adult in main channel, (b) HI values for children in main channel, (c) HI values for adult in tributaries, (d) HI values for children in tributaries.
Water 13 02078 g006
Table 1. Relative weight and limit values of individual variable, and the calculated average WQIi.
VariableDrinking Water Guidelines aWeight (wi)Relative Weight (wi)Average WQIi
EC1500 μS/cm40.0621.93
TDS1000 mg/L40.0621.62
F1 mg/L50.0771.97
Cl250 mg/L30.0460.57
NO3-N10 mg/L50.0771.40
SO4250 mg/L50.0770.59
Na200 mg/L30.0460.47
K12 mg/L b20.0310.76
Mg50 mg/L b20.0310.63
Ca75 mg/L b20.0311.72
Ni20 μg/L50.0770.54
Cu1000 μg/L20.0310.00
Zn1000 μg/L30.0460.00
As10 μg/L50.0771.13
Mo70 μg/L50.0770.10
Cd5 μg/L50.0770.01
Pb10 μg/L50.0770.02
Notes: a According to the Chinese drinking water standards (GB 5749-2006); b from [42].
Table 2. HM concentrations, pH, electric conductivity, and total dissolved solids of river water in the upper TGR area and related limit values of drinking water guidelines.
UnitUpper TGR AreaSource Area of YRW aDrinking Water GuidelinesSurface Water
Standard d Standard c
MinMaxMeanSDMedianChina b China aWHO c WHO b
Vμg/L0.513.191.440.551.450.18
Niμg/L0.982.191.400.211.380.182070
Cuμg/L0.331.500.860.240.930.631000200010
Znμg/L0.007.900.631.140.330.681000 50
Asμg/L0.453.231.460.571.480.86101050
Moμg/L0.332.200.940.310.980.527070
Cdμg/L0.000.020.010.000.000.02531
Pbμg/L0.000.100.030.030.020.76101010
pH d7.268.197.810.177.81 6.5–8.5
EC dμS/cm212734471134470
TDS dmg/L11941026475263 1000
Notes: a is Chinese drinking water standards (GB 5749-2006), b is WHO drinking water guidelines, c,d is the limited values of Grade I of Chinese surface water standard.
Table 3. Varimax rotated component matrix for dissolved HMs of the upper TGR area.
VariablePC1PC2PC3
Eigenvalues3.041.621.35
Variance (%)38.020.216.9
V0.920.20−0.01
Ni0.78−0.100.16
Cu0.230.630.16
Zn0.08−0.070.91
As0.860.400.05
Mo0.880.230.15
Cd0.160.520.67
Pb0.060.83−0.06
Publisher’s Note: MDPI stays neutral with regard to jurisdictional claims in published maps and institutional affiliations.

