Article

Relationships between Insufficient Drinking Water Supply and the Socio-Economic Development of Small Municipalities: Mayors’ Opinions from the Czech Republic

1
Faculty of Economics, University of West Bohemia, Univerzitní 8, 301 00 Plzeň, Czech Republic
2
Research Institute for Soil and Water Conservation, Žabovřeská 250, 156 27 Praha 5-Zbraslav, Czech Republic
*
Author to whom correspondence should be addressed.
Water 2021, 13(15), 2098; https://doi.org/10.3390/w13152098
Submission received: 30 May 2021 / Revised: 18 July 2021 / Accepted: 26 July 2021 / Published: 30 July 2021
(This article belongs to the Special Issue Risk Assessment and Decision Support in Drinking Water Systems)

Abstract

:
Repeatedly occurring droughts in the Czech Republic in previous years have heightened the need to answer questions concerning the provision of drinking water in small municipalities in the context of their development. The goal of the research was to assess what mutual relationships exist between insufficient drinking water supply and the socio-economic level of municipalities with less than 2000 inhabitants. The basis of the study is formed by data collected via a questionnaire survey of the mayors of 2110 municipalities. For the purposes of the analysis, the Drinking Water Supply Threat Index (DWSTI) composite indicator was established. Subsequently, the effect of selected factors on DWSTI was determined via correlation and regression analysis, and results were compared for two size groups of municipalities indicate water supply problems. The digging of new wells for individual needs is seen to be the most significant signal of problems. The absence of water supply infrastructure results in a heightening of the socio-economic deprivation of small municipalities, as it limits new building and becomes a limitation to their development. A solution is possible based on regional or trans-regional financial and managerial support of development together with an active approach on the part of municipalities.

1. Introduction

Access to hygienically safe drinking water is one of the basic prerequisites for the quality of the population’s life and health. Significant attention is paid to the issue globally, primarily with regard to regions that suffer from water source scarcity or have not yet built suitable water-supply infrastructure [1,2]. The problematic accessibility of drinking water in these regions is a result of natural conditions, e.g., climatic or hydrological drought, or as a manifestation of socio-economic drought linked to the poor economic level of regions [3,4]. From this perspective, the global level of evaluation is given attention in the development and application of a number of indicators of quality water accessibility [5,6,7]. In a worldwide comparison, Central European countries including the Czech Republic are among the macroregions that have a high level of security in terms of the availability of drinking water for the population [8,9]. Moreover, with regard to natural conditions, the territory of Central Europe is among areas with a low level of water stress [3,9]. Despite this fact, there are several reasons to consider research into the connection between the lower quality of drinking water supply and the development of municipalities in Central Europe to be topical [10,11,12,13]. An analysis of current influences on insufficient drinking water supply for the inhabitants of small municipalities in the Czech Republic is the subject of our study.
This paper focuses on the present situation from the point of view of the mayors of small municipalities in the Czech Republic. The opinions of the municipality’s management are also significant with regard to the ability to identify barriers of development and find opportunities to overcome obstacles. In the first phase, representatives of municipalities or regions must identify the problem of the insufficient supply of drinking water as a significant one [14,15]. This is a question of the ability of perception, political decision-making and strategic planning in the field of drinking water.
With regard to the primary selection of municipalities with an insufficient water supply infrastructure, sparsely inhabited municipalities in the Czech Republic with fewer than 2000 inhabitants have been chosen. The goal of our research is to assess the relationships between insufficient drinking water supply and the development of municipalities in the Czech Republic in the aforementioned size category. In connection with this goal, two research questions have been established:
Q1:
Which socio-economic characteristics of small municipalities are connected to insufficient drinking water supply?
Q2:
Is insufficient drinking water supply a limiting factor in the socio-economic development of municipalities?
The term insufficient drinking water supply in this study indicates a situation in which the state of drinking water supply is perceived by mayors of municipalities as problematic. Insufficient drinking water supply can also be described using the terms low quality of drinking water supply or threat to the availability of drinking water. Differences in insufficient drinking water supply are distinguished by the Drinking Water Supply Threat Index (DWSTI) in this study.

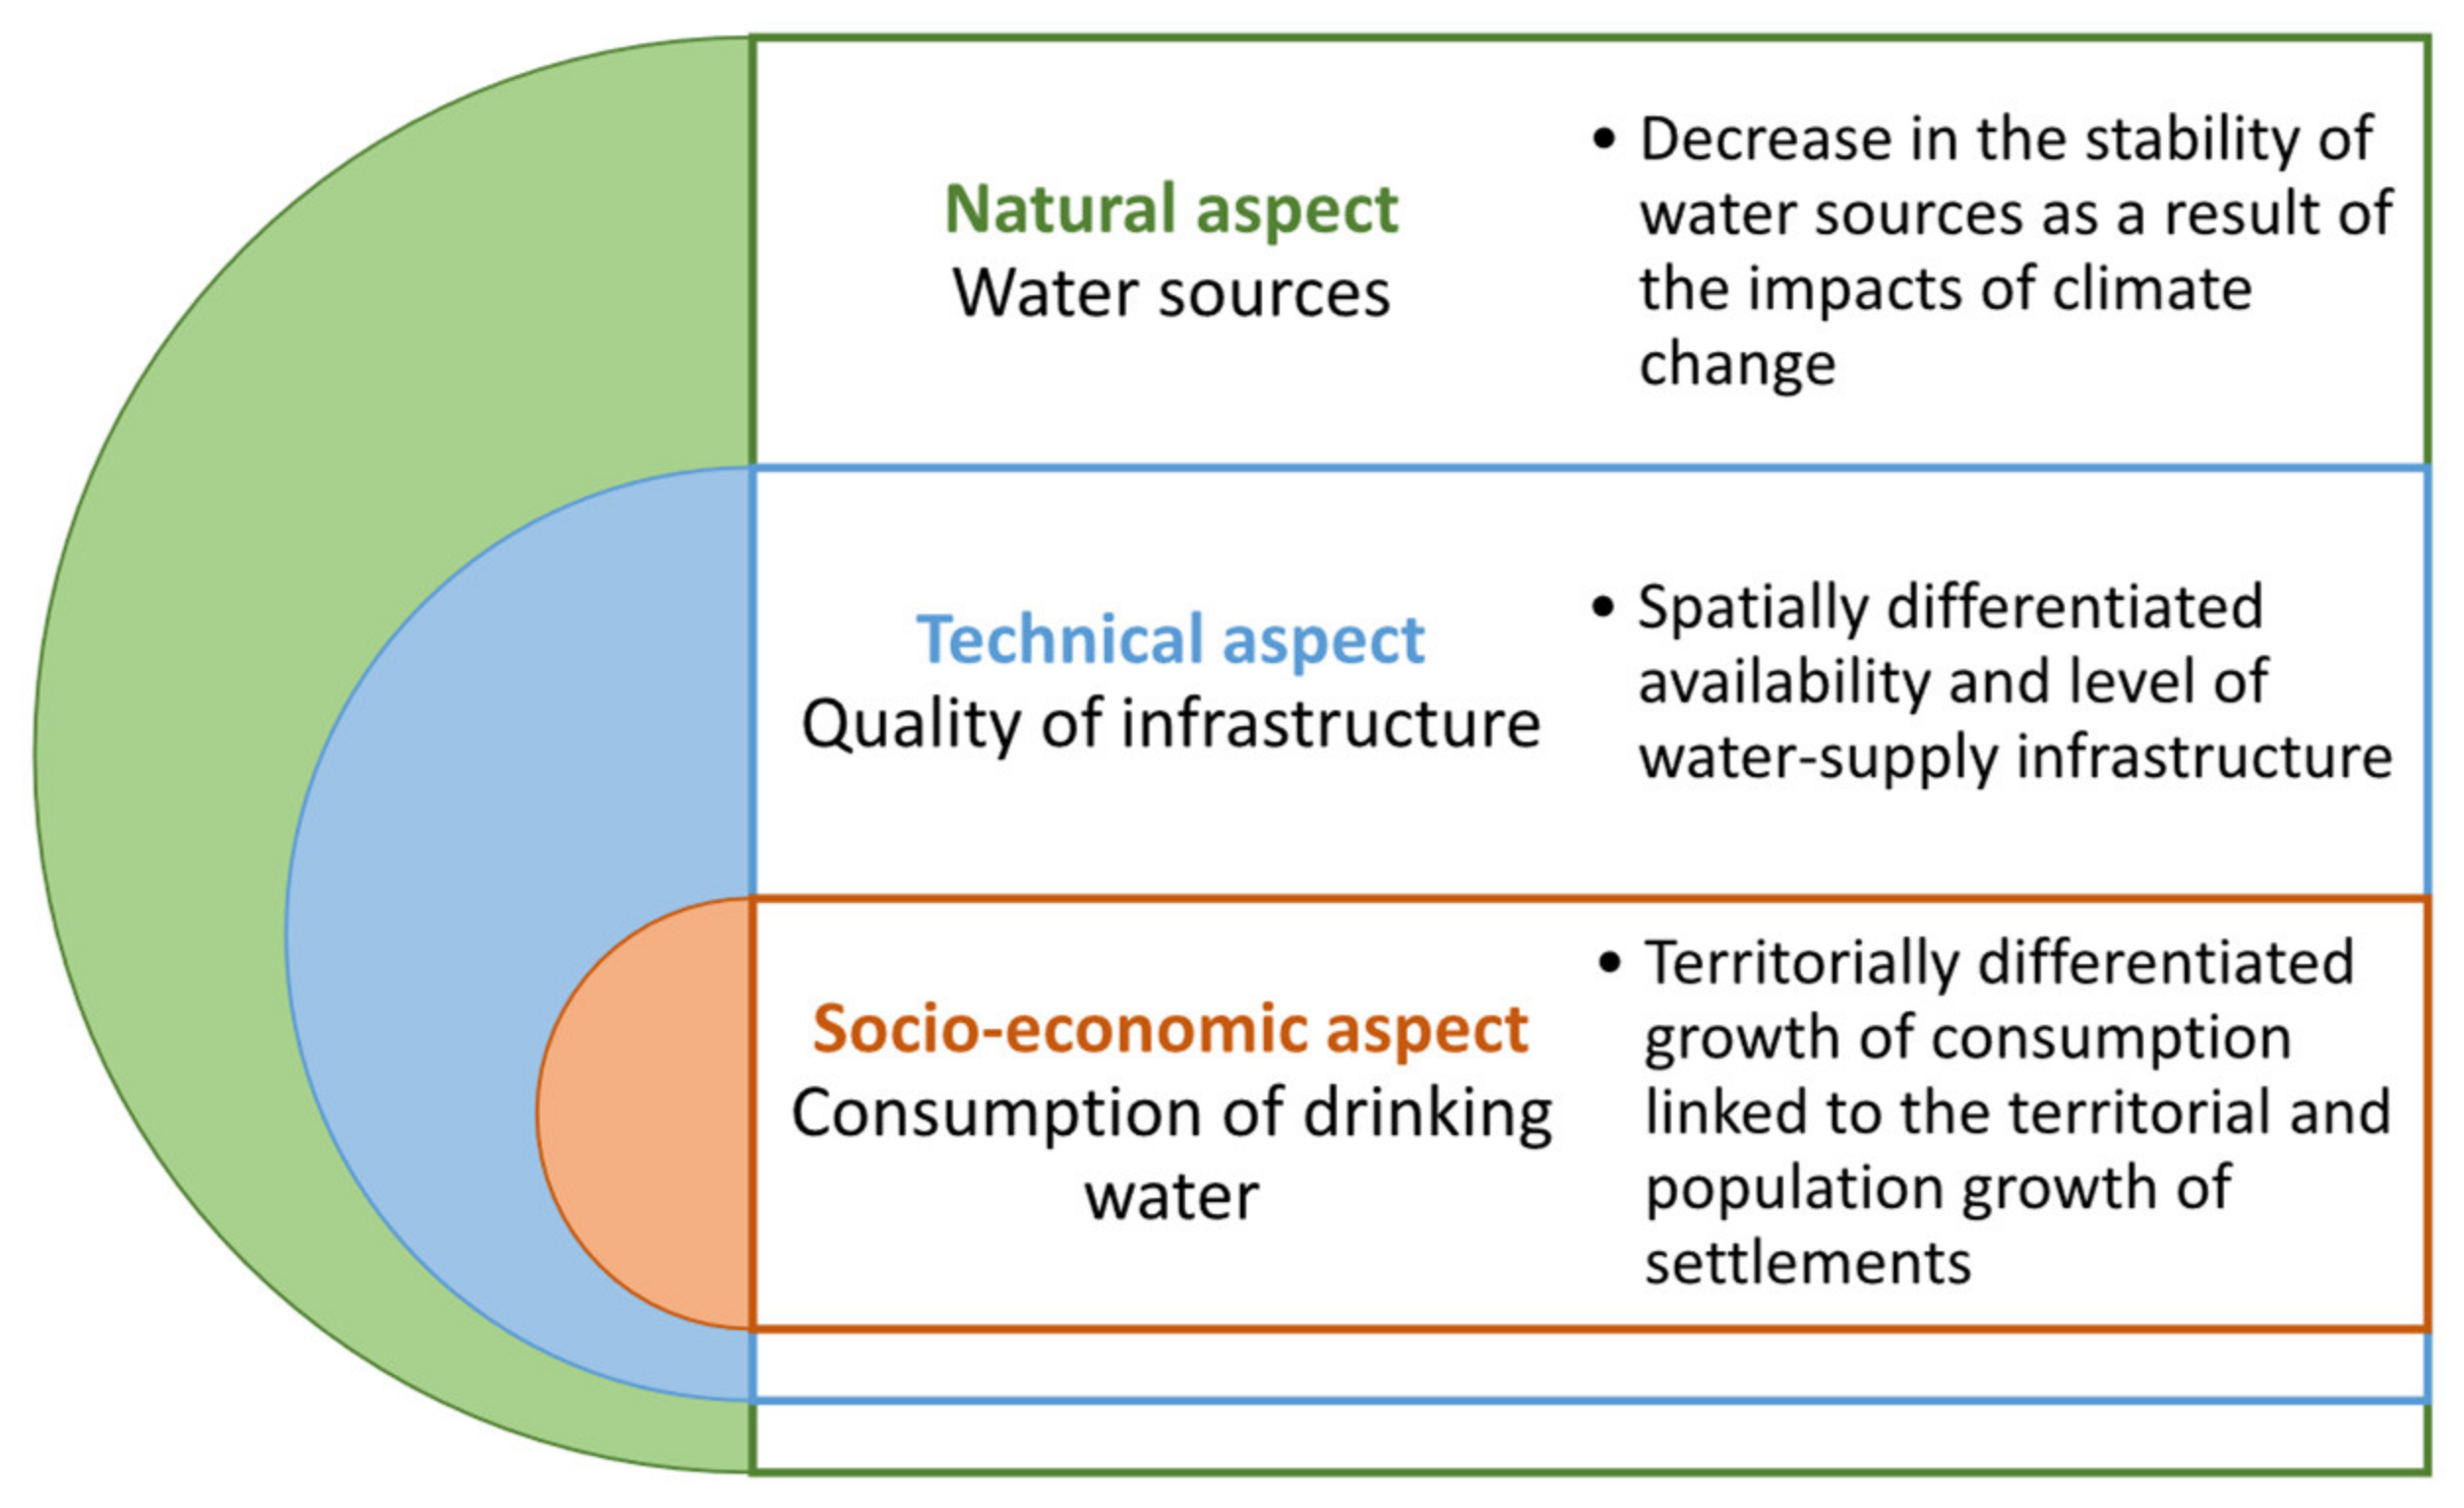
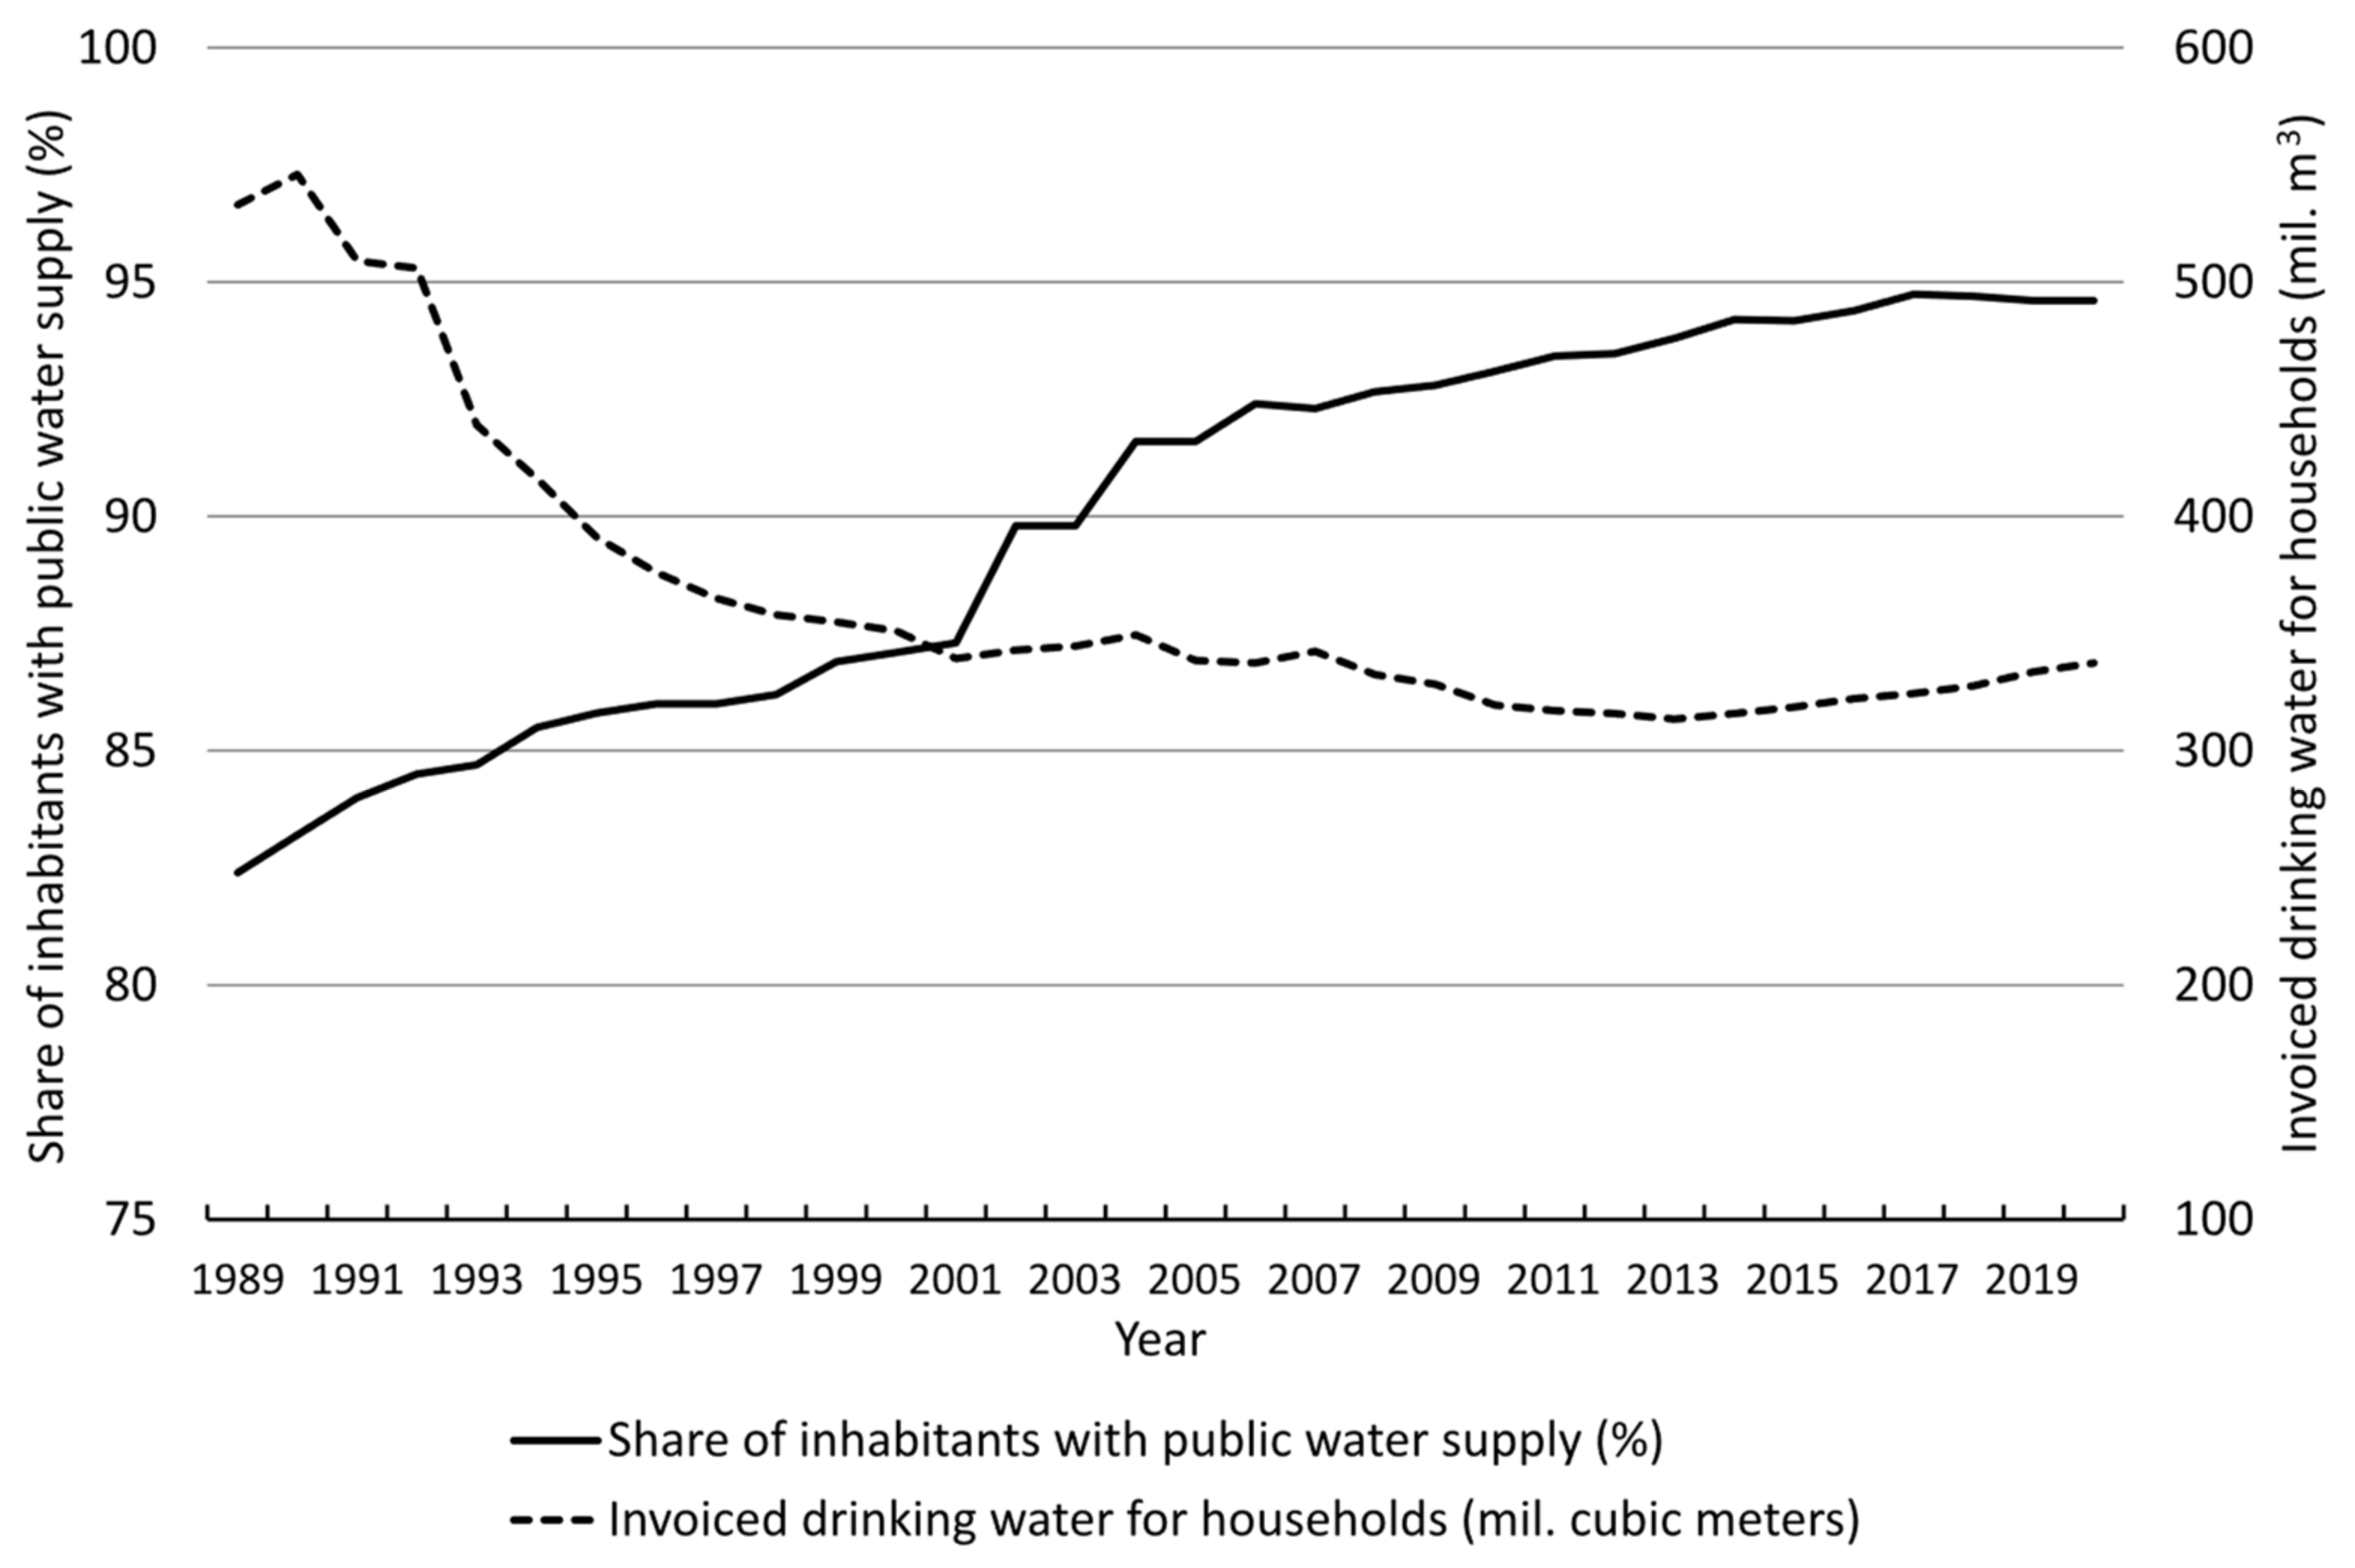
1.1. Basic Aspects of Drinking Water Supply Problems in the Czech Republic

The basic aspects of problems in ensuring drinking water in the natural and socio-economic conditions of the Czech Republic can be divided into three main interconnected categories (Figure 1). Climate change in Central Europe is manifesting itself in heightening temperatures and a change in the distribution of precipitation over the course of the year. Along with this, the level of perception of the impacts of climate change on water sources is also rising [16,17]. Therefore, the spatial differentiation of the impacts of climate change on the hydrological balance of river basins are analyzed and estimated according to individual scenarios [18,19]. In this context, new water supply measures are discussed in connection with the heightening probability of all forms of drought occurring [9,20,21].
The second category of problems in supplying drinking water is linked to the non-existence or insufficient quality of a water supply infrastructure providing water primarily to some small municipalities in rural areas. According to a nationwide survey from 2016, 12% of a total of 6254 municipalities in the Czech Republic were not connected to a water source [22]. The absence of a municipal water supply is primarily related to municipalities that are small in population. At the same time, the degree to which municipalities are equipped with basic infrastructure in the Czech Republic shows relatively strong regional differentiation [23]. The percentage of inhabitants that are connected to a water supply has grown nationwide from 82.4% in 1989 to 94.6% in 2020 [24] (Figure 2). The development of the water supply infrastructure in the last 30 years in the Czech Republic has been linked to overall socio-economic development in the post-communist period, similarly, for example, to Poland [13,25] or eastern Germany [26]. The water supply sector has gone through partial privatization, significant technological modernization, and the implementation of drinking water prices commensurate to costs. As a result, the daily consumption of water in households dropped dramatically to 91.3 L per day per person in 2020, which was one of the lowest values in the EU [8,9]. This manifested itself in a significant drop in produced and invoiced drinking water [24] (Figure 2). However, 578,000 inhabitants of the Czech Republic still have no secured supply of drinking water from a water supply connection. There are hundreds of water supplies with insufficient drinking water quality or a poor technical or operational quality of the supply system [27,28].
The third significant group of issues concerning the availability of drinking water is connected to the capacity of the present water supply infrastructure and the possibilities of its development in municipalities where new housing construction is taking place and the number of inhabitants is growing. The process of suburbanization has been a dominant phenomenon for the residential development of municipalities in the Czech Republic since the end of the 20th century [30,31,32]. As a result, expansion of urbanized areas is taking place in a number of municipalities on the peripheries of urban agglomerations as a result of intensive housing construction. The limited capacity of water sources for supplying new households with drinking water from the expanding network of water supply infrastructure is manifesting itself in individual cases as a limiting factor to this development [33,34]. According to sociological surveys hitherto, inhabitants of the Czech Republic see the security of drinking water as a fundamental water supply issue [35], which also influences their selection of immovable property for their own housing [36].

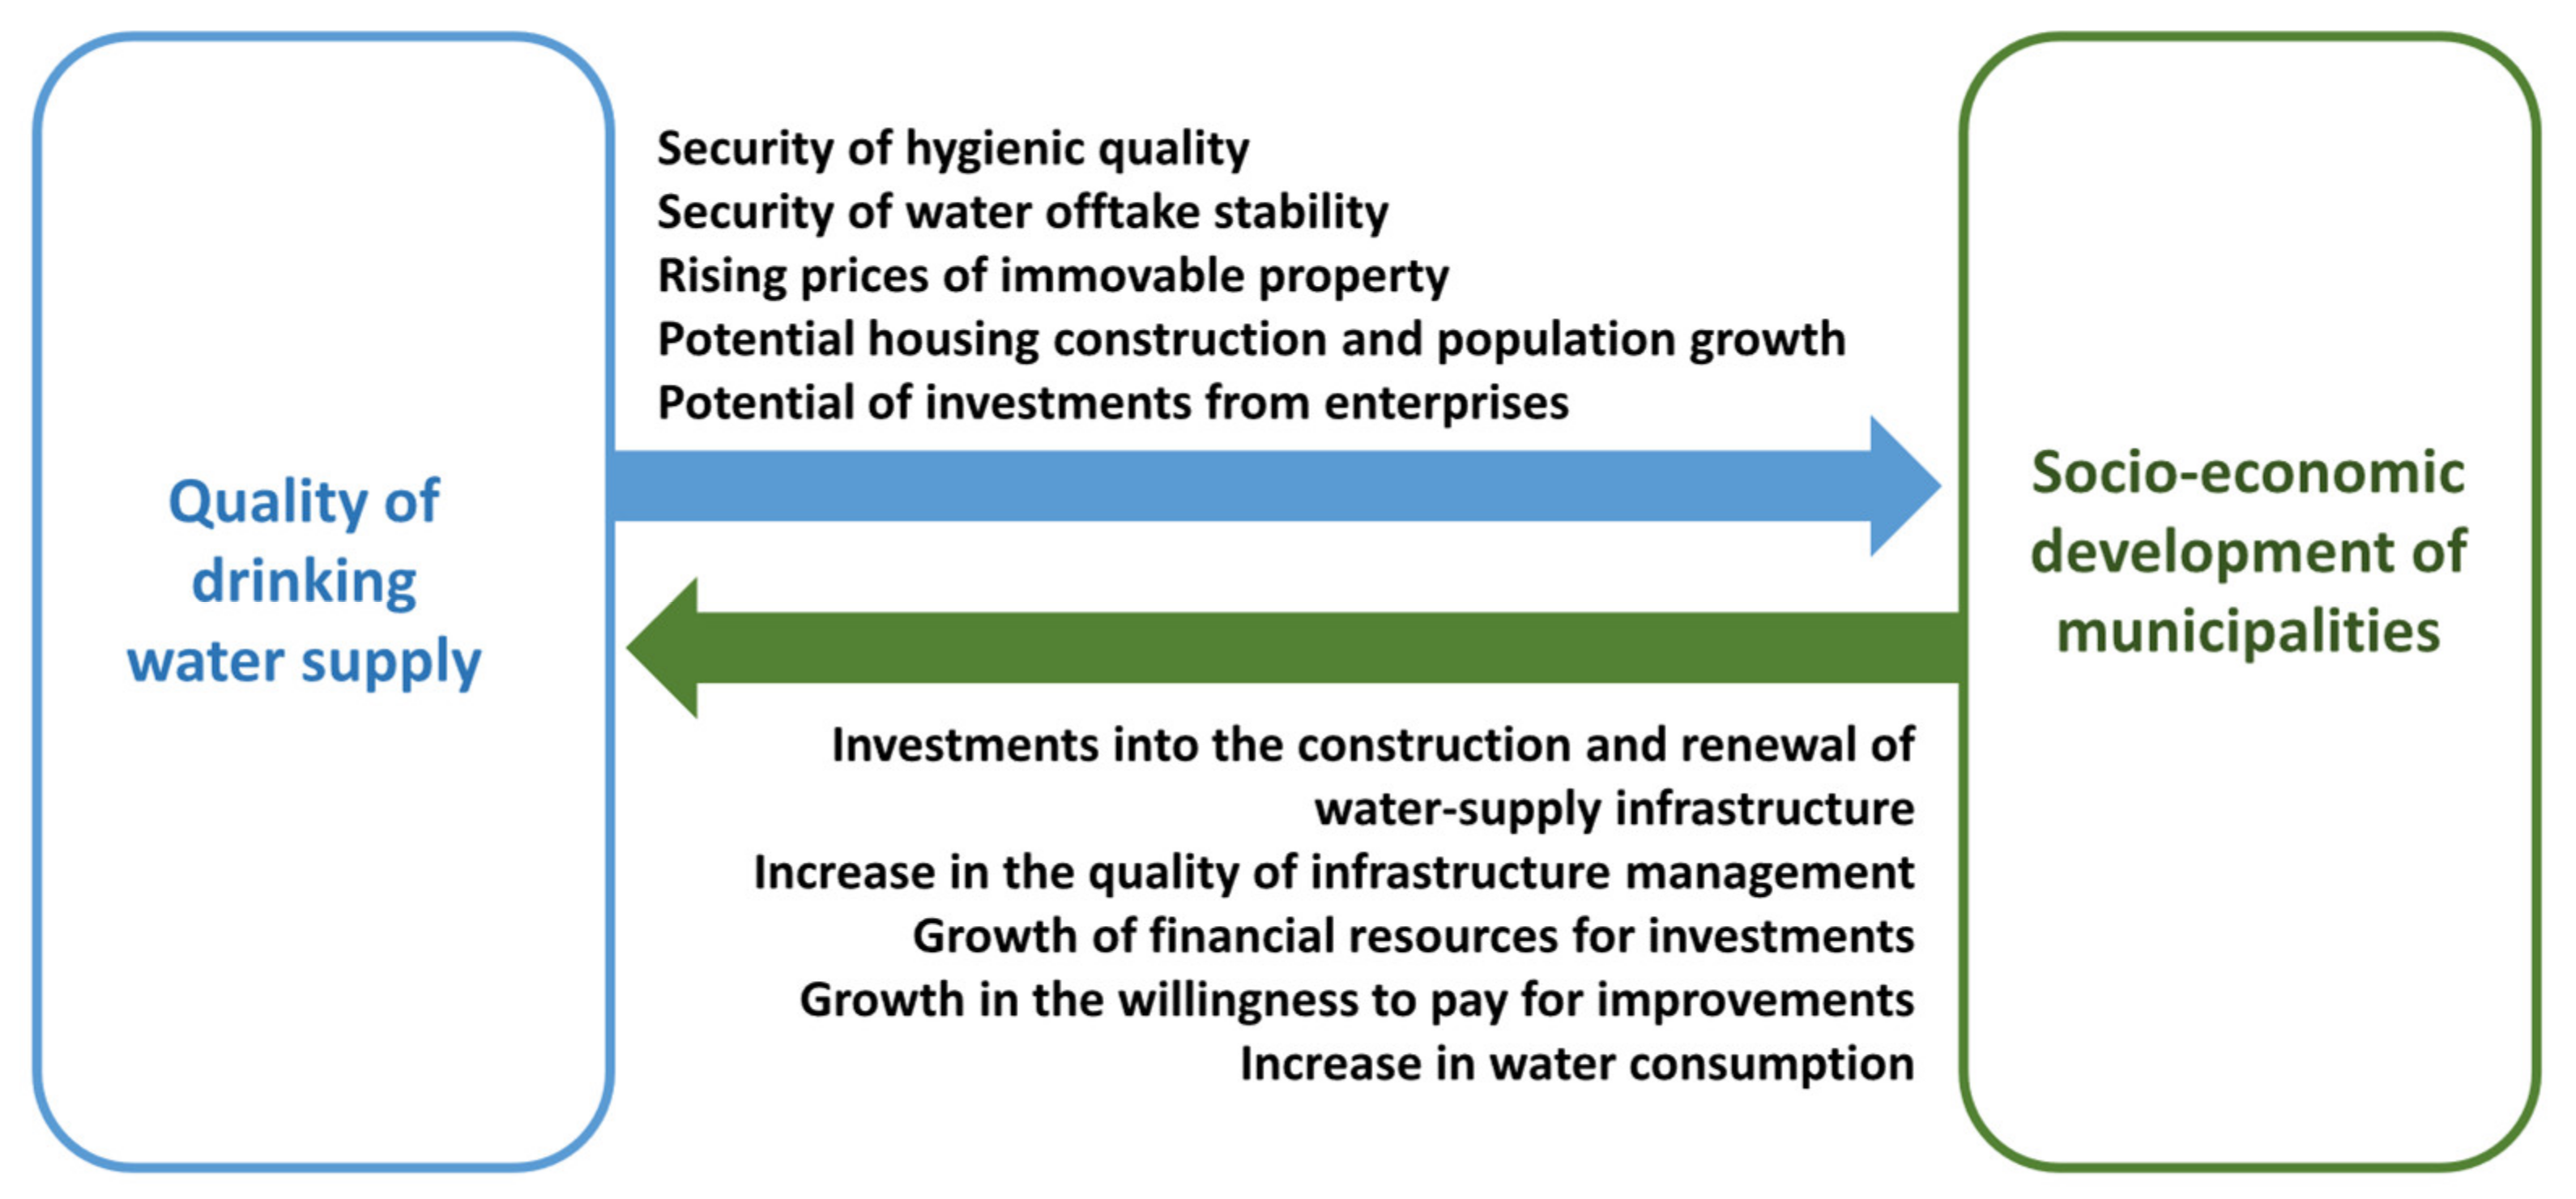
1.2. Relationships between the Quality of Drinking Water Supply and the Development of Municipalities

Issues concerning the relationships between drinking water supply and the development of municipalities are dealt with throughout the world in case studies of regions of a comparable socio-economic level, but namely in conditions with a more significant deficit of water sources [37,38,39,40,41]. In regard to the deepening problems of droughts as a result of climate change however, such studies can also be inspiring in terms of the conditions in the Czech Republic. From the perspective of drinking water supply, it is also important that individual small municipalities are distinguished by their differing degree of socio-economic peripherality and thus differing demand for housing construction [42,43,44]. The socio-economic status of inhabitants simultaneously influences demand, willingness to effectively manage water, or to pay for an increase in the quality of supplied drinking water [45,46,47,48]. The relationships of socio-economic factors with the quality of drinking water supply in municipalities in the Czech Republic have so far been identified based on a statistical comparison of larger administrative units [49]. Existing research shows that the perception of drinking water shortages is not only influenced by indicators representing the volume and price of water in each region—it can also be determined by other socio-economic factors such as income, gender, age, and education [49]. Based on the analysis of mutual relationships and according to findings from studies from other regions [50,51,52,53], a positive mutual relationship between the quality of the drinking water supply and the development of municipalities can be assumed (Figure 3).
The supply of drinking water is an important factor in the selection of a place to live. As a survey carried out in the Czech Republic has shown [36], the most important factor for decisions on a change of place of residence in respondents’ minds is the “Drinking water supply situation”. In municipalities with a good-quality and high-capacity provision of water supply connections, the possibility arises for new housing construction or the development of entrepreneurial activity [12,25,39]. The studies point to an incongruity between municipal planning on a local scale and the planning of water supply infrastructure on a regional scale [26,39,54,55]. It is therefore important for water management planning to know the views of mayors and their perception of obstacles to development.
The successful population and economic development of a municipality as a stimulus to ensuring high-quality infrastructure works in the other direction of the mutual relationship [52,56]. The strengthening of financial and human resources heightens the ability of municipalities to invest into infrastructure [57,58]. An equally important issue is the economic status of the population, which is a prerequisite for the willingness to pay for high-quality security of drinking water [59,60,61,62].

1.3. Factors Impacting the State and Development of Drinking Water Supply

Factors influencing the state and development of drinking water supply (Table 1) can be divided into at least two levels of measurement—local and regional (or supra-regional) [11,50,63]. From the perspective of regional development theories, we can categorize the internal and external development factors of municipalities in a similar manner [42,64,65]. External factors of quality drinking water supply are linked to the geographical location of the municipality, e.g., factors such as climate, hydrological balance of the territory, hydrogeological regional conditions, the existence of regional water supply systems, and the migration potential of the municipality with regard to the position of the region in the residential system [37,39,41,50,66].
Our research focuses on the socio-economic contexts of the level of drinking water supply; other primarily natural factors have not been subjected to statistical investigation. The spatial differentiation of natural conditions (e.g., hydrogeological conditions on the local level of municipalities) is certainly an important factor for municipalities in the Czech Republic, but it is one that is quantitatively difficult to process [18,19].
According to some theories, the human and social capital of municipalities can have a significant impact on development [23,56,65,67]. This is also the focus of our study on the opinions of mayors of municipalities. In the issue of the availability of drinking water, the opinions and attitudes of inhabitants in regard to the willingness to pay for a higher standard of infrastructure can also have an impact [45,59,60]. The economic level of inhabitants also corresponds to waste or effective use of water [68,69,70]. In households with their own gardens, the consumption of water for watering or filling pools can be an important part of the balance [71,72,73,74]. Therefore, a certain portion of households makes use of water drawn from wells as a complementary source of water for watering gardens or lawns [75], which can affect the local level of the availability of ground water periods of drought.
The quality of the municipality’s management is also connected to the ability to strategically plan and acquire financial support for the development of infrastructure [54,55,76]. Local factors should also include ones such as the typology of the built-up area, its density, and the municipality’s fragmentation into individual sections of the built-up area [25]. The costs for securing infrastructure grow exponentially with the increasing fragmentation of the residential structure [77].

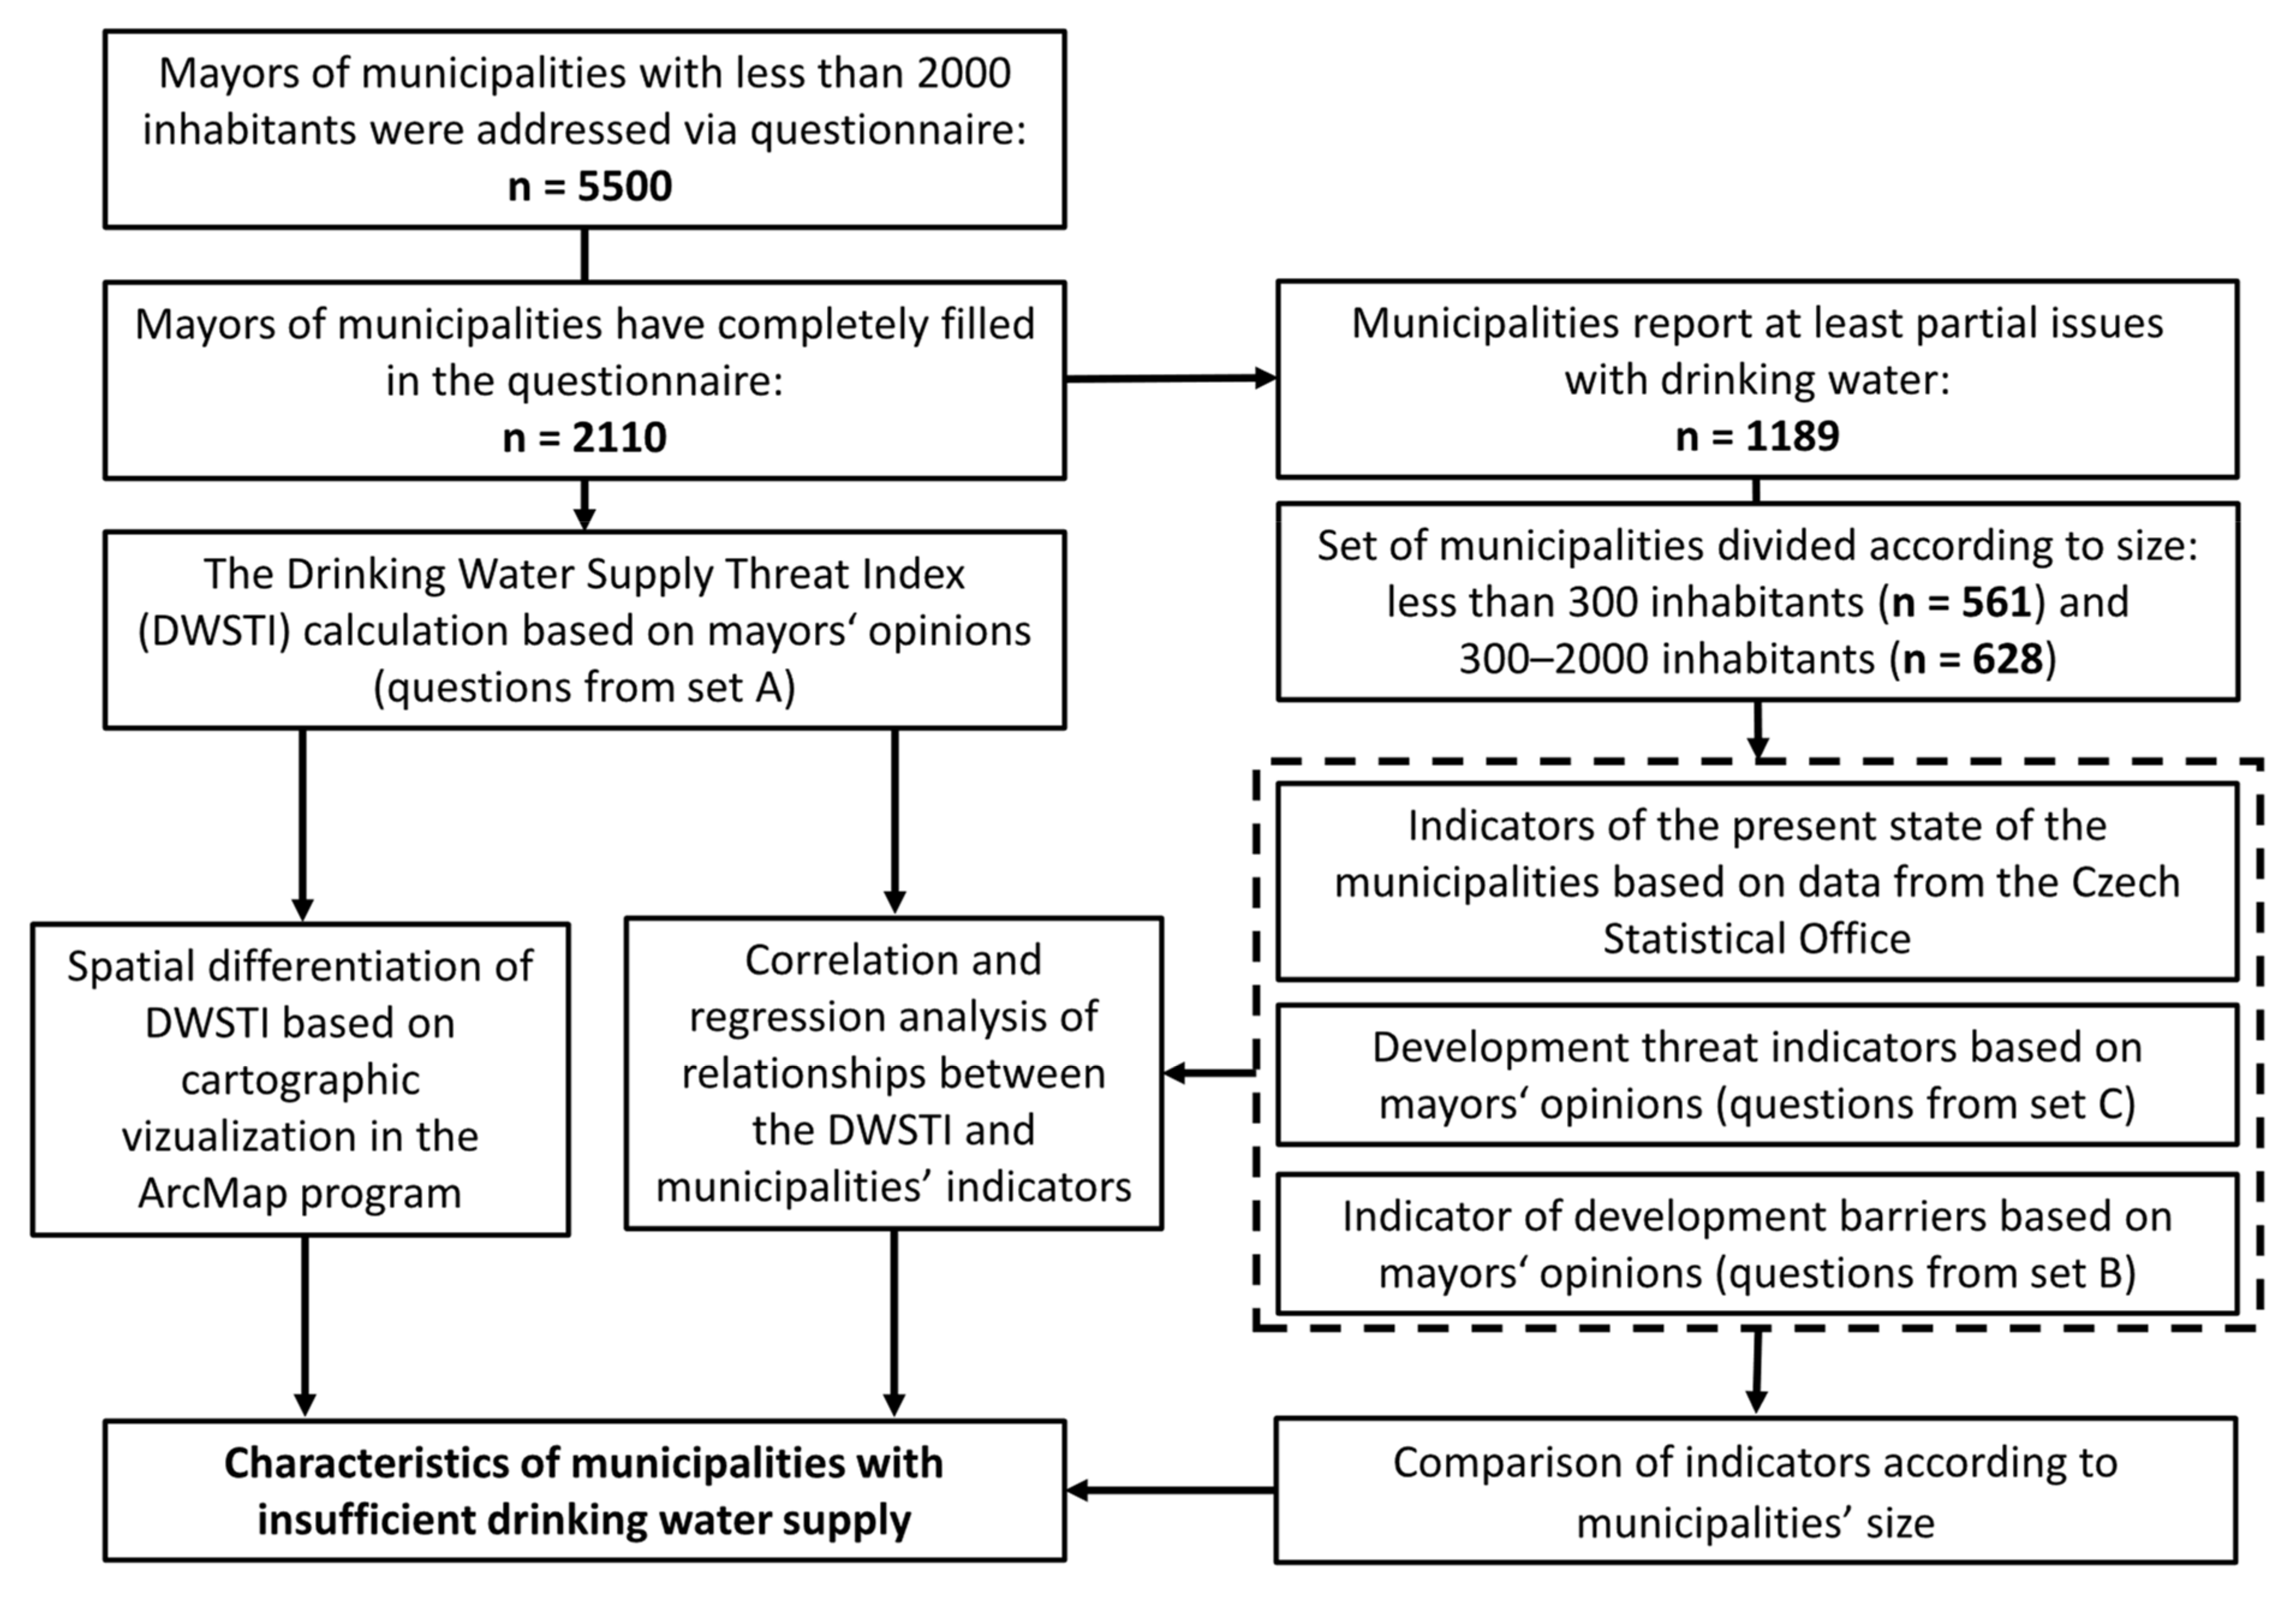
2. Materials and Methods

The basis of the study is formed by data collected via a questionnaire survey of the mayors. For the purposes of the analysis, a composite index recording the threat to drinking water availability (Drinking Water Supply Threat Index (DWSTI)) was established. This indicator stems from primary data based on the completed questionnaire survey of small municipalities. Subsequently, the influence of selected factors on DWSTI was studied. Secondary data of the present state of the municipalities from the Czech Statistical Office’s database was also used. In the following text, used data and selected variables that were subsequently used for analysis are described. A correlation analysis was carried out, estimates of simple and multiple linear regression were made, during which the Variation Inflation Factor (VIF) for measuring the force of multicollinearity was counted, and estimates were made with the Robust Regression condition in STATA software. A brief overview of the methodology is shown in Figure 4.

2.1. Questionnaire Survey of Mayors

The questionnaire survey was carried out in the form of an electronic questionnaire, and data collection took place in the spring of 2020. The target group were mayors of small municipalities in the Czech Republic. From a list of all municipalities in the Czech Republic in the database of the Czech Statistical Office, a selection of municipalities with a population lower than 2000 was carried out and, using data boxes, the mayors of these municipalities were addressed. The information system of data boxes is operated by the Czech Post, and it is compulsory for every municipality to have one. Addressing municipalities (mayors) via an information system of data boxes is a secure method for sending out applications, which was crucial in terms of response rate. Mayors of municipalities were always the ones addressed, as the questionnaire survey is focused on the representatives of the municipal authorities who are closely acquainted with the issue in small municipalities and can assess its significance for the specific locality. A total of over 5500 small municipalities in the Czech Republic were addressed, and 2110 completely filled-out questionnaires were obtained. This provided a high degree of returned questionnaires, specifically 38.0%. In terms of comparing the degree of returned questionnaires in individual regions, the highest return was recorded in the Pilsen Region, where the rate of return reached 45.5%; the lowest rate of return was observed in the Karlovy Vary Region, at 34.3%. A detailed overview of the number of municipalities and collected questionnaires in individual regions is presented in Table 2. Data on the number of collected questionnaires show that the distribution of questionnaires corresponds to the distribution of population size up to 2000 inhabitants in individual regions. These data together with the high degree of returned questionnaires heightens the quality and reliability of the completed survey. The obtained data are a unique source of information for a deeper analysis of the state of drinking water supply in small municipalities up to 2000 inhabitants, results from a questionnaire survey provide valuable information on current problems that small municipalities have with drinking water supply.
The questionnaire survey was focused on municipalities’ current state of drinking water management in terms of the potential for development. The questionnaire was divided into three areas of assessment from the perspective of the mayors: (A) Present state of drinking water supply; (B) Barriers (critical topics) to the municipality’s drinking water supply development; (C) Threats to the municipality’s development in the future. Three sets of questions suitable for statistical analysis in this study were selected (Appendix A, Table A1).

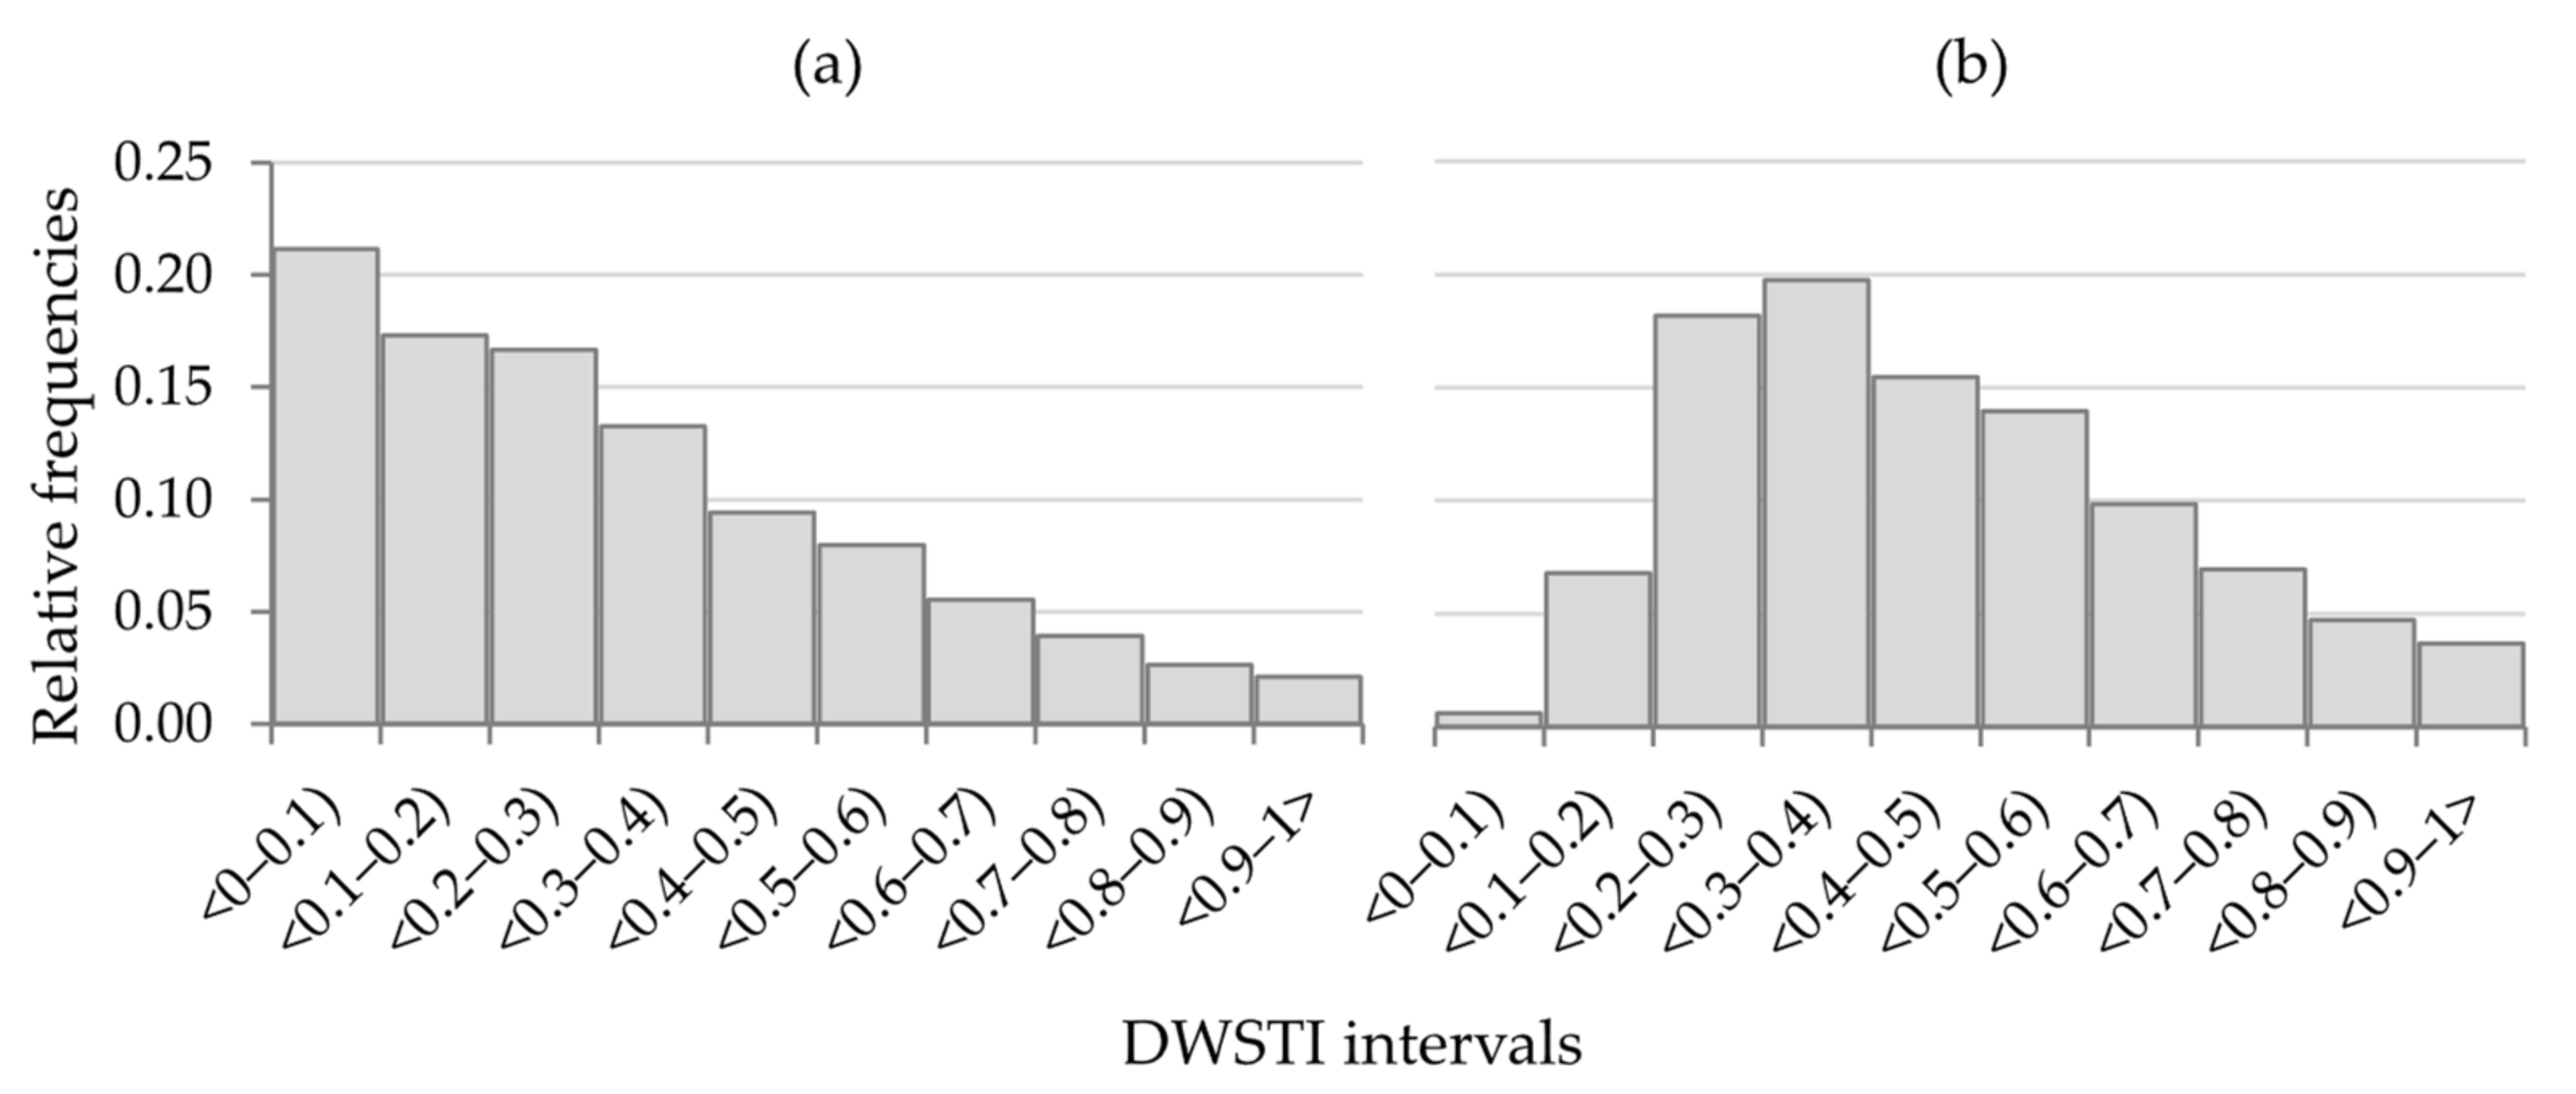
2.2. Drinking Water Supply Threat Index (DWSTI)

DWSTI was calculated from a set of questions from area (A): How would you assess the present state of drinking water supply in your municipality? Set contains a total of 10 sub-questions (A1–A10) aimed at determining the current state of drinking water availability in the municipality (Appendix A, Table A1). Respondents could select from Likert scale responses (strongly agree = 1; agree = 0.75; neutral = 0.5; disagree = 0.25; strongly disagree = 0). In order to reduce distortion and heighten the quality of acquired data, question sequence rotation was used. Based on the professional assessment and methodology of other studies [5,7,12,27], individual sub-questions were assigned weights which were entered into the DWSTI calculation. For the allocation of weights, the sub-questions A1–A10 were divided into three categories according to the potential impact on insufficient drinking water supply: (a) major problems (weight 0.2); (b) partial problems (weight 0.1); (c) additional indications of possible problems (weight 0.05). The total weight of all sub-questions is 1. The DWSTI calculation is expressed in Equation (1).
DWSTI = 0.2(A1 + A10) + 0.1(A2 + A3 + A4 + A5) + 0.05(A6 + A7 + A8 + A9)
DWSTI is thus a composite index that takes a value in an interval of 0 to 1, in which values close to 1 represent municipalities having significant problems with drinking water supply; values close to 0 thus represent municipalities for which drinking water supply does not present a fundamental problem. As we were interested primarily in small municipalities with significant drinking water supply problems, municipalities that answered Strongly disagree to question A1 were omitted from the subsequent analysis. From the original number of 2110 municipalities, 1189 municipalities thus remained in the final dataset. The overview of the relative frequencies according to the completed index is presented in Figure 5.
Maps showing spatial differentiation of DWSTI were created in the ArcMap program (version 10.7.1) with the use of administrative division layers from the ArcČR 500 geodatabase [78]. In order to depict the spatial differentiation of drinking water availability in the studied municipalities, the method of point symbols located in centroids representing individual municipalities was used.
Municipalities are depicted without population size differentiation; the color of the point expresses the DWSTI value on a scale of 0 to 1. Although these are only positive values, a multicolor scale was selected, which ranges from shades of blue for the lowest values (also symbolizing a sufficient drinking water supply) to high values in warm shades of red (symbolizing drinking water supply threats). Values are divided into seven intervals based on a manually edited compromise between the Jenks natural breaks optimization method in values (Natural Breaks—Jenks [79]) and even intervals so that the intervals respected both the specific structure of the values and the differences in the drinking water availability index values as compared to the middle of the whole scale (i.e., an index value of 0.5).
The similar method of proportional (point) symbols shows municipalities with a DWSTI value of 0.5 or higher, i.e., those in which the availability of drinking water poses a larger problem. Therefore, we selected a simpler color scale with an analogous color scheme [80] of shades of warm colors from yellow to red, which again represent the highest values with the greatest threat to drinking water supply. However, this time the size of the points agrees in proportion to the population size of individual municipalities as of 1 January 2020 [81] (values of the number of inhabitants in the legend thus express only a referential measurement of size, not intervals of size categories).
In regard to the fact that population size is a key parameter which is fundamental for the financing, administration, and planning of a municipality’s development, municipalities were divided into two groups according to the number of inhabitants. The division of the data set was also supported by ANOVA results, in which the zero hypothesis of the equality of mean DWSTI values was refuted on a 5% significance level. The first group (SIZE 1) is thus made up of municipalities that have a population of less than 300; this group contains 561 municipalities. The next and slightly larger group (SIZE 2) are municipalities with more than 300 inhabitants; this group is made up of 628 municipalities. An overview of relative frequencies of the completed index is presented in Figure 6.

2.3. Indicators of the Municipality’s Present State

Based on an analysis in the theoretical section, factors that can affect drinking water availability and an overview of selected factors were identified. A brief description of them is listed in Table 3. Before the correlation and regression analysis itself, identification of so-called “outliers” was carried out. Their possible impact on estimates was eliminated by so-called winsorization, which is the transformation of statistics by limiting extreme values in statistical data in order to decrease the effect of possible false remote values. Selected quantiles for individual variables are listed in the last column in Table 3.
A complete overview of the descriptive statistics is presented in Appendix B (Table A2). In terms of the technical problem of multicollinearity, its strength was measured in the econometric model estimate via VIF and, in the case of multiple linear regression, its degree was tolerable and values 1/FIV did not surpass the value of 3.07.

2.4. Development Threat Indicators

Indicators of the development threat to municipalities were calculated from responses to two questions in area (C), specifically C1: For each issue, mark the degree to which you think the given area is important for the development of your municipality, and C2: For each issue, mark the degree to which you think the given area is a threat to your municipality’s development over the next 10 years. Here, respondents could choose from the Likert scale of responses (does not limit at all/does not threaten at all; does not limit/does not threaten; neutral; limits/threatens; strongly limits/strongly threatens). A total of 18 issues were defined, and an overview of the individual issues is provided in Appendix A (Table A1). In the case of selecting issues, question sequence rotation was used.
Based on the methodology of other studies [5,7,15,23], composite development threat indicators (C1–C18) were calculated from a set of questions C1 and C2. The weight of response C1 (importance for development) was decreased to a value of 0.2; the weight of response C2 (threat to development) was 1. The values of indicators are standardized in an interval of 0 to 1; values close to 1 represent municipalities with an issue that is a highly significant threat to their development and vice versa.

2.5. Indicator of Development Barriers in the Area of Drinking Water Availability (Barrier Indicator)

The Barrier Indicator was calculated from a set of questions from area (B), specifically from responses to question: What do you consider to be development barriers in the field of drinking water supply in your municipality? Set B contains a total of 13 sub-questions aimed at determining the seriousness of the given barrier (Appendix A, Table A1). Respondents could choose from three answers (not a barrier = 0; partial barrier = 0.5; fundamental barrier = 1). Once again, question sequence rotation was used in data collection. Individual sub-questions were assigned the same weights.
The Barrier Indicator is also a composite index, which takes on a value in an interval of 0 to 1, in which values close to 1 represent municipalities with significant barriers in supplying drinking water; conversely, values close to 0 represent municipalities that do not have significant development barriers in the area of drinking water supply.

3. Results

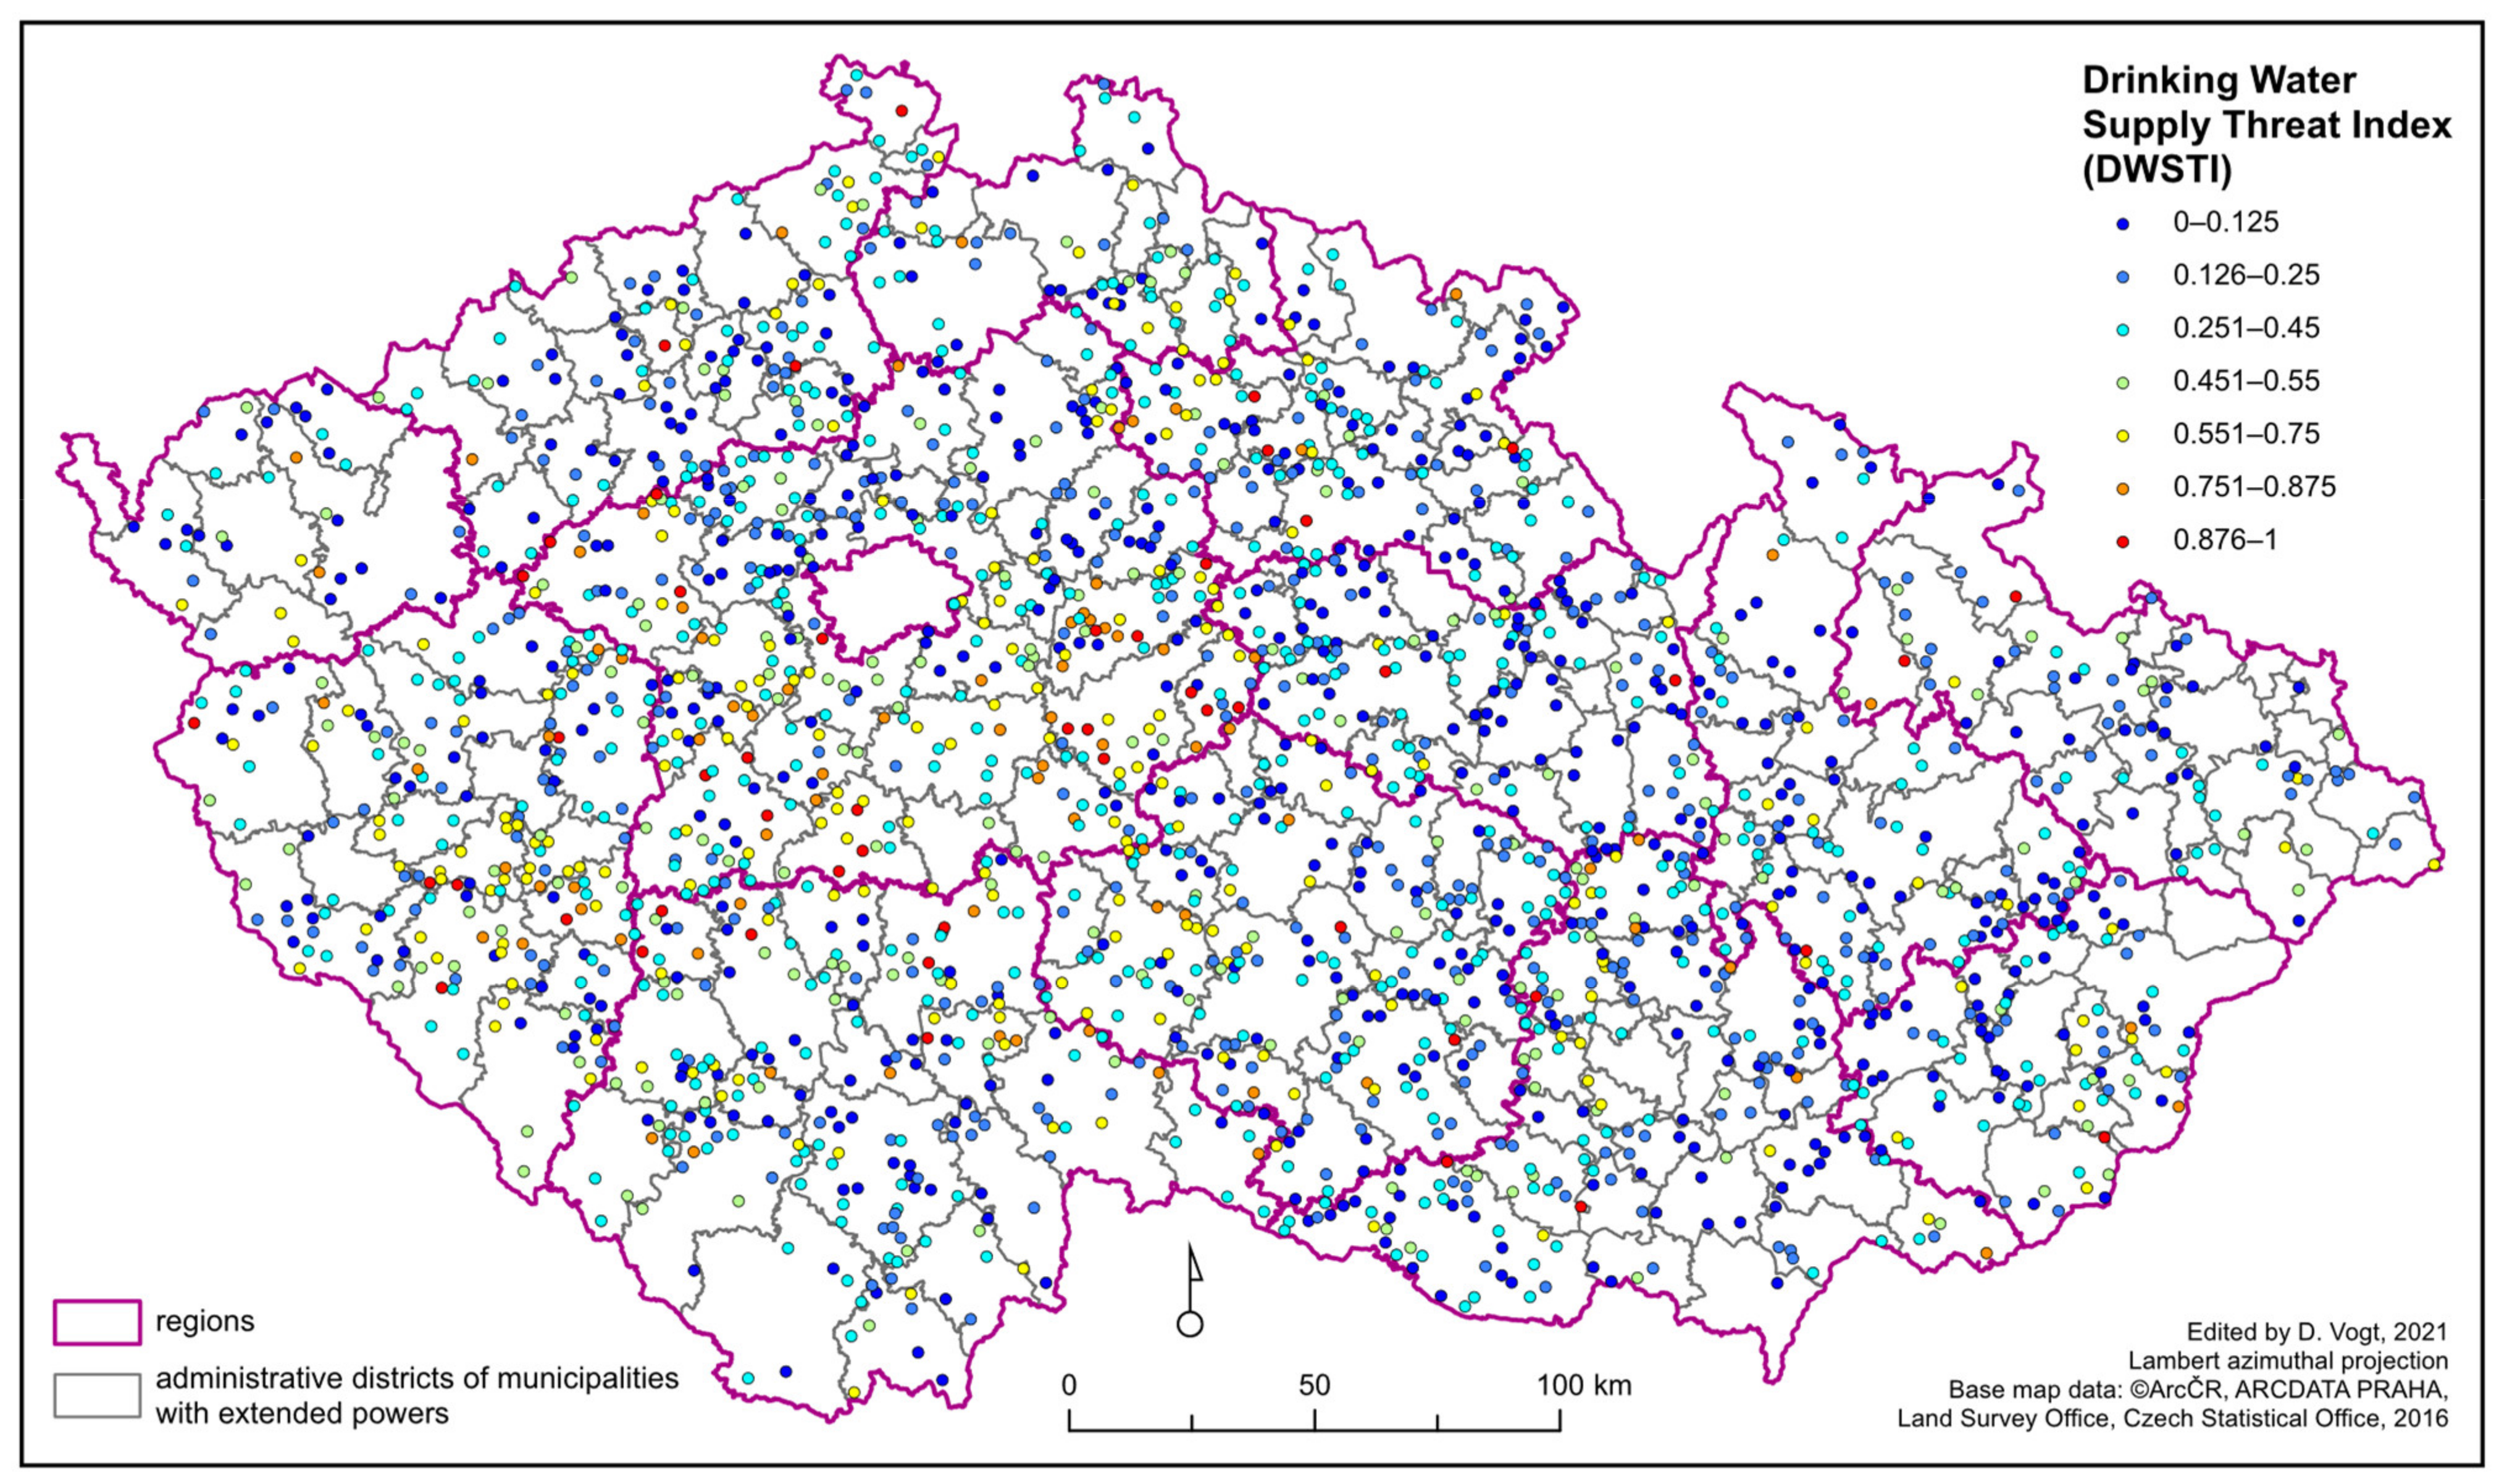
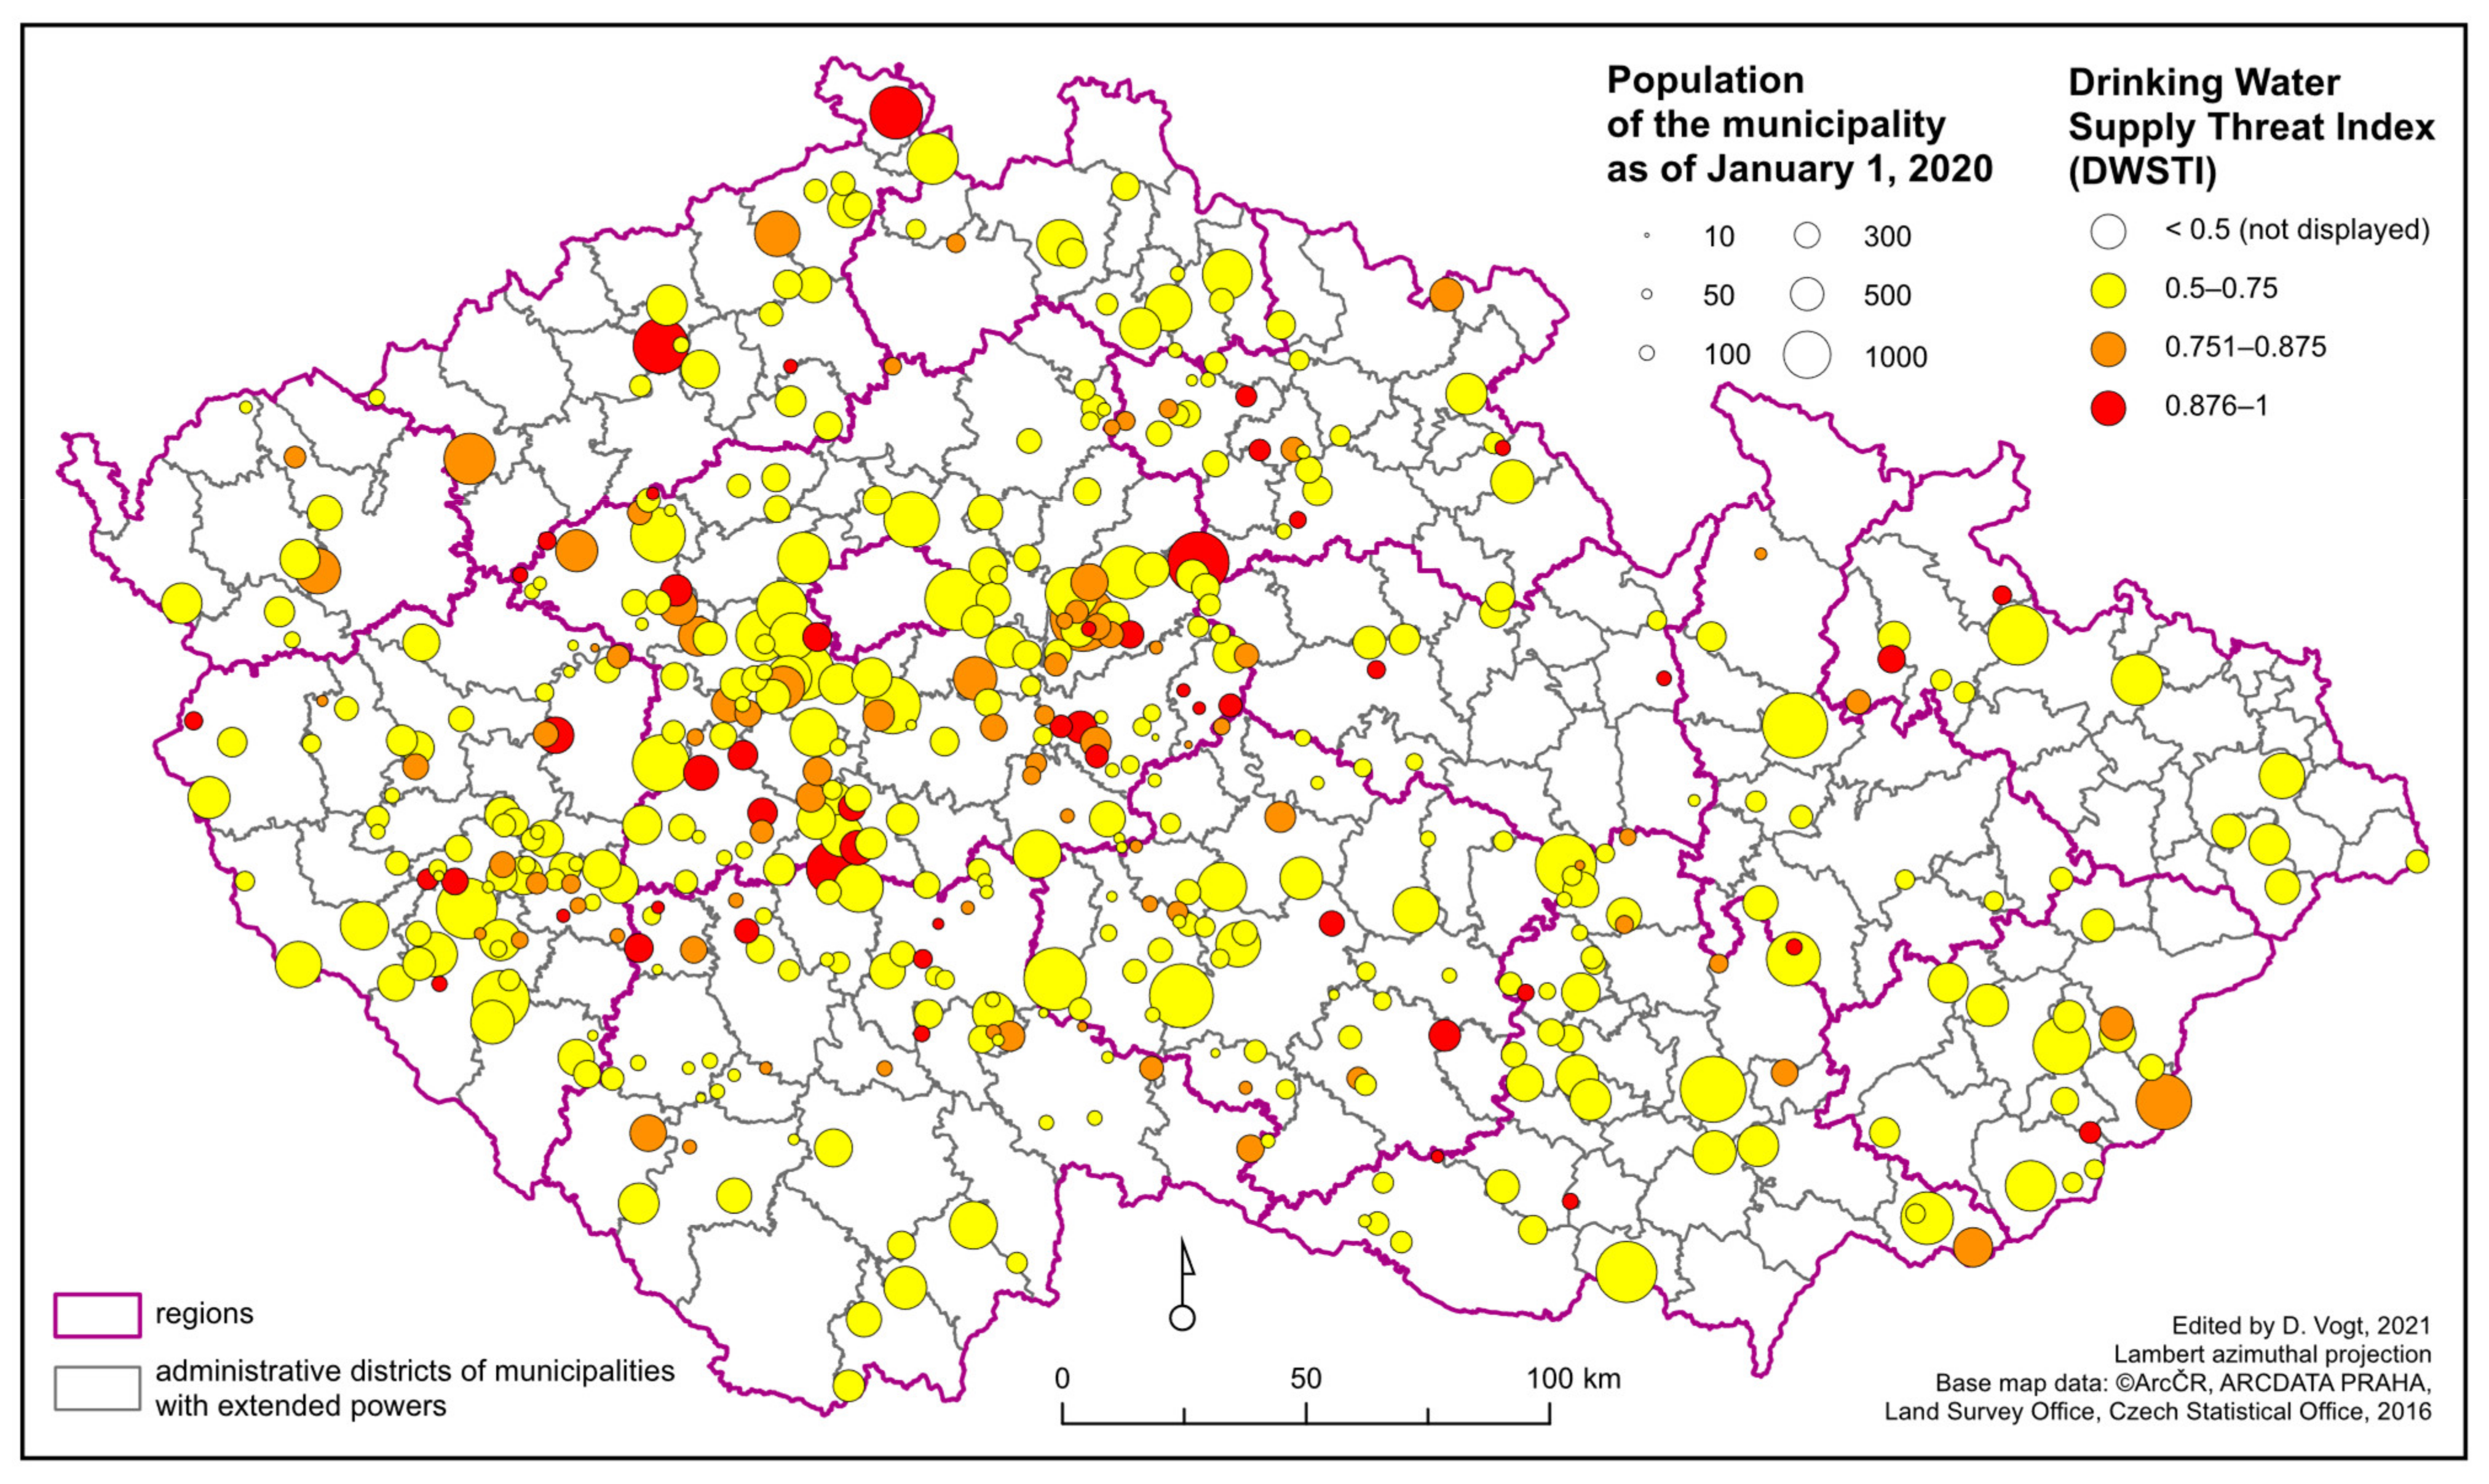
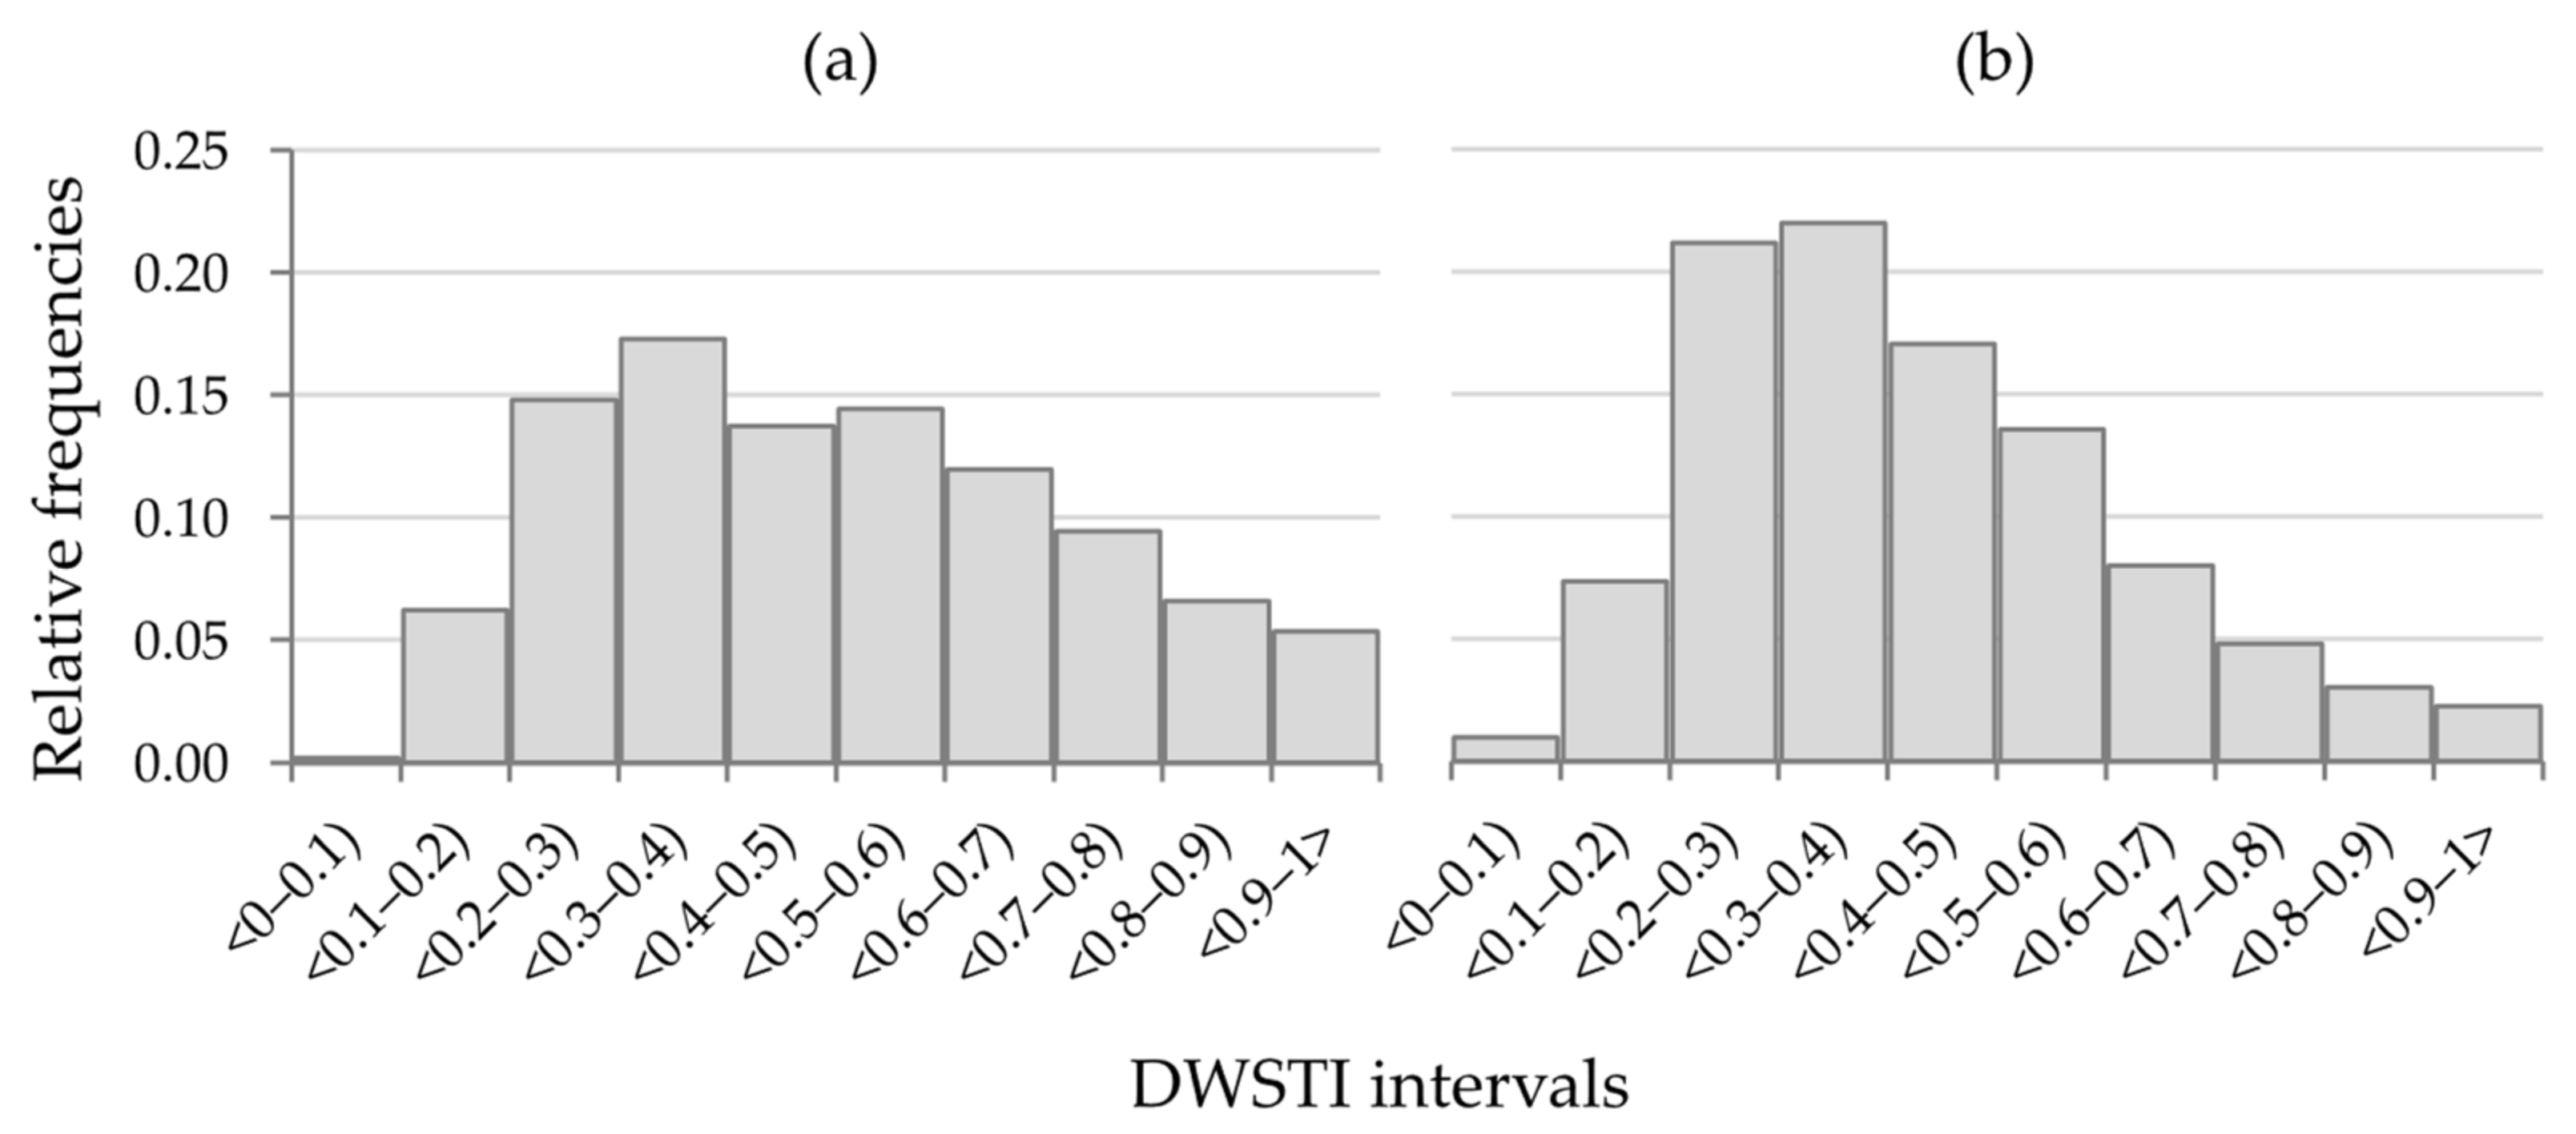
3.1. Spatial Differentiation of Municipalities with Problematic Drinking Water Supply

The questionnaire survey on drinking water supply in municipalities up to 2000 inhabitants has shown that threatened municipalities are not equally distributed throughout the Czech Republic (Figure 6 and Figure 7). A higher concentration of threatened municipalities is located namely in several clusters in the Central Bohemian Region (periphery of the Prague agglomeration), for example, to the east and south of the region towards its border with the South Bohemian Region. Another cluster of problematic municipalities is found in the Pilsen-South district (Pilsen Region, West Bohemia).
A significant concentration of problems was identified in some microregions that are the target of suburbanization or recreation. With some exceptions, problematic municipalities are not found in mountainous regions on the administrative periphery of the Czech Republic.
The spatial differentiation of municipalities with problematic drinking water supply is influenced by the relationship to the municipalities’ population size. Based on results from the questionnaire survey, we can claim that representatives of the smallest municipalities with fewer than 300 inhabitants point to a higher degree of problems with drinking water availability than representatives of municipalities with 300–2000 inhabitants. The average value of DWSTI in the case of the smallest municipalities is 0.498, and the median reaches a value of 0.475. In the second group of municipalities, the average value of DWSTI is 0.418 and the median is 0.388. An overview of relative frequencies according to the completed index is presented in Figure 8. At the same time, the size of municipalities is linked to their position in the residential system as well as the development of the administrative demarcation of the municipalities. In the eastern area of the Czech Republic, municipalities generally have greater population sizes, which is clearly reflected in the small number of problematic municipalities in terms of drinking water supply. The makeup of small municipalities is also generally influenced, for example, by the greater degree of urbanization in regions historically focused on the mining of coal (North Bohemia, Moravia-Silesia Region).

3.2. Significance of Problems with Drinking Water Supply

It was statistically confirmed based on a t-test on a 5% significance level that smaller municipalities (SIZE 1) show a lower quality of drinking water supply than municipalities with larger populations (SIZE 2) (p-value = 0.0085). Other relationships were therefore determined for two size categories of municipalities.
Individual statements from the municipalities’ representatives show that the most serious problem is seen in the attempt to implement new wells to allow for the drawing of ground water to supply individual households (Table 4). This naturally corresponds to the non-existence of a water supply infrastructure in some municipalities as well as the insufficient capacity of local water sources. Ensuring a connection to the regional water supply system is hindered by the high costs of implementation. Representatives of municipalities cite the issue of water waste as a less serious issue. Contrary to all other aspects of drinking water issues, the situation of the group of larger municipalities (SIZE 2) is slightly worse in this context.

3.3. Characteristics of Municipalities with Insufficient Drinking Water Supply

A basic characteristic impacting the lower quality of drinking water supply is the population size of municipalities. The smallest municipalities with less than 300 inhabitants show a connection between DWSTI and the density of the built-up area. As the dispersion of the built-up area grows (e.g., family homes with large properties), so does the occurrence of possible problems with drinking water supply. Larger municipalities (300–2000 inhabitants) have higher DWSTI values linked to the lower intensity of residential development, a higher relative growth of inhabitants via migration and a higher number of economic subjects operating in the municipality. At the same time, a higher relative growth is a shared characteristic of both size categories of municipalities linked to DWSTI.
Numerous other characteristics did not statistically prove a significant relationship with the issue of drinking water supply. Demographic indicators (natural growth, aging index) or indicators of the municipality’s human capital (relative number of candidates in municipal elections, percentage of the unemployed) proved to be irrelevant. Estimates of multiple linear regression are listed in Table 5.

3.4. The Issue of Drinking Water Supply in the Context of Development Threats to Municipalities

Municipalities where drinking water supply problems have been identified by the questionnaire have other common development threats (Table 6). Representatives of both size groups of municipalities agree that the most limiting factor to their development is the lack of funds in the municipality’s budget. The group of significant problematic topics also includes the decrease in and aging of the population, drinking water supply, the state of roads, and a sufficient amount of space for housing development. From the topics above, the following two problems are the most relatively significant for the development of the smallest municipalities: the decrease and aging of the population and the issue of drinking water supply. The significance of the issue of nonexistent or insufficient water supply infrastructure of the smallest municipalities is also shown by the identified development problem in the area of wastewater treatment.
Based on correlation and regression analysis, a statistically significant influence could not be determined between the low level of drinking water supply (DWSTI) and development threat indicators. For most indicators, the relationship proved to be insignificant. The direct dependence of both groups of municipalities was determined only for indicator C7 (Drinking water supply). In the case of municipalities up to 300 inhabitants, an indirect dependence was determined for indicator C14 (Work opportunities in the municipality and accessible surroundings).

3.5. Development Barriers in the Area of Drinking Water Supply

Correlation and regression analysis showed a statistically significant direct dependence between the low quality of drinking water supply and the existence of development barriers in this area. Thus, the assumption that the growing frequency or intensity of barriers is linked to heightening DWSTI was confirmed. Estimates of linear regression are presented in Table 7.
The average of the Barrier Indicator in municipalities up to 300 inhabitants takes a value of 0.463; in the case of municipalities over 300 inhabitants, the average value of the indicator is 0.449. The most significant barriers were identified by the representatives of small municipalities in the area of ensuring funds, i.e., a lack of funds and the related insecurities in acquiring subsidies and the risk of indebting the municipality (Table 8). Furthermore, it was stated that acquiring subsidies is connected to the complex administration of projects, but the legal environment itself is not the primary barrier. Within the survey, municipality representatives also declared that the disinterest of the population in heightening the quality of drinking water or the reluctance of neighboring municipalities to cooperate in shared projects was not a barrier. Differences between the size groups of small municipalities are not significant, a fact which is confirmed by the result of the paired t-test (p-value = 0.2823); nonetheless, in comparison to other types of barriers, the aforementioned economic barriers interfere relatively more with the group of the smallest municipalities.

4. Discussion

4.1. Connections between Socio-Economic Level of Municipalities and Insufficient Drinking Water Supply

The spatial differentiation of municipalities with problematic drinking water supply proves to be dependent on the concurrence of local and regional factors. Local factors can include those such as the availability of local water sources [11], the efficiency of the built-up area’s layout in terms of infrastructure costs [25,56], or the behavior of consumers and their willingness to pay for higher-quality drinking water security [47,68]. For example, regional factors influence the possibility for municipalities to connect to centralized regional water supply systems [55,63]. Differentiating the degree of the influence of individual factors is not possible when strictly based on the spatial differentiation of the composite indicator as DWSTI is used in the study. However, we can claim that the determined uneven distribution of DWSTI values does not correspond to basic spatial patterns of the socio-economic peripherality of municipalities on a nationwide scale [59,60,67]. As the spatial distribution of DWSTI results showed, the most significant clusters of problematic municipalities are found in socio-economically established areas, for example, on the periphery of the metropolitan region of Prague or in urban regions with a metropolitan function (Pilsen-South district). However, the possible deduction that problems with drinking water supply are primarily linked to the process of suburbanization [31,32] cannot be confirmed unambiguously in regard to other identified clusters of problematic municipalities in peripheral regions (e.g., on the border of the Central Bohemian and South Bohemian Region).
Statistical analysis has shown in municipalities in the category of 300 to 2000 inhabitants that problems with drinking water are linked to the larger relative growth in the population via migration and a higher relative number of economic subjects, and thus to factors indicating pressure on strengthening the drinking water supply system. This can be an explanation for the incongruity between the non-peripheral position from a state-wide socio-economic standpoint and insufficient drinking water supply as a particular indicator of peripherality on a regional level. Furthermore, results have proven the connection between DSWTI and the lower intensity of housing development. Insufficient drinking water supply in municipalities can also function as a limit to the development of municipalities. Problems with drinking water supply are then a selective factor in the varying dynamics of development in an otherwise socio-economically advantageous position on the peripheries of urban agglomerations [33,34]. The regional policy of drinking water supply, for example, the construction of key water supply pipelines or the division of extraction capacities, can therefore influence the differentiation in the level of municipalities’ development [41]. The connection between the insufficient drinking water supply and regional development can be partially explained via the concept of aspatial peripherality. This concept links the development of a territory to factors not affected by socio-economic position, for example, ICT infrastructure or the quality of social capital [85]. If we draw from the examination of the water supply infrastructure of the studied municipalities and compare their position with maps of local infrastructure [85], we can consider the network routing of individual regional water supply systems as an explaining factor of peripherality [86]. At the same time, the discussed factor of available connections to regional water supply systems is usually not taken into consideration at all in defining peripheral areas within complex development studies in the Czech Republic [59,60,65,67].
As is shown in numerous studies, spatial types of built-up areas also have a distinct impact on the costs of connecting to a shared water supply [25,56,77]. This connection was also partially confirmed by the determined statistical dependence of the relationship between DWSTI and the low concentration of the built-up area in municipalities with less than 300 inhabitants.

4.2. Insufficient Drinking Water Supply as a Limiting Factor to the Socio-Economic Development of Municipalities

Based on the results, insufficient drinking water supply can also be considered an important cause of the deprivation of municipalities’ development. According to the deprivation theory, individual dimensions of deprivation correlate; nonetheless, their mutual spatial connections are often too weak to create a spatial pattern [65,87]. The completed examination of development problems shows that small municipalities are generally face a decrease in and aging of the population, poor state of roads, and insufficient areas for housing development, fact which correspond to research on a nationwide level [42,43]. As a result of such long-term trends, the depopulation of some rural areas can even be a motive for reassessing planned capacities of water supply infrastructure in regions with a significantly decreasing population [26].
The completed examination of barriers has shown that a shared factor limiting the development of small municipalities is a lack of funds. In a certain manner, this deals with the influence of the retroaction of a particular deprivation in the municipality’s development (Figure 9). The lack of a municipality’s financial resources does not allow for investments into the municipality’s infrastructure. Subsequently, the insufficient provision of drinking water capacity resources limits the territorial and economic development of municipalities, which in turn blocks the increase in financial resources. The possibility to invest in water supply infrastructure potentially requires the financial participation of the inhabitants, which proves to be socially intolerable. This factor may be deepened by the lower economic level of the population of undeveloped municipalities [69] and thus also by their lower level of willingness to financially contribute to better infrastructure [45].
According to mayors’ opinions, the low interest of the population in improving water quality is not one of the main barriers to improving the situation. Surveys suggest that a larger proportion of the population agrees with an increase in the price of drinking water if it were to increase its quality [61].
Inhabitants would rather keep their individual supply from their own wells, as it proves to be the cheapest solution. Problems with water quality in such a solution are usually not reliably identifiable [11]. However, as our examination of problematic aspects has shown, efforts to dig new individual wells or deepen existing ones is currently a highly significant problem. There is justified concern that the local supply of ground water may not keep up with uncontrolled extraction for the needs of individual households. In recent years, these local sources in individual cases have already reached their limit and municipalities have had to deal with the temporary, provisional supply of drinking water [17,27]. Heightened interest in the use of local sources of ground water has also been recorded abroad [11]. At the same time, there is a debate on the search for a balance between the advantages of using local water sources and the benefits of centralized drinking water supply via a regional water supply system [37,55,63,88]. Differences in solutions lie not only in economic optimization and establishing a correct price policy. On one hand, there is the professionalism and the certainty of supply from a regional water supply system [37,88], and on the other is the advantage of self-sufficiency and the positive impact of the local community’s involvement in the use of local natural resources and their help in protecting them [40,41,57,89]. A key factor in the selection of a proper solution can be the natural conditions of individual municipalities; therefore, on a local level, their detailed analysis and monitoring is recommended as a starting point for adaptation measures for the impacts of climate change [90,91,92].

4.3. Research Limitations

The limits of the completed research can be linked primarily to the implementation of the questionnaire survey. One frequently mentioned problem is the so-called self-selection bias, in which greater tendencies can be observed in some respondents towards taking part in surveys than others, which can also apply to some municipality representatives. Decreasing this distortion could be achieved by extending the deadline for filling in the questionnaires and repeating the call to fill them in.
On the other hand, extending the period for filling in the questionnaire was not seen as desirable in regard to the initial onset of the COVID-19 pandemic in the Czech Republic in March of 2020. In addition, the return rate of almost 40% can be considered very good. Another limitation may have been the date of the survey’s realization, as the initial measures of Czech municipalities against the spread of COVID-19 at the beginning of March 2020 may have negatively affected the degree of return, and responses to some questions concerning problems of municipalities may have been influenced by the current situation.
The opinions of the representatives of the municipality can namely express existing perceptional, institutional, and economic barriers. Differing opinions on the significance and solutions to problems with drinking water may also be held by the representatives of the professional public or water resource management companies [93], e.g., in the question of the quality of drinking water [12], the security of drinking water supply provision [88], or the degree of influence on the regional development of municipalities [23]. It can be assumed that the perception of barriers generally differs according to a focus on either local (municipal) or regional planning [55].
Mayors’ opinions may not reflect the views of the inhabitants in areas such as the perception of water quality [94,95]. However, the way the population perceives water quality is not a question of its chemical state, but rather of aesthetic and psychological factors [95]. These factors are influenced by the reputation of drinking water quality in the media [96] and the ways in which water companies communicate with the population [94].
In order to capture the relationship between DWSI and selected factors, correlation and regression analysis tools were used. The authors carried out a measurement of the degree of multicollinearity using VIF, and estimates were made with the Robust Regression condition in order reach the best and most unbiased estimates possible. A limitation to the results of the correlation and regression analysis may be the issue of the availability of indicators for municipalities. Municipalities may be made up of individual settlements, usually of one larger settlement and a number of associated ones. The layout of the built-up area, namely in mountainous regions is not necessarily compact, and can also be dispersed or linear.

4.4. Barriers and Opportunities for Drinking Water Supply in Small Municipalities

According to the results of the survey, representatives of small municipalities are aware of the gravity of the drinking water problem and would like to find a solution. The impacts of climate change are contributing to a heightened sensitivity to this issue in the Czech Republic, as is happening similarly in other regions [16,97,98,99]. The current experience of some municipalities with water shortage as a consequence of climate change are perceived in this regard as being more significant than, for example, the risks of floods on the level of small municipalities [100,101,102,103] or problems with managing rainwater in cities [104,105]. In terms of the theoretical concepts concerning barriers in adapting to climate change [14], the issue of securing drinking water on the level of small municipalities in the Czech Republic is moving from the problem identification phase to the planning phase or even the realization of measures. Our examination of the development problems of small municipalities has confirmed this.
In the next phase, there is a need to raise awareness among the population about the risks of insufficient drinking water supply. The perception of health risks depends on the degree of the population’s environmental and health literacy [106,107,108]. Education and high-quality media communication on the part of water companies or municipalities are therefore suitable tools for improving the attitudes of the population [94]. Environmental education can increase interest in dealing with environmental problems related to climate change [109]. However, the personal benefit of individuals is an important factor in pro-environmental behavior [75,109].
Drinking water supply infrastructure issues are part of the Strategic Framework Czech Republic 2030—National Sustainable Development Goals, in particular to Goal 6 (Clean Water and Sanitation), Goal 9 (Industry, Innovation and Infrastructure), and Goal 13 (Climate Action) [110]. Our results in accordance with this document confirm the need to support the quality of water supply as a precondition for development of a resilient economy and quality of life in connection with the adaptation of regions to climate change [110]. At present, plans for managing drought and water shortage are being created in the Czech Republic according to unified methodology for individual regions [90]. A part of possible measures on the level of municipalities is, for example, the possibility of limiting water extraction, implementing technologies that reduce water consumption, or securing alternate sources of water in times of drought [90]. According to the completed survey, roughly 40% of municipalities with less than 2000 inhabitants issue restrictions concerning the consumption of drinking water.
Progress in the issue of drinking water supply can take place only if the barriers identified by our research—namely, those in the economic area—are overcome. Securing financial resources in this context is not within the capabilities of small municipalities on a local level [23,24,69]. A solution is possible if it is primarily based on regional and trans-regional support within rural development policy and the utilization of municipalities’ active approach [111]. The more effective use of water resources on the state level can also be positively influenced by improving the system of issuing permits to extract water. Change the fee policy for extractions of surface or ground water is also recommended [112].

5. Conclusions

The representatives of local governments view problems regarding drinking water supply as priority issues in the development of small municipalities in the Czech Republic. Within the set of 2110 municipalities with less than 2000 inhabitants, 14% of municipality representatives see drinking water supply as fundamental and assume that, in the next 10 years, water supply will fundamentally threaten the development of municipalities. Frequently in the group of the smallest municipalities with less than 300 inhabitants, absent water supply infrastructure in the municipality is a current and fundamental problem. Mayors’ perception of drinking water problems is most significantly linked to concerns about water shortages in existing wells as a consequence of the creation of new wells for individual use. This trend is linked to the local decrease of ground water supply as a consequence of repeating periods of drought in the Czech Republic at present. It is very important that mayors are aware of the problem and are trying to improve drinking water supplies. The perception of the risks of insufficient drinking water supply should also be strengthened via appropriate communication with the population.
Insufficient funds in municipalities’ budgets have been identified as the greatest barriers to a possible improvement to the situation. Small municipalities are in a situation in which the lack of funds prevents investment into water supply infrastructure. The economic barrier is also linked to the high unit costs of connecting households in small or non-compact settlements. As a consequence, the poor quality of ensuring drinking water sources deepens the socio-economic deprivation of small municipalities, because it limits new housing construction and thus becomes a fundamental limitation to their development. The described lock-in development is visible namely in some small municipalities on the peripheries of agglomerations, in which there is a demand for properties for new housing development as a consequence of suburbanization processes, but quality drinking water supply is absent. The unavailability of water supply infrastructure together with a local shortage of water sources is becoming a selective factor of development for territories on a regional level. Insufficient drinking water supply blocks the development of municipalities and influences their peripheral position in the regional settlement hierarchy.

Author Contributions

Conceptualization, J.K.; methodology, J.K. and L.K.; software, L.K. and D.V.; validation, L.K.; formal analysis, L.K. and J.K.; investigation, P.H., L.K., T.H. and J.K.; resources, L.K., D.V. and J.K.; data curation, L.K., D.V., J.K. and P.H.; writing—original draft preparation, J.K., L.K. and D.V.; writing—review and editing, J.K., L.K. and P.H.; visualization, D.V., J.K. and L.K.; supervision, T.H.; project administration, P.H.; funding acquisition, P.H. and T.H. All authors have read and agreed to the published version of the manuscript.

Funding

This research was funded by the Technology Agency of the Czech Republic, Grant TL02000060 “Accessibility of Drinking Water for Inhabitants of Small Municipalities as an Indicator of the Socio-economic Development of Society”.

Institutional Review Board Statement

Not applicable.

Informed Consent Statement

Not applicable.

Data Availability Statement

The data presented in this study are available on request from the corresponding author.

Conflicts of Interest

The authors declare no conflict of interest. The funders had no role in the design of the study; in the collection, analyses, or interpretation of data; in the writing of the manuscript; or in the decision to publish the results.

Appendix A

Table A1. Questionnaire survey—questions selected for the statistical analysis.
IDQuestion
AHow would you assess the present state of drinking water supply in your municipality?
(scale responses: strongly agree; agree; neutral; disagree; strongly disagree)
A1The drinking water supply in our municipality is problematic
A2We are lacking water supply infrastructure in our municipality
A3Local water sources are not keeping up with the consumption of our municipality
A4New wells for individual consumption are causing concerns among the municipality’s inhabitants regarding the lack of water in wells and boreholes
A5The low amount of drinking water sources is limiting the development of our municipality
A6Drinking water is being wasted in our municipality
A7The quality of drinking water in our municipality is not being sufficiently monitored
A8The quality of drinking water in our municipality is problematic
A9Costs for ensuring drinking water for our municipality are too high
A10Sources and supply of drinking water for our municipality are not keeping up with consumption
BWhat do you see as barriers to the development of drinking water supply in your municipality?
(scale responses: not a barrier; partial barrier; fundamental barrier)
B1Limited competencies of the municipal government
B2Lack of funds in the budget of the municipality
B3Threat of immoderate debt to the municipality
B4Uncertainty of acquiring money from a project (from subsidies)
B5Complicated administration of projects
B6Unwillingness of neighboring municipalities to cooperate
B7Excessively long realization period
B8Inhabitants‘ disagreement with change
B9Unacceptable increase in water rates
B10There is no interest in heightening the quality of drinking water
B11Insufficient capacities of companies in realization
B12Insufficient methodological support (of the region, state)
B13Barriers in legal regulations
CC1: For each issue, mark the degree to which you think the given area is important for the development of your municipality.
(scale responses: does not limit at all; does not limit; neutral; limits; strongly limits)
C2: For each issue, mark the degree to which you think the given area is a threat to your municipality’s development over the next 10 years (scale responses: does not threaten at all; does not threaten; neutral; threatens; strongly threatens)
C1State of roads
C2Transport services (to regional or territorial centers)
C3Air quality
C4Traffic burden on roads
C5Waste management
C6Threat of floods
C7Drinking water supply
C8Waste-water purification
C9Civic amenities of the municipality—e.g., a store, nursery school, basic school
C10Availability of quality medical care
C11Threat of soil erosion or degradation
C12Decrease or aging of the population
C13Sufficient areas for housing development
C14Work opportunities in the municipality and accessible surroundings
C15Suitable conditions for entrepreneurship in the municipality
C16Safety in the municipality
C17Conditions for culture, sports and club activity
C18Sufficient funds in the municipality’s budget

Appendix B

Table A2. Indicators of the present state of the municipalities—descriptive statistics.
SIZE 1ObsMeanStd. Dev.MinMax
w_kanmpr5611.55990.58230.50004.5000
w_priprel_obyv561−0.03200.0724−0.14910.1203
w_prisrel_obyv5610.10190.1448−0.21660.3862
w_indst19561138.883455.681947.6191242.8571
w_ekonsob_obyv5610.13180.03450.05950.1892
w_nez18195612.75371.63580.00006.0920
w_bytyrel_obyv5610.05090.03630.00000.1376
w_hustzast5610.03770.01330.00880.0591
w_hustmkom5610.72470.65820.00002.6775
w_huskozas56165.797453.03180.0000190.8470
SIZE 1ObsMeanStd. Dev.MinMax
w_kanmpr6282.62741.15320.36674.5714
w_priprel_obyv628−0.00540.0521−0.14910.1203
w_prisrel_obyv6280.10940.1260−0.21660.3862
w_indst19628120.493734.018547.6191242.8571
w_ekonsob_obyv6280.12470.02800.05950.1892
w_nez18196282.70491.32610.17926.0920
w_bytyrel_obyv6280.05620.03240.00000.1376
w_hustzast6280.02400.00990.00670.0591
w_hustmkom6280.83260.71500.00002.6775
w_huskozas62859.144247.70350.0000190.8470
Source: own calculations based on data from the Czech Statistical Office [81,82,83,84].

References

  1. Wada, Y.; Bierkens, M.F.P. Sustainability of global water use: Past reconstruction and future projections. Environ. Res. Lett. 2014, 9, 104003. [Google Scholar] [CrossRef]
  2. Moriarty, P.; Smits, S.; Butterworth, J.; Franceys, R. Trends in rural water supply: Towards a service delivery approach. Water Altern. 2013, 6, 329–349. [Google Scholar]
  3. Hanasaki, N.; Fujimori, S.; Yamamoto, T.; Yoshikawa, S.; Masaki, Y.; Hijioka, Y.; Kainuma, M.; Kanamori, Y.; Masui, T.; Takahashi, K.; et al. A global water scarcity assessment under Shared Socio-economic Pathways—Part 2: Water availability and scarcity. Hydrol. Earth Syst. Sci. 2013, 17, 2393–2413. [Google Scholar] [CrossRef] [Green Version]
  4. Rogers, P.P.; Llamas, M.R.; Martínez-Cortina, L. Water Crisis: Myth or Reality; Taylor and Francis/Balkema: Leiden, The Netherlands, 2006. [Google Scholar]
  5. Brown, A.; Matlock, M.D. A Review of Water Scarcity Indices and Methodologies; University of Arkansas, The Sustainability Consortium: Fayetteville, NC, USA, 2011. [Google Scholar]
  6. Liu, J.; Yang, H.; Gosling, S.N.; Kummu, M.; Flörke, M.; Pfister, S.; Hanasaki, N.; Wada, Y.; Zhang, X.; Zheng, C.; et al. Water scarcity assessments in the past, present, and future. Earth’s Future 2017, 5, 545–559. [Google Scholar] [CrossRef]
  7. Plummer, R.; de Loë, R.; Armitage, D. A systematic review of water vulnerability assessment tools. Water Resour. Manag. 2012, 26, 4327–4346. [Google Scholar] [CrossRef] [Green Version]
  8. Europe’s Water in Figures. An Overview of the European Drinking Water and Waste Water Sectors; EurEau, The European Federation of National Associations of Water Services: Brussels, Belgium, 2017.
  9. Water Resources across Europe—Confronting Water Scarcity and Drought; European Environment Agency: Copenhagen, Denmark, 2009.
  10. Bodík, I.; Ridderstolpe, P. (Eds.) Sustainable Sanitation in Central and Eastern Europe—Addressing the Needs of Small and Medium-Size Settlements; Global Water Partnership contribution to International Year of Sanitation: Bratislava, Slovakia, 2008. [Google Scholar]
  11. Trobec, T.; Lampič, B.; Plut, D. The changing role of local water resources over time (The case of Slovenian rural region Bela krajina). Eur. Countrys. 2017, 9, 177–193. [Google Scholar] [CrossRef] [Green Version]
  12. Tchórzewska-Cieślak, B.; Pietrucha-Urbanik, K.; Szpak, D. Safety problems of small water supply systems. J. KONBiN 2016, 37, 51–72. [Google Scholar] [CrossRef] [Green Version]
  13. Piasecki, A. Water and sewage management issues in rural Poland. Water 2019, 11, 625. [Google Scholar] [CrossRef] [Green Version]
  14. Moser, S.C.; Ekstrom, J.A. A framework to diagnose barriers to climate change adaptation. Proc. Natl. Acad. Sci. USA 2010, 107, 22026–22031. [Google Scholar] [CrossRef] [Green Version]
  15. Donovan, R.; Evans, J.; Bryson, J.; Porter, L.; Hunt, D. Large-Scale Urban Regeneration and Sustainability: Reflections on the ‘Barriers’ Typology; The University of Birmingham: Birmingham, UK, 2005. [Google Scholar]
  16. Martinovský, M. Sekuritizace hrozby nedostatku vody v České republice. Obrana Strateg. 2009, 9, 25–48. (In Czech) [Google Scholar] [CrossRef] [Green Version]
  17. Garnier, M.; Holman, I. Critical review of adaptation measures to reduce the vulnerability of European drinking water resources to the pressures of climate change. Environ. Manag. 2019, 64, 138–153. [Google Scholar] [CrossRef] [PubMed]
  18. Thomas, J.; Kyncl, M.; Langarová, S. Assessing relations between water supply and demand in the Odra and Morava river basins. Geosci. Eng. 2012, 58, 41–48. [Google Scholar] [CrossRef]
  19. Beran, A.; Hanel, M.; Nesládková, M.; Vizina, A.; Vyskoč, P.; Kožín, R. Climate change impacts on water balance in Western Bohemia and options for adaptation. Water Supply 2019, 19, 323–335. [Google Scholar] [CrossRef]
  20. Koncepce Ochrany Před Následky Sucha Pro Území České Republiky; Ministry of Agriculture: Prague, Czech Republic; Ministry of the Environment: Prague, Czech Republic; T.G. Masaryk Water Research Institute: Prague, Czech Republic, 2017. (In Czech)
  21. Loon, A.V.; Lanen, H.V. Testing the observation-modelling framework to distinguish between hydrological drought and water scarcity in case studies around Europe. Eur. Water 2015, 49, 65–75. [Google Scholar]
  22. Dědič, P. Kanalizaci s čističkou má více než polovina obcí. Statistika&My 2018, 8, 27–28. (In Czech) [Google Scholar]
  23. Bernard, J. Endogenní rozvojové potenciály malých venkovských obcí—Obtížné hledání a měření jejich vlivu. Sociologický časopis 2011, 47, 745–775. (In Czech) [Google Scholar] [CrossRef]
  24. Duda, J.; Bogdanova, V.; Korych, T.; Lípa, O. Vodovody a kanalizace ČR. Ekonomika Ceny Informace; Ministry of Agriculture: Prague, Czech Republic, 2020. (In Czech) [Google Scholar]
  25. Pawełek, J. Degree of development and functionality of the water supply and sewage systems in rural Poland. Barometr Regionalny 2016, 14, 141–149. [Google Scholar]
  26. Huning, S.; Naumann, M.; Bens, O.; Hüttl, R.F. Transformations of modern infrastructure planning in rural regions: The case of water infrastructures in Brandenburg, Germany. Eur. Plan. Stud. 2011, 19, 1499–1516. [Google Scholar] [CrossRef]
  27. Datel, J.; Hrabánková, A. Specifika místních vodních zdrojů při zásobování obyvatelstva pitnou vodou. Vodohospodářské Technicko-Ekonomické Informace 2016, 58, 21–27. (In Czech) [Google Scholar] [CrossRef]
  28. Teichmann, M.; Kuta, D.; Endel, S.; Szeligova, N. Modeling and optimization of the drinking water supply network—A system case study from the Czech Republic. Sustainability 2020, 12, 9984. [Google Scholar] [CrossRef]
  29. Czech Statistical Office. Česká Republika od roku 1989 v Číslech. 2021. Available online: https://www.czso.cz/csu/czso/ceska-republika-od-roku-1989-v-cislech-aktualizovano-1452021 (accessed on 25 May 2021).
  30. Ouředníček, M. Differential suburban development in the Prague urban region. Geogr. Ann. Ser. B Hum. Geogr. 2007, 89, 111–126. [Google Scholar] [CrossRef]
  31. Sýkora, L.; Mulíček, O. The micro-regional nature of functional urban areas (FUAs): Lessons from the analysis of the Czech urban and regional system. Urban Res. Pract. 2009, 2, 287–307. [Google Scholar] [CrossRef]
  32. Sýkora, L.; Ouředníček, M. Sprawling post-communist metropolis: Commercial and residential suburbanisation in Prague and Brno, the Czech Republic. In Employment Deconcentration in European Metropolitan Areas: Market Forces versus Planning Regulations; Razin, E., Dijst, M., Vázquez, C., Eds.; Springer: Dordrecht, The Netherlands, 2007; pp. 209–233. [Google Scholar]
  33. Kladivo, P.; Roubínek, P.; Opravil, Z.; Nesvadbová, M. Suburbanization and local governance-positive and negative forms: Olomouc case study. Bull. Geogr. Socioecon. Ser. 2015, 27, 95–107. [Google Scholar] [CrossRef] [Green Version]
  34. Kubeš, J.; Nováček, A. Suburbs around the Czech provincial city of České Budějovice—Territorial arrangement and problems. Hung. Geogr. Bull. 2019, 68, 65–78. [Google Scholar] [CrossRef] [Green Version]
  35. Kniezková, T. Interest of Czech population in water management. Eur. Countrys. 2013, 5, 197–211. [Google Scholar] [CrossRef]
  36. Kureková, L.; Hejduková, P.; Hejduk, T.; Cölba, M.; Roub, R. Drinking water supply as a factor for decisions to change housing—Views of inhabitants in a nation-wide questionnaire survey. In Proceedings of the 14th Economics & Finance Conference, Lisbon, Portugal, 28–29 September 2020; pp. 99–109. [Google Scholar] [CrossRef]
  37. Pierce, G.; Lai, L.; DeShazo, J.R. Identifying and addressing drinking water system sprawl, its consequences, and the opportunity for planners’ intervention: Evidence from Los Angeles County. J. Environ. Plan. Manag. 2019, 62, 2080–2100. [Google Scholar] [CrossRef]
  38. Hanak, E. Is water policy limiting residential growth? Evidence from California. Land Econ. 2008, 84, 31–50. [Google Scholar] [CrossRef]
  39. Lieske, S.N.; McLeod, D.M.; Coupal, R.H. Infrastructure development, residential growth and impacts on public service expenditure. Appl. Spat. Anal. 2015, 8, 113–130. [Google Scholar] [CrossRef] [Green Version]
  40. Kallis, G. Coevolution in water resource development: The vicious cycle of water supply and demand in Athens, Greece. Ecol. Econ. 2010, 69, 796–809. [Google Scholar] [CrossRef]
  41. Otero, I.; Kallis, G.; Aguilar, R.; Ruiz, V. Water scarcity, social power and the production of an elite suburb: The political ecology of water in Matadepera, Catalonia. Ecol. Econ. 2011, 70, 1297–1308. [Google Scholar] [CrossRef]
  42. Perlín, R.; Kučerová, S.; Kučera, Z. Typologie venkovského prostoru Česka. Geografie 2010, 115, 161–187. (In Czech) [Google Scholar] [CrossRef]
  43. Jančák, V.; Havlíček, T.; Chromý, P.; Marada, M. Regional differentiation of selected conditions for the development of human and social capital in Czechia. Geografie 2008, 113, 269–284. [Google Scholar] [CrossRef]
  44. Ženka, J.; Slach, O.; Sopkuliak, A. Typologie českych nemetropolitních regionů z hlediska faktorů, mechanismů a akterů regionalního rozvoje. Geografie 2017, 122, 281–309. (In Czech) [Google Scholar] [CrossRef] [Green Version]
  45. Filipidis, E.I. A willingness to pay survey for improved water supply conditions in Taxiarchis municipal district of Halkidiki prefecture, Greece. New Medit. 2005, 4, 43–47. [Google Scholar]
  46. De Doria, M.F.; Pidgeon, N.; Hunter, P.R. Perceptions of drinking water quality and risk and its effect on behaviour: A cross-national study. Sci. Total Environ. 2009, 407, 5455–5464. [Google Scholar] [CrossRef]
  47. Fielding, K.S.; Russell, S.; Spinks, A.; Mankad, A. Determinants of household water conservation: The role of demographic, infrastructure, behavior, and psychosocial variables. Water Resour. Res. 2012, 48, W10510. [Google Scholar] [CrossRef] [Green Version]
  48. Tussupova, K.; Berndtsson, R.; Bramryd, T.; Beisenova, R. Investigating willingness to pay to improve water supply services: Application of contingent valuation method. Water 2015, 7, 3024–3039. [Google Scholar] [CrossRef] [Green Version]
  49. Hejduková, P.; Kureková, L. Water scarcity: Regional analyses in the Czech Republic from 2014 to 2018. Oeconomia Copernic. 2020, 11, 161–181. [Google Scholar] [CrossRef] [Green Version]
  50. Hossain, F.; Arnold, J.; Beighley, E.; Brown, C.; Burian, S.; Chen, J.; Madadgar, S.; Mitra, A.; Nizogi, D.; Pielke, R.; et al. Local-to-regional landscape drivers of extreme weather and climate: Implications for water infrastructure resilience. J. Hydrol. Eng. 2015, 20, 02515002. [Google Scholar] [CrossRef] [Green Version]
  51. Wurbs, R.A. Institutional framework for modeling water availability and allocation. Water 2020, 12, 2767. [Google Scholar] [CrossRef]
  52. Mitrică, B.; Mocanu, I. Drinking water supply and consumption territorial disparities in the Timiş Plain, Analele Universităţii din Oradea. Seria Geografie 2011, 16, 239–247. [Google Scholar]
  53. Hanak, E.; Browne, M.K. Linking housing growth to water supply: New planning frontiers in the American west. J. Am. Plan. Assoc. 2006, 72, 154–166. [Google Scholar] [CrossRef]
  54. Furlong, C.; De Silva, S.; Guthrie, L.; Considine, R. Developing a water infrastructure planning framework for the complex modern planning environment. Util. Policy 2016, 38, 1–10. [Google Scholar] [CrossRef]
  55. Lienert, J.; Schnetzer, F.; Ingold, K. Stakeholder analysis combined with social network analysis provides fine-grained insights into water infrastructure planning processes. J. Environ. Manag. 2013, 125, 134–148. [Google Scholar] [CrossRef] [Green Version]
  56. Minar, S. External and Internal Drivers for the Water Sector: Global Change and Paradigm Shift. In Urban Water II; Mambretti, S., Brebbia, C.A., Eds.; WIT Press: Southampton, UK, 2014; Volume 139, pp. 303–314. [Google Scholar] [CrossRef] [Green Version]
  57. Bruckmeier, K.; Tovey, H. Knowledge in sustainable rural development: From forms of knowledge to knowledge processes. Sociol. Rural. 2008, 48, 313–329. [Google Scholar] [CrossRef]
  58. Bernard, J. Community satisfaction in Czech rural communities. Sociol. Rural. 2015, 55, 205–226. [Google Scholar] [CrossRef]
  59. Miller, E.; Buys, L. The impact of social capital on residential water-affecting behaviors in a drought-prone Australian community. Soc. Nat. Resour. 2008, 21, 244–257. [Google Scholar] [CrossRef] [Green Version]
  60. Graymore, M.L.M.; Wallis, A.M. Water savings or water efficiency? Water-use attitudes and behaviour in rural and regional areas. Int. J. Sustain. Dev. World Ecol. 2010, 17, 84–93. [Google Scholar] [CrossRef] [Green Version]
  61. Kušová, D.; Těšitel, J. Ochota veřejnosti ekonomicky se podílet na zajištění garantované kvality pitné vody. Regionální Rozvoj Mezi Teorií Praxí 2017, 2017, 95–105. (In Czech) [Google Scholar]
  62. Turton, A.R. Water and sustainable development: A southern perspective. In Encyclopedia of Life Support Systems (EOLSS), Water and Development II; UNESCO-EOLSS Publishers Ltd.: Paris, France, 2002. [Google Scholar]
  63. Saurí, D.; Moral, L.D. Recent developments in Spanish water policy. Alternatives and conflicts at the end of the hydraulic age. Geoforum 2001, 32, 351–362. [Google Scholar] [CrossRef]
  64. Agarwal, S.; Rahman, S.; Errington, A. Measuring the determinants of relative economic performance of rural areas. J. Rural Stud. 2009, 25, 309–321. [Google Scholar] [CrossRef]
  65. Bernard, J. Prostorové vzorce rozvinutosti venkovských obcí Česka. Geografie 2012, 117, 72–94. (In Czech) [Google Scholar] [CrossRef] [Green Version]
  66. Rak, J.; Boryczko, K. The issue of water resources diversification in water supply systems. J. KONBiN 2015, 35, 157–168. [Google Scholar] [CrossRef] [Green Version]
  67. Harrington, C.; Curtis, A.; Black, R. Locating communities in natural resource management. J. Environ. Policy Plan. 2008, 10, 199–215. [Google Scholar] [CrossRef]
  68. Garcia, X.; Ribas, A.; Llausàs, A.; Saurí, D. Socio-demographic profiles in suburban developments: Implications for water-related attitudes and behaviors along the Mediterranean coast. Appl. Geogr. 2013, 41, 46–54. [Google Scholar] [CrossRef]
  69. Salus, J.; Pilař, T.; Majerová, V. Threats to rural society in the Czech Republic and its future in the context of global risks. Rural Areas Dev. 2016, 13, 91–104. [Google Scholar]
  70. Morote, Á.-F.; Hernández, M.; Rico, A.-M. Causes of domestic water consumption trends in the city of Alicante: Exploring the links between the housing bubble, the types of housing and the socio-economic factors. Water 2016, 8, 374. [Google Scholar] [CrossRef] [Green Version]
  71. Kopp, J.; Frajer, J.; Novotná, M. New types of ponds? Changing of quantity and function of water bodies in rural built-up areas (Pilsen Region, Czechia). Eur. Countrys. 2017, 9, 145–162. [Google Scholar] [CrossRef] [Green Version]
  72. Domene, E.; Saurí, D.; Parés, M. Urbanization and sustainable resource use: The case of garden watering in the metropolitan region of Barcelona. Urban Geogr. 2005, 26, 520–535. [Google Scholar] [CrossRef]
  73. Vidal, M.; Domene, E.; Sauri, D. Changing geographies of water-related consumption: Residential swimming pools in suburban Barcelona. Area 2011, 43, 67–75. [Google Scholar] [CrossRef]
  74. Syme, G.J.; Shao, Q.; Po, M.; Campbell, E. Predicting and understanding home garden water use. Landsc. Urban Plan. 2004, 68, 121–128. [Google Scholar] [CrossRef]
  75. Slavíková, L.; Macháč, J.; Slámová, V.; Stránský, D.; Kabelková, I. Proč České Domácnosti (Ne)Využívají Srážkovou Vodu? Výsledky Reprezentativního Šetření STEM a Řízených Rozhovorů v Domácnostech; Institute for Economic and Environmental Policy (IEEP): Ústí nad Labem, Czech Republic, 2021. (In Czech) [Google Scholar]
  76. Kubeš, J.; Chvojková, A. Back to peripheries based on remoteness. Human capital in the peripheral municipalities of South Bohemia. J. Rural Stud. 2020, 79, 116–124. [Google Scholar] [CrossRef]
  77. Sauer, J. Economies of scale and firm size optimum in rural water supply. Water Resour. Res. 2005, 41, W11418. [Google Scholar] [CrossRef]
  78. ArcČR 500—Digital Geographic Database of the Czech Republic, Version 3.3; ARCDATA PRAHA, Land Survey Office in Prague, Czech Statistical Office: Prague, Czech Republic, 2016; Available online: https://www.arcdata.cz/produkty/geograficka-data/arccr-500 (accessed on 15 October 2019).
  79. Jenks, G.F. The Data Model Concept in Statistical Mapping. In International Yearbook of Cartography; C. Bertelsmann Verlag: Gütersloh, Germany, 1967; Volume 7, pp. 186–190. [Google Scholar]
  80. Spence, M. Colour in cartography. In The Routledge Handbook of Mapping and Cartography; Kent, A.J., Vujakovic, P., Eds.; Routledge: Abingdon, UK; New York, NY, USA, 2018; pp. 324–345. [Google Scholar]
  81. Czech Statistical Office. Data for Local Action Groups (LAGs)—Data by Municipalities, 2014–2019, with LAG Code Lists—Updated on 30 September 2020. Available online: https://www.czso.cz/csu/czso/data_pro_mistni_akcni_skupiny_mas (accessed on 25 October 2020).
  82. Czech Statistical Office. MOS—Municipal Statistics—Time Series. 2020. Available online: https://vdb.czso.cz/mos/ (accessed on 25 October 2020).
  83. Czech Statistical Office. Open Dates for Municipal Council Elections 2014. Available online: https://volby.cz/opendata/kv2014/kv2014_opendata.htm (accessed on 30 November 2019).
  84. Czech Statistical Office. Open Dates for Municipal Council Elections 2018. Available online: https://volby.cz/opendata/kv2018/kv2018_opendata.htm (accessed on 30 November 2019).
  85. Copus, A.K. From core-periphery to polycentric development: Concepts of spatial and aspatial peripherality. Eur. Plan. Stud. 2001, 9, 539–552. [Google Scholar] [CrossRef]
  86. Sweco Hydroprojekt, a.s. Revize Funkčnosti Propojení a Zajištění Potenciálních Možností Nových Propojení Vodárenských Soustav v Období Sucha. Plán Rozvoje Vodovodů a Kanalizací Území České Republiky; Ministry of Agriculture: Prague, Czech Republic, 2020. (In Czech) [Google Scholar]
  87. Noble, M.; Wright, G.; Smith, G.; Dibben, C. Measuring multiple deprivation at the small-area level. Environ. Plan. A Econ. Space 2006, 38, 169–185. [Google Scholar] [CrossRef]
  88. Boryczko, K.; Rak, J. Method for assessment of water supply diversification. Resources 2020, 9, 87. [Google Scholar] [CrossRef]
  89. Rolston, A.; Linnane, S. Drinking water source protection for surface water abstractions: An overview of the group water scheme sector in the Republic of Ireland. Water 2020, 12, 2437. [Google Scholar] [CrossRef]
  90. Vlnas, R. Návrh obsahu plánu pro zvládání sucha a nedostatku vody v ČR. Vodohospodářské Technicko-Ekonomické Informace 2018, 60, 40–44. (In Czech) [Google Scholar]
  91. Kulhavý, Z.; Fučík, P. Adaptation options for land drainage systems toward sustainable agriculture and the environment: A Czech perspective. Pol. J. Environ. Stud. 2015, 24, 1085–1102. [Google Scholar] [CrossRef]
  92. Duffková, R.; Holub, J.; Fučík, P.; Rožnovský, J.; Novotný, I. Long-term water balance of selected field crops in different agricultural regions of the Czech Republic using Fao-56 and soil hydrological approaches. Sustainability 2019, 11, 5243. [Google Scholar] [CrossRef] [Green Version]
  93. Larson, K.L.; White, D.D.; Gober, P.; Harlan, S.; Wutich, A. Divergent perspectives on water resource sustainability in a public–policy–science context. Environ. Sci. Policy 2009, 12, 1012–1023. [Google Scholar] [CrossRef]
  94. Dettori, M.; Azara, A.; Loria, E.; Piana, A.; Masia, M.D.; Palmieri, A.; Cossu, A.; Castiglia, P. Population distrust of drinking water safety. Community outrage analysis, prediction and management. Int. J. Environ. Res. Public Health 2019, 16, 1004. [Google Scholar] [CrossRef] [PubMed] [Green Version]
  95. Kozisek, F.; Pomykacova, I.; Jeligova, H.; Cadek, V.; Svobodova, V. Survey of human pharmaceuticals in drinking water in the Czech Republic. J. Water Health 2013, 11, 84–97. [Google Scholar] [CrossRef] [PubMed]
  96. Hrudey, S.E.; Hrudey, E.J.; Pollard, S.J.T. Risk management for assuring safe drinking water. Environ. Int. 2006, 32, 948–957. [Google Scholar] [CrossRef] [Green Version]
  97. Beran, A.; Hanel, M. Definování zranitelných oblastí z hlediska nedostatku vody na území České republiky. Vodohospodářské Technicko-Ekonomické Informace 2015, 57, 23–26. (In Czech) [Google Scholar] [CrossRef]
  98. Jurgilevich, A.; Räsänen, A.; Groundstroem, F.; Juhola, S. A systematic review of dynamics in climate risk and vulnerability assessments. Environ. Res. Lett. 2017, 12, 013002. [Google Scholar] [CrossRef]
  99. Joakim, E.P.; Mortsch, L.; Oulahen, G. Using vulnerability and resilience concepts to advance climate change adaptation. Environ. Hazards 2015, 14, 137–155. [Google Scholar] [CrossRef]
  100. Slavíková, L.; Raška, P. This Is My Land! Privately Funded Natural Water Retention Measures in the Czech Republic. In Nature-Based Flood Risk Management on Private Land; Hartmann, T., Slavíková, L., McCarthy, S., Eds.; Springer: Cham, Switzerland, 2019; pp. 55–67. [Google Scholar]
  101. Slavíková, L.; Raska, P.; Kopáček, M. Mayors and “their” land: Revealing approaches to flood risk management in small municipalities. J. Flood Risk Manag. 2019, 12, e12474. [Google Scholar] [CrossRef] [Green Version]
  102. Slavíková, L. Effects of government flood expenditures: The problem of crowding-out. J. Flood Risk Manag. 2018, 11, 95–104. [Google Scholar] [CrossRef]
  103. Andráško, I. Why people (do not) adopt the private precautionary and mitigation measures: A review of the issue from the perspective of recent flood risk research. Water 2021, 13, 140. [Google Scholar] [CrossRef]
  104. Runhaar, H.; Mees, H.; Wardekker, A.; van der Sluijs, J.; Driessen, P.P.J. Adaptation to climate change-related risks in Dutch urban areas: Stimuli and barriers. Reg. Environ. Change 2012, 12, 777–790. [Google Scholar] [CrossRef] [Green Version]
  105. Kopp, J.; Ježek, J. Experience of Czech cities with the implementation of ecohydrological management. In Grazer Schriften der Geographie und Raumforschung; Institut für Geographie und Raumforschung: Graz, Austria, 2018; Volume 48, pp. 53–60. [Google Scholar]
  106. Carducci, A.; Fiore, M.; Azara, A.; Bonaccorsi, G.; Bortoletto, M.; Caggiano, G.; Calamusa, A.; De Donno, A.; De Giglio, O.; Dettori, M.; et al. Environment and health: Risk perception and its determinants among Italian university students. Sci. Total Environ. 2019, 691, 1162–1172. [Google Scholar] [CrossRef] [Green Version]
  107. Carducci, A.; Fiore, M.; Azara, A.; Bonaccorsi, G.; Bortoletto, M.; Caggiano, G.; Calamusa, A.; De Donno, A.; De Giglio, O.; Dettori, M.; et al. Pro-environmental behaviors: Determinants and obstacles among Italian university students. Int. J. Environ. Res. Public Health 2021, 18, 3306. [Google Scholar] [CrossRef] [PubMed]
  108. Sekera, J.; Preis, J.; Pazdiora, P. Health literacy on HIV infection among adolescents in the Czech Republic: A case study of two Czech cities Plzeň and České Budějovice. Epidemiol. Mikrobio. Imunol. 2020, 69, 182–188. [Google Scholar]
  109. Lehnert, M.; Fiedor, D.; Frajer, J.; Hercik, J.; Jurek, M. Czech students and mitigation of global warming: Beliefs and willingness to take action. Environ. Educ. Res. 2020, 26, 864–889. [Google Scholar] [CrossRef]
  110. Office of the Government of the Czech Republic. The Strategic Framework Czech Republic 2030; Office of the Government of the Czech Republic, Department of Sustainable Development: Prague, Czech Republic, 2017.
  111. Margerum, R.D.; Robinson, C.J. Collaborative partnerships and the challenges for sustainable water management. Curr. Opin. Environ. Sustain. 2015, 12, 53–58. [Google Scholar] [CrossRef]
  112. Slavíková, L.; Vojáček, O.; Smejkal, T. Artificial shortage of surface water: How can water demand management mitigate the scarcity problem? Water Environ. J. 2017, 31, 12–19. [Google Scholar] [CrossRef] [Green Version]
Figure 1. Basic aspects of drinking water supply problems in the Czech Republic.
Water 13 02098 g001
Figure 2. Development of the supply for inhabitants and the production of drinking water in the Czech Republic from 1989 to 2020. Data source: Czech Statistical Office [29].
Water 13 02098 g002
Figure 3. Circular causality scheme: Retroactions between the quality of drinking water supply and the socio-economic development of municipalities.
Water 13 02098 g003
Figure 4. Flow chart of the methodology.
Water 13 02098 g004
Figure 5. Overview of relative frequencies according to DWSTI: (a) completely dataset of municipalities (n = 2110; average = 0.310; median = 0.263); (b) selected dataset of municipalities that report at least partial issues with drinking water (n = 1189; average = 0.456; median = 0.452).
Water 13 02098 g005
Figure 6. Assessment of Czech municipalities with less than 2000 inhabitants (involved in the survey n = 2110) according to the Drinking Water Supply Threat Index (DWSTI). Source: own processing based on questionnaire survey and data [78].
Water 13 02098 g006
Figure 7. Small municipalities in the Czech Republic with a value of DWSTI ≥ 0.5 (n = 468) evaluated according to DWSTI and population size. Source: own processing based on questionnaire survey and data [78,81].
Water 13 02098 g007
Figure 8. Comparison of relative frequencies DWSTI according to population size of municipalities: (a) SIZE 1—municipalities with less than 300 inhabitants (n = 561; average = 0.498; median = 0.475); (b) SIZE 2—municipalities with 300–2000 inhabitants (n = 628; average = 0.418; median = 0.388).
Water 13 02098 g008
Figure 9. Circular causality scheme of the development deprivation of municipalities with problematic drinking water supply.
Water 13 02098 g009
Table 1. Factors influencing the state and development of drinking water supply.
Factor
Category
Internal/LocalExternal/Regional/Trans-Regional
StateDevelopmentStateDevelopment
NaturalQuality and amount of local water sources; morphometry of territoryLocal manifestations of climate changeClimatic and hydrological positionRegional manifestations of climate change
TechnicalQuality and extent of infrastructure in the municipality; typology of the built-up areaDevelopment of infrastructure; well digging, new building developmentRegional water supply systemsDevelopment of regional water supply systems
SocialCapability of leadership; community ties; age structurePopulation growth/water consumption; efficient consumption; changes in municipality leadershipDemand for housing in the regionRegional growth of the population/water consumption
EconomicMunicipality budget, affluence of inhabitantsMunicipality’s investments; richer inhabitants moving inEconomic position of the municipality; economy of water supply companies; state policyEconomic development of the region; investments into the water supply industry; changes in policy
Table 2. Overview of the number of municipalities and collected questionnaires in individual regions.
RegionNumber of Municipalities up to 2000 InhabitantsDistribution of Municipalities in RegionsNumber of
Collected
Questionnaires
Distribution of Collected
Questionnaires
Return Rate
Central Bohemia102618.5%40019.0%39.0%
South Bohemia57110.3%23511.1%41.2%
Pilsen4578.2%2089.9%45.5%
Karlovy Vary1081.9%371.8%34.3%
Ústí nad Labem3025.4%1296.1%42.7%
Liberec1833.3%653.1%35.5%
Hradec Králové4047.3%1436.8%35.4%
Pardubice4157.5%1577.4%37.8%
Vysočina67312.1%22010.4%32.7%
South Moravia58710.6%21110.0%35.9%
Olomouc3566.4%1266.0%35.4%
Zlín2524.5%914.3%36.1%
Moravia-Silesia2183.9%884.2%40.4%
Total5552100.0%2110100.0%38.0%
Data sources: Czech Statistical Office (2020) and own questionnaire survey.
Table 3. Indicators of the present state of the municipality.
VariableDescriptionOutliers
Winsorized the
Variables at Level
w_kanmprAverage number of candidates for one mandate in 2014 and 2018 municipal elections0;95
w_priprel_obyvNatural growth increment 2001–2019 per 1 inhabitant (1.1.2020)5;99
w_prisrel_obyvNatural growth increment via moving, 2001–2019 per 1 inhabitant (1.1.2020)1;95
w_indst19Aging index1;95
w_ekonsob_obyvNumber of active economic entities in 2019 per 1 inhabitant (1.1.2020)1;95
w_nez1819Average percentage of the unemployed 2018–20190;95
w_bytyrel_obyvNew dwellings 2001–2019 per 1 inhabitant (1.1.2020)0;95
w_hustzastBuilt-up areas 2019 [ha] per 1 inhabitant as of 1.1.20200;95
w_hustmkomDensity of local roads [km/km2] 2016 (on overall area 2019)0;95
w_huskozasDensity of local roads [km/km2] 2016 (on the area of built-up surfaces 2019)0;95
Source: own processing based on data from the Czech Statistical Office [81,82,83,84].
Table 4. Sub-questions of DWSTI: weights and average values.
IDQuestionWeightSIZE 1SIZE 2
AHow Would You Assess the Present State of Drinking Water Supply in Your Municipality?
A1The drinking water supply in our municipality is problematic0.20.53480.4490
A2We are lacking water supply infrastructure in our municipality0.10.51430.3248
A3Local water sources are not keeping up with the consumption of our municipality0.10.52810.4865
A4New wells for individual consumption are causing concerns among the municipality’s inhabitants regarding the lack of water in wells and boreholes0.10.59710.5884
A5The low amount of drinking water sources is limiting the development of our municipality0.10.47910.3842
A6Drinking water is being wasted in our municipality0.050.38240.4299
A7The quality of drinking water in our municipality is not being sufficiently monitored0.050.35340.2098
A8The quality of drinking water in our municipality is problematic0.050.43540.3061
A9Costs for ensuring drinking water for our municipality are too high0.050.53250.5127
A10Sources and supply of drinking water for our municipality are not keeping up with consumption0.20.46970.3861
Note: values close to 1 represent significant problems.
Table 5. Results of the estimate of multiple linear regression.
REG_SIZE 1REG_SIZE 2
coefSecoefse
w_kanmpr0.0130.0170.0030.007
w_priprel_obyv−0.1610.159−0.1430.202
w_prisrel_obyv0.182 **0.0710.205 **0.091
w_indst19−0.0000.000−0.0000.000
w_ekonsob_obyv−0.0770.2771.237 ***0.321
w_nez18190.0040.0060.0040.006
w_bytyrel_obyv−0.0200.295−0.996 ***0.374
w_hustzast2.153 ***0.7841.1040.899
w_hustmkom0.067 **0.028−0.0100.016
w_huskozas−0.001 **0.0000.0000.000
_cons0.403 ***0.0650.260 ***0.069
N 561 628
Prob > F 0.0072 0.0002
R2 0.0427 0.0535
Note: 0.01—***; 0.05—**; 0.1—*; data sources: own questionnaire survey and Czech Statistical Office [81,82,83,84].
Table 6. Issues of municipalities‘ further development: average values of development threat indicators.
CType of ThreatSIZE 1SIZE 2CType of ThreatSIZE 1SIZE 2
C1State of roads0.6250.633C10Availability of quality medical care0.5800.591
C2Transport services (to regional or territorial centers)0.5790.557C11Threat of soil erosion or degradation0.5020.511
C3Air quality0.4490.478C12Decrease or aging of the population0.6700.603
C4Traffic burden on roads0.5340.604C13Sufficient areas for housing development0.6200.610
C5Waste management0.5480.558C14Work opportunities in the municipality and accessible surroundings0.5900.569
C6Threat of floods0.3500.425C15Suitable conditions for entrepreneurship in the municipality0.4920.507
C7Drinking water supply0.6520.605C16Safety in the municipality0.4680.502
C8Wastewater treatment0.6330.579C17Conditions for culture, sports and club activity0.4810.492
C9Civic amenities of the municipality—e.g., a store, nursery school, basic school0.5570.564C18Sufficient funds in the municipality’s budget0.7490.718
Note: values close to 1 represent highly important threats.
Table 7. Results of the linear regression estimate of the Barrier Indicator.
REG_SIZE 1REG_SIZE 2
CoefSeCoefse
barrier0.151 ***0.0470.197 ***0.036
_cons0.428 ***0.0240.330 ***0.017
N 561 628
Prob > F 0.0013 0.0000
R2 0.0181 0.0417
Note: 0.01—***; 0.05—**; 0.1—*.
Table 8. Sub-questions of the Barrier Indicator: weights and average values.
BWhat Do You See as Barriers to the Development of Drinking Water Supply in Your Municipality?
IDQuestionWeightSIZE 1SIZE 2
B1Limited competencies of the municipal government0.070.3540.387
B2Lack of funds in the budget of the municipality0.070.7710.704
B3Threat of immoderate debt to the municipality0.070.7350.629
B4Uncertainty of acquiring money from a project (from subsidies)0.070.7250.701
B5Complicated administration of projects0.070.6560.641
B6Unwillingness of neighboring municipalities to cooperate0.070.1640.139
B7Excessively long realization period0.070.4930.486
B8Inhabitants’ disagreement with change0.070.2760.248
B9Unacceptable increase in water rates0.070.4790.480
B10There is no interest in heightening the quality of drinking water0.070.1840.139
B11Insufficient capacities of companies in realization0.070.2980.330
B12Insufficient methodological support (of the region, state)0.070.3670.361
B13Barriers in legal regulations0.070.4330.439
Note: values close to 1 represent significant barriers.
Publisher’s Note: MDPI stays neutral with regard to jurisdictional claims in published maps and institutional affiliations.

