
Investigating Effect of Pumping Ratio on Effectiveness of Barrier Wells for Saltwater Intrusion: Lab-Scale Experiments and Numerical Modeling

Abstract
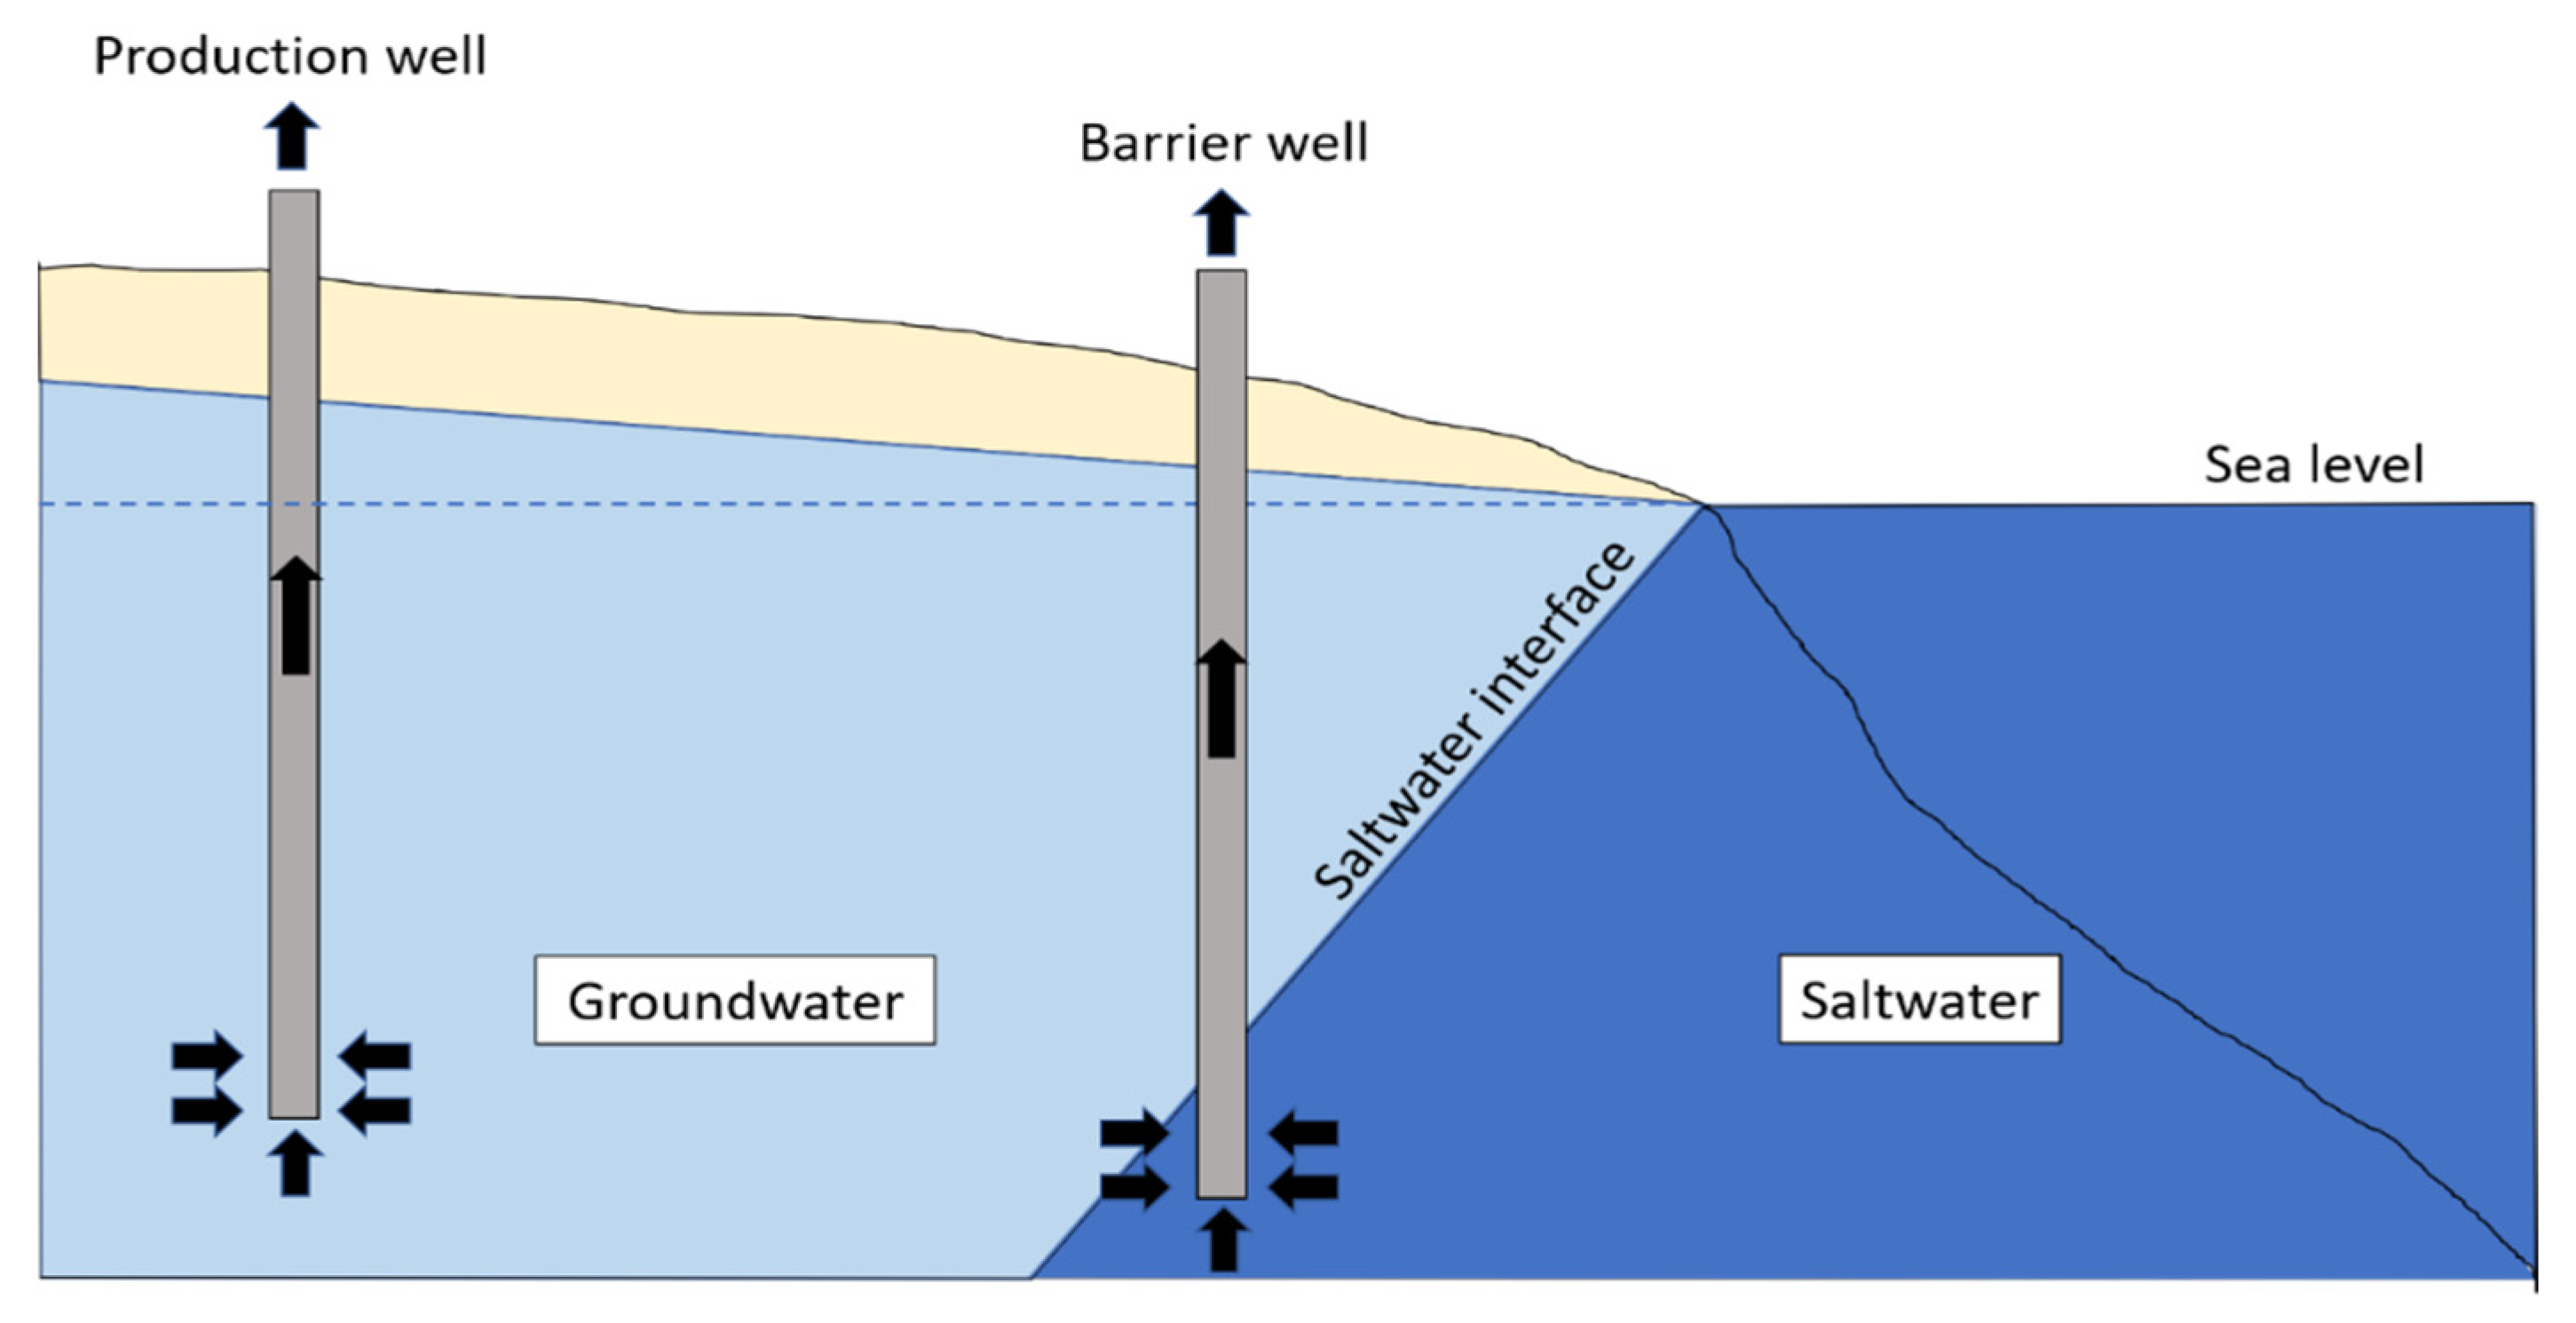
:1. Introduction
2. Methodology
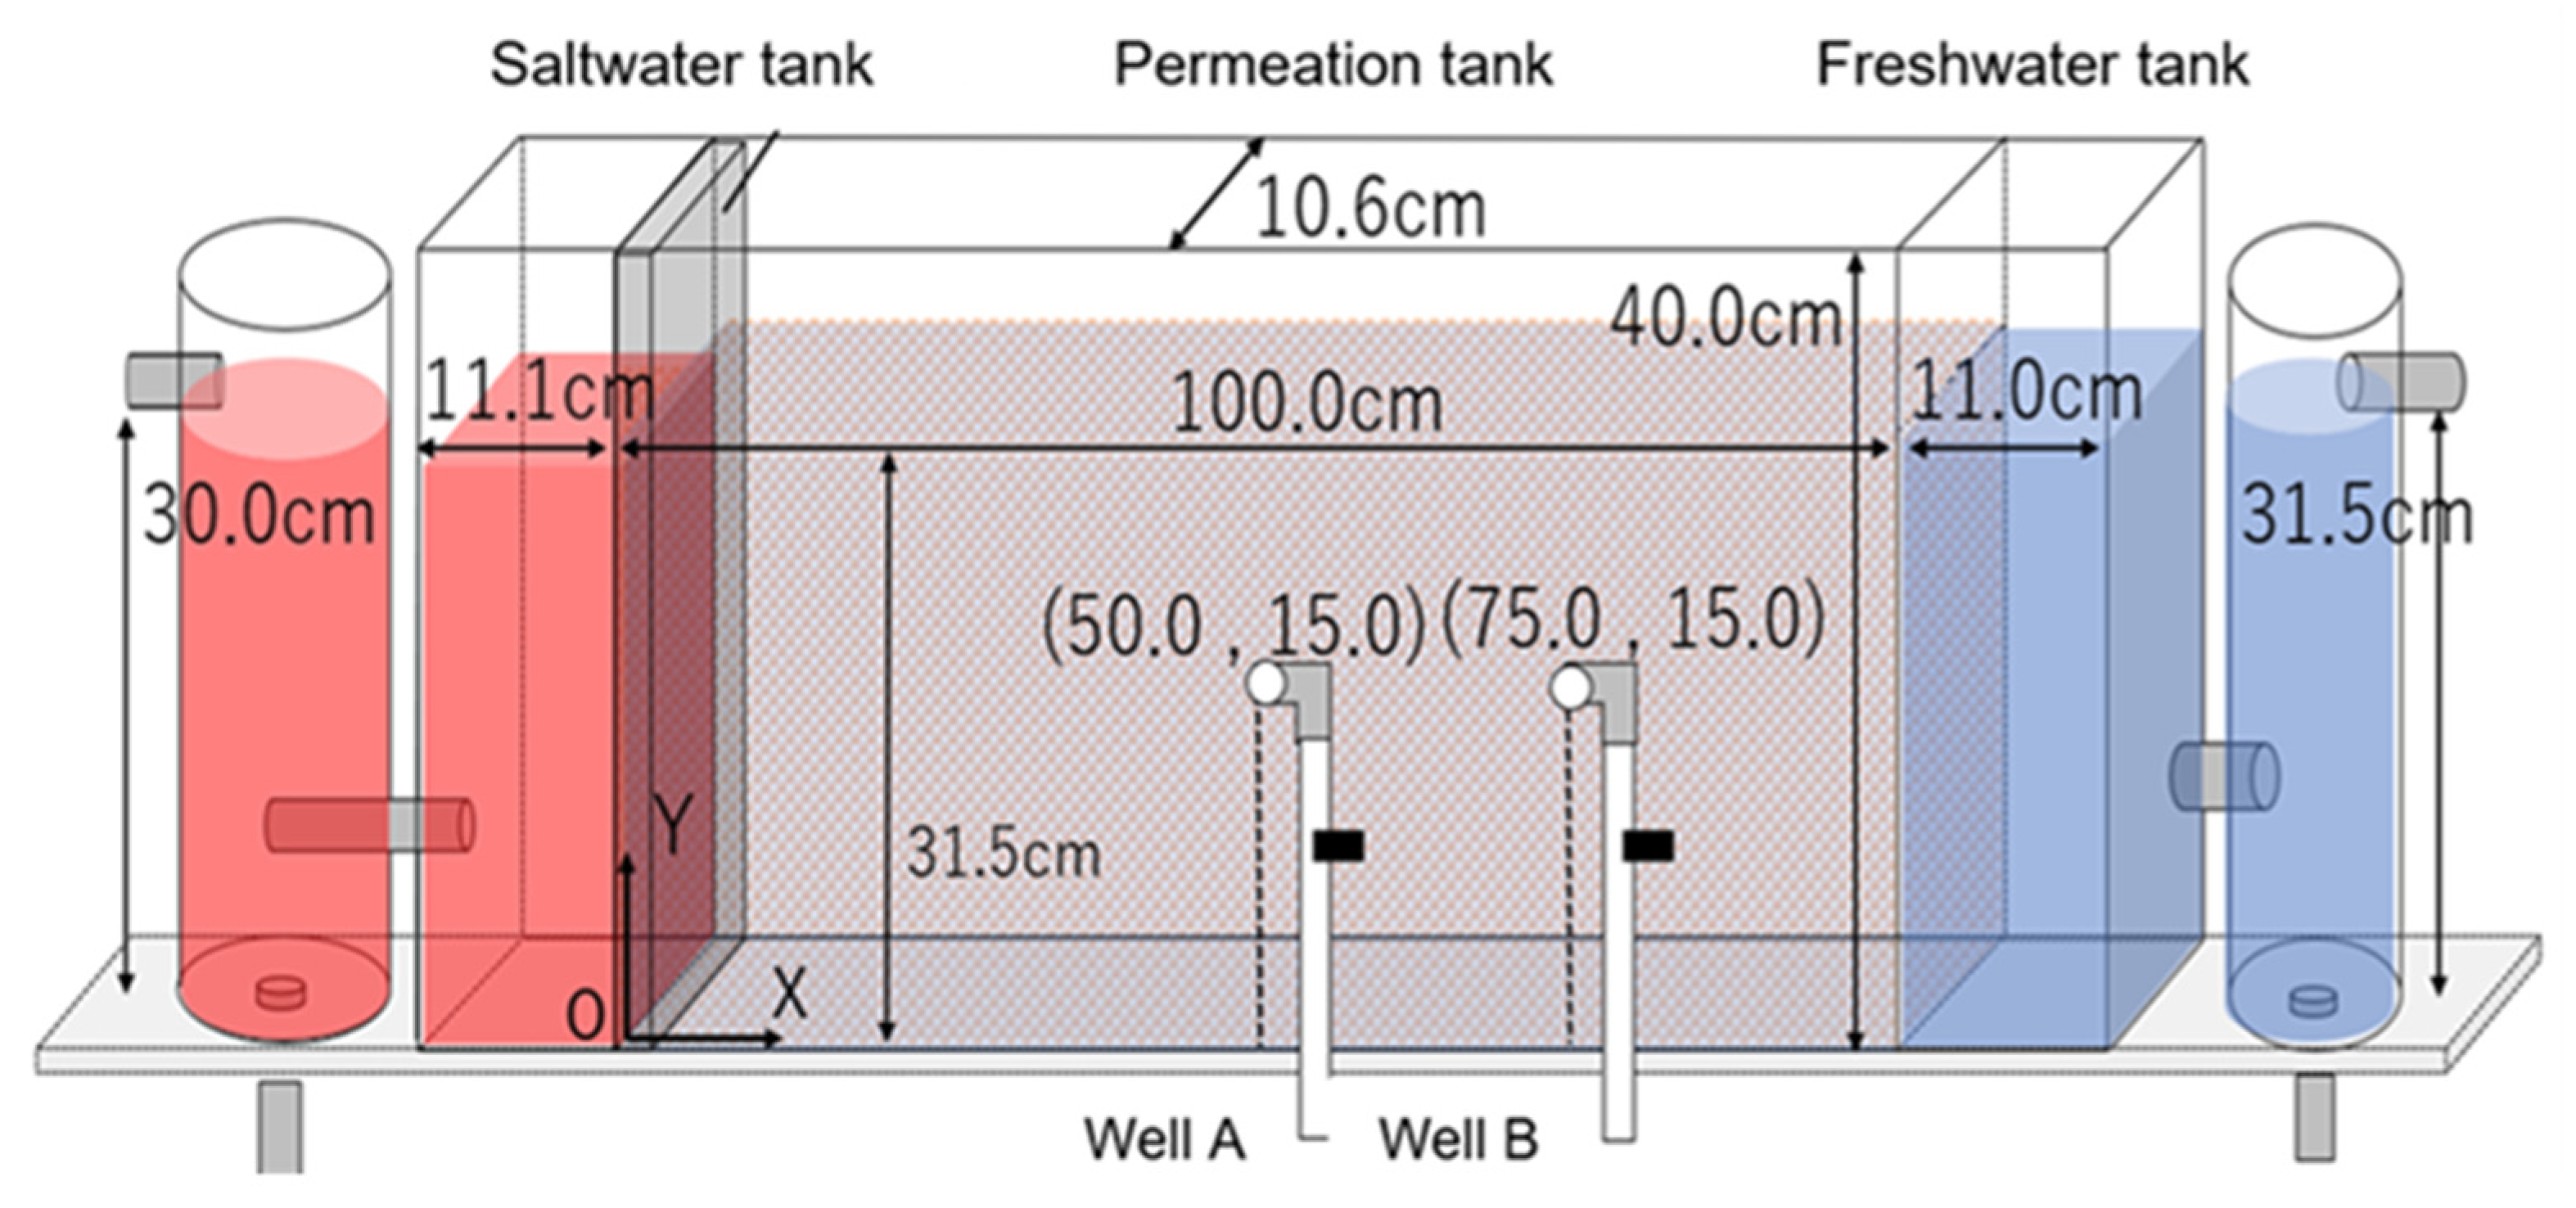
2.1. Lab-Scale Experiments
2.2. Numerical Model
3. Results and Discussion
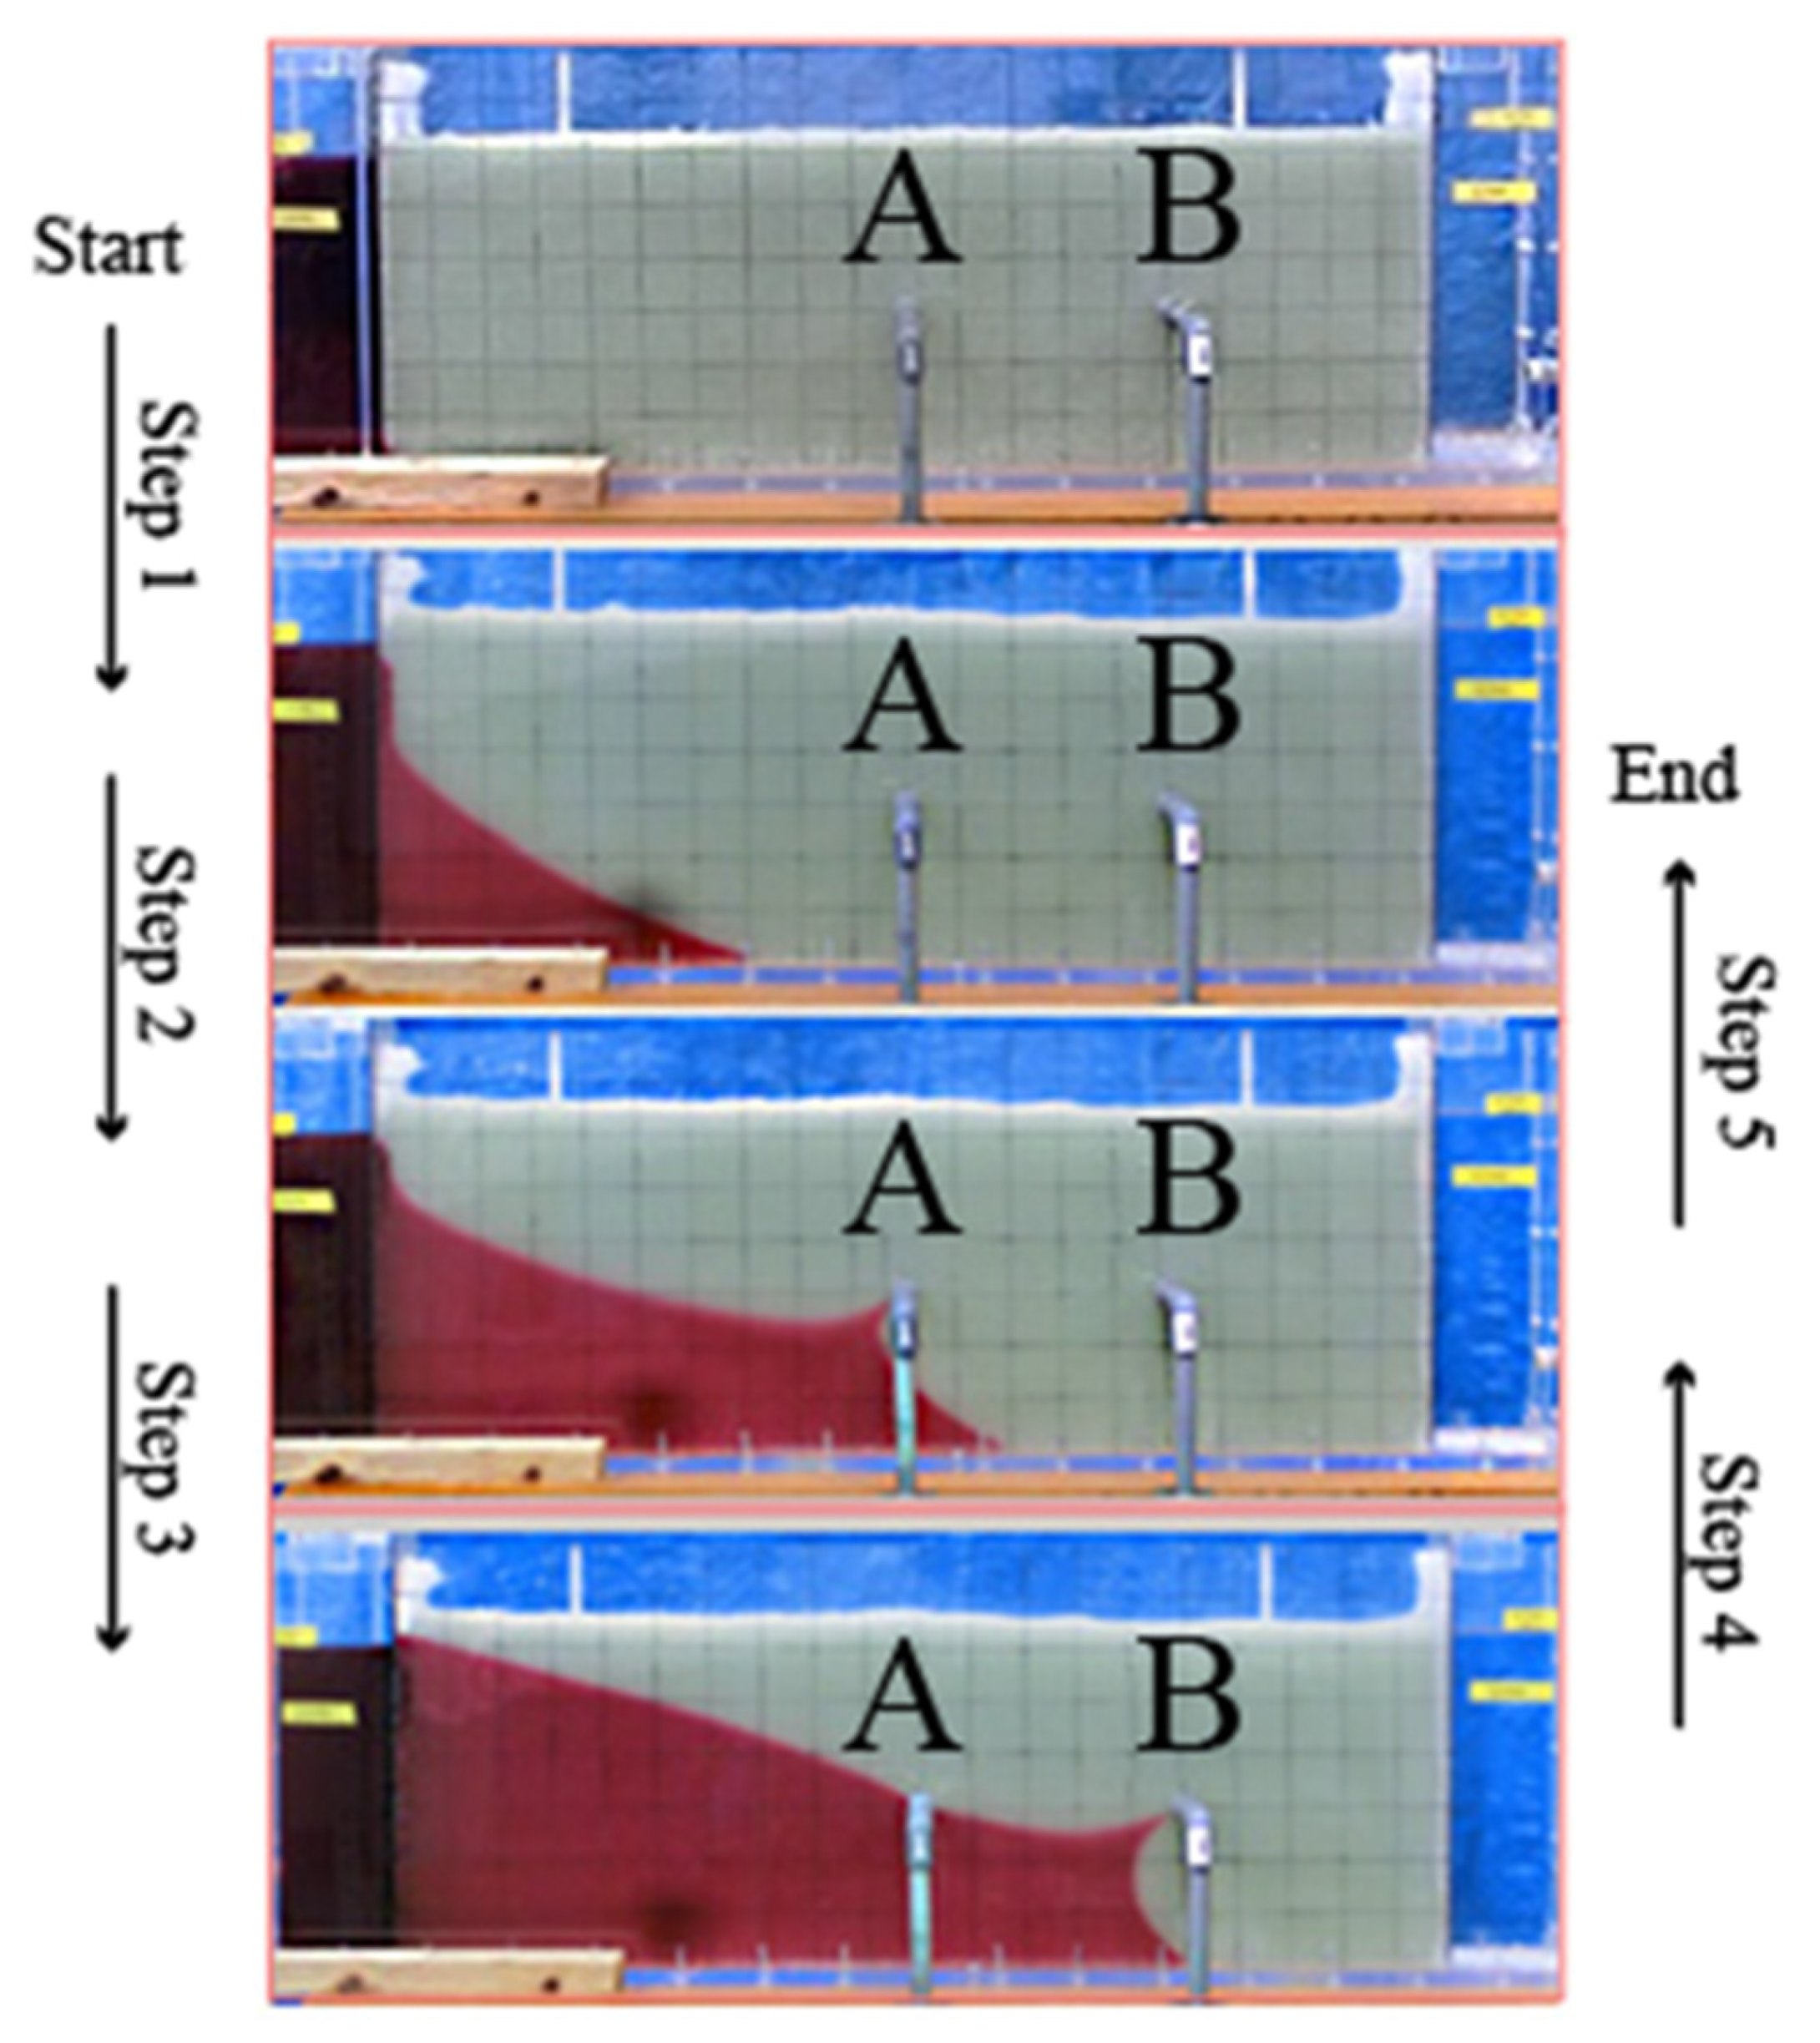
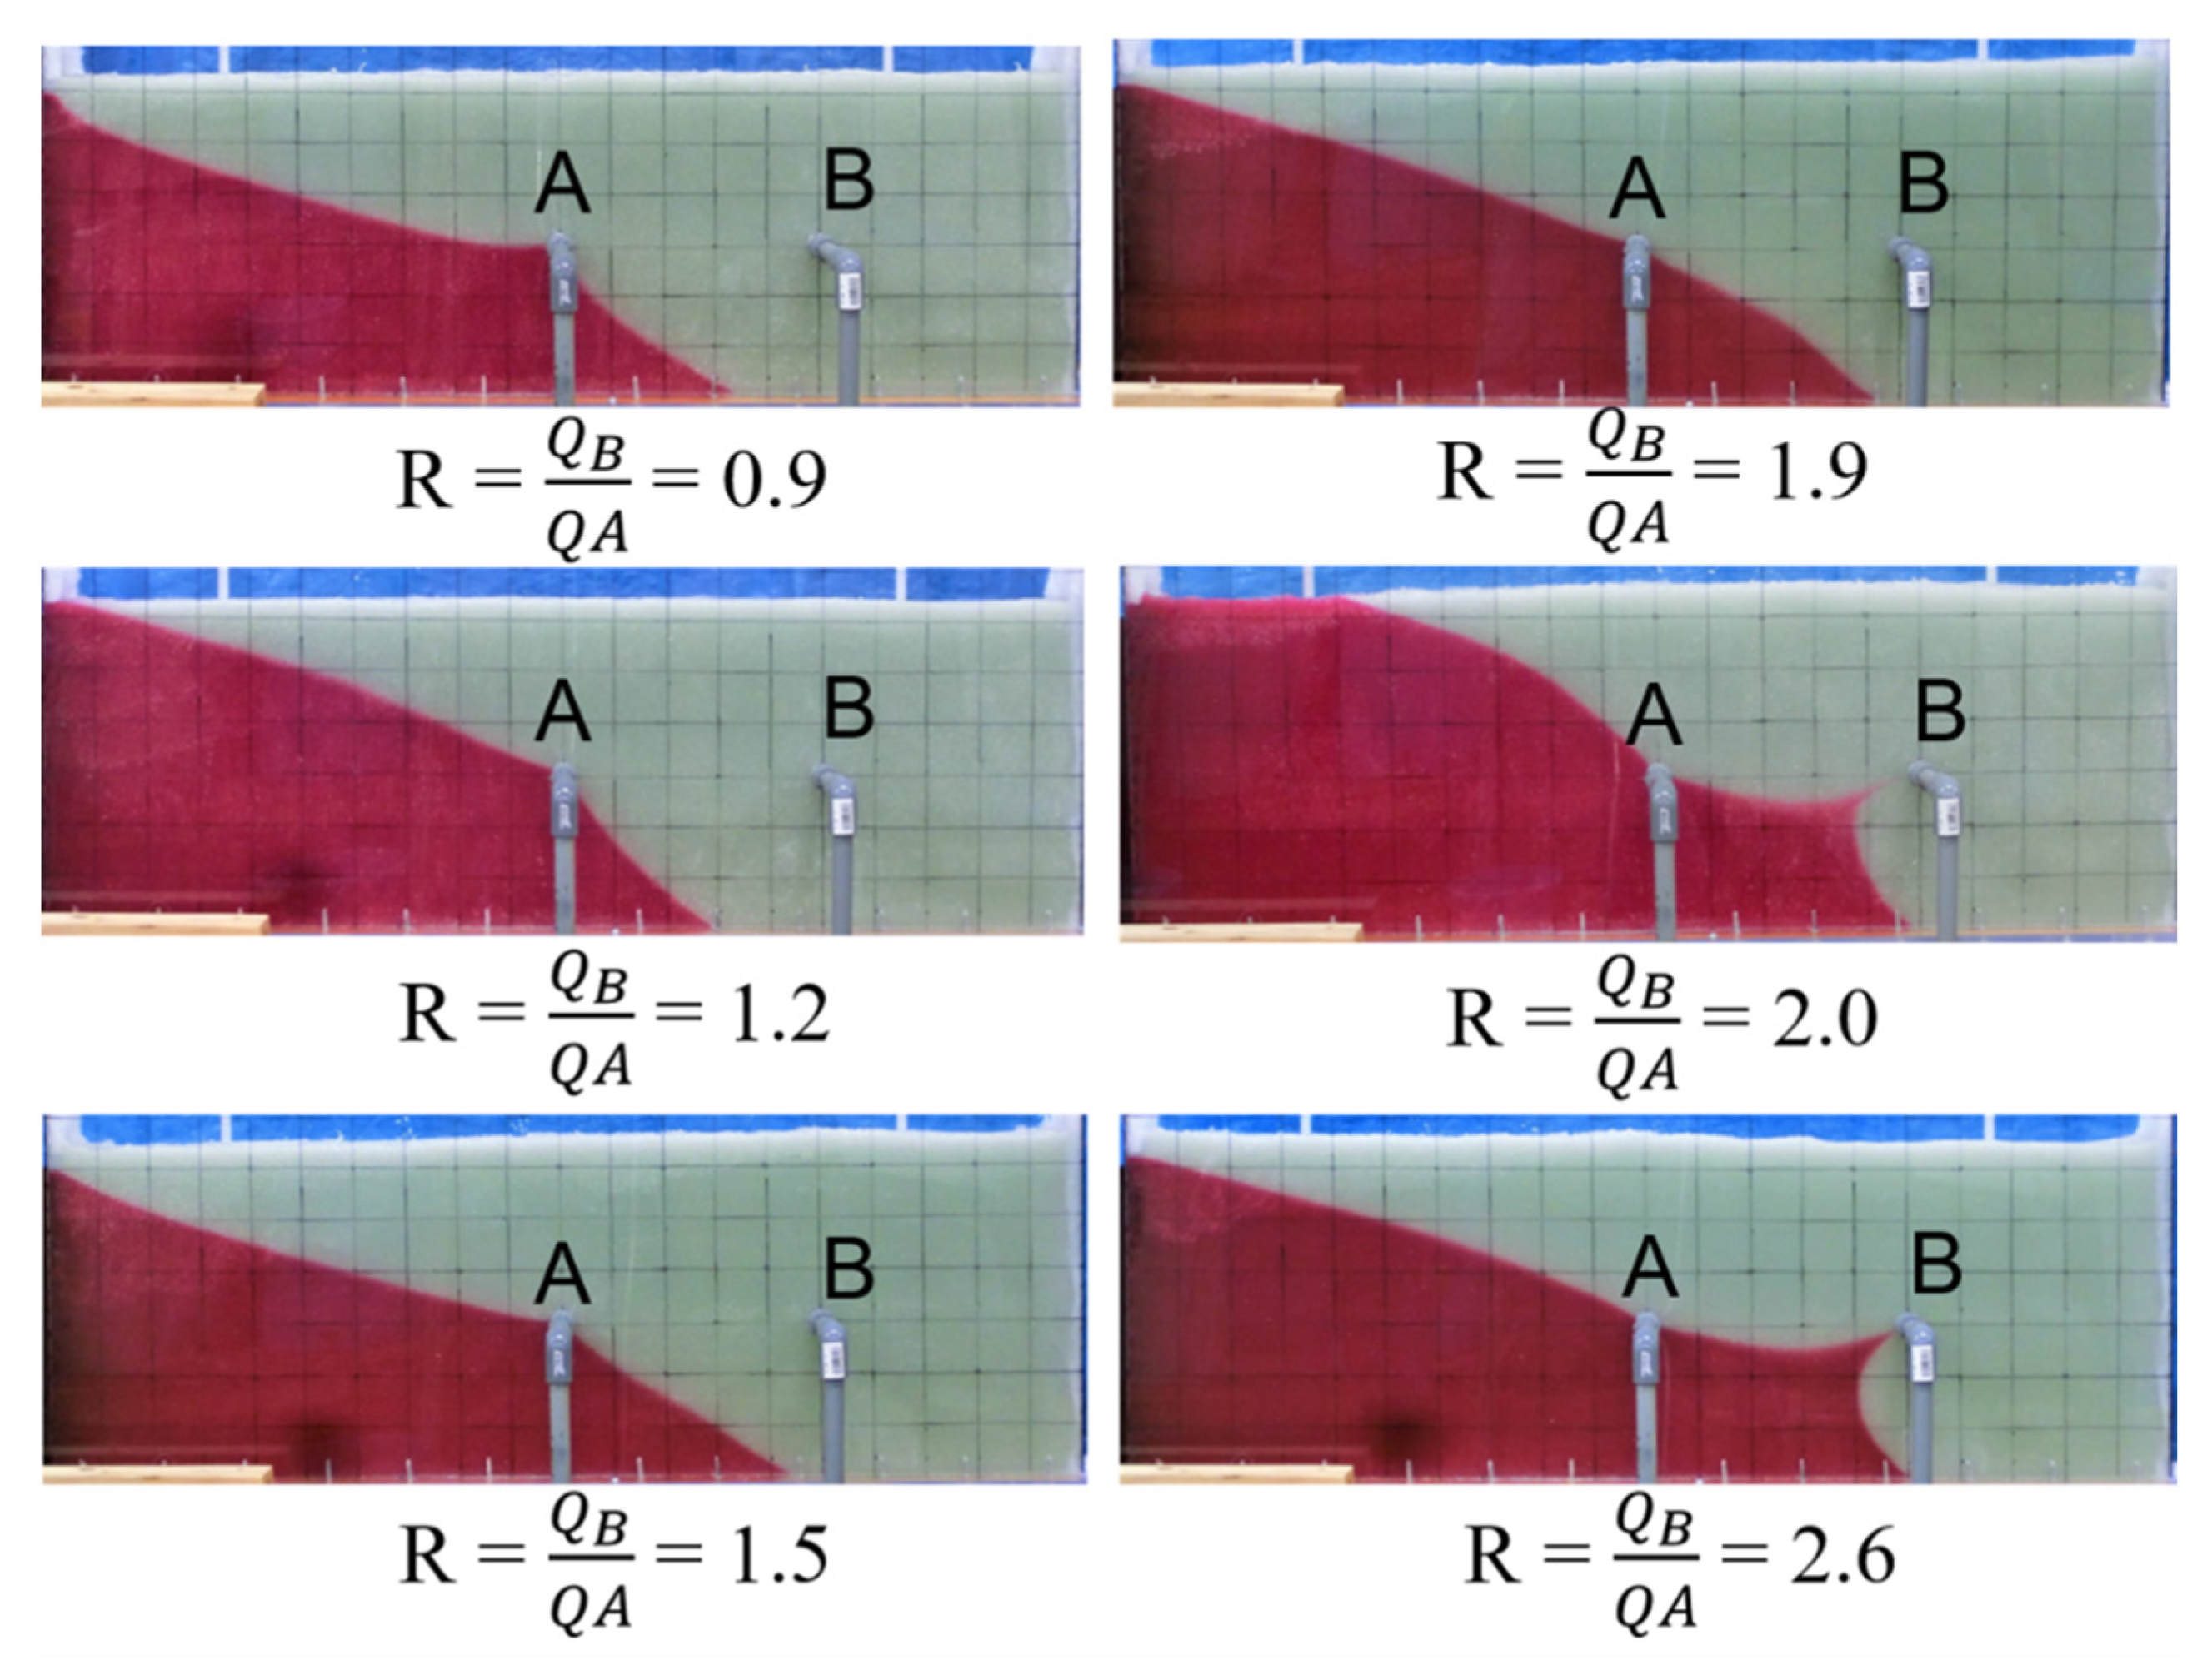
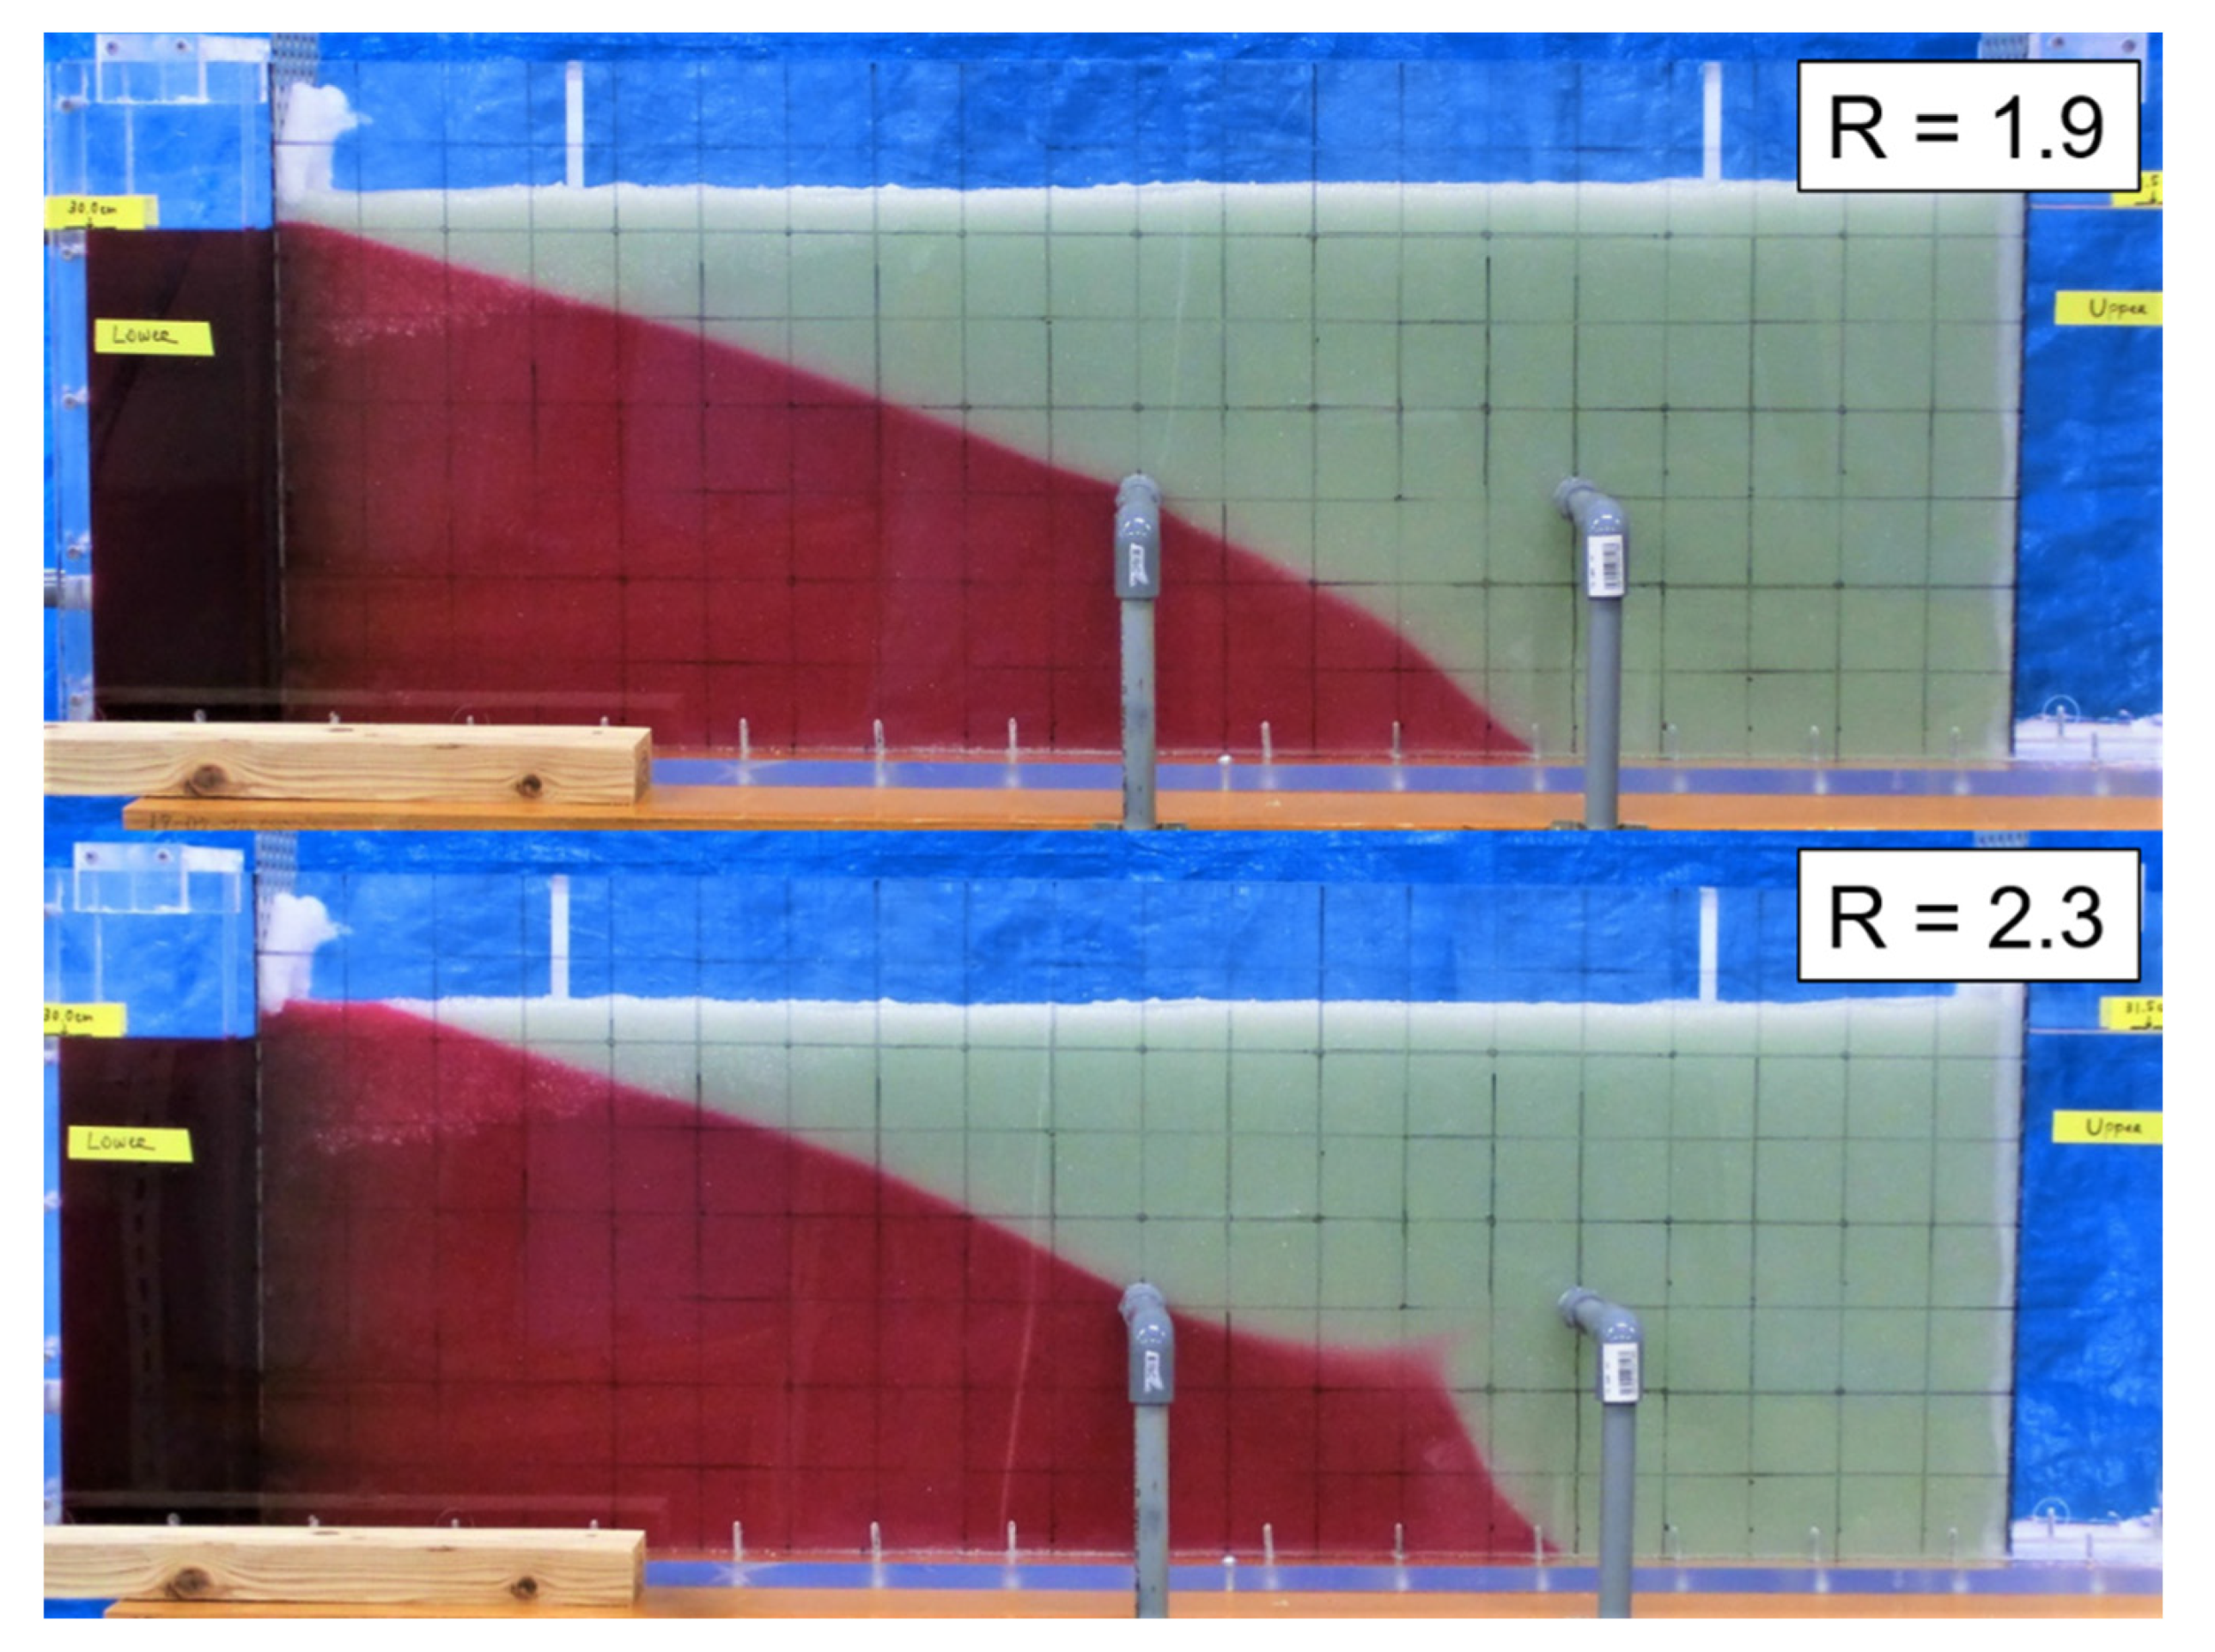
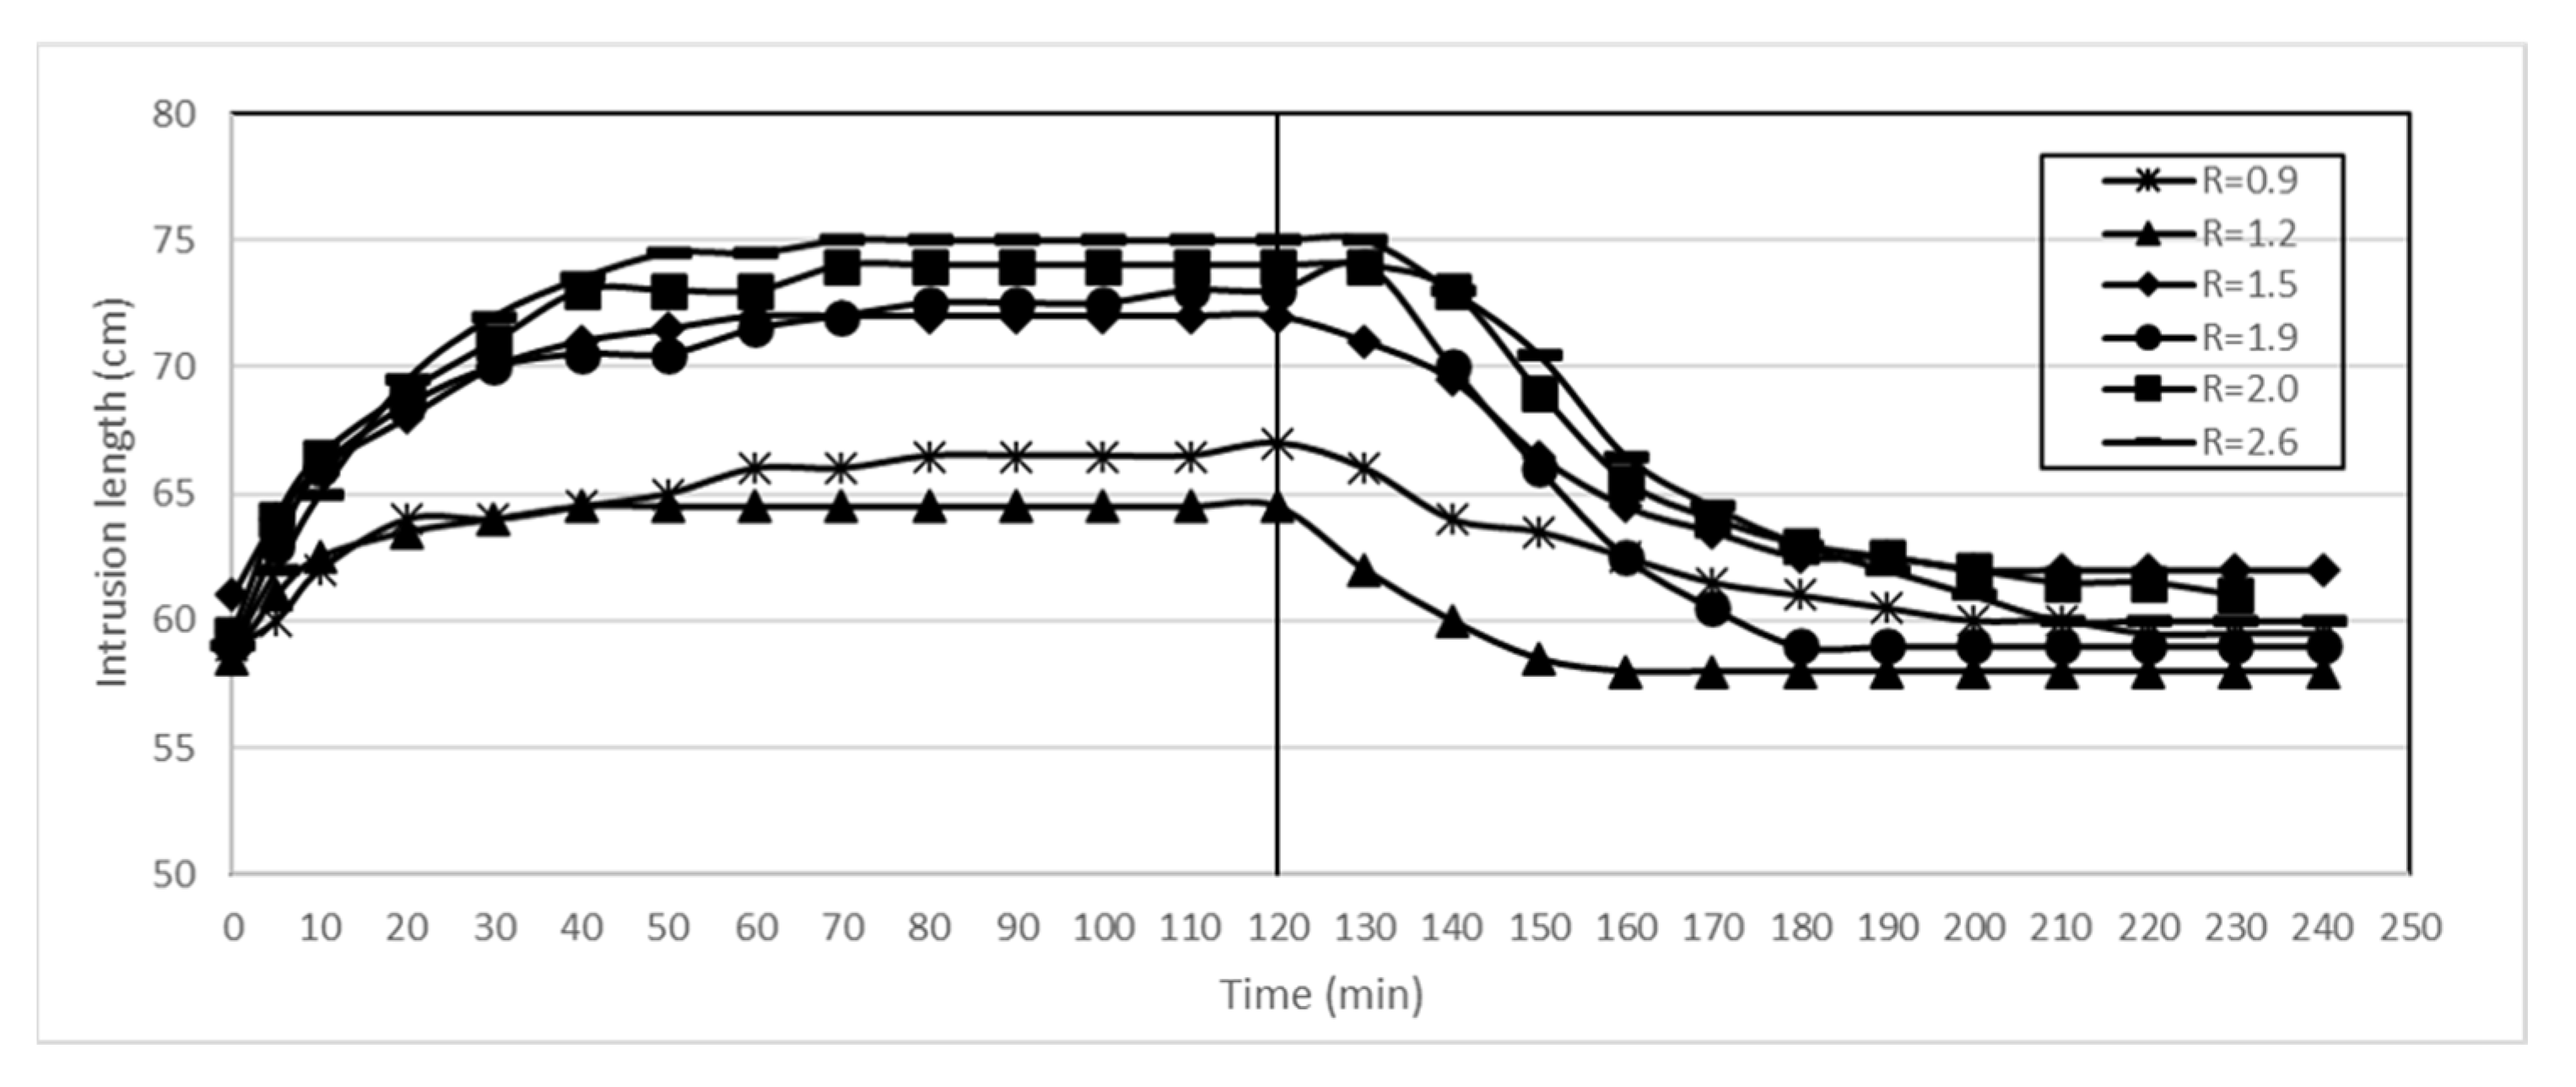
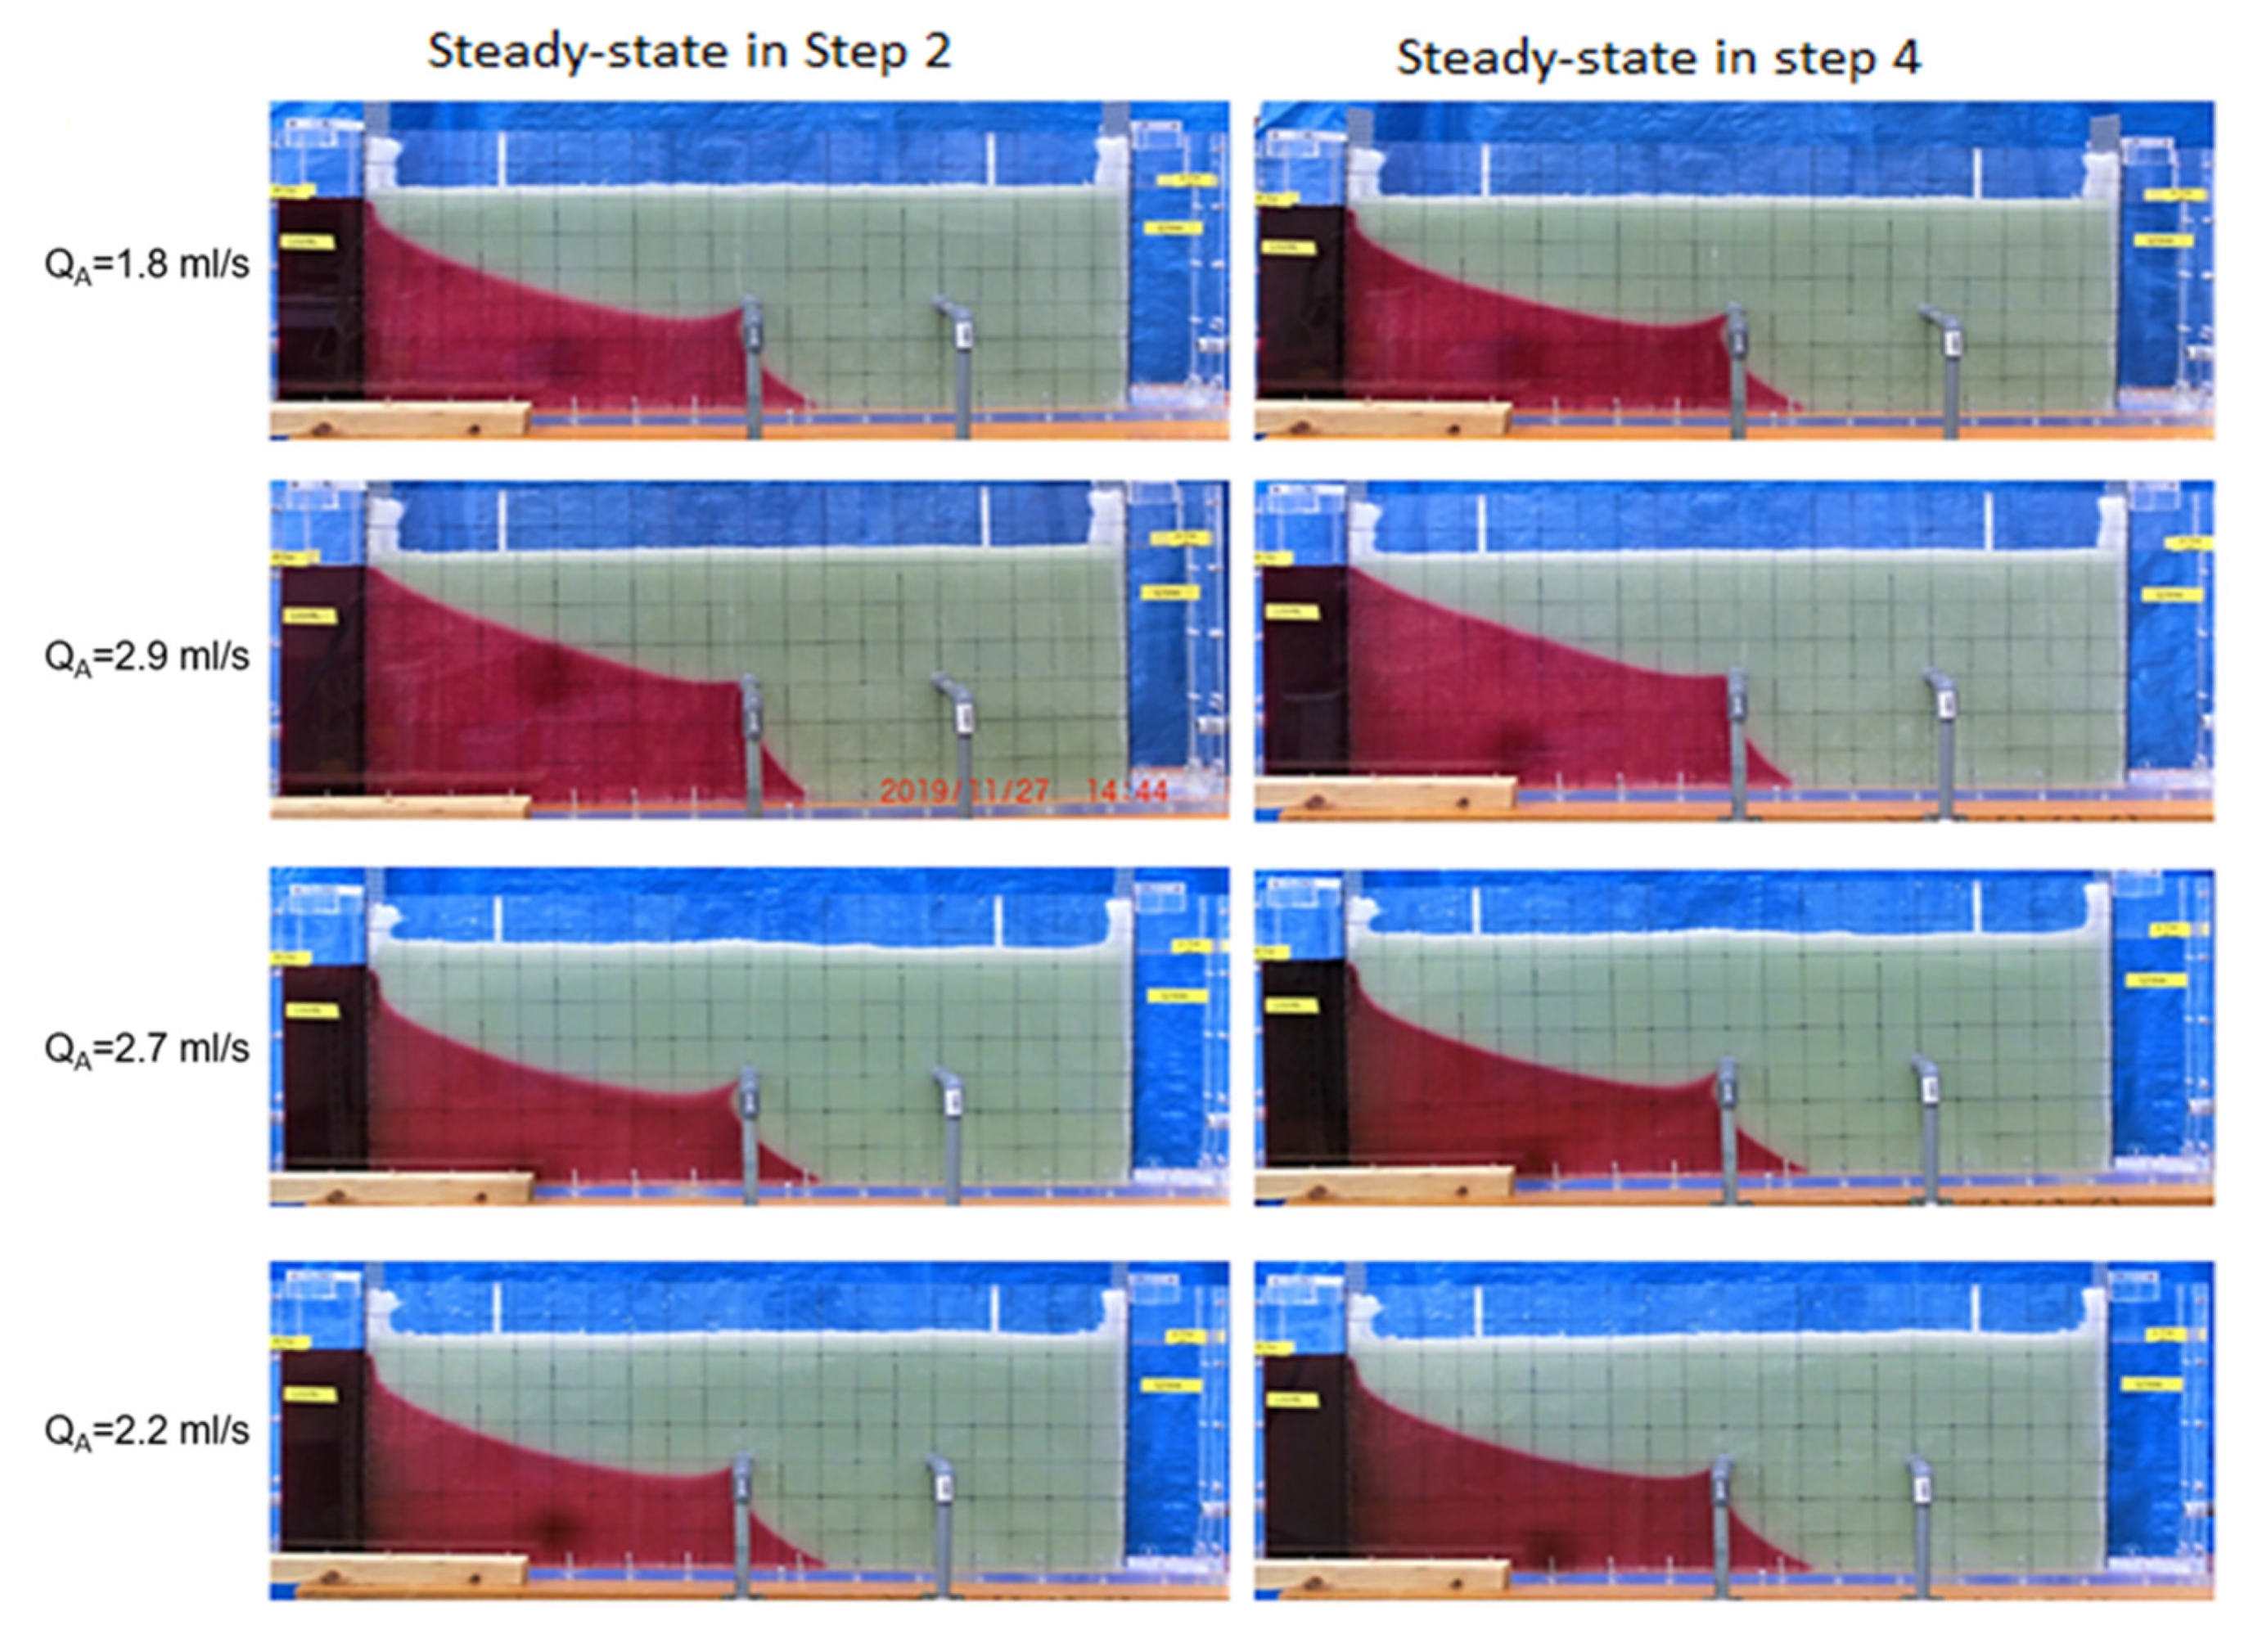
3.1. Lab-Scale Experiments
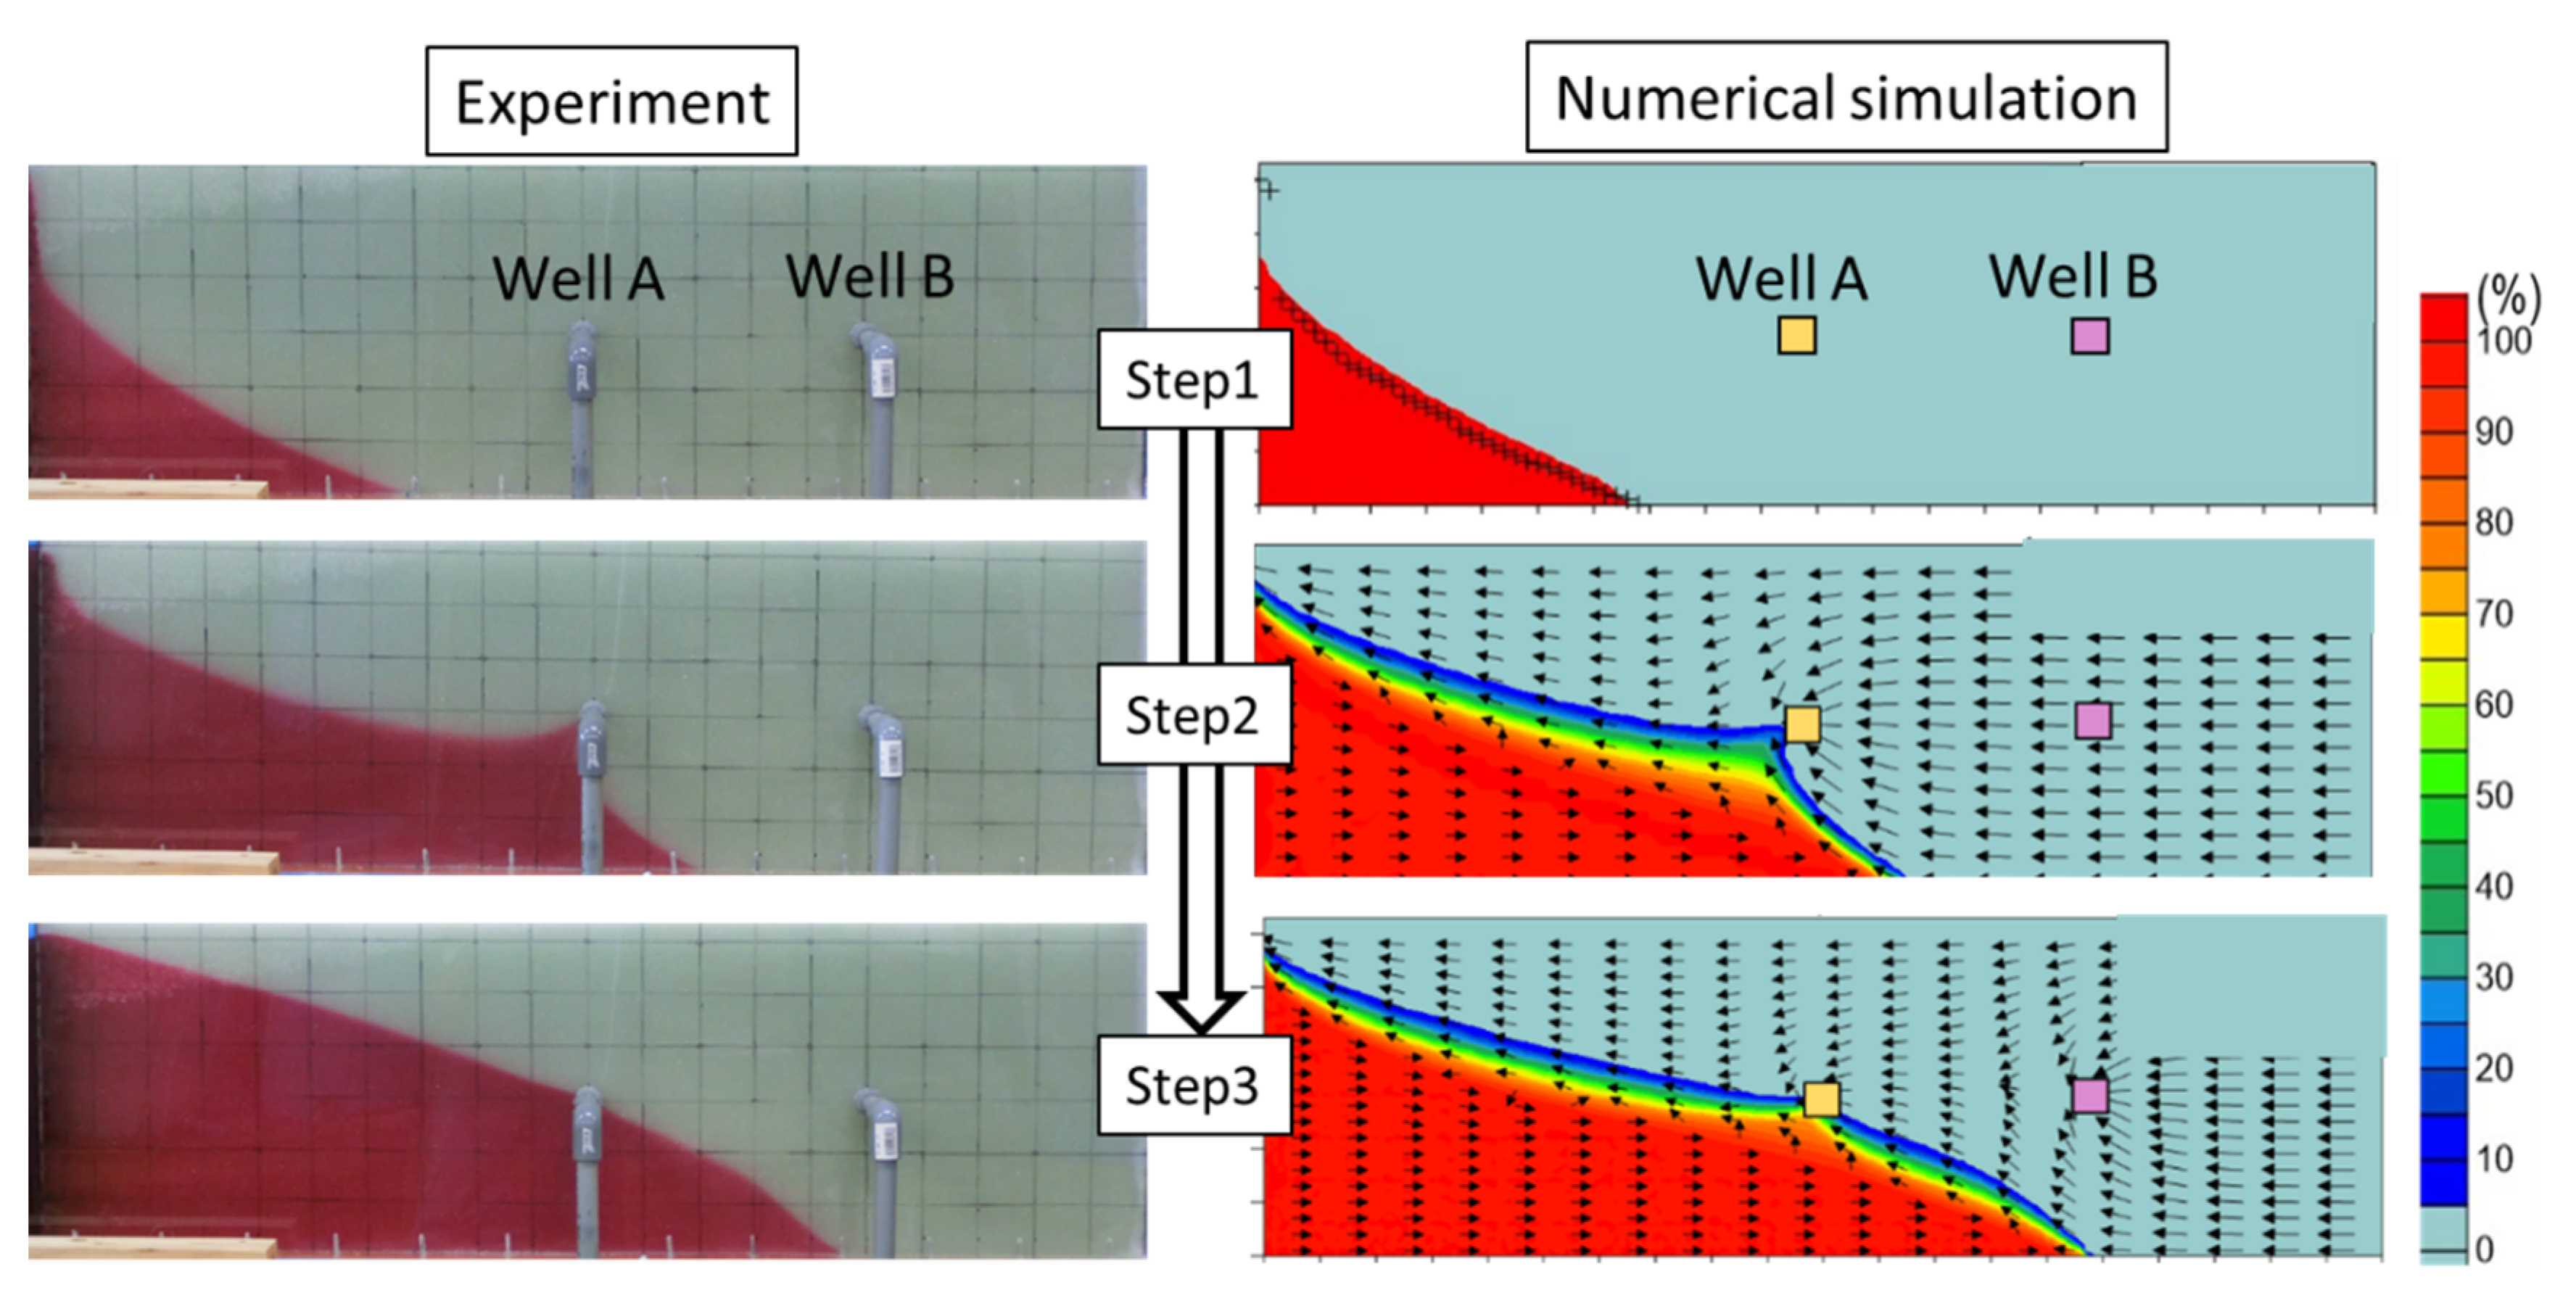
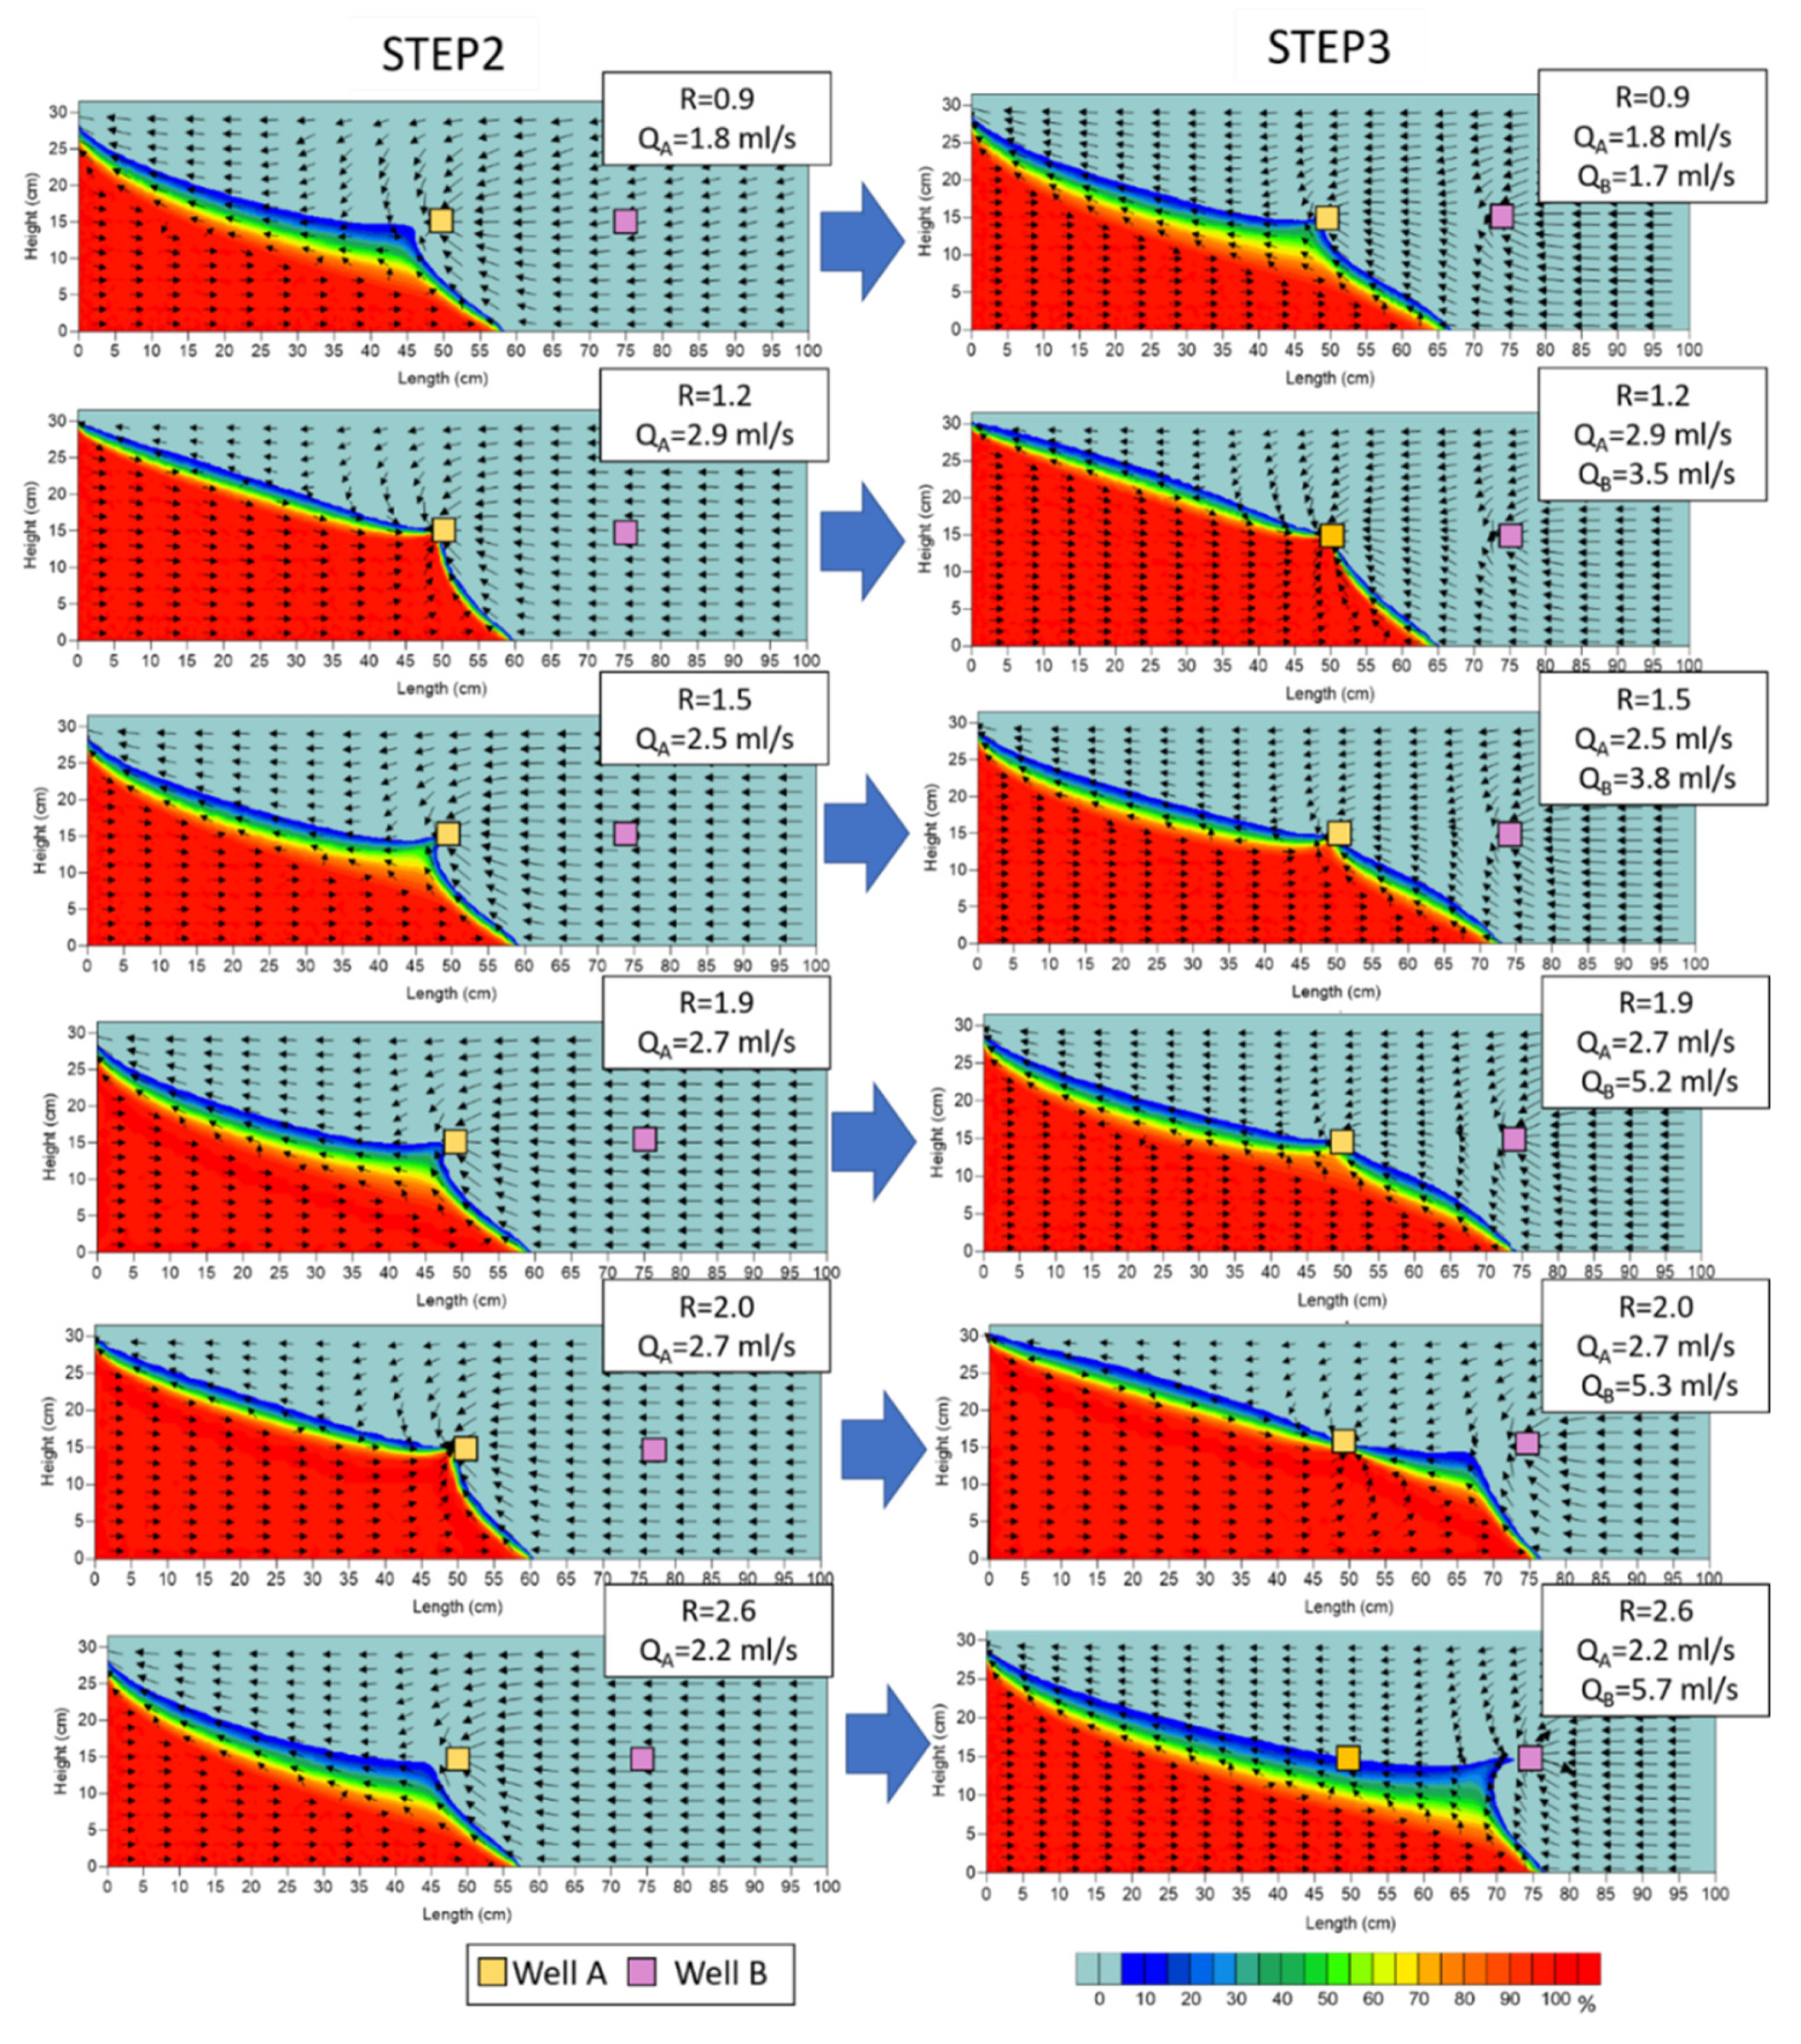
3.2. Numerical Simulation
4. Conclusions
Author Contributions
Funding
Institutional Review Board Statement
Informed Consent Statement
Data Availability Statement
Acknowledgments
Conflicts of Interest
References
- Abd-Elhamid, H.F.; Javadi, A.A.; Qahman, K.M. Impact of over-pumping and sea level rise on seawater intrusion in Gaza aquifer (Palestine). J. Water Clim. Chang. 2015, 6, 891–902. [Google Scholar] [CrossRef]
- Sherif, M.; Sefelnasr, A.; Javadi, A. Incorporating the concept of equivalent freshwater head in successive horizontal simulations of seawater intrusion in the Nile Delta aquifer, Egypt. J. Hydrol. 2012, 464-465, 186–198. [Google Scholar] [CrossRef]
- Mazi, A. Seawater Intrusion Risks and Controls for Safe Use of Coastal Groundwater under Multiple Change Pressures; Department of Physical Geography and Quaternary Geology, Stockholm University: Stockholm, Sweden, 2014. [Google Scholar]
- Ebeling, P.; Händel, F.; Walther, M. Potential of mixed hydraulic barriers to remediate seawater intrusion. Sci. Total. Environ. 2019, 693, 133478. [Google Scholar] [CrossRef] [PubMed]
- Costall, A.; Harris, B.; Pigois, J.P. Electrical Resistivity Imaging and the Saline Water Interface in High-Quality Coastal Aquifers. Surv. Geophys. 2018, 39, 753–816. [Google Scholar] [CrossRef] [Green Version]
- Werner, A.D.; Simmons, C.T. Impact of Sea-Level Rise on Sea Water Intrusion in Coastal Aquifers. Ground Water 2009, 47, 197–204. [Google Scholar] [CrossRef] [PubMed]
- FAO (Food and Agriculture Organization). Seawater Intrusion in Coastal Aquifers: Guidelines for Study, Monitoring, and Control; FAO: Rome, Italy, 1997. [Google Scholar]
- Sherif, M.M.; Singh, V.P. Effect of climate change on sea water intrusion in coastal aquifers. Hydrol. Process. 1999, 13, 1277–1287. [Google Scholar] [CrossRef]
- IPCC. The Physical Science Basis. Contribution of Working Group I to the Fifth Assessment Report of the Intergovernmental Panel on Climate Change Stocker, T.F. Summary for policymakers. In Climate Change; Qin, D., Plattner, G.-K., Tignor, M., Allen, S.K., Boschung, J., Nauels, A., Xia, Y., Bex, V., Midgley, P.M., Eds.; Cambridge University Press: Cambridge, UK; New York, NY, USA, 2013; pp. 25–26. [Google Scholar] [CrossRef]
- Hussain, M.S.; Abd-Elhamid, H.F.; Javadi, A.A.; Sherif, M.M. Management of Seawater Intrusion in Coastal Aquifers: A Review. Water 2019, 11, 2467. [Google Scholar] [CrossRef] [Green Version]
- Stein, S.; Yechieli, Y.; Shalev, E.; Kasher, R.; Sivan, O. The effect of pumping saline groundwater for desalination on the fresh–saline water interface dynamics. Water Res. 2019, 156, 46–57. [Google Scholar] [CrossRef] [PubMed]
- Vats, O.P.; Sharma, B.; Stamm, J.; Bhattacharjya, R.K. Groundwater Circulation Well for Controlling Saltwater Intrusion in Coastal aquifers: Numerical study with Experimental Validation. Water Resour. Manag. 2020, 34, 3551–3563. [Google Scholar] [CrossRef]
- Sherif, M.M.; Hamza, K. Mitigation of Seawater Intrusion by Pumping Brackish Water. Transp. Porous Media 2001, 43, 29–44. [Google Scholar] [CrossRef]
- Pool, M.; Carrera, J. Dynamics of negative hydraulic barriers to prevent seawater intrusion. Hydrogeol. J. 2009, 18, 95–105. [Google Scholar] [CrossRef]
- Park, S.-U.; Kim, J.-M.; Yum, B.-W.; Yeh, G.-T. Three-Dimensional Numerical Simulation of Saltwater Extraction Schemes to Mitigate Seawater Intrusion due to Groundwater Pumping in a Coastal Aquifer System. J. Hydrol. Eng. 2012, 17, 10–22. [Google Scholar] [CrossRef]
- Blair, T.C.; McPherson, J.G. Grain-size and textural classification of coarse sedimentary particles. J. Sediment. Res. 1999, 69, 6–19. [Google Scholar] [CrossRef]
- Yu, C.; Cheng, J.; Jones, L.; Wang, Y.; Faillace, E.; Loureiro, C.; Chia, Y. Data Collection Handbook to Support Modeling the Impacts of Radioactive Material in Soil; U.S. Department of Energy Office of Scientific and Technical Information: Oak Ridge, TN, USA, 1993. [CrossRef] [Green Version]
- Elizabeth, L.E.; Miguel, A.; Maria, G.; Eduardo, A. A model for calculating the density of aqueous multicomponent electrolyte solutions. J. Chil. Chem. Soc. 2008, 53, 1393–1398. [Google Scholar]
- Simion, A.I.; Cristina, G.; Ana-Maria, R.; Lucian, G. Mathematical modelling of density and viscosity of NaCl aqueous solutions. J. Agroaliment. Process. Technol. 2015, 21, 41–52. [Google Scholar]
- Castro-Orgaz, O. Steady free-surface flow in porous media: Generalized Dupuit–Fawer equations. J. Hydraul. Res. 2011, 49, 55–63. [Google Scholar] [CrossRef]
- Jinno, K.; Momii, K.; Fujino, K.; Nakagawa, K.; Hosokawa, T.; Egusa, N.; Hiroshiro, Y. Numerical Analysis of Mass Transport in Groundwater; Kyushu University Press: Fukuoka, Japan, 2001; pp. 13–72. (In Japanese) [Google Scholar]
- Van Genuchten, M.T. A closed-from equation for predicting the hydraulic conductivity of unsaturated soils. Soil Sci. Soc. Am. J. 1980, 44, 893–898. [Google Scholar] [CrossRef] [Green Version]
- Jinno, K.; Momii, K.; Fujino, K.; Nakagawa, K.; Hosokawa, T.; Egusa, N.; Hiroshiro, Y. Numerical Analysis of Mass Transport in Groundwater; Kyushu University Press: Fukuoka, Japan, 2001; pp. 83–84. (In Japanese) [Google Scholar]
- Diersch, H.-J.; Kolditz, O. Variable-density flow and transport in porous media: Approaches and challenges. Adv. Water Resour. 2002, 25, 899–944. [Google Scholar] [CrossRef]
- Harleman, D.R.F.; Rumer, R.R. Longitudinal and lateral dispersion in an isotropic porous medium. J. Fluid Mech. 1963, 16, 385. [Google Scholar] [CrossRef]


| Experiment No. | 1 | 2 | 3 | 4 | 5 | 6 |
|---|---|---|---|---|---|---|
| Hydraulic conductivity (cm/s) | 0.45 | 0.40 | 0.53 | 0.50 | 0.39 | 0.48 |
| Water intake at point A; QA (mL/s) | 1.8 | 2.9 | 2.5 | 2.7 | 2.7 | 2.2 |
| Water intake at point B; QB (mL/s) | 1.7 | 3.5 | 3.8 | 5.2 | 5.3 | 5.7 |
| Water intake ratio; QB/QA | 0.9 | 1.2 | 1.5 | 1.9 | 2.0 | 2.6 |
| Saturated water content | 0.342 | |
| Residual water content | 0.075 | |
| Coefficient | α | 0.0491 (cm/s) |
| m | 0.8599 | |
| n | 7.138 | |
| Time Interval | Δt | 0.5 (s) |
|---|---|---|
| Cell length in x direction | Δx | 0.5 (cm) |
| Cell length in y direction | Δy | 0.5 (cm) |
| Longitudinal dispersion length | αL | 0.038 (cm) |
| Transverse dispersion length | αT | 0.0051 (cm) |
| Molecular diffusion | DM | 1.0 × 10⁻⁵ (cm2/s) |
| Porosity | ne | 0.35 |
| Freshwater head | Hf | 31.5 (cm) |
| Saltwater head | Hs | 30.0 (cm) |
| Freshwater density | ρs | 0.991 (g/cm3) |
| Saltwater density | ρf | 1.025 (g/cm3) |
| Extrapolation factor for SOR method | ω | 1.6 |
| Criteria for convergence judgement | ε0 | 1.0 × 10⁻² |
| Specific storage coefficient | SS | 0.1 |
| Boundary | Pressure Head | Conc. |
|---|---|---|
| AB | ||
| BC | ||
| CD | ||
| DE | ||
| EA | ||
| EF |
| Intake Ratio; QB/QA | 0.9 | 1.2 | 1.5 | 1.9 | 2.0 | 2.6 |
|---|---|---|---|---|---|---|
| Intrusion length of saltwater (cm) | 67.0 | 64.5 | 72.0 | 73.0 | 74.0 | 75.0 |
| Time to reach steady state (min) | 90 | 70 | 80 | 110 | 130 | 70 |
| Upconing | × | × | × | × | ○ | ○ |
Publisher’s Note: MDPI stays neutral with regard to jurisdictional claims in published maps and institutional affiliations. |
© 2021 by the authors. Licensee MDPI, Basel, Switzerland. This article is an open access article distributed under the terms and conditions of the Creative Commons Attribution (CC BY) license (https://creativecommons.org/licenses/by/4.0/).
Share and Cite
Ozaki, S.; Akl, C.A.; Nagino, T.; Hiroshiro, Y. Investigating Effect of Pumping Ratio on Effectiveness of Barrier Wells for Saltwater Intrusion: Lab-Scale Experiments and Numerical Modeling. Water 2021, 13, 2100. https://doi.org/10.3390/w13152100
Ozaki S, Akl CA, Nagino T, Hiroshiro Y. Investigating Effect of Pumping Ratio on Effectiveness of Barrier Wells for Saltwater Intrusion: Lab-Scale Experiments and Numerical Modeling. Water. 2021; 13(15):2100. https://doi.org/10.3390/w13152100
Chicago/Turabian StyleOzaki, Shinichi, Christel Abi Akl, Tatsuya Nagino, and Yoshinari Hiroshiro. 2021. "Investigating Effect of Pumping Ratio on Effectiveness of Barrier Wells for Saltwater Intrusion: Lab-Scale Experiments and Numerical Modeling" Water 13, no. 15: 2100. https://doi.org/10.3390/w13152100