
Design of a Thermal Hotel Based on AHP-QFD Methodology
by
 , , and
Fatma Kürüm Varolgüneş
1 ,
,
Fatih Canan
2,
María de la Cruz del Río-Rama
3,* and
and
Cristiana Oliveira
4
1
Department of Architecture, Bingöl University, 12000 Bingol, Turkey
2
Department of Architecture, Konya Technical University, 42130 Konya, Turkey
3
Business Management and Marketing Department, Faculty of Business Sciences and Tourism, University of Vigo, 32004 Ourense, Spain
4
European University of the Canary Islands, 38300 Santa Cruz de Tenerife, Spain
*
Author to whom correspondence should be addressed.
Water 2021, 13(15), 2109; https://doi.org/10.3390/w13152109
Submission received: 8 May 2021
/
Revised: 22 July 2021
/
Accepted: 28 July 2021
/
Published: 31 July 2021
(This article belongs to the Special Issue Integrated Water Resources Management (IWRM), a Holistic Approach to Sustainable Water Management)
Abstract
:The aim of this investigation was to help select design criteria that highlight customer satisfaction, and thus improve the design quality in buildings, specifically in a building of a thermal hotel. The methodology is based on applying the Quality Function Deployment (QFD) technique to listen to the voice of the customer, in addition to the Analytic Hierarchy Process (AHP), which allows selection of the best design alternative. The literature shows that QFD–AHP methods have been tried in different areas of the building industry, but there are few examples of combining building design processes. In the study process, collaboration environments between stakeholders were established and the operability of the method used was tested with real actors. The matrix solutions realised in the horizontal and vertical sections of the framework of the model can be reused in different projects with different user demands. This added a modular and developable feature to the model. This study revealed that the most important customer needs, in order of importance, are “health”, “service”, “comfort”, and “functionality”. These are followed by “accessibility”, “aesthetics”, and “energy conservation”. According to the findings, QFD was shown to be an appropriate method for transferring customer (occupant) requirements to designs in the most accurate manner, given the complex structure of thermal hotel buildings.
1. Introduction
Rapid and continuous change is inevitable in the building industry. For this reason, quality-oriented [1,2,3] approaches should be adopted at every phase of the production process to ensure continuous superiority in international competition. The quality policy adopted in projects that are designed to be long lasting is vital in this respect.
The building design process starts with an idea and a requirement. This process proceeds through actions such as inputs, processes, and outputs. The designer-oriented feature of the initial phase of this process reflects the poor transfer of occupant expectations to the design process. In addition, it is very difficult for designers to evaluate their own designs objectively, and to formulate the effects of the designed space on their users [4,5]. The success of the building process is proportional to the accuracy and timeliness of the data from the planning and design phases. Feedback of experience is particularly valuable in buildings because they are primarily customised products from which the prototypes are built and occupied.
However, the construction industry has been slow to learn from buildings in use because the industry does not closely consider the buildings’ occupants [6]. This results in the production of buildings that cannot meet the expectations of customers. Therefore, it is vital to develop methods that take into account the feedback and expectations of building users beginning from the first phase of building construction.
The literature review shows that there are several investigations that use the QFD method in the construction industry [7,8,9,10,11,12,13,14,15,16,17,18,19,20,21,22,23,24].
Eldin and Hikle [15] considered QFD to be a process that manages the development of a new production. In their study, QFD was sampled in a building design project. In this study, a model was created of university classes in the future, whereas Singhaputtangkul et al. [20] used the Knowledge-Based Decision Support System, Quality Function Deployment (KBDSS-QFD), to decide on the building envelopes. Wood et al. [23] utilised the same method to achieve occupant satisfaction in green hospital design. Singhaputtangkul and Zhao [25] suggested that building designers should focus on QFD in the construction industry so that they can make the most appropriate decisions while creating building shells with sustainable and developable design goals. The book discusses some features that can be integrated into the traditional QFD method to improve efficiency. Juan et al. [26] stated that user expectations are different in the production of housing in the building industry. They used the QFD method to reveal the expectations and cognitive differences of the designers and residential users, and to produce solutions.
In the building industry, customer expectations are difficult to determine, and eliminating these deficiencies in the application phase causes problems in the production process. However, determining customer expectations in the first phase of the building production process has a great importance in the successful implementation of the process.
In the literature, it is seen that there are some examples where QFD-AHP methods have been tried in different areas of the building industry, but there are few studies in which these methods have been combined with building design processes. For this reason, in the current study, it was emphasised that a multi-criteria method should be used to determine the correct strategies based on user satisfaction in the design process, which is the early stage of building production. This investigation tried to include the QFD method in the design process of thermal tourism hotel buildings.
To test the method, a field study was conducted in a thermal tourism region in Turkey. When building thermal tourism hotels, the philosophy of quality must be adopted throughout the life cycle of the hotels to increase the success and ensure the sustainability of the buildings. It is of great importance that the philosophy of quality is transferred to every phase of design and implementation in this process when construction has begun in the region.
This study aims to create awareness about the continuity of a sustainable construction process with a competitive power structure, taking into account occupant satisfaction. Considering the complex structures of thermal hotels and the characteristics associated with these structures, the QFD method is considered to be an appropriate method for transferring customer (user) requirements to designs in the most accurate manner. By including the QFD method in the thermal hotel design process, a common language is produced for the expectations of all stakeholders.
The present investigation utilised the Quality Function Deployment (QFD) method, which was developed to improve quality and to ensure customer satisfaction in the production and service sectors. It was predicted that the QFD method would transfer the expectations of the customers and the technical requirements to the designs in the most accurate manner and eliminate the deficiencies in this direction. The adaptability of the QFD method and its structure, which can analyse both the qualitative and quantitative measures, will enable the concept of quality to be incorporated into the design processes. The structure of the study is presented in Figure 1.
2. Materials and Methods
The inclusion of quality assessment and development methods from the design phase in the production process will make a significant contribution to the systematic process of building production. In the analysis and assessment of the information collected, qualitative and quantitative methods were used together to ensure the criteria were as objective and measurable as possible.
In the investigation, the QFD method was tested in the building production area. The method was modelled on thermal hotels. Aksaray (Ihlara) thermal region in the Central Anatolia region of Turkey was preferred as the study area. The importance rating of the data was calculated by the AHP method. In March 2018, the pairwise comparison matrices in the AHP method were applied to a focus group of 20 people, and consistency analyses were calculated. With the customer expectations and importance rating, a horizontal section was created that expresses the “voice of the customer” in the house of quality, which is a group of complex matrices that make up the central structure of the QFD.
In the next step, technical studies were undertaken by conducting literature research and a field study, and brainstorming with service providers and the design team. The house of quality was formed by combining the data and findings obtained from the solutions of all matrices. The house of quality shows the results of many analyses on a single visual.
This investigation, which aimed to introduce the philosophy of quality to thermal tourism buildings, was also aimed at the continuation of a sustainable building production process that takes into account occupant satisfaction and provides high competitiveness [27,28].
2.1. Quality and Quality Function Deployment (QFD)
In construction, the quality is defined as the production of effective solutions in a wide range of factors, such as targeted cost, duration, physical performance criteria, functional expectations, aesthetic expectations, compliance with the environmental and legal rules, feasibility, sustainability, and energy saving. The quality of a design can be explained as the inclusion of customer expectations in building design. To improve the quality of architectural design, many methods of different disciplines are being tried. Among these methods, Quality Function Deployment systematically approaches customer (occupant) requests and translates their requirements into numerical figures and provides precise and concrete data [17]. One of the most privileged stakeholders for the companies operating in the construction sector is the customer [17]. Therefore, in this study, the word “customer” was used instead of “occupant”. The steps to meet the needs and expectations of a customer constitute the quality criteria.
The Quality Function Deployment (QFD) method employs a range of matrices called the house of quality (HoQ) to translate customer expectations into technical requirements [29]. This method was developed to improve the quality of the products. QFD is a method that enables the determination of customers’ requests and needs, and includes the planning and development of structured products from design to marketing to meet these requirements [10,30]. This association between customer expectations (the “whats”) and technical specifications (the “hows”) enables the development of a quantitative criterion that shows the effects of each feature on customer expectations [26,31,32]. The most important advantage of QFD is the digitisation of subjective expert opinions, thus facilitating the determination of preferences [32].
According to Akoa, QFD is a method that transforms customer demands into design goals and aims to improve the quality of design [33]. Day defined QFD as a process of planning or operation that would enable products and services to support and complement each other [34]. Dikmen et al. [17] defined the QFD as a comprehensive application of Total Quality Management (TQM), which requires a clear assessment of customer (end-occupant) expectations to transform the basic needs of a project into design goals [17]. The use of QFD in the early phases of designs enables a focus on the budget, performance, and operational dimensions of projects, and more accurate decisions regarding customer satisfaction. Sullivan defined QFD as “a system that transforms customer demands into appropriate technical requirements at every stage of product development and production (marketing strategies, planning, product design, and engineering, prototype assessment, sales process, production process, and development, etc.)” [35,36]. Wolfe described QFD as a formal structure to improve the system development process [37].
QFD is the transformation of consumer needs (whats) into technical requirements (hows) at every phase of product development and production. QFD associates customer expectations with technical requirements and uses the house of quality (HoQ) matrices to demonstrate the quality of projects and achieve the objectives [20,38]. Upon completion of these matrices, the QFD process usually ends [39].
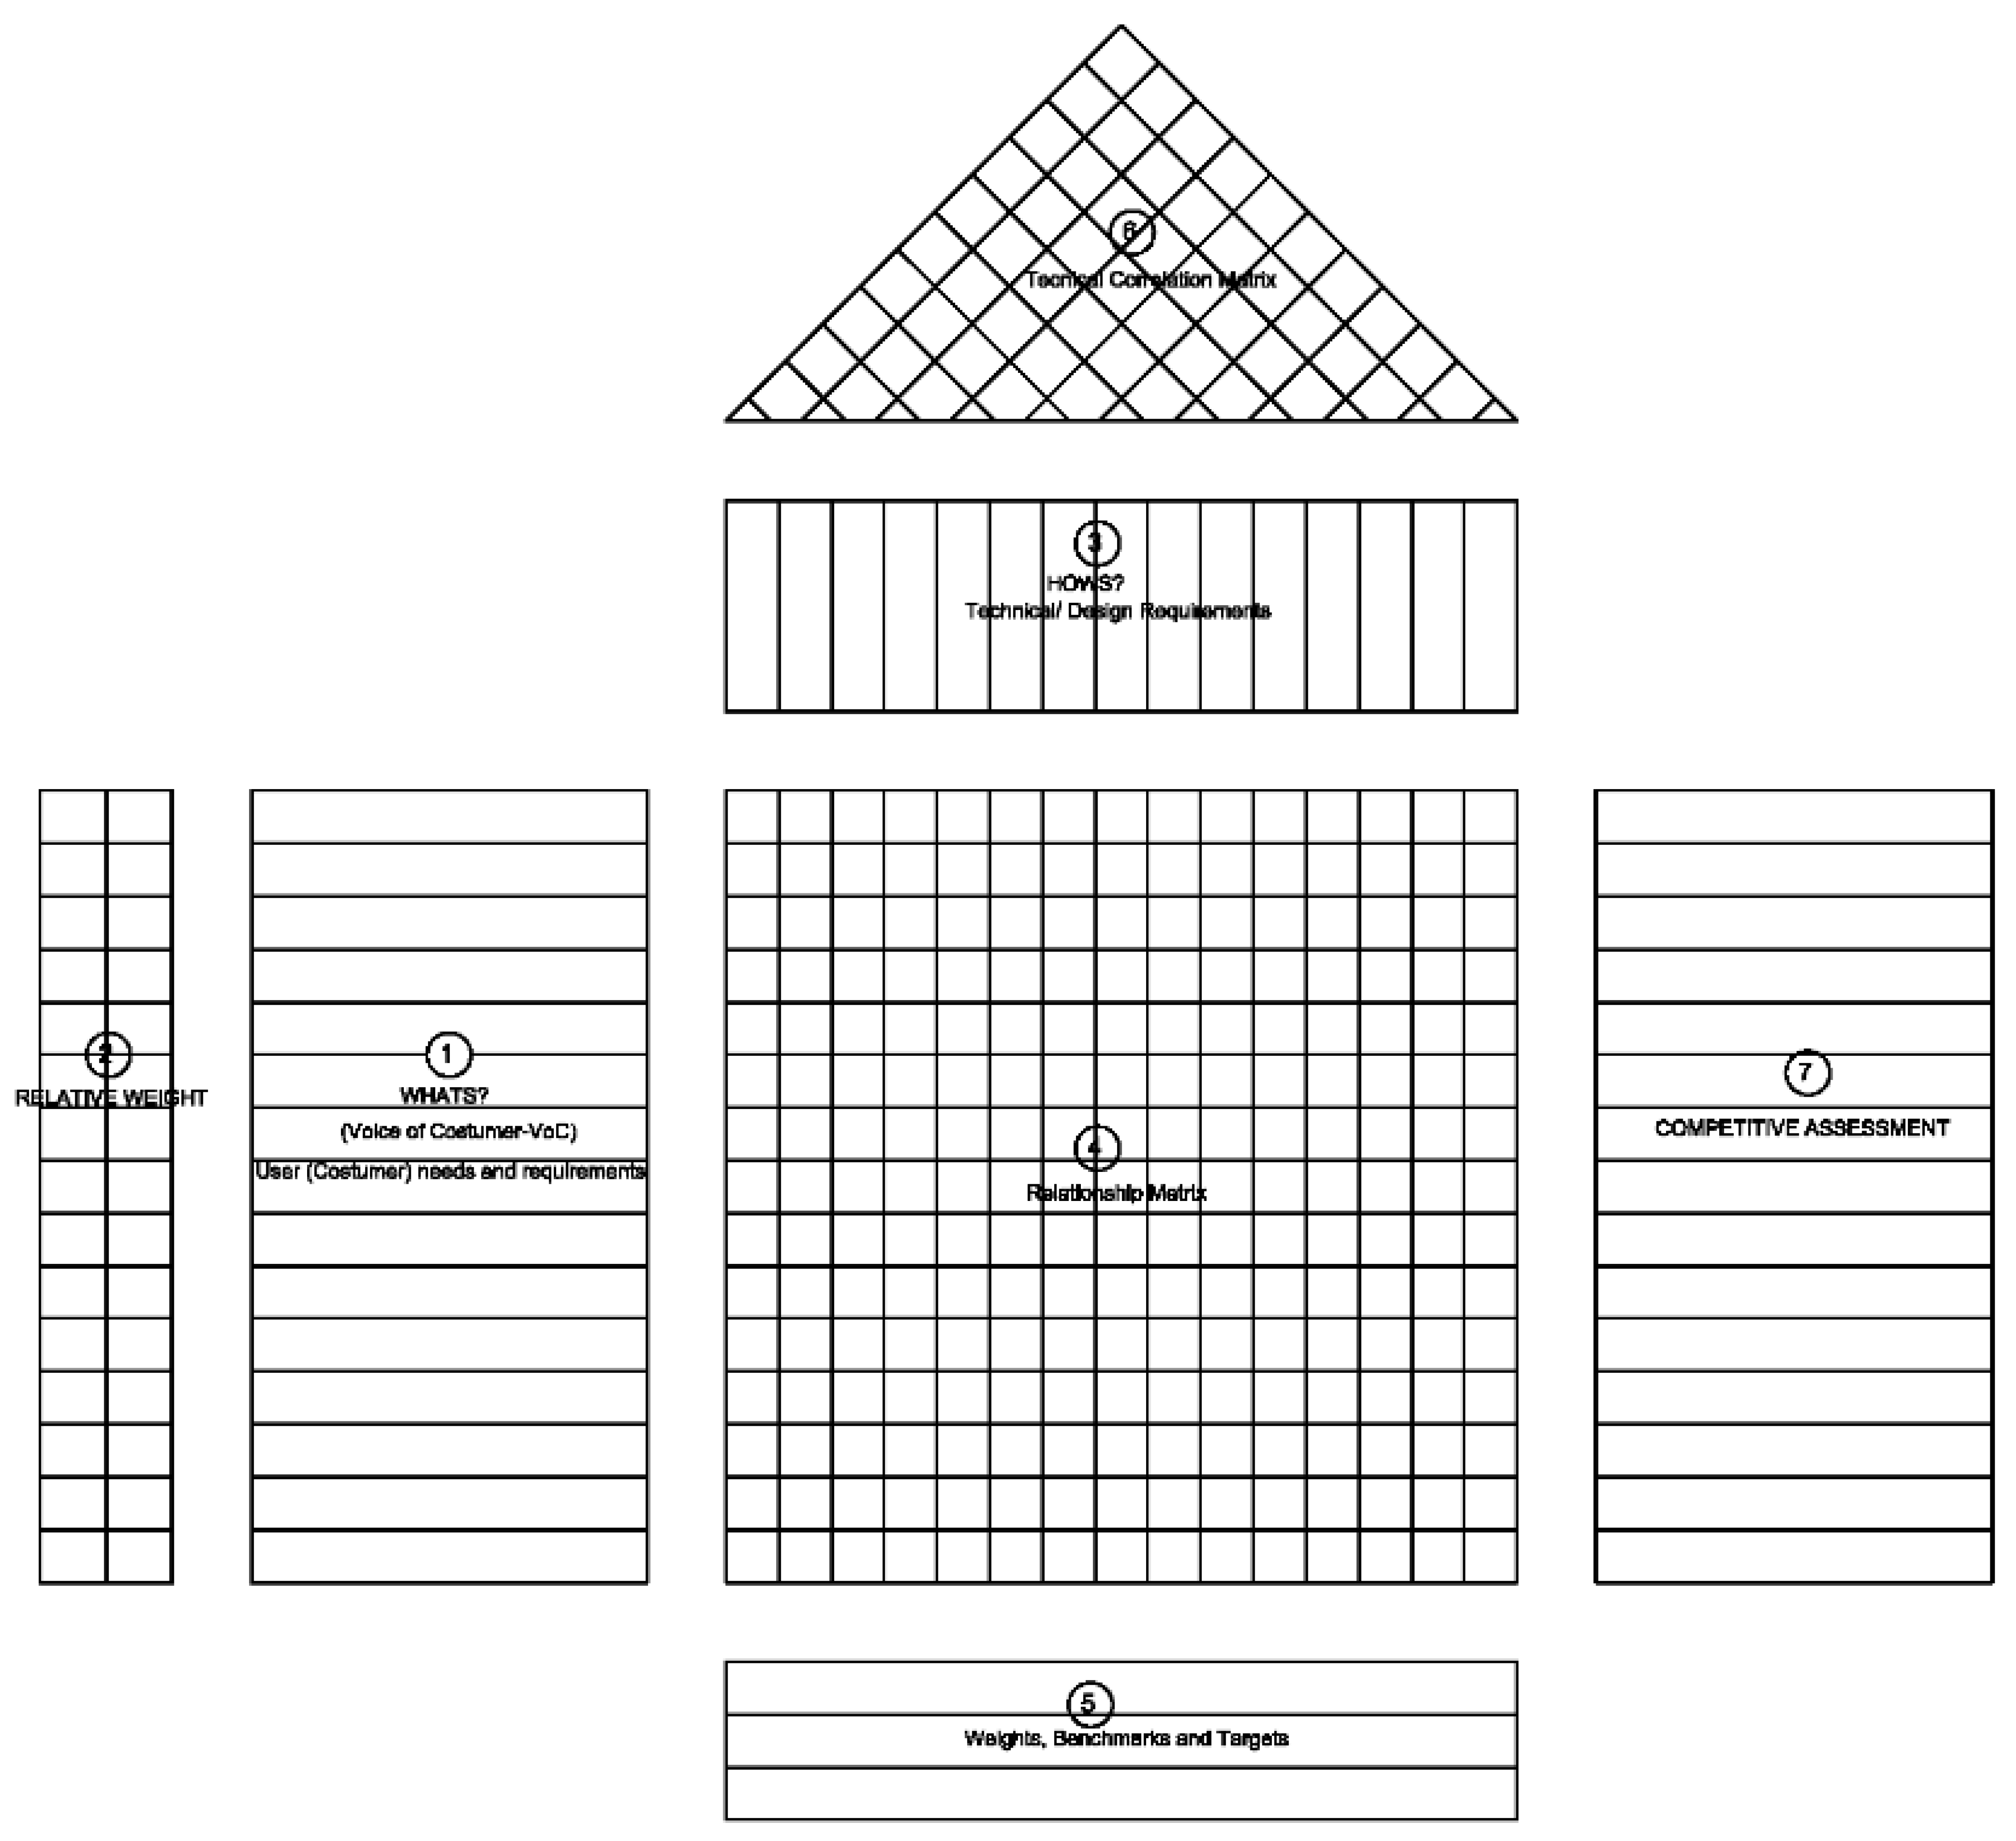
The house of quality is a group of complex matrices that make up the central structure of the QFD [40]. The house of quality is a kind of conceptual map that provides the means for interfunctional planning and communications [28,41,42]. The house of quality organises information about customer expectations and technical requirements. Problems can be identified by looking at the grid of this house. The house of quality is a multifunctional tool. In addition to containing numerical data for engineers, it also represents the customer’s voice for producers and managers. The seven steps to build a house of quality are as follows: Step 1, customer needs and requirements (voice of customer, VoC); step 2, determining the order of priority with the AHP method by grouping customer expectations with the affinity and hierarchy diagram; step 3, determination of technical requirements; step 4, solutions to matrices to determine the relationships between customer requirements and technical requirements; step 5, calculating the degree of technical significance and the degree of normalised technical significance; step 6, correlation matrices; and step 7, competitive analysis and determination of the goals (Figure 2).
2.2. Steps of House of Quality Diagram
2.2.1. Customer Needs and Requirements (Voice of Customer, VoC)
One of the most important methods used to listen to the voice of the customer is focus group interviews. In this method, the project team meets with a group representing the customer group, and brainstorms with open-ended questions or learns their demands through surveys. When preparing the items in the survey method, sometimes not possible to estimate the actual needs of customers. Gemba analysis is widely used to eliminate this gap in the survey method. Gemba is the place where the product or service provides value for the customer [43].
2.2.2. Determining the Order of Priority with the AHP Method by Grouping Customer Expectations with the Affinity and Hierarchy Diagram
Expectations that have been revealed by the surveys comprise scattered data consisting of many items and expressions in different scopes. For the organisation of this list of needs and expectations, affinity diagrams [44] and hierarchy diagrams are usually used.
The data organised in groups at the first stage with affinity diagrams are reorganised in a horizontal and hierarchical scheme with the hierarchy diagram [45]. Demonstration of hierarchically grouped data in a systematic order provides comprehensive and complete design criteria for customer expectations [15]. It is formed collecting similar ideas under the main title [46]. It provides the filling of gaps that may be caused by neglected or forgotten items through the logical analysis of hierarchy diagrams [15].
The QFD method requires the determination of the importance levels of the customer requirements as the primary input to determine the priority elements that enable the product to be produced at the targeted quality. Therefore, it is of great importance to utilise the Analytical Hierarchy Process (AHP) when determining the data to be entered into the QFD. AHP is a multi-criteria decision-making technique developed by Saaty, which enables the selection of alternatives in the set of selected criteria [47]. Since AHP allows for the calculation of the consistency index during comparison, it is preferred for decision-making in MCDM. Due to its simplicity, ease of use, and great flexibility, the Analytic Hierarchy Process (AHP) has been studied extensively and used in nearly all applications related to multiple criteria decision-making (MCDM) since its development [31,47,48,49,50,51,52,53,54,55]. Thus, the application of AHP has become a popular research method in various fields for assessing, rating, and determining the importance weightings for selection indicators or criteria [31,52]. Considering these factors, AHP, one of the MCDM methods, was employed in this study.
The aim of using AHP is to organise concrete or abstract factors systematically and to provide solutions in the decision-making process of problems [47]. Sarathy defined AHP as modelling in a hierarchical structure showing the relations between a complex problem, goals, criteria, and alternatives [48]. According to this method, at the top of the established hierarchical structure, the target is specified, under which subgoals and alternatives are mentioned. In addition to structuring complex problems, AHP allows the inclusion of objective and subjective considerations in the decision process. In AHP, all parts of the hierarchy are related to each other, and it is easy to see the extent to which the change in one factor affects other factors. The next step after the creation of the hierarchy table of the decision problem is to determine the weights of the criteria with the same importance. At this stage, Saaty’s 1–9 scale for AHP preference is utilised for the determination of the weights: 1—two criteria contribute equally to the objective; 3—experience and judgment strongly favour one activity over another; 5—an activity is very strongly favoured over another, and its dominance is demonstrated in practice; 7—an activity is strongly favoured, and its dominance is demonstrated in practice; 9—the evidence of favouring one activity over another is of the highest possible order of affirmation; and 2, 4, 6, and 8 are used to represent compromise between the priorities listed above [46]. With this scale used by Saaty, the degree of importance of the criteria is determined. Thus, data normalisation is an essential part of any decision-making process because it transforms the input data into numerical data [53]. After the data normalisation process, the significant priorities are determined using either the eigenvectors method or a simplified version with the Simple Additive Weighting (SAW) method [52] (Table 1 and Table 2).
According to the multiplicative reciprocal matrix, the maximal eigenvalue λmax and associated eigenvector can be obtained, and then the normalised eigenvector serves as the preference vector of the alternatives.
In an ideal case, the value of λmax is equal to the number of alternatives. When the multiplicative reciprocal matrix exhibits some level of inconsistency, λmax will be larger than the number of alternatives. In practical decision scenarios, it is hard to obtain a completely consistent multiplicative reciprocal matrix [54]. Based on the eigenvalue method, Saaty [2] developed a consistency index to quantify the inconsistency level of multiplicative reciprocal matrices [46,54,55]. Then, Saaty’s consistency index is defined as follows (Fomulas (1) and (2)) [46,49,50,52,54]:
The consistency ratio is calculated as follows:
Random Consistency Index values (RI) [46]

2.2.3. Determination of Technical Requirements
Once the customer expectations section of the QFD matrices is determined, the next step is to assess the information in this section as an input and to develop the technical requirements section of the matrices. Technical requirements are at the top of the house of quality, in the columns section. At least one technical requirement should be identified to meet each customer request. The “hows” may consist of processes, persons, functions, or methods. However, to identify these, the knowledge of an entire organisation is necessary. At this point, multidisciplinary teamwork is essential because solving problems requires different ideas and experiences.
The purpose of the Quality Function Deployment methodology is not to provide design or application solutions in the early stages of the project [34]. Rather, the primary objective is to demonstrate the multi-faceted and critical relationships of all processes with the desired needs by creating a visual map that will enable the user to focus on their thoughts and requirements. For this reason, technical requirements were determined as a result of the literature reviews, interviews with facility occupants, managers, and expert technical staff, and field studies.
2.2.4. Matrices Solution to Determine the Relationships between Customer Requirements and Technical Requirements.
After determining the technical requirements to meet customer needs, the relationships between these requirements and customer needs are determined. The aim is to show the effectiveness of each technical requirement in meeting specific customer demands. In order to determine these relationship levels, team members need to make a joint decision. The relationship level in the house of quality is indicated by a specific rating. The American rating system was preferred in the study: strong relationship—9; moderate relationship—3; and weak relationship—1.
2.2.5. Calculating the Degree of Technical Significance and the Degree of Normalised Technical Significance
After determining the technical requirements to meet customer needs, the relationships between these requirements and customer needs are determined. The aim is to show the effectiveness of each technical requirement in meeting specific customer demands. To determine these relationship levels, team members need to make a joint decision. In the house of quality, the relationship matrices aim to ensure the determination of the Importance of Technical Requirements (IoTR) to meet customer expectations. After determining the relationship level between the customer expectations and the technical requirements, the Importance of Technical Requirements is calculated using the formula at the bottom of the house of quality:
The bottom grid contains the normalised values of these importance ratings (Formulas (3) and (4)).
2.2.6. Correlation Matrices
The purpose of the correlation matrices is to determine whether the technical requirements are positive or negative in their relations with each other. Negative requirements are carefully examined. Thus, the negative impact of a technical requirement on others is communicated to the project team or the company to take necessary measures. In this paper, two symbols (positive relationship or negative relationship) are used to show the relationships between the technical requirements (in the correlation matrices section) [17,51].
2.2.7. Competitive Analysis and Determination of the Goals
In this section, the number of competitors is determined by the QFD team to compare the data related to the job or service, and the columns are created accordingly in the house of quality. Once all necessary data are placed as an input to the house of quality, analyses are undertaken (Formulas (5) and (6)). Other than mandatory customer expectations, technical requirements, and the relations between them, the skeleton of the house of quality has a flexible structure that depends on all other sections (types of analysis, development of the matrices), the nature and scope of the data, and the other institutional variables [34].
QFD is a system of matrices that provides a structure similar to a backbone. Many models can be proposed for development on this backbone structure. However, these models need to be shaped according to the situation of the QFD team.
3. Results
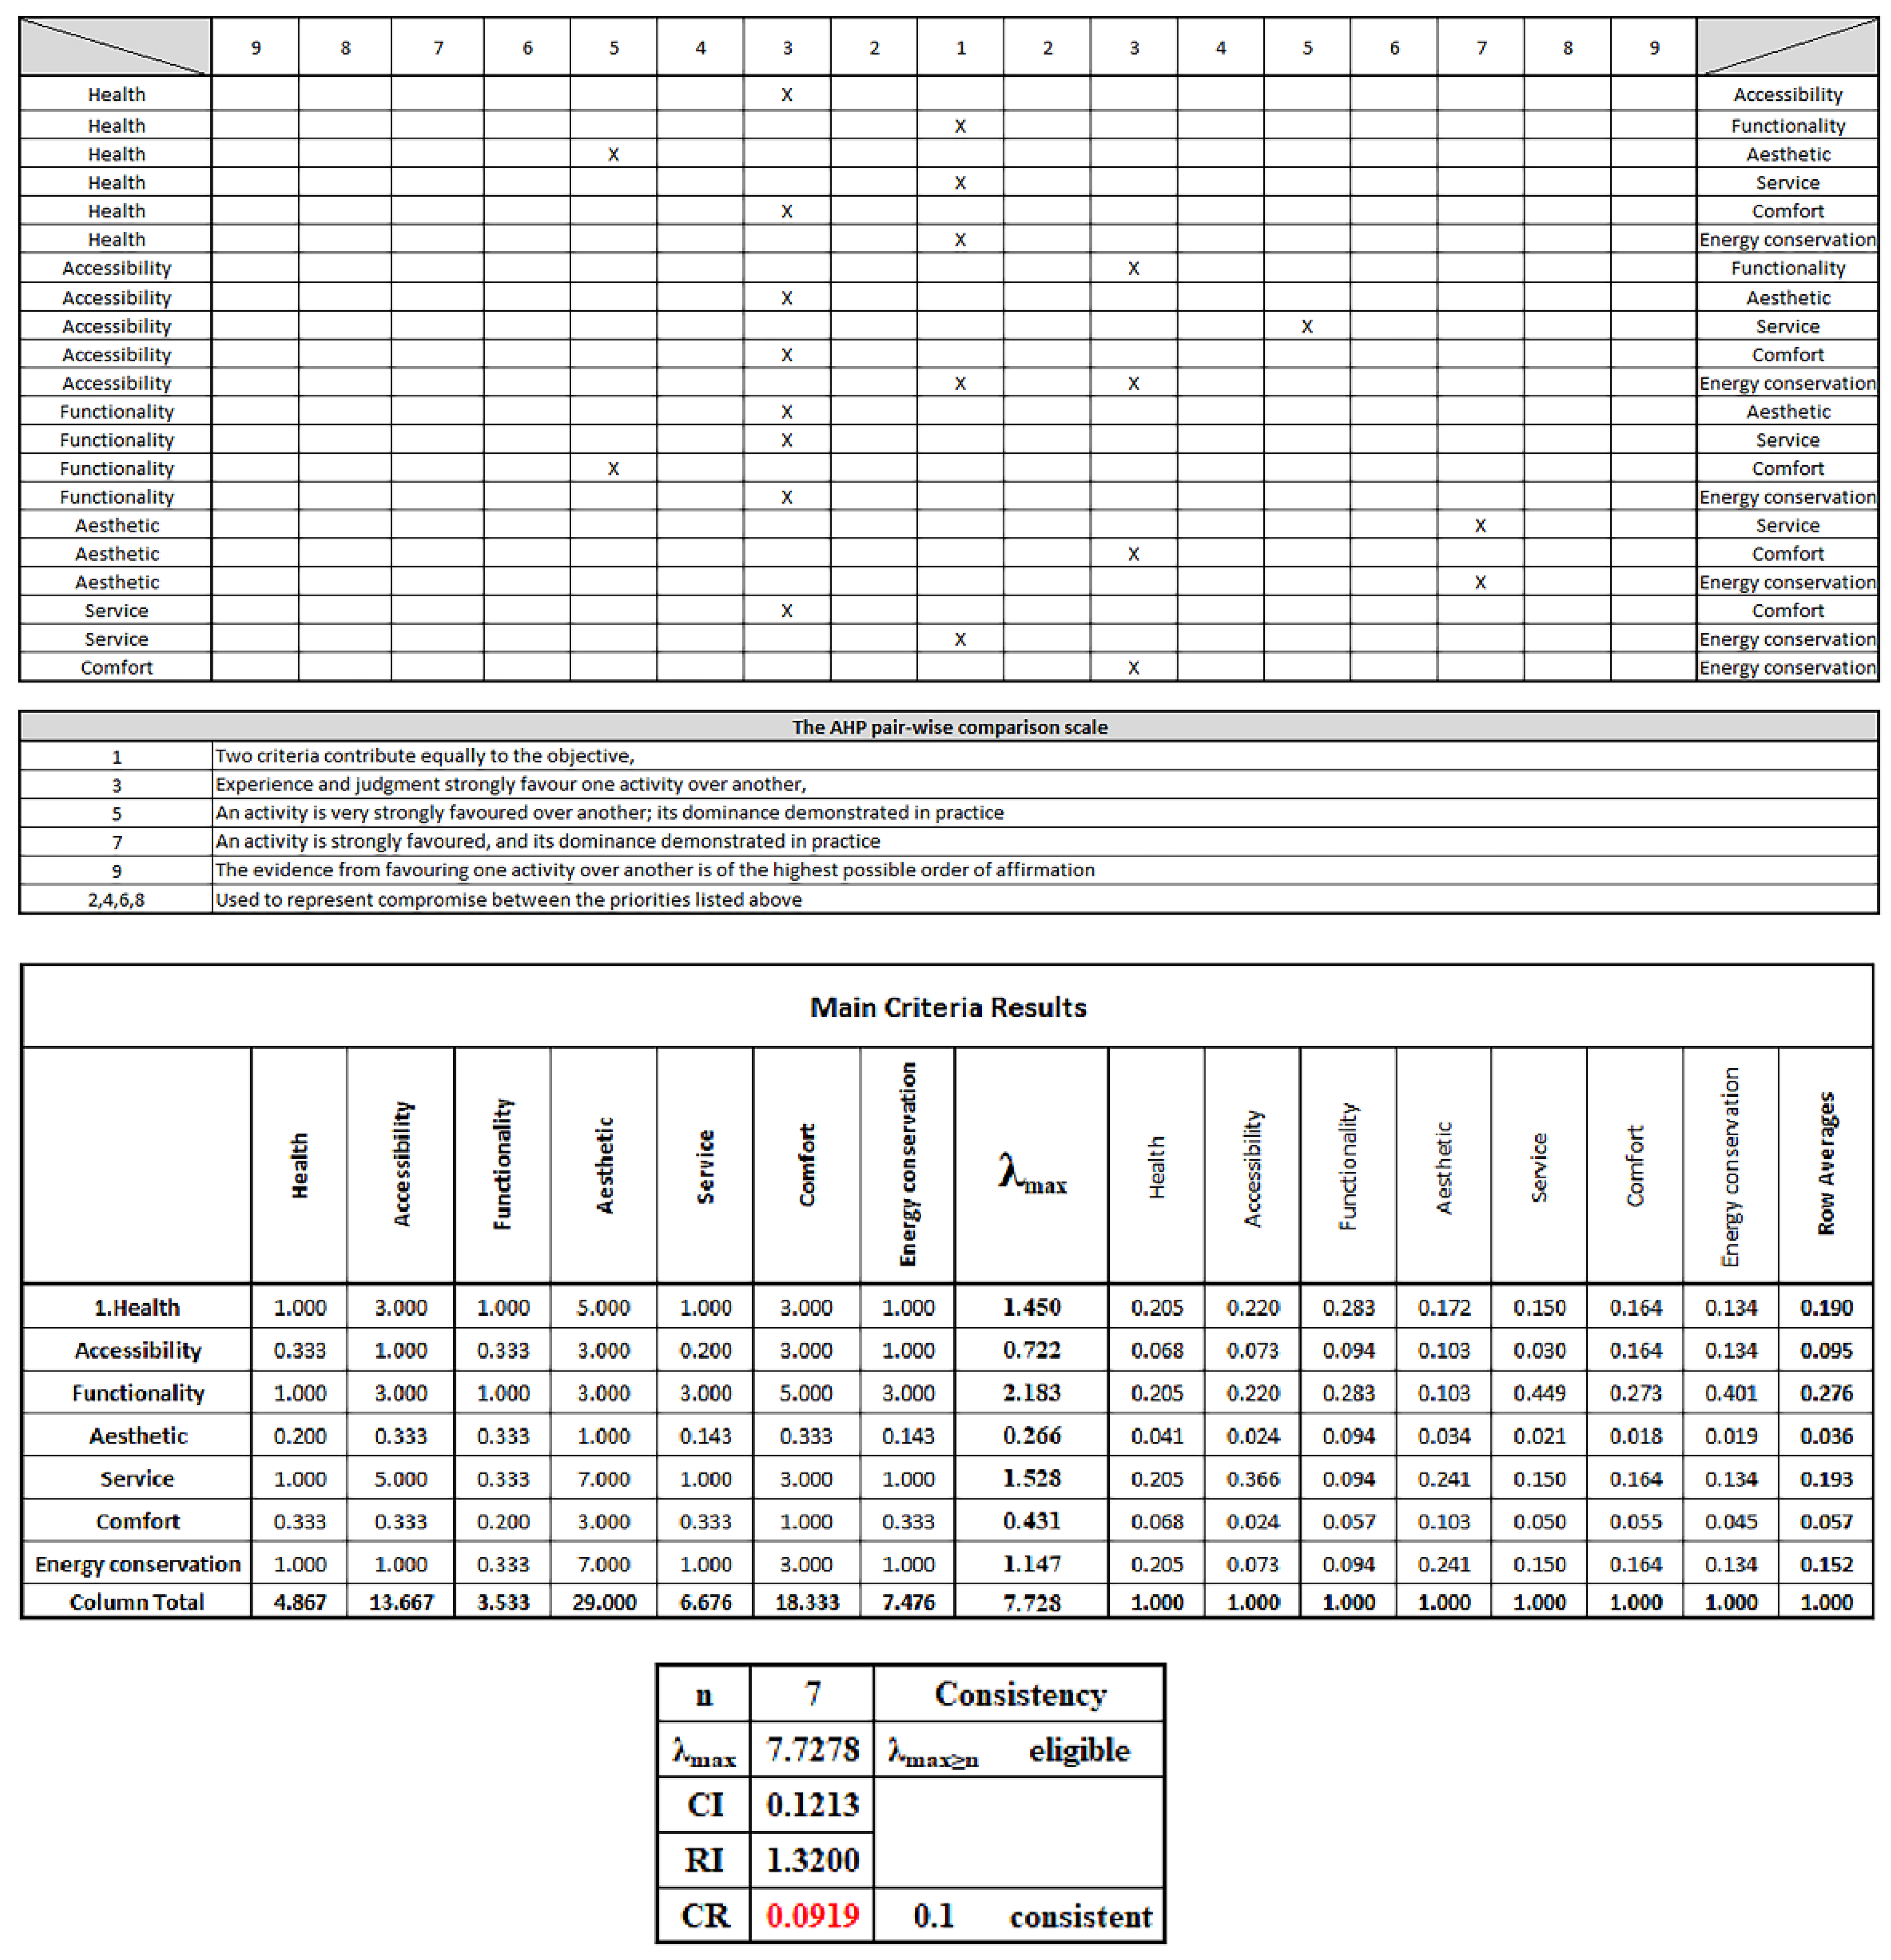
In August 2017, interviews were conducted with a randomly selected focus group of 60 people using facilities to obtain their demands for thermal hotels. The answers given to the questionnaires were ranked from the most positive answers to the least positive with the “average of the scores” method. Numerous disorganised data collected from questionnaires were first grouped with the affinity diagram and rearranged in main and subgroups with the help of the hierarchy diagram. In March 2018, the AHP pairwise comparison matrix was applied to a focus group of 20 people, and consistency analyses were undertaken. Conducting these determinations at the preliminary design phase enabled the transfer of the correct data to the stakeholders of the project. AHP pairwise comparison matrix analyses are presented in Figure 1 as an example (Figure 3, Table 3).
Using the Analytical Hierarchy Process (AHP) method, the importance of the customer requirements was calculated. In March 2018, the AHP pairwise comparison matrices were applied to a focus group of 20 people, and consistency analyses were undertaken. Conducting these determinations at the preliminary design phase enabled the transfer of the correct data to the stakeholders of the project. The comparison matrices between the criteria are square matrices with dimensions of n * n. The matrix components on the diagonal of these matrices take the value 1 because each criterion is compared to itself.
The comparison matrices show the importance of the criteria in relation to each other according to a certain logic. However, to determine the percentage distributions of these criteria, the totals of the columns that make up the comparison matrices are used. The comparison matrices show the importance of the criteria in relation to each other in certain logic (Table 4 and Table 5). Although the AHP has a consistent system in itself, the accuracy of the results naturally depends on the consistency of the comparison between the criteria made by the decision maker. Based on the customer expectations and importance rating, a horizontal section is created that expresses the “voice of the customer” in the house of quality. The column of importance ratings and the column of relative importance ratings adjacent to it provide a valuable source of information for detailed analysis of customer needs and expectations. This column is formed by calculating the relative importance of each customer’s expectations in relation to each other in each line. The vertical column of the QFD method, based on customer expectations, includes the technical requirements section that contains information about the customer. The technical requirements were determined as a result of the literature reviews, interviews with thermal hotel occupants, managers, and expert technical staff, and field studies.
After determining the technical requirements to meet customer needs, matrix solutions were derived on the house of quality (Figure 4). To create the relations matrices section in the house of quality, we asked for the help of an experienced technical team working on thermal hotel projects. The team, consisting of two architects and one mechanical engineer, tried to identify the relationship between customer expectations and technical requirements. This method allows the project team to know the relationships between customer expectations and technical requirements at the design phase, and enables the assessment of potential threats and opportunities. After determining the relationships, the technical importance rating was calculated according to customer expectations.
The calculated technical importance rating is shown at the bottom of the house of quality. A lower row contains the relative importance (normalised) value of these ratings. The values obtained for each technical requirement were added, and the results were then added to the technical importance rating line in the lower part of the relations matrices. After establishing the relationship matrices section and calculating the importance of technical requirements, the technical team was asked to determine the correlation relationships. The correlation matrices showed that each technical requirement had a positive or negative relationship.
In the study, a competition analysis section was added to the skeleton of the house of quality (Figure 4). The purpose of the technical assessment of competition is to allow the companies wishing to use the model to assess their status in the sector and to compare their status with that of other companies. In this study, Aksaray Ihlara Thermal Holiday Village (Cappadocia) was accepted as the research company, and it was compared with its competitors in its vicinity. The demands in the customer voice section were assessed using a five point scale. When the results of the assessment of competition are combined with the other results of the matrices, it can be determined how much the company is behind its competitors in terms of meeting customer expectations. Thus, the company gains knowledge about the topics that need improvement.
4. Discussion
The analysis studies revealed that the most important customer needs are “health”, “service”, “comfort” and “functionality”. These are followed by “accessibility”, “aesthetics”, and “energy conservation”, also in order of importance. These results imply that the primary purpose of thermal hotel visits is to receive treatment and be healed. In other words, customers who visit these facilities primarily for health reasons demand clean, spacious designs where they can obtain good service, rest, have fun, and feel comfortable.
According to the subcriteria, the health criterion includes the subcriteria of “Health effects of hot spring”, “Clean air and climate impacts on health”, and “organic product use”, in order of importance. Climate cure treatments, which are complementary to thermal water treatment at thermal hotels, should also be included in the design. Facilities should be located in a large recreational area, isolated from noise and traffic density, and intertwined with nature. The materials used must be organic and hygienic. The service criterion includes the subcriteria of “service by the staff”, “social facilities”, and “economic”, in order of importance. The comfort criterion includes the subcriteria of “ensuring spatial comfort”, “control of temperature”, and “control of sound and light”, in order of importance. In thermal hotel designs, spatial comfort should be considered. Special attention to ventilation and air conditioning issues, and arrangements for noise, temperature, and light and humidity control, will improve the design and use quality.
Although thermal hotel designs are similar to the designs of accommodation facilities, the most obvious difference is that the design of their basic units is based on hot springs and the climate. Therefore, when designing thermal hotels, these differences should be considered, and design criteria specific to spa and wellness units should be established.
Accurate use of planning and design principles in the production process of thermal hotels will lay the foundations for sustainable development. As a result of the study conducted in Aksaray and its vicinity, macroplanning decisions, which are the cornerstone of the design, determined the most important criteria for both customer expectations and technical requirements. The calculation of the importance ratings of technical requirements enabled the determination of technical requirements with high importance ratings, and allowed the technical team to focus on these requirements. By calculating the importance of technical requirements, more important technical requirements were identified and the design team was able to focus on these requirements. Thus, a healthier design and production process was achieved.
Considering the importance ratings of technical requirements calculated based on the customer expectations, it can be seen that “climate factor and assessment of environmental factors” has the highest importance rating (“10.20”). According to this item, which was calculated as a result of comparing customer expectations and technical requirements, the location of the thermal source and topographic conditions are crucial for thermal hotel design. This is an appropriate solution to avoid damaging the source and deliver the source to the facility in the shortest possible manned. The locations should have a relaxing natural and artificial environment. In addition, the thermal hotel should not be located in an area with unplanned urbanisation. Topographic characteristics change the effects and duration of climate elements, and thus lead to changes in the effect of the climate on buildings. In addition, when determining the location of the buildings, areas that are free of noise and other environmental problems should be preferred as much as possible.
“Determining the effect of human factors that are effective in macro- and microplanning decisions on design” has the second highest importance rating (“8.85”), indicating that it has a vital place in the design of thermal hotels. Human factors also determine behavioural performance. Performance is the determinant of the relationships between the physical environment and human behaviour, human satisfaction, and sociological and psychological satisfaction. These include factors such as the size of a building, the proximity of the indoor areas, the frequency of their use, and the spaces created for privacy and social interaction. These factors are of great importance for design quality. The macro- and microplanning decisions of thermal hotels are shaped according to the environmental structure, location, socio-cultural and socio-economic status, and customer profile.
Furthermore, the requirement of “spatial arrangements” has the third highest importance rating (“6.65”). Furthermore, the “geometry and dimensions of the building” has the fourth highest importance rating (“6.63”), whereas the “thermal and acoustic effects, lighting, and ventilation solutions” has the fifth highest importance rating (“6.56”). “The performance characteristics” has the sixth highest importance rating (“6.05”), “environmentally friendly and durable solutions” has the seventh highest importance rating (“5.52”), and the “use of efficient, quality and economical materials” has the eighth highest importance rating (“5.28”).
“Transportation and accessibility” has the ninth highest importance rating (“5.15”), whereas the “orientation of the building” has the tenth highest importance rating (“4.94”). When these requirements are transferred to designs, thermal facilities should be considered as a whole. Around the accommodation and curing centre, green spaces, jogging and hiking trails, and entertainment venues (recreational water facilities such as the Aqua Park) should be established. Between units, there should be open and closed passages. The dimensions determined in the spatial arrangements should have measures that can provide freedom of movement and function; production of nonfunctional spaces should be avoided. The geometry of the building should take into account local texture, regional climate data, and environmental factors. The production of sustainable buildings should consider the effect of parameters such as the climate of the region; active and passive systems in accordance with the climate, or the combined use of the two; topography; vegetation; and orientation of the building with respect to the sun and the wind.
The technical requirement of “infrastructure works for the protection of thermal resources, and capacity determination” has the eleventh highest importance rating (“4.92”). According to this technical requirement, protection areas must be determined. Planning of thermal facilities requires interdisciplinary studies. Water flow should be measured, and the catchment area should be formed. Geological structure and hydrogeological conditions, the topographic structure of the environment and climatic conditions, soil types, the drainage area boundary, residential areas, and industrial facilities should be determined. In addition, for thermal tourism in the region of a hot spring, the strategy plans should be prepared at the preliminary design phase.
The “convenient, flexible and improved solutions” has the twelfth highest importance rating (“4.58”). Spaces should be flexible and able to be improved. Interior comfort conditions will provide a more aware approach to energy efficiency by grouping different locations (zoning/creating buffer space). When designing buildings, building geometry cannot be considered to be independent of the local fabric and contemporary architectural factors cannot be ignored. Both cases should be well blended in designs. The building must reflect the character of its environment. Accurate volume organisations are crucial to improve the quality of designs. In the same manner, adding different functions to the same space when designing spaces provides a significant flexibility tool. Flexibility in design includes elements such as multifunctionality, increased spatial relationships, the creation of a multifunctional facade, the creation of divisible/connectable spaces, and the capacity of areas of usage. By comparison, structural flexibility can be assessed under the two subheadings of bearing systems and structural components. The concept of flexibility in bearing systems requires features such as large openings, flexibility in structural joints, and effective intervention in the system.
5. Conclusions
A model was developed in the present study using Quality Function Deployment (QFD) and Analytic Hierarchy Process (AHP) methods and their matrix solution. The matrix solution derived in the horizontal and vertical sections of the skeleton of the model can be derived again with different expectations and requirements in various projects. Thus, the model is modular and able to be improved.
For the implementation of the model in the architectural production process, we first recommend an interdisciplinary study. It is of paramount importance to include expert individuals in the project team to manage the QFD and to investigate the environmental, cultural, and sociological characteristics of the region to be designed. Therefore, we recommend cooperation between the academic circles, local governments, operators, and non-governmental organisations in the region. During the study, this cooperation was established, and the comprehensibility and auditability of the proposed model were tested with real actors.
The house of quality matrix expresses the results of many analyses with a single visual. During the production of new projects in the construction sector, in addition to identifying technical requirements, occupants’ decisions need to be concretised using more objective methods. It is considered that the produced model can fill this gap. The QFD and AHP methods offer new models in the assessment process because their structures can be adapted and they can be used to analyse both qualitative and quantitative measures. Using these models, comparison of the obtained information is possible. The model’s features, such as grouping according to specific characteristics, main and subcriteria categorisation in a hierarchical order, and assessment based on pairwise comparison, enable quality assessment at the design phase. The building design and production processes involve complex problems.
The matrices produced by the QFD and AHP methods try to break this complexity down into small pieces, which can then be solved gradually. The model proposed by this study emphasises the parameters that can be used in the assessment of quality, and provides a measurement system that efficiently identifies different architectural design types. This system is not standardised, and is open to change and development. The comparative analysis capability of the QFD method provides projects with the quality control and assessment of occupant satisfaction. This method, which is recommended for use in the design phase, can also be used as a decision support system for the renewal of the existing building stock and maintenance and demolition decisions.
Author Contributions
Conceptualisation, Investigation, Methodology, Formal Analysis, Writing—Original Draft, Preparation and Writing—Review & Editing, F.K.V., F.C., M.d.l.C.d.R.-R. and C.O. All authors have read and agreed to the published version of the manuscript.
Funding
This research is supported by the Selcuk University Scientific Research Project Fund (SUBAP-17201065).
Institutional Review Board Statement
Not applicable.
Informed Consent Statement
Not applicable.
Data Availability Statement
Not applicable.
Conflicts of Interest
The authors declare no conflict of interest.
References
- Mohr-Jackson, I. Managing a total quality orientation: Factors affecting customer satisfaction. Ind. Mark. Manag. 1998, 27, 109–125. [Google Scholar] [CrossRef]
- Noguchı, M. The effect of the quality-oriented production approach on the delivery of prefabricated homes in Japan. J. Hous. Built Environ. 2003, 18, 353–364. [Google Scholar] [CrossRef]
- Gransberg, D.D.; Molenaar, K. Analysis of owner’s design and construction quality management approaches in design/build projects. J. Manag. Eng. 2004, 20, 162–169. [Google Scholar] [CrossRef]
- Bordass, B.; Leaman, A. Making feedback and post-occupancy evaluation routine 3: Case studies of the use of techniques in the feedback portfolio. Build. Res. Info. 2005, 33, 361–375. [Google Scholar] [CrossRef]
- Göçer, Ö.; Hua, Y.; Göçer, K. Completing the missing link in building design process: Enhancing post-occupancy evaluation method for effective feedback for building performance. Build. Environ. 2015, 89, 14–27. [Google Scholar] [CrossRef]
- Way, M.; Bordass, B. Making feedback and post-occupancy evaluation routine 2: Soft landings–involving design and building teams in improving performance. Build. Rese. Info. 2005, 33, 353–360. [Google Scholar] [CrossRef]
- Shino, J.; Nishihara, R. Quality development in the construction industry. In Quality Function Deployment (QFD): Integrating Customer Requirements into Product Design; Akao, Y., Ed.; Productivity Press: Portland, OR, USA, 1990; pp. 263–297. [Google Scholar]
- Mallon, J.; Mullıgan, D. Quality function deployment—A system for meeting customers’ needs. J. Constr. Eng. Manag. 1993, 119, 516–531. [Google Scholar] [CrossRef]
- Huovila, P.; Lakka, A.; Laurikka, P.; Vainio, M. Involvement of Customer Requirements in Building Design. In Lean Construction. Balkema, Rotterdam; CRC Press: Boca Raton, FL, USA, 1997; pp. 403–416. [Google Scholar]
- Abdul-Rahman, H.; Kwan, C.; Woods, P.C. Quality function deployment in construction design: Application in low-cost housing design. Int. J. Qual. Reliab. Manag. 1999, 16, 591–605. [Google Scholar] [CrossRef]
- Gargıone, L.A. Using quality function deployment (QFD) in the design phase of an apartment construction project. Proc. IGLC Citeseer 1999, 7, 357. [Google Scholar]
- Kamara, J.M.; Anumba, C.J.; Evbuomwan, N.F. Client requirements processing in construction: A new approach using QFD. J. Archit. Eng. 1999, 5, 8–15. [Google Scholar] [CrossRef]
- Pheng, L.S.; Yeap, L. Quality function deployment in design/build projects. J. Archit. Eng. 2001, 7, 30–39. [Google Scholar] [CrossRef]
- Ardıtı, D.; Lee, D.E. Assessing the corporate service quality performance of design-build contractors using quality function deployment. Constr. Manag. Econ. 2003, 21, 175–185. [Google Scholar] [CrossRef]
- Eldın, N.; Hıkle, V. Pilot study of quality function deployment in construction projects. J. Constr. Eng. Manag. 2003, 129, 314–329. [Google Scholar] [CrossRef]
- Yang, Y.Q.; Wang, S.Q.; Dulaımı, M.; Low, S.P. A fuzzy quality function deployment system for buildable design decision-makings. Autom. Constr. 2003, 12, 381–393. [Google Scholar] [CrossRef]
- Dıkmen, I.; Bırgonul, M.T.; Kızıltas, S. Strategic use of quality function deployment (QFD) in the construction industry. Build. Environ. 2005, 40, 245–255. [Google Scholar] [CrossRef]
- Delgado-Hernandez, D.J.; Aspınwall, E. Quality management case studies in the UK construction industry. Total Qual. Manag. 2008, 19, 919–938. [Google Scholar] [CrossRef]
- Carıaga, I.; El-Dıraby, T.; Osman, H. Integrating value analysis and quality function deployment for evaluating design alternatives. J. Constr. Eng. Manag. 2007, 133, 761–770. [Google Scholar] [CrossRef]
- Sınghaputtangkul, N.; Low, S.P.; Teo, A.L.; Hwang, B.G. Knowledge-based decision support system quality function deployment (KBDSS-QFD) tool for assessment of building envelopes. Autom. Constr. 2013, 35, 314–328. [Google Scholar] [CrossRef]
- Ulubeylı, S.; Kazaz, A.; Soycopur, B.; Er, B. Quality function deployment in the speculative house-building market: How to satisfy high-income customers. Int. J. Constr. Manag. 2015, 15, 148–156. [Google Scholar] [CrossRef]
- John, R.; Smith, A.; Chotipanich, S.; Pitt, M. Awareness and effectiveness of quality function deployment (QFD) in design and build projects in Nigeria. J. Facil. Manag. 2014, 12, 72–88. [Google Scholar] [CrossRef]
- Wood, L.C.; Wang, C.; Abdul-Rahman, H.; Abdul-Nasır, N.S.J. Green hospital design: Integrating quality function deployment and end-user demands. J. Clean. Prod. 2016, 112, 903–913. [Google Scholar] [CrossRef]
- Juan, Y.K.; Perng, Y.H.; Castro-Lacouture, D.; Lu, K.S. Housing refurbishment contractors selection based on a hybrid fuzzy-QFD approach. Autom. Constr. 2009, 18, 139–144. [Google Scholar] [CrossRef]
- Sınghaputtangkul, N.; Zhao, X. Applying a fuzzy consensus scheme to enhance the group decision making of a building envelope design team. J. Constr. Eng. Manag. 2016, 142, 04016025. [Google Scholar] [CrossRef]
- Juan, Y.K.; Hsıng, N.P.; Hsu, Y.H. Applying the Kano two-dimensional model and quality function deployment to develop sustainable planning strategies for public housing in Taiwan. J. Hous. Built Environ. 2019, 34, 265–282. [Google Scholar] [CrossRef]
- Kürüm Varolgüneş, F.; Canan, F. Determination of Customer Requirements for Thermal Accommodation Facility Designs. Afyon Kocatepe University. J. Soc. Sci. 2018, 20, 231–248. [Google Scholar]
- Kürüm Varolgüneş, F.; Canan, F. The Importance of the Use of QFD-AHP Methods in Architectural Design Quality Evaluation. In Proceedings of the International Conference on Multidisciplinary, Science, Engineering and Technology (IMESET’18), Dubai, United Arab Emirates, 25–27 October 2018. [Google Scholar]
- Ashtıany, M.S.; Alıpour, A. Integration Axiomatic Design with Quality Function Deployment and Sustainable design for the satisfaction of an airplane tail stakeholders. Procedia CIRP 2016, 53, 142–150. [Google Scholar] [CrossRef]
- Savaş, H.; Mevhıbe, A. Üniversite Kütüphanesi Tasarımında Kalite Fonksiyon Göçerimi Uygulaması. Dokuz Eylul Univ. Sos. Bilimler Enst. Derg. 2005, 3, 80–98. [Google Scholar]
- Kamaruzzaman, S.N.; Lou, E.C.W.; Wong, P.F.; Wood, R.; Che-Anı, A.I. Developing weighting system for refurbishment building assessment scheme in Malaysia through analytic hierarchy process (AHP) approach. Energy Policy 2018, 112, 280–290. [Google Scholar] [CrossRef]
- Işık, O.; Seğmen, Y.E.; Kölemen, M. Engineering Curriculum Design Using Quality Function Deployment. J. Aeronaut. Space Technol. 2012, 5, 55–60. [Google Scholar]
- Akao, Y. History of quality function deployment in Japan. Best Qual. Targets Improv. Syst. 1990, 3, 183–196. [Google Scholar]
- Day, R.G. Quality Function Deployment: Linking a Company with Its Customers; Asq Press: Milwaukee WI, USA, 1995. [Google Scholar]
- Sullıvan, L.P. Quality function deployment. Qual. Prog. 1986, 19, 39–50. [Google Scholar]
- Sullıvan, L.P. Policy management through quality function deployment. Qual. Prog. 1988, 21, 18–20. [Google Scholar]
- Wolfe, M. Development of the city of quality: A hypertext-based group decision support system for quality function deployment. Decis. Support Syst. 1994, 11, 299–318. [Google Scholar] [CrossRef]
- Özdemır, Y.; Alcan, P.; Başlıgıl, H.; Çakrak, D. A hybrid QFD-AHP methodology and an application for heating systems in Turkey. Int. J. Optim. Control. Theor. Appl. (IJOCTA) 2018, 8, 117–126. [Google Scholar] [CrossRef]
- Hauser, J.R.; Clausıng, D. The house of quality. Harv. Bus. Rev. 1988, 1, 1–16. [Google Scholar]
- Shen, X.X.; Tan, K.C.; Xıe, M. An integrated approach to innovative product development using Kano’s model and QFD. Eur. J. Innov. Manag. 2020, 3, 91–99. [Google Scholar] [CrossRef]
- Shıllıto, M.L. Advanced QFD: Linking Technology to Market and Company Needs; John Wiley & Sons: New York, NY, USA, 1994. [Google Scholar]
- Bazaati, S.; Bayrmi, S.; Emel, O.R.A.L. Kalite Fonksiyon Yayılımı ve İnşaat Sektöründe Bir Uygulama. Çukurova Üniversitesi Mühendislik-Mimarlık Fakültesi Dergisi 2014, 29, 53–62. [Google Scholar] [CrossRef]
- Mazur, G.H. Voice of customer analysis: A modern system of front-end QFD tools, with case studies. In Proceedings of the Annual Quality Congress Proceedings-American Society for Quality Control. Orlando, Milwaukee, WI, USA, 5–7 May 1997; pp. 486–495. [Google Scholar]
- Shafer, S.M.; Smıth, H.J.; Lınder, J.C. The power of business models. Bus. Horiz. 2005, 48, 199–207. [Google Scholar] [CrossRef]
- Gurı-Rozenblıt, S. Effects of a tree diagram on students’ comprehension of main ideas in an expository text with multiple themes. Read. Res. Q. 1989, 24, 236–247. [Google Scholar] [CrossRef]
- Awasthı, A.; Chauhan, S.S. A hybrid approach integrating Affinity Diagram, AHP and fuzzy TOPSIS for sustainable city logistics planning. Appl. Math. Model. 2012, 36, 573–584. [Google Scholar] [CrossRef]
- Saaty, T.L. How to make a decision: The analytic hierarchy process. Eur. J. Oper. Res. 1990, 48, 9–26. [Google Scholar] [CrossRef]
- Sarathy, P.S. TQM practice in real-estate industry using AHP. Qual. Quant. 2013, 47, 2049–2063. [Google Scholar] [CrossRef]
- Ramanathan, R. A note on the use of the analytic hierarchy process for environmental impact assessment. J. Environ. Manag. 2001, 63, 27–35. [Google Scholar] [CrossRef]
- Emır, O.; Saraçlı, S. Determination of the thermal hotel location: Application of analytic hierarchy process. Tour. Hosp. Manag. 2014, 20, 71–83. [Google Scholar] [CrossRef]
- Moubachır, Y.; Bouamı, D. A new approach for the transition between QFD phases. Procedia CIRP 2015, 26, 82–86. [Google Scholar] [CrossRef]
- Eryürük, Ş.; Varolgüneş, F.K.; Varolgüneş, S. Assessment of stakeholder satisfaction as additive to improve building design quality: AHP-based approach. J. Hous. Built Environ. 2021, 1–24. [Google Scholar] [CrossRef]
- Vafaei, N.; Ribeiro, R.A.; Camarinha-Matos, L.M. Normalization techniques for multi-criteria decision making: Analytical hierarchy process case study. In Doctoral Conference on Computing, Electrical and Industrial Systems; Springer: Cham, Switzerland, 2016; pp. 261–269. [Google Scholar]
- Zhang, B.A.; Pedrycz, W.; Fayek, A.R.; Dong, Y. A Differential Evolution-Based Consistency Improvement Method in AHP with an Optimal Allocation of Information Granularity. IEEE Trans. Cybern. 2020, 1–12. [Google Scholar] [CrossRef]
- Ho, W.; Ma, X. The state-of-the-art integrations and applications of the analytic hierarchy process. Eur. J. Oper. Res. 2018, 267, 399–414. [Google Scholar] [CrossRef]
Figure 1.
The structure of the study.

Figure 2.
Steps of the house of quality diagram.

Figure 3.
AHP pairwise comparison matrices result (example—Questionnaire 1).

Figure 4.
The house of quality for thermal hotel design.


Table 1.
Development of the pairwise comparison matrix [52].
Table 1.
Development of the pairwise comparison matrix [52].
| Criteria | C1 | C2 | C3 | Cn | |
|---|---|---|---|---|---|
| C1 | 1 | a12 | a13 | a1n | |
| C2 | 1/a12 | 1 | a23 | a2n | |
| C3 | 1/a13 | 1/a23 | 1 | a3n | |
| 1 | |||||
| Cn | 1/a1n | 1/a2n | 1/a3n | 1 | |
| ∑Column1 | ∑Column2 | ∑Column3 | ∑Columnn |
Table 2.
Development of the normalised matrix [52].
Table 2.
Development of the normalised matrix [52].
| Criteria | C1 | C2 | C3 | Cn | Row Average | Weights |
|---|---|---|---|---|---|---|
| C1 | 1/∑Column1 | (a12)/∑Column2 | (a13)/∑Column3 | (a1n)/∑Columnn | ∑Row1/n = | w1 |
| C2 | (1/a12)/∑Column1 | 1/∑Column2 | (a23)/∑Column3 | (a2n)/∑Columnn | ∑Row2/n = | w2 |
| C3 | (1/a13)/∑Column1 | (1/a23)/∑Column2 | 1/∑Column3 | (a3n)/∑Columnn | ∑Row3/n = | w3 |
| Cn | (1/a1n)/∑Column1 | (1/a2n)/∑Column2 | (1/a3n)/∑Column3 | 1/∑Columnn | ∑Rown/n = | wn |
Table 3.
AHP pairwise comparison matrices result table (Questionnaire 1).
| Main Criteria | 1 | 2 | 3 | 4 | 5 | 6 | 7 | Weights |
|---|---|---|---|---|---|---|---|---|
| (1) Health | 1.000 | 3.000 | 1.000 | 5.000 | 1.000 | 3.000 | 1.000 | 0.1897 |
| (2) Accessibility | 0.333 | 1.000 | 0.333 | 3.000 | 0.200 | 3.000 | 1.000 | 0.0953 |
| (3) Functionality | 1.000 | 3.000 | 1.000 | 3.000 | 3.000 | 5.000 | 3.000 | 0.2764 |
| (4) Aesthetic | 0.200 | 0.333 | 0.333 | 1.000 | 0.143 | 0.333 | 0.143 | 0.0361 |
| (5) Service | 1.000 | 5.000 | 0.333 | 7.000 | 1.000 | 3.000 | 1.000 | 0.1935 |
| (6) Comfort | 0.333 | 0.333 | 0.200 | 3.000 | 0.333 | 1.000 | 0.333 | 0.0574 |
| (7) Energy conservation | 1.000 | 1.000 | 0.333 | 7.000 | 1.000 | 3.000 | 1.000 | 0.1516 |
| Consistency ratio: 0.0919 | ||||||||
| Health | ||||||||
| (1) Health effects of hot spring | 1.000 | 3.000 | 0.333 | 0.2605 | ||||
| (2) Clean air and climate impacts on health | 0.333 | 1.000 | 0.200 | 0.1062 | ||||
| (3) Use of organic products | 3.000 | 5.000 | 1.000 | 0.6333 | ||||
| Consistency ratio: 0.0477 | ||||||||
| Accessibility | ||||||||
| (1) Location | 1.000 | 0.200 | 3.000 | 0.333 | 0.1192 | |||
| (2) Disability solution | 5.000 | 1.000 | 9.000 | 5.000 | 0.6275 | |||
| (3) Vehicle and pedestrian path | 0.333 | 0.111 | 1.000 | 0.333 | 0.0554 | |||
| (4) Inter-unit accessibility | 3.000 | 0.200 | 3.000 | 1.000 | 0.1978 | |||
| Consistency ratio: 0.0989 | ||||||||
| Functionality | ||||||||
| (1) Flexibility and Expandability | 1.000 | 1.000 | 3.000 | 5.000 | 3.000 | 0.3373 | ||
| (2) Suitability for use | 1.000 | 1.000 | 3.000 | 5.000 | 3.000 | 0.3373 | ||
| (3) Use of local materials | 0.333 | 0.333 | 1.000 | 5.000 | 1.000 | 0.1475 | ||
| (4) Appropriate size | 0.200 | 0.200 | 0.200 | 1.000 | 0.333 | 0.0513 | ||
| (5) Performance | 0.333 | 0.333 | 1.000 | 3.000 | 1.000 | 0.1265 | ||
| Consistency ratio: 0.0386 | ||||||||
| Aesthetic | ||||||||
| (1) Facade of building | 1.000 | 0.333 | 1.000 | 0.1867 | ||||
| (2) local architecture design | 3.000 | 1.000 | 5.000 | 0.6555 | ||||
| (3) Originality | 1.000 | 0.200 | 1.000 | 0.1578 | ||||
| Consistency ratio: 0.0372 | ||||||||
| Service | ||||||||
| (1) Staff service | 1.000 | 5.000 | 3.000 | 0.6555 | ||||
| (2) Social facilities | 0.200 | 1.000 | 1.000 | 0.1578 | ||||
| (3) Economic | 0.333 | 1.000 | 1.000 | 0.1867 | ||||
| Consistency ratio: 0.0372 | ||||||||
| Comfort | ||||||||
| (1) Noise and light control | 1.000 | 1.000 | 0.333 | 0.1867 | ||||
| (2) Temperature control | 1.000 | 1.000 | 0.200 | 0.1578 | ||||
| (3) Spatial comfort | 3.000 | 5.000 | 1.000 | 0.6555 | ||||
| Consistency ratio: 0.0372 | ||||||||
| Energy conservation | ||||||||
| (1) Environmental awareness | 1.000 | 0.333 | 0.333 | 3.000 | 0.1454 | |||
| (2) Natural environment data | 3.000 | 1.000 | 0.333 | 5.000 | 0.2816 | |||
| (3) Use of natural resources | 3.000 | 3.000 | 1.000 | 7.000 | 0.5152 | |||
| (4) Action plans | 0.333 | 0.200 | 0.143 | 1.000 | 0.0578 | |||
| Consistency ratio: 0.0738 | ||||||||
Table 4.
AHP consistency ratio results (f = 20).
| CRITERIA | F 1 | F 2 | F 3 | F 4 | F 5 | F 6 | F 7 | F 8 | F 9 | F 10 | F 11 | F 12 | F 13 | F 14 | F 15 | F 16 | F 17 | F18 | F 19 | F 20 |
|---|---|---|---|---|---|---|---|---|---|---|---|---|---|---|---|---|---|---|---|---|
| Main criteria | 0.0919 | 0.0859 | 0.0878 | 0.0690 | 0.0748 | 0.0855 | 0.0908 | 0.0960 | 0.0990 | 0.0922 | 0.0879 | 0.0903 | 0.0992 | 0.0929 | 0.0928 | 0.0959 | 0.0887 | 0.1448 | 0.0709 | 0.0815 |
| Health subcriteria | 0.0477 | 0.0834 | 0.0093 | 0.0000 | 0.0477 | 0.0564 | 0.0961 | 0.0390 | 0.0961 | 0.0758 | 0.0897 | 0.0000 | 0.0000 | 0.0961 | 0.0477 | 0.0477 | 0.0961 | 0.0834 | 0.0477 | 0.0961 |
| Accessibility subcriteria | 0.0989 | 0.0604 | 0.0696 | 0.0276 | 0.0713 | 0.0931 | 0.0875 | 0.0914 | 0.0983 | 0.0000 | 0.0931 | 0.0713 | 0.0997 | 0.0654 | 0.0260 | 0.0000 | 0.0664 | 0.0213 | 0.0533 | 0.0493 |
| Functionality subcriteria | 0.0386 | 0.0882 | 0.0777 | 0.0920 | 0.0479 | 0.0904 | 0.0430 | 0.0439 | 0.0998 | 0.0690 | 0.0000 | 0.0802 | 0.0000 | 0.0745 | 0.0183 | 0.0718 | 0.0240 | 0.0519 | 0.0761 | 0.0982 |
| Aesthetic subcriteria | 0.0372 | 0.0477 | 0.0961 | 0.0961 | 0.0000 | 0.0961 | 0.0477 | 0.0000 | 0.0477 | 0.0093 | 0.0093 | 0.0477 | 0.0000 | 0.0477 | 0.0477 | 0.0477 | 0.0607 | 0.0961 | 0.0607 | 0.0000 |
| Service subcriteria | 0.0372 | 0.0093 | 0.0961 | 0.0000 | 0.0000 | 0.0834 | 0.0834 | 0.0000 | 0.3065 | 0.0607 | 0.0607 | 0.0758 | 0.0479 | 0.0000 | 0.0000 | 0.0758 | 0.0961 | 0.0000 | 0.0000 | 0.0000 |
| Comfort subcriteria | 0.0372 | 0.0961 | 0.0477 | 0.0477 | 0.0000 | 0.0961 | 0.0309 | 0.0000 | 0.0477 | 0.0000 | 0.0611 | 0.0000 | 0.0170 | 0.0961 | 0.0000 | 0.0000 | 0.0000 | 0.0309 | 0.0607 | 0.0000 |
| Energy conservation subcriteria | 0.0738 | 0.0738 | 0.0604 | 0.0713 | 0.0545 | 0.0689 | 0.0576 | 0.0079 | 0.0369 | 0.0664 | 0.0826 | 0.0738 | 0.0654 | 0.0000 | 0.0873 | 0.0545 | 0.0997 | 0.0874 | 0.0689 | 0.0808 |
Table 5.
Importance of customer requirements (f = 20).
| CRITERIA | F1 | F 2 | F 3 | F 4 | F 5 | F 6 | F 7 | F 8 | F 9 | F 10 | F 11 | F 12 | F 13 | F 14 | F 15 | F16 | F 17 | F 18 | F 19 | F 20 | Importance of Customer Requirements |
|---|---|---|---|---|---|---|---|---|---|---|---|---|---|---|---|---|---|---|---|---|---|
| 1. Health | 0.1897 | 0.2435 | 0.3947 | 0.2586 | 0.2857 | 0.0594 | 0.4750 | 0.4103 | 0.4054 | 0.1423 | 0.3783 | 0.3370 | 0.2240 | 0.1013 | 0.2523 | 0.3418 | 0.1261 | 0.2823 | 0.2536 | 0.2758 | 0.2719 |
| 1.1. Health contribution of thermal water | 0.2605 | 0.6434 | 0.6687 | 0.7143 | 0.6333 | 0.5247 | 0.7235 | 0.6689 | 0.7235 | 0.7028 | 0.5105 | 0.7143 | 0.4286 | 0.7235 | 0.6333 | 0.6333 | 0.7235 | 0.6434 | 0.6333 | 0.7235 | 0.6315 |
| 1.2. Health contribution of climate | 0.1062 | 0.0738 | 0.2431 | 0.1429 | 0.1062 | 0.1416 | 0.0833 | 0.2674 | 0.0833 | 0.1822 | 0.1001 | 0.1429 | 0.4286 | 0.1932 | 0.2605 | 0.2605 | 0.1932 | 0.2828 | 0.2605 | 0.1932 | 0.1873 |
| 1.3. Use of organic products | 0.6333 | 0.2828 | 0.0882 | 0.1429 | 0.2605 | 0.3338 | 0.1932 | 0.0637 | 0.1932 | 0.1149 | 0.3893 | 0.1429 | 0.1429 | 0.0833 | 0.1062 | 0.1062 | 0.0833 | 0.0738 | 0.1062 | 0.0833 | 0.1812 |
| 2. Accessibility | 0.0953 | 0.0446 | 0.0782 | 0.2951 | 0.0502 | 0.1038 | 0.0971 | 0.2238 | 0.0911 | 0.1019 | 0.0409 | 0.0597 | 0.0548 | 0.0499 | 0.0356 | 0.2501 | 0.0550 | 0.0667 | 0.0239 | 0.0319 | 0.0925 |
| 2.1. Location | 0.1192 | 0.5134 | 0.0347 | 0.5324 | 0.0989 | 0.1591 | 0.6585 | 0.2707 | 0.0943 | 0.1000 | 0.1591 | 0.0989 | 0.0765 | 0.5579 | 0.5549 | 0.1250 | 0.0969 | 0.3889 | 0.2715 | 0.0780 | 0.2494 |
| 2.2. Disability solutions | 0.6275 | 0.1009 | 0.3119 | 0.0606 | 0.1716 | 0.2630 | 0.0484 | 0.0513 | 0.0490 | 0.3000 | 0.5011 | 0.3648 | 0.5430 | 0.2633 | 0.0967 | 0.3750 | 0.2906 | 0.3889 | 0.5646 | 0.5117 | 0.2942 |
| 2.3. Vehicle and pedestrian path | 0.0554 | 0.1188 | 0.2437 | 0.2191 | 0.6080 | 0.5011 | 0.1515 | 0.1044 | 0.2725 | 0.3000 | 0.0768 | 0.3648 | 0.2445 | 0.1219 | 0.0967 | 0.3750 | 0.2281 | 0.1535 | 0.0825 | 0.1725 | 0.2245 |
| 2.4. Inter-units accessibility | 0.1978 | 0.2670 | 0.4097 | 0.1879 | 0.1216 | 0.0768 | 0.1416 | 0.5736 | 0.5842 | 0.3000 | 0.2630 | 0.1716 | 0.1360 | 0.0569 | 0.2516 | 0.1250 | 0.3844 | 0.0687 | 0.0814 | 0.2378 | 0.2318 |
| 3. Functionality | 0.2764 | 0.0771 | 0.1060 | 0.0923 | 0.1961 | 0.1013 | 0.1218 | 0.0917 | 0.0692 | 0.2032 | 0.0409 | 0.0794 | 0.1298 | 0.0808 | 0.1495 | 0.0578 | 0.2163 | 0.0836 | 0.1437 | 0.0828 | 0.1200 |
| 3.1. Flexibility and Expandability | 0.3373 | 0.4314 | 0.0452 | 0.1297 | 0.1066 | 0.1372 | 0.0593 | 0.0327 | 0.2767 | 0.0559 | 0.2381 | 0.0366 | 0.2308 | 0.2188 | 0.0857 | 0.2622 | 0.3331 | 0.1184 | 0.0545 | 0.4527 | 0.1821 |
| 3.2. Suitability for intended use | 0.3373 | 0.2198 | 0.2279 | 0.4225 | 0.2316 | 0.4448 | 0.2609 | 0.2781 | 0.5495 | 0.2877 | 0.2381 | 0.2474 | 0.2308 | 0.3795 | 0.0763 | 0.2622 | 0.3736 | 0.2753 | 0.4433 | 0.2374 | 0.3012 |
| 3.3. Using appropriate materials | 0.1475 | 0.1036 | 0.1428 | 0.0883 | 0.2610 | 0.2357 | 0.2609 | 0.1329 | 0.0729 | 0.1344 | 0.2381 | 0.1000 | 0.2308 | 0.1139 | 0.2905 | 0.2622 | 0.1516 | 0.2753 | 0.2239 | 0.1450 | 0.1806 |
| 3.4. Appropriate size | 0.0513 | 0.0547 | 0.0850 | 0.1631 | 0.0516 | 0.0669 | 0.0782 | 0.2781 | 0.0623 | 0.1344 | 0.0476 | 0.1000 | 0.0769 | 0.0514 | 0.2571 | 0.0874 | 0.0777 | 0.0346 | 0.1029 | 0.0601 | 0.0961 |
| 3.5. Performance | 0.1265 | 0.1904 | 0.4991 | 0.1964 | 0.3492 | 0.1154 | 0.3408 | 0.2781 | 0.0386 | 0.3877 | 0.2381 | 0.5161 | 0.2308 | 0.2364 | 0.2905 | 0.1259 | 0.0641 | 0.2963 | 0.1755 | 0.1047 | 0.2400 |
| 4. Aesthetic | 0.0361 | 0.2683 | 0.0217 | 0.0597 | 0.0559 | 0.0483 | 0.0344 | 0.0314 | 0.0222 | 0.0346 | 0.1526 | 0.0282 | 0.0869 | 0.3249 | 0.0602 | 0.0234 | 0.0825 | 0.0641 | 0.0772 | 0.0807 | 0.0797 |
| 4.1. Facade of building | 0.1867 | 0.1062 | 0.7235 | 0.7235 | 0.7778 | 0.7235 | 0.6333 | 0.7143 | 0.1062 | 0.6687 | 0.0882 | 0.1062 | 0.6000 | 0.6333 | 0.1062 | 0.1062 | 0.5889 | 0.7235 | 0.1593 | 0.1429 | 0.4309 |
| 4.2. Use of the local architecture | 0.6555 | 0.2605 | 0.1932 | 0.0833 | 0.1111 | 0.1932 | 0.1062 | 0.1429 | 0.2605 | 0.0882 | 0.6687 | 0.6333 | 0.2000 | 0.1062 | 0.6333 | 0.2605 | 0.2519 | 0.0833 | 0.5889 | 0.4286 | 0.2975 |
| 4.3. Originality | 0.1578 | 0.6333 | 0.0833 | 0.1932 | 0.1111 | 0.0833 | 0.2605 | 0.1429 | 0.6333 | 0.2431 | 0.2431 | 0.2605 | 0.2000 | 0.2605 | 0.2605 | 0.6333 | 0.1593 | 0.1932 | 0.2519 | 0.4286 | 0.2716 |
| 5. Service | 0.1935 | 0.1098 | 0.2010 | 0.1194 | 0.2255 | 0.1515 | 0.1172 | 0.1138 | 0.1746 | 0.3160 | 0.1811 | 0.3275 | 0.2821 | 0.1849 | 0.1121 | 0.1208 | 0.2123 | 0.2615 | 0.1719 | 0.2326 | 0.1905 |
| 5.1. Staff Service | 0.5654 | 0.2431 | 0.7235 | 0.2000 | 0.4286 | 0.2828 | 0.6434 | 0.3333 | 0.5007 | 0.2519 | 0.5889 | 0.7028 | 0.3278 | 0.2000 | 0.4286 | 0.7028 | 0.7235 | 0.3333 | 0.4286 | 0.4286 | 0.4519 |
| 5.2. Social Facilities | 0.2750 | 0.6687 | 0.0833 | 0.6000 | 0.4286 | 0.0738 | 0.2828 | 0.3333 | 0.3102 | 0.5889 | 0.2519 | 0.1822 | 0.2611 | 0.2000 | 0.4286 | 0.1822 | 0.0833 | 0.3333 | 0.4286 | 0.4286 | 0.3212 |
| 5.3. Economy | 0.1596 | 0.0882 | 0.1932 | 0.2000 | 0.1429 | 0.6434 | 0.0738 | 0.3333 | 0.1890 | 0.1593 | 0.1593 | 0.1149 | 0.4111 | 0.6000 | 0.1429 | 0.1149 | 0.1932 | 0.3333 | 0.1429 | 0.1429 | 0.2269 |
| 6. Comfort | 0.0574 | 0.1452 | 0.1469 | 0.1403 | 0.1333 | 0.1451 | 0.1330 | 0.1025 | 0.1997 | 0.1764 | 0.1811 | 0.1319 | 0.1976 | 0.1572 | 0.3117 | 0.1463 | 0.2314 | 0.2157 | 0.2096 | 0.2326 | 0.1697 |
| 6.1. Noise and light control | 0.1867 | 0.0833 | 0.2605 | 0.1062 | 0.1429 | 0.1932 | 0.1150 | 0.0667 | 0.2605 | 0.1429 | 0.0904 | 0.1429 | 0.0755 | 0.0833 | 0.1429 | 0.2000 | 0.1429 | 0.1150 | 0.1593 | 0.4286 | 0.1569 |
| 6.2. Temperature control | 0.1578 | 0.1932 | 0.1062 | 0.2605 | 0.4286 | 0.0833 | 0.4055 | 0.4667 | 0.1062 | 0.4286 | 0.3537 | 0.4286 | 0.3338 | 0.1932 | 0.4286 | 0.6000 | 0.4286 | 0.4055 | 0.2519 | 0.1429 | 0.3101 |
| 6.3. Spatial comfort | 0.6555 | 0.7235 | 0.6333 | 0.6333 | 0.4286 | 0.7235 | 0.4796 | 0.4667 | 0.6333 | 0.4286 | 0.5559 | 0.4286 | 0.5907 | 0.7235 | 0.4286 | 0.2000 | 0.4286 | 0.4796 | 0.5889 | 0.4286 | 0.5329 |
| 7. Energy conservation | 0.1516 | 0.1115 | 0.0516 | 0.0344 | 0.0534 | 0.3906 | 0.0215 | 0.0265 | 0.0379 | 0.0256 | 0.0251 | 0.0364 | 0.0248 | 0.1010 | 0.0786 | 0.0597 | 0.0764 | 0.0261 | 0.1201 | 0.0637 | 0.0758 |
| 7.1. Environmental awareness | 0.1454 | 0.1454 | 0.5134 | 0.3648 | 0.5081 | 0.2104 | 0.3875 | 0.0791 | 0.3936 | 0.2281 | 0.5464 | 0.2816 | 0.5579 | 0.3000 | 0.4072 | 0.5081 | 0.1360 | 0.2959 | 0.4813 | 0.4732 | 0.3482 |
| 7.2. Natural environment data | 0.2816 | 0.2816 | 0.1188 | 0.1716 | 0.2289 | 0.0979 | 0.1792 | 0.4270 | 0.1645 | 0.2906 | 0.1246 | 0.1454 | 0.0569 | 0.3000 | 0.0722 | 0.1932 | 0.2445 | 0.1348 | 0.2104 | 0.1220 | 0.1923 |
| 7.3. Use of natural resources | 0.5152 | 0.5152 | 0.2670 | 0.3648 | 0.1932 | 0.4813 | 0.3042 | 0.4270 | 0.3936 | 0.3844 | 0.2679 | 0.5152 | 0.1219 | 0.1000 | 0.2753 | 0.2289 | 0.5430 | 0.4955 | 0.2104 | 0.1220 | 0.3363 |
| 7.4. Action plans | 0.0578 | 0.0578 | 0.1009 | 0.0989 | 0.0699 | 0.2104 | 0.1292 | 0.0669 | 0.0483 | 0.0969 | 0.0611 | 0.0578 | 0.2633 | 0.3000 | 0.2453 | 0.0699 | 0.0765 | 0.0737 | 0.0979 | 0.2827 | 0.1233 |
| Total | 7.0000 | 7.0000 | 7.0000 | 7.0000 | 7.0000 | 7.0000 | 7.0000 | 7.0000 | 7.0000 | 7.0000 | 7.0000 | 7.0000 | 7.0000 | 7.0000 | 7.0000 | 7.0000 | 7.0000 | 7.0000 | 7.0000 | 7.0000 | 7.0000 |
Publisher’s Note: MDPI stays neutral with regard to jurisdictional claims in published maps and institutional affiliations. |
© 2021 by the authors. Licensee MDPI, Basel, Switzerland. This article is an open access article distributed under the terms and conditions of the Creative Commons Attribution (CC BY) license (https://creativecommons.org/licenses/by/4.0/).
Share and Cite
MDPI and ACS Style
Kürüm Varolgüneş, F.; Canan, F.; del Río-Rama, M.d.l.C.; Oliveira, C. Design of a Thermal Hotel Based on AHP-QFD Methodology. Water 2021, 13, 2109. https://doi.org/10.3390/w13152109
AMA Style
Kürüm Varolgüneş F, Canan F, del Río-Rama MdlC, Oliveira C. Design of a Thermal Hotel Based on AHP-QFD Methodology. Water. 2021; 13(15):2109. https://doi.org/10.3390/w13152109
Chicago/Turabian StyleKürüm Varolgüneş, Fatma, Fatih Canan, María de la Cruz del Río-Rama, and Cristiana Oliveira. 2021. "Design of a Thermal Hotel Based on AHP-QFD Methodology" Water 13, no. 15: 2109. https://doi.org/10.3390/w13152109
Note that from the first issue of 2016, this journal uses article numbers instead of page numbers. See further details here.