Article

Spatiotemporal Variations and Influencing Factors of Terrestrial Evapotranspiration and Its Components during Different Impoundment Periods in the Three Gorges Reservoir Area

1
Chongqing Institute of Green and Intelligent Technology, Chinese Academy of Sciences, Chongqing 401122, China
2
University of Chinese Academy of Sciences, Beijing 100049, China
3
Key Laboratory of Mine Geological Hazard Mechanism and Prevention and Control, Xi’an 710054, China
4
Jingjiang Hydrology and Water Resources Survey Bureau, Jingzhou 434099, China
5
Institute of Agricultural Resources and Environment, Tibet Academy of Agricultural and Animal Husbandry Science, Lhasa 850000, China
*
Author to whom correspondence should be addressed.
Water 2021, 13(15), 2111; https://doi.org/10.3390/w13152111
Submission received: 2 July 2021 / Revised: 26 July 2021 / Accepted: 29 July 2021 / Published: 31 July 2021

Abstract

:
Identifying the spatiotemporal variations and influencing climate factors of evapotranspiration (ET) and its components (vegetation transpiration (Ec), soil evaporation (Es), and canopy interception evaporation (Ei)) can greatly improve our understanding of water cycle, carbon cycle, and biogeochemical processes in a warming climate. As the world′s largest hydropower project, the construction of the Three Gorges Project (TGP) coupled with the significant land use/land cover change affected the regional water and energy exchange in the Three Gorges Reservoir Area (TGRA). This study aimed to reveal the spatiotemporal variations and influencing climate factors in ET and its components using PML-V2 products in TGRA during 2000–2020. Results showed that the mean annual ET, Ec, Es, and Ei in TGRA were 585.12, 328.49, 173.07, and 83.56 mm, respectively. The temporal variation of ET was dominated by Ec, with no significant change in the time trend. Es decreased (2.92 mm/y) and Ei increased (1.66 mm/y) significantly mainly in the cultivated land. ET, Ec, and Ei showed a similar seasonal variation pattern with a single peak, while Es presented a bimodal pattern. From the pre-impoundment to the first impoundment period, ET and Ec mainly increased in the head of TGRA, meanwhile, Es in urban area increased significantly by 27.8%. In the subsequent impoundment periods, ET and Ec changed slightly while Es sharply decreased. The Ei increased persistently during different impoundment period. The dominant climate factors affecting changes in Ec and Es were air temperature, vapor pressure deficit, and sunshine hours, while the variation of Ei was mainly affected by air temperature, vapor pressure deficit, and precipitation.

1. Introduction

Evapotranspiration (ET) is one of the critical processes of the land–atmosphere system that connects water, energy, and carbon cycles [1], and plays a key role in linking ecosystem functioning, carbon and climate feedbacks, water resources, and agricultural management [2]. Terrestrial ET mainly emphasizes the combined evaporation of land surface and transpiration through the stomata of plants, including vegetation transpiration (Ec), soil evaporation (Es) and canopy interception evaporation (Ei) [3]. The three ET components (Ec, Es, and Ei) undergo different processes [4] and have different functions within ecosystems [5]. Understanding the spatiotemporal pattern of ET and its components is critical for modelling the land-atmosphere interaction, as well as better understanding the water cycle and energy balance within land-atmosphere system.
The lysimeter, eddy covariance systems and Bowen ration energy balance systems were widely used to measure ET at point scale, while the micro-lysimeters, isotopes, and sap flux made reliable verification of individual ET components possible [6]; thus, many studies were conducted to partition ET using the measured data at farmland [7], orchard [8], grassland [9], and dry land [10]. While at regional scales, ET and its components were estimated by evapotranspiration models with meteorological data coupled with remote sensing data [5,11], these model including Penman–Monteith–Leuning (PML) model [12,13], Shuttleworth–Wallace (S–W) model [14,15], FAO dual-Kc model [15,16], and the two-source energy balance (TSEB) model [17].
Due to the difference in atmospheric conditions, climatic features, hydrological regimes, vegetation and soil, the ET and its components, the proportion of components and the influencing factors varied greatly from site to site [18,19,20]. Ec was dependent on vegetation coverage and water demand, which varied with plant types, plant phenology, hydrologic controls, and water-use efficiency [13]. Es was mostly driven by the atmospheric demand for vapor, soil moisture, and the amount of vegetation above the soil [21]. Ei was mainly affected by the occurrence of low intensity and frequent rainfall and the characteristics of the vegetation stand [13,22]. Generally, Ec accounted for the major part of ET globally [13,18], especially in vegetated systems with low precipitation, Ec was the most important part among the three components [18]. While for areas with low vegetation coverage, yet high precipitation and air temperature, Es became the largest component [23]. Compared to Ec and Es, Ei accounted for a little proportion of ET, while it was an indispensable component of surface-water balance, particularly for the vegetated areas with higher vegetation coverage and leaf area index, combined with low intensity and frequent rainfall [13,22]. The dominant factors affecting the variation of ET components varied significantly, and their responses to climate and environmental change were different.
As the world′s largest hydropower project, the Three Gorges Project (TGP) provided protection for flood control, water supply, shipping, and power safety for the contemporary era [24]. TGP was officially launched in 1994 and initially impounded in June 2003. It started storing water step-by-step from 135 m in late 2003, to 156 m and 172 m above sea level in late 2006 and late 2008, respectively. After one year of experimental water impoundment since the end of 2008, TGP was officially operated at full 175 m capacity and then lowered to 145 m during flood season [25]. The impacts of TGP have been discussed by governments and scientists since the 1950s, with ecological impact being one of the most controversial academic issues [26,27,28,29].
The land use/land cover (LUCC) [30] and regional climate [31] changed significantly in the Three Gorges Reservoir Area (TGRA) since the construction of TGP. ET and its components, linking the energy change and water cycle in the soil-vegetation-atmosphere system, were greatly impacted by LUCC and climate changes. Thus, ET in TGRA were extensively investigated during the past five years [32,33,34,35,36,37]. Most studies focused on reference evapotranspiration [34] or potential evapotranspiration [32]. A few works conducted the estimation of ET [36,37] and its response to LUCC and climate changes [35,36]. However, the spatiotemporal variations of ET components and how they contribute to ET changes during different impoundment periods have not been systematically investigated and are not fully understood.
Therefore, this study was carried out to fill the knowledge gap; the main objectives were: (1) to characterize the spatial and temporal variations of ET and its components in TGRA from 2000 to 2020; (2) to quantify the contributions of climate change to the variations of ET and its components. The work can help researchers study the impact of TGP on regional energy change and water cycles; it can also improve our understanding of the regional ecological and climatic impact of TGP.

2. Materials and Methods
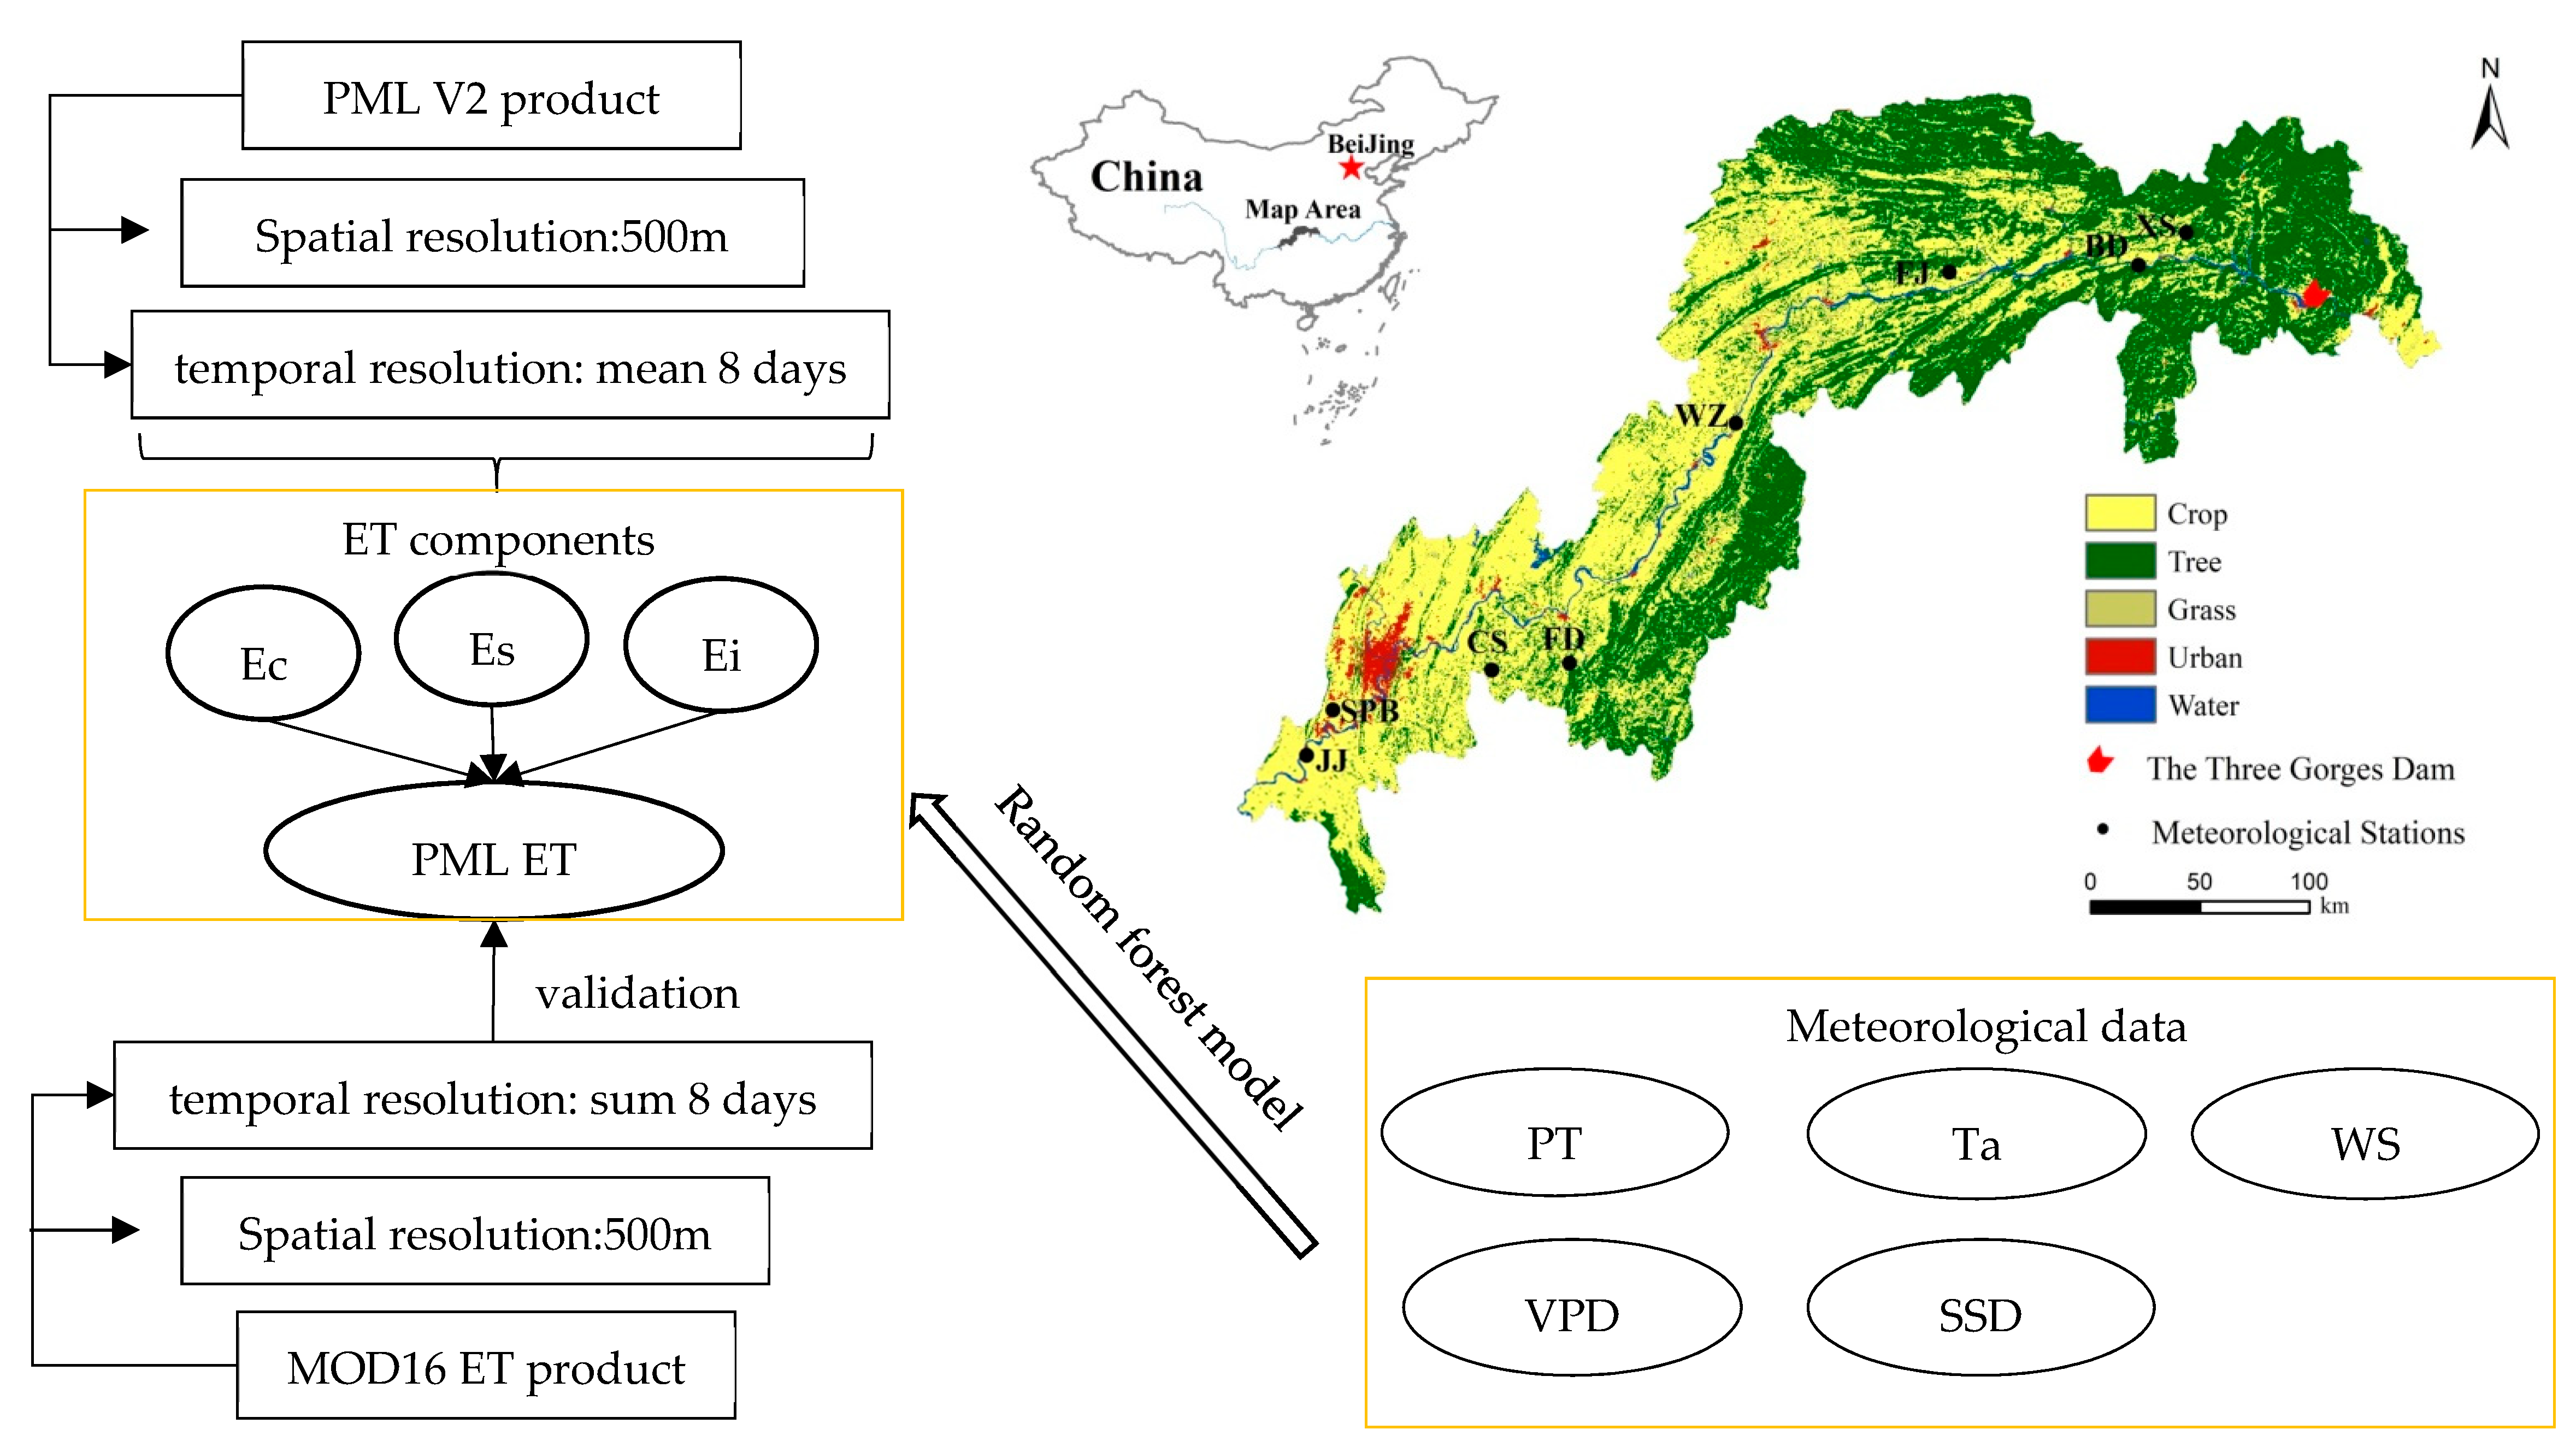
2.1. Study Area

This study used PML-V2 products from 2000–2020 in TGRA to reveal the spatiotemporal variations of ET and its components; the random forest regression model was used to explain the influence of meteorological factors on ET, Ec, Es, and Ei (Figure 1). The TGRA (28°56′ N~31°44′ N, 106°16′ E~111°28′ E) was located in the upper reaches of the Yangtze River (Figure 1), with the area of 5.79 × 10⁴ km2. It was located in the transfer zone between the northern temperate zone and the subtropical zone, the climate was subtropical monsoon climate, with high temperature and rain in summer and a cool winter. The average annual temperature was 17–19 °C, and the average annual rainfall was 900–1200 mm (Table 1). The region was dominated by cultivated and forest land, which accounted for 48.08% and 46.73%, respectively, while grassland, urban land, and water bodies accounted for less than 5% of the total area. The cultivated land mainly distributed in the western part and northern central area, and the forest land mainly distributed in the eastern parts and southern central area (Figure 1).

2.2. Data Collection

PML-V2 ET data product, MOD16A2 ET data product, meteorological data, ESA CCI land use, and water level data were used in this study (Table 1). PML-V2 first used a water carbon coupled canopy conductance model to estimate ET and GPP [38]. Zhang et al. [39] Further improved the PML-V2 by incorporating the vapor pressure deficit constraint to GPP that was then used to constrain canopy conductance and ET. PML-V2 ET products used MODIS data and GLDAS meteorological data as the model input. MODIS data included leaf area index (MCD15A3H), albedo (MCD43A3), surface specific emissivity (MOD11A2), and land use (MCD12Q1) data, and GLDAS meteorological forcing data included precipitation, short-wave radiation, long-wave radiation, water vapor pressure, air temperature, and wind speed. The PML-V2 ET product was well calibrated against 8-day measurements at 95 widely-distributed flux towers globally, with the root mean square error (RMSE) and Bias of 0.69 mm/day and−1.8%, respectively [39]. It was also verified across China [39,40,41]. In this study, 500 m and 8-day resolution of a PML-V2 ET product from 2000–2020 covering TGRA were downloaded from the Google Earth Engine.
The MOD16A2 ET product (MOD16 ET) with the same spatial and temporal resolution to the PML-V2 ET product was used to validate PML-V2. This dataset was developed by Mu et al. [42], based on an improved Penman–Monteith algorithm. It included evapotranspiration (ET), latent heat flux (LE), potential evapotranspiration (PET), and potential latent heat flux (PLE).
The land use data in 2015 (Figure 1) was derived from the European Space Agency Climate Change Initiative (ESA CCI) epoch maps based on MERIS (300 m resolution) [43]. Qualitative evaluation showed that ESA CCI maps were in agreement with other satellite land cover products [44].
Meteorological data, including precipitation (PT), air temperature (Ta), wind speed (WS), relative humidity (RH), and sunshine hours (SSD) were collected from the China Meteorological Administration at eight meteorological stations in TGRA during the period 2000–2020. The distribution of meteorological stations are shown in Figure 1 and detailed information of these stations are listed in Table 2. Water vapor pressure difference (VPD) was calculated from the daily mean air temperature and relative humidity.
The water level data of the upstream of the Three Gorges Dam (TGD) were provided by the Three Gorges Corporation.

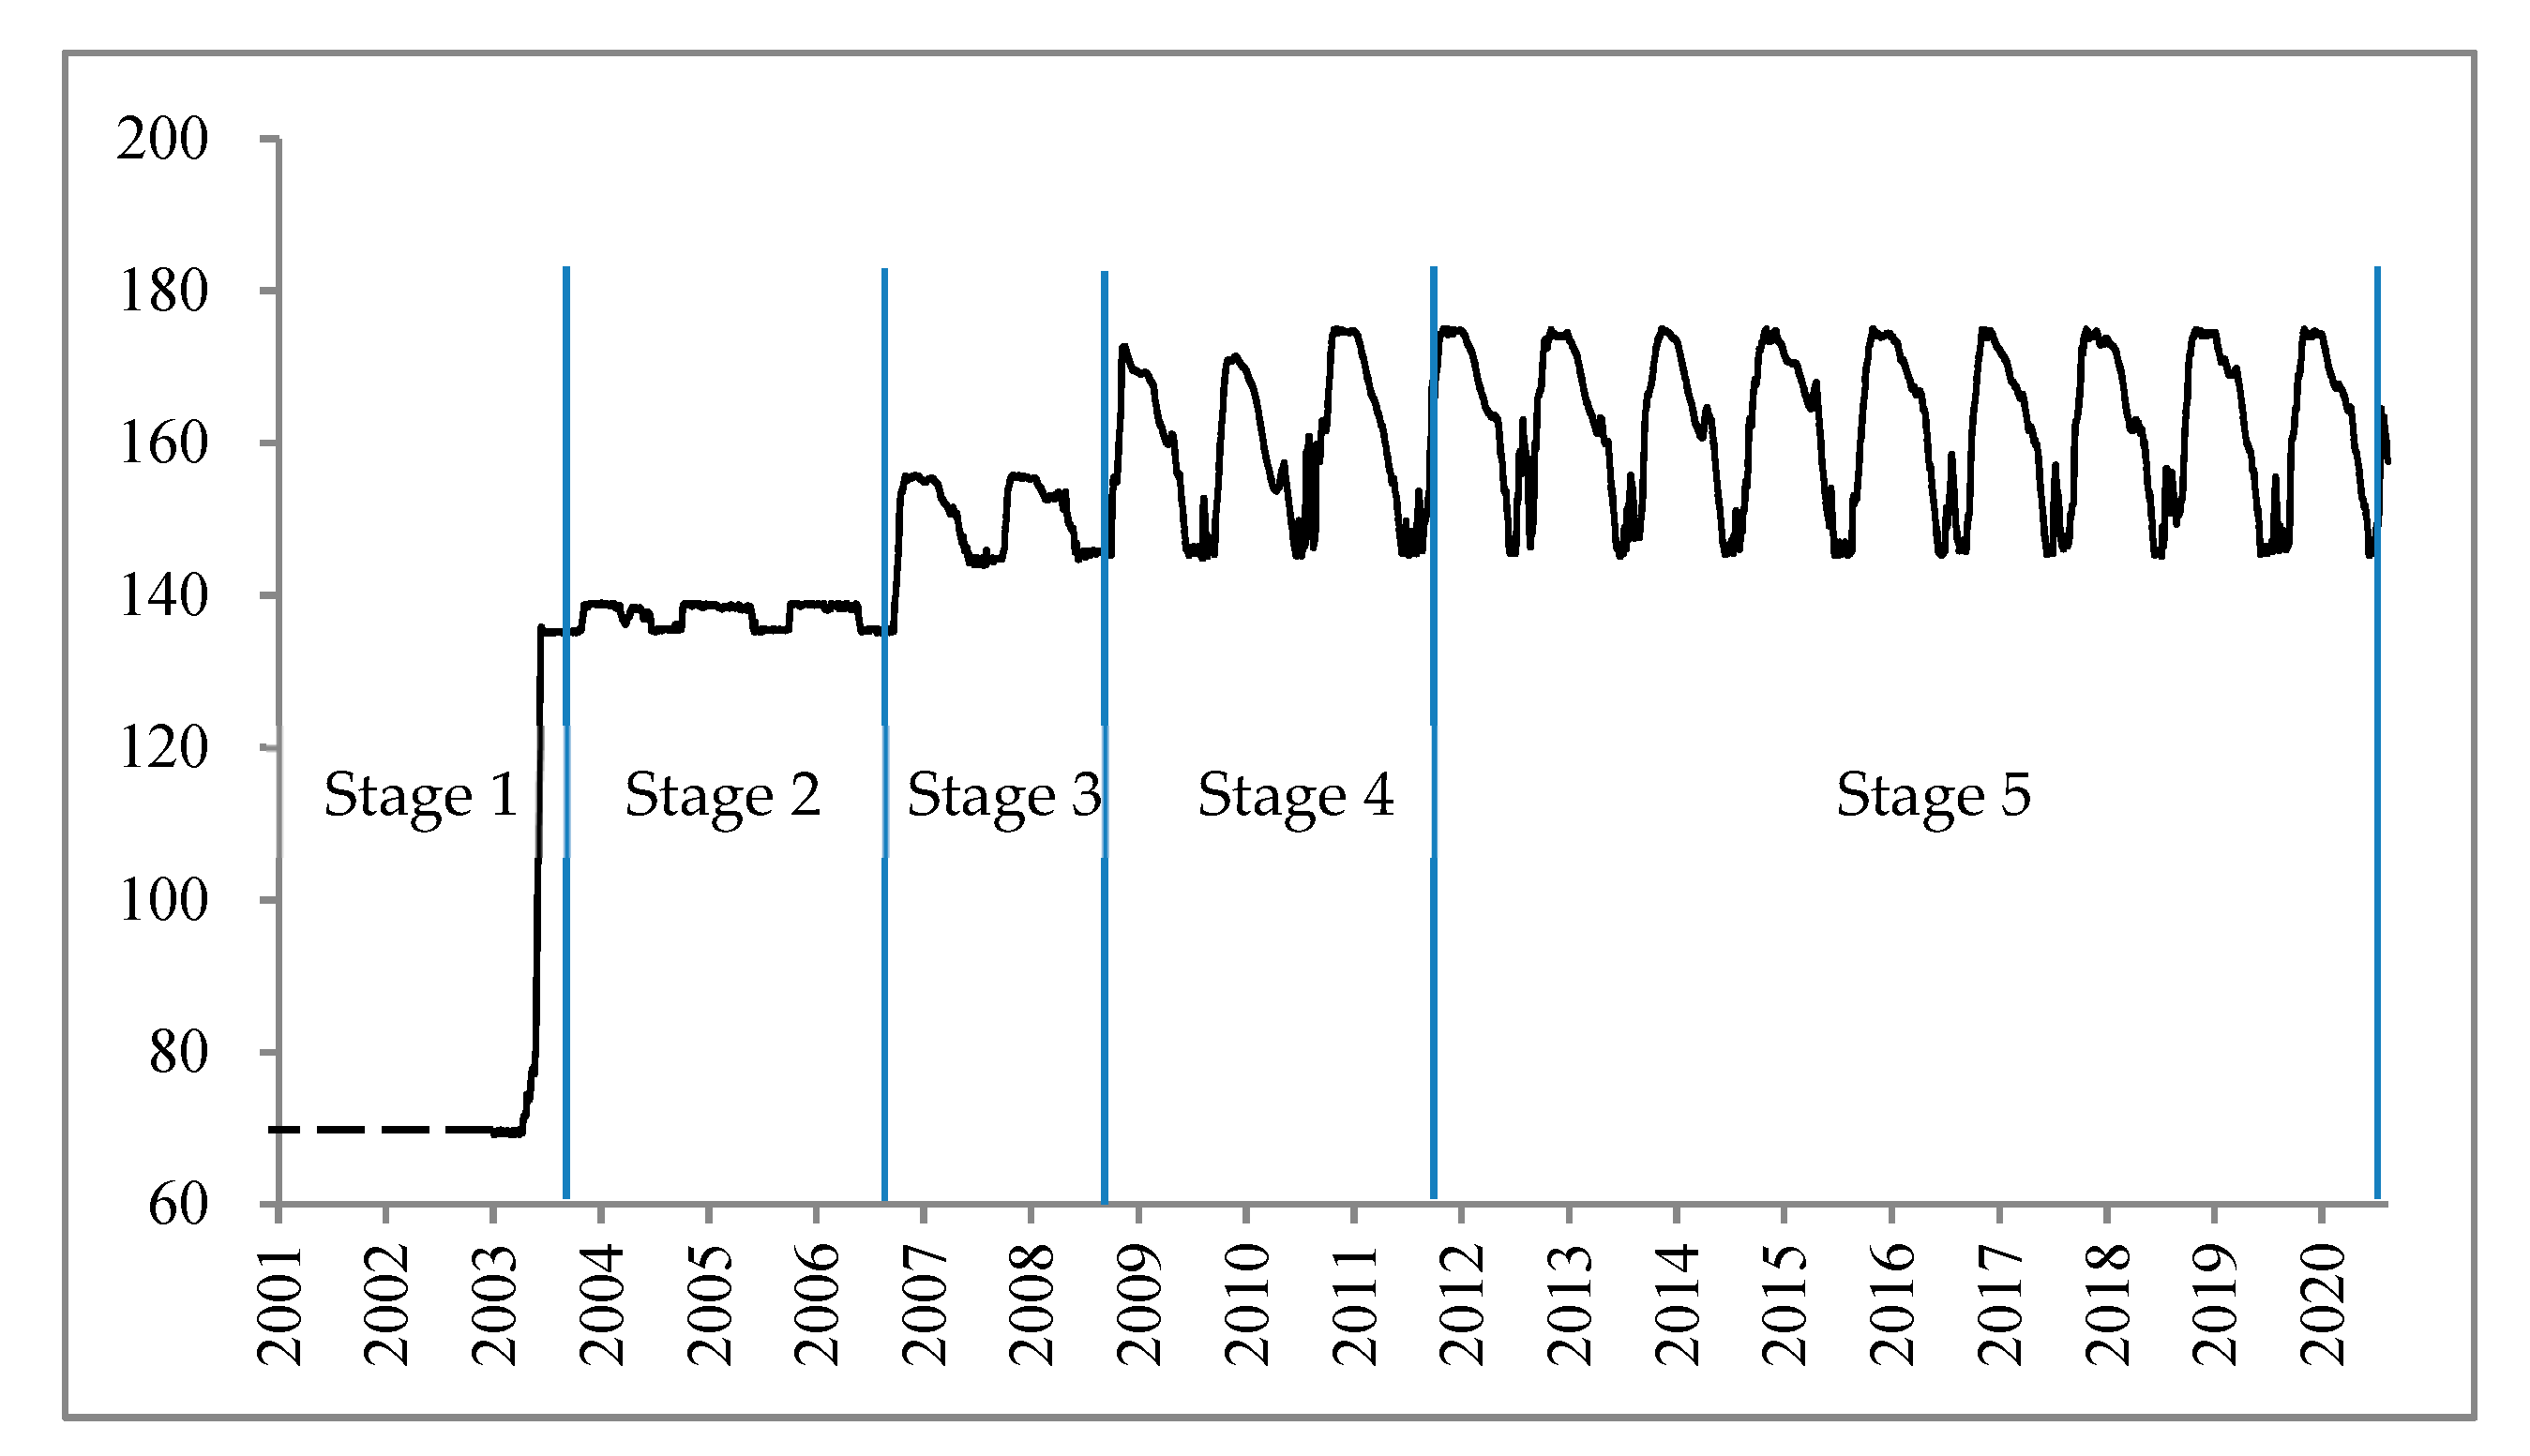
2.3. Division of Impoundment Periods

According to the construction phase and changes of the water level of the TGD, five impoundment stages were determined (Figure 2): (1) stage 1: pre-impoundment period (October 2000–September 2003), with the highest water level below 70 m; (2) stage 2: the first impoundment period (October 2003–September 2006), with the highest water level peaked at 135 m; (3) stage 3: the second impoundment period (October 2006–September 2008), with the highest water level reached at 156 m; (4) stage 4: the third impoundment period (October 2008–September 2011), with the highest water level from 156 m to 175 m; (5) stage 5: officially operated period (October 2011–September 2020), with water level to 175 m in the dry season and 145 m in the flood season.

2.4. Sensitivity Analysis Method

Random forest algorithm was used to analyze the sensitivity ET, Ec, Es, and Ei to climate change. This method was widely used to investigate the response of ET to climate factors [45,46]. The random forest model was a classification tree-based machine learning algorithm proposed by Breiman in 2001 [47]. The model used the bootstrapping resampling method to extract multiple samples from the original sample, and built decision tree models for each bootstrapping sample. Then the predictions of multiple decision trees were combined, and the final prediction result was obtained through voting [47]. The random forest model can be used for clustering, discriminant, and regression, and it can also be used to evaluate the importance of variables. The sensitivity was assessed by the inherent variable importance of the random forest models. It was measured as a relative increase in mean squared error (%IncMSE) [47], which describes the increase in predicting performance loss of the random forest model if the factor is excluded from the model. In this study, the random forest model was implemented in the R package [48].

3. Results

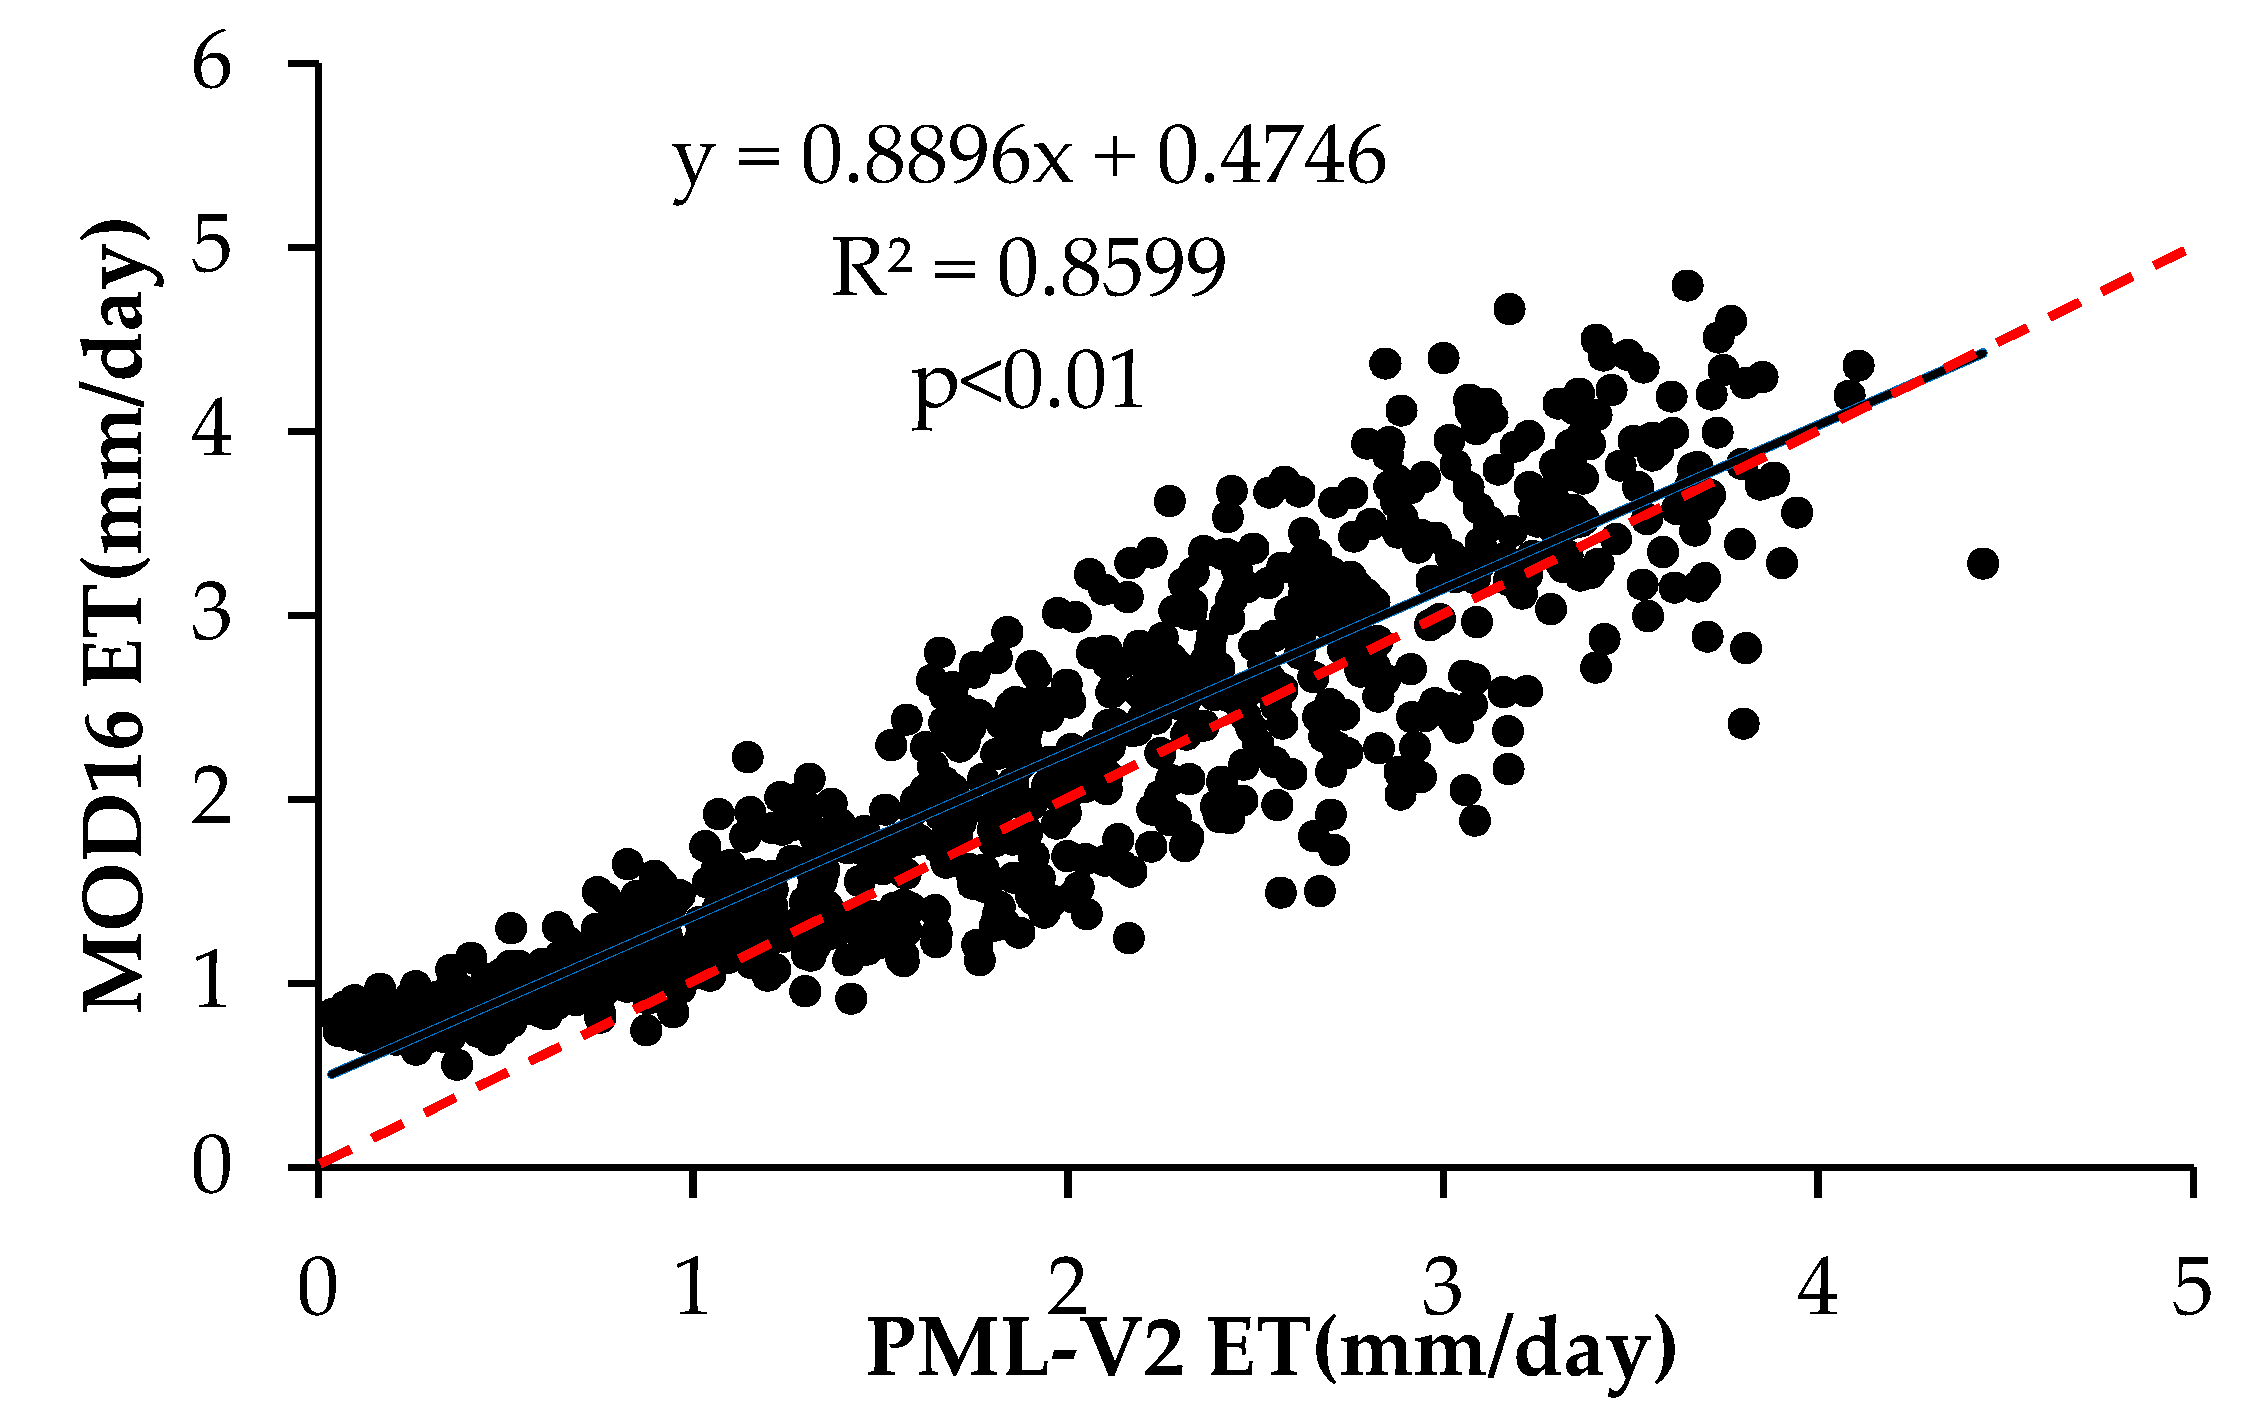
3.1. Model Validation

The comparison between the 8-day ET from MOD16 and that from PML-V2 is presented in Figure 3. Good agreement was found between the two datasets, with the R2 of 0.86 (p < 0.01). While most of the scattered points fell above the 1:1 line, indicating that PML-V2 ET underestimated ET compared to MOD16, but the distribution of the scatter points was relatively uniform, indicating that the PML-V2 model could better described the seasonal variation characteristics of ET in TGRA [36]. The verification result suggested that at the 95 global flux sites globally (R2 = 0.72) [39], and it was also slightly better than the performance of PML-V2 ET in northern China [40]. Overall, the validation result confirmed the reliability of using the PML-V2 data product to reveal the spatial and temporal variation of ET in TGRA.

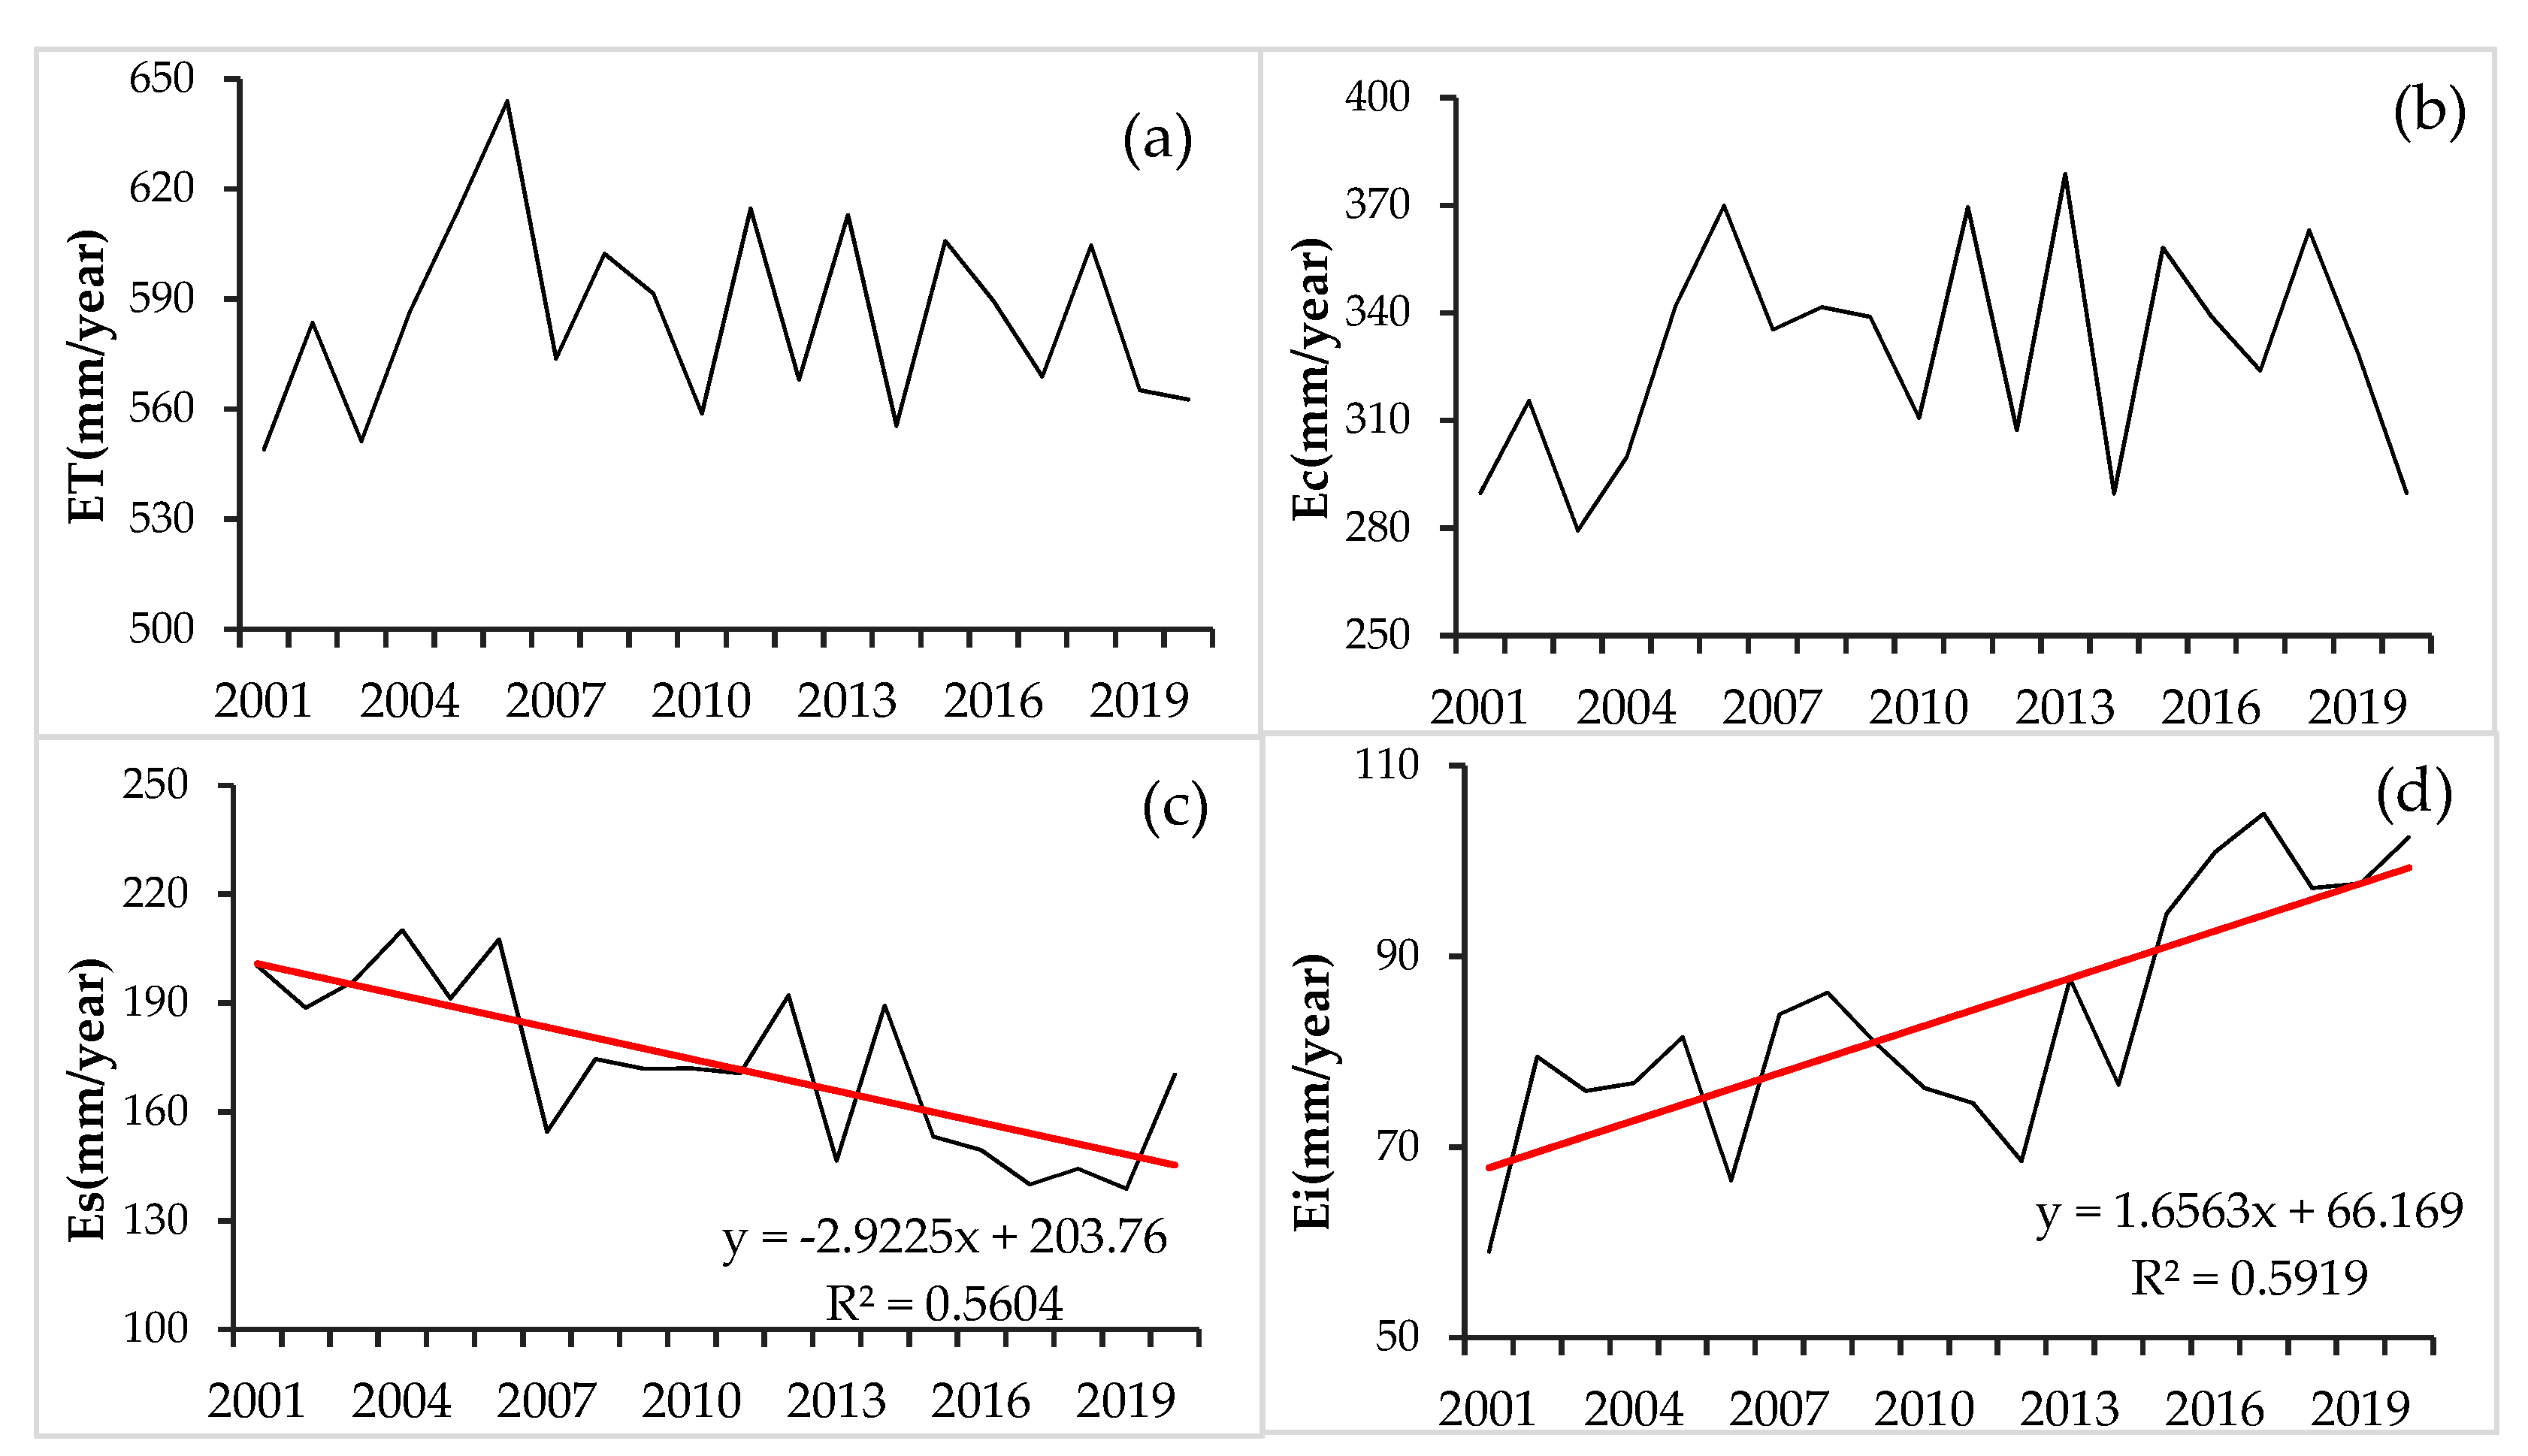
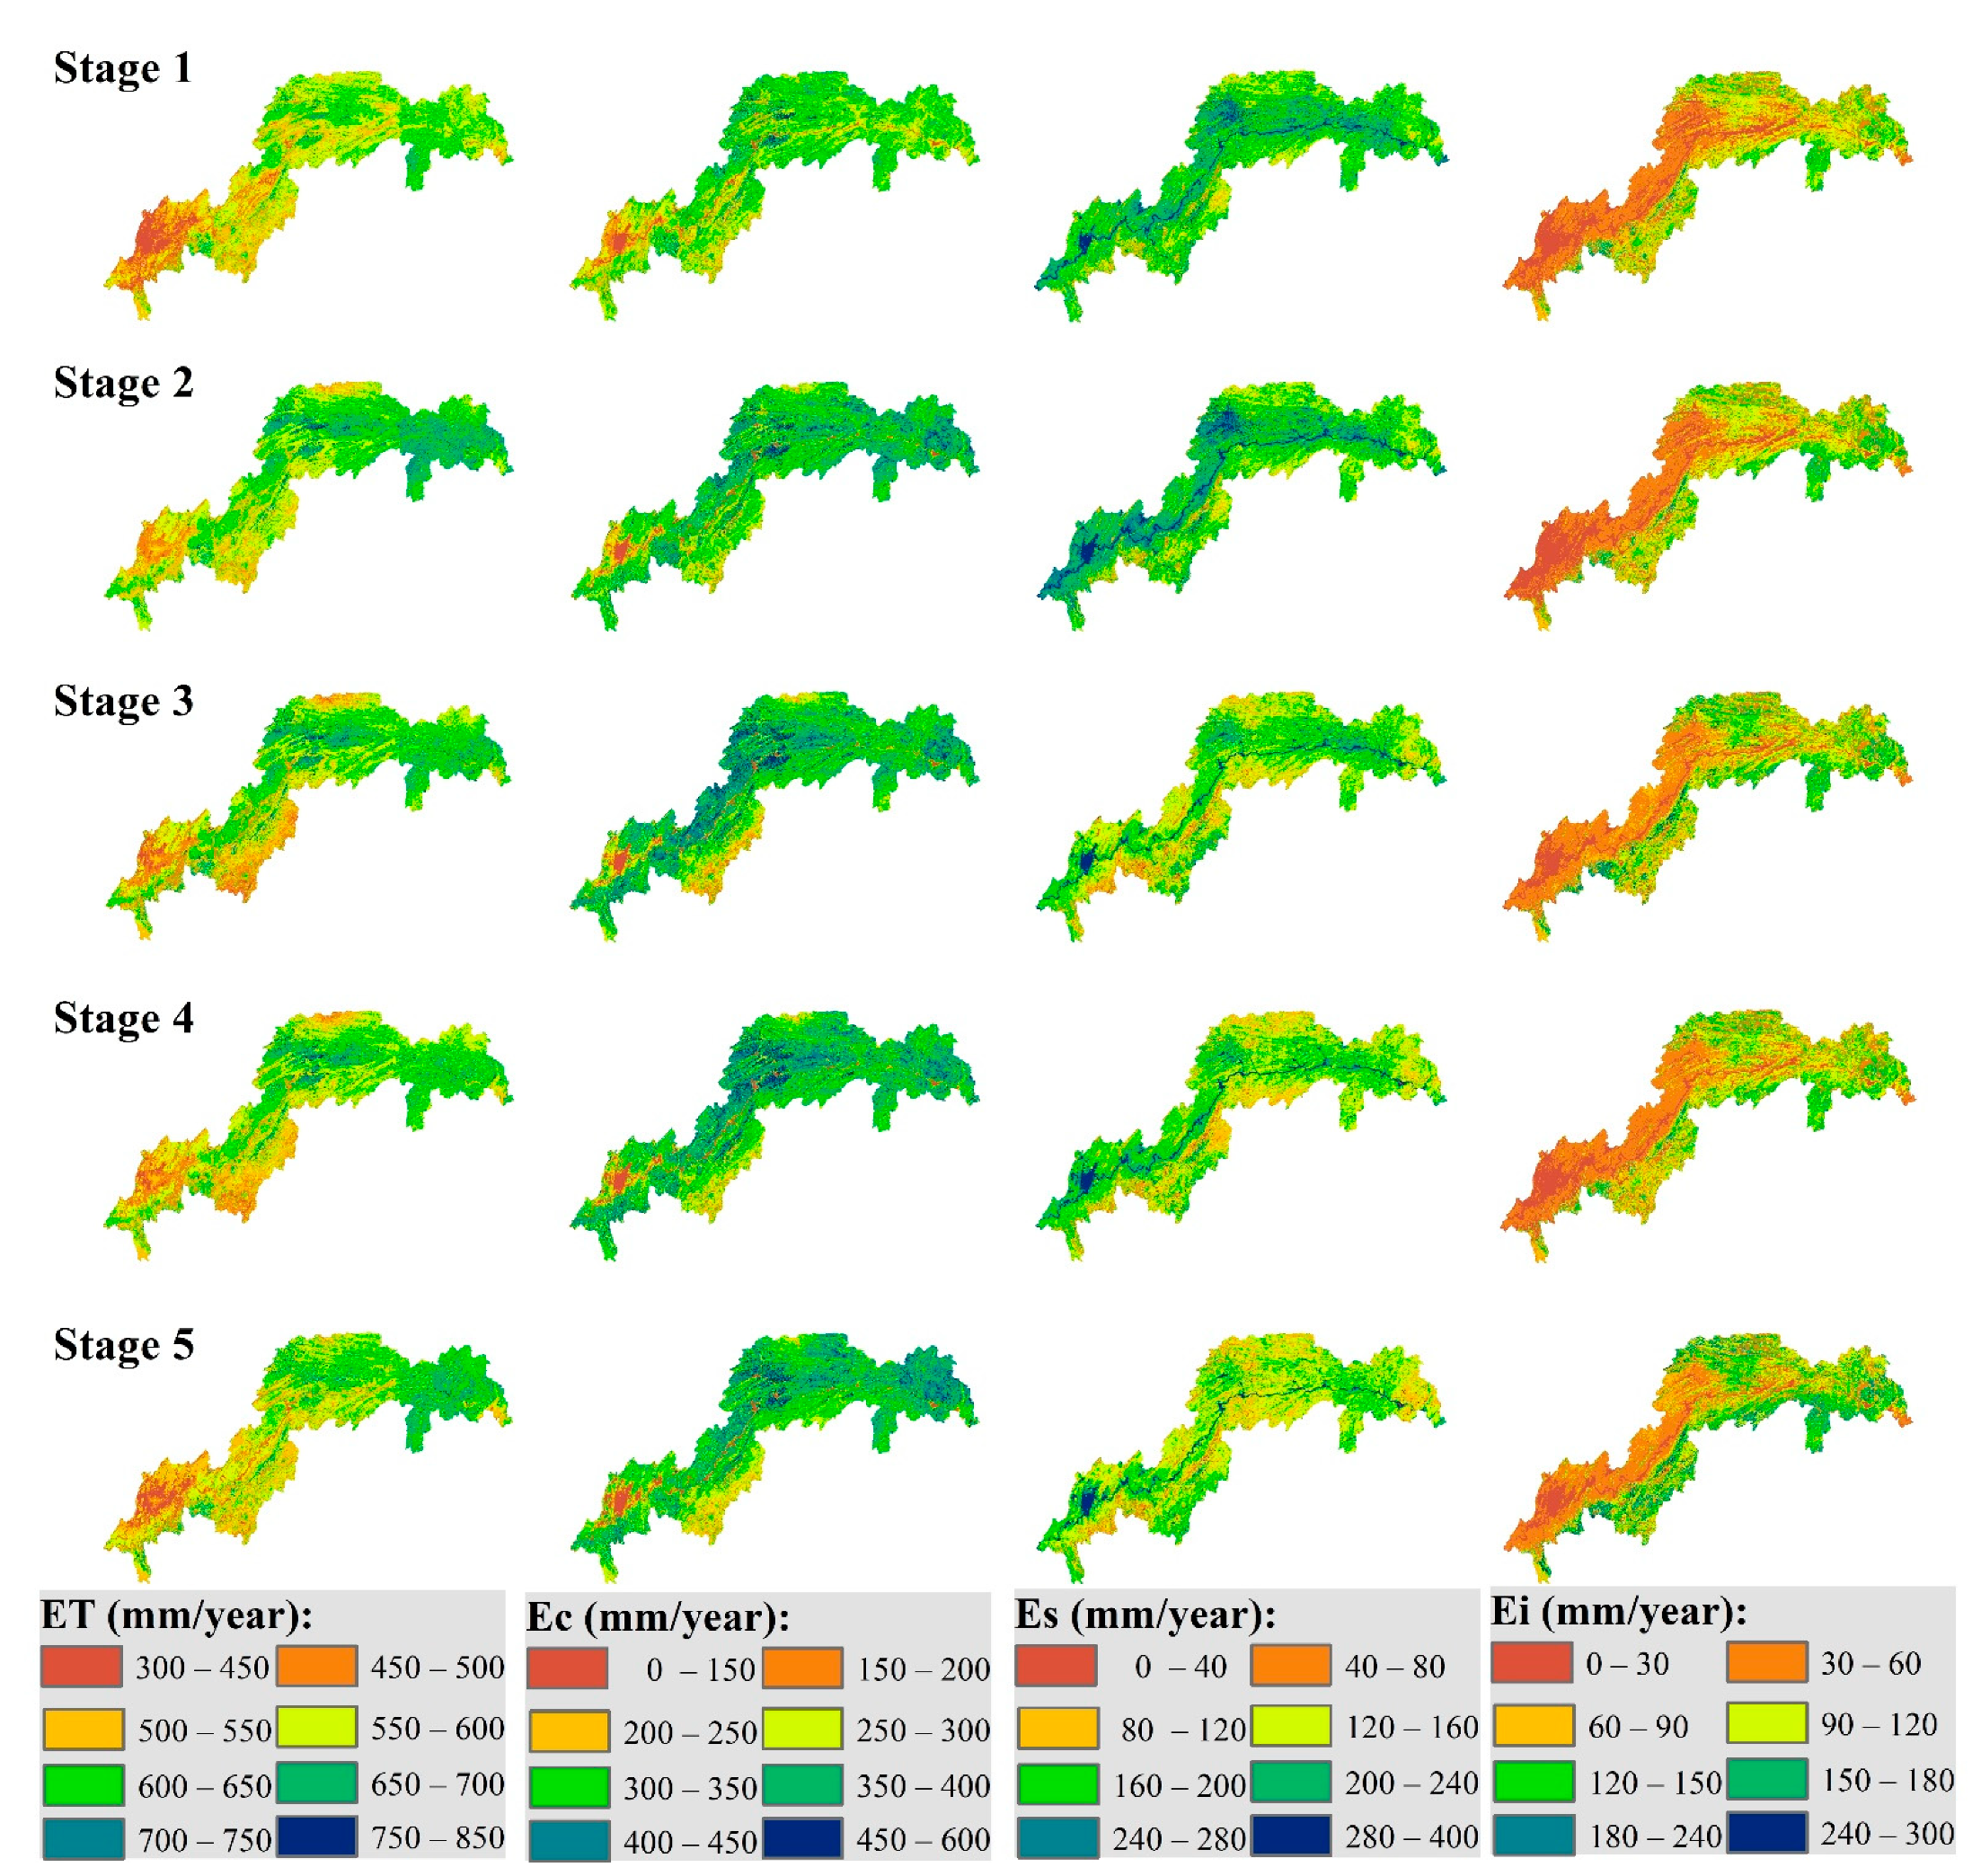
3.2. Interannual Variation of ET and Its Components

The interannual variation of ET and its components are shown in Figure 4. The annual ET ranged from 549 to 644 mm across the whole study period, and the mean annual Ec, Es, and Ei were 328.49, 173.07, and 83.56 mm, respectively, which accounted for 56.06%, 29.64%, and 14.3% of ET, respectively. Es showed a significantly decreasing trend from 2001 to 2020 with the rate of −2.92 mm/y (R2 = 0.56), while Ei showed a significantly increasing trend with the rate of 1.66 mm/y (R2 = 0.59). The interannual changes of ET and Ec were not significant.
The spatial distribution of annual ET and its components during different impoundment periods are shown in Figure 5. ET and Ec changed significantly from stage 1 to stage 2, they increased by 7.7% and 12.2% in the whole TGRA, 15.0% and 17.8% in the head of TGRA, and 6.9% and 12.5% in the tail of TGRA, respectively. While in the central part of TGRA, ET and Ec increased slightly, from 548.4 to 579.7 mm and 287.8 to 313.5 mm, respectively. They changed little from stage 2 to stage 5. Es in the urban area increased significantly by 27.8% from stage 1 to stage 2; however, it sharply decreased from 385.9 to 349.9 mm from stage 2 to stage 3, with forest land and cultivated land decreasing by 10.8% and 21.9%, respectively. From stage 3 to stage 5, Es decreased slightly by 6.2% which also mainly occurred in cultivated land. The Ei of the forest land was 102.1 mm, which was higher than 63.7 mm of the cultivated land. Overall, the Ei in TGRA increased significantly by 27.4% from stage 1 to stage 5, and the most obvious change was observed in cultivated land, which increased by 38.7%.

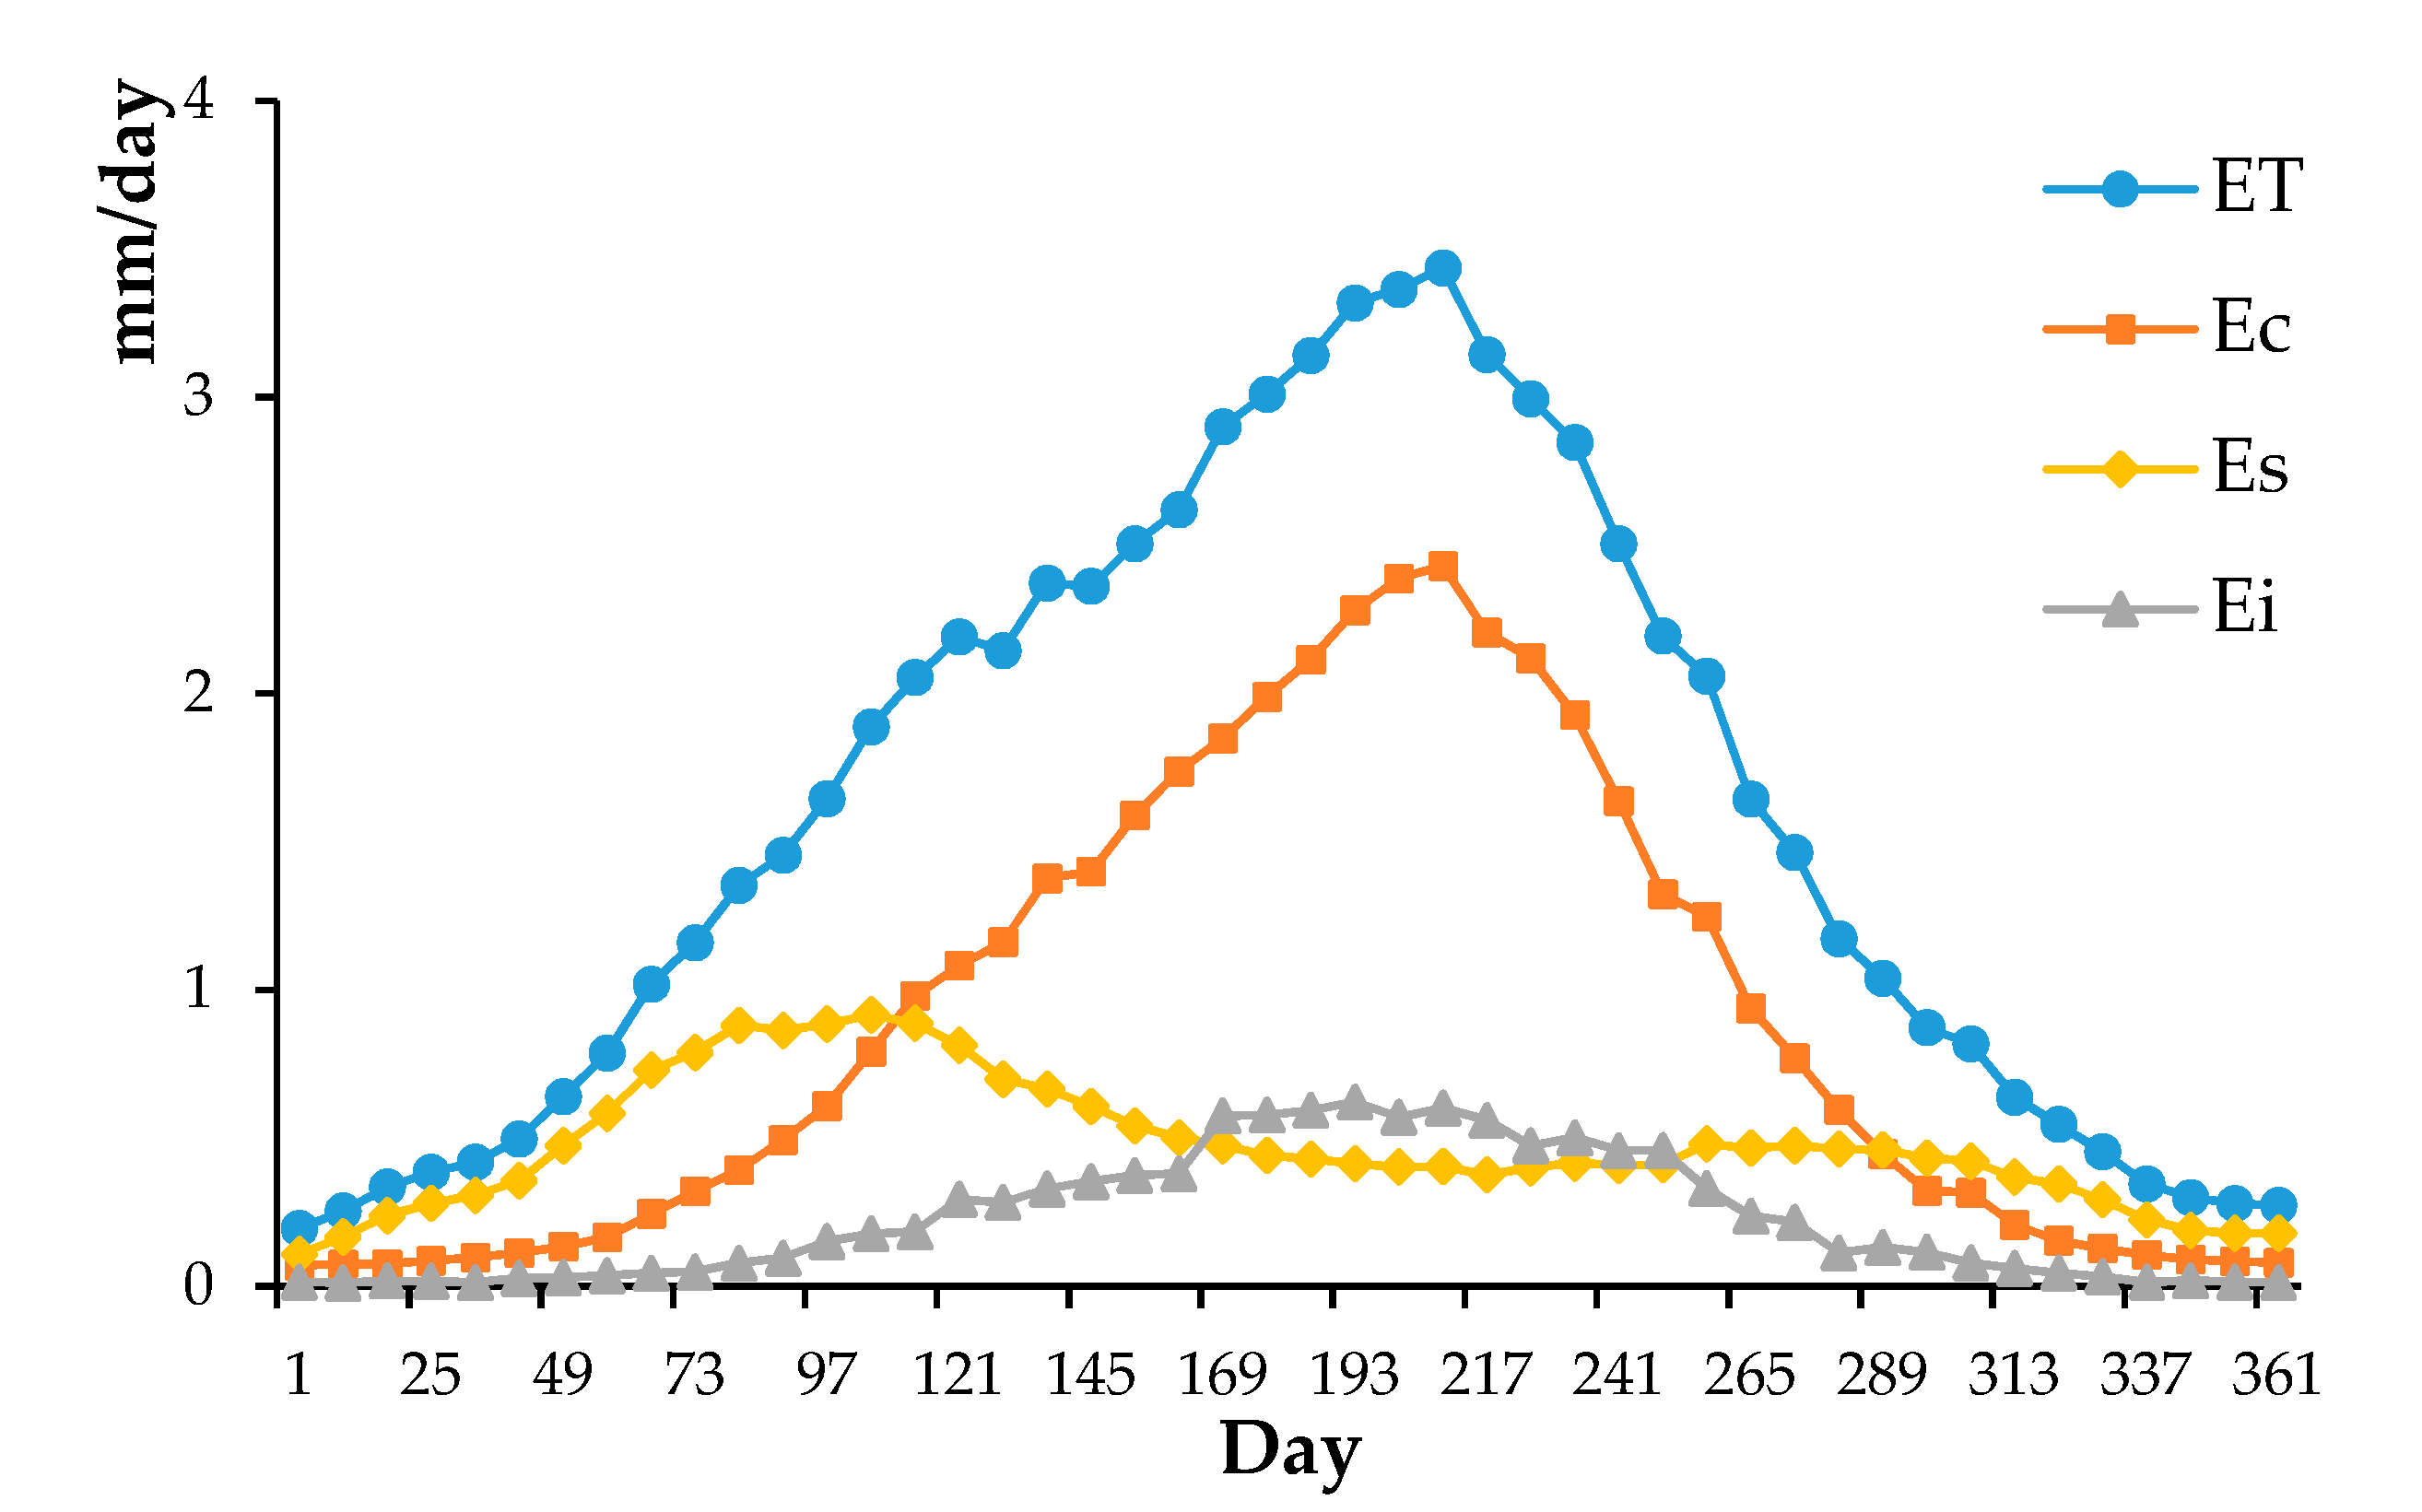
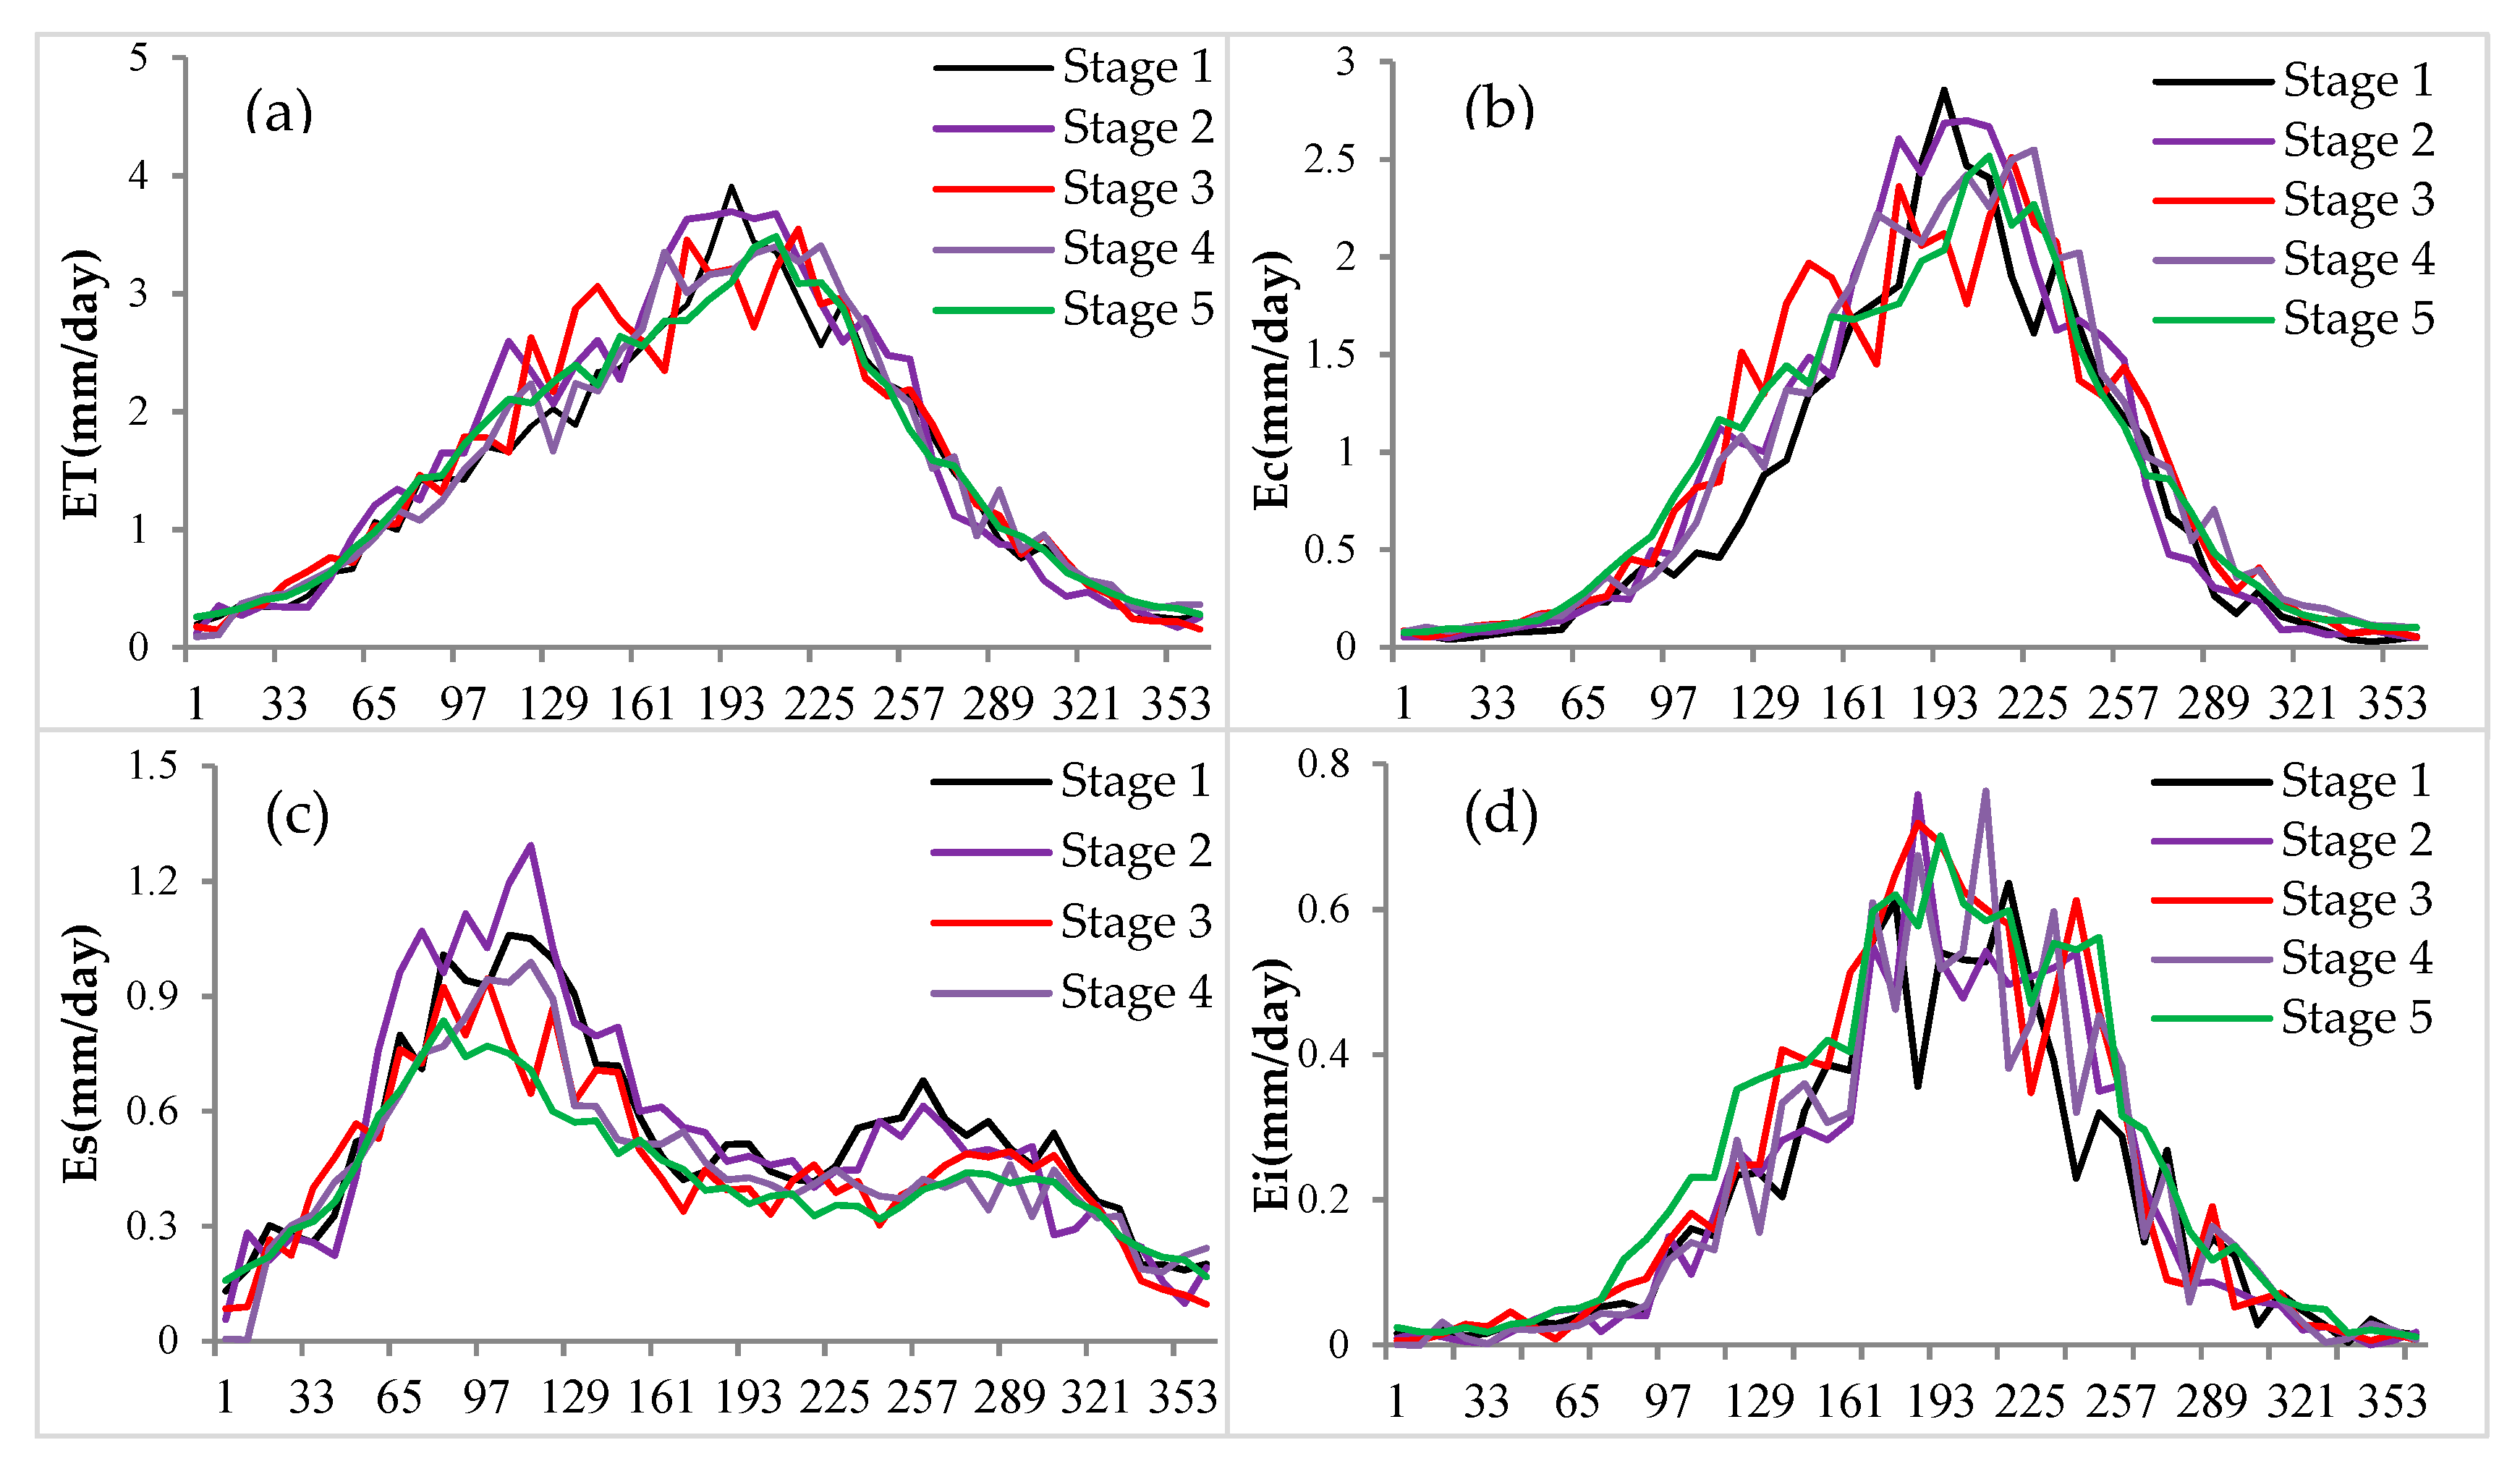
3.3. Seasonal Patterns of ET and Its Components

ET, Ec, and Ei presented a similar pattern of seasonal variation with a single peak (Figure 6); they increased progressively from the beginning of year and reached the maximum on the 209th day, and then decreased progressively to the end of the year. Daily ET and Ec increased at the rate of 0.14 and 0.1 mm/day before the 209th day and decreased at the rate of 0.18 and 0.13 mm/day after the 209th day, respectively. Ei increased exponentially from the 1st to the 169th day, then changed slightly to the 249th day, and decreased exponentially to the end of the year. The peak of Ei was observed at the 193rd day of the year. Es presented a bimodal pattern with two peaks at the 105th day and the 257th day, respectively.
The seasonal variations of daily ET and its components during different impoundment periods are shown in Figure 7. Ec from January to May before impoundment (stage 1) was lower than that after impoundment, but there was no significant difference in Ec among different impoundment stages from June to December. The peak of Ec appeared at the 193rd day before impoundment (stage 1), while it delayed to the 201st day, 209th day, and 217 day for stage 2 to stage 4, respectively, and finally returned to the 209th day at stage 5. Es from February to June was in order: stage 2 > stage 1 > stage 3 > stage 4 > stage 5, and there was little difference in Es among different impoundment stages from June to July. The Es at stage 1 was higher than other stages from July to October, while Es at stage 5 was lower than other stages across the year. After impoundment, Ei increased form 0.20 mm/day at stage 1 to 0.25 mm/day at stage 5, and the increase of Ei was greatest from days 169 to 217, with a 14.0% increase.

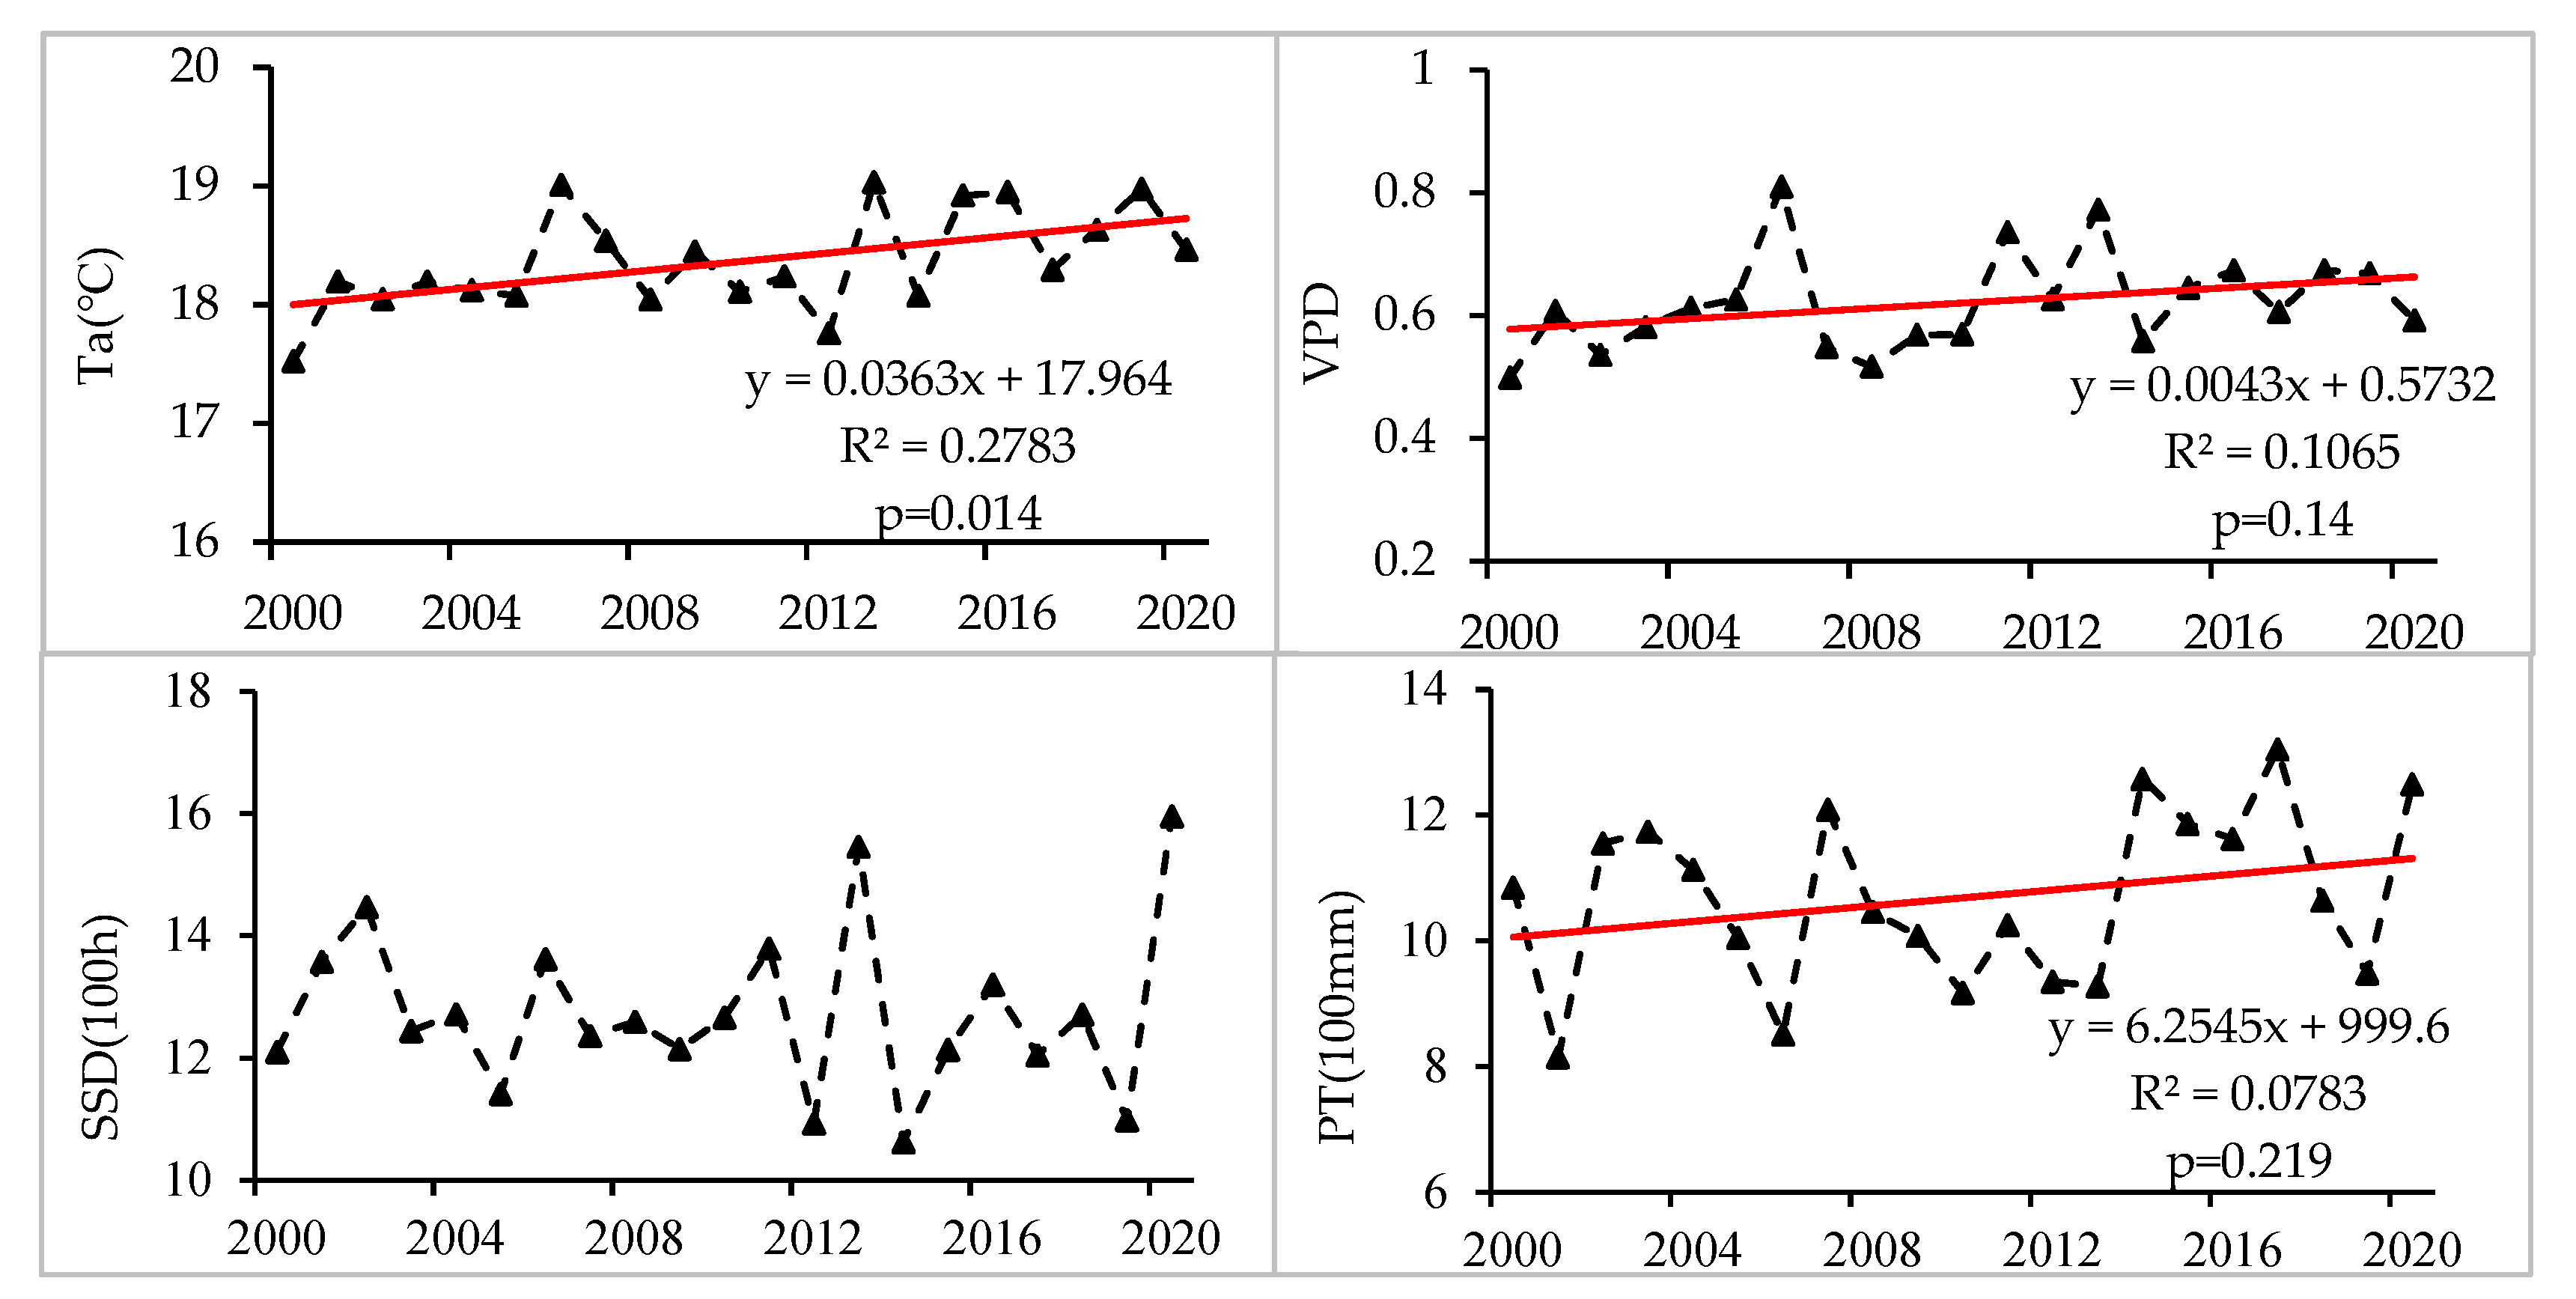
3.4. Response of ET and Its Components Variation to Climate Change

The employed five climate factors explained 86.57%, 85.63%, 39.80%, and 62.54% variance of ET, Ec, Es, and Ei, respectively. Based on the relationship between climate factors and ET, Ec, Es, and Ei, it can be found that the influence of climate factors on ET, Ec, Es, and Ei varied from site-to-site (Table 3). As far as ET, Ec, and Es were concerned, the relative importance of meteorological factors was in order: Ta > VPD > SSD > PT > WS. While for Ei, the relative importance of meteorological factors was in order: Ta > VPD > PT > SSD > WS. Overall, the variation of ET, Ec, Es, and Ei in TGRA was dominated by Ta, as can been seen from Table 2, Ta showed the highest relative importance at each station. The % incMSE of Ta were much higher than the corresponding values of VPD, SSD, PT, and WS, generally indicating that the influence of temperature on the variation of ET and its components was more pronounced than other meteorological factors. The % incMSE of Ta was 0.8096 and 0.4818 for ET and EC, respectively, which was much higher than 0.0557 and 0.0555 for Es and Ei, respectively, suggesting that influence of temperature on the variation of ET and Ec was more significant than that on Es and Ei. Similar results were also observed for VPD.

4. Discussion

This study used PML-V2 ET and its component products generated at 500 m and 8-day resolution. The validation result showed that it had good performance in modeling ET compared with MOD16 ET (R2 = 0.86) in TGRA. However, the accuracy of the MOD16 ET product also needs to be evaluated as it underestimated the ET for semiarid area [49] and overestimated for forested areas [50,51]. Moreover, the FAO-56 Penman–Monteith model used in MOD16 was limited due to the lack of required weather data in many regions [52], and the heterogeneity of land use [53], uncertainty in measuring soil water status [54], and complex dynamic changes in vegetation [36] also affecting the evaluation of ET, which were ignored in ET models. Moreover, due to the absence of the lysimeters, isotopes, and sap flux in TGRA, the ET components were not verified in this study. Therefore, the sites that measured ET and its components in TGRA are likely to be built and a more accurate validation method is needed to carry out future research.
The average annual ET in TGRA was 585.12 mm, which was higher than the average ET of 406 mm across China [55], and much higher than the ET in arid and semiarid regions in western China, such as the Loess Plateau [56] and Tibetan Plateau [6], while it was much lower than ET in humid regions in eastern China [55].
Ec accounted for 56.06% of ET and it was the most important ET component in TGRA. The contribution of Ec to ET was reasonable compared with the results of 0.20–0.65 for global terrestrial ecosystems [57], 0.52–0.59 for Chinese terrestrial ecosystem [19], while it was much lower than that for the Yangtze River Basin, where the Ec accounted for 65% of ET [58], and was higher than that for the Yellow River Basin, where the proportion of Ec to ET was 48% [59]. Es accounted for 29.64% of ET in TGRA, which was lower than 0.55 across China [60], and much lower than the proportion for the Tibetan Plateau [6] and the Yellow River Basin [59] in semiarid regions in western China, while the proportion was slightly higher than that globally [13]. Ei accounted for the lowest proportion of ET in TGRA (14.3%), which was higher than 9.98% on a global scale [13].
Due to the difference in climatic features, hydrological regimes, vegetation, and soil coupled with the methodology and data, the proportion of ET components varied from region-to-region [18,19]. Generally, Ec accounted for the major part of ET globally and in most regions [13,18], especially in vegetated systems with low precipitation, Ec was the most important part among the three components [18]. While for areas in deserts and the Plateau with low vegetation coverage, yet high precipitation and temperature, Es was the predominate part [6,13]. Ei depended on the precipitation and canopy status. Compared to Ec and Es, it accounted for a little proportion of ET, while it was an indispensable component of surface water balance, particularly for the vegetated areas with higher vegetation coverage and leaf area index [22].
The mean annual ET did not show a significant change in TGRA from 2000 to 2020; this was consistent with the results from previous studies for TGRA [33,36,37]. For instance, Wang et al. [36] found that the annual ET displayed an insignificant increasing trend from 1993 to 2013. Hao et al. [33] reported an insignificant increasing trend of ET during 2000–2015. Zheng et al. [37] investigated the variation of ET using MOD16 from 2003 to 2016, and the results showed no obvious change trend.
The dominant climate factors affecting the changes in ET, Ec, and Es were Ta and VPD. The result was consistent with that of Pascolini-Campbell et al. [61], who investigated the global ET from 2003 to 2019 and found that land temperature was the main driver of the ET trend. Increases in VPD and temperature combined with the decrease in relative humidity [62] increased the atmospheric demand for evapotranspiration [63].
Since the construction of TGP, the land use/land cover changed significantly in TGRA [30]. The forest and vegetation coverage, the leaf area index increased significantly during the past two decades [64], which significantly increased Ei from 2000 to 2020. Moreover, Ei was directly related to PT, and PT presented a similar changing trend to that of Ei (Figure 4 and Figure 8). Generally, the land use change from cultivated land and grassland to shrubs and forest [33], as well as the increase of Ta and VPD, leading to the increase in the degree of stomatal opening, can enhance the process of vegetation transpiration and increase the Ec [65,66]. However, the Ec did not show significant increasing trend; this may be due to the exponential increase of Ec with increasing Ta (Figure 9). Although Ta showed a weak significant increase and the interannual variation trend of Ta was very similar to that of Ec (Figure 4 and Figure 8), the increase and decrease effect of Ta would be magnified to the change of Ec, so the Ec change was more drastic and its linear change trend was not significant.
Previous studies suggested that Es correlated significantly with soil temperature, VPD, and PT [61]. The Ta, VPD, and PT showed increasing trends during the study period (Figure 8). The increase of Ta and VPD will increase Es to meet the need of atmospheric demand [67]. However, Es decreased significantly with the rate of −2.92 mm/y, this may be due to the increased vegetation coverage and the leaf area index. With the increase of Ta, vegetation growth accelerated, vegetation coverage and the leaf area index increased, so that Es showed an increasing at first and then a decreasing trend, with the increase of Ta (Figure 9). Moreover, the land use change and ecological restoration could also increase vegetation coverage, which offset the effect of increasing Ta, VPD, and PT [33,36]. Therefore, increase of vegetation coverage was the main factor responsible for the decrease of Es in most areas of TGRA.

5. Conclusions

The spatiotemporal variations of ET and its components and their response to climate change were investigated using PML-V2 products from 2000–2020 in TGRA. The annual ET ranged from 549 to 644 mm, and the mean annual Ec, Es, and Ei were 328.49, 173.07, and 83.56 mm, respectively, accounting for 56.06%, 29.64%, and 14.3% of ET in the studying area. ET, Ec, and Ei showed a similar pattern of seasonal variation with a single peak appeared on the 209th day for ET and Ec, and on the 193rd day for Ei, while Es presented a bimodal pattern with two peaks on the 105th day and the 257th day, respectively. The temporal variation of ET was dominated by Ec, with no significant change in the time trend. Es decreased (2.92 mm/y) and Ei increased (1.66 mm/y) significantly, mainly in the cultivated land. ET and Ec increased by 7.7% and 12.2% from stage 1 to stage 2, mainly in the head of TGRA, while they changed little from stage 2 to stage 5. Es in the urban area increased significantly by 27.8% from stage 1 to stage 2, but it decreased sharply from stage 2 to stage 5. The Ei in TGRA increased persistently from stage 1 to stage 5. Es decreased and Ei increased most obviously in cultivated areas, and the increase of vegetation coverage was the main factor responsible for the change of Es and Ei in TGRA. Among the employed climate factors, Ta, VPD, and SSD were the dominant factors affecting the variation of ET, Ec, and Es, while for Ei, the dominant factors were Ta, VPD, and PT. Moreover, the influence of Ta and VPD, on the variation of ET and Ec, was more pronounced than that on Es and Ei.

Author Contributions

Author Contributions: Y.J.: Conceptualization, Visualization and Writing—original draft. Q.T.: Software, Methodology. L.Y. (Lingyun Yan): Formal analysis. S.W.: Reviewing and Supervision. L.Y.(Liming Yan): Funding acquisition and Writing—review. D.T.: Funding acquisition. J.C.: Conceptualization, Validation and Writing—review. Q.C.: Reviewing and Validation. All authors have read and agreed to the published version of the manuscript.

Funding

This research was funded by the Youth Innovation Promotion Association (no. 2018417), Key Laboratory of Mine Geological Hazard Mechanism and Prevention and Control (no. 2018-08), Science and Technology Project of Jingjiang Hydrology and Water Resources Survey Bureau (no. 2020-01), and the National Natural Science Foundation of China (no. 42061015, 51779241 and 41901130).

Institutional Review Board Statement

Not applicable.

Informed Consent Statement

Not applicable.

Data Availability Statement

PML-V2 ET, MOD16A2 ET and the land use data used in this paper can be downloaded from Google Earth Engine, earthdata.nasa.gov, accesssed on 30 July 2021, and the ESA-CCI land cover website. Meteorological data are not applicable.

Acknowledgments

We acknowledge the research environment provided by Chongqing Institute of Green and Intelligent Technology, Chinese Academy of Sciences.

Conflicts of Interest

The authors declare no conflict of interest.

References

  1. Jung, M.; Reichstein, M.; Ciais, P.; Seneviratne, S.I.; Sheffield, J.; Goulden, M.L.; Bonan, G.; Cescatti, A.; Chen, J.; de Jeu, R.; et al. Recent decline in the global land evapotranspiration trend due to limited moisture supply. Nature 2010, 467, 951–954. [Google Scholar] [CrossRef]
  2. Fisher, J.B.; Melton, F.; Middleton, E.; Hain, C.; Anderson, M.; Allen, R.; McCabe, M.F.; Hook, S.; Baldocchi, D.; Townsend, P.A.; et al. The future of evapotranspiration: Global requirements for ecosystem functioning, carbon and climate feedbacks, agricultural management, and water resources. Water Resour. Res. 2017, 53, 2618–2626. [Google Scholar] [CrossRef]
  3. Zhang, F.; Geng, M.; Wu, Q.; Liang, Y. Study on the spatial-temporal variation in evapotranspiration in China from 1948 to 2018. Sci. Rep. 2020, 10, 1–13. [Google Scholar] [CrossRef]
  4. Katul, G.G.; Oren, R.; Manzoni, S.; Higgins, C.; Parlange, M.B. Evapotranspiration: A process driving mass transport and energy exchange in the soil-plant-atmosphere-climate system. Rev. Geophys. 2012, 50, RG3002. [Google Scholar] [CrossRef] [Green Version]
  5. Kool, D.; Agam, N.; Lazarovitch, N.; Heitman, J.L.; Sauer, T.J.; Ben-Gal, A. A review of approaches for evapotranspiration partitioning. Agric. For. Meteorol. 2014, 184, 56–70. [Google Scholar] [CrossRef]
  6. Wang, W.; Li, J.; Yu, Z.; Ding, Y.; Xing, W.; Lu, W. Satellite retrieval of actual evapotranspiration in the Tibetan Plateau: Components partitioning, multidecadal trends and dominated factors identifying. J. Hydrol. 2018, 559, 471–485. [Google Scholar] [CrossRef]
  7. Zheng, J.; Fan, J.; Zhang, F.; Zhuang, Q. Evapotranspiration partitioning and water productivity of rainfed maize under contrasting mulching conditions in Northwest China. Agric. Water Manag. 2021, 243, 106473. [Google Scholar] [CrossRef]
  8. Ntshidi, Z.; Dzikiti, S.; Mazvimavi, D.; Mobe, N.T. Contribution of understorey vegetation to evapotranspiration partitioning in apple orchards under Mediterranean climatic conditions in South Africa. Agric. Water Manag. 2021, 245, 1233–1242. [Google Scholar] [CrossRef]
  9. Ochoa-Sanchez, A.E.; Crespo, P.; Carrillo-Rojas, G.; Marin, F.; Celleri, R. Unravelling evapotranspiration controls and components in tropical Andean tussock grasslands. Hydrol. Process. 2020, 34, 2117–2127. [Google Scholar] [CrossRef]
  10. Wang, H.; Li, X.; Xiao, J.; Ma, M. Evapotranspiration components and water use efficiency from desert to alpine ecosystems in drylands. Agric. For. Meteorol. 2021, 298, 108283. [Google Scholar] [CrossRef]
  11. Xiong, Y.J.; Zhao, W.L.; Wang, P.; Paw, K.T.U.; Qiu, G.Y. Simple and applicable method for estimating evapotranspiration and its components in arid regions. J. Geophys. Res. Atmos. 2019, 124, 9963–9982. [Google Scholar] [CrossRef]
  12. Leuning, R.; Zhang, Y.Q.; Rajaud, A.; Cleugh, H.; Tu, K. A simple surface conductance model to estimate regional evaporation using MODIS leaf area index and the Penman-Monteith equation. Water Resour. Res. 2008, 44, W10419. [Google Scholar] [CrossRef]
  13. Zhang, Y.; Pena-Arancibia, J.L.; McVicar, T.R.; Chiew, F.H.S.; Vaze, J.; Liu, C.; Lu, X.; Zheng, H.; Wang, Y.; Liu, Y.Y.; et al. Multi-decadal trends in global terrestrial evapotranspiration and its components. Sci. Rep. 2016, 6, 1–12. [Google Scholar] [CrossRef] [Green Version]
  14. Shuttleworth, W.J.; Wallace, J.S. Evaporation from sparse crops—An energy combination theory. Q. J. R. Meteorol. Soc. 1985, 111, 839–855. [Google Scholar] [CrossRef]
  15. Zhao, P.; Li, S.; Li, F.; Du, T.; Tong, L.; Kang, S. Comparison of dual crop coefficient method and Shuttleworth-Wallace model in evapotranspiration partitioning in a vineyard of northwest China. Agric. Water Manag. 2015, 160, 41–56. [Google Scholar] [CrossRef]
  16. Allen, R.G.; Pereira, L.S.; Raes, D.; Smith, M. Crop Evapotranspiration. Guidelines for Computing Crop Water Requirements; FAO: Rome, Italy, 1998. [Google Scholar]
  17. Chen, H.; Huang, J.J.; McBean, E.; Singh, V.P. Evaluation of alternative two-source remote sensing models in partitioning of land evapotranspiration. J. Hydrol. 2021, 597, 126029. [Google Scholar] [CrossRef]
  18. Lawrence, D.M.; Thornton, P.E.; Oleson, K.W.; Bonan, G.B. The partitioning of evapotranspiration into transpiration, soil evaporation, and canopy evaporation in a GCM: Impacts on land-atmosphere interaction. J. Hydrometeorol. 2007, 8, 862–880. [Google Scholar] [CrossRef]
  19. Niu, Z.; He, H.; Zhu, G.; Ren, X.; Zhang, L.; Zhang, K. A spatial-temporal continuous dataset of the transpiration to evapotranspiration ratio in China from 1981–2015. Sci. Data 2020, 7, e2020JG005823. [Google Scholar] [CrossRef]
  20. Wang, K.; Dickinson, R.E. A review of global terrestrial evapotranspiration: Observation, modeling, climatology, and climatic variability. Rev. Geophys. 2012, 50, RG2005. [Google Scholar] [CrossRef]
  21. Detto, M.; Montaldo, N.; Albertson, J.D.; Mancini, M.; Katul, G. Soil moisture and vegetation controls on evapotranspiration in a heterogeneous Mediterranean ecosystem on Sardinia, Italy. Water Resour. Res. 2006, 42, W08419. [Google Scholar] [CrossRef]
  22. Scott, D.F.; Bruijnzeel, L.A.; Vertessy, R.A.; Calder, I.R. HYDROLOGY—Impacts of Forest Plantations on Streamflow. In Encyclopedia of Forest Sciences; Academic Press: Cambridge, MA, USA, 2004. [Google Scholar]
  23. Gong, D.; Kang, S.; Yao, L.; Zhang, L. Estimation of evapotranspiration and its components from an apple orchard in northwest China using sap flow and water balance methods. Hydrol. Process. 2007, 21, 931–938. [Google Scholar] [CrossRef]
  24. Wang, X.; de Linage, C.; Famiglietti, J.; Zender, C.S. Gravity Recovery and Climate Experiment (GRACE) detection of water storage changes in the Three Gorges Reservoir of China and comparison with in situ measurements. Water Resour. Res. 2011, 47, W12502. [Google Scholar] [CrossRef]
  25. Tang, Q.; Bao, Y.; He, X.; Fu, B.; Collins, A.L.; Zhang, X. Flow regulation manipulates contemporary seasonal sedimentary dynamics in the reservoir fluctuation zone of the Three Gorges Reservoir, China. Sci. Total Environ. 2016, 548, 410–420. [Google Scholar] [CrossRef] [PubMed]
  26. Edmonds, R.L. The Sanxia (3 Gorges) Project—The environmental argument surrounding China super dam. Glob. Ecol. Biogeogr. Lett. 1992, 2, 105–125. [Google Scholar] [CrossRef]
  27. Fu, B.-J.; Wu, B.-F.; Lue, Y.-H.; Xu, Z.-H.; Cao, J.-H.; Niu, D.; Yang, G.-S.; Zhou, Y.-M. Three Gorges Project: Efforts and challenges for the environment. Prog. Phys. Geogr. Earth Environ. 2010, 34, 741–754. [Google Scholar] [CrossRef]
  28. Xu, X.; Tan, Y.; Yang, G. Environmental impact assessments of the Three Gorges Project in China: Issues and interventions. Earth Sci. Rev. 2013, 124, 115–125. [Google Scholar] [CrossRef] [Green Version]
  29. Zhang, Q.; Lou, Z. The environmental changes and mitigation actions in the Three Gorges Reservoir region, China. Environ. Sci. Policy 2011, 14, 1132–1138. [Google Scholar] [CrossRef]
  30. Huang, C.; Huang, X.; Peng, C.; Zhou, Z.; Teng, M.; Wang, P. Land use/cover change in the Three Gorges Reservoir area, China: Reconciling the land use conflicts between development and protection. Catena 2019, 175, 388–399. [Google Scholar] [CrossRef]
  31. Li, X.; Sha, J.; Wang, Z.-L. Influence of the Three Gorges Reservoir on climate drought in the Yangtze River Basin. Environ. Sci. Pollut. Res. 2021, 28, 29755–29772. [Google Scholar] [CrossRef]
  32. Deng, H.; Shao, J.-A. Evapotranspiration and humidity variations in response to land cover conversions in the Three Gorges reservoir region. J. Mt. Sci. 2018, 15, 590–605. [Google Scholar] [CrossRef]
  33. Hao, B.; Ma, M.; Li, S.; Li, Q.; Hao, D.; Huang, J.; Ge, Z.; Yang, H.; Han, X. Land use change and climate variation in the Three Gorges reservoir catchment from 2000 to 2015 based on the Google Earth engine. Sensors 2019, 19, 2118. [Google Scholar] [CrossRef] [PubMed] [Green Version]
  34. Lv, M.-q.; Chen, J.-L.; Mirza, Z.A.; Chen, C.-D.; Wen, Z.-F.; Jiang, Y.; Ma, M.-h.; Wu, S.-J. Spatial distribution and temporal variation of reference evapotranspiration in the Three Gorges reservoir area during 1960–2013. Int. J. Climatol. 2016, 36, 4497–4511. [Google Scholar] [CrossRef]
  35. Ma, Z.Z.; Ray, R.L.; He, Y.P. Assessing the spatiotemporal distributions of evapotranspiration in the Three Gorges Reservoir Region of China using remote sensing data. J. Mt. Sci. 2018, 15, 2676–2692. [Google Scholar] [CrossRef]
  36. Wang, H.; Xiao, W.; Zhao, Y.; Wang, Y.; Hou, B.; Zhou, Y.; Yang, H.; Zhang, X.; Cui, H. The spatiotemporal variability of evapotranspiration and its response to climate change and land use/land cover change in the Three Gorges reservoir. Water 2019, 11, 1739. [Google Scholar] [CrossRef] [Green Version]
  37. Zheng, Y.; Wang, L.; Chen, C.; Fu, Z.; Peng, Z. Using satellite gravity and hydrological data to estimate changes in evapotranspiration induced by water storage fluctuations in the Three Gorges reservoir of China. Remote Sens. 2020, 12, 2143. [Google Scholar] [CrossRef]
  38. Gan, R.; Zhang, Y.; Shi, H.; Yang, Y.; Eamus, D.; Cheng, L.; Chiew, F.H.S.; Yu, Q. Use of satellite leaf area index estimating evapotranspiration and gross assimilation for Australian ecosystems. Ecohydrology 2018, 11, e1974. [Google Scholar] [CrossRef]
  39. Zhang, Y.; Kong, D.; Gan, R.; Chiew, F.H.S.; McVicar, T.R.; Zhang, Q.; Yang, Y. Coupled estimation of 500 m and 8-day resolution global evapotranspiration and gross primary production in 2002–2017. Remote Sens. Environ. 2019, 222, 165–182. [Google Scholar] [CrossRef]
  40. Li, C.; Zhang, Y.; Shen, Y.; Kong, D.; Zhou, X. LUCC-driven changes in gross primary production and actual evapotranspiration in Northern China. J. Geophys. Res. Atmos. 2020, 125, e2019JD031705. [Google Scholar] [CrossRef]
  41. Li, C.; Zhang, Y.; Shen, Y.; Yu, Q. Decadal water storage decrease driven by vegetation changes in the Yellow River Basin. Sci. Bull. 2020, 65, 1859–1861. [Google Scholar] [CrossRef]
  42. Mu, Q.; Zhao, M.; Running, S.W. Improvements to a MODIS global terrestrial evapotranspiration algorithm. Remote Sens. Environ. 2011, 115, 1781–1800. [Google Scholar] [CrossRef]
  43. Bontemps, S.; Defourny, P.; Radoux, J.; Bogaert, E.V.; Lamarche, C.; Achard, F.; Mayaux, P.; Boettcher, M.; Brockmann, C.; Kirches, G. Consistent Global Land Cover Maps For Climate Modelling Communities: Current Achievements Of The ESA’ Land Cover CCI. In Proceedings of the ESA Living Planet Symposium, Edinburgh, UK, 2013, 9–13 September.
  44. Li, W.; MacBean, N.; Ciais, P.; Defourny, P.; Lamarche, C.; Bontemps, S.; Houghton, R.A.; Peng, S. Gross and net land cover changes in the main plant functional types derived from the annual ESA CCI land cover maps (1992–2015). Earth Syst. Sci. Data 2018, 10, 219–234. [Google Scholar] [CrossRef] [Green Version]
  45. Olberz, M.; Kahlen, K.; Zinkernagel, J. Assessing the impact of reference evapotranspiration models on decision support systems for irrigation. Horticulturae 2018, 4, 49. [Google Scholar] [CrossRef] [Green Version]
  46. Ruiz- Alvarez, M.; Gomariz-Castillo, F.; Alonso-Sarria, F. Evapotranspiration response to climate change in semi-arid areas: Using random forest as multi-model ensemble method. Water 2021, 13, 222. [Google Scholar] [CrossRef]
  47. Breiman, L. Random forests. Mach. Learn. 2001, 45, 5–32. [Google Scholar] [CrossRef] [Green Version]
  48. Liaw, A.; Wiener, M. Classification and regression by randomForest. R News 2002, 2, 18–22. [Google Scholar]
  49. Hu, G.; Jia, L.; Menenti, M. Comparison of MOD16 and LSA-SAF MSG evapotranspiration products over Europe for 2011. Remote Sens. Environ. 2015, 156, 510–526. [Google Scholar] [CrossRef]
  50. Jang, K.; Kang, S.; Lim, Y.-J.; Jeong, S.; Kim, J.; Kimball, J.S.; Hong, S.Y. Monitoring daily evapotranspiration in Northeast Asia using MODIS and a regional Land Data Assimilation System. J. Geophys. Res. Atmos. 2013, 118, 12927–12940. [Google Scholar] [CrossRef] [Green Version]
  51. Trambauer, P.; Dutra, E.; Maskey, S.; Werner, M.; Pappenberger, F.; van Beek, L.P.H.; Uhlenbrook, S. Comparison of different evaporation estimates over the African continent. Hydrol. Earth Syst. Sci. 2014, 18, 193–212. [Google Scholar] [CrossRef] [Green Version]
  52. Srivastava, A.; Sahoo, B.; Raghuwanshi, N.S.; Singh, R. Evaluation of variable-infiltration capacity model and MODIS-terra satellite-derived grid-scale evapotranspiration estimates in a river basin with tropical monsoon-type climatology. J. Irrig. Drain. Eng. 2017, 143, 04017028. [Google Scholar] [CrossRef] [Green Version]
  53. Srivastava, A.; Kumari, N.; Maza, M. Hydrological response to agricultural land use heterogeneity using variable infiltration capacity model. Water Resour. Manag. 2020, 34, 3779–3794. [Google Scholar] [CrossRef]
  54. Sharma, K.; Irmak, S.; Kukal, M.S. Propagation of soil moisture sensing uncertainty into estimation of total soil water, evapotranspiration and irrigation decision-making. Agric. Water Manag. 2021, 243, 106454. [Google Scholar] [CrossRef]
  55. Ma, N.; Szilagyi, J.; Zhang, Y.; Liu, W. Complementary-relationship-based modeling of terrestrial evapotranspiration across China during 1982–2012: Validations and spatiotemporal analyses. J. Geophys. Res. Atmos. 2019, 124, 4326–4351. [Google Scholar] [CrossRef]
  56. Huo, A.; Yang, L.; Luo, P.; Cheng, Y.; Peng, J.; Nover, D. Influence of landfill and land use scenario on runoff, evapotranspiration, and sediment yield over the Chinese Loess Plateau. Ecol. Indic. 2021, 121, 107208. [Google Scholar] [CrossRef]
  57. Jasechko, S.; Sharp, Z.D.; Gibson, J.J.; Birks, S.J.; Yi, Y.; Fawcett, P.J. Terrestrial water fluxes dominated by transpiration. Nature 2013, 496, 347. [Google Scholar] [CrossRef]
  58. Lu, J.; Wang, G.; Gong, T.; Hagan, D.F.T.; Wang, Y.; Jiang, T.; Su, B. Changes of actual evapotranspiration and its components in the Yangtze River valley during 1980–2014 from satellite assimilation product. Theor. Appl. Climatol. 2019, 138, 1493–1510. [Google Scholar] [CrossRef]
  59. Jiang, Z.-Y.; Yang, Z.-G.; Zhang, S.-Y.; Liao, C.-M.; Hu, Z.-M.; Cao, R.-C.; Wu, H.-W. Revealing the spatio-temporal variability of evapotranspiration and its components based on an improved Shuttleworth-Wallace model in the Yellow River Basin. J. Environ. Manag. 2020, 262, 110310. [Google Scholar] [CrossRef] [PubMed]
  60. Hu, Z.; Wu, G.; Zhang, L.; Li, S.; Zhu, X.; Zheng, H.; Zhang, L.; Sun, X.; Yu, G. Modeling and partitioning of regional evapotranspiration using a satellite-driven water-carbon coupling model. Remote Sens. 2017, 9, 54. [Google Scholar] [CrossRef] [Green Version]
  61. Pascolini-Campbell, M.; Reager, J.T.; Chandanpurkar, H.A.; Rodell, M. A 10 per cent increase in global land evapotranspiration from 2003 to 2019. Nature 2021, 593, 543–547. [Google Scholar] [CrossRef]
  62. Byrne, M.P.; O’Gorman, P.A. Land-ocean warming contrast over a wide range of climates: Convective quasi-equilibrium theory and idealized simulations. J. Clim. 2013, 26, 4000–4016. [Google Scholar] [CrossRef]
  63. Penman, H.L. Natural evaporation from open water, bare soil and grass. Proc. R. Soc. Lond. Ser. Math. Phys. Sci. 1948, 193, 120. [Google Scholar] [CrossRef] [Green Version]
  64. Zhang, J.; Liu, Z.; Sun, X. Changing landscape in the Three Gorges Reservoir area of Yangtze River from 1977 to 2005: Land use/land cover, vegetation cover changes estimated using multi-source satellite data. Int. J. Appl. Earth Obs. Geoinf. 2009, 11, 403–412. [Google Scholar] [CrossRef]
  65. Shen, M.; Piao, S.; Jeong, S.-J.; Zhou, L.; Zeng, Z.; Ciais, P.; Chen, D.; Huang, M.; Jin, C.-S.; Li, L.Z.X.; et al. Evaporative cooling over the Tibetan Plateau induced by vegetation growth. Proc. Natl. Acad. Sci. USA 2015, 112, 9299–9304. [Google Scholar] [CrossRef] [PubMed] [Green Version]
  66. Yao, T.; Thompson, L.; Yang, W.; Yu, W.; Gao, Y.; Guo, X.; Yang, X.; Duan, K.; Zhao, H.; Xu, B.; et al. Different glacier status with atmospheric circulations in Tibetan Plateau and surroundings. Nat. Clim. Chang. 2012, 2, 663–667. [Google Scholar] [CrossRef]
  67. Massmann, A.; Gentine, P.; Lin, C. When does vapor pressure deficit drive or reduce evapotranspiration? J. Adv. Modeling Earth Syst. 2019, 11, 3305–3320. [Google Scholar] [CrossRef] [PubMed] [Green Version]
Figure 1. The overall framework, study area, and location of meteorological stations.
Water 13 02111 g001
Figure 2. The water level in the TGD (unit: m) and division of impoundment periods.
Water 13 02111 g002
Figure 3. Scatter plots of MOD16 ET against PML-V2 ET.
Water 13 02111 g003
Figure 4. The temporal variation of annual ET(a), Ec(b), Es(c), and Ei(d) from 2001 to 2020.
Water 13 02111 g004
Figure 5. The spatial distribution of annual ET, Ec, Es, and Ei during different impoundment periods.
Water 13 02111 g005
Figure 6. Temporal trends of seasonal variation in Ec, Es, and Ei during 2000–2020.
Water 13 02111 g006
Figure 7. Temporal trends of daily ET(a), Ec(b), Es(c), and Ei(d) during different impoundment periods.
Water 13 02111 g007
Figure 8. Interannual variation of the four dominant factors (Ta, VPD, SSD, and PT).
Water 13 02111 g008
Figure 9. Trends of Ec, Es, and Ei as Ta increase (8-day mean scatter plot).
Water 13 02111 g009
Table 1. Detailed information of datasets used in this study.
DatasetIncluding DataTime ResolutionTime PeriodData Source
PML V2ET, Ec, Es, Ei8-day2000–2020https://code.earthengine.google.com/7af6ab197596a75b8858f5ab34ed2bca (accessed on 30 July 2021)
MOD16ET8-day2000–2020https://earthdata.nasa.gov/ (accessed on 30 July 2021)
Land use dataland useyearly2015http://www.esa-landcover-cci.org/ (accessed on 30 July 2021)
Meteorological dataPT, Ta, WS, RH, SSDdaily2000–2020the China Meteorological Administration
Water level datawater leveldaily2003–2020the Three Gorges Corporation
Table 2. Detailed information of the studied meteorological stations.
NameLongitude
(°E)
Latitude
(°N)
Elevation
(m a.s.l)
PT
(mm)
Ta
(°C)
WS
(m/s)
SSD
(h)
VPD
Badong (BD)110.22 31.02 33401085.44 17.53 1.77 1602.23 0.64
Changshou (CS)107.04 29.50 37761103.62 18.15 1.31 1126.22 0.54
Fengdu (FD)107.41 29.52 21801035.60 18.85 1.29 1265.67 0.64
Fengjie (FJ)109.30 31.03 60731038.52 18.39 1.73 1372.31 0.69
Jiangjin (JJ)106.15 29.17 26141009.62 18.89 1.41 1087.69 0.41
Shapingba (SPB)106.28 29.35 25911134.39 18.96 1.40 989.72 0.63
Wanzhou (WZ)108.24 30.46 18671177.85 18.87 0.93 1203.34 0.41
Xingshan (XS)110.46 31.14 2755962.15 17.23 1.11 1560.64 0.46
Table 3. Random forest results (the value of % incMSE) at different sites during 2000–2020.
StationVar Explained (%)PTTaWSVPDSSD
ETBD89.84 0.0922 0.6573 0.0204 0.3740 0.1206
CS86.21 0.1097 1.0272 0.0138 0.4316 0.1264
FD88.23 0.0930 0.7969 0.0557 0.4015 0.1345
FJ89.60 0.0967 0.7408 0.0173 0.3404 0.1123
JJ86.04 0.1121 0.7987 0.0171 0.3271 0.1782
SPB73.73 0.1085 0.8812 0.0299 0.4329 0.1254
WZ89.08 0.0862 0.8290 0.0402 0.5208 0.1885
XS89.79 0.1004 0.7454 0.0120 0.3614 0.0831
Mean86.57 0.0999 0.8096 0.0258 0.3987 0.1336
EcBD90.02 0.0288 0.3951 0.0129 0.1837 0.0780
CS84.73 0.0271 0.5732 0.0141 0.2514 0.0851
FD87.76 0.0273 0.4418 0.0326 0.2150 0.0940
FJ91.16 0.0393 0.5359 0.0161 0.1919 0.0839
JJ83.54 0.0374 0.4638 0.0089 0.1410 0.0851
SPB70.36 0.0550 0.5373 0.0257 0.2202 0.0723
WZ87.54 0.0229 0.3838 0.0148 0.1544 0.0876
XS89.89 0.0381 0.5237 0.0091 0.2211 0.0678
Mean85.63 0.0345 0.4818 0.0168 0.1973 0.0817
EsBD35.42 0.0083 0.0315 0.0025 0.0255 0.0093
CS29.66 0.0076 0.0453 0.0007 0.0264 0.0195
FD26.86 0.0040 0.0321 0.0040 0.0185 0.0086
FJ33.67 0.0060 0.0225 0.0019 0.0169 0.0076
JJ53.60 0.0232 0.0815 0.0071 0.0571 0.0280
SPB39.51 0.0140 0.0756 0.0062 0.0547 0.0120
WZ67.26 0.0207 0.1137 0.0133 0.0978 0.0332
XS32.43 0.0113 0.0431 0.0025 0.0231 0.0064
Mean39.80 0.0119 0.0557 0.0048 0.0400 0.0156
EiBD65.44 0.0188 0.1020 0.0034 0.0233 0.0069
CS62.63 0.0220 0.1270 0.0051 0.0314 0.0120
FD65.74 0.0163 0.0957 0.0048 0.0227 0.0097
FJ70.16 0.0085 0.0331 0.0003 0.0075 0.0046
JJ60.74 0.0027 0.0116 0.0004 0.0040 0.0022
SPB43.67 0.0021 0.0156 0.0002 0.0055 0.0038
WZ58.74 0.0027 0.0118 0.0004 0.0046 0.0026
XS73.21 0.0178 0.0473 0.0008 0.0109 0.0028
Mean62.54 0.0114 0.0555 0.0019 0.0138 0.0056
Publisher’s Note: MDPI stays neutral with regard to jurisdictional claims in published maps and institutional affiliations.

