Article

Baseflow and Stormflow Zinc Loads in a Small Agricultural River Catchment Influenced by an Industrial Area

1
Graduate School of Engineering, Department of Architecture and Civil Engineering, Toyohashi University of Technology, Toyohashi 441-8580, Japan
2
Department of Environmental Engineering, Faculty of Engineering, Diponegoro University, Semarang 50275, Indonesia
3
Department of Architecture and Civil Engineering, Toyohashi University of Technology, Toyohashi 441-8580, Japan
*
Author to whom correspondence should be addressed.
Water 2021, 13(15), 2113; https://doi.org/10.3390/w13152113
Submission received: 2 July 2021 / Revised: 28 July 2021 / Accepted: 29 July 2021 / Published: 31 July 2021
(This article belongs to the Section Water Quality and Contamination)

Abstract

:
A stringent environmental quality standard for zinc (Zn) has been enacted by regulators because of its toxicity to aquatic life. This study’s objective was to evaluate the variability of Zn concentrations and fluxes in the baseflow and stormflow and to estimate the contribution of Zn from point and non-point sources. By using high-resolution temporal sampling, the suspended solids (SS), iron (Fe), and Zn concentrations were measured in a small agricultural river catchment. Fe, as the natural non-point source, and Zn were evaluated using the end member mixing analysis (EMMA) to identify the source apportionment (point and non-point). The results indicate that in the baseflow, Zn mainly originated from point sources and was possibly discharged by manufacturing industries. By contrast, the non-point sources (diffuse sources) were responsible for extremely high SS, Fe, and Zn levels in the stormflow. In addition, Zn discharge during the stormflow was 93 times higher than that during the baseflow. According to the EMMA, approximately 74% of the Zn was from point sources. River management can be improved if Zn point sources are adequately treated. During a storm event, it is also important to control the particulate Zn released into the river.

1. Introduction

Heavy metals naturally occur in surface water through erosion, surface runoff, and rock weathering, depending on the geological setting in the river system [1]. Zinc (Zn) is a trace element often classified as a heavy metal and is frequently discovered in the Eearth’s crust. Zn concentrations vary over a broad range of levels, and vary from <0.01 mg/L to >0.2 mg/L in rivers [2]. Metals transported during low and high flow may generate different fluxes in river systems. Elevated heavy metal contamination may be caused by sediment-rich water [3] mainly transported by natural erosion and atmospheric deposition during storm events. On a global scale, the largest source of natural Zn emissions is sea salt, closely followed by soil particle flux [4].
Although human activities do not change the overall Zn amount in the environment on a global scale, mining, Zn-product manufacturing, and other uses of Zn create emissions in the atmosphere, water, and soil [2]. These emissions are referred to as anthropogenic emissions or discharges. The increase in human activities worldwide has caused changes to the biogeochemical characteristics of water, so anthropogenic emissions play a key role in water quality changes [5]. In the United Kingdom (UK), the most significant Zn release comes from mining and ore-processing industries [6,7]. Even after activity ceased, Zn pollution remained high in these areas. Other anthropogenic sources that contribute high amounts of Zn are Zn-product manufacturing industries, such as hot-dip galvanization (for automobiles and building materials), electro-galvanization [8], electronics [9], brass/bronze, tire vulcanization agents [10], coating, batteries [11], supplements, and medicine. The use of these Zn products brings elevated Zn concentrations to the receiving water bodies if they corrode and washout during rain events. Agriculture also contributes a considerable amount of Zn-containing runoff due to the use of pesticides and fertilizers.
Even though Zn is a required trace nutrient, if humans ingest extremely high levels of zinc, it may cause anemia or damage to the kidneys and pancreas [12,13]. Previous research confirms that high Zn concentrations are also toxic to aquatic organisms [14] and plants [15]. Zn poses a substantial environmental risk and threat to aquatic life [16,17]. Furthermore, the survival of aquatic life depends on the river water quality. Regulating agencies in multiple European countries and Japan are concerned about Zn toxicity in aquatic life. European countries have enacted two approaches regarding Zn environmental quality standards (EQSs). One approach involves water hardness because toxicological levels of Zn increased with decreasing water hardness. The EQS of total Zn annual mean concentration is set from 0.008 mg/L (0–50 mg/L CaCO3) to 0.125 mg/L (>250 mg/L CaCO3) [18]. The UK identifies Zn as a possible “specific pollutant” because of its significant quantities discharging into the water [19]. The biotic ligand model is another approach produced specifically in the UK and Wales that enables the prediction of bioavailable Zn concentrations [20]. In addition, Comber et al. [19] developed a tiered approach to the implementation of metal EQS under the WFD. Gozzard et al. [6] found that in a historically metal- mined river catchment in UK, the high-flow EQS exceedances outweighed the low-flow exceedances caused by diffuse sources despite higher Zn concentrations during low flow and the fact that these sources caused adverse pollution even when point sources were remediated. In 2003, Japan enacted an EQS of Zn to protect aquatic life (0.03 mg/L in annual mean concentration). However, according to the Ministry of Environment of Japan [21], Zn levels in 1.6% of 1203 Japanese rivers exceeded the EQS.
To date, only a few studies have compared metal concentrations in the baseflow and stormflow during high-resolution temporal sampling as the event progressed [5,22,23]. Baseflow and stormflow survey comparison may reveal possible sources of Zn within the catchment, such as mineral weathering [23], deliver valuable insights into the hydrology of metal transport [22], and reveal an accurate flux estimation considering the baseflow and stormflow over athe year [5]. Zn particulate flux into rivers may be mobilized to a greater degree during rainy events due to the washout of corroded materials, road deposit particle buildup, and mineral weathering. Recent attention also focuses on the impact human activities on the geochemistry of river systems, particularly in urban settings [24]. Behrendt [25] estimated the point and diffuse source loads of heavy metals by emission approach. Extreme flooding and severely low river flow (both of which are likely due to climate change) are the most recent issues in metal transport, particularly in watershed draining mine areas [26,27,28,29]. However, there is only limited knowledge available regarding the sources of Zn during the baseflow and stormflow in a small agricultural watershed that is potentially contaminated by industrial activities. It is evident that although industrial point sources release a considerable amount of Zn, the flux from unknown sources during irrigation periods is much higher than the flux during non-irrigation periods [30].
To achieve a given objective, the monitoring frequency must be specified [31]. In this study, two high-resolution temporal samplings were undertaken to obtain the baseflow and stormflow fluxes of Zn. Additionally, a naturally occurring element which originated from non-point (diffuse) sources, such as iron (Fe), was also evaluated. The suspended solids were analyzed in order to approximate the relevance of particulate element both during baseflow and stormflow. To estimate the contribution of Zn origins from point and non-point sources, the end member mixing analysis (EMMA) was implemented to the Zn ratios derived from the baseflow and stormflow comparisons. The present study mainly focused on the Zn source apportionment (point and non-point sources) during the sampling campaigns. Therefore, this study aimed to evaluate the variability of Zn concentrations and fluxes in the baseflow and stormflow of a small agricultural river catchment and to estimate source apportionment of Zn from point sources and non-point sources to the river water.

2. Materials and Methods

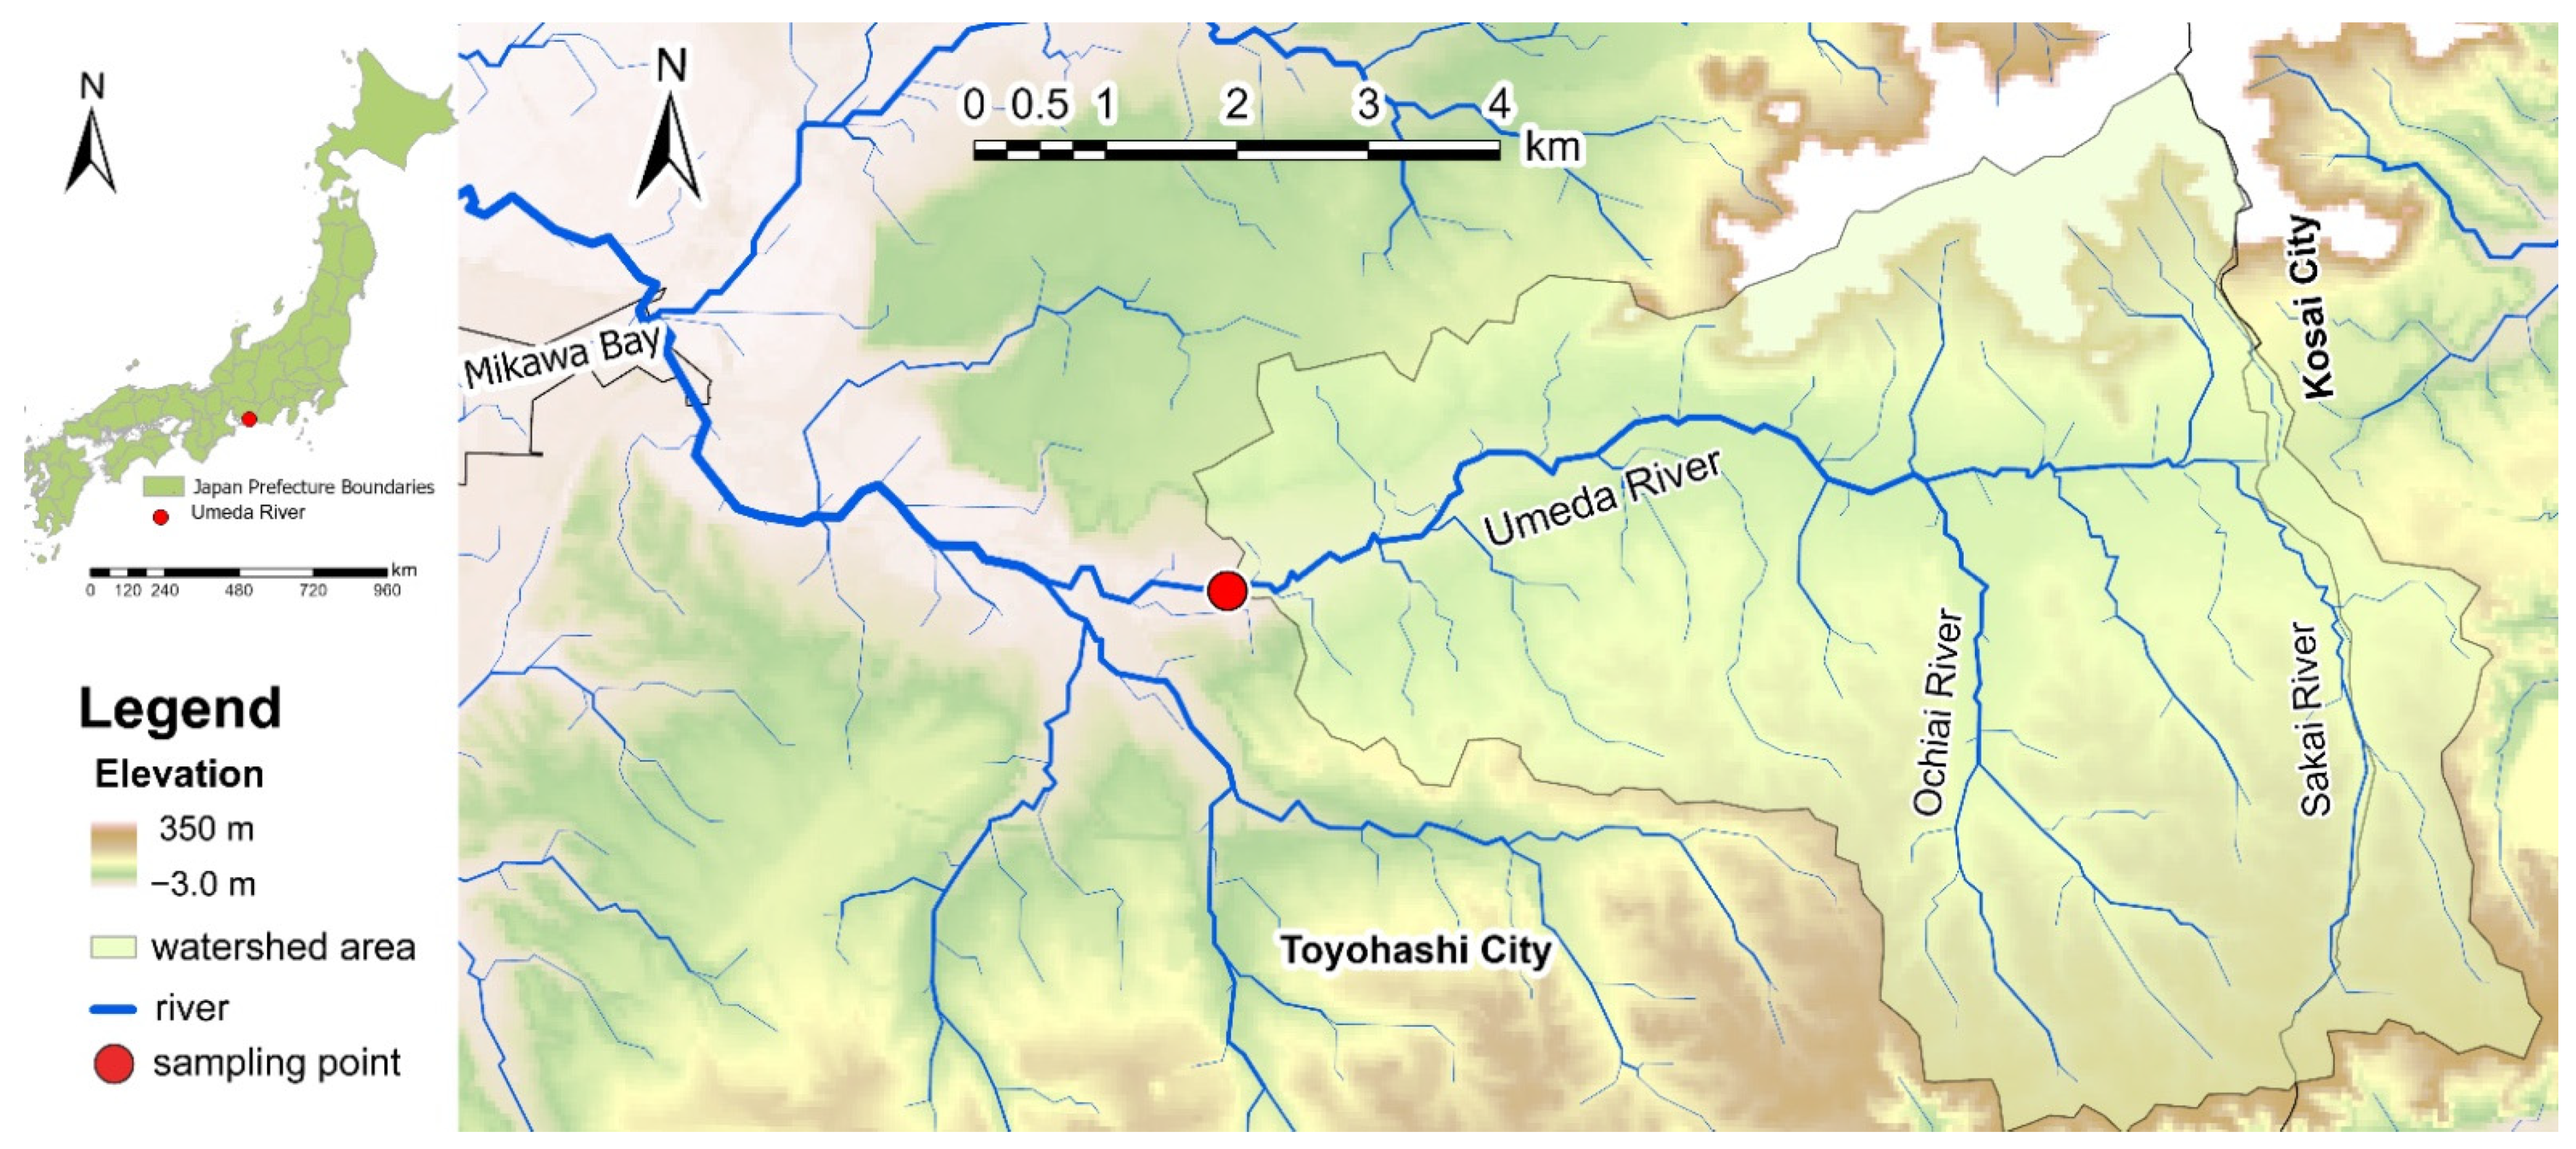
2.1. Site Description

This study focused on the Umeda River in Aichi Prefecture, Japan. This river flows through the city of Toyohashi with two mainstems, the Sakai River and Ochiai River which crosses industrial areas. The river catchment area in this study is approximately 43.7 km2. The major use of the surrounding land is agricultural land (48.8%), including paddy field (5.8%), cabbage, tea, and other crops. The urban area comprises commercial, industrial, and residential areas (29.6%), whereas 7.8% of the area is forested, 9.4% is bamboo, 1.6% is grassland, 0.3% is rivers, 0.7% is for solar panel, and 1.8% is bare land. According to the results of a water quality survey conducted by the Toyohashi City Environmental Research Center (2015–2017), the total Zn concentration of the Umeda River exceeded the EQS. Previous research revealed spatial variation in the total Zn concentration in the Umeda River and its annual mean value breached the EQS [32]. A part of the agricultural field is irrigated using the Umeda River water.
The central region of Japan, specifically in Toyohashi City, has a temperate climate. According to the Japan Meteorological Agency [33], the yearly mean precipitation approximately 1600 mm. The lowest precipitation usually exhibits in January (approximately 50 mm per year) and the highest precipitation amount is in September or October (approximately 200 mm). The monthly mean temperature in 2020 ranged from 8.8 °C (in December and January) to 29.7 °C (in August). In Chubu region of Japan, the dominant soil types are andosols and cambisols, specifically in the Umeda River catchment, acrisols also presents [34,35]. Allophane, imogolite, and ferrihydrite, along with Fe- and Al-organic matter complexes, compose up the fine portion of andosols [36]. Due to their unique mineralogy, they have very low bulk density, high organic matter levels, changeable charge [36], and generally exhibit high heavy metal concentrations [37]. By contrast, weatherable minerals are generally few in acrisols [38] and cambisols [39]. The geology consists of sedimentary rocks and accretionary complexes [40]. The catchment is rich in limestone [40].
The sampling point was located at the Hatakeda Bridge, as illustrated in Figure 1. This section of the river is the most downstream, without tidal influence. A single sampling point might be arguable, but this point was decided based on a monthly survey conducted for a year. The most downstream point exhibited a relatively high annual total Zn concentration compared to upper stream section of the river [32].

2.2. Water Sampling Methods

This study consisted of two high-resolution temporal samplings undertaken on a sunny day (as the baseflow) and during a rainy event (as the stormflow). The baseflow survey was conducted for a total of 50 h, on the weekdays from 17:00 on Wednesday (5 February 2020) to 17:00 on Thursday (February 6, 2020) and on the weekend from 17:00 on Saturday (8 February 2020) to 17:00 on Sunday (9 February 2020). February (in the winter season) was selected because it has a relatively low precipitation level over the year (73 mm in monthly total of precipitation [33]), to minimize the surface runoff flowing into the water body. A previous study in the Umeda River also reported that the winter has the highest Zn concentrations [32]. The stormflow survey was undertaken in September as it has a relatively high precipitation level (291 mm in monthly total of precipitation [33]). The stormflow survey was conducted from 14:30 on Sunday (6 September 2020) to 07:30 on Tuesday (8 September 2020).
The water samples were taken using an autosampler (Teledyne ISCO-6712, Lincoln, NE, USA) that took hourly 1 L samples. To avoid cross-contamination, a purge phase was programmed, and both bottles and the pipe were made of polypropylene. One liter of water sample was taken manually using polypropylene bottles at each baseflow survey (17:00 on the second day). Sample container cleaning by triple rinsing with pure water before each sampling event was completed to prevent contamination.

2.3. Estimation of River Discharge by the Water Level–Discharge Model

The River Division of the Aichi Prefectural Construction Bureau monitored the water level every 10 min at the Hamamichi Station. The survey in this study was performed at Hatakeda Bridge approximately 1 km from the Hamamichi Station. A water level–discharge (H–Q) model [41] was implemented to estimate the river discharge, including the conversion of the water level from the Hamamichi Station to the Hatakeda Bridge. The scatterplot of H and Q is illustrated in Figure 2.

2.4. Water Analysis

2.4.1. Suspended Solids

The filtration of water samples using GF/F membranes (Whatman™, Medium, UK) was conducted immediately after transport to the laboratory. The GF/F membranes were cleaned at 400 °C prior to use. For the baseflow samples, 100 mL water samples were filtered using wash—dried and pre-weighed GF/F membranes, while only 50 mL stormflow water samples were filtered to measure the suspended solid (SS) concentration.

2.4.2. Zinc and Iron Concentrations

The unfiltered samples were acidified by adding 0.5 mL concentrated HNO3 (ultrapure analytical reagent, Tama Chemicals Co., Ltd., Kanagawa, Japan) to 50 mL samples immediately after the samples were collected. They had to be acid digested prior to measurement of Zn and Fe concentrations. The acidified samples were heated up on a hot plate at 205 °C for 20 min and filtered using a 0.45 µm syringe filter (cellulose acetate, Advantec®, Tokyo, Japan). The first 5 mL of the filtrate was disposed of to avoid contamination from the filter cartridge. The acid digested samples were stored at 4 °C until Zn and Fe measurement.
The total fraction of metal was measured using an atomic absorption spectrometry instrument (AA-7000, Shimadzu Corporation, Kyoto, Japan). A flame method was applied to measure iron (Fe) (detection limit: 0.01 mg/L) and Zn concentrations (detection limit: 0.005 mg/L). If the concentration of Zn was below 0.005 mg/L, the samples were re-measured using graphite furnace absorption spectrometry with a detection limit of 0.0005 mg/L.
The quality assurance and quality control (QA/QC) procedures were performed to ensure accurate measurement. Acid cleaning by soaking plasticware and glassware using 1% HNO3 (ultrapure reagent, Kanto Chemical, Co., Inc., Tokyo, Japan) was completed to ensure that no metal contamination occurred. Milli-Q (ultrapure) water was used to prepare all standard solution with ultrapure reagents. The calibration curve of measurement was revalidated every six samples including method blank. Triplicate measurement was performed and indicated that the coefficient of variation was less than 7% (Zn and Fe). A certified reference material (CRM 7202-c No. 0356, National Metrology Institute of Japan) was used to assess the recovery rates of the analytical procedure. The recovery rates were acceptable which ranged from 84 to 92% for Zn and from 93 to 99% for Fe.

2.5. Data Analysis

Data handlings such as bivariate Pearson correlation, non-linear regression, and other descriptive statistics were performed using Minitab® 19 software. The association degrees were examined using a bivariate Pearson correlation among SS, Zn, and Fe concentrations. A correlation with p < 0.05 is considered as statistically significant.
To evaluate the Zn load, the load (L)-discharge (Q) equation method was applied to both baseflow and stormflow datasets [42]. The high-resolution temporal sampling at the baseflow and stormflow sampling campaign generated the hourly loads by multiplying Zn concentration and river discharge. The L-Q equation can be written as [42]:
L = c Q n
where c and n are coefficients obtained from the non-linear regression between L and Q. The Levenberg–Marquardt algorithm [43,44] was performed to solve the non-linear regression of the L-Q equation method by adjusting the parameter estimates to minimize the residual error’s sum of squares.
To estimate the proportion of zinc load both from point source and non-point source, an end member mixing analysis (EMMA) [45] was performed using two tracers, i.e., Zn from point sources and Zn from non-point sources. The hourly Zn and Fe loads at each sampling campaign were summed up to obtain daily load. A natural source element from non-point sources is necessary to estimate the non-point source load ratio of Zn. In this case, Fe is considered as the natural source element that originated from non-point sources according to the baseflow survey campaign evaluation. The relative contribution of Zn generated from the point sources ( F PS ) and non-point sources ( F NPS ) could be written by the following equations:
1 = F PS + F NPS
total   ratio   of   Zn = F PS × R Zn _ PS + F NPS × R Zn _ NPS
where R Zn _ PS is the ratio of Zn from point source and R Zn _ NPS is the Zn ratio from non-point or diffuse sources. The values used in the EMMA are thoroughly explained in the Section 3.3.

3. Results and Discussion

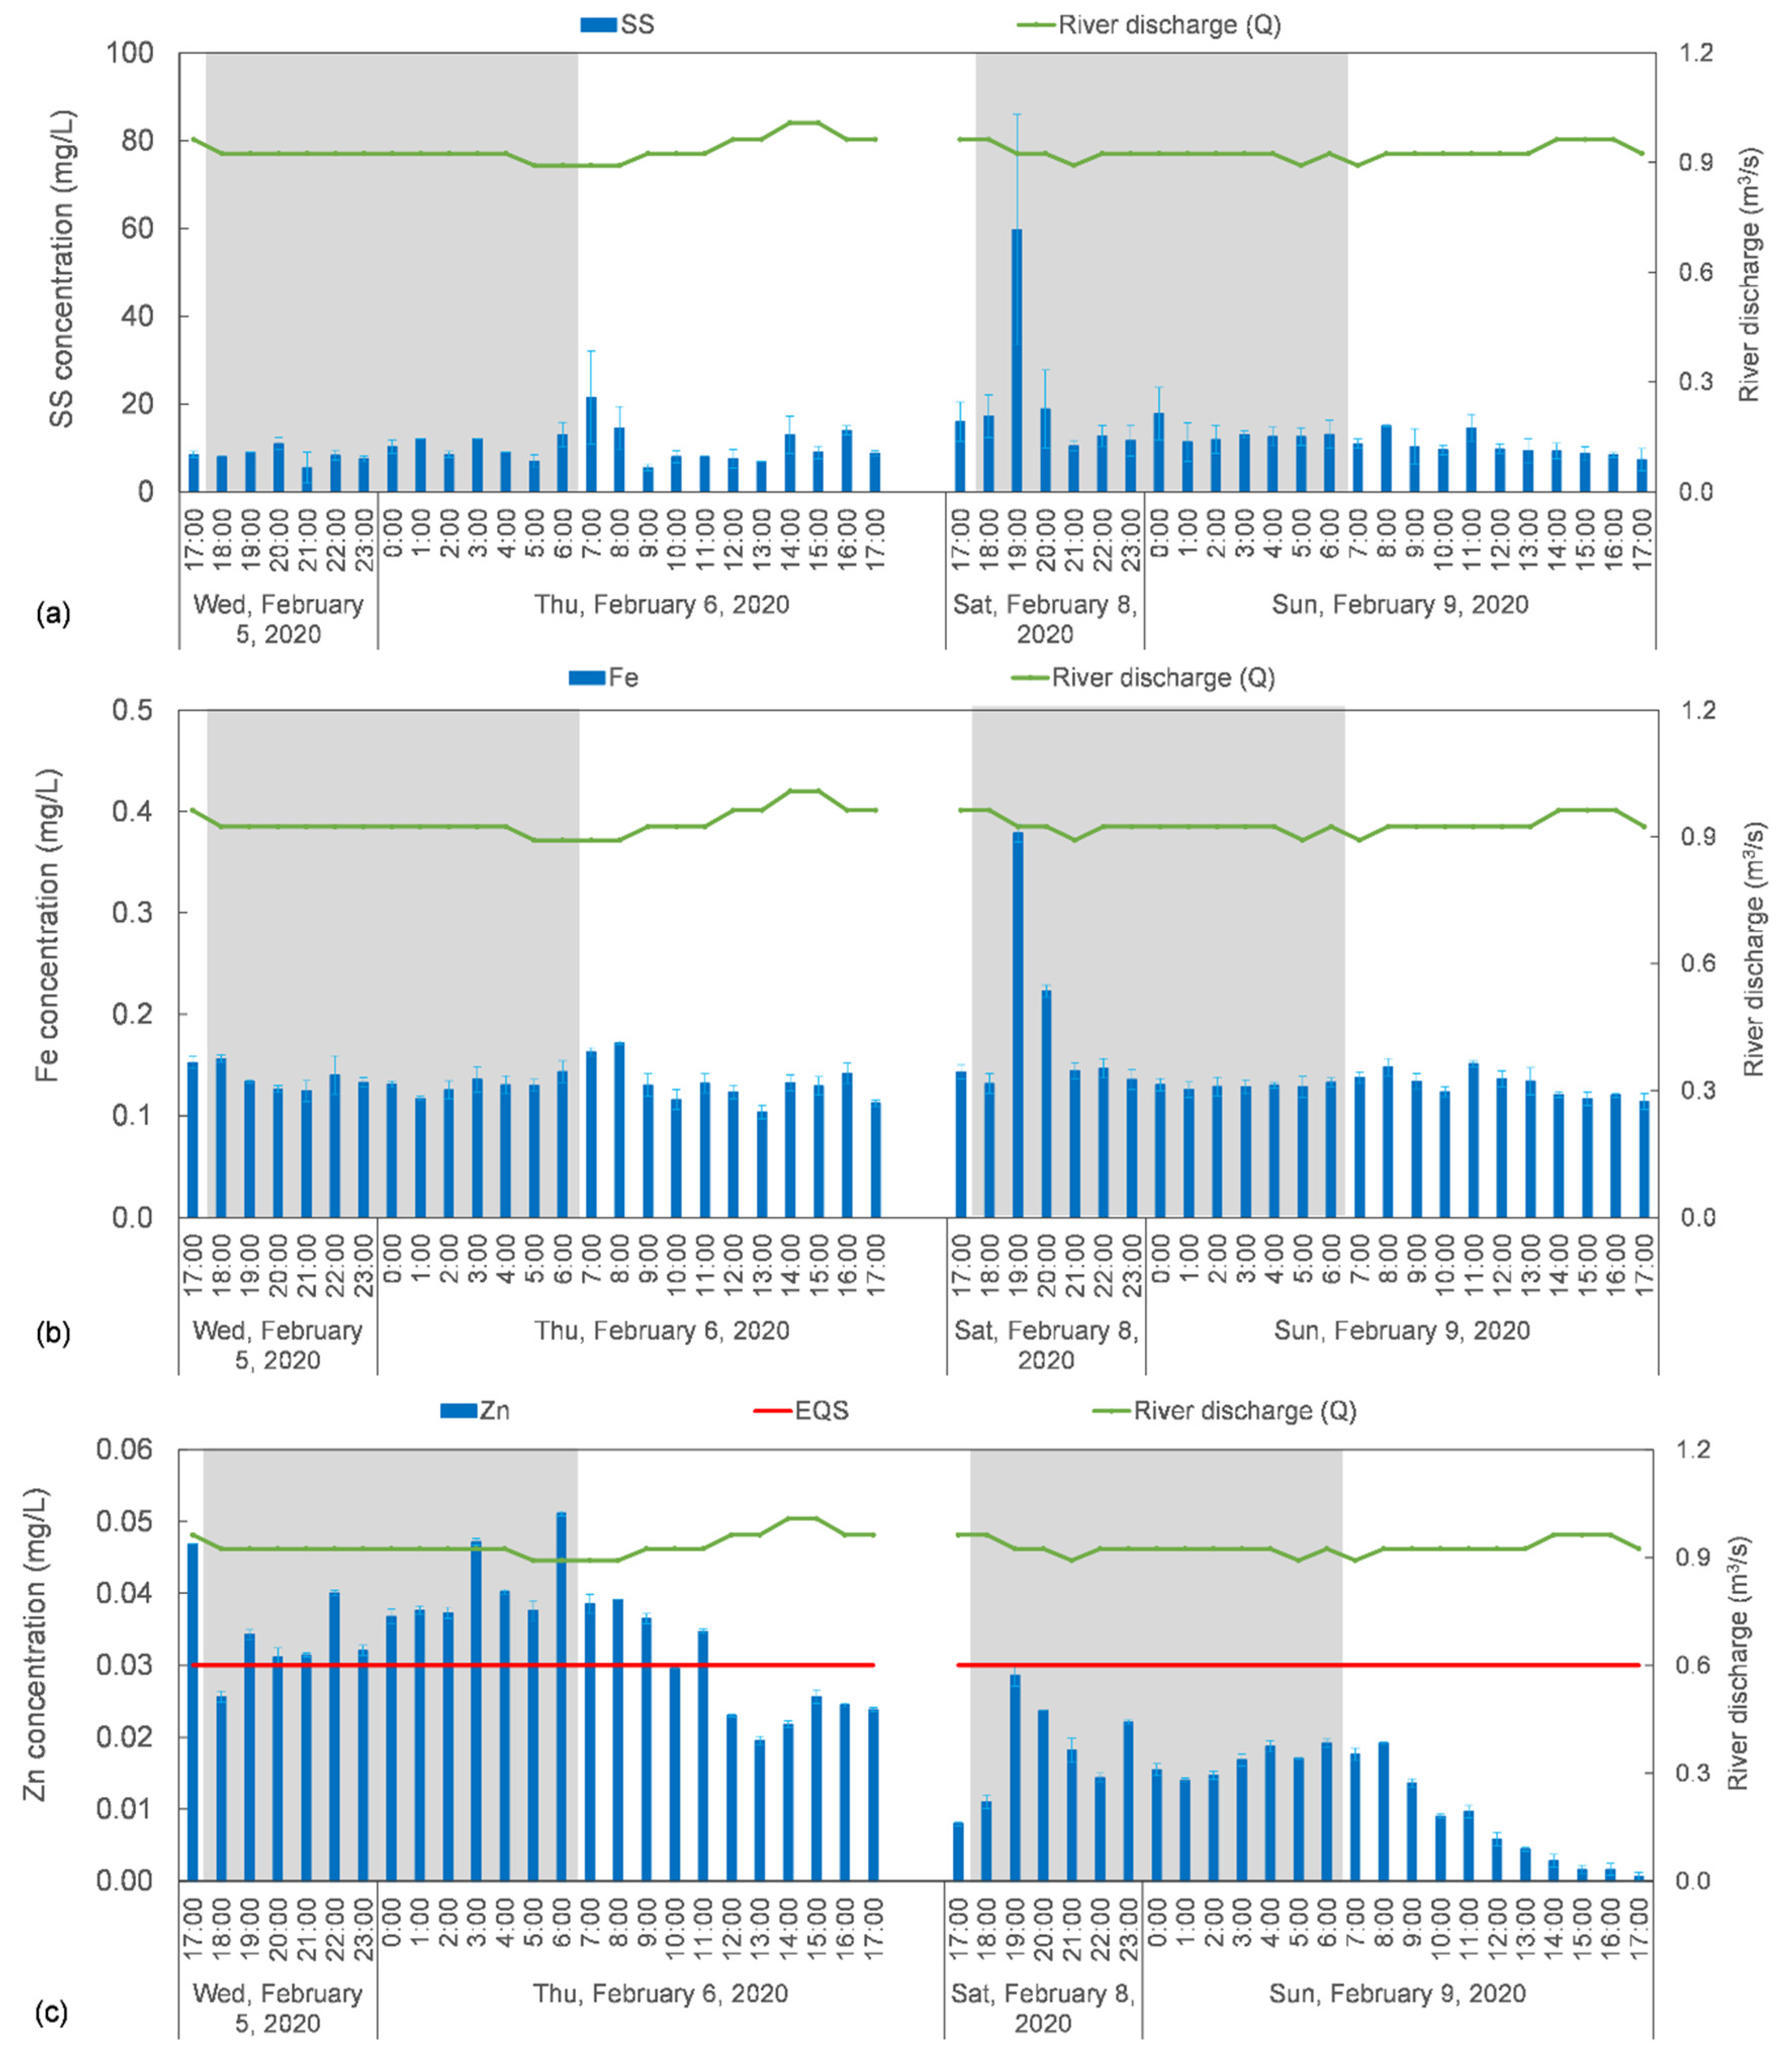
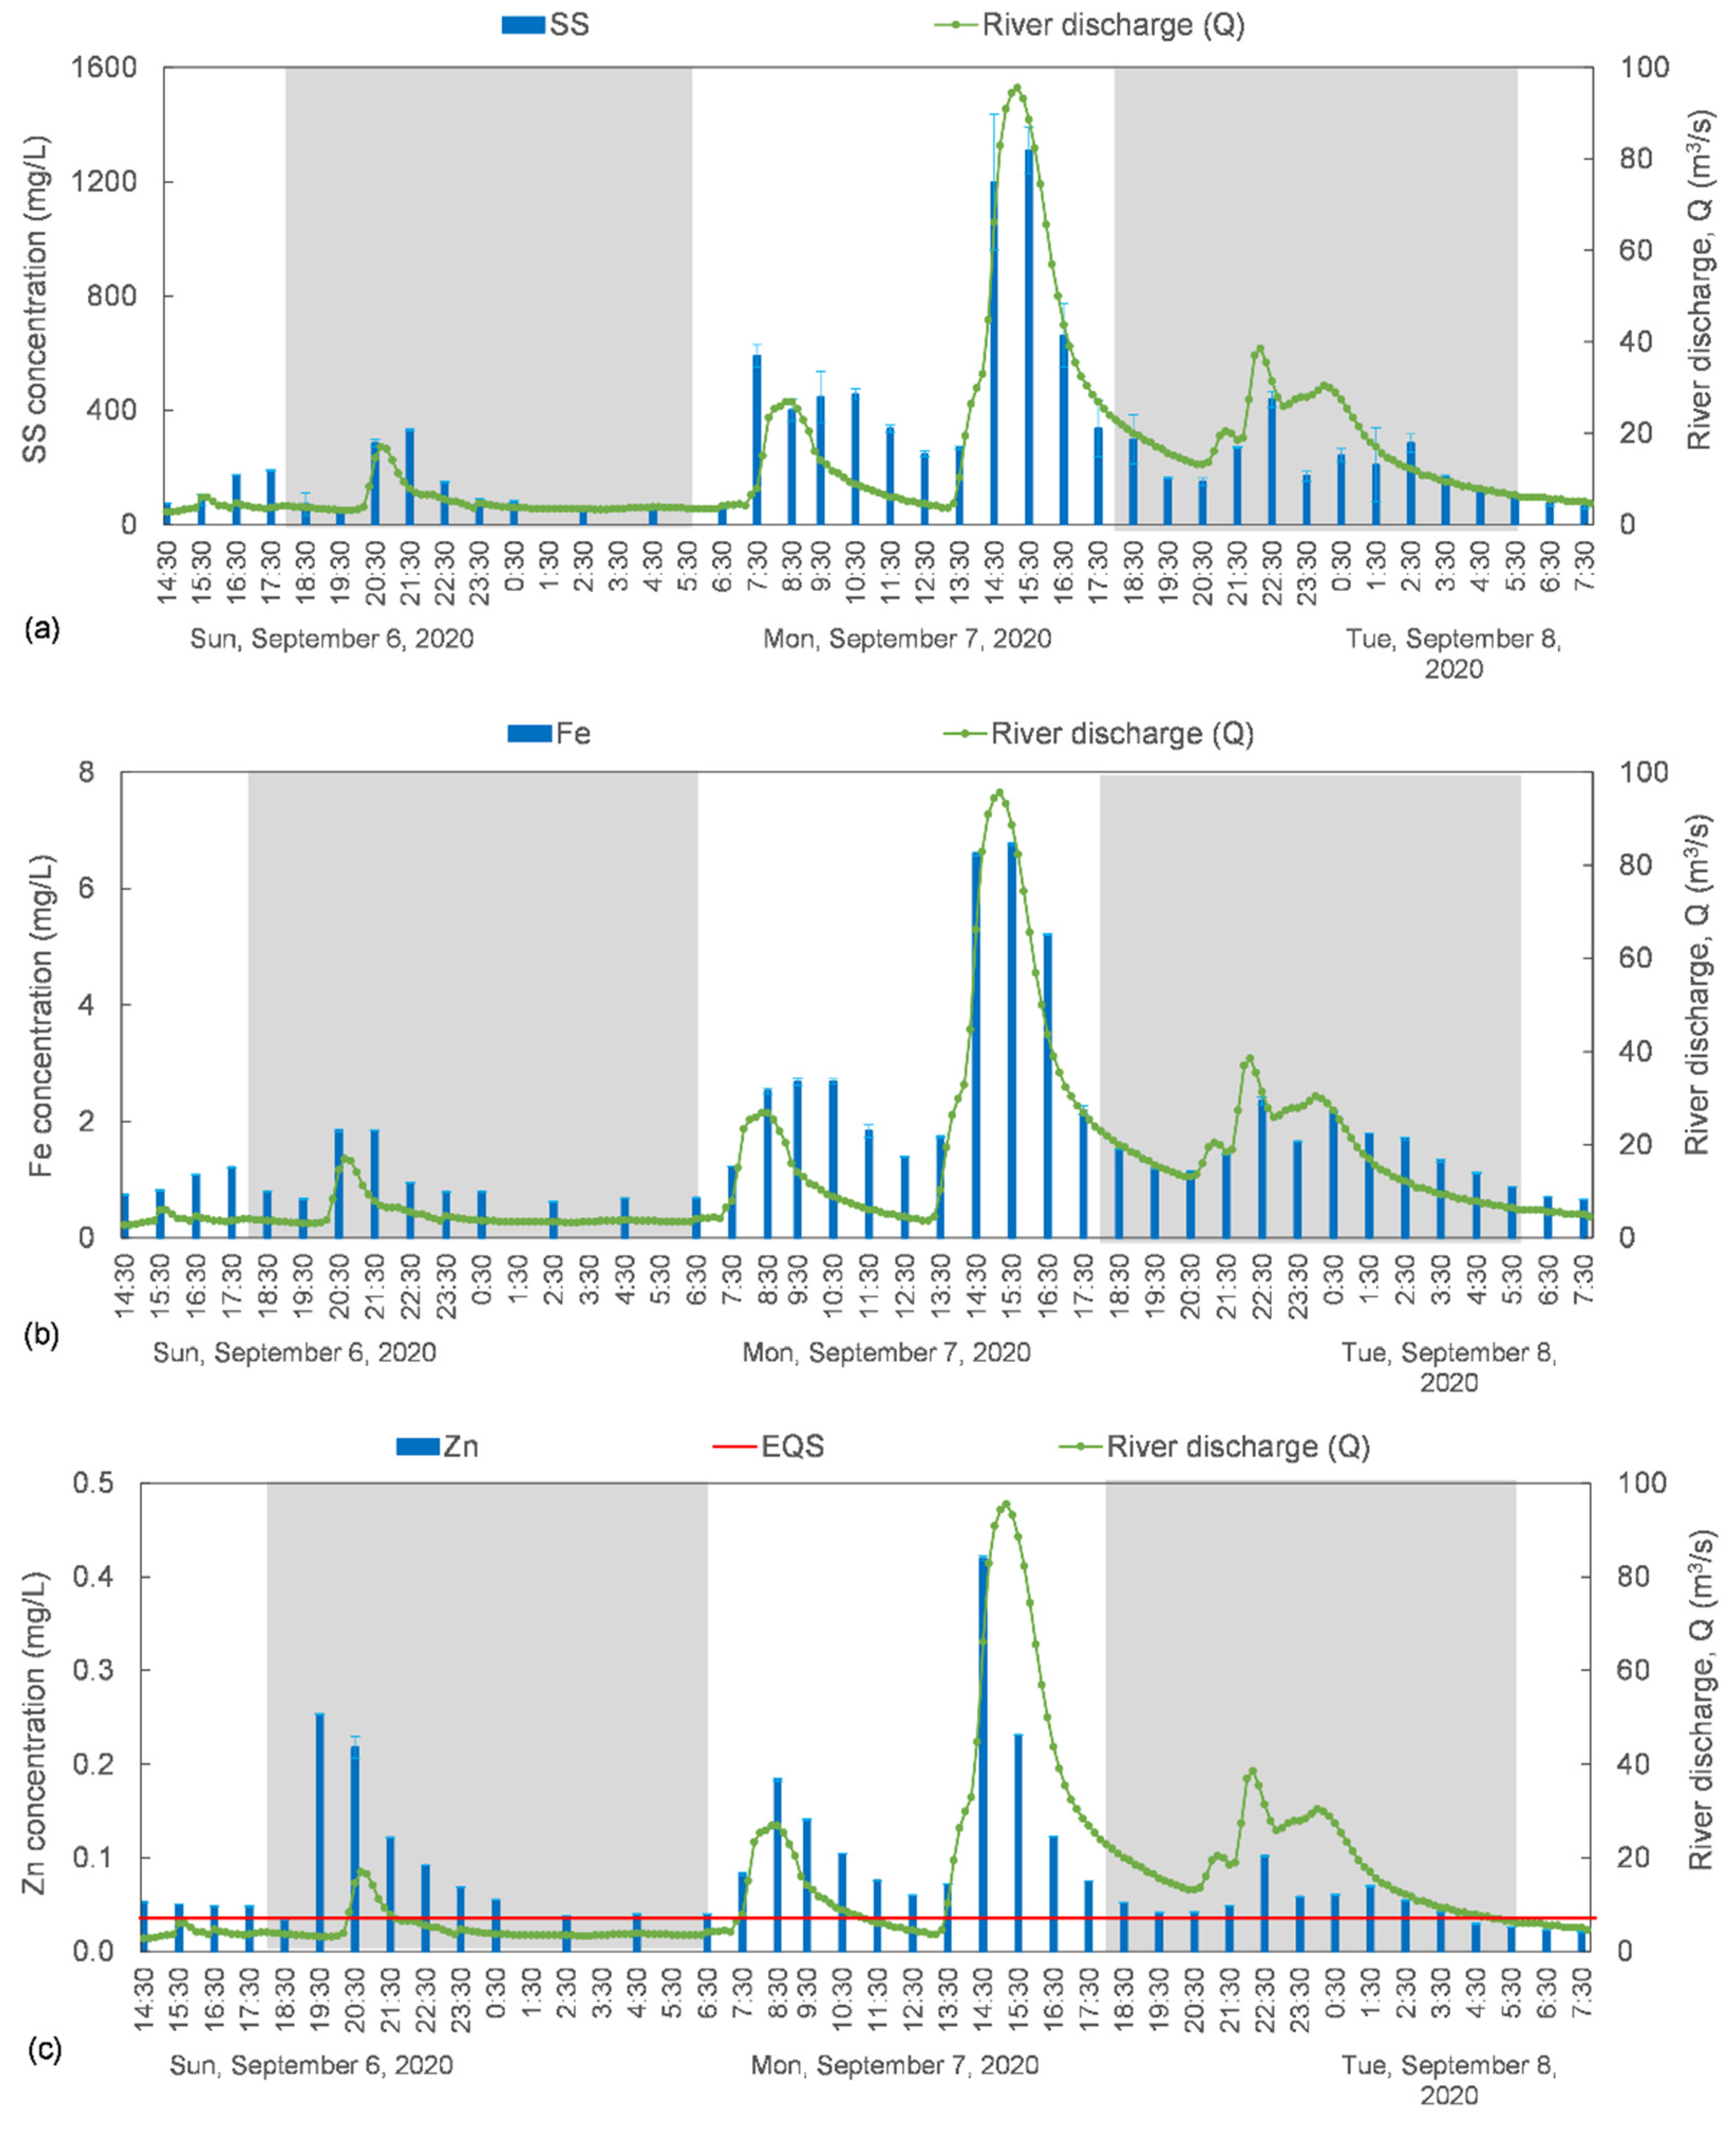
3.1. Variability of Suspended Solid, Iron, and Zinc Concentrations

The variation in SS, Fe, and Zn concentrations during a sunny day (in the baseflow) is illustrated in Figure 3a–c, respectively. These charts comprise the SS, Fe, and Zn levels during weekdays and the weekend. The river discharges were relatively steady for both the weekdays and the weekend, varying from 0.89 to 0.93 m3/s. The average in SS concentration during the weekdays was 10 ± 3.47 mg/L, ranging from 5–22 mg/L. During the weekend, the SS concentration varied from 7 to 19 mg/L, with a mean of 12 ± 9.97 mg/L, excluding an outlier of 60 mg/L that was due to an unknown cause. The SS levels during the weekend were slightly higher than those during the weekdays, although the river discharges did not vary significantly.
Figure 3b illustrates the variation of Fe concentrations during the weekdays and the weekend. The average Fe concentration was 0.133 ± 0.015 mg/L during the weekdays (varying from 0.104 to 0.172 mg/L) and 0.146 ± 0.053 mg/L during the weekends (ranging from 0.114 to 0.379 mg/L). The concentrations indicate no difference between weekdays and the weekend, except an outlier similar to that when the SS level was extremely high. In this outlier case, both the SS and Fe may have originated from natural sources.
The diel variability of Zn for 25 h during the weekdays and the weekend is illustrated in Figure 3c. The Zn clearly exhibited a difference in concentration between weekdays and the weekend in February (during the winter season). The Zn concentrations during the weekdays (mean: 0.034 ± 0.008 mg/L, range: 0.019–0.051 mg/L) were considerably higher than those during the weekend (mean: 0.016 ± 0.006 mg/L, range: 0.001–0.029 mg/L). The fluctuation pattern of Zn levels was much different from that of the SS levels, indicating that the Zn was mostly present in dissolved form. On weekday, it is obvious that the Zn concentrations indicated more fluctuation (up to 392% in amplitude from the minimum to the maximum level) compared with the SS and Fe. The Zn concentrations were considerably higher at night than during the day, regardless of the river discharge variation. The EQSs were breached substantially during the weekdays at night, except at 18:00. These results indicate that the elevated Zn concentrations might be due to anthropogenic activities that were only conducted on weekdays.
The concentrations of SS, Fe, and Zn in the stormflow are presented in Figure 4. From September 6 (Sunday) to September 8 (Tuesday), 2020, a rainy event consisted of four major discharge peaks in the Umeda River catchment (17, 27, 96, and 39 m3/s). In contrast to the baseflow concentrations, instream SS, Fe, and Zn concentrations generally followed river discharge during the rainy event, as illustrated in Figure 4a–c, respectively.
At the first discharge peak, the SS concentration began to increase to 333 mg/L in the falling limb of the storm hydrograph. It then declined in the steady flow from 22:30 to 06:30. Immediately before the second discharge peak, the SS concentration reached 590 mg/L and drastically decreased at the apex (401 mg/L) before it rose again until 456 mg/L, after which it gradually declined. The SS concentration soared to its highest level (1309 mg/L) right after the third discharge peak, demonstrating a similar phenomenon to those of the first and fourth discharge peaks (438 mg/L).
The timing of the SS concentration peak was similar to that of the Fe pattern. However, all Fe concentration peaks arrived after the respective discharge peaks (1.85, 2.68, 6.77, and 2.35 mg/L). Fe concentrations varied simultaneously with the river discharge, in particular from the third peak to the end of the storm event. At the first and second discharge peaks, the Fe concentration was more stable. Although the discharges declined, the Fe concentration levels were still relatively high (1.39–2.68 mg/L). Both the SS and Fe fluctuations indicated that the source still existed even after the discharge peaks. The materials in the ground of the catchment continuously flushed and flowed into the river.
The Zn concentrations in the stormflow indicated a distinguished variation compared with the SS and Fe concentrations. The Zn level soared to the second-highest concentration (0.25 mg/L) just before the first discharge peak and gradually decreased until approximately 0.04 mg/L in the steady flow at 3.47 m3/s. When compared with the SS concentration level at 19:30 on September 6, 2020, the first high in Zn concentration (0.25 mg/L) might have been present in dissolved form. Then, the Zn concentrations began to vary, coinciding with the river discharges where the level reached 0.18 mg/L at the second peak. The highest concentration (0.42 mg/L) occurred just before the third peak and then decreased following the discharge pattern.
Given that this Zn peak occurred just before the discharge peak, the river system was flushed of any fine material present in its source prior to the highest discharge [46,47]. A rainy event potentially generates easily soluble corrosion products in the first rain volume, frequently referred to as the first flush, that will be removed as runoff. It will then be followed by a more or less constant runoff rate during ongoing rain [48]. Some factors, such as the length of dry periods and the extent of dry deposition, rain volume and intensity, and porous corrosion layers, may affect the magnitude of the first flush [48]. Although the fourth discharge peak was higher than the second peak, the Zn level only slightly increased when the fourth peak occurred, indicating that the source might have already been exhausted. In addition, the lower concentration in high flow might be related to a dilution effect by Zn-poor water and particle input. This was the case after the fourth peak. In steady low flow during the beginning of the storm event, the EQS exceedances were immediately observed, varying from 11% to 75%. The largest EQS exceedance (1299%) was in the third rising limb. The EQS was not breached, only when the Zn source was exhausted at the end of the storm event (from 9 m3/s). Nevertheless, it should be noted that the EQS was enacted for the annual mean value.
At the beginning and the end of the stormflow in September, the river discharge exhibited relatively lower values, i.e., from 2.8 to 6.5 m3/s. The river discharge range in February (winter) was still lower than the range in September (autumn). Due to seasonal variation [32], the winter’s instream Zn may show higher levels than in autumn. However, in the present study, the Zn levels in the baseflow during both seasons are not remarkably different. Indeed, due to elevated contributions from the non-point sources at the beginning and the end of the stormflow, SS and Fe were significantly different during both seasons. As described in the Section 2.2, September had a substantially higher monthly total of precipitation than February, causing river discharges to remain high and could not reach the baseflow level because of the frequent rainfall. Therefore, the uncertainties involving the sampling period difference, specifically in Zn concentrations, are still acceptable.
Zn sources may be natural or anthropogenic and include both point and non-point sources. The anthropogenic non-point sources are derived from human activities such as atmospheric deposition of Zn [49,50]; agricultural activities [51,52]; roof corrosion [53]; sewage overflows [54,55]; road traffic activities such as tire wear, particle abrasion from tires, brakes, and road wear [56,57,58,59]; and exhaust from vehicles [57]. The significant source of the atmospheric deposition of Zn particles in Tokyo Bay and in France originated from municipal solid waste incineration plants [50,60]. In the Umeda River, wet deposition may also contribute to the instream Zn levels, particularly at the beginning of the storm event. Additionally, the Umeda River catchment area consists of a considerable area of agricultural land that may contain additional Zn in the soil due to fertilizer, pesticides [61], and livestock applications [17,62,63]. Naito et al. [51] estimated that the Zn release to surface water through leaching and runoff from agricultural land in Japan was 7 t/y.

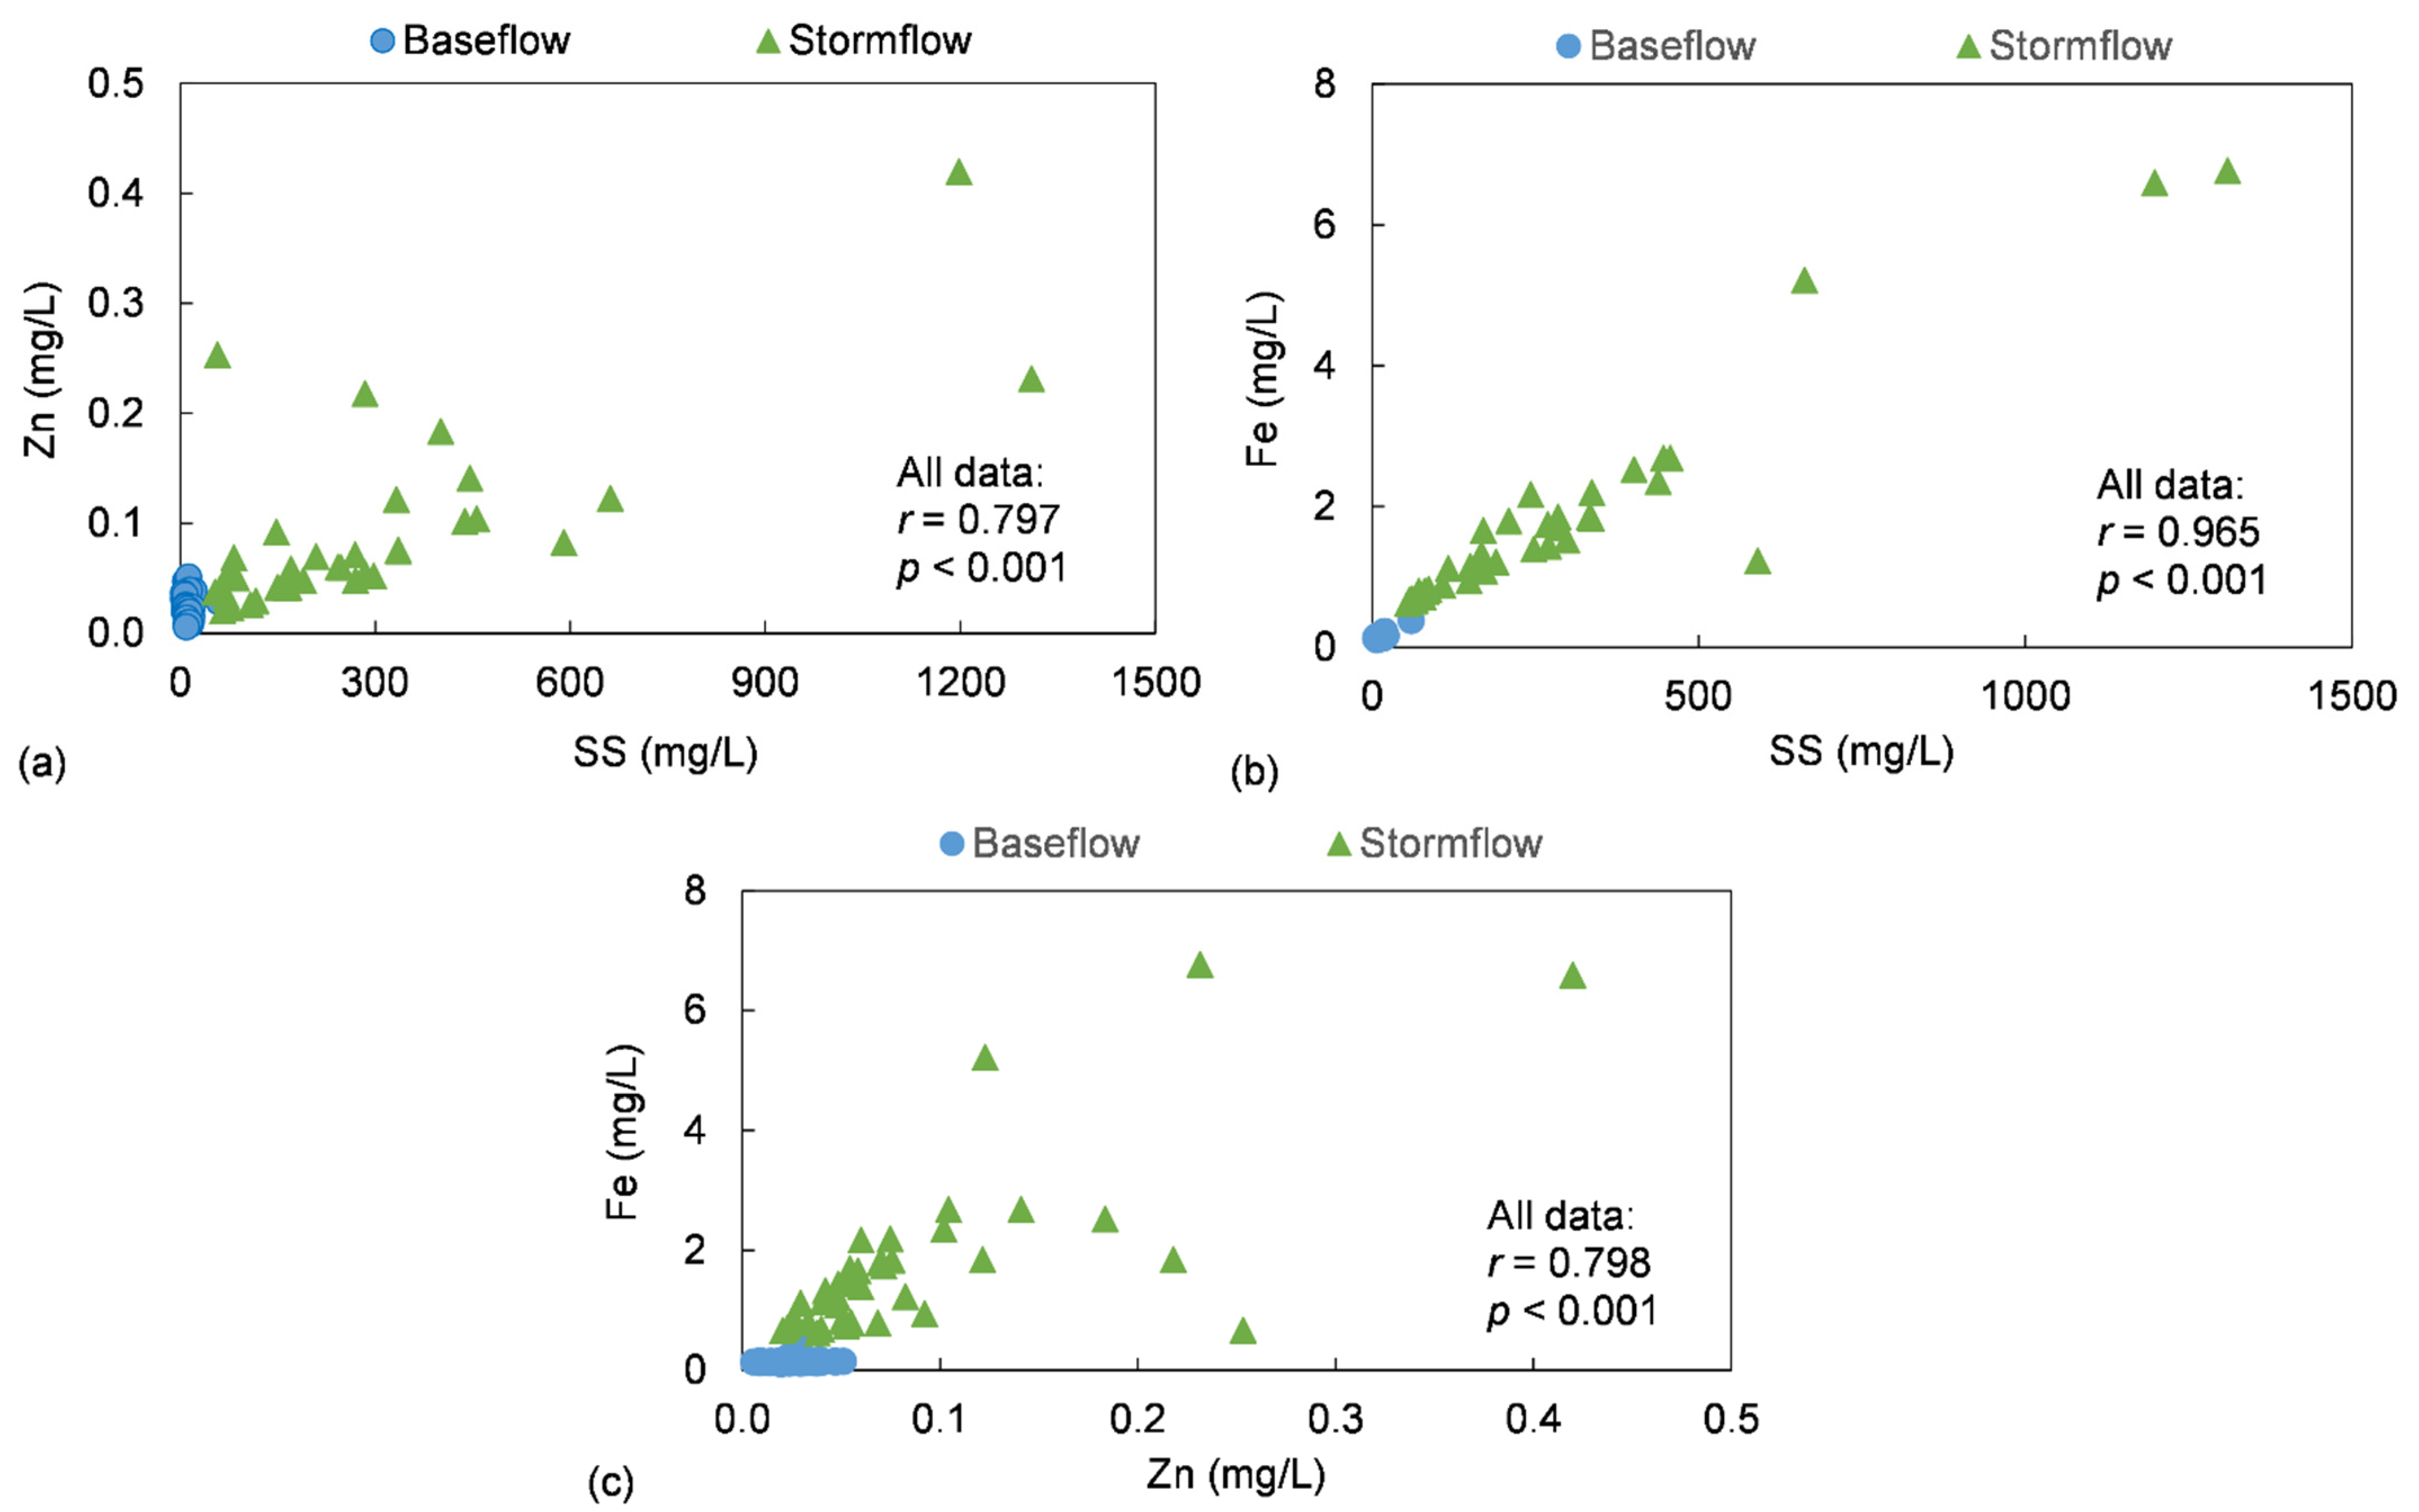
3.2. Correlations between Suspended Solid, Iron, and Zinc Concentrations

The Pearson correlation data plots of the Zn, Fe, and SS concentrations are presented in Figure 5. The relationship between the SS and Zn concentrations in the baseflow and stormflow was significantly positive (r = 0.797, p < 0.001), whereas the SS and Fe concentrations demonstrated a very strong positive correlation (r = 0.965, p < 0.001). It is clear that Zn and Fe were introduced into the river in particulate form during the storm event. In the baseflow, no significant correlation was revealed between the SS and Zn concentrations, whereas the SS–Fe correlation indicated a very strong positive and significant correlation (r = 0.911, p < 0.001). Therefore, in the baseflow, it is likely that most Fe will be presented in particulate form. The origin of Zn (dominated by the dissolved fraction) may come from specific point sources during baseflow.
The correlation between Zn and Fe exhibited a strong and significant correlation for both stormflow and baseflow (r = 0.798, p < 0.001). In a near-neutral river such as the Umeda River, the Zn within the storm water might be adsorbed on the Fe–oxyhydroxide coatings of the SS. According to previous research [46,64,65,66,67], Zn in particulate form is commonly adsorbed by organic matter or Fe–Mn oxyhydroxides.
The loads of SS, Fe, and Zn (g/s) were calculated by multiplying the concentration (mg/L) by the discharge (m3/s), for all data from both flows. By using non-linear regression, empirical LQ methods in equation (1) were established [42]. As illustrated in Figure 6, the n coefficient accounts for more than n > 1 and indicates washout-type runoff [68]. The highest n coefficient was demonstrated in the SS load (n = 1.98), whereas the n coefficients of Fe and Zn were lower at 1.76 and 1.62, respectively. However, it should be pointed out that in the non-linear regression, Zn was less fitted than those in Fe and SS.

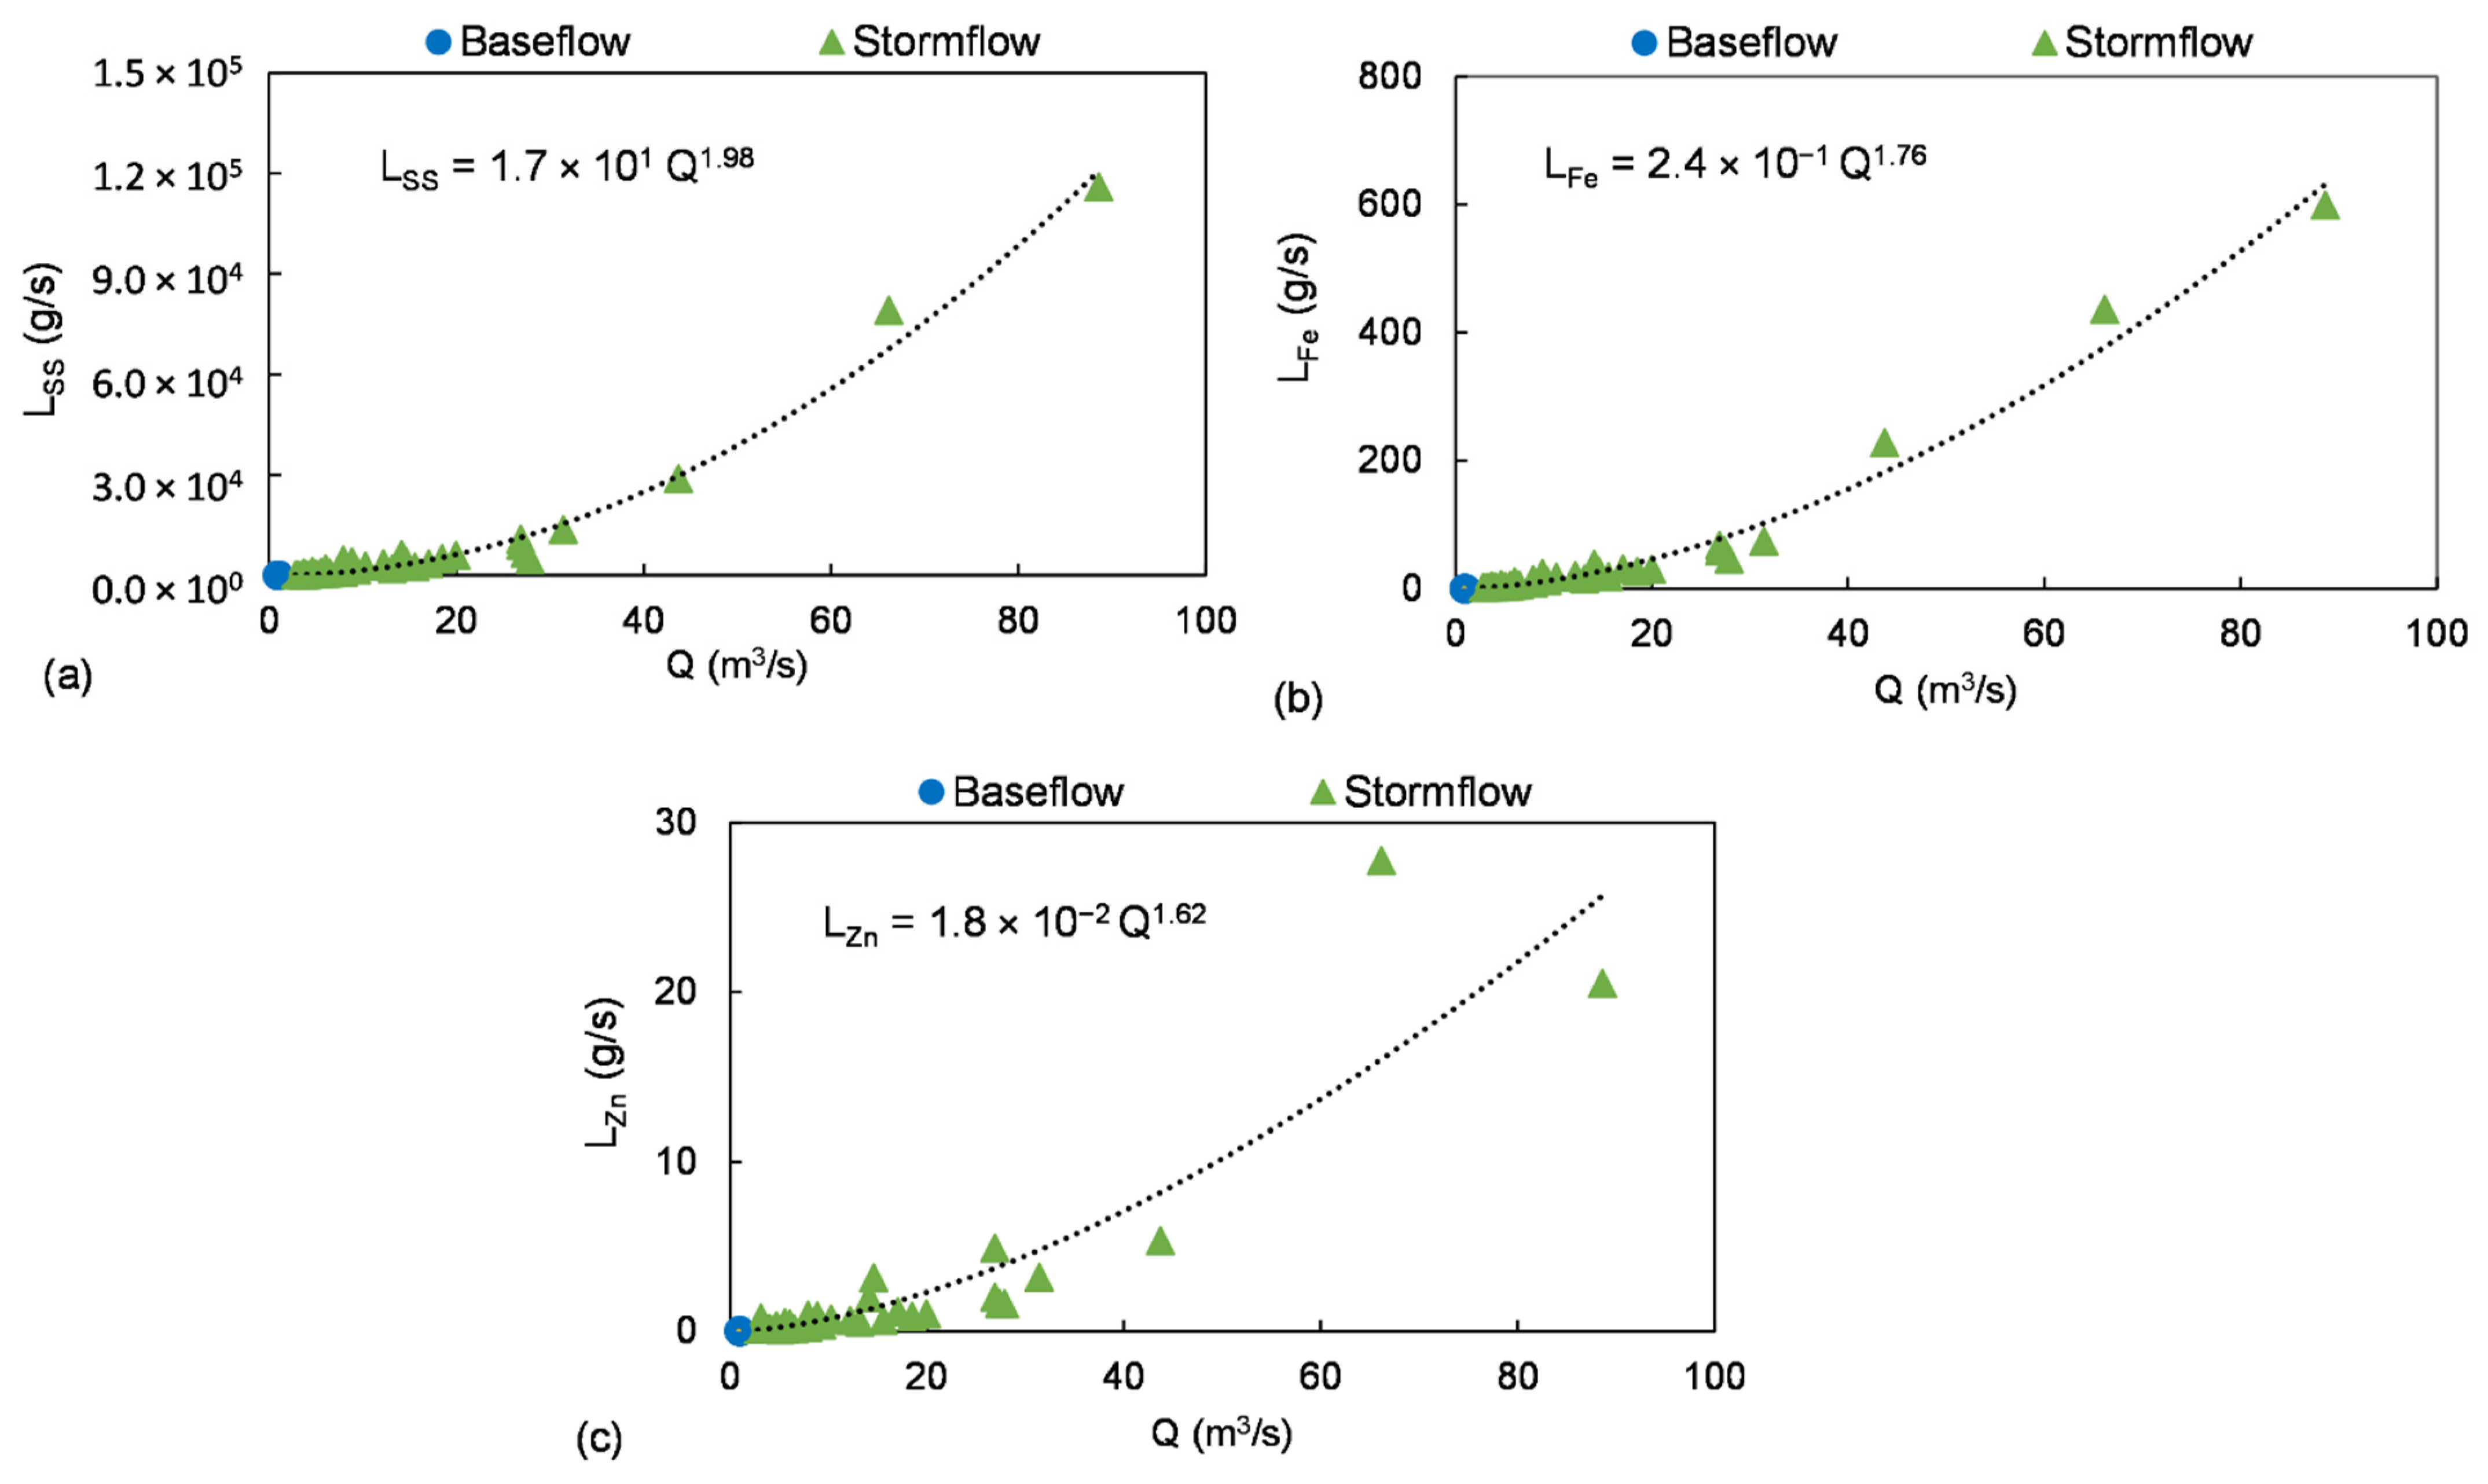
3.3. Daily Loads of Suspended Solids, Iron, and Zinc

The total loadings of SS, Fe, and Zn in the baseflow and stormflow during the sampling event were calculated. Table 1 presents the daily load of each parameter in both events. The daily flux in the baseflow was 2.4 × 101 t/day for SS, 2.8 × 10⁻¹ t/day for Fe, and 4.7 × 10⁻² t/day for Zn. The total loadings in the stormflow were much higher for SS, Fe, and Zn (1.7 × 10⁴ t/day, 9.8 × 101 t/day, and 4.4 t/day, respectively).
The ratio of loads in the baseflow and stormflow (Table 1) indicate evidence that there were different load magnitudes between the two flows, in which the fluxes during the stormflow were much higher than those during the baseflow, particularly for SS. The ratio of SS was 692, indicating that the fluxes were almost 700 times higher than those in the baseflow with the discharge mean ratio of 15. However, the ratios of the Fe (350) and Zn (93) loadings were much lower than the SS ratio. The Fe ratio in the present study comprised dissolved and particulate fractions. When the flow regime shifted to high flow (stormflow), the dissolved Fe remained the same, but its particulate form increased following the SS input. Thus, the SS ratio was almost two-fold higher than the Fe ratio.
Fe and Zn were likely diluted among the relatively unpolluted particulate matters and water discharging into the river. Previous research also observed the dilution effect at the stormflow in which the concentration of the metal carried in solution and bound to the SS decreased because of mixing with relatively clean sediment and water [46,47]. The extent and length of the dry period might have been long enough for SS, Zn, and Fe to build up in the watershed area. This buildup would particularly occur in the impervious surfaces of the urban area comprising 29.6% of land use in the Umeda River watershed. The Zn flux ratio was only 93, demonstrating that Zn was more diluted than Fe. This finding is also supported by the lower concentration of Zn at the last discharge peak that was observed during the end of the storm period.
The end member mixing analysis (EMMA) was applied to estimate the Zn point source (PS) and non-point or diffuse source (NPS) contribution using Equations (2) and (3). The ratio of Zn ( stormflow baseflow ) from PS, as indicated by R Zn _ PS , was 1 because the Zn concentrations from PS remained relatively similar in both the baseflow and the stormflow. In this case, the ratio of Zn from non-point sources ( R Zn _ NPS ) was the same as the Fe ratio (i.e., 350) and the total ratio of Zn was equal to 93 (see Table 1). This calculation reveals that the fraction from the PS reached 74%, whereas the NPS fraction was only 26%. The Zn released from PS was approximately three-fold higher than that from NPS. Zn discharge during the stormflow was 93 times higher than that during the baseflow, where the primary sources were PS that accounted for approximately 3.2 t/day. NPS contributed approximately 1.2 t/day in the stormflow.
It should be noted that the total number of water samples used in this study was 139. In terms of statistical analysis, the sample number is adequate. However, the high-resolution temporal samplings of each event (baseflow and stormflow) could be repeated in the future study to strengthen the evidence.
This study demonstrates that it is necessary to manage the river both for point and non-point Zn sources so that Zn released into the river water will not harm aquatic organisms. The Zn input from NPS was higher during the stormflow; thus, the stormwater runoff from human activities should be appropriately controlled. In the stormflow, the particulate fraction was much higher than the dissolved fraction. Zn particulates may originate from both human activities and natural sources. A potential anthropogenic diffuse source is tire wear particles that may be highly bioavailable [59]. Other particulates could be released from agricultural areas (the majority of the land-use around the Umeda River) and from atmospheric deposition. It is also possible that the resuspension of Zn-contaminated riverbed sediment occurred. Some Zn input may come from the natural weathering process of the river catchment [69]. Monitoring of particulate discharge released into the river is required to prevent extremely high levels of particulate Zn. One possible way of controlling this discharge is an infiltration-based system of stormwater control [70].
The baseflow survey indicated that the nighttime concentrations were higher, so this should be considered in the monitoring procedures. The toxicity of Zn increases along with higher fractions of dissolved Zn, particularly ZnCl2 [59,71]. Wastewater treatment is undoubtedly essential to maintain Zn levels below the National Effluent Standards (NES) of 2.0 mg/L. Based on previous research, the yearly wastewaters discharged to the tributary (the Sakai River) of the Umeda River were all below the NES, but the riverine Zn concentrations in the downstream section remained remarkably high during the winter season when the river discharges were relatively low [32]. Therefore, the Zn fluxes released from PS (particularly anthropogenic sources such as industrial facilities) should also be appropriately managed.

4. Conclusions

This study outlines Zn source apportionment (i.e., point sources and non-point sources) by comparing measurement results in the baseflow and the stormflow. Both surveys were undertaken by high-resolution temporal sampling during a sunny day (the baseflow) and during a rainy event (the stormflow). The results revealed that in the baseflow, the primary sources were point sources, whereas in the stormflow, diffuse (non-point) sources were responsible for the extremely high concentrations of Zn in the Umeda River. Zn levels, mainly in particulate form, remained high even after the highest peak discharge occurred, indicating that diffuse Zn sources may be abundant in the catchment. However, compared with SS and Fe, the Zn were potentially more diluted, and its source was exhausted at the end of storm event.
In the present study, Fe in the baseflow and stormflow was primarily released from natural non-point sources. Using a simple end member mixing analysis with two tracers (Zn from point source and non-point source), approximately 74% of the Zn loads came from point sources and the rest originated from non-point sources. The amount of Zn from point sources outweighed the Zn input from non-point sources. River management can be improved if Zn point sources are adequately treated and managed. During a storm event, it is also important to control the particulate Zn released into the river.

Author Contributions

Conceptualization, P.A., K.Y. and T.I.; methodology, P.A., H.A., S.O., K.Y., T.I. and M.N.N.; software, P.A. and H.A.; validation, P.A., K.Y., T.I. and M.N.N.; formal analysis, P.A., K.Y. and T.I.; investigation, P.A., H.A., S.O., K.Y., T.I. and M.N.N.; resources, K.Y. and T.I.; data curation, P.A., H.A. and S.O.; writing—original draft preparation, P.A. and H.A.; writing—review and editing, P.A., H.A., K.Y., T.I. and M.N.N.; visualization, P.A. and H.A.; supervision, K.Y., T.I. and M.N.N.; project administration, K.Y. and T.I.; funding acquisition, K.Y. and T.I. All authors have read and agreed to the published version of the manuscript.

Funding

This study was funded by the Research Institute for Technological Science and Innovation (RITI) of Toyohashi University of Technology, Japan.

Institutional Review Board Statement

Not applicable.

Informed Consent Statement

Not applicable.

Data Availability Statement

The authors confirm that the data supporting the findings of this study are available within the article.

Acknowledgments

The authors are thankful to the Research Institute for Technological Science and Innovation (RITI) of Toyohashi University of Technology, Japan, for financial support. The authors would like to sincerely thank Widyastuti Kusuma and Ryosuke Suzuki for their assistance in performing the field survey. We are grateful for the data provided by the ALOS-2/ALOS Science Project from Japan Aerospace Exploration Agency (2021) and the digital elevation model by ESRI Japan. The first author sincerely thanks the Japanese Ministry of Education, Culture, Sports, Science and Technology (MEXT) for the doctoral scholarship.

Conflicts of Interest

The authors declare no conflict of interest.

References

  1. Dalai, T.K.; Rengarajan, R.; Patel, P.P. Sediment geochemistry of the Yamuna River System in the Himalaya: Implications to weathering and transport. Geochem. J. 2004, 38, 441–453. [Google Scholar] [CrossRef]
  2. International Zinc Association Zinc in the Environment: An Introduction. Available online: https://www.zinc.org/wp-content/uploads/sites/4/2015/01/Zinc-in-the-Environment-Understanding-the-Science_web.pdf (accessed on 2 February 2021).
  3. Jain, C.K.; Singhal, D.C.; Sharma, M.K. Adsorption of zinc on bed sediment of River Hindon: Adsorption models and kinetics. J. Hazard. Mater. 2004, 114, 231–239. [Google Scholar] [CrossRef] [PubMed]
  4. Richardson, G.M.; Garrett, R.; Mitchell, I.; Mah-Poulson, M.; Hackbarth, T. Critical Review on Natural Global and Regional Emissions of Six Trace Metals to the Atmosphere; Risklogic Scientific Services, Inc.: Ottawa, ON, Canada, 2001; Available online: https://www.echa.europa.eu/documents/10162/13630/vrar_appendix_p2_en.pdf (accessed on 2 February 2021).
  5. Nicolau, R.; Lucas, Y.; Merdy, P.; Raynaud, M. Base flow and stormwater net fluxes of carbon and trace metals to the Mediterranean sea by an urbanized small river. Water Res. 2012, 46, 6625–6637. [Google Scholar] [CrossRef]
  6. Gozzard, E.; Mayes, W.M.; Potter, H.A.B.; Jarvis, A.P. Seasonal and spatial variation of diffuse (non-point) source zinc pollution in a historically metal mined river catchment, UK. Environ. Pollut. 2011, 159, 3113–3122. [Google Scholar] [CrossRef] [PubMed]
  7. Rudall, S.; Jarvis, A.P. Diurnal fluctuation of zinc concentration in metal polluted rivers and its potential impact on water quality and flux estimates. Water Sci. Technol. 2012, 65, 164–170. [Google Scholar] [CrossRef]
  8. Desaulty, A.M.; Petelet-Giraud, E. Zinc isotope composition as a tool for tracing sources and fate of metal contaminants in rivers. Sci. Total Environ. 2020, 728, 138599. [Google Scholar] [CrossRef] [PubMed]
  9. Wahaab, R.A.; Alseroury, F.A. Wastewater treatment: A case study of electronics manufacturing industry. Int. J. Environ. Sci. Technol. 2019, 16, 47–58. [Google Scholar] [CrossRef]
  10. Zhang, J.; Hua, P.; Krebs, P. The chemical fractionation and potential source identification of Cu, Zn and Cd on urban watershed. Water Sci. Technol. 2015, 72, 1428–1436. [Google Scholar] [CrossRef]
  11. Mansoorian, H.J.; Mahvi, A.H.; Jafari, A.J. Removal of lead and zinc from battery industry wastewater using electrocoagulation process: Influence of direct and alternating current by using iron and stainless steel rod electrodes. Sep. Purif. Technol. 2014, 135, 165–175. [Google Scholar] [CrossRef]
  12. Hein, M.S. Copper deficiency anemia and nephrosis in zinc-toxicity: A case report. S. D. J. Med. 2003, 56, 143–147. [Google Scholar]
  13. Gyorffy, E.J.; Chan, H. Copper deficiency and microcytic anemia resulting from prolonged ingestion of over-the-counter zinc. Am. J. Gastroenterol. 1992, 87, 1054–1055. [Google Scholar] [PubMed]
  14. Hatakeyama, S. Effect of copper and zinc on the growth and emergence of Epeorus latifolium (Ephemeroptera) in an indoor model stream. Hydrobiologia 1989, 174, 17–27. [Google Scholar] [CrossRef]
  15. Bhatti, S.S.; Sambyal, V.; Nagpal, A.K. Analysis of Genotoxicity of Agricultural Soils and Metal (Fe, Mn, and Zn) Accumulation in Crops. Int. J. Environ. Res. 2018, 12, 439–449. [Google Scholar] [CrossRef]
  16. Tsushima, K.; Naito, W.; Kamo, M. Assessing ecological risk of zinc in Japan using organism- and population-level species sensitivity distributions. Chemosphere 2010, 80, 563–569. [Google Scholar] [CrossRef]
  17. Itahashi, S.; Kasuya, M.; Suzuki, R.; Abe, K.; Banzai, K. Assessment of potential risk to aquatic organisms by zinc originating from swine farm effluent in a rural area of Japan. Jpn. Agric. Res. Q. 2014, 48, 291–298. [Google Scholar] [CrossRef] [Green Version]
  18. Water Framework Directive. The River Basin Districts Typology, Standards and Groundwater Threshold Values (Water Framework Directive) (England and Wales) Directions. 2010. Available online: https://gov.wales/sites/default/files/publications/2019-07/100804direct38.pdf (accessed on 2 February 2021).
  19. Comber, S.D.W.; Merrington, G.; Sturdy, L.; Delbeke, K.; van Assche, F. Copper and zinc water quality standards under the EU Water Framework Directive: The use of a tiered approach to estimate the levels of failure. Sci. Total Environ. 2008, 403, 12–22. [Google Scholar] [CrossRef]
  20. Heijerick, D.G.; De Schamphelaere, K.A.C.; Janssen, C.R. Predicting acute zinc toxicity for Daphnia magna as a function of key water chemistry characteristics: Development and validation of a biotic ligand model. Environ. Toxicol. Chem. 2002, 21, 1309–1315. [Google Scholar] [CrossRef]
  21. Ministry of Environment of Japan. Public Water Quality Measurement Results in 2020, Japan. 2021. Available online: https://www.env.go.jp/water/suiiki/r1/r1-1_r2.pdf (accessed on 27 July 2021).
  22. Miller, C.V.; Foster, G.D.; Majedi, B.F. Baseflow and stormflow metal fluxes from two small agricultural catchments in the Coastal Plain of the Chesapeake Bay Basin, United States. Appl. Geochem. 2003, 18, 483–501. [Google Scholar] [CrossRef]
  23. Rothwell, J.J.; Evans, M.G.; Daniels, S.M.; Allott, T.E.H. Baseflow and stormflow metal concentrations in streams draining contaminated peat moorlands in the Peak District National Park (UK). J. Hydrol. 2007, 341, 90–104. [Google Scholar] [CrossRef]
  24. Rose, S.; Shea, J.A. Chapter 6 Environmental geochemistry of trace metal pollution in urban watersheds. Dev. Environ. Sci. 2007, 5, 99–131. [Google Scholar] [CrossRef]
  25. Behrendt, H. Separation of point and diffuse loads of pollutants using monitoring data of rivers. Water Sci. Technol. 1993, 28, 165–175. [Google Scholar] [CrossRef]
  26. Ciszewski, D.; Grygar, T.M. A Review of Flood-Related Storage and Remobilization of Heavy Metal Pollutants in River Systems. Water. Air. Soil Pollut. 2016, 227, 239. [Google Scholar] [CrossRef] [Green Version]
  27. Barber, L.B.; Paschke, S.S.; Battaglin, W.A.; Douville, C.; Fitzgerald, K.C.; Keefe, S.H.; Roth, D.A.; Vajda, A.M. Effects of an Extreme Flood on Trace Elements in River Water—From Urban Stream to Major River Basin. Environ. Sci. Technol. 2017, 51, 10344–10356. [Google Scholar] [CrossRef]
  28. Byrne, P.; Onnis, P.; Runkel, R.L.; Frau, I.; Lynch, S.F.L.; Edwards, P. Critical Shifts in Trace Metal Transport and Remediation Performance under Future Low River Flows. Environ. Sci. Technol. 2020, 54, 15742–15750. [Google Scholar] [CrossRef] [PubMed]
  29. Mayes, W.M.; Perks, M.T.; Large, A.R.G.; Davis, J.E.; Gandy, C.J.; Orme, P.A.H.; Jarvis, A.P. Effect of an extreme flood event on solute transport and resilience of a mine water treatment system in a mineralised catchment. Sci. Total Environ. 2021, 750, 141693. [Google Scholar] [CrossRef] [PubMed]
  30. Andarani, P.; Yokota, K.; Saga, M.; Inoue, T.; Matsumoto, Y. Study of zinc pollution in river water: Average mass balance based on irrigation schedule. River Res. Appl. 2020, 36, 1286–1295. [Google Scholar] [CrossRef]
  31. Nguyen, T.H.; Helm, B.; Hettiarachchi, H.; Caucci, S.; Krebs, P. Quantifying the information content of a water quality monitoring network using principal component analysis: A case study of the freiberger mulde river basin, Germany. Water 2020, 12, 420. [Google Scholar] [CrossRef] [Green Version]
  32. Andarani, P.; Alimuddin, H.; Suzuki, R.; Yokota, K.; Inoue, T. Zinc contamination in surface water of the Umeda River, Japan. IOP Conf. Ser. Earth Environ. Sci. 2021, 623, 012064. [Google Scholar] [CrossRef]
  33. Japan Meteorological Agency Past Weather Data in Toyohashi City, Aichi Prefecture. Available online: https://www.data.jma.go.jp/obd/stats/etrn/index.php?prec_no=51&block_no=0470&year=2008&month=12&day=&view=p1 (accessed on 27 July 2021).
  34. Kanda, T.; Takata, Y.; Kohyama, K.; Ohkura, T.; Maejima, Y.; Wakabayashi, S.; Obara, H. New soil maps of Japan based on the comprehensive soil classification system of Japan—First approximation and its application to the world reference base for soil resources 2006. Jpn. Agric. Res. Q. 2018, 52, 285–292. [Google Scholar] [CrossRef] [Green Version]
  35. Matsuyama, N.; Saigusa, M.; Abe, T. Distributions of Allophanic Andosols and Nonallophanic Andosols in Kanto and Chubu Districts. Jpn. J. Soil Sci. Plant Nutr. 1994, 65, 304–312. [Google Scholar] [CrossRef]
  36. Kögel-Knabner, I.; Amelung, W. 12.7—Dynamics, Chemistry, and Preservation of Organic Matter in Soils. In Treatise on Geochemistry, 2nd ed.; Holland, H.D., Turekian, K.K., Eds.; Elsevier: Oxford, UK, 2014; pp. 157–215. [Google Scholar]
  37. Levard, C.; Basile-Doelsch, I. Chapter 3—Geology and Mineralogy of Imogolite-Type Materials. In Nanosized Tubular Clay Minerals; Yuan, P., Thill, A., Bergaya, F., Eds.; Developments in Clay Science; Elsevier: Amsterdam, The Netherlands, 2016; Volume 7, pp. 49–65. [Google Scholar]
  38. The Editors of Encyclopaedia Britannica. Acrisol. Available online: https://www.britannica.com/science/Acrisol (accessed on 27 July 2021).
  39. Driessen, P.; Deckers, J. Mineral Soils Conditioned by Limited Age. Available online: http://www.fao.org/3/Y1899E/y1899e08.htm#P2_46 (accessed on 27 July 2021).
  40. Geological Survey of Japan 1/50,000 Geological Map of Japan. 2021. Available online: https://gbank.gsj.jp/geonavi/geonavi.php#13,34.73110,137.46215 (accessed on 27 July 2021).
  41. Yokota, K.; Inoue, T.; Yokokawa, M.; Shimoyama, R.; Okubo, Y. Evaluation of nitrogen and phosphorus runoff load in rivers based on high-frequency surveys. Environ. Sci. 2013, 26, 140. (In Japanese) [Google Scholar]
  42. Kunimatsu, T.; Otomori, T.; Osaka, K.; Hamabata, E.; Komai, Y. Evaluation of nutrient loads from a mountain forest including storm runoff loads. Water Sci. Technol. 2006, 53, 79–91. [Google Scholar] [CrossRef]
  43. Levenberg, K.; Arsenal, F. A Method for the Solution of Certain Non-Linear Problems in Least Squares. Q. Appl. Math. 1943, 1, 536–538. [Google Scholar] [CrossRef] [Green Version]
  44. Marquardt, D.W. An Algorithm for Least-Squares Estimation of Nonlinear Parameters. J. Soc. Ind. Appl. Math. 1963, 11, 431–441. [Google Scholar] [CrossRef]
  45. Barthold, F.K.; Tyralla, C.; Schneider, K.; Vaché, K.B.; Frede, H.G.; Breuer, L. How many tracers do we need for end member mixing analysis (EMMA)? A sensitivity analysis. Water Resour. Res. 2011, 47, 1–14. [Google Scholar] [CrossRef]
  46. Dawson, E.J.; Macklin, M.G. Speciation of heavy metals on suspended sediment under high flow conditions in the River Aire, West Yorkshire, UK. Hydrol. Process. 1998, 12, 1483–1494. [Google Scholar] [CrossRef]
  47. Bradley, S.B.; Lewin, J. Transport of heavy metals on suspended sediments under high flow conditions in a mineralised region of wales. Environ. Pollution. Ser. B Chem. Phys. 1982, 4, 257–267. [Google Scholar] [CrossRef]
  48. He, W.; Odnevall Wallinder, I.; Leygraf, C. A laboratory study of copper and zinc runoff during first flush and steady-state conditions. Corros. Sci. 2001, 43, 127–146. [Google Scholar] [CrossRef]
  49. Sakata, M.; Marumoto, K. Dry Deposition Fluxes and Deposition Velocities of Trace Metals in the Tokyo Metropolitan Area Measured with a Water Surface Sampler. Environ. Sci. Technol. 2004, 38, 2190–2197. [Google Scholar] [CrossRef] [PubMed]
  50. Sakata, M.; Narukawa, M.; Marumoto, K. Atmospheric and Riverine Inputs of Trace Substances to Tokyo Bay. 2005. Available online: https://criepi.denken.or.jp/jp/kenkikaku/report/detail/V04016.html (accessed on 2 February 2021).
  51. Naito, W.; Kamo, M.; Tsushima, K.; Iwasaki, Y. Exposure and risk assessment of zinc in Japanese surface waters. Sci. Total Environ. 2010, 408, 4271–4284. [Google Scholar] [CrossRef]
  52. Ke, X.; Gui, S.; Huang, H.; Zhang, H.; Wang, C.; Guo, W. Ecological risk assessment and source identification for heavy metals in surface sediment from the Liaohe River protected area, China. Chemosphere 2017, 175, 473–481. [Google Scholar] [CrossRef] [PubMed]
  53. Sage, J.; El Oreibi, E.; Saad, M.; Gromaire, M.C. Modeling the temporal variability of zinc concentrations in zinc roof runoff—experimental study and uncertainty analysis. Environ. Sci. Pollut. Res. 2016, 23, 16552–16566. [Google Scholar] [CrossRef] [Green Version]
  54. Gromaire-Mertz, M.C.; Garnaud, S.; Gonzalez, A.; Chebbo, G. Characterisation of urban runoff pollution in Paris. Water Sci. Technol. 1999, 39, 1–8. [Google Scholar] [CrossRef]
  55. Sakson, G.; Brzezinska, A.; Zawilski, M. Emission of heavy metals from an urban catchment into receiving water and possibility of its limitation on the example of Lodz city. Environ. Monit. Assess. 2018, 190, 281. [Google Scholar] [CrossRef] [PubMed] [Green Version]
  56. Legret, M.; Pagotto, C. Evaluation of pollutant loadings in the runoff waters from a major rural highway. Sci. Total Environ. 1999, 235, 143–150. [Google Scholar] [CrossRef]
  57. Hjortenkrans, D.; Bergbäck, B.; Häggerud, A. New metal emission patterns in road traffic environments. Environ. Monit. Assess. 2006, 117, 85–98. [Google Scholar] [CrossRef]
  58. Degaffe, F.S.; Turner, A. Leaching of zinc from tire wear particles under simulated estuarine conditions. Chemosphere 2011, 85, 738–743. [Google Scholar] [CrossRef] [PubMed]
  59. Wagner, S.; Hüffer, T.; Klöckner, P.; Wehrhahn, M.; Hofmann, T.; Reemtsma, T. Tire wear particles in the aquatic—A review on generation, analysis, occurrence, fate and effects. Water Res. 2018, 139, 83–100. [Google Scholar] [CrossRef]
  60. Le Floch, M.; Noack, Y.; Robin, D. Emission sources identification in a vinicity of the municipal solid waste incinerator of Toulon in the South of France. J. Phys. IV Fr. 2003, 107, 727–730. [Google Scholar] [CrossRef]
  61. Singh, A.K.; Hasnain, S.I.; Banerjee, D.K. Grain size and geochemical partitioning of heavy metals in sediments of the Damodar River—A tributary of the lower Ganga, India. Environ. Geol. 1999, 39, 90–98. [Google Scholar] [CrossRef]
  62. Mishima, S.I.; Taniguchi, S.; Kawasaki, A.; Komada, M. Estimation of Zinc and Copper Balance in Japanese Farmland Soil Associated with the Application of Chemical Fertilizers and Livestock Excreta. Soil Sci. Plant. Nutr. 2005, 51, 437–442. [Google Scholar] [CrossRef]
  63. Li, Z.H.; Li, Z.P.; Tang, X.; Hou, W.H.; Li, P. Distribution and risk assessment of toxic pollutants in surface water of the lower yellow river, China. Water 2021, 13, 1582. [Google Scholar] [CrossRef]
  64. Rose, S.; Crean, M.S.; Sheheen, D.K.; Ghazi, A.M. Comparative zinc dynamics in Atlanta metropolitan region stream and street runoff. Environ. Geol. 2001, 40, 983–992. [Google Scholar] [CrossRef]
  65. Dali-youcef, N.; Ouddane, B.; Derriche, Z. Adsorption of zinc on natural sediment of Tafna River (Algeria). J. Hazard. Mater. 2006, 137, 1263–1270. [Google Scholar] [CrossRef] [PubMed]
  66. Nimick, D.A.; Gammons, C.H.; Parker, S.R. Diel biogeochemical processes and their effect on the aqueous chemistry of streams: A review. Chem. Geol. 2011, 283, 3–17. [Google Scholar] [CrossRef]
  67. Gammons, C.H.; Nimick, D.A.; Parker, S.R. Diel cycling of trace elements in streams draining mineralized areas—A review. Appl. Geochem. 2015, 57, 35–44. [Google Scholar] [CrossRef]
  68. Yamada, T.; Inoue, T.; Tsushima, K.; Nagai, M.; Kiso, Y. Nutrient Loss from a Tea Plantation Area in Japan. J. Water Environ. Technol. 2009, 7, 331–340. [Google Scholar] [CrossRef] [Green Version]
  69. Chu, X.; Wang, H.; Zheng, F.; Huang, C.; Xu, C.; Wu, D. Spatial Distribution Characteristics and Sources of Nutrients and Heavy Metals in the Xiujiang River of Poyang Lake Basin in the Dry Season. Water 2021, 13, 1654. [Google Scholar] [CrossRef]
  70. Behroozi, A.; Arora, M.; Fletcher, T.D.; Western, A.W.; Costelloe, J.F. Understanding the Impact of Soil Clay Mineralogy on the Adsorption Behavior of Zinc. Int. J. Environ. Res. 2021. [Google Scholar] [CrossRef]
  71. Pagano, M.; Porcino, C.; Briglia, M.; Fiorino, E.; Vazzana, M.; Silvestro, S.; Faggio, C. The Influence of Exposure of Cadmium Chloride and Zinc Chloride on Haemolymph and Digestive Gland Cells from Mytilus galloprovincialis. Int. J. Environ. Res. 2017, 11, 207–216. [Google Scholar] [CrossRef]
Figure 1. The study site of the Umeda River catchment.
Water 13 02113 g001
Figure 2. Scatterplot of water levels (H) and river discharges (Q) of the H-Q curve in the baseflow and stormflow.
Water 13 02113 g002
Figure 3. Temporal variation of: (a) SS; (b) Fe; (c) Zn in the baseflow over 25 h (50 samples). The shaded areas represent the nighttime. Error bars denote standard deviations.
Water 13 02113 g003
Figure 4. Temporal variation of (a) SS; (b) Fe; (c) Zn in the stormflow over 42 h (39 samples). Shaded areas represent the nighttime. Error bars denote standard deviations.
Water 13 02113 g004
Figure 5. Scatter plots and correlations among parameters: (a) SS–Zn; (b) SS–Fe; (c) Zn–Fe.
Water 13 02113 g005
Figure 6. Scatter plots and non-linear regression between river discharges (Q) and load (L) equations: (a) SS; (b) Fe; (c) Zn.
Water 13 02113 g006
Table 1. Total daily load of suspended solids (SS), Fe, and Zn.
Q (m3/day)SS (t/day)Fe (t/day)Zn (t/day)
Baseflow8.4 × 1042.4 × 1012.8 × 10−14.7 × 10⁻²
Stormflow1.3 × 1061.7 × 1049.8 × 1014.4
Stormflow Baseflow 1569235093
Publisher’s Note: MDPI stays neutral with regard to jurisdictional claims in published maps and institutional affiliations.

