
Assessing the Uncertainty of Hydropower-Environmental Conflict-Resolution Management under Climate Change


1
Bureau of Hydrology, Changjiang Water Resources Commission, Wuhan 430010, China
2
Changjiang Institute of Survey, Planning, Design and Research, Wuhan 430010, China
*
Author to whom correspondence should be addressed.
Water 2021, 13(15), 2114; https://doi.org/10.3390/w13152114
Submission received: 17 May 2021
/
Revised: 12 July 2021
/
Accepted: 28 July 2021
/
Published: 31 July 2021
(This article belongs to the Section Water and Climate Change)
Abstract
:To balance the water demands of different departments and produce a win–win result for reservoir operation, a series of conflict-resolution methods have been developed to define the socio-optimal operation strategy for specific conflict problems. However, given the inherent uncertainty of reservoir operation brought by climate change, the compromised strategies selected by conflict-resolution methods can vary. Therefore, quantifying the impacts of climate change on the decision characteristics of conflict-resolution methods can help to address questions about whether conflict-resolution decisions are sustainable given unforeseen changes. In this study, the Yangtze River is regarded as study area. As a world-class hydropower project located on the midstream of Yangtze River, Three Gorges Hydroelectric Power Station can transfer plenty of water energy into electricity. To alleviate the ecological water shortage caused by hydropower operation, sustainable and balanced operation strategies considering the water demands of two departments needs to be studied. In the context of hydropower-environmental conflict-resolution management, the decision behaviors of two fuzzy social choice methods and four game-theoretical bargaining methods under 25 kinds of future climate scenarios are analyzed. Comparing the strategy selection results of different methods for a future period (2021–2082) shows that in all proposed climate scenarios, the decisions of the Nash bargaining method, alternating offer method, and unanimity fallback bargaining method in game-theoretical bargaining methods are more stable than other studied methods, which means that climate change affects the decision behaviors of these three methods slightly. In addition, balanced strategies selected by these three methods could formulate adaptable reservoir operation policies that would satisfy the interests of hydropower and environmental stakeholders equally, and avoid a very low satisfaction level of individual stakeholder and whole stakeholders in the water-conflict year. Therefore, against the background of an increasing demand for environmental protection, these three methods can provide socio-optimal strategies considering social and economic benefits for water resource management.
1. Introduction
Water resources can produce great economic and environmental benefits for stakeholders. Given the commonality and limitation of water resources, when the benefits obtained from water use are greater than the use cost, water resources will be seriously consumed, or even exhausted, which can be described as “the tragedy of the commons” [1]. In order to balance the resource protection and economic development, it is important to establish sustainable water resource management. As part of the infrastructure, reservoirs play an indispensable role in water resource reallocation. Due to limited water resources, the policy of single-objective reservoir operation cannot satisfy the water demands of departments with conflicting interests and positions. Therefore, integrating the water demands of different departments into reservoir operation is critical for sustainable water resource management [2]. By optimizing the multi-objective reservoir model, a series of non-dominated operation strategies can be obtained. To balance the water demands of conflicting departments and produce a positive win–win result, formal conflict methodologies and techniques have been established to select a compromise among the possible strategies.
These conflict-resolution methods are usually derived from social choice theory and game theory. Social choice theory is used to analyze the relationship between individual preference and collective decision, and develop a methodology that can fairly sort different social statuses [3]. Social choice methods include several methods, such as Borda counting [4], approval voting [5] and plurality voting [6] methods. Game theory is used to study the predicted and actual behavior of stakeholders, and define the equilibrium strategy for the game [7]. Game-theoretical bargaining methods include several methods, such as Nash bargaining [8], Rubinstein bargaining [9], and fallback bargaining [10] methods. Due to the different decision theories, the socio-optimal strategies selected by these methods for the same dispute may be different. Therefore, it is necessary to define the appropriate conflict-resolution method for the specific conflict problem [11].
The prerequisite for defining the appropriate method to solve the specific conflict problem is to analyze the decision characteristics of conflict-resolution methods, studies of which are limited. Kant and Lee compared several social choice methods and indicated that the multi-group social choice method, which orders social states without considering monetary measures or market-orientation, can accommodate all stakeholders’ preferences, or address inter-group distributional issues [12]. Alizadeh et al. found that four social choice methods and two fallback bargaining methods could effectively resolve conflicts that arose from groundwater management, which resulted in reduced groundwater exploitation and an increased water level [13]. Xu et al. (2019) investigated the decision-tendencies of fuzzy social choice methods, which are extensions of social choice methods and consider uncertainty in the decision behaviors of stakeholders [14], and game-theoretical bargaining methods for conflict resolution in multi-objective reservoir operation, and indicated that the decisions of game-theoretical bargaining methods were more stable than those of fuzzy social choice methods [15]. Although the decision characteristics of social choice methods and game-theoretical bargaining methods were analyzed in those studies, they assumed the available quantity of water resources based on a single predetermined climate scenario, without considering various climate change scenarios.
Climate change is an important factor that influences the hydrological cycle, which affects runoff by changing precipitation and evaporation [16,17,18], and results in different water-conflict scenarios [19]. Given the uncertainties in climate scenarios, reservoir operation, which is highly dependent on the timing and magnitude of inflow, includes inherent uncertainty [20], and the compromises selected by conflict-resolution methods from possible operation strategies may vary. Uncertainty analysis of the selection behaviors of conflict-resolution methods can help to address questions about whether conflict-resolution decisions are sustainable given unforeseen changes, based on which the government can formulate adaptable policies to establish sustainable water resource management for the future [21]. Therefore, to better address conflict resolution for water resource management, it is necessary to quantify the impacts of uncertainty brought by climate change on the decision characteristics of conflict-resolution methods.
In order to achieve this goal, the uncertainty of future climate simulations based on 25 GCMs was taken into account, based on which the decision behaviors of two fuzzy social choice methods and four game-theoretical bargaining methods were analyzed. In this study, the Three Gorges Hydroelectric Power Station was selected as the study area. As this is an engineering project with multiple operation objectives, its operation policy needs to satisfy the water demands of multiple departments that have different, or even conflicting, interests. For instance, due to improved hydropower generation, the reservoir discharge is usually reduced to raise the water level, and the reduced discharge can threaten the ecological environment [22,23]. To analyze the decision characteristics of conflict-resolution methods under various climate scenarios, a multi-objective reservoir operation model considering hydropower generation and environmental protection was established, and two fuzzy social choice methods and four game-theoretical bargaining methods were used to select the socio-optimal strategies. By analyzing the satisfied degree of two departments related to the selected strategies under the different climate scenarios, the impacts of climate change on the decisions of the conflict-resolution methods can be quantified.
This paper furthers the study of Xu et al. [15], and the main innovation is to quantify the impact of uncertainty induced by climate change on the decision behaviors of conflict-resolution methods. The paper is organized as follows: Section 2 introduces the methodology, including the prediction of reservoir inflows under different climate scenarios, the establishment of the multi-objective optimization model, and the resolution of the water conflict between hydropower generation and environmental protection. Section 3 introduces the study area and data, including meteorological and inflow data. Section 4 presents the analyses of decision characteristics of conflict-resolution methods considering the uncertainties of climate change.
2. Materials and Methods
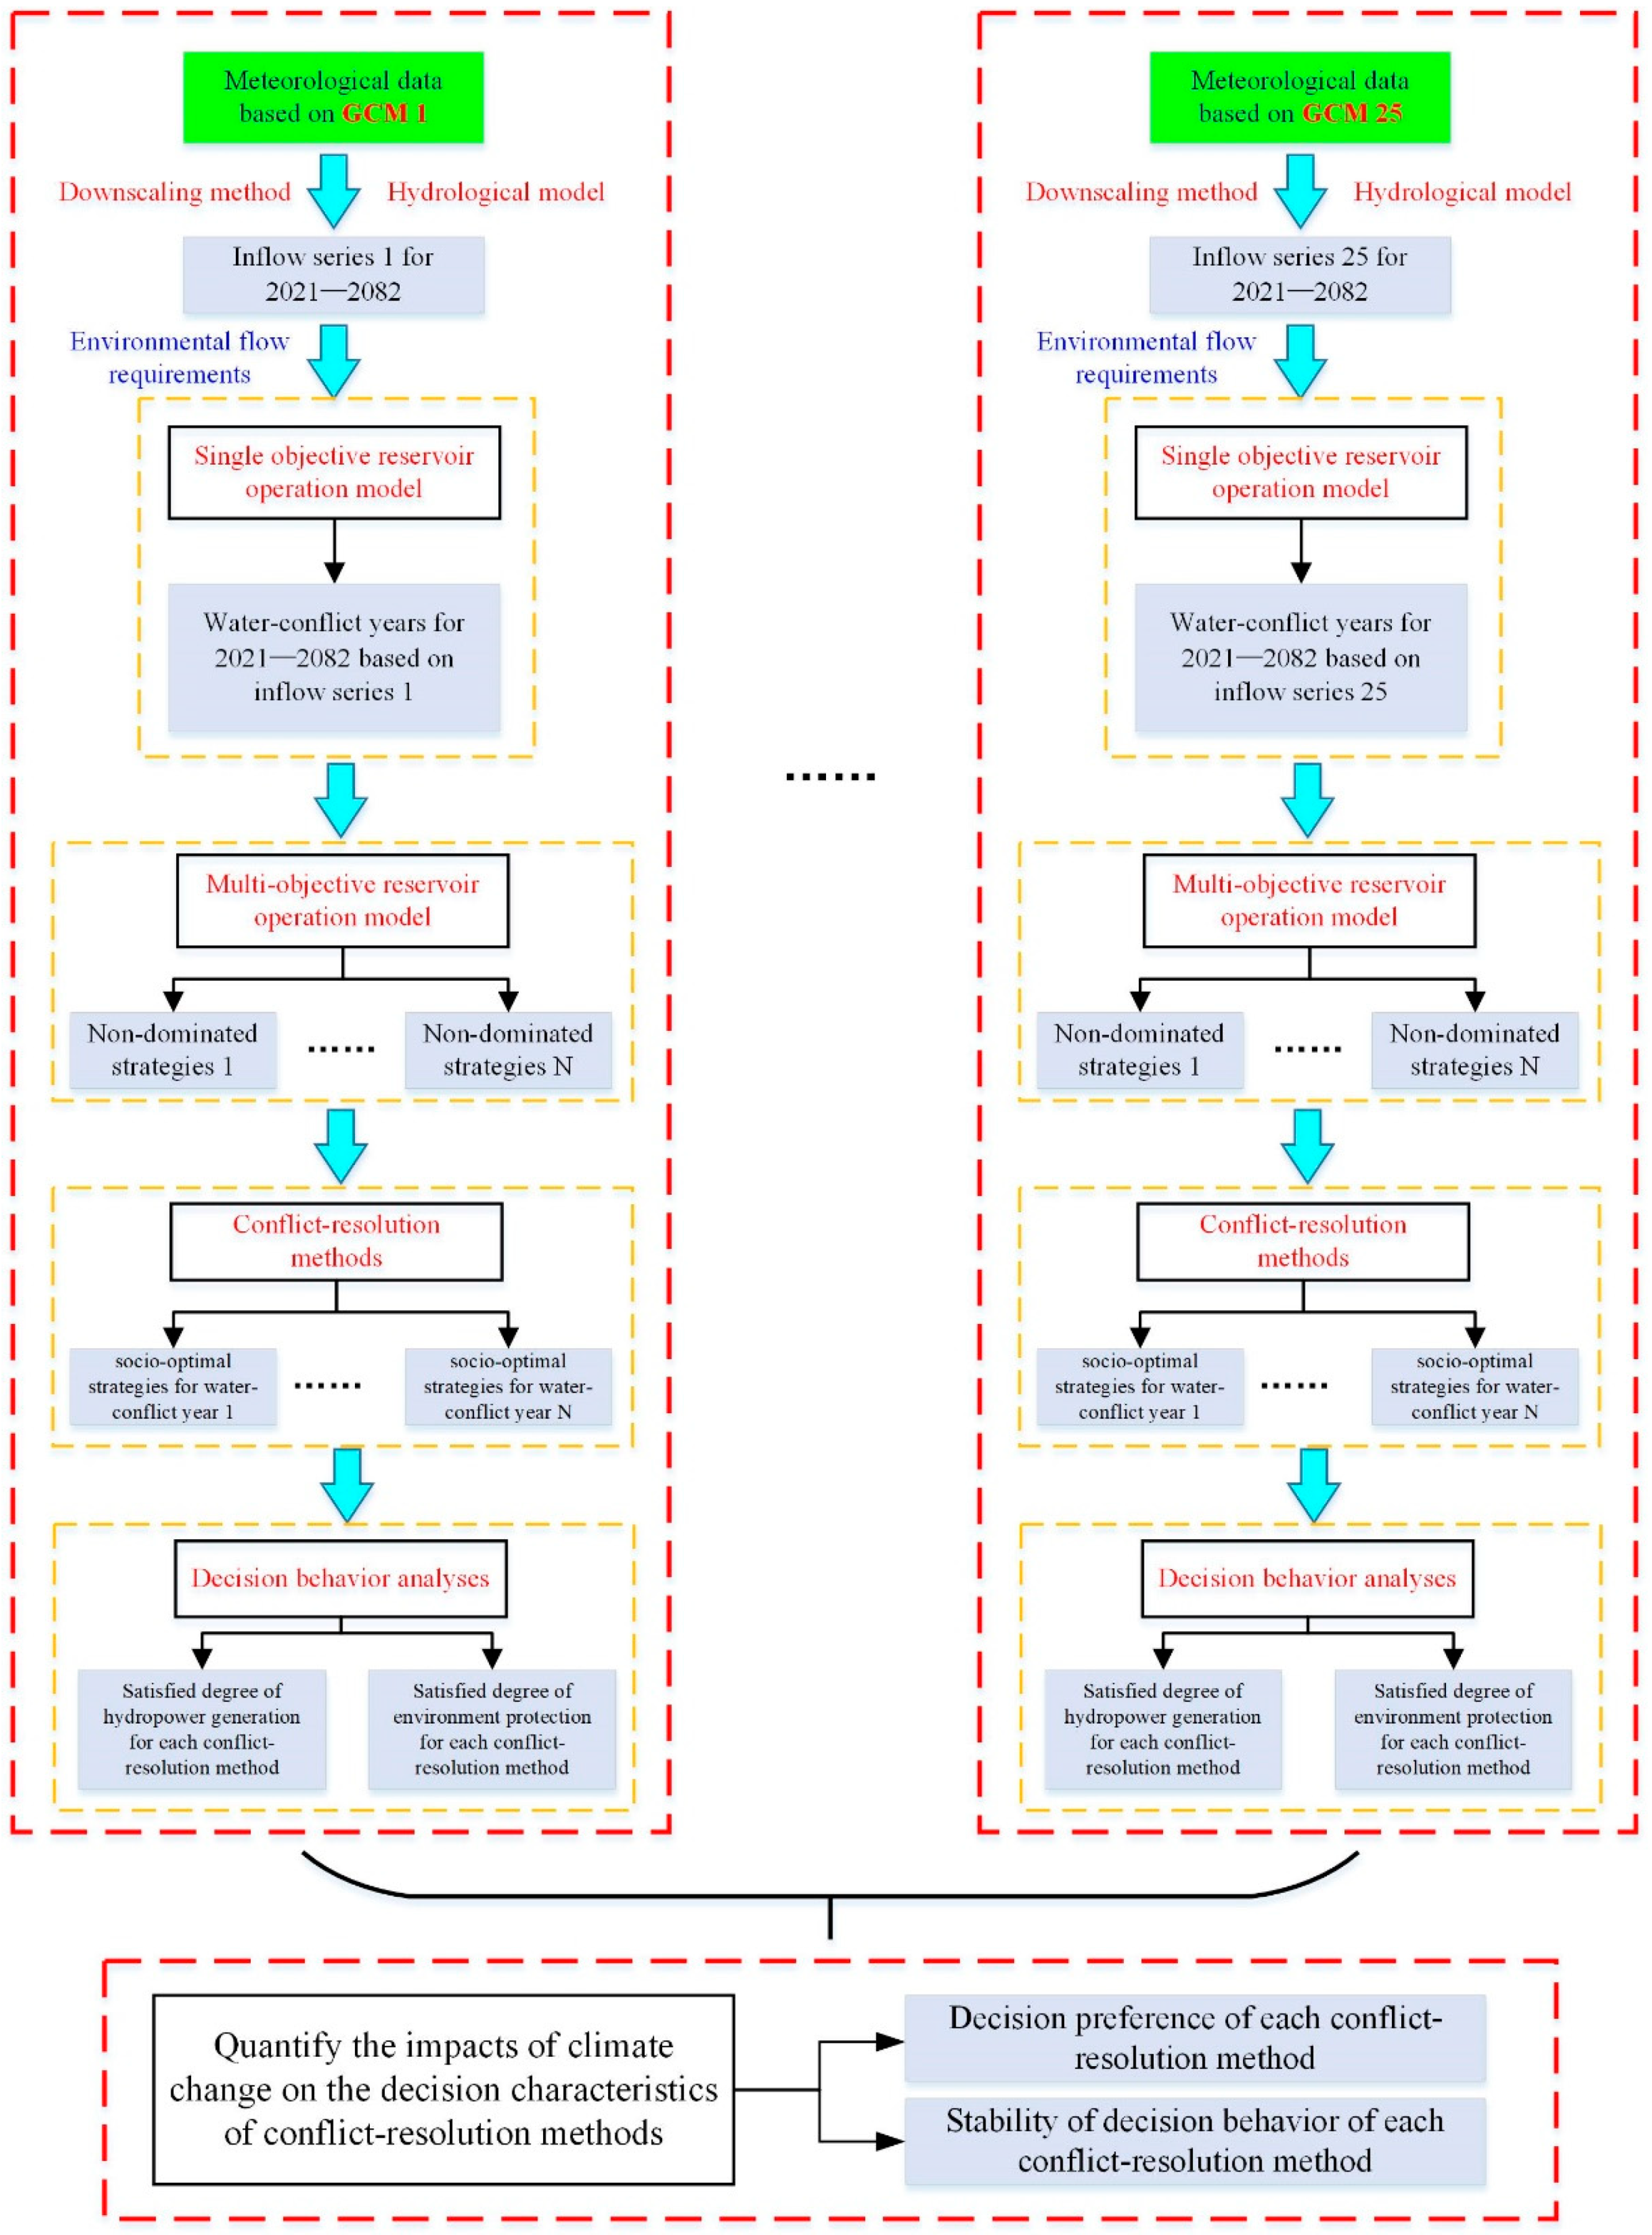
The methodology to assess the uncertainty of hydropower–environmental conflict-resolution management under climate change includes four steps: step 1, simulate future climate scenarios under different GCMs, and predict future inflow series based on a hydrological model for each climate scenario; step 2, define the environmental flow patterns, and select the water-conflict years based on each pattern; step 3, build a multi-objective reservoir operation model considering hydropower generation and environmental protection, and optimize the model to obtain non-dominated strategies; and step 4, apply conflict-resolution methods to select a balanced strategy from the non-dominated strategies, and calculate metrics based on the selected strategy to analyze the impacts of climate change on the strategy selection of conflict-resolution methods. A flowchart of this methodology is presented in Figure 1.
2.1. Reservoir Inflows under Climate Change
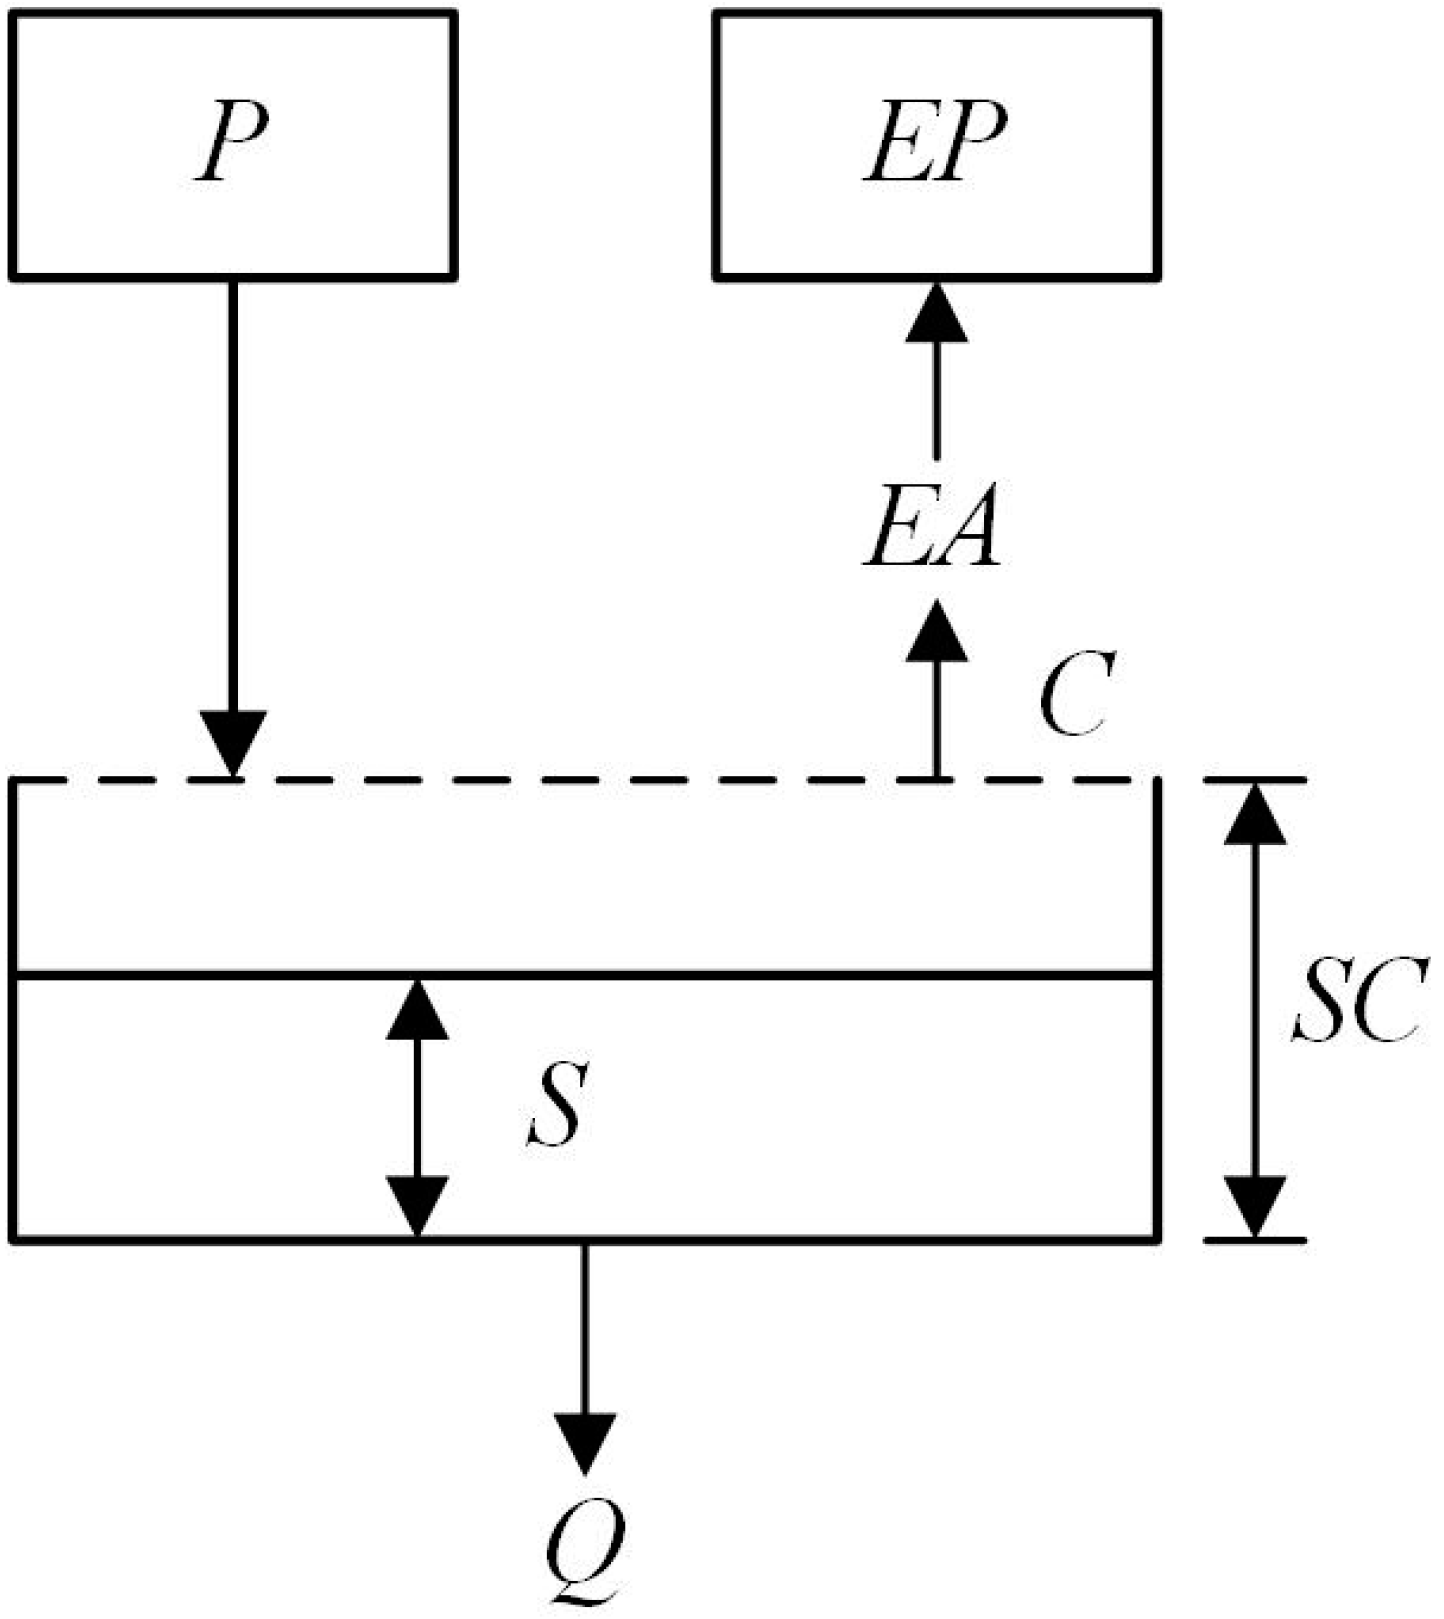
To qualify the impacts of climate change on reservoir inflows, future climate simulations of 25 GCMs were collected. These simulations were based on an average of the outputs from 25 GCMs, presented in Table 1. To refine the coarse resolution and eliminate systematic bias, the outputs were downscaled by quantile mapping [24,25] to be used as the inputs of the hydrologic model. The two-parameter monthly water balance model [26] was used to simulate monthly runoff (Figure 2). The two-parameter monthly water balance model with simple and clear physical basis were verified effectively to simulate runoff of 70 sub-catchments from the Dongjiang, Ganjiang, and Hanjiang Basins in the south of China. The details of the two-parameter monthly water balance model are as follows:
- (1)
- Actual monthly evapotranspiration:where is the number of months; is actual monthly evapotranspiration; is monthly rainfall; is the first model parameter, which represents the coefficient of evapotranspiration; and is monthly pan evapotranspiration calculated by the Thornthwaite method [27,28], using the monthly mean temperature.
- (2)
- Monthly runoff:where is monthly runoff; is the water content in soil, which is calculated according to the water conservation law (Equation (3)); and is the second model parameter, which represents the maximum water storage capacity of the watershed.
- (3)
- Water content in soil:
In this study, the observed daily inflow data at Yichang station for 1950–2010 period were used to calibrate (1950–1980) and validate (1981–2010) the two parameters of the two-parameter monthly water balance model.
2.2. Selection of Water-Conflict Year
The premise of conflict analysis between hydropower generation and environmental protection is to determine the water demands of the two stakeholders. Therefore, in this paper, environmental flow (EF) for the middle and lower reaches of the Yangtze River had to be determined. Based on the basic flow method [29], Xu et al. proposed three EF patterns for the study area: basic flow (BF), maintenance basic flow (MBF), and appropriate environmental flow (AEF) [15]. Different from the former two patterns, AEF was determined by considering the reproduction of aquatic organisms living in the study area, which is more environmentally friendly to the ecology of the river. It is important to note that the ecosystem’s water demand for the three EF patterns is regarded as constant, which isolates potential additional water demand due to climate change.
To define the water-conflict years from inflow series for future years, a reservoir operation model targeting on the maximum hydropower generation was formulated as follows:
where is total hydropower generation (); is the reservoir output at the tth period (); and are the total operation period and timestep, respectively. The single-objective model is subject to several constraints, such as water level, reservoir storage, releases, output, and reservoir water balance constraints, and can be optimized by an intelligent algorithm, which results in the corresponding optimal release decisions.
According to the optimized release, the discrimination for water-conflict years is set as:
where is the optimal release from Three Gorges Hydroelectric Power Station at the tth period (), and is the EF for river protection at the tth period. The discrimination rule indicates that if the optimized release can satisfy the water demand of environmental use, there is no water use conflict between hydropower generation and environmental protection, and the year is defined as a water-free year; otherwise, it is a water-conflict year.
2.3. Multi-Objective Optimization Modeling
According to previous studies [22,23], for improving the hydropower generation, the reservoir releases are usually reduced to raise the water level. However, when the reservoir releases are reduced, the EF under the downstream of the reservoir cannot be satisfied and the water deficit can be increased, which may threaten the ecological environment. Therefore, for each water-conflict year, a multi-objective reservoir operation model, including hydropower and water deficit objectives, can be established as follows:
where is total hydropower generation (); is the total water deficit to maintain EF demands (), and is the average releases from Three Gorges Hydroelectric Power Station at the tth period (). In Equation (6), , in which . indicates the output coefficient; and indicate the water level of the reservoir at the t − 1th and tth period, respectively; and indicates the water level at the outlet of draft tubes of the reservoir, which is related to . The relevant constraints referred to in this multi-objective model are similar to those in a single-objective model. By optimizing the multi-objective model, a series of non-dominated solutions are produced, which reflect the water conflict between hydropower generation and environmental protection.
Although the formula expressions of Equations (4) and (6) are similar, the meanings are different. Equation (4) indicates a single-objective model which targets on the maximum hydropower generation to select the water-conflict year, while Equation (6) is just one objective of the multi-objective model which is used to provide possible solutions for water-conflict year with considering hydropower generation and environmental protection. In addition, the optimized solution of Equation (4) is just one solution of the non-dominated solutions obtained from the multi-objective model.
2.4. Conflict Resolution of Water Demands of Two Stakeholders
Six representative conflict-resolution methods, including fuzzy Borda counting, fuzzy approval voting, Nash bargaining, alternating offer, Young conflict-resolution and unanimity fallback bargaining, are applied to select the socio-optimal strategy from possible strategies. The fuzzy Borda counting and fuzzy approval voting methods are classified as fuzzy social choice methods. Fuzzy social choice methods are based on social choice theory that consider how to integrate conflicting individual preferences into a collective decision, the core point of which is fairness. The fuzzy approval voting is different from fuzzy Borda counting in that each stakeholder ranks all strategies based on individual preference without pairwise comparison. Nash bargaining, alternating offer, Young conflict-resolution and unanimity fallback bargaining are classified as game-theoretical bargaining methods. Game-theoretical bargaining methods are based on game theory that emphasize individual rationality and preference, and can offer compromised strategies for stakeholders with conflicting interests through competition and cooperation. For these four methods, Nash bargaining is derived from cooperative game theory, while the other three methods are derived from non-cooperative game theory. Different from cooperative game theory, non-cooperative game theory does not emphasize the binding agreements between different stakeholders, and thus the total benefits of stakeholders do not be considered. Detailed descriptions of these conflict-resolution methods are as following:
(1) Fuzzy Borda counting. The fuzzy Borda counting method (FBCM) is a type of FSCM, and is derived from the Borda counting method [30]. By pairwise comparison of different strategies, individual preferences can be quantified, and the socio-optimal strategy is defined as the one with the highest score.
(2) Fuzzy approval voting. The fuzzy approval voting method (FAVM) is a type of FSCM, and is derived from the AVM [30]. Without pairwise comparison of different strategies, each stakeholder ranks all strategies based on individual preference, and the socio-optimal strategy is defined as the one with the highest score.
(3) Nash bargaining. The Nash bargaining method (NBM) is a type of GTBM [8]. To establish this model, the utility functions of stakeholders are improved in order to maximize the product of their utilities. The advantage of the bargaining efficiency is that it is a Pareto one and all the non-dominated strategies have motivation to accept it.
(4) Alternating offer. The alternating offer method (AOM) is a type of GTBM, and is derived from the Rubinstein bargaining method [31]. By taking turns proposing strategies and adjusting individual expected value according to those strategies, bargaining continue until the proposed strategy can satisfy the expected value of different stakeholders.
(5) Young conflict-resolution. The Young conflict-resolution method (YCRM) is a type of GTBM [32]. Based on previous experience of bargaining, the relationship between the strategy and utility values can be quantified. According to the relationships, the compromised strategy accepted by stakeholders can be defined.
(6) Unanimity fallback bargaining. The unanimity fallback bargaining method (UFBM) is a type of GTBM [10]. Here, the strategies are referred in order according to the stakeholders’ preferences. When different stakeholders propose the same strategy, the bargaining is stopped. As in AOM, the number of compromised strategies may be more than one.
2.5. Metrics
According to the methodology, when the multi-objective model is optimized by NSGA-II under the inflow scenario of the water-conflict year, a series of non-dominated solutions can be obtained. Then, the conflict-resolution methods are applied to select the socio-optimal solution from the non-dominated solutions. Based on the selection results of conflict-resolution method for water-conflict years, certain metrics are introduced to analyze the decision behavior or performance of the conflict-resolution methods. These are described as follows:
(1) Satisfied degree. The satisfied degree is used to evaluate stakeholder satisfaction with the socio-optimal strategy selected from the non-dominated strategies.
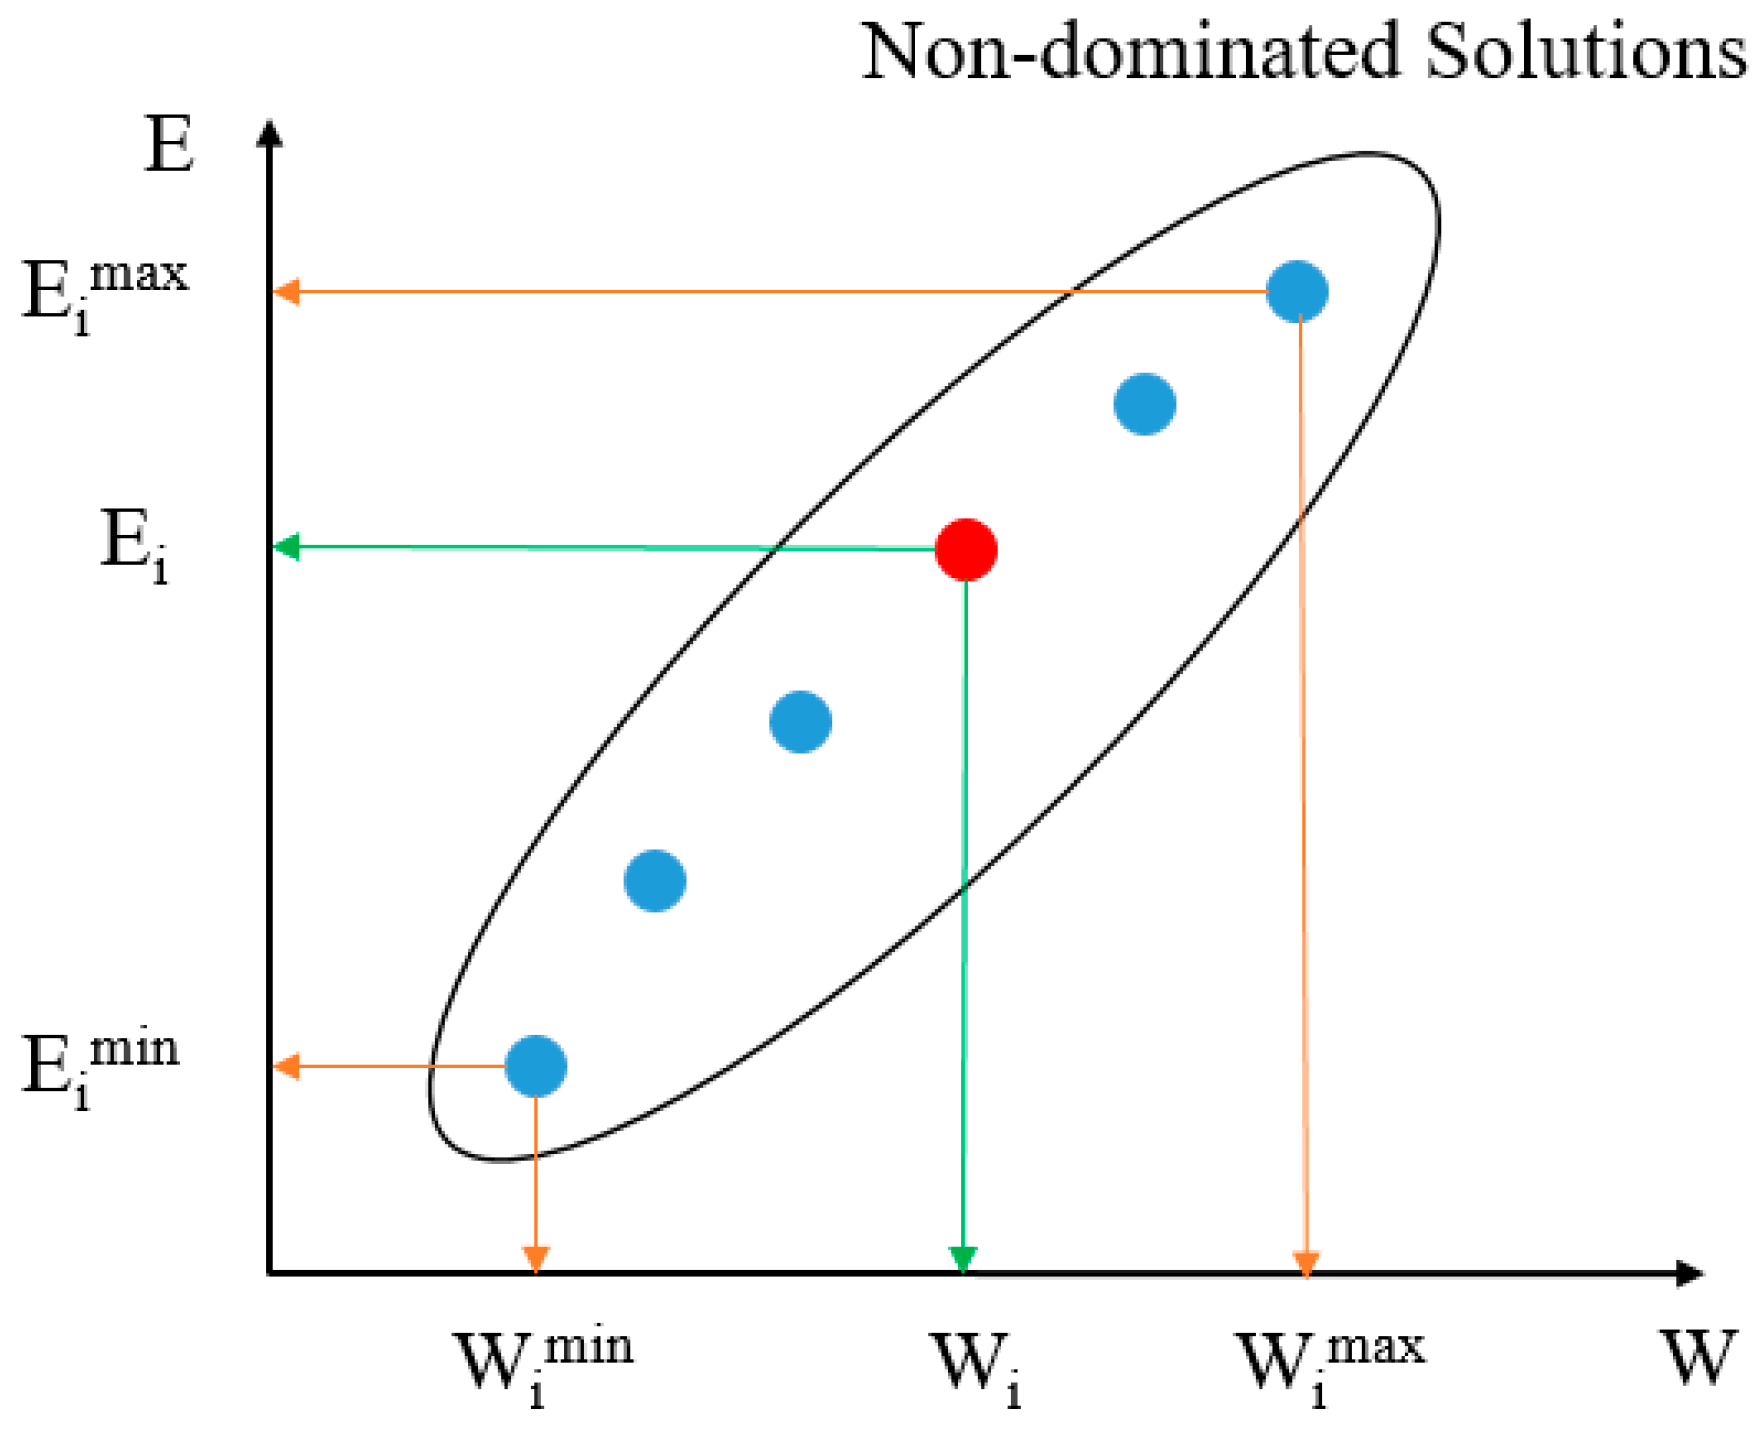
where and are the satisfied degrees of hydropower stakeholder and environmental stakeholder; and are the hydropower generation and water deficit, respectively, according to the selected strategy in the ith water-conflict year (the red point in Figure 3); is the number of water-conflict years under certain GCM scenario and EF pattern; and are the minimum and maximum hydropower generation and and are the minimum and maximum water deficit, respectively, according to the non-dominated strategies in the ith water-conflict year, which are shown in Figure 3.
According to and , it is indicated that the closer the value of is to that of , the higher hydropower stakeholder’s satisfaction is; and the closer the value of is to that of , the higher environmental stakeholder’s satisfaction is.
(2) Standard deviation of satisfied degree. The standard deviation of satisfied degree (SSD) is used to evaluate the stabilities of the strategy selection of conflict-resolution methods.
where is the standard deviation of hydropower stakeholder’s satisfied degree value; is the standard deviation of environmental stakeholder’s satisfied degree value; is the average of for certain GCM scenario and EF pattern; and is the average of for certain GCM scenario and EF pattern.
3. Study Area and Data
3.1. Study Area
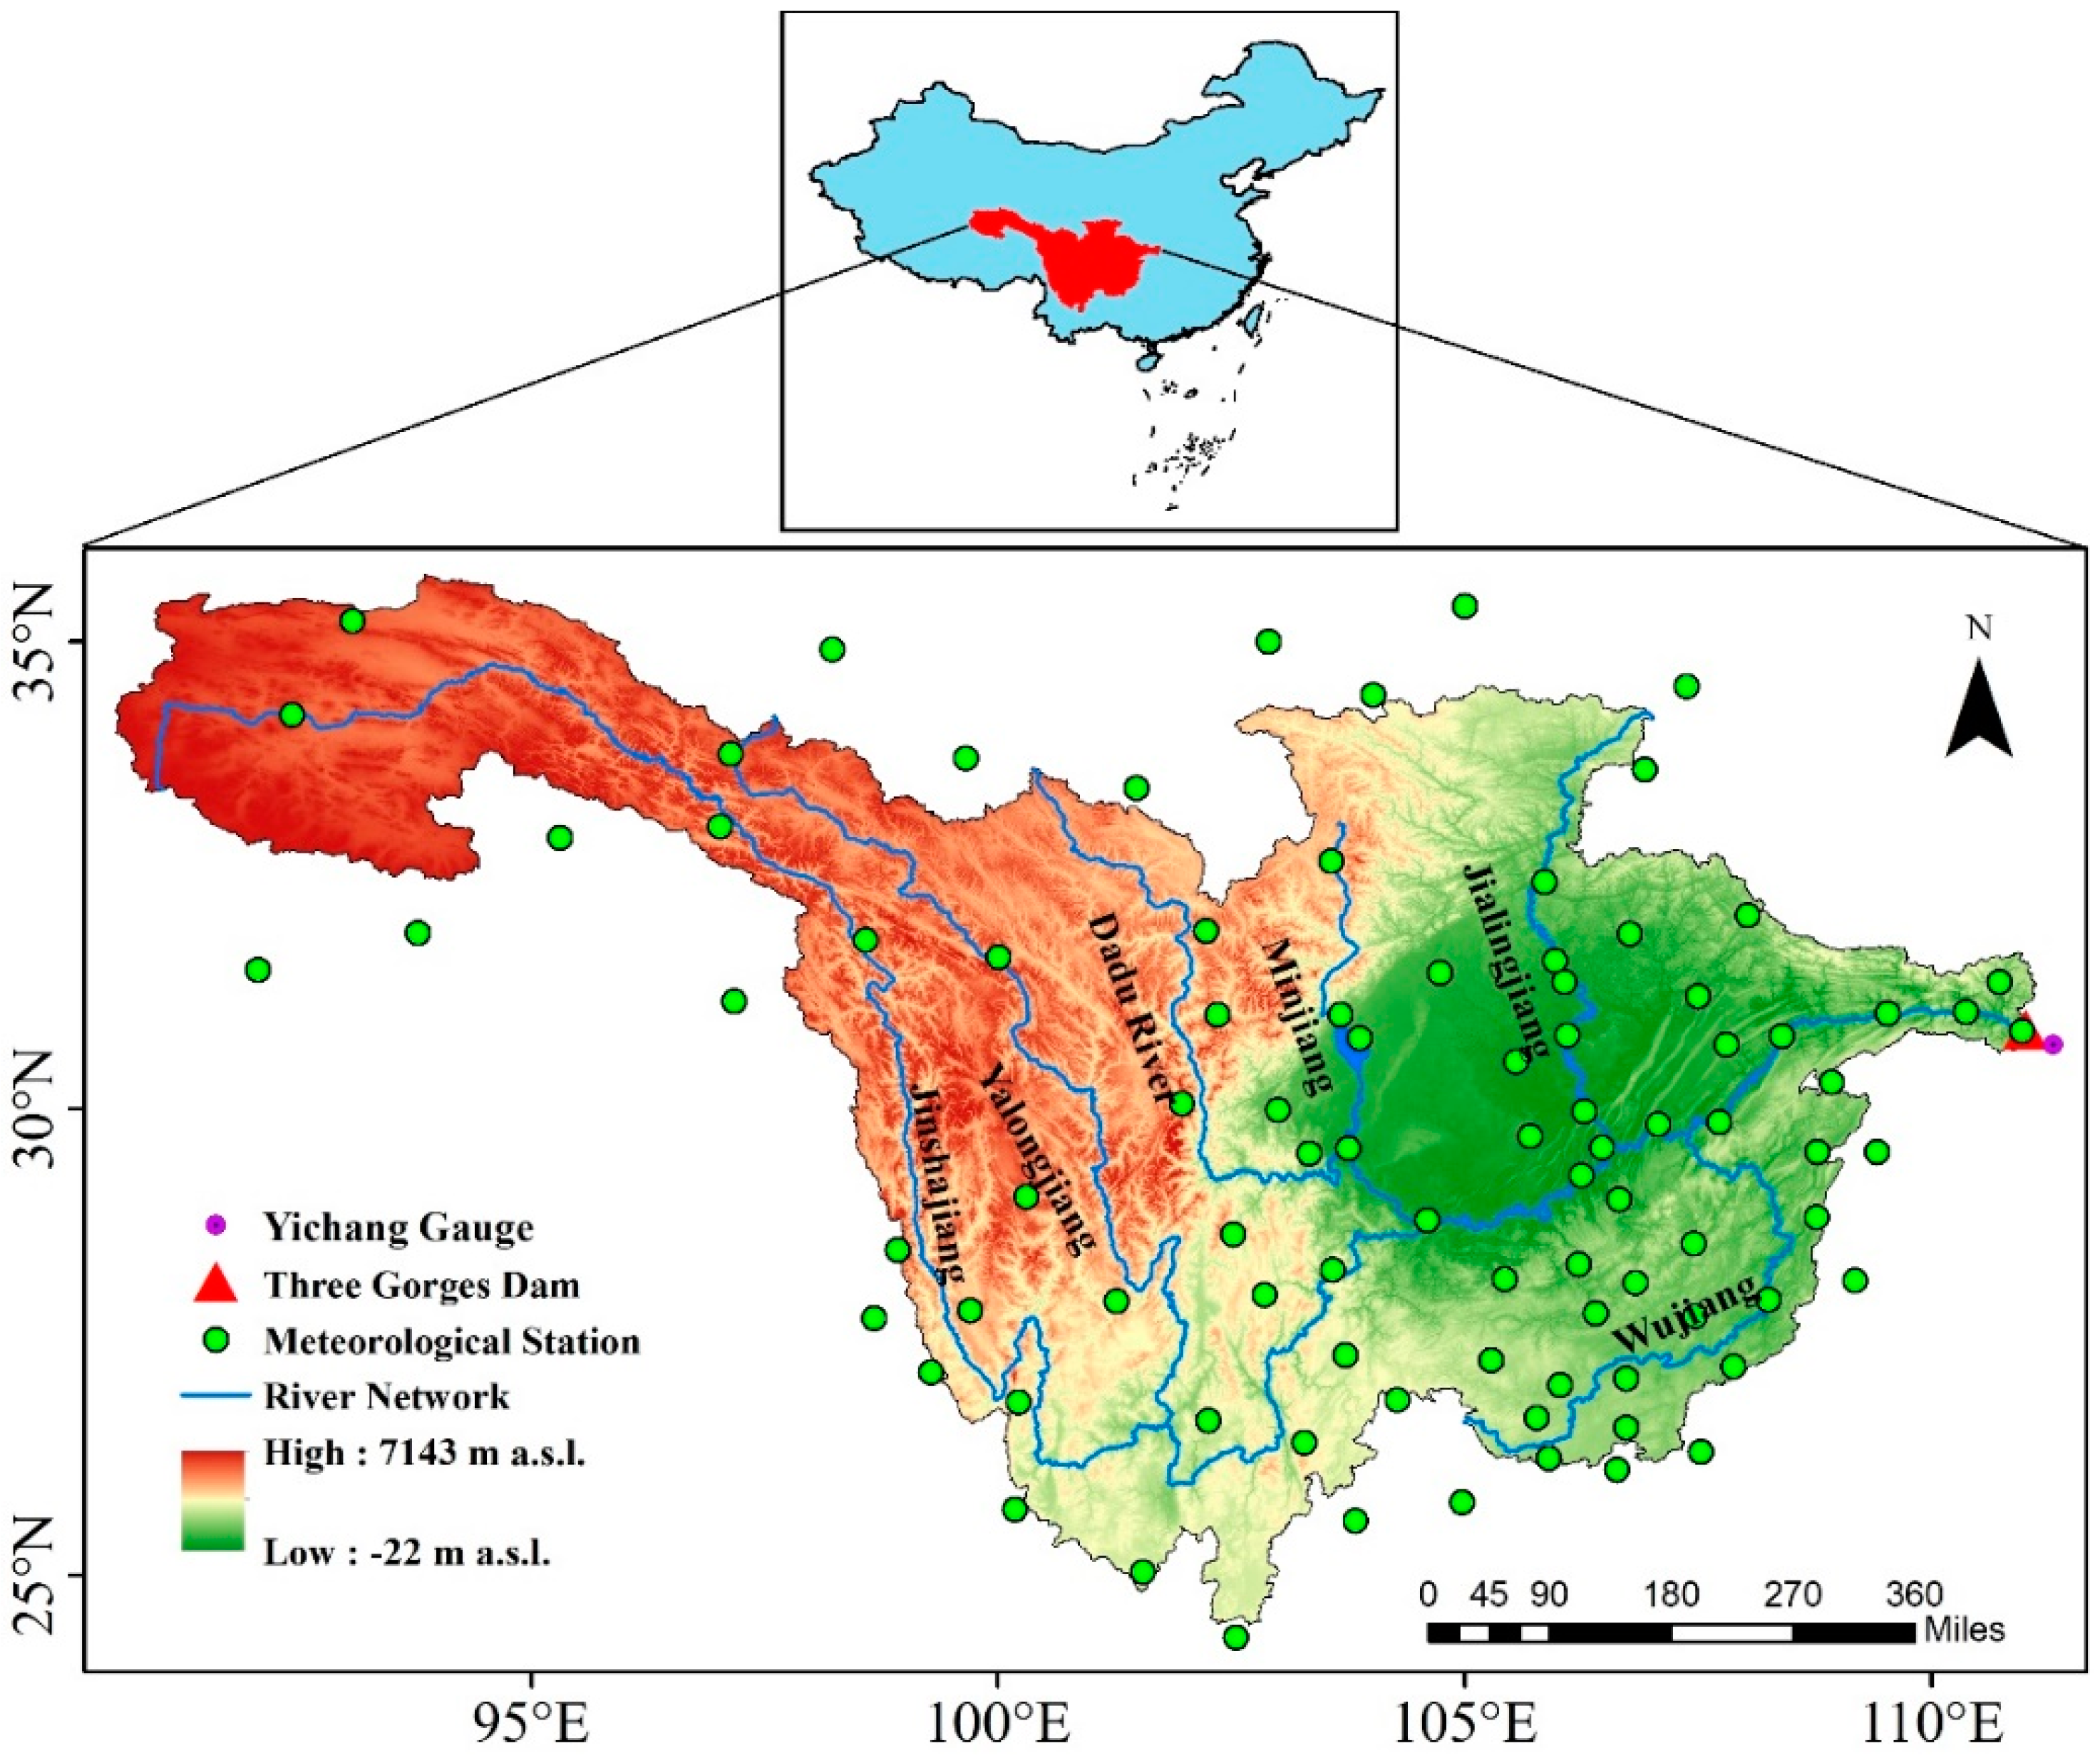
As the longest river in China, the Yangtze River crosses eight provinces, distributed from high to low latitude. With the combination of a huge waterhead drop and abundant water resources, plenty of water energy can be provided through hydropower projects. As a world-class hydropower project, Three Gorges Hydroelectric Power Station, located in the midstream of the Yangtze River, was chosen as the study subject (Figure 4). According to the operation rules, the main function of Three Gorges Hydroelectric Power Station from June 1 to September 31 is flood control, thus, the water level is reduced to the flood limited water level (145 m) before the flood season and controlled at a fixed water level (145 m) during the flood season. After the flood season, the water resource is impounded and the water level is gradually raised to the normal pool water level (175 m). To guarantee high economic output, the water level of Three Gorges Hydroelectric Power Station is maintained as high as possible during the water supply period, which may influence the water demand of the ecological environment. In order to realize sustainable water resource management, there needs to be a reasonable reservoir operation policy in order to alleviate the conflict between economic and environmental demands.
3.2. Data
This study used both observed and GCM-simulated daily precipitation and temperature data for the upstream of the Three Gorges Hydroelectric Power Station. The observed daily inflow data at Yichang station were acquired from the Bureau of Hydrology of Changjiang Water Resources Commission.
The observed daily precipitation and daily maximum and minimum temperature at 92 meteorological stations (Figure 4) were acquired from the National Meteorological Information Center (http://data.cma.cn/, accessed on 31 July 2021). The GCM-simulated daily precipitation and daily maximum and minimum temperature were extracted from the database of the Coupled Model Intercomparison Project Phase 5.
In this study, the base and projection periods were selected as 1950–2010 and 2021–2082. The model simulations were based on the ensemble mean of the established climate models, and the difference in reservoir inflow between future simulations and the baseline period of 1950–2010 was applied to modify actual reservoir inflow data obtained from the Yichang hydrological station. In addition, to define the EF, the water demands of aquatic organisms in each month were considered [33]. Further, to relieve the saline water intrusion induced by the impoundment of the Three Gorges Hydroelectric Power Station, which threatens the survival of aquatic organisms, the minimum flow requirement was considered for salinity-control [33].
4. Results and Discussion
4.1. Uncertainty Related to Global Climate Models in Simulation of Future Inflow
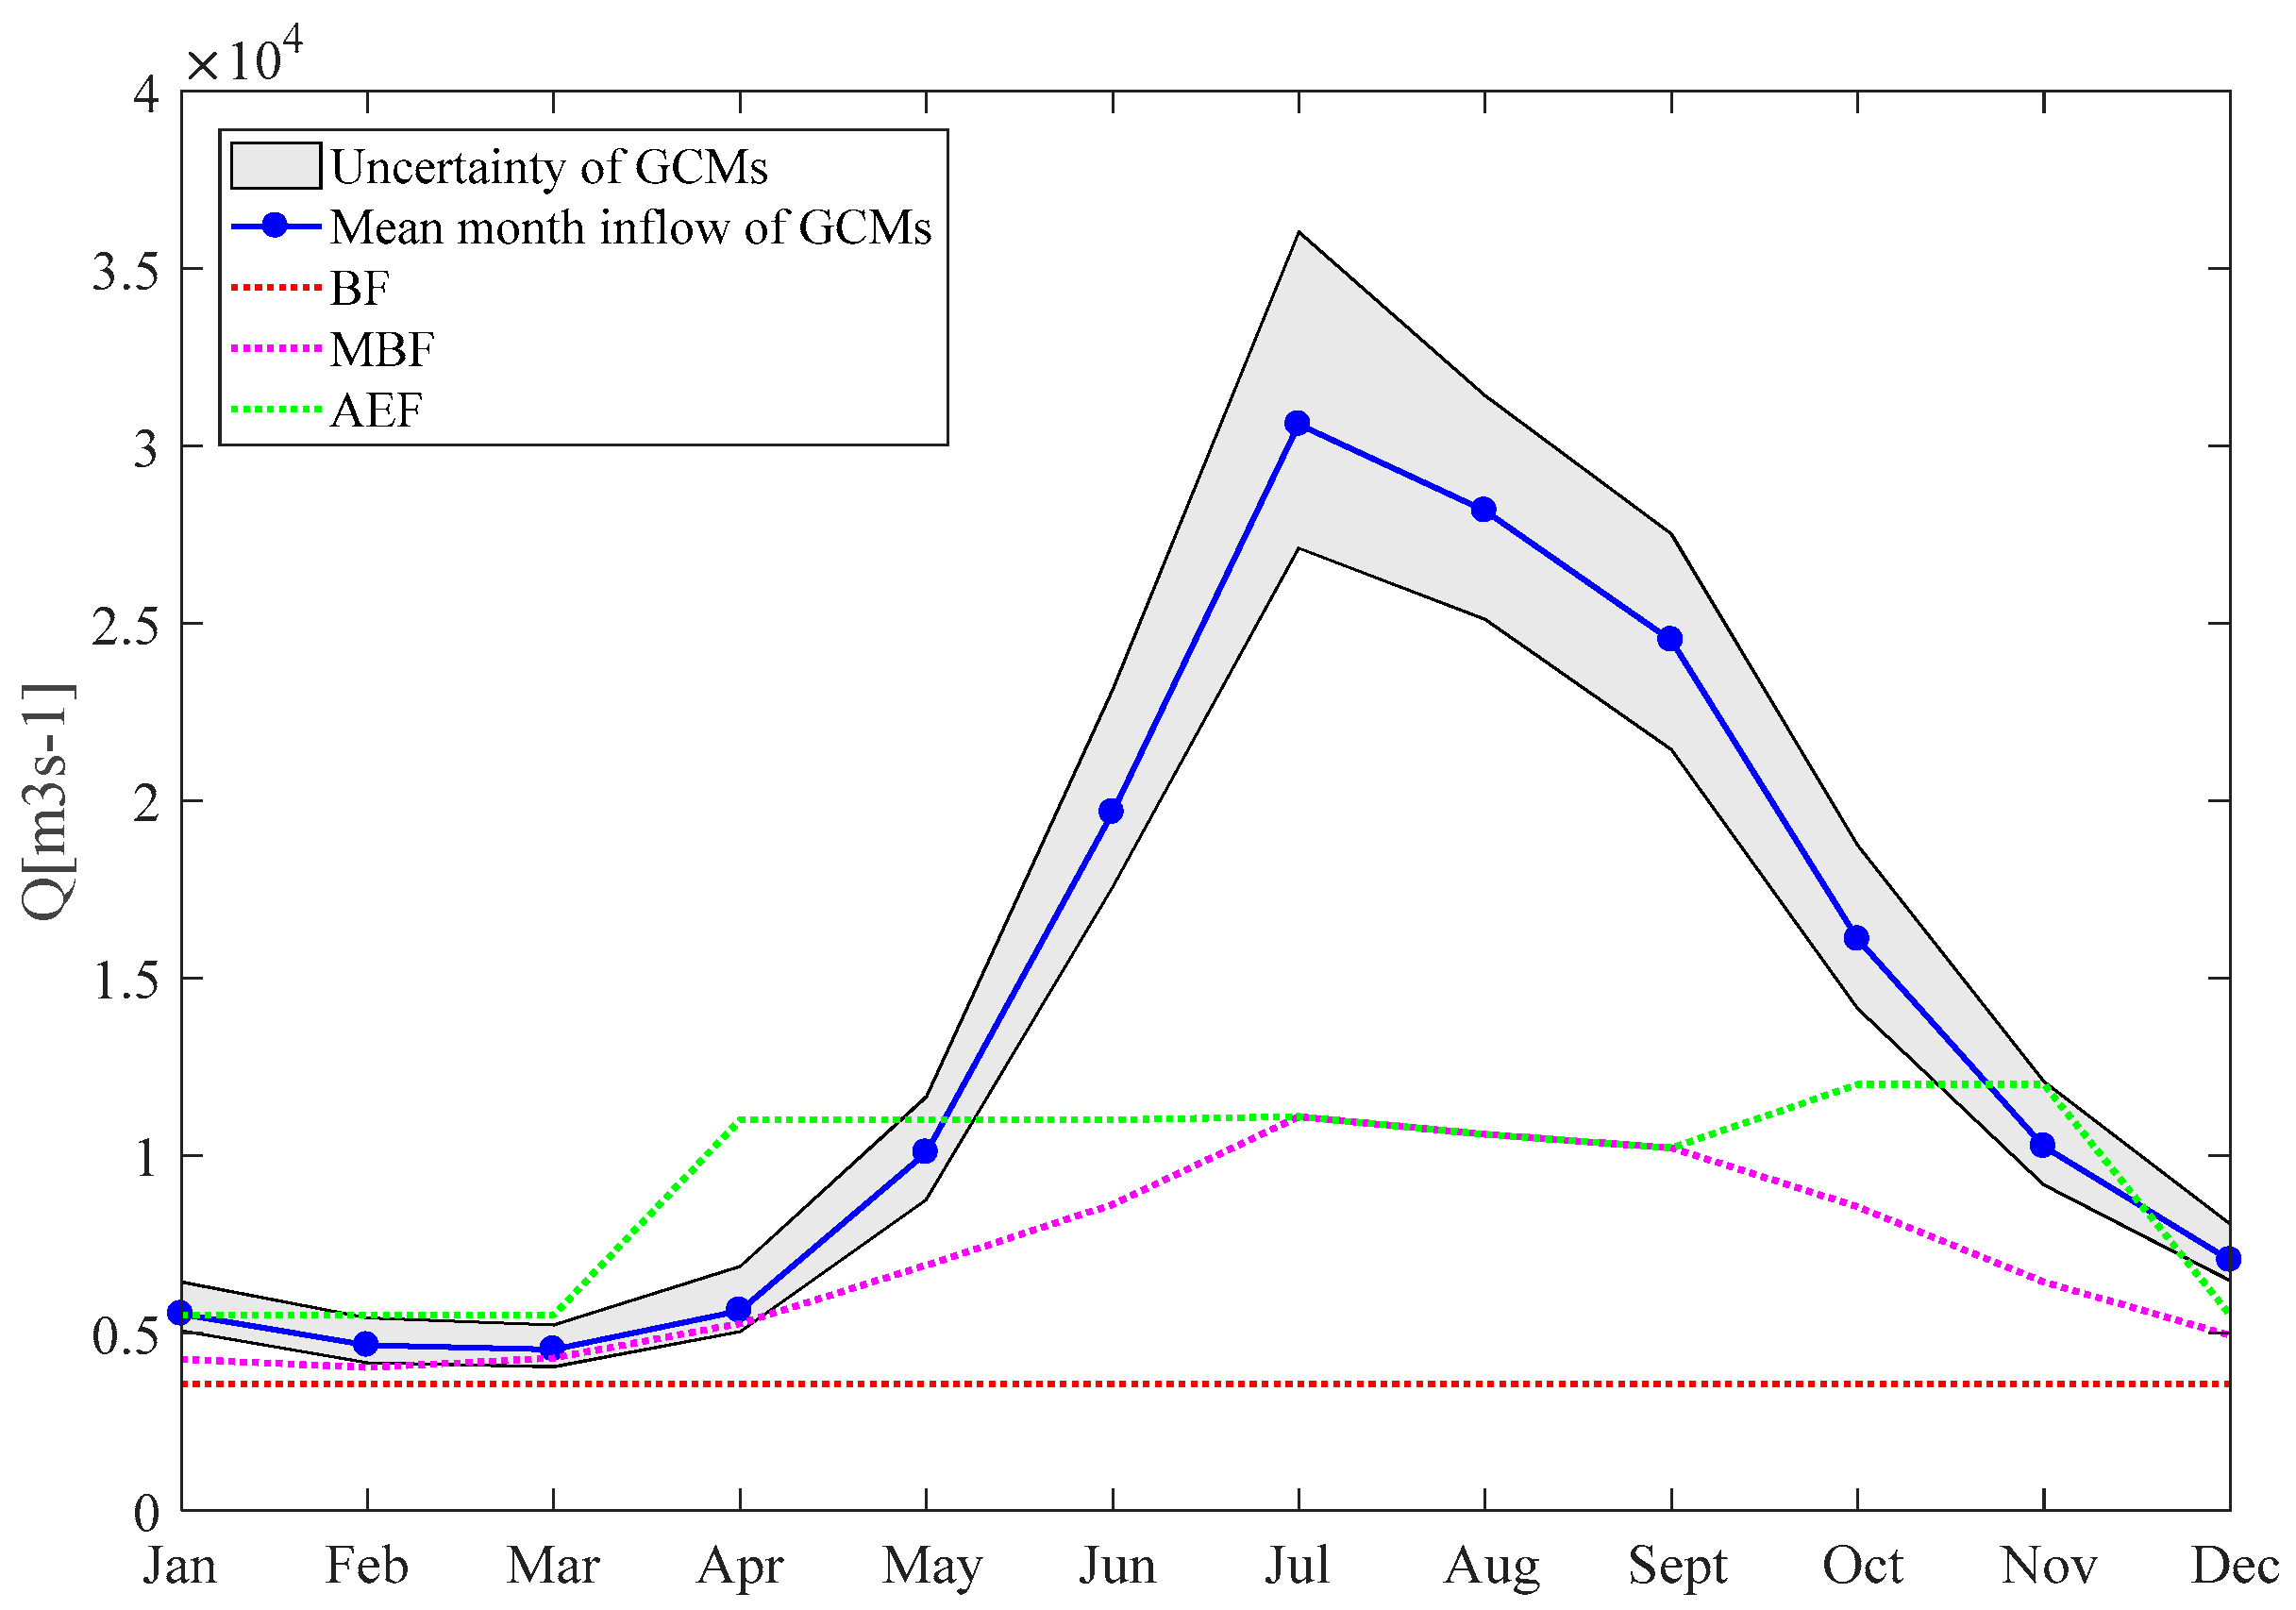
A total of 25 GCMs simulations under the greenhouse gas emissions scenario of representative concentrations pathway (RCP) 4.5 were evaluated. Based on the future climate scenarios, 25 future streamflow patterns were generated by two-parameter monthly water balance model. Since diverse downscaling and hydrology models are not considered here, the uncertainty of reservoir inflows is related to the uncertainty of GCMs. Projected (2021–2082) mean monthly inflow (m3/s) of different GCMs is shown in Figure 5. The solid blue line represents the mean inflow process and the solid black line represents the maximum and minimum monthly mean inflow generated by the 25 GCMs. Figure 5 shows the fluctuation tendency of monthly inflow for the projection period and indicates that the uncertainty of the simulated flow covers a wide range.
In addition, Figure 5 also shows the BF, MBF and AEF for environmental protection, which were obtained based on the observed daily streamflow time series from 1950 to 2012 (base period) and the water demands of environmental protection in the study area. According to Figure 5, it is found that the BF series has a unique flow value, which indicates the minimum channel water demand; MBF reflects the temporal variability of BF, which can better reflect the natural conditions of the river ecosystem; and AEF shows the strictest requirements for environmental flow considering the water demand of environmental protection in the study area. Without the reservoir operation, the BF, MBF and AEF series can generally be satisfied by the simulated inflow, except for AEF in April.
4.2. Conflict between Economic and Environmental Water Use in Water-Conflict Years
Figure 6 shows the selection results of water-conflict years from the future period (2021–2082) under different EF patterns and GCMs. In Figure 6, the x-axis represents the 25 GCMs following the order in Table 1, and the y-axis represents the water deficit to maintain EF demands for each future operation year. Each small square indicates the degree of water deficit, when the hydropower generation is maximized. Lighter color means more serious water deficit. Thus, the water-free years are shown in the navy blue, which indicates that the water deficit is 0, the others are water-conflict years, which are represented by red points in Figure 6. Table 2 shows the total number of water-conflict years for the future period under different EF patterns and GCMs. It is observed that there are fewer water-conflict years under BF pattern than under MBF and AEF. Especially, based on future inflow generated by GCM 7, 9, 21, 22, and 23, there is no water use conflict under the BF scenario.
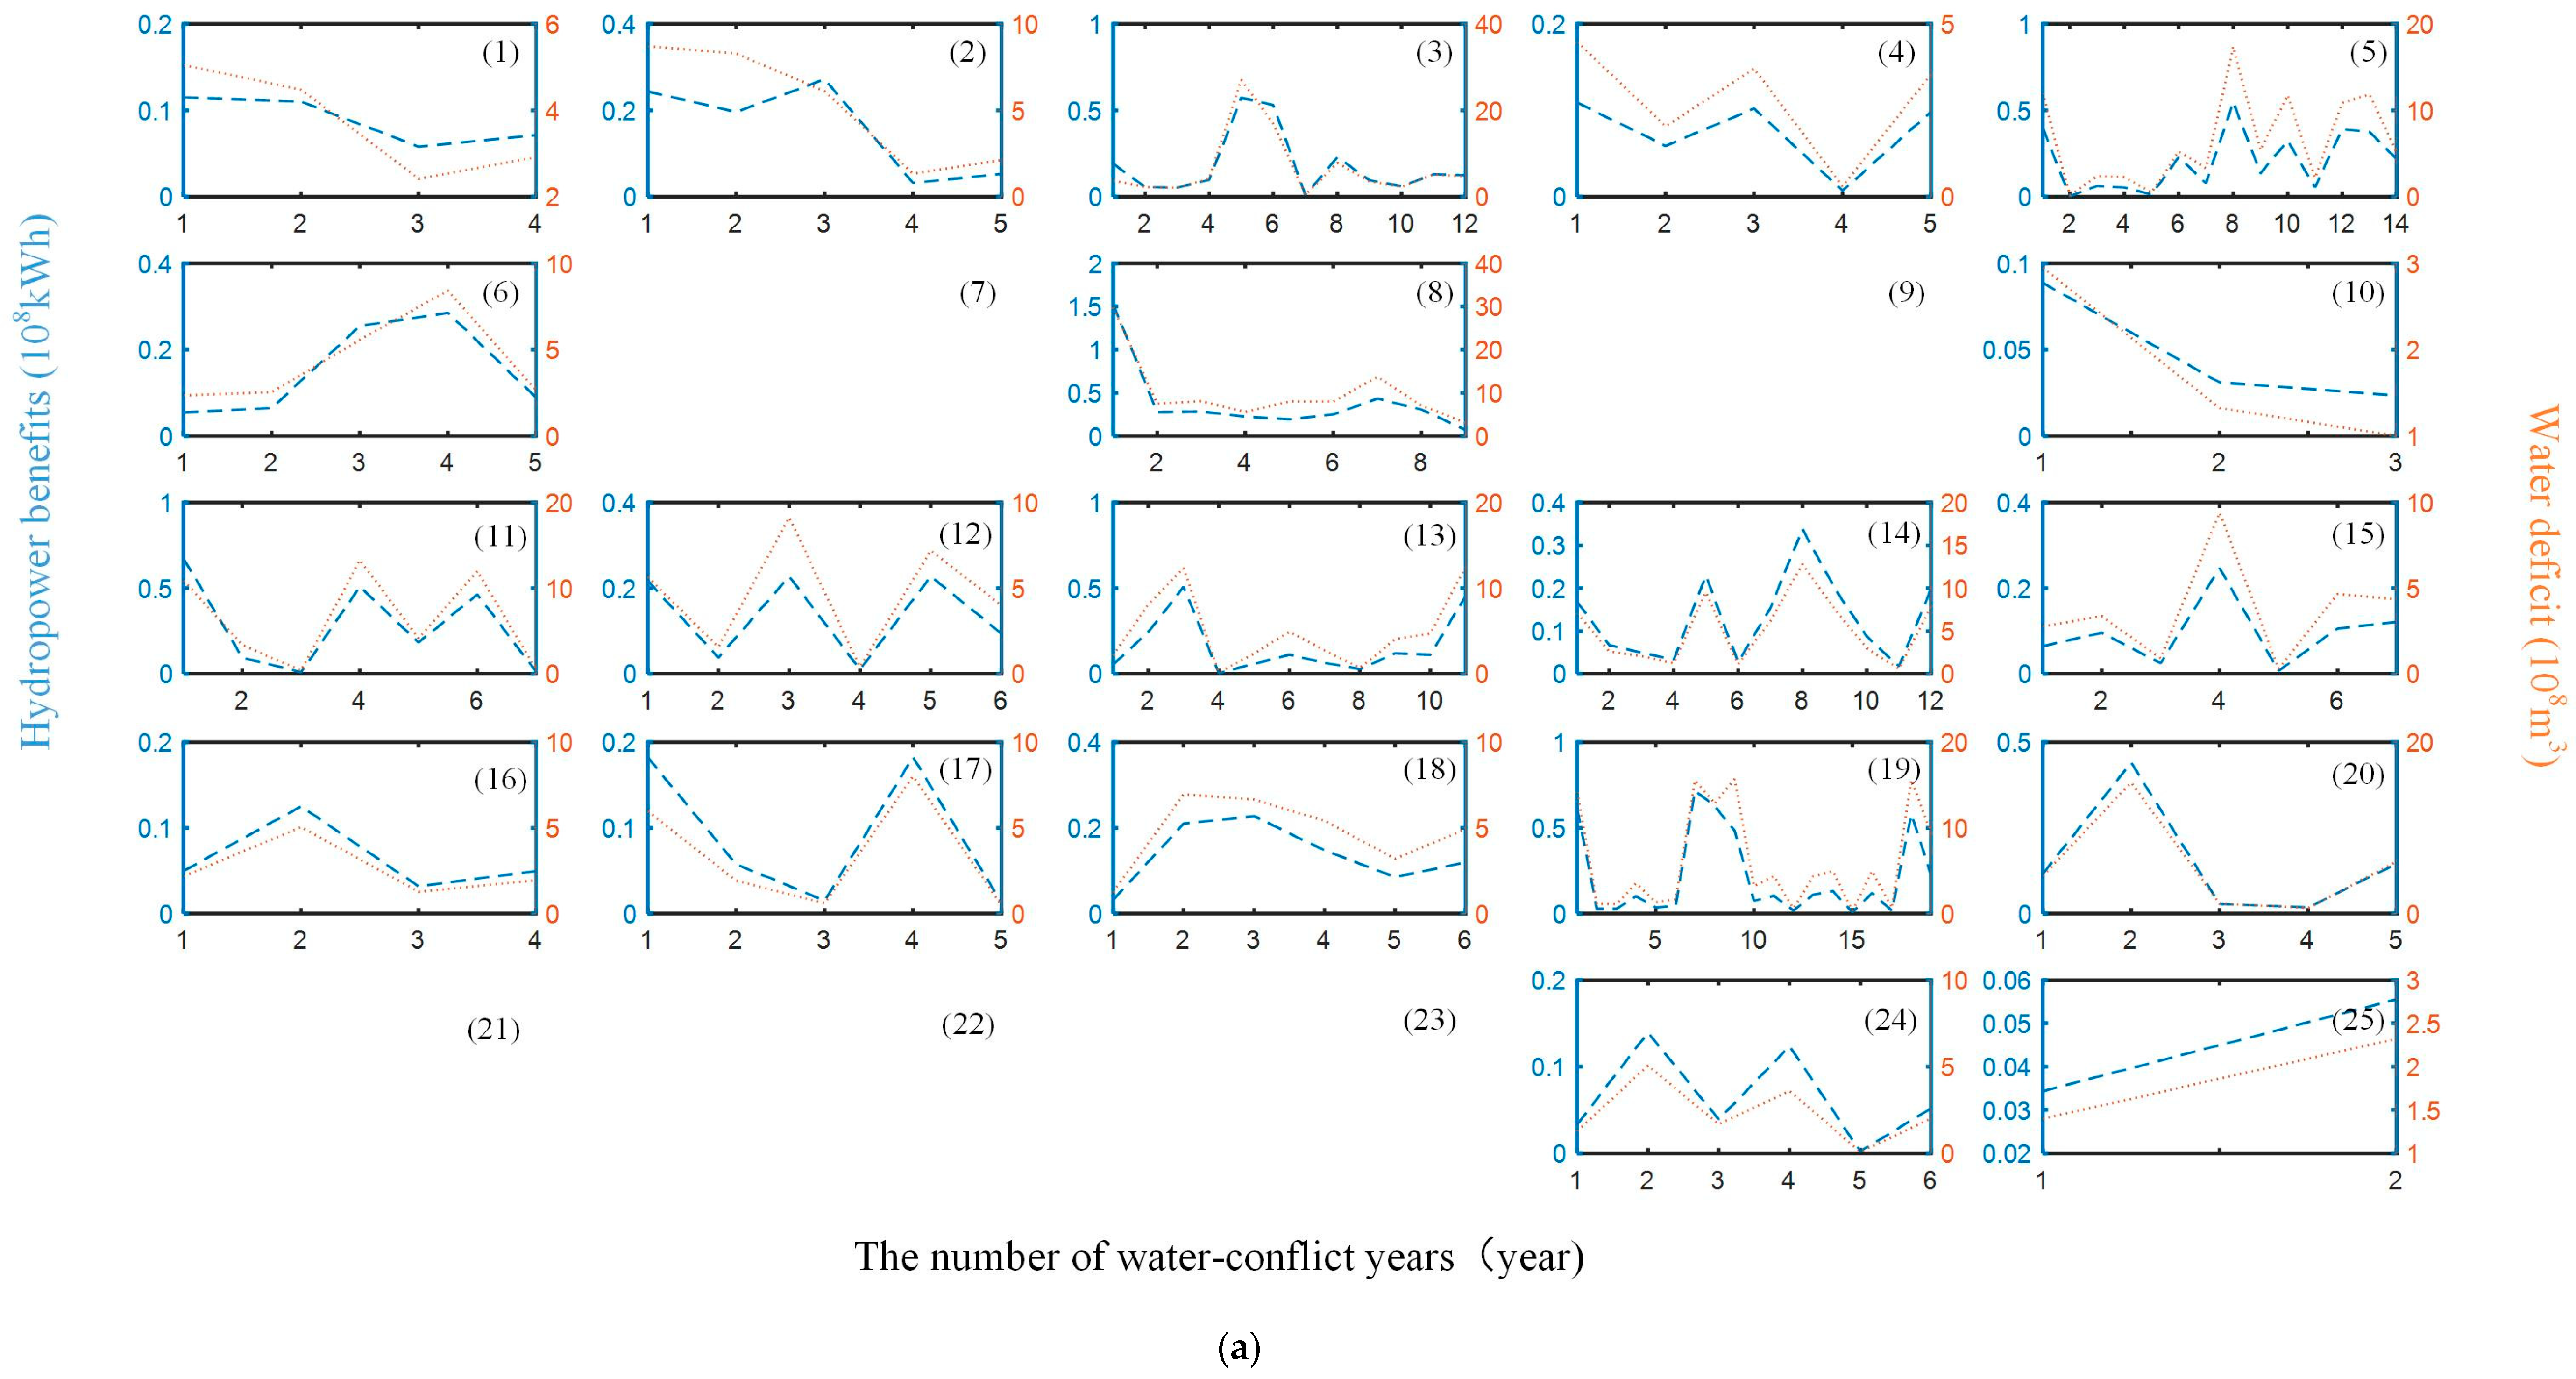
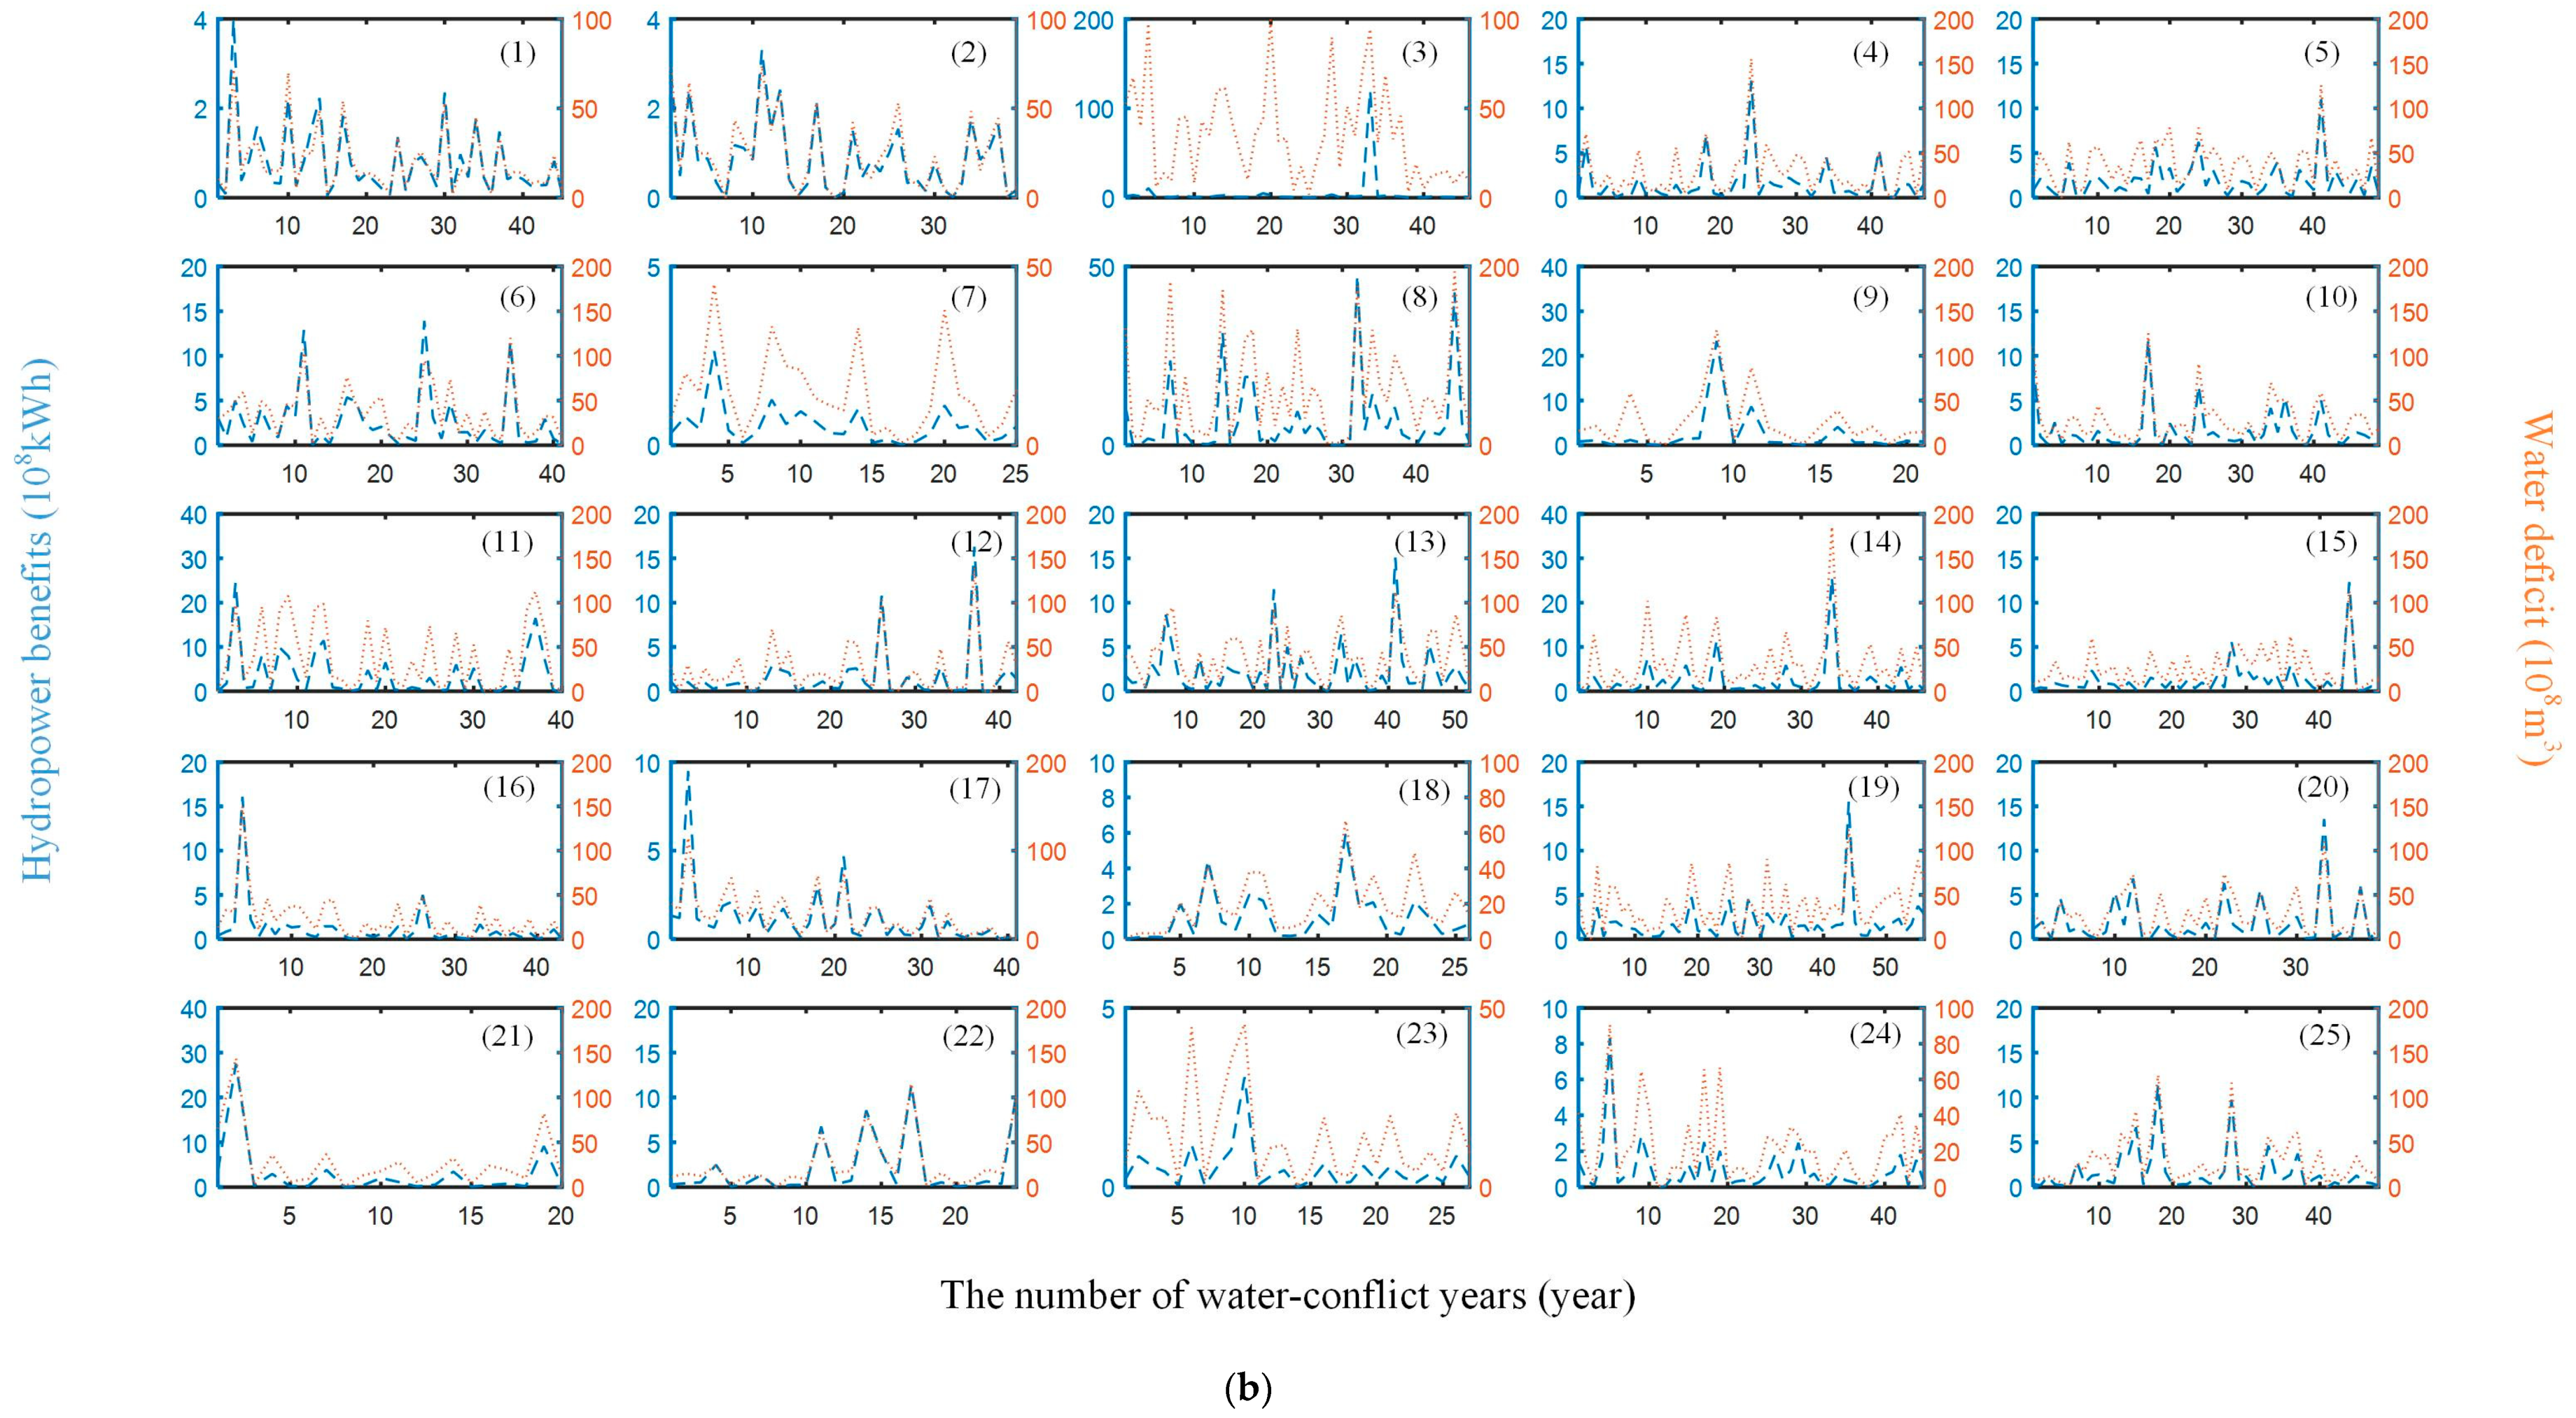
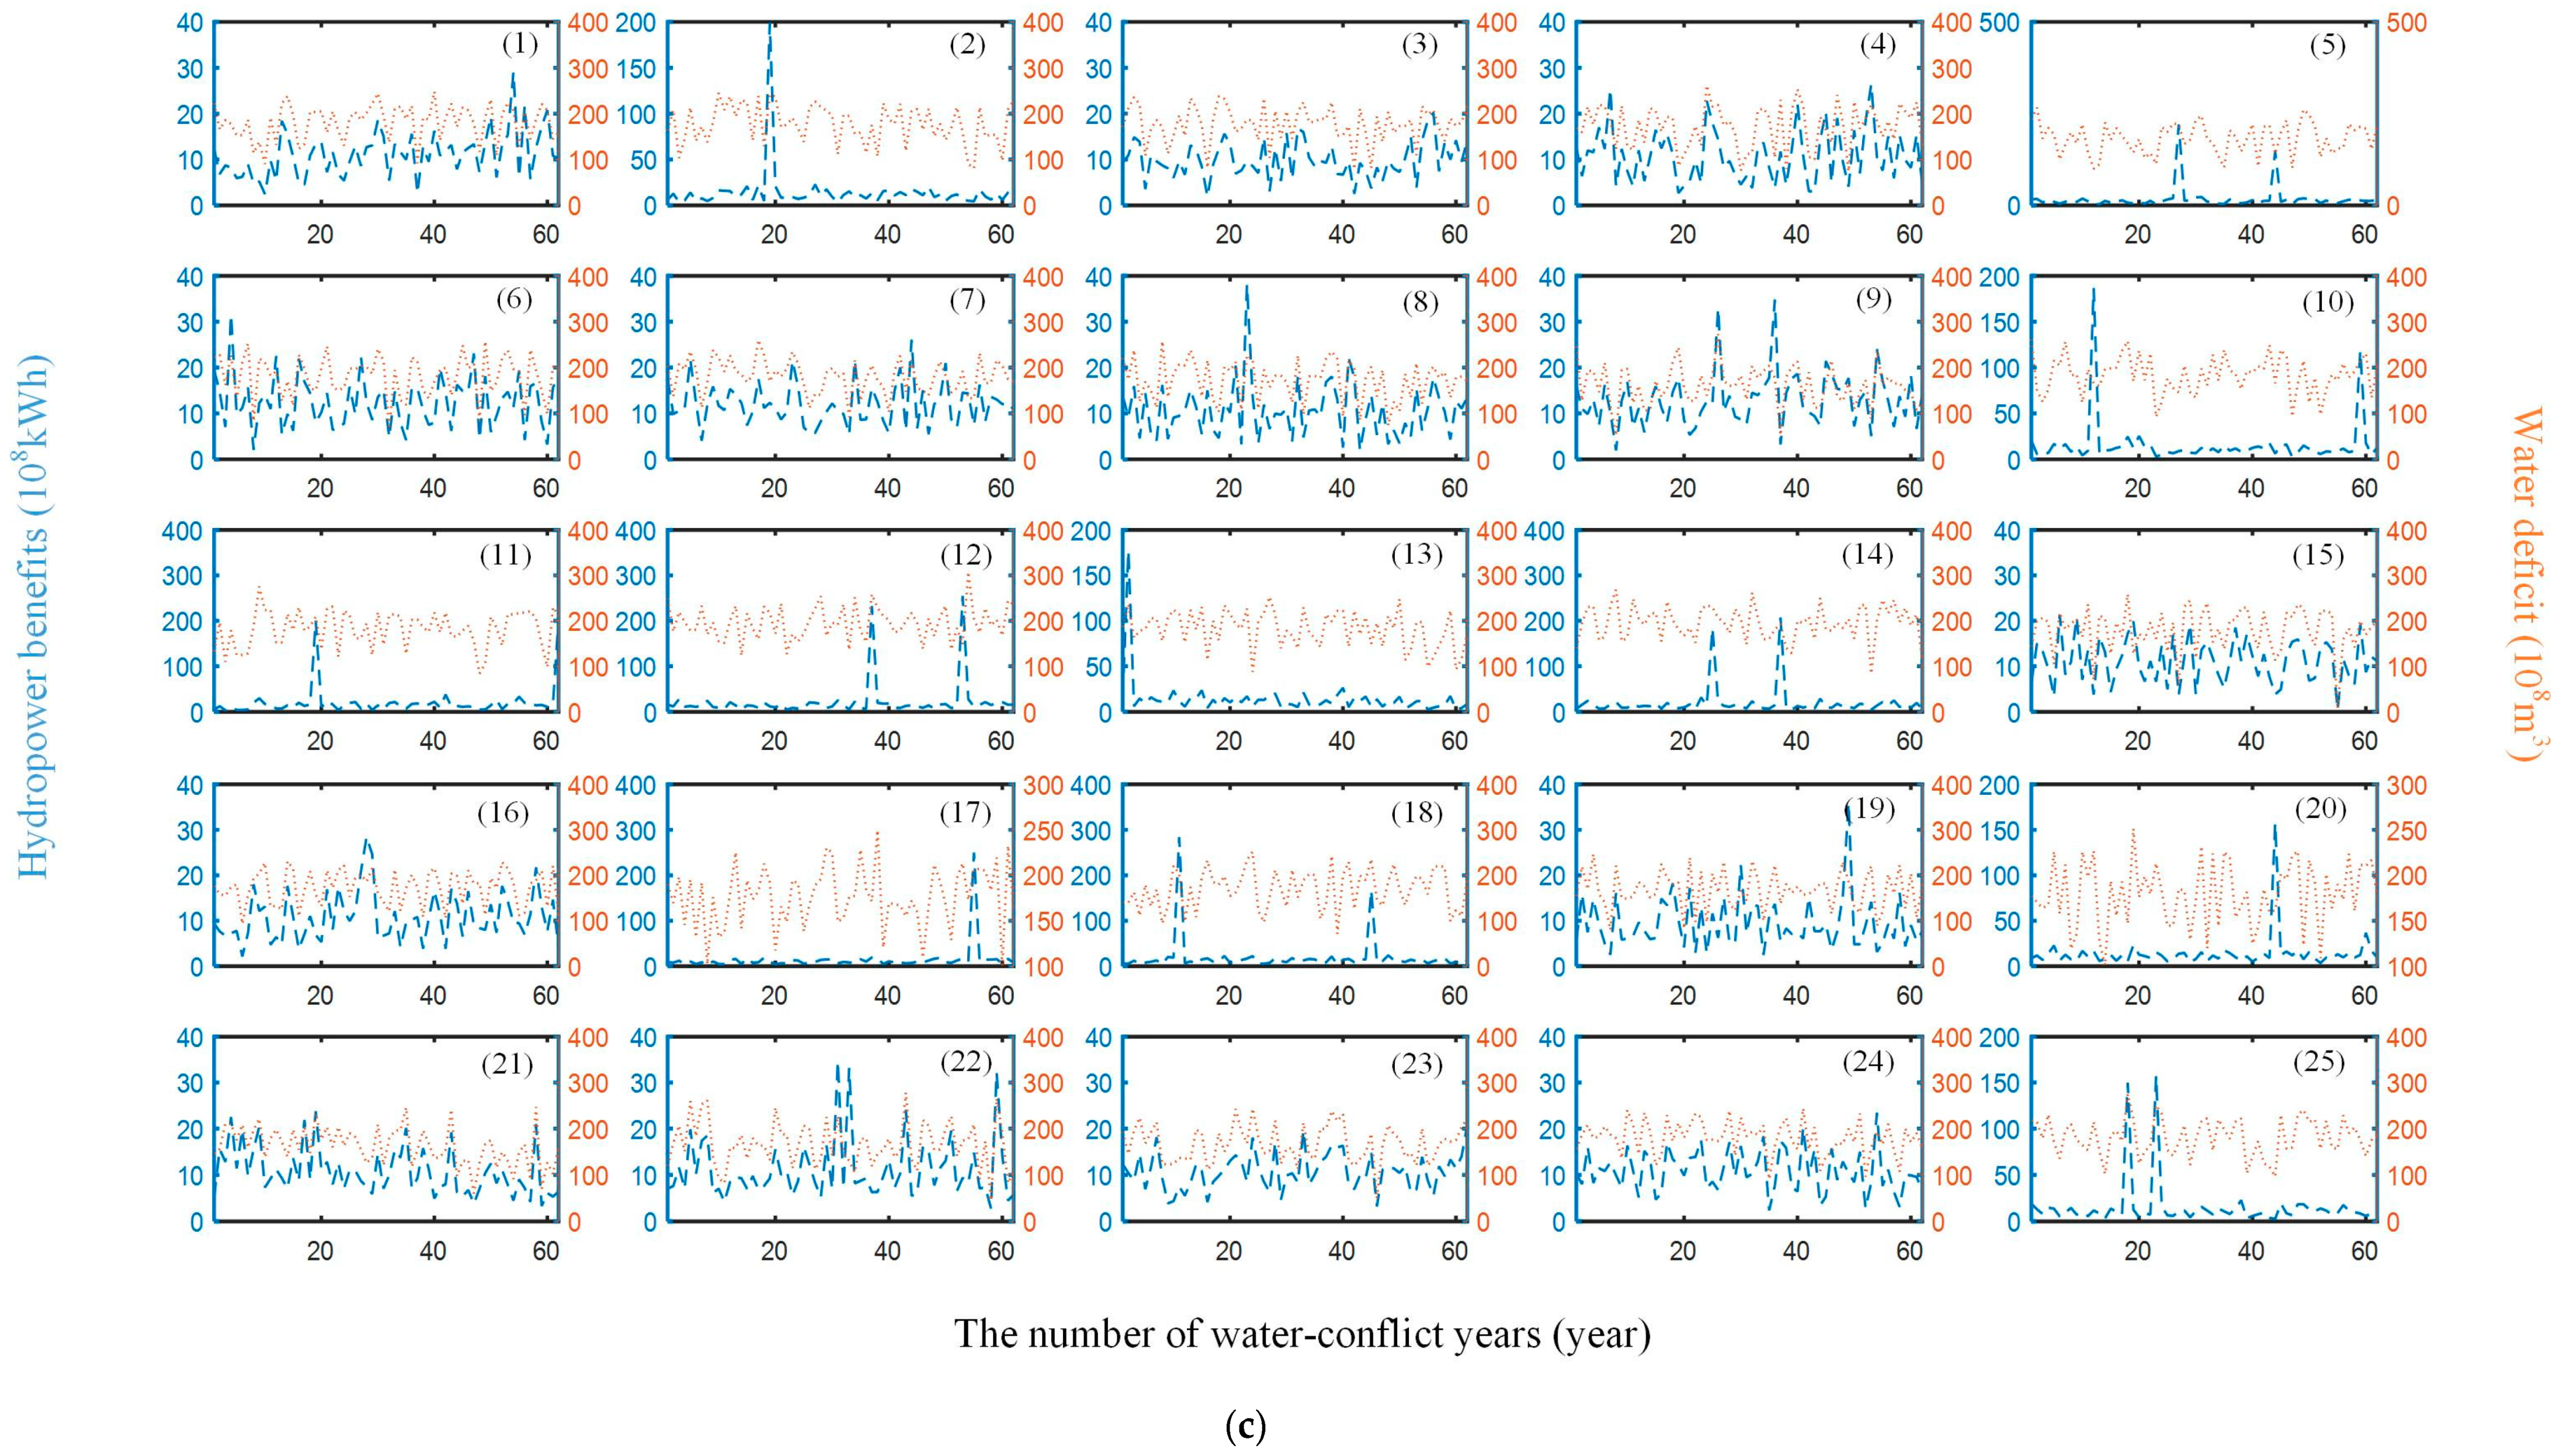
Based on the optimization by the non-dominated sorting genetic algorithm (NSGA-II) [34] for water-conflict years, a series of non-dominated strategies of the multi-objective optimization model can be obtained. Figure 7 exhibits the non-dominated solutions for different water-conflict years. In Figure 7, the x-axis represents the number of water-conflict years under different EF patterns and GCMs, which has been referred to in Table 2, the y-axis on the left represents the difference between and , and y-axis on the right represents the difference between and . Therefore, the blue and orange lines, respectively, indicate the decreased hydropower benefits and water deficit according to the non-dominated strategies for each water-conflict year under different EF patterns and GCMs (). It is observed that reduced hydropower benefits can result in reduced water deficit. In other words, the hydropower and environmental benefits cannot be increased simultaneously. In addition, from the BF and MBF patterns, it is observed that the change tendency of the blue and orange lines is similar, which indicates that a decrease in hydropower benefits can result in a decrease in water deficit. However, the tendency mentioned above is weakened in the AEF pattern, which may be because the effect of reservoir operation in relieving the water deficit is limited when the water demand for environmental use is very high. In practical life, to adequately bridge the gap of water demand in environmental use, more engineering and non-engineering measures need to be taken; however, for this paper, we focus on the impacts of reservoir operation on the environmental benefits. Based on the analyses mentioned above, changes in hydropower operation can effectively improve the benefits of environmental protection. Therefore, socio-optimal strategies supported by energy and environment departments need to be selected. The six conflict-resolution methods were applied to select balanced strategies from the non-dominated strategies.
4.3. Quantifying Climate Change Impacts on Hydropower-Environmental Conflict Resolution
Figure 8 shows the SSDE and SSDW related to the selected strategies using the six conflict-resolution methods for future periods under different EF patterns and GCMs. From Figure 8, it is observed that for different GCM scenarios, the SSDE and SSDW obtained by the six methods are not the same, and the fluctuation tendency of these values according to 25 GCM scenarios for each EF pattern are similar. However, for each EF pattern, the SSDE and SSDW obtained by FBCM, FAVM and YCRM under the 25 scenarios show drastic fluctuation, while those obtained by NBM, AOM, and UFBM show relatively stable fluctuation. Therefore, compared to other methods, strategy-selections of NBM, AOM, and UFBM are stable and unaffected by GCM scenarios.
Table 3 indicates the average SSDE and SSDW obtained by the six conflict-resolution methods according to different GCMs for each EF patterns. Based on Figure 8 and Table 3, under the same EF pattern and GCM scenario, the SSDE and SSDW obtained by NBM, AOM, and UFBM are somewhat smaller than those obtained by FBCM, FAVM, and YCRM; as the EF demand increases, the fluctuation ranges of the SSDE and SSDW obtained by FBCM, FAVM and YCRM narrow significantly, while the ranges of values obtained by NBM, AOM, and UFBM remain within a small scale. This indicates that the strategy-selections of NBM, AOM, and UFBM are more stable than those of FBCM, FAVM and YCRM. This means that the strategy-selections of NBM, AOM, and UFBM are not affected by EF patterns. When the EF pattern is determined, the SDE and SDW of the balanced strategy selected by NBM, AOM, and UFBM can be predicted for different GCM scenarios.
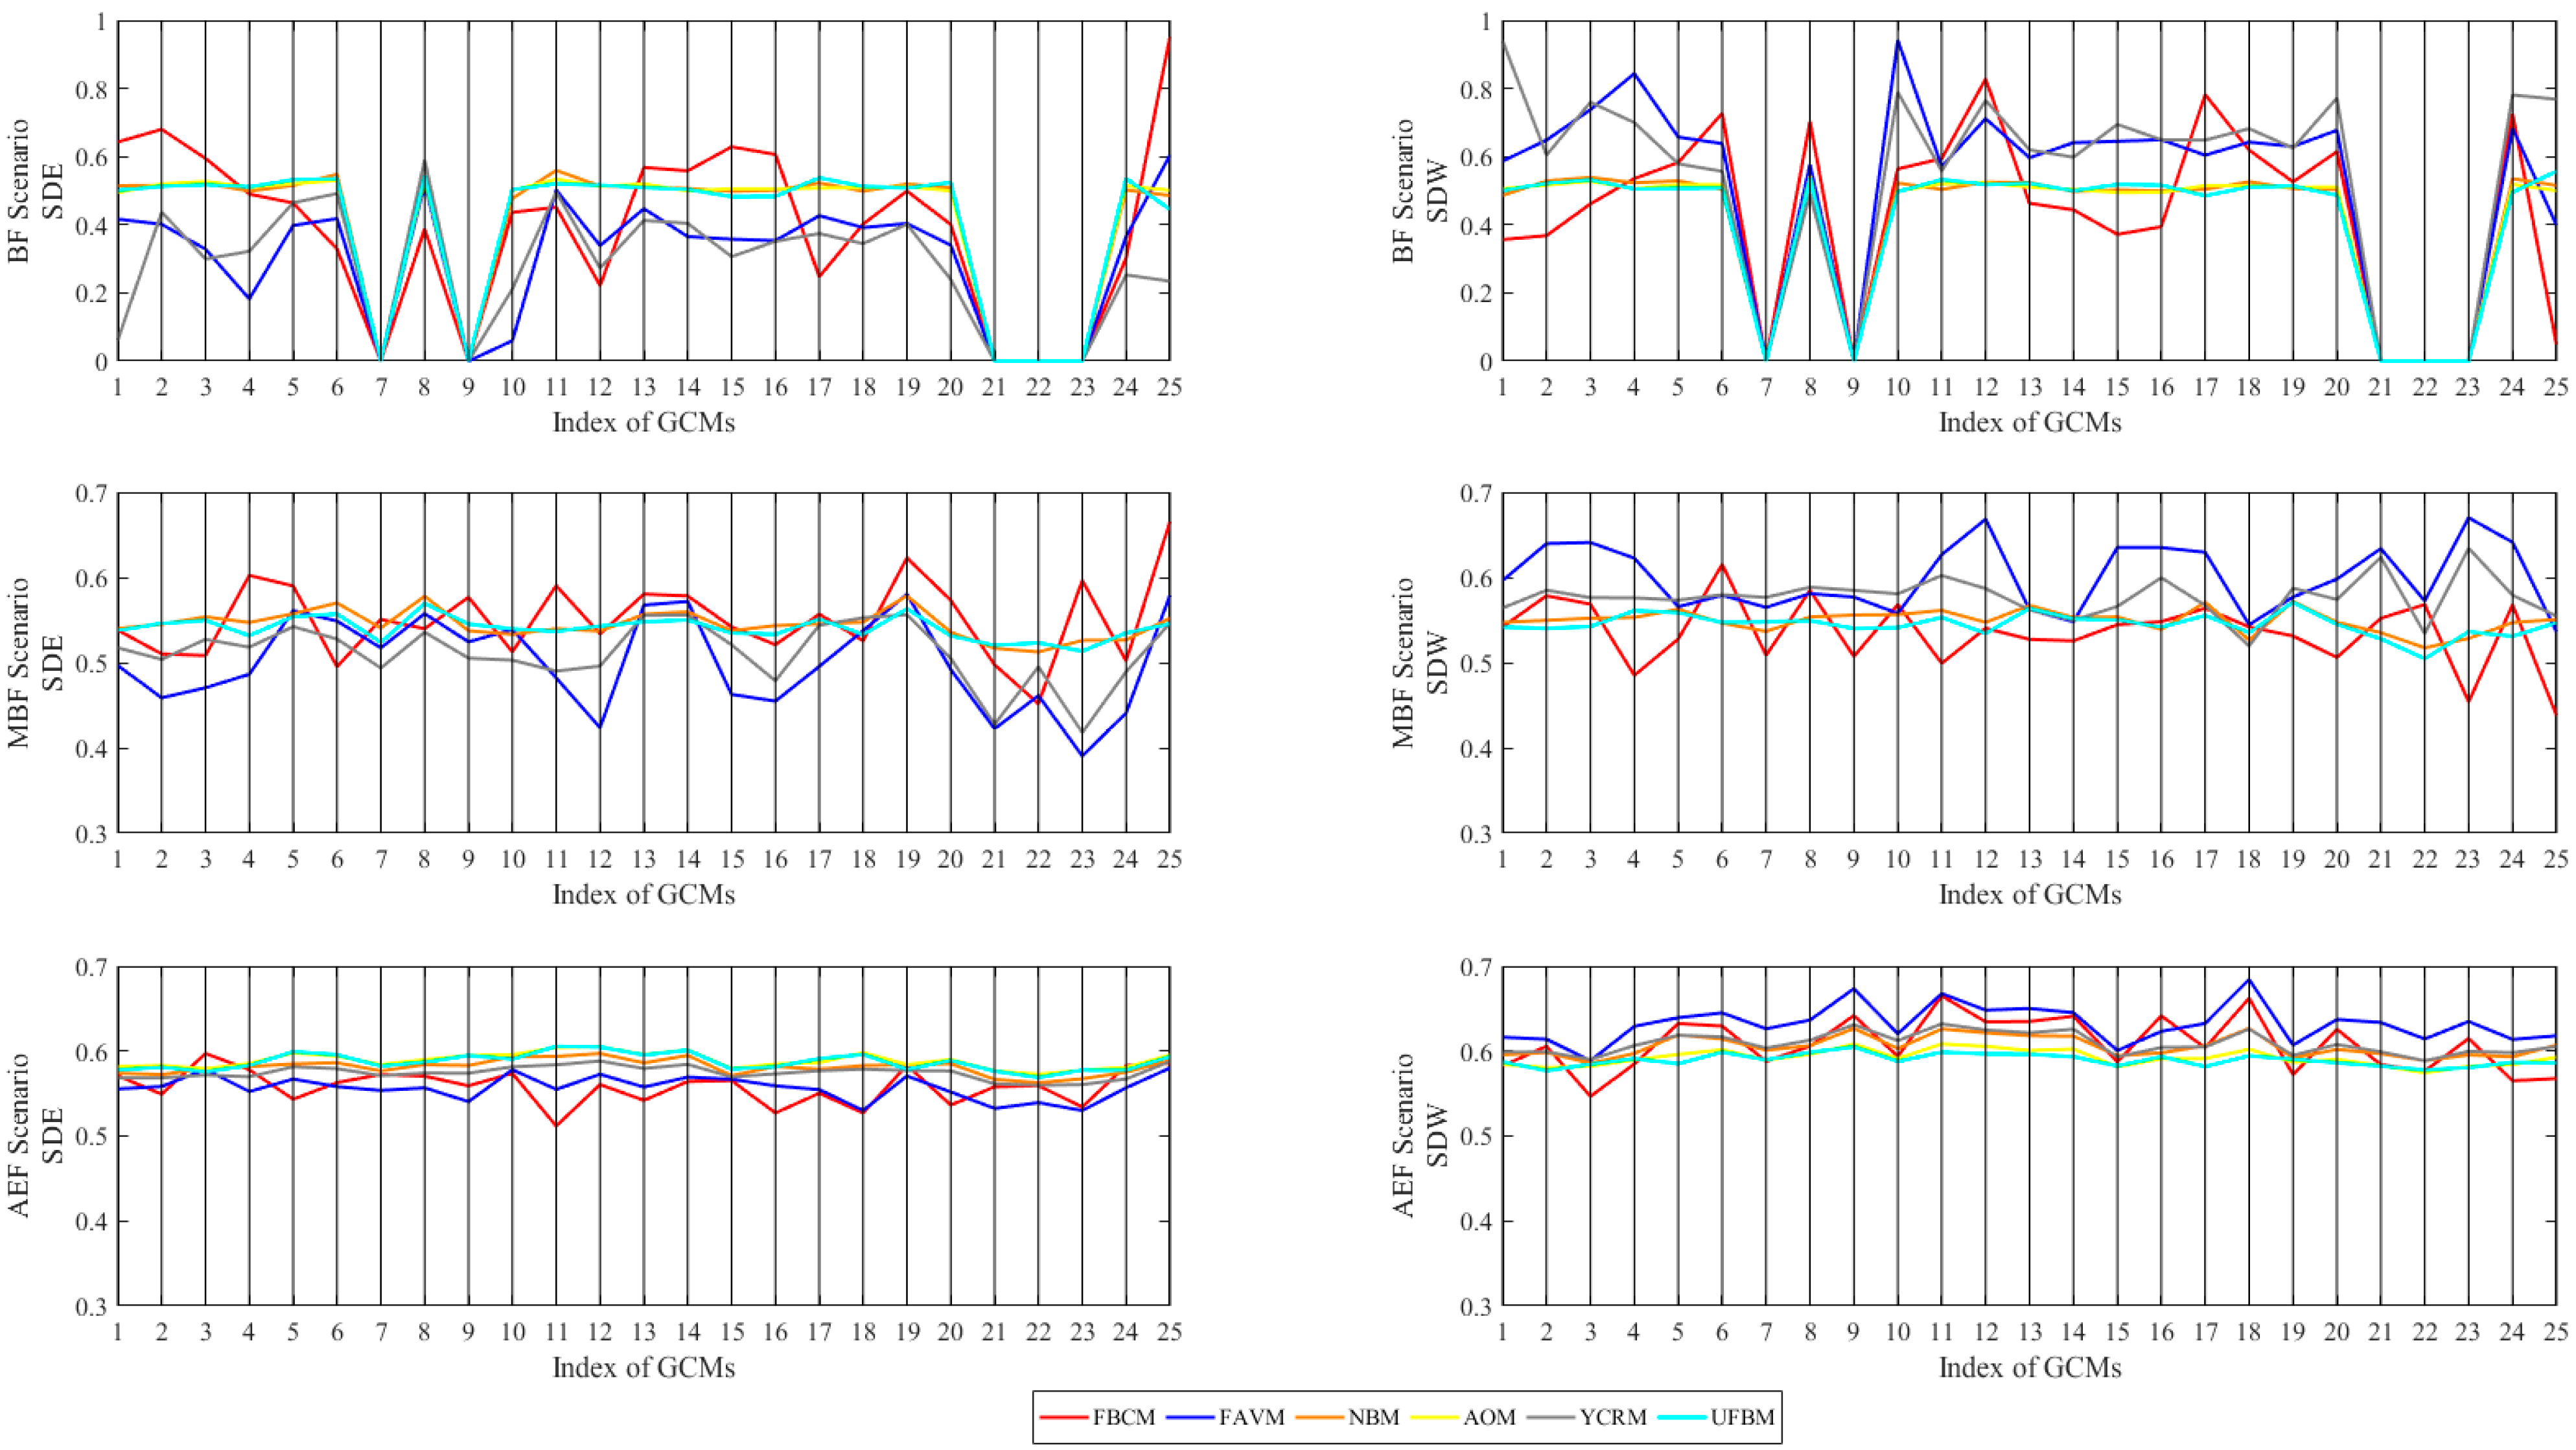
Figure 9 shows the SDE and SDW related to the selected strategies using the six conflict-resolution methods for future periods under different EF patterns and GCMs. From Figure 9, it is observed that for BF and MBF patterns, there is a wider fluctuation range for the SDE and SDW obtained by FBCM, FAVM, and YCRM than by NBM, AOM, and UFBM for the 25 GCMs scenarios. Table 4 shows the average SDE and SDW obtained by the six conflict-resolution methods from 25 GCMs scenarios for three EF patterns. From Table 4, it is observed that for the same EF pattern, there is a significantly smaller difference between the average SDE and SDW obtained by NBM, AOM, and UFBM than by FBCM, FAVM, and YCRM. In addition, the average SDE and SDW obtained by NBM, AOM, and UFBM for each EF pattern are more similar than those obtained by FBCM, FAVM and YCRM.
Because the strategy-selections of NBM, AOM, and UFBM are stable and unaffected by GCM scenarios, it can be concluded that the average SDE and SDW obtained by NBM, AOM, and UFBM for three EF patterns are nearly (0.51, 0.51), (0.54, 0.54), and (0.59, 0.59), respectively. Since the stability of strategy-selections of FBCM, FAVM, and YCRM under the AEF pattern is acceptable, considering climate change, the average SDE and SDW obtained by these methods in the future period are (0.56, 0.60), (0.56, 0.63), and (0.57, 0.61).
4.4. Discussion
Simulating hydrological responses to climate change involves multiple steps, which contributes multi-source uncertainties. For example, the choices of emission scenarios, GCMs, downscaling methods, hydrological models and hydrological model parameters can influence the hydrological simulations. In our paper, the future climate simulations are based on 25GCMs, which were downscaled by quantile mapping to refine the coarse resolution and eliminate systematic bias; then the outputs of quantile mapping are used as the inputs of two-parameter monthly water balance model to predict the monthly inflow for 2021–2082. It is indicated that the prediction errors mainly come from the simulation of GCMs and two-parameter monthly water balance model.
Many studies have investigated these uncertainties on watershed hydrology [18,35,36]. Zhang et al. [37] investigated the overall uncertainty and the relative contribution of each uncertainty component for hydrological simulations over 408 watersheds in China by using 3 emission scenarios, 21 GCMs, 8 downscaling methods, 4 hydrological models, and 2 sets of optimized hydrological model parameters. They found that the uncertainty related to GCMs contributes most with the percentage of 60%, followed by the uncertainty related to hydrological models (approximately 7%) and downscaling methods (less than 1%). Additionally, the two-parameter monthly water balance model shows good performance on the calibration and validation period, with the Nash efficiency coefficient of 0.94 and 0.88. The future inflow prediction errors caused by hydrological model are limited. Therefore, our study focuses on the uncertainty of GCMs.
In order to fully consider the uncertainty of climate simulations, our study use 25 GCMs from Coupled Model Intercomparison Project Phase 5. According to our analyses, it can be found that the strategy-selections of NBM, AOM, and UFBM are stable and unaffected by GCM scenarios, which tend to select the balanced strategy that satisfy the hydropower and environmental stakeholders equally. However, the strategy-selections of FBCM, FAVM, and YCRM are sensitive to the choices of GCMs. The difference of decision stability between the former and the latter three methods may be derived from the different decision theories. Given that NBM, AOM, and UFBM belong to GTBM, it is indicated that through the bargaining based on individual rationality and preference, the compromised strategies for stakeholders with conflicting interests can be obtained with high probability.
Although the satisfied degrees of the hydropower and environmental stakeholders are nearly the same for every balanced operation strategy, the balanced operation strategies selected for water-conflict years are different. This is because that for each water-conflict year, the non-dominated solutions obtained from multi-objective model are specific, and thus, the balanced operation strategies selected from the non-dominated solutions under water-conflict years are different. Therefore, considering climate change, the balanced strategies obtained by NBM, AOM, and UFBM are varied. Due to the pivotal nature of balanced strategies, which can satisfy two stakeholders equally, the balanced strategies can adapt to resolve the conflict between hydropower generation and environmental protection under diverse water-deficit patterns, and contribute to sustainable hydropower management.
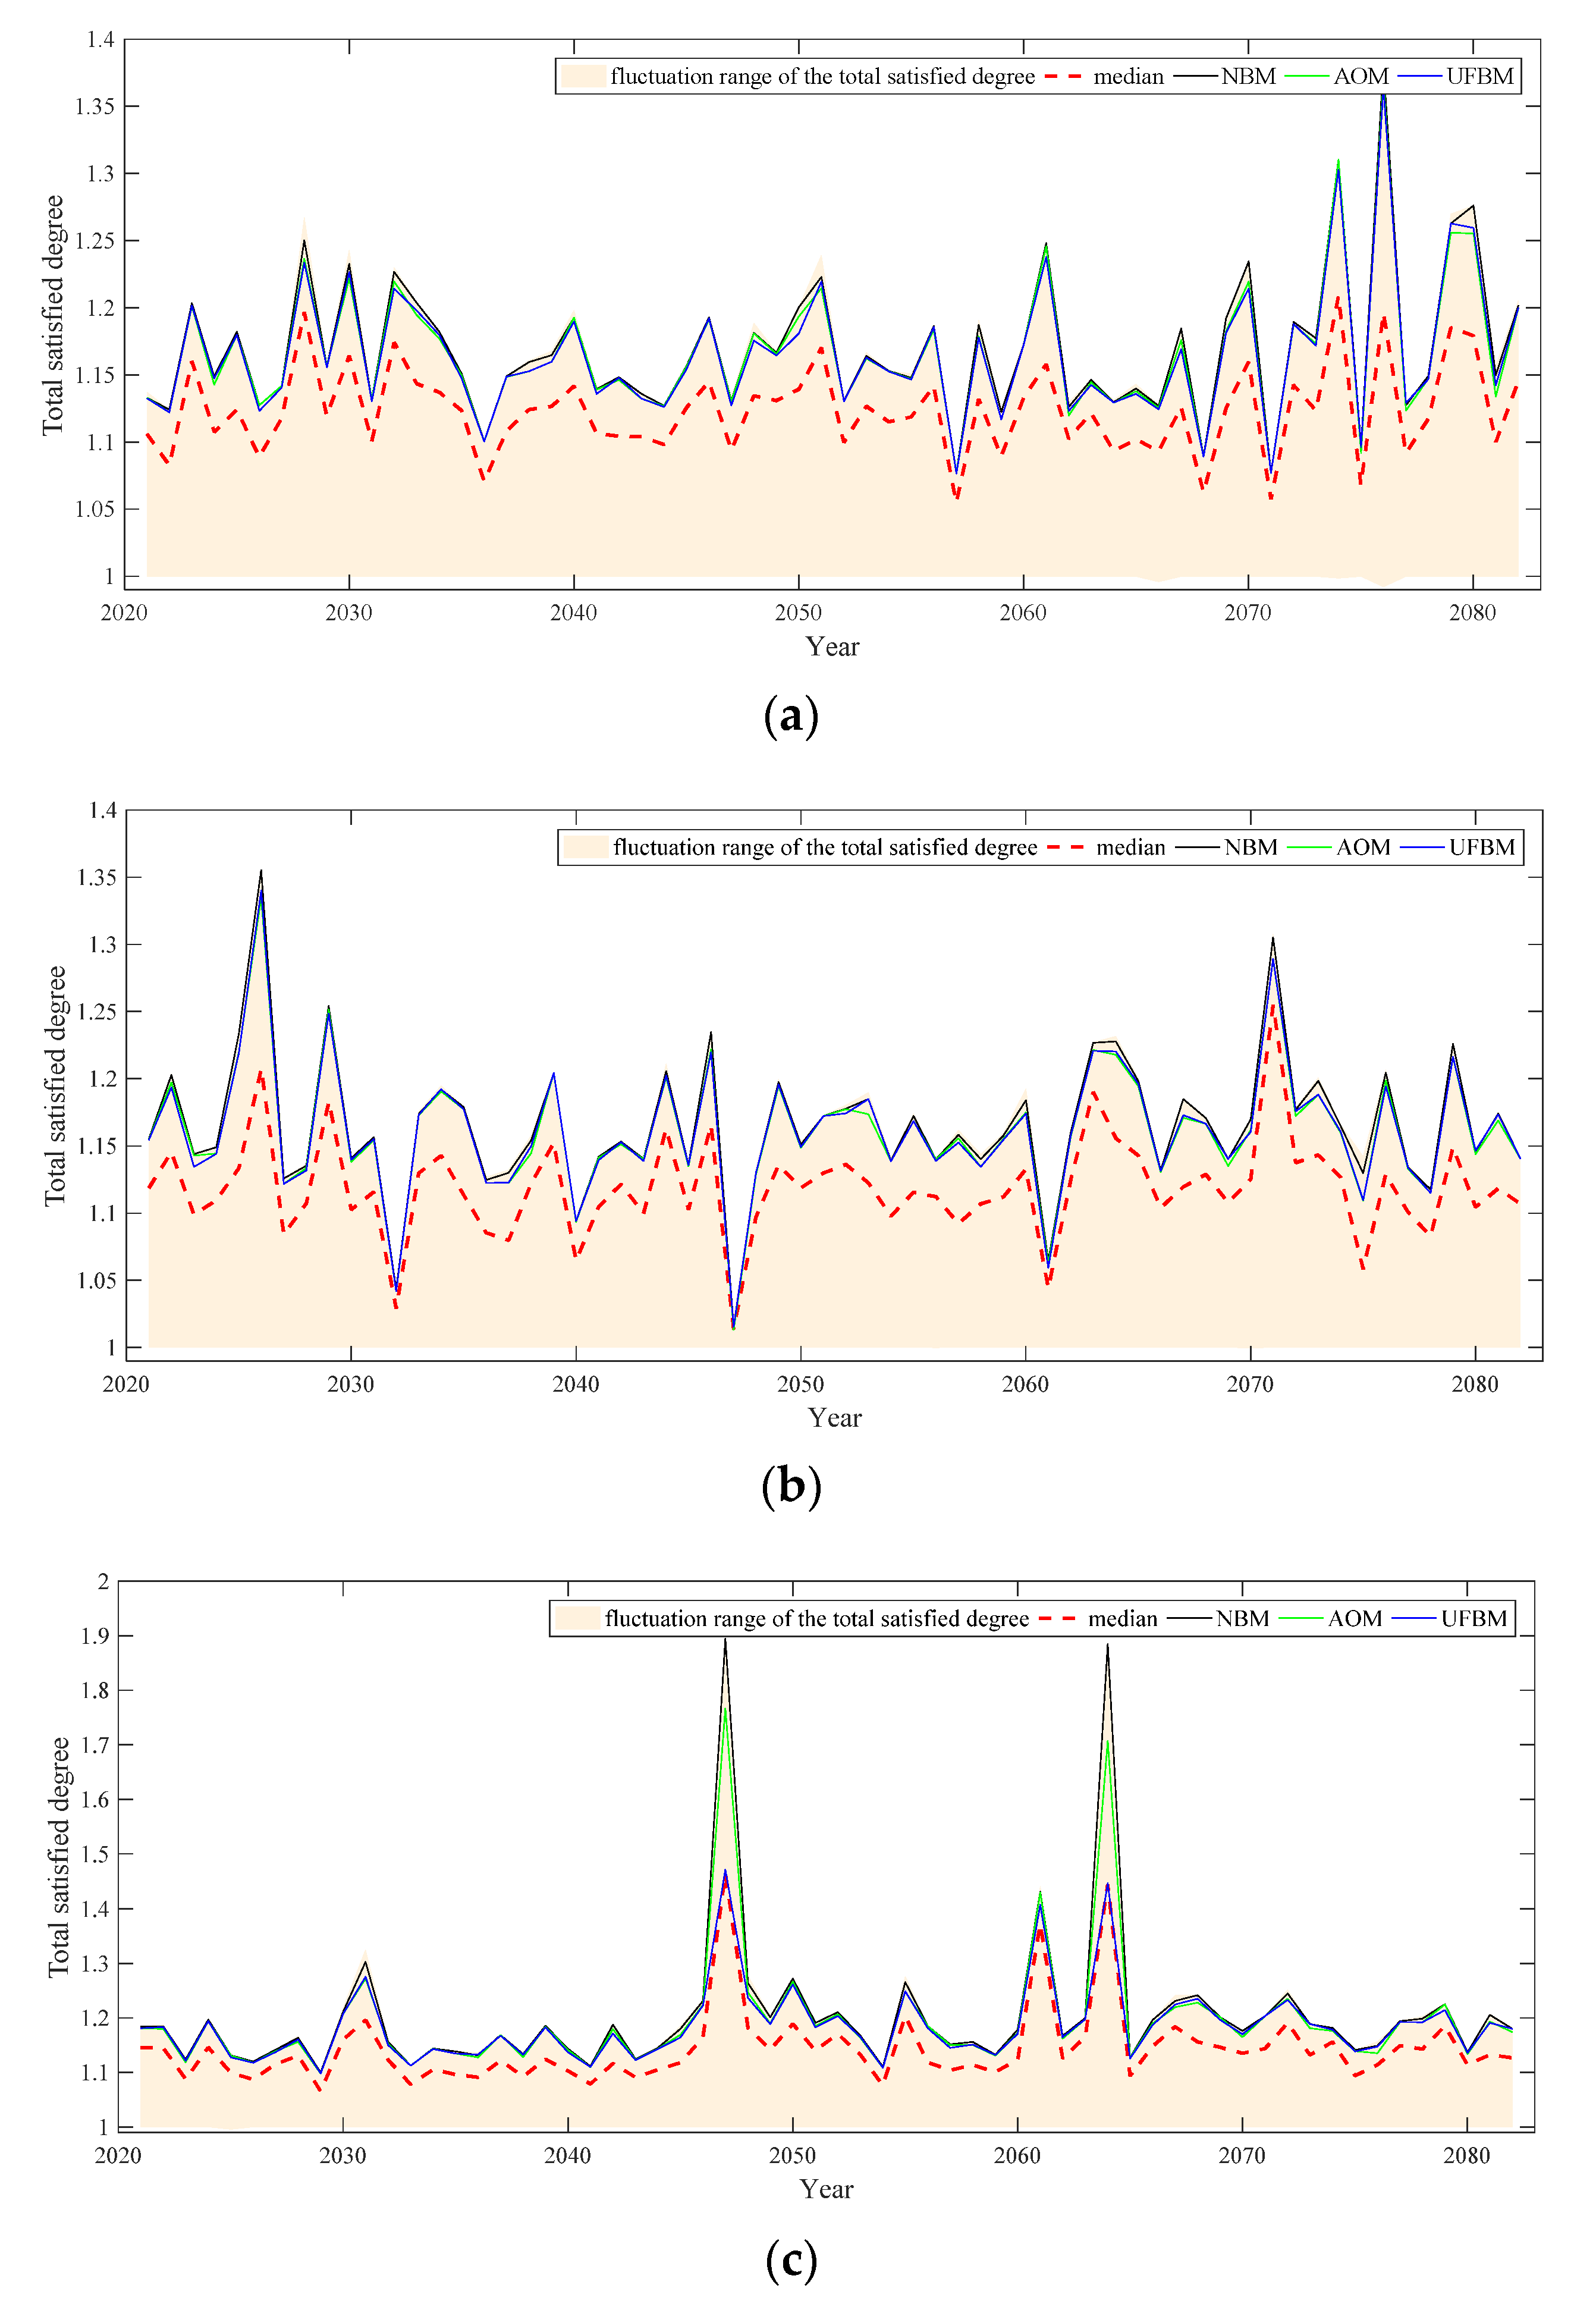
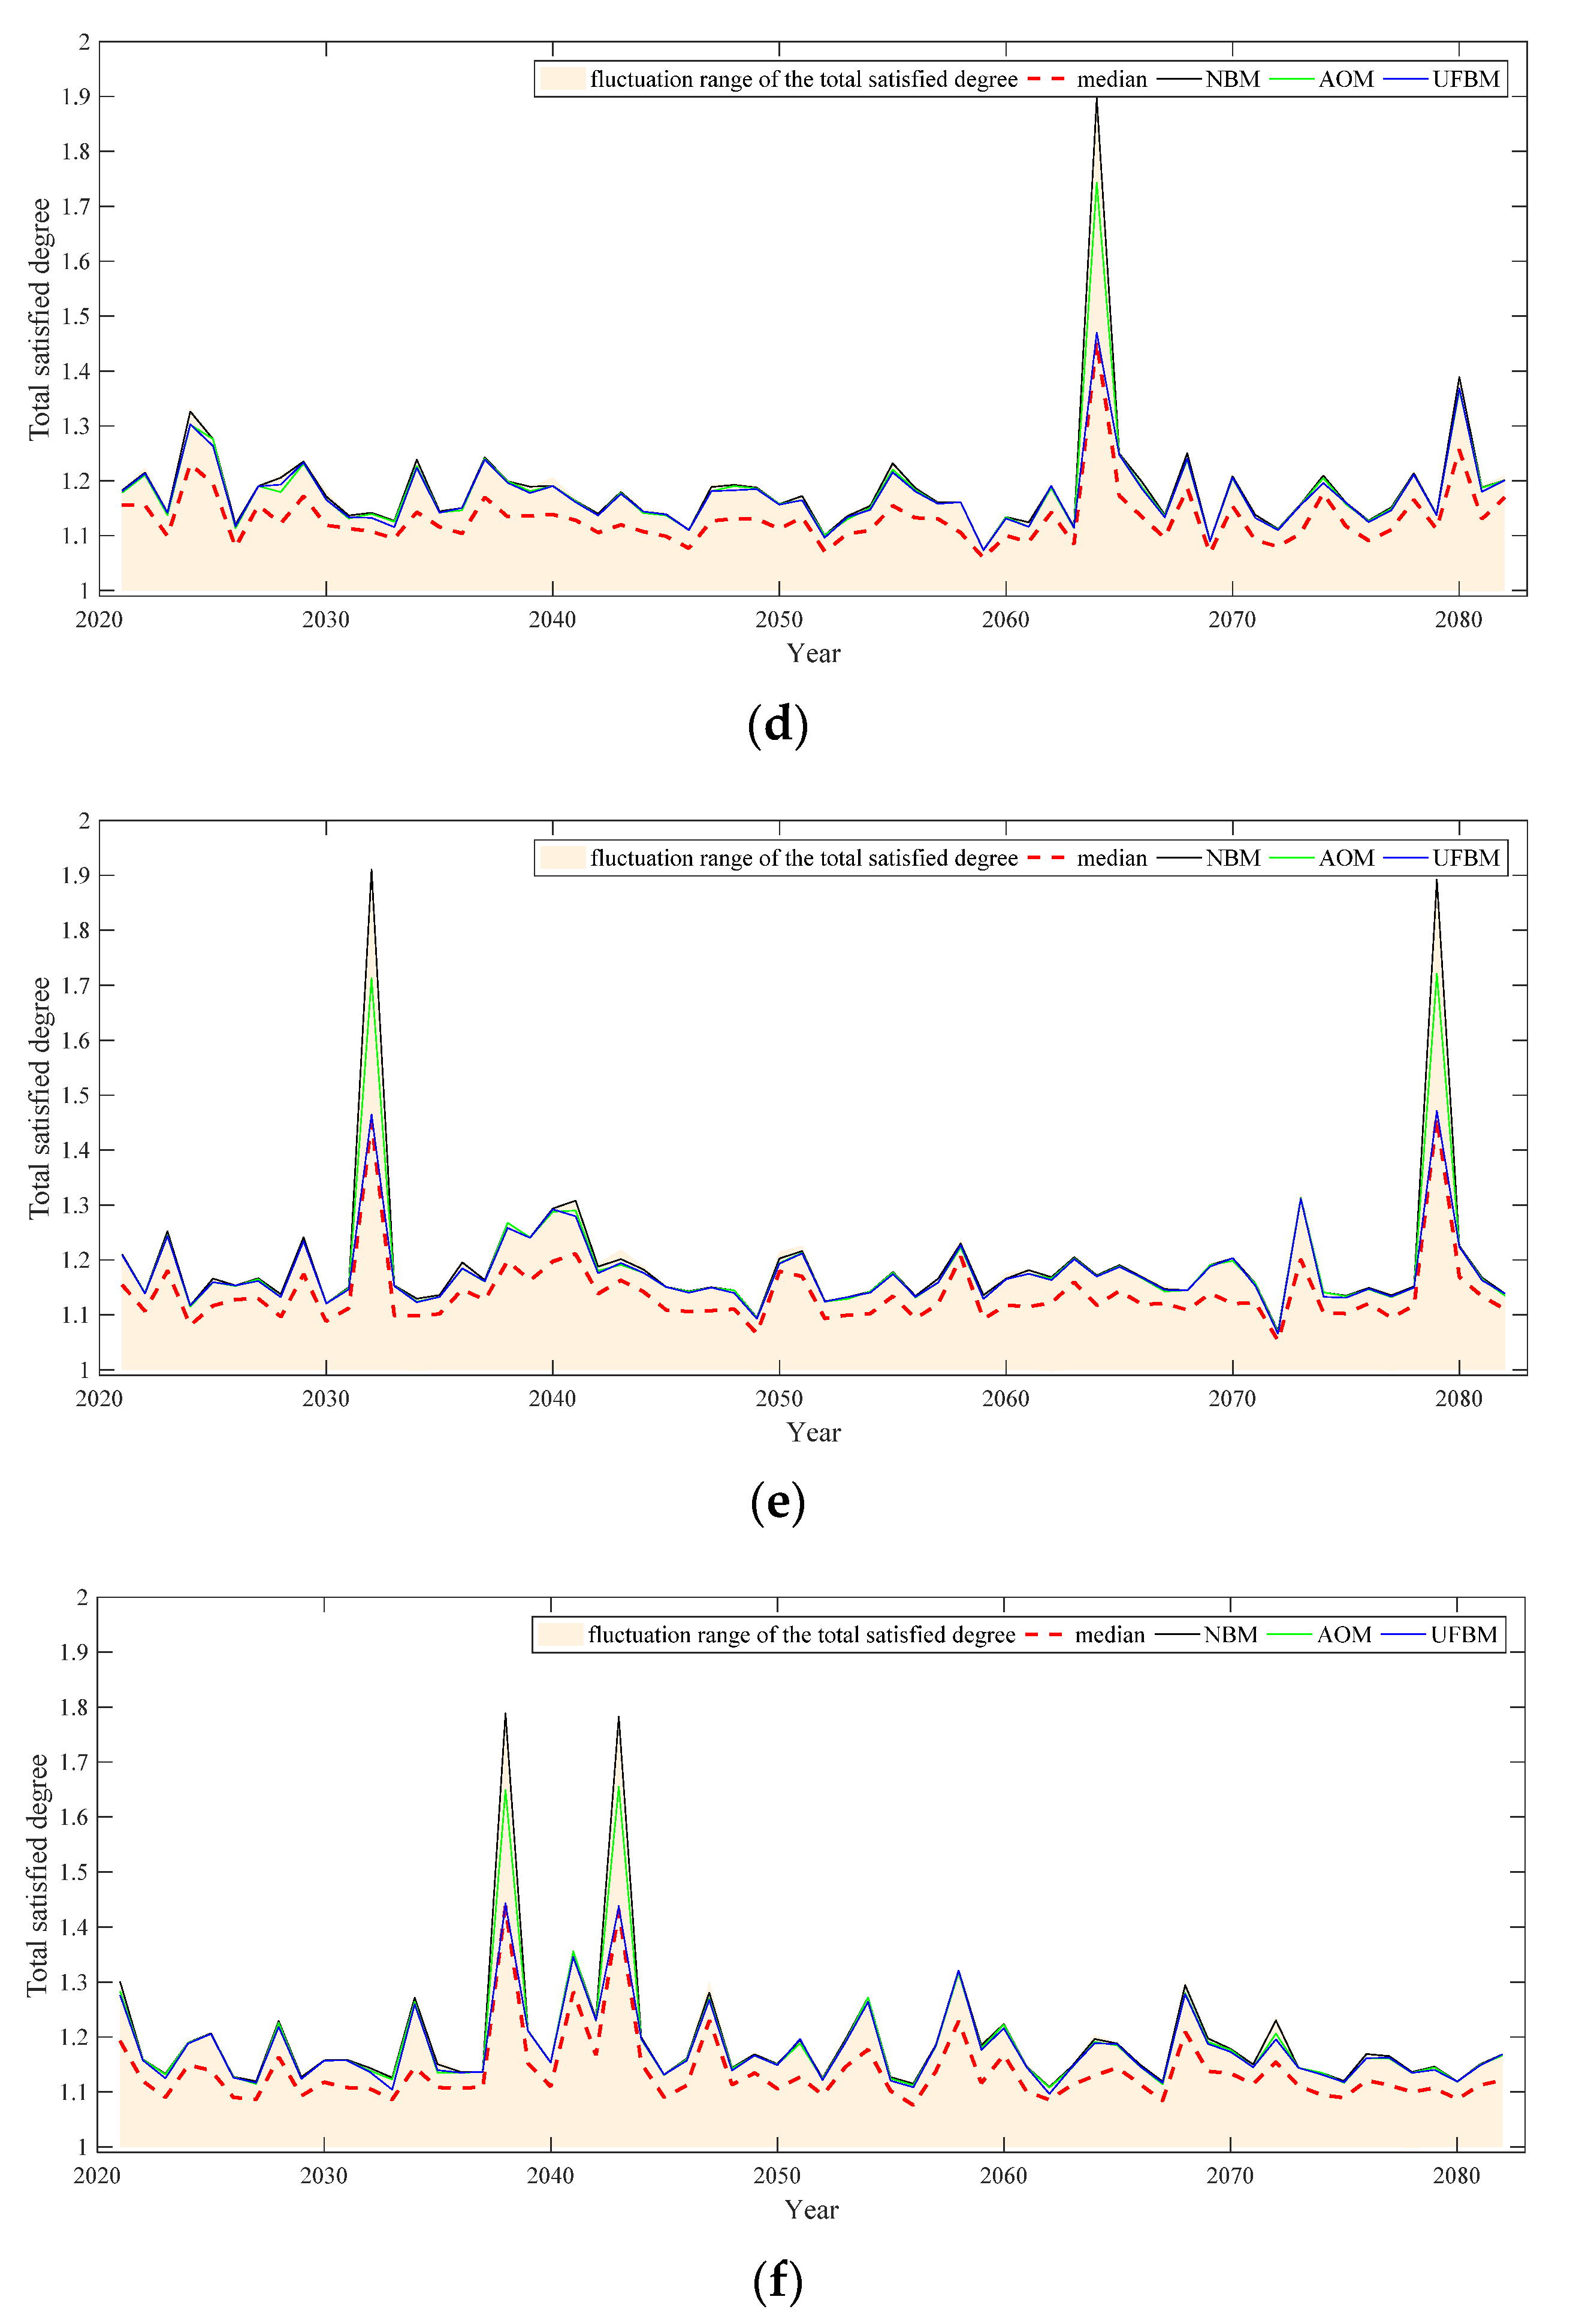
Additionally, the satisfaction levels for the balanced strategies selected by NBM, AOM, and UFBM are also discussed in this paper. To achieve this goal, the satisfied degrees of two stakeholders are added for each non-dominated strategy under different GCMs and EF patterns, named “total satisfied degree of each non-dominated strategy”. Considering the results under different GCMs and EF patterns are similar, the paper presents the analyses based on GCM1, 5, 10, 15, 20, 25 under AEF pattern only, shown in Figure 10.
In Figure 10, the light orange shadow indicates the fluctuation range of the total satisfied degrees of the non-dominated strategies for each water-conflict year under GCM1, 5, 10, 15, 20, 25 and AEF pattern; the red dotted line indicates the median of the total satisfied degrees of the non-dominated strategies; the black, green, and blue lines indicate the total satisfied degree of the balanced strategy selected by NBM, AOM and UFBM for each water-conflict year, respectively. The figure shows that the black, green, and blue lines fluctuate above the median and near to the maximum of total satisfied degrees of the non-dominated strategies for each water-conflict year. It is indicated that the satisfaction levels of the balanced strategies selected by the three methods are very high among the non-dominated strategies for each water-conflict year based on GCM1, 5, 10, 15, 20, 25 under AEF pattern. Therefore, the strategy-selections of NBM, AOM and UFBM not only satisfy two stakeholders equally, but also avoid the very low level of the total satisfied degree in any one of the future water-conflict years.
5. Conclusions
This paper mainly analyzed the impacts of climate change on hydropower-environmental conflict-resolution management. For this study goal, fuzzy Borda counting method (FBCM), fuzzy approval voting method (FAVM), Nash bargaining method (NBM), alternating offer method (AOM), Young conflict-resolution method (YCRM), and unanimity fallback bargaining method (UFBM) were used to select socio-optimal strategies for multi-objective reservoir operation considering hydropower and environmental benefits in a future period (2021–2082) under the RCP4.5 scenario with 25 GCMs. Evaluating the decision performance of these conflict-resolution methods shows the following main conclusions:
- (1)
- Compared to FBCM, FAVM, and YCRM, the strategy-selections of NBM, AOM, and UFBM are more stable and unaffected by climate change.
- (2)
- For the same environmental flow pattern, there is a significantly smaller difference between the average SDE and SDW obtained by NBM, AOM, and UFBM from the 25 GCMs than those obtained by FBCM, FAVM, and YCRM. In addition, the average SDE and SDW obtained by NBM, AOM, and UFBM from the 25 GCMs are more similar than those obtained by FBCM, FAVM, and YCRM.
- (3)
- Based on the stability of the conflict-resolution decisions of NBM, AOM, and UFBM under climate change, the average SDE and SDW obtained by the three methods for three environmental flow patterns in the future period are (0.51,0.51), (0.54,0.54), and (0.59,0.59), respectively. In addition, considering climate change, the average SDE and SDW obtained by FBCM, FAVM, and YCRM based on an appropriate environmental flow pattern in the future period are (0.56, 0.60), (0.56, 0.63), and (0.57, 0.61), respectively.
These conclusions indicate that the conflict-resolution decisions of NBM, AOM, and UFBM are sustainable for hydropower–environmental management given unforeseen climate changes. Balanced strategies selected by these three methods could formulate adaptable reservoir operation policies that would satisfy the interests of hydropower and environmental stakeholders equally, and avoid a very low satisfaction level of individual stakeholder and whole stakeholders in the water-conflict year. Therefore, against the background of an increasing demand for environmental protection, these three methods can provide a win–win strategy considering social and economic benefits for hydropower management. Based on the socio-optimal strategy, hydropower management can be more sustainable.
Author Contributions
Conceptualization, Y.X. and Y.H.; methodology, Y.X.; software, Y.X.; validation, Y.H.; formal analysis, Y.X.; investigation, Y.X.; resources, Y.X.; data curation, Y.H.; writing—original draft preparation, Y.X.; writing—review and editing, Y.X.; project administration, Y.X.; funding acquisition, Y.X. All authors have read and agreed to the published version of the manuscript.
Funding
This research was funded by Natural Science Foundation of Hubei Province, China, grant number 2020CFB327.
Institutional Review Board Statement
Not applicable.
Informed Consent Statement
Not applicable.
Data Availability Statement
The precipitation, maximum and minimum temperature data were acquired from the National Meteorological Information Center (http://data.cma.cn/, accessed on 31 July 2021); the observed daily inflows data were acquired from the Bureau of Hydrology of ChangJiang Water Resources Commission; and the daily precipitation, maximum and minimum temperature data, simulated by 25 GCMs, were obtained from the database of the Coupled Model Intercomparison Project Phase 5.
Acknowledgments
This research is supported by the Natural Science Foundation of Hubei Province, China (2020CFB327). Sincere gratitude is extended to the editor and the anonymous reviewers for their professional comments and corrections.
Conflicts of Interest
The authors declare no conflict of interest.
References
- Hardin, G. The Tragedy of the commons. Science 1968, 162, 1243–1248. [Google Scholar] [CrossRef] [PubMed]
- Chhuon, K.; Herrera, E.; Nadaoka, K. Application of integrated hydrologic and river basin management modeling for the optimal development of a multi-purpose reservoir project. Water Resour. Manag. 2016, 30, 3143–3157. [Google Scholar] [CrossRef]
- Ebert, U.; Welsch, H. Meaningful environmental indices: A social choice approach. J. Environ. Econ. Manag. 2004, 47, 270–283. [Google Scholar] [CrossRef]
- de Borda, J.C. Memoire, sur les Elections au Scrutin. Histoire de I’Academie Royale des Sciences Année 1781; University of Michigan Press: Ann Arbor, MI, USA, 1995. [Google Scholar]
- Brams, S.J.; Fishburn, P.C. Approval voting. Am. Political Sci. Rev. 1978, 72, 831–847. [Google Scholar] [CrossRef]
- Lin, X.; Yacoub, S.; Burns, J.; Simske, S. Performance analysis of pattern classifier combination by plurality voting. Pattern Recogn. Lett. 2003, 24, 1959–1969. [Google Scholar] [CrossRef]
- Madani, K. Game theory and water resources. J. Hydrol. 2010, 381, 225–238. [Google Scholar] [CrossRef]
- Nash, J. Two person cooperative games. Econometrica 1953, 21, 128–140. [Google Scholar] [CrossRef]
- Rubinstein, A. A Sequential Theory of Bargaining; Stanford University: Stanford, CA, USA, 1985. [Google Scholar]
- Brams, S.J.; Kilgour, D.M. Fallback bargaining. Group Decis. Negot. 2001, 10, 287–316. [Google Scholar] [CrossRef]
- D’Angelo, A.; Eskandari, A.; Szidarovszky, F. Social choice procedures in water-resource management. J. Environ. Manag. 1998, 52, 203–210. [Google Scholar] [CrossRef]
- Kant, S.; Lee, S. A social choice approach to sustainable forest management: An analysis of multiple forest values in Northwestern Ontario. Forest Policy Econ. 2004, 6, 215–227. [Google Scholar] [CrossRef]
- Alizadeh, M.R.; Nikoo, M.R.; Rakhshandehroo, G.R. Developing a multi-objective conflict-resolution model for optimal groundwater management based on fallback bargaining models and social choice rules: A case study. Water Resour. Manag. 2017, 31, 1457–1472. [Google Scholar] [CrossRef]
- Nurmi, H. Approaches to collective decision making with fuzzy preference relations. Fuzzy Sets Syst. 1981, 6, 249–259. [Google Scholar] [CrossRef]
- Xu, Y.; Fu, X.; Chu, X. Analyzing the impacts of climate change on hydro-environmental conflict-resolution management. Water Resour. Manag. 2019, 33, 1591–1607. [Google Scholar] [CrossRef]
- Barnett, T.P.; Pierce, D.W.; Hidalgo, H.G.; Bonfils, C.; Santer, B.D.; Das, T.; Bala, G.; Wood, A.W.; Nozawa, T.; Mirin, A.A.; et al. Human induced changes in the hydrology of the western United States. Science 2008, 319, 1080–1083. [Google Scholar] [CrossRef] [PubMed] [Green Version]
- Wang, B.; Liang, X.-J.; Zhang, H.; Wang, L.; Wei, Y.-M. Vulnerability of hydropower generation to climate change in China: Results based on Grey forecasting model. Energy Pol. 2014, 65, 701–707. [Google Scholar] [CrossRef]
- Shen, M.; Chen, J.; Zhuan, M.; Chen, H.; Xu, C.; Xiong, L. Estimating uncertainty and its temporal variation related to global climate models in quantifying climate change impacts on hydrology. J. Hydrol. 2018, 556, 10–24. [Google Scholar] [CrossRef]
- Ashofteh, P.S.; Bozorg-Haddad, O.; Loáiciga, H.A. Impacts of climate change on the conflict between water resources and agricultural water use. J. Irrig. Drain. Eng. 2017, 43, 02516002. [Google Scholar] [CrossRef]
- Mandal, S.; Arunkumar, R.; Breach, P.A.; Simonovic, S.P. Reservoir operations under changing climate conditions: Hydropower-production perspective. J. Water Resour. Plann. Manag. 2019, 145, 04019016. [Google Scholar] [CrossRef]
- Golfam, P.; Ashofteh, P.; Rajaee, T.; Chu, X. Prioritization of water allocation for adaptation to climate change using multi-criteria decision making (MCDM). Water Resour. Manag. 2019, 33, 3401–3416. [Google Scholar] [CrossRef]
- Yi, Y.-J.; Wang, Z.-Y.; Yang, Z.-F. Impact of the Gezhouba and Three Gorges Dams on habitat suitability of carps in the Yangtze River. J. Hydrol. 2010, 387, 283–291. [Google Scholar] [CrossRef]
- Cai, W.; Zhang, L.; Zhu, X.; Zhang, A.; Yin, J.; Wang, H. Optimized reservoir operation to balance human and environmental requirements: A case study for the Three Gorges and Gezhouba Dams, Yangtze River basin, China. Ecol. Infor. 2013, 18, 40–48. [Google Scholar] [CrossRef]
- Camici, S.; Brocca, L.; Melone, F.; Moramarco, T. Impact of climate change on flood frequency using different climate models and downscaling approaches. J. Hydrol. Eng. 2013, 19, 04014002. [Google Scholar] [CrossRef]
- Sangelantoni, L.; Russo, A.; Gennaretti, F. Impact of bias correction and downscaling through quantile mapping on simulated climate change signal: A case study over Central Italy. Theor. Appl. Climatol. 2018, 135, 1–16. [Google Scholar] [CrossRef]
- Xiong, L.; Guo, S. A two-parameter monthly water balance model and its application. J. Hydrol. 1999, 216, 111–123. [Google Scholar] [CrossRef]
- Thornthwaite, C.W. An approach toward a rational classification of climate. Geograph. Rev. 1948, 38, 55–94. [Google Scholar] [CrossRef]
- Xu, C.-Y.; Singh, V.P. Evaluation and generalization of temperature-based methods for calculating evaporation. Hydrol. Process. 2001, 15, 305–319. [Google Scholar] [CrossRef] [Green Version]
- Palau, A.; Alcázar, J. The basic flow method for incorporating flow variability in environmental flows. River Res. Appl. 2012, 28, 93–102. [Google Scholar] [CrossRef]
- García-Lapresta, J.L.; Martínez-Panero, M. Borda count versus approval voting: A fuzzy approach. Publ. Choice 2002, 112, 167–184. [Google Scholar] [CrossRef]
- Carraro, C.; Sgobbi, A. Modelling negotiated decision making in environmental and natural resource management: A multilateral, multiple issues, non-cooperative bargaining model with uncertainty. Automatica 2008, 44, 1488–1503. [Google Scholar] [CrossRef]
- Young, H.P. An evolutionary model of bargaining. J. Econ. Theory 1993, 59, 145–168. [Google Scholar] [CrossRef]
- Wang, X.-M.; Zhou, J.-Z.; Ouyang, S.; Zhang, Y. TGC eco-friendly generation multi-objective optimal dispatch model and its solution algorithm. J. Hydraul. Eng. 2013, 44, 154–163. (In Chinese) [Google Scholar]
- Deb, K.; Pratap, A.; Agarwal, S.; Meyarivan, T. A fast and elitist multiobjective genetic algorithm: NSGA-II. IEEE Trans. Evol. Comput. 2002, 6, 182–197. [Google Scholar] [CrossRef] [Green Version]
- Chen, J.; Brissette, F.P.; Poulin, A.; Leconte, R. Overall uncertainty study of the hydrological impacts of climate change for a Canadian watershed. Water Resour. Res. 2011, 47, W12509. [Google Scholar] [CrossRef]
- Wang, H.; Chen, J.; Xu, C.; Zhang, J.; Chen, H. A framework to quantify the uncertainty contribution of GCMs over multiple sources in hydrological impacts of climate change. Earths Future 2020, 8, e2020EF001602. [Google Scholar] [CrossRef]
- Zhang, S.; Chen, J.; Gu, L. Overall uncertainty of climate change impacts on watershed hydrology in China. Int. J. Climatol. 2021. [Google Scholar] [CrossRef]
Figure 1.
Flow chart of methodology.

Figure 2.
Structure of two-parameter monthly water balance model.

Figure 3.
Illustration of the calculation of the satisfied degrees of hydropower stakeholder and environmental stakeholder.
Figure 3.
Illustration of the calculation of the satisfied degrees of hydropower stakeholder and environmental stakeholder.

Figure 4.
Locations upstream of Three Gorges Hydroelectric Power Station and meteorological stations. m a.s.l., meters above sea level.
Figure 4.
Locations upstream of Three Gorges Hydroelectric Power Station and meteorological stations. m a.s.l., meters above sea level.

Figure 5.
Projected (2021–2082) mean monthly inflow (m3/s) generated by 25 GCMs (BF: basic flow; MBF: maintenance basic flow; AEF: appropriate environmental flow).
Figure 5.
Projected (2021–2082) mean monthly inflow (m3/s) generated by 25 GCMs (BF: basic flow; MBF: maintenance basic flow; AEF: appropriate environmental flow).

Figure 6.
Water-conflict years under different EF patterns and GCMs for future periods: each red point indicate the water-conflict year (EF: environmental flow; BF: basic flow; MBF: maintenance basic flow; AEF: appropriate environmental flow).
Figure 6.
Water-conflict years under different EF patterns and GCMs for future periods: each red point indicate the water-conflict year (EF: environmental flow; BF: basic flow; MBF: maintenance basic flow; AEF: appropriate environmental flow).

Figure 7.
Changes in hydropower benefits and water deficit according to the non-dominated strategies for each water-conflict year under different GCMs and EF patterns: (a) BF pattern, (b) MBF pattern, (c) AEF pattern (BF: basic flow; MBF: maintenance basic flow; AEF: appropriate environmental flow).


Figure 8.
SSDE and SSDW obtained by six conflict-resolution methods under different GCMs and EF patterns (FBCM: fuzzy Borda counting method; FAVM: fuzzy approval voting method; NBM: Nash bargaining method; AOM: alternating offer method; YCRM: Young conflict-resolution method; UFBM: unanimity fallback bargaining method; BF: basic flow; MBF: maintenance basic flow; AEF: appropriate environmental flow; SSDE: standard deviation of hydropower stakeholder’ satisfied degree value; SSDW: standard deviation of environmental stakeholder’ satisfied degree value).

Figure 9.
SDE and SDW obtained by six conflict-resolution methods under different GCMs and EF patterns (FBCM: fuzzy Borda counting method; FAVM: fuzzy approval voting method; NBM: Nash bargaining method; AOM: alternating offer method; YCRM: Young conflict-resolution method; UFBM: unanimity fallback bargaining method; BF: basic flow; MBF: maintenance basic flow; AEF: appropriate environmental flow; SDE: average of the satisfied degrees of hydropower stakeholder for certain GCM scenario and EF pattern; SDW: average of the satisfied degrees of environmental stakeholder for certain GCM scenario and EF pattern).

Figure 10.
Satisfaction levels for the balanced strategies selected by NBM, AOM, and UFBM for each water-conflict year based on different GCMs under AEF pattern: (a) GCM1; (b) GCM5; (c) GCM10; (d) GCM15; (e) GCM20; (f) GCM25 (NBM: Nash bargaining method; AOM: alternating offer method; UFBM: unanimity fallback bargaining method; AEF: appropriate environmental flow).


Table 1.
Detailed information about 25GCMs.
| ID | Model Name | Modelling Center | Institution | Resolution |
|---|---|---|---|---|
| 1 | ACCESS1.0 | CSIRO-BOM | Commonwealth scientific and industrial research organization (CSIRO) and Bureau of Meteorology (BOM), Australia | 1.875 × 1.25 |
| 2 | ACCESS1.3 | 1.875 × 1.25 | ||
| 3 | BCC-CSM1.1(m) | BCC | Beijing climate center, China meteorological administration | 1.125 × 1.25 |
| 4 | BNU-ESM | |||
| 5 | CMCC-CMS | CMCC | Centro euro-Mediterraneo per I Cambiamenti Climatici | 1.9 × 1.9 |
| 6 | CMCC-CM | 0.75 × 0.75 | ||
| 7 | CNRM-CM5 | CNRM-CERFACS | Centre national de Recherches Meteorologiques/Centre Europeen de Recherche et formation Avancee en Calcul Scientifique | 1.4 × 1.4 |
| 8 | CSIRO-Mk3.6.0 | CSIRO-QCCCE | Commonwealth scientific and industrial research organization in collaboration with Queensland climate change Centre of Excellence | 1.9 × 1.9 |
| 9 | CanESM2 | CCCMA | Canadian Centre for climate modelling and analysis | 2.8 × 2.8 |
| 10 | FGOALS-g2 | |||
| 11 | GFDL-CM3 | NOAA GFDL | NOAA geophysical fluid dynamics laboratory | 2.5 × 2.0 |
| 12 | GFDL-ESM2G | 2.5 × 2.0 | ||
| 13 | GFDL-ESM2M | 2.5 × 2.0 | ||
| 14 | GISS-E2-H | NASA GISS | NASA Goddard Institute for Space Studies | 2.5 × 2.0 |
| 15 | GISS-E2-R | 2.5 × 2.0 | ||
| 16 | HadGEM2-CC | MOHC(and INPE) | Met Office Hadley Centre (additional HadGEM2-ES realizations contributed by Instituto Nacional de Pesquisas Espaciais) | 1.875 × 1.25 |
| 17 | HadGEM2-ES | 1.875 × 1.25 | ||
| 18 | IPSL-CM5A-LR | IPSL | Institute Pierre-Simon Laplace | 3.75 × 1.9 |
| 19 | IPSL-CM5A-MR | 2.5 × 1.25 | ||
| 20 | IPSL-CM5B-LR | 3.75 × 1.9 | ||
| 21 | MIROC-ESM-CHEM | MIROC | Japan Agency for Marine-Earth Science and Technology, atmosphere and ocean research institute (the University of Tokyo), and national institute for environmental studies | 2.8 × 2.8 |
| 22 | MIROC-ESM | 2.8 × 2.8 | ||
| 23 | MIROC5 | MIROC | Atmosphere and ocean research institute (the University of Tokyo), National Institute for Environmental Studies, and Japan Agency for Marine-Earth Science and Technology | 1.4 × 1.4 |
| 24 | MRI-CGCM3 | MRI | Meteorological research institute | 1.1 × 1.1 |
| 25 | INM-CM4 | INM | Institute for Numerical Mathematics | 2.0 × 1.5 |
Table 2.
The number of water-conflict years from the future period under different EF patterns and GCMs.
Table 2.
The number of water-conflict years from the future period under different EF patterns and GCMs.
| GCMs | BF Pattern | MBF Pattern | AEF Pattern | GCMs | BF Pattern | MBF Pattern | AEF Pattern |
|---|---|---|---|---|---|---|---|
| 1th | 4 | 45 | 62 | 14th | 12 | 46 | 62 |
| 2th | 5 | 39 | 62 | 15th | 7 | 48 | 62 |
| 3th | 12 | 46 | 62 | 16th | 4 | 43 | 62 |
| 4th | 5 | 47 | 62 | 17th | 5 | 41 | 62 |
| 5th | 14 | 49 | 62 | 18th | 6 | 26 | 62 |
| 6th | 5 | 41 | 62 | 19th | 19 | 56 | 62 |
| 7th | 0 | 25 | 62 | 20th | 5 | 39 | 62 |
| 8th | 9 | 47 | 62 | 21th | 0 | 20 | 62 |
| 9th | 0 | 21 | 62 | 22th | 0 | 24 | 62 |
| 10th | 3 | 49 | 62 | 23th | 0 | 27 | 62 |
| 11th | 7 | 40 | 62 | 24th | 6 | 45 | 62 |
| 12th | 6 | 42 | 62 | 25th | 2 | 48 | 62 |
| 13th | 11 | 52 | 62 |
Note: EF: environmental flow; BF: basic flow; MBF: maintenance basic flow; AEF: appropriate environmental flow.
Table 3.
Average SSDE and SSDW obtained by the six conflict-resolution methods according to different GCMs for each EF patterns.
Table 3.
Average SSDE and SSDW obtained by the six conflict-resolution methods according to different GCMs for each EF patterns.
| EF Pattern | FBCM | FAVM | NBM | AOM | YCRM | UFBM | ||||||
|---|---|---|---|---|---|---|---|---|---|---|---|---|
| Average SSDE | Average SSDW | Average SSDE | Average SSDW | Average SSDE | Average SSDW | Average SSDE | Average SSDW | Average SSDE | Average SSDW | Average SSDE | Average SSDW | |
| BF | 0.30 | 0.29 | 0.25 | 0.23 | 0.03 | 0.03 | 0.02 | 0.02 | 0.22 | 0.20 | 0.03 | 0.04 |
| MBF | 0.31 | 0.31 | 0.20 | 0.18 | 0.06 | 0.06 | 0.05 | 0.06 | 0.15 | 0.13 | 0.05 | 0.06 |
| AEF | 0.20 | 0.22 | 0.08 | 0.10 | 0.04 | 0.06 | 0.04 | 0.04 | 0.04 | 0.06 | 0.05 | 0.04 |
Note: FBCM: fuzzy Borda counting method; FAVM: fuzzy approval voting method; NBM: Nash bargaining method; AOM: alternating offer method; YCRM: Young conflict-resolution method; UFBM: unanimity fallback bargaining method; BF: basic flow; MBF: maintenance basic flow; AEF: appropriate environmental flow; SSDE: standard deviation of hydropower stakeholder’ satisfied degree value; SSDW: standard deviation of environmental stakeholder’ satisfied degree value.
Table 4.
Average SDE and SDW obtained by the six conflict-resolution methods according to different GCMs and EF patterns.
Table 4.
Average SDE and SDW obtained by the six conflict-resolution methods according to different GCMs and EF patterns.
| EF Pattern | FBCM | FAVM | NBM | AOM | YCRM | UFBM | ||||||
|---|---|---|---|---|---|---|---|---|---|---|---|---|
| Average SDE | Average SDW | Average SDE | Average SDW | Average SDE | Average SDW | Average SDE | Average SDW | Average SDE | Average SDW | Average SDE | Average SDW | |
| BF | 0.49 | 0.54 | 0.38 | 0.65 | 0.51 | 0.52 | 0.51 | 0.51 | 0.35 | 0.68 | 0.51 | 0.51 |
| MBF | 0.55 | 0.54 | 0.50 | 0.60 | 0.54 | 0.55 | 0.54 | 0.54 | 0.51 | 0.58 | 0.54 | 0.54 |
| AEF | 0.56 | 0.60 | 0.56 | 0.63 | 0.58 | 0.60 | 0.59 | 0.59 | 0.57 | 0.61 | 0.59 | 0.59 |
Note: FBCM: fuzzy Borda counting method; FAVM: fuzzy approval voting method; NBM: Nash bargaining method; AOM: alternating offer method; YCRM: Young conflict-resolution method; UFBM: unanimity fallback bargaining method; BF: basic flow; MBF: maintenance basic flow; AEF: appropriate environmental flow; SDE: average of the satisfied degrees of hydropower stakeholder for certain GCM scenario and EF pattern; SDW: average of the satisfied degrees of environmental stakeholder for certain GCM scenario and EF pattern.
Publisher’s Note: MDPI stays neutral with regard to jurisdictional claims in published maps and institutional affiliations. |
© 2021 by the authors. Licensee MDPI, Basel, Switzerland. This article is an open access article distributed under the terms and conditions of the Creative Commons Attribution (CC BY) license (https://creativecommons.org/licenses/by/4.0/).
Share and Cite
MDPI and ACS Style
Xu, Y.; Hui, Y. Assessing the Uncertainty of Hydropower-Environmental Conflict-Resolution Management under Climate Change. Water 2021, 13, 2114. https://doi.org/10.3390/w13152114
AMA Style
Xu Y, Hui Y. Assessing the Uncertainty of Hydropower-Environmental Conflict-Resolution Management under Climate Change. Water. 2021; 13(15):2114. https://doi.org/10.3390/w13152114
Chicago/Turabian StyleXu, Yuni, and Yu Hui. 2021. "Assessing the Uncertainty of Hydropower-Environmental Conflict-Resolution Management under Climate Change" Water 13, no. 15: 2114. https://doi.org/10.3390/w13152114
Note that from the first issue of 2016, this journal uses article numbers instead of page numbers. See further details here.