
Assessment of Trophic Responses of a Reservoir to Seasonal and Annual Variations in Monsoon


Department of Earth & Environmental Sciences, Jeonbuk National University, Jeonju 54896, Korea
*
Author to whom correspondence should be addressed.
Water 2021, 13(15), 2117; https://doi.org/10.3390/w13152117
Submission received: 30 June 2021
/
Revised: 25 July 2021
/
Accepted: 28 July 2021
/
Published: 31 July 2021
(This article belongs to the Section Water Quality and Contamination)
Abstract
:The variations in water quality parameters and trophic status of a multipurpose reservoir in response to changing intensity of monsoon rain was investigated by applying a trophic state index deviation (TSID) analysis and an empirical regression model to the data collected in two periods from 2014 to 2017. The reservoir in general maintained mesotrophic conditions, and Carlson’s trophic state index (TSIc) was affected most by TSITP. Nutrient concentrations, particularly phosphorus, did not show strong correlations with precipitation, particularly in the period with weak monsoon, and a significant increase in total phosphorus (TP) was observed in Spring 2015, indicating the possibility of internal phosphorus loading under decreased depth and stability of water body due to a lack of precipitation. TSIChl was higher than TSISD in most data in period 1 when a negligible increase in precipitation was observed in the monsoon season while a significant fraction in period 2 showed the opposite trend. Phytoplankton growth was not limited by nutrient limitation although nutrient ratios (N/P) of most samples were significantly higher than 20, indicating phosphorus-limited condition. TSID and regression analysis indicated that phytoplankton growth was limited by zooplankton grazing in the Spring, and that cell concentrations and community structure in the monsoon and post-monsoon season were controlled by the changing intensity of the monsoon, as evidenced by the positive and negative relationships between community size and cyanobacterial population with the amount of precipitation in the Summer, respectively. The possibility of contribution from internal loading and an increase in cyanobacterial population associated with weak monsoon, in addition to potential for nutrient enrichment in the post-monsoon season, implies a need for the application of more stringent water quality management in the reservoir that can handle all potential scenarios of eutrophication.
1. Introduction
The generation of reservoirs by building dams across rivers rapidly and significantly alters the shape and dimension of watersheds, as well as the physicochemical characteristics of water bodies [1,2,3]. For example, the watershed area of a reservoir is typically much larger than natural counterparts with similar water surface areas [4], which, in combination with the stagnant character of water bodies, makes them more susceptible to pollutant loading from the surrounding area. Indeed, many reservoirs are experiencing significant water quality degradation, particularly due to excessive input and enrichment of nutrients, such as nitrogen (N) and phosphorus (P), which results in eutrophication that frequently leads to algal bloom and many associated environmental, economic, and social problems [5,6,7].
The reduction of anthropogenic input of nutrients, particularly ones that limit algal growth, has been a major goal of water quality management of reservoirs to avoid the undesirable impact of eutrophication [8,9]. Limiting nutrients can easily be determined by mass or molar ratio of total N (TN) and total P (TP) [10,11], which varies widely with nutritional enrichment, geographic location, and the artificial nature of lentic water bodies [11,12,13]. The threshold values of TN/TP for N, P, and co-limitation varies in the literature [14,15]. Despite its convenience and simplicity, the ratio alone may not provide adequate information about how algal growth in a reservoir is governed by complex biogeochemical processes. It was found that algal growth was not always controlled by P even when P-limited conditions were implied by the ratio [16,17].
The concept of trophic state was introduced early in the 20th century as a fundamental property utilized to classify aquatic ecosystems in terms of biological productivity [18]. Among the many different methods proposed to quantify the trophic status [19,20], the trophic state index (TSI) proposed by Carlson, which is based on chlorophyll-a (Chl-a, TSIChl), TP (TSITP), and Secchi depth (SD, TSISD) and independently estimates algal biomass to assess the trophic states of temperate lakes, has been most widely applied [20]. TSI was expanded subsequently to include TN [21,22] and modified to be applied to tropical conditions. It was proposed that the numerical differences of individual TSIs could be used to identify various limiting conditions in an aquatic ecosystem [23,24,25], and a simple two-dimensional graphical method in which TSIChl–TSISD values are plotted against TSIChl–TSITP was proposed for identification of relationships between the variables [24]. The approach has been applied to interpret deviations caused by nutrient limitation, non-algal turbidity, zooplankton grazing, and water color imparted by dissolved constituents [26,27].
Trophic responses of a water body to anthropogenic input of nutrients have also been evaluated using an empirical regression model based on recognized linear relationships between the log-transformed data of water quality parameters. The most commonly utilized approach is to apply the model to Chl-a, TN, and TP to identify nutritional control over algal growth [11,19,28]. Regression analysis on SD, a commonly used index of water turbidity, with TP, TN, Chl-a, and suspended solids (SS) has also been used to further elucidate trophic processes as the turbidity of water can be induced by various dissolved and suspended components, including algal biomass [29]. Meanwhile, linear relationships of non-algal light attenuation coefficient (Kna) with TP, TN, Chl-a, and SS have been used to evaluate the relationships between algal biomass production and light attenuation mechanisms [5,30,31]. These modeling approaches provided information on the causal relationship between algal biomass and various variables and helped set up water quality management goals through the reduction of pollutant input [19,32,33].
The aforementioned approaches are frequently applied to regional or national data from multiple reservoirs or to the long-term monitoring data of individual reservoirs based on the assumption that they can be applied universally over the spatiotemporal scope of interest [19,32,33]. It has been increasingly recognized, however, that relations between the variables are affected by many physicochemical and biological factors, including, but not limited to, operation condition and morphology of reservoir, intensity and distribution of precipitation, light condition, and zooplankton grazing [8,32,33,34,35,36]. Additionally, recently experienced increasing frequency of extreme weather conditions may produce conditions that do not match the relations identified from spatially or temporally averaged data. The trophic assessment of individual lakes from multiple sampling locations has been tried to identify a lake’s response to specific conditional changes [37,38,39,40], but many of these research results are limited to supplying a snapshot of the lake’s trophic status as samplings were performed over a limited time interval.
In this study, physicochemical water quality variables and Chl-a of a large multipurpose reservoir in Korea were investigated by collecting and analyzing samples from locations representing different physical characteristics of the reservoir for two periods, each lasting for about a year and one of which included a year with a serious lack of monsoon precipitation. The relationships between nutrients and the tropic state were evaluated by analyzing the spatiotemporal distribution and deviation of Carlson’s TSI, performing empirical regression modeling and statistical analysis. The main objective of this study is to identify the seasonal variations in the processes that control the various factors that may influence the biological productivity of the reservoir and provide information on their relationship with the dynamics of aquatic ecosystems, particularly growth and compositional changes in the algal community over the two different periods with different monsoon intensities.
2. Materials and Methods
2.1. Study Area
The study area, Yongdam Reservoir, is located at 35°57′50″–35°49′08″ N, and 127°26′08″–127°32′54″ E in Jeonbuk Province, South Korea (Figure 1). The reservoir was created in 2001 by constructing Yongdam dam on the upstream Geum River for the purposes of flood control, hydroelectric power generation, and water supply to agricultural and urban areas in the western half of the province. More than a million people are currently benefitting from the construction of the reservoir. The reservoir has a surface area of 36.24 km2, with a water storage capacity of 8.15 × 10⁸ m3, and an average water retention time of 191 days. It is the fifth largest reservoir in the nation in terms of storage capacity. Two water intake towers are installed near the dam (site α in Figure 1) at the western section of the reservoir (site β). Each tower can withdraw water from the five equally spaced gates from an elevation of 226.5 to 261.6 m. The gates are flexibly operated depending on the water level at the time of withdrawal. Tower α was installed to supply water to downstream Geum River, and water taken at tower β is supplied through an aqueduct tunnel to the Gosan power station and water treatment facility 21.9 km away. The reservoir is surrounded by a mixed watershed with a total area of 930 km2, about 71.1% of which is forest, followed by agricultural, undeveloped, and city area each constituting 14.7, 6.0, and 1.8%, respectively. There are five tributaries flowing into the reservoir; Geum River and Guryang, Jinan, Jeongja, and Juja streams. The first three join and enter the reservoir at the southern end and constitute the majority of the inflow, and the urbanized area and the pollution sources are predominantly located in their watersheds.
As with other reservoirs in Korea that are used to supply drinking water, one of the major goals of water quality management of Yongdam Reservoir is to control the excessive growth of phytoplankton, particularly harmful cyanobacteria, and the algal alert system has been adopted and operated since 2003. Appropriate alerts are issued if the concentrations of Chl-a or cyanobacteria (Genus Microcystis, Anabaena, Aphanizomenon, and Oscillatoria) are higher than the threshold for each alert level on two consecutive measurements (Table S1). Concentrations of Chl-a and cyanobacteria are measured weekly at the water intake towers in the reservoir, and algal advisories have been issued three times in 2005, 2006, and 2010.
2.2. Water Sampling
Spatiotemporal variation in water quality parameters and their trophic implications were investigated by collecting water samples from seven sampling sites in the reservoir (Figure 1). The sampling sites were selected in such a way that the impact of tributary inflow on water quality parameters and their changes within the reservoir could be traced. Site A was located near the southern end of the reservoir, where the Geum River and Jinan and Guryang streams coalesce and flow in, and site G was selected to be located close to the inlet of Juja stream. Sites E and F were close to the dam and located in the area of maximum water depth. The depth of the water was shallowest in site A, where its range during the investigation was 1.0–9.0 m, while sites E and F showed the greatest depths in each sampling event with a range of 30.0–48.5 m. A gradual increase in depth was observed from site B to site D. Based on the consideration of the spatial distribution and water depth of each site, sites A and G were classified as riverine zones in this study, B and C transition zones, and D–F lacustrine zones.
Water sampling was performed in two different periods, September 2014–October 2015 and May 2016–March 2017. The sampling schedule was adjusted in such a way that the impacts of important weather events, particularly the Summer monsoon, could be evaluated by sampling before, during, and after the typical monsoon season (June to August) in Korea. Water samples were collected in September, October, and December 2014, and March, April, June, July, August, and October 2015 in period 1. The months in which sampling was done in period 2 were May, August, September, and November 2016, and March 2017.
2.3. Analytical Methods
Surface water samples were collected at a depth of 0.5m using a 2.2 L Van Dorn water sampler (Wildlife Supply Co., Yulee, FL, USA). Water temperature (T), hydrogen ion concentration (pH), dissolved oxygen (DO), electrical conductivity (EC), and oxidation-reduction potential (ORP) of the samples were measured on site with probes for these parameters attached to a portable multi meter (Hach Multimeter, HQ40D, Hach Co., Loveland, CO, USA).
Water samples for laboratory measurement were refrigerated in an ice box immediately after collection, and transported to the laboratory, where they were stored at 4 °C in the dark until analysis. Concentrations of TP, TN, Chl-a, and COD were measured following the protocol of Korean Standard Methods for the Examination of Water and Wastewater [41]. TP was measured with the ascorbic acid method after potassium persulfate digestion. The UV spectrophotometric method after alkaline potassium persulfate digestion was applied to measure TN. Chl-a was estimated using a spectrophotometer after extraction in 90% acetone. COD was measured with the potassium permanganate method.
The transparency of the water was determined by measuring SD using a Secchi disk with a 20 cm diameter at the time of sample collection. The depth profile of the water temperature was obtained by measuring the temperature at 0.5 m intervals with a HOBO Water Temperature v2 (Onset Computer Co. Bourne, MA, USA), which was also used for the measurement of water depth by attaching a heavy metal bar to the end of the cable. Identification and enumeration of phytoplankton in the water samples were made under an inverted optical microscope (Nikon TS-100, Nikon Co., Minato-ku, Tokyo, Japan). Algal cells in the water samples fixed with Lugol’s solution (v/v 2%) and concentrated by sedimentation were mounted on a Sedgwick-Rafter chamber for microscopic analysis.
2.4. Trophic State Index and Non-Algal Light Attenuation Coefficient
TSIs on the Chl-a, TP, and SD of the reservoir were calculated using the methods proposed by Carlson [20]. The Carlson’s TSI (TSIC) can be obtained by calculating the arithmetical average of the three TSIs. TSI has the advantage of presenting the trophic state on a continuous numeric scale. Waters with TSIs less than 40 are categorized as oligotrophic, 40 to 50 mesotrophic, 50 to 70 eutrophic, and higher than 70 hypereutrophic [21,42]. TSITN was also calculated using the method in the literature [21]. The equations used for the calculation of TSIs were:
Non-algal light attenuation coefficient (Kna), a useful tool for assessing underwater light availability and the mechanism controlling light attenuation, was computed using SD and Chl-a using the following formula [43]:
2.5. Statistics Analysis
Pearson correlation analysis, a univariate statistical analysis widely applied to evaluate the relationship between two variables in a data set by measuring the strength, direction, and probability of the linear association between two interval or ratio variables, was applied to identify a one-to-one statistical dependence between the variables studied. Correlation coefficient (r), whose numerical value ranges from −1 to 1 is the statistic used in the analysis. While r values close to 1 and −1 indicate strong positive and negative relationships, respectively, no correlation exists if it is zero at a significance level of p < 0.05.
A regression analysis for empirical modeling was performed after logarithmically converting (base 10) the concentrations of TN (mg/L), TP (mg/L), Chl-a (μg/L), and SD (m) to promote homogeneity of variance. The relationships among nutrients, Chl-a, and SD were explored using simple linear regression models with Chl-a as the dependent variable of TN and TP, and SD of TN, TP, and Chl-a. Since a 95% quantile regression model can be used to estimate the rates of change for functions close to the upper boundary of a conditional distribution of responses [44], the nutrient–Chl-a relationships based on 95% quantile regression were implemented to explore a 95% maximum response of Chl-a to nutrient levels, and the same operation was also conducted for SD. All the statistical analyses were conducted with PASW Statistics 18 software (SPSS Inc., Chicago, IL, USA).
3. Results
3.1. Precipitation Pattern and Flow Regime
Long-term precipitation data for the nineteen-year period from 2002 to 2020 obtained by calculating the averages of values from three weather stations around the study area indicated that the total amount of precipitation in each year was mainly controlled by that of monsoon rain in the Summer (Table S2). Yearly precipitation ranged from 1194.7 to 1949.1 mm with an average of 1536.0 mm, nearly 50% of which was concentrated in the Summer. The average precipitation from June to August during the last nineteen years was 790.4 mm with a range of 369.5 to 1211.4 mm when maximum and minimum yearly precipitations were recorded, respectively, indicating that the duration and intensity of Summer monsoon and frequency and precipitation characteristics of occasional typhoons were the critical controlling factors of fluctuation in yearly precipitation. Below average annual precipitations were recorded in the study area during the study period between 2014 and 2017, and the lowest value in the last twenty years (1194.7 mm) was recorded in 2015 when severe drought was experienced in the entire Korean peninsula. Annual precipitation in 2014 and 2017 were also below average, at 1376.8 and 1388.9 mm, respectively, while a value (1500.4 mm) close to the average was recorded in 2016. Monthly distribution of precipitation during the study period clearly shows the relationship between monsoon rain and total yearly precipitation (Figure 2). Only a slight increase from the baseline monthly precipitation was observed during the monsoon season (June to August) in 2015 when the lowest yearly precipitation was recorded. The precipitation during the monsoon season in the year was 369.5 mm, much lower than the average value of 790.4 mm. After typical monsoon rain distributions of 195.7 and 368.7 mm were observed in July and August 2014, respectively, the duration of low precipitation began in September 2014, when the first sampling event occurred in this study, and extended to March 2016. Normal temporal variation was recovered in 2016 when an appreciable increase in precipitation was observed during the corresponding interval in the Summer.
A variation in the precipitation patterns induced changes in reservoir operation, affecting the water balance of the reservoir. Mostly negative monthly water balance was observed after the monsoon from September 2014 until an increase in precipitation was recorded in the Spring of 2016. The average inflow and discharge in 2015 were 10.0 and 17.4 m3/s, respectively, and a slightly positive balance was observed only in July and December. A positive balance in the Summer and negative in the winter, the typical characteristics in the reservoirs in Korea [45,46], were observed in 2016 with average inflow and discharge of 18.3 and 13.4 m3/s, respectively. Water balance directly affected the water level of the reservoir, and a consistent decrease from 254.6 m in September 2014 was observed until the lowest level of 239.8 m was recorded in February 2016.
3.2. Water Quality Parameters
Although sampling was scheduled to be performed before, during, and after the typical monsoon season in Korea, the two sampling periods have different temporal lengths and do not have consistent seasonal representation such that direct comparison between them can be complicated by different seasonality. For the comparison of the inter-annual changes in water quality and associated trophic behavior of the reservoir while maintaining seasonal consistency, each sampling period was divided into two subperiods. Period 1 was divided to subperiods 1-1 (September 2014–April 2015) and 1-2 (May–October 2015), and period 2 to subperiods 2-1 (May–October 2016) and 2-2 (September 2016–March 2017). Subperiods 1-1 and 2-2 were compared for changes occurring from post-monsoon to pre-monsoon periods, and 1-2 and 2-1 to identify the impact of varying monsoon intensity on the seasonal transition from the Spring (pre-monsoon) to the Summer (monsoon). Key statistic values of the measured water quality parameters in the four periods are listed in Table 1. Among the parameters that are directly used for trophic state evaluation, TN concentrations showed the least variation at different sampling locations in each sampling event, although temporal fluctuations were observed (Figure 3). An increasing trend of TN was observed from September 2014 until it reached the maximum in June 2015, after which decreased concentrations were observed until October. High TN concentrations were also observed in May and November 2016 in the second period and did not always show an appreciable relationship with precipitation as evidenced by low concentrations in the Summer 2016. Although temporally averaged spatial distributions show similar average values in subperiods 1-1 and 2-2 with differences that are not statistically significant (p > 0.05), subperiod 1-2 showed a distribution consistently higher than 2-1, particularly at sampling site A, which is expected to have more riverine characteristics than the others.
Increases in average TP concentrations were observed in September 2014, March and April 2015, and September 2016 with the most significant increase occurring in Spring 2015. Large spatial variation in TP concentrations was observed in May 2016, although the average concentration was not significantly different from the other months. In most cases, average TP concentrations were lower than 0.03 mg/L corresponding to level 3 or better in Korean water quality standards. Except for subperiod 2-2, TP concentrations were highest at location A, where three tributaries are combined to flow in and gradually decrease within the reservoir to achieve the lowest concentration around the dam (site E). Temporally averaged concentrations at each location were always higher in subperiod 1-1 than 2-2, and large variations observed in the lacustrine zone (sites D and E) in subperiod 1-1 were caused by increased concentrations in March and April 2015 when TP concentrations in these sites were comparable to or even higher than those in site A. Subperiods 1-2 and 2-1 showed very similar average values at each sampling location. COD concentrations among different sampling locations were similar except for subperiod 1-2 when a gradual decrease in the flow direction was observed and their distribution pattern was somewhat similar to that of TN. Unlike nutrient concentrations, however, an appreciable increase in Spring 2015 was not observed, and temporal variation seemed to be in the opposite trend, particularly in subperiod 1-1.
The distribution of averaged Chl-a concentrations showed similar spatial patterns to those of TP, with the highest concentrations being at site A and then a gradual decrease within the lake. The temporal distribution of spatially averaged concentrations, however, did not show much correlation as the highest concentrations were observed in September 2014, October 2015, and August 2016. The spatial distribution of SD showed statistically significant differences (p < 0.01) in average values at each sampling site between subperiods 1-1 and 2-2, and subperiods 1-2 and 2-1. The differences were larger in the area where physical characteristics are expected to be those of transitional or lacustrine zones. SD values seem to correlate with Chl-a concentrations particularly in many of the subperiods. SD increased significantly in March 2015 and gradually decreased after recording the maximum in April in period 1. SD showed a somewhat higher correlation with precipitation than the other parameters, recording the lowest values in September 2014 and a sharp decrease in Summer 2016.
The application of Pearson correlation analysis to the data from each subperiod resulted in a higher correlation between water quality parameters (TP, TN, and COD) and precipitation in subperiod 2-2 than 1-1. Subperiod 1-2 showed a stronger correlation between SD and both Chl-a and TP than subperiod 2-1 (Table 2).
3.3. Spatiotemporal Distribution of Trophic State Index
Trophic state indices calculated on Chl-α, TP, SD, and TN showed different spatial and temporal variations (Figure 4). The temporal distribution of spatially averaged Carlson’s trophic index (TSIC), the average value of TSIChl, TSITP, and TSISD, indicated a mostly mesotrophic condition in subperiod 1-1, although results in April 2015 corresponded to a eutrophic condition (TSIC = 50.3). TSIC were highest in Spring (March and April) 2015 during this study with an average value of 48.5, which was significantly different from the other seasons (p < 0.01). Although TSIC at the beginning of subperiod 2-2 (September 2016) corresponded to mesotrophic conditions, oligotrophic conditions were recorded for the rest of the period with TSIC values significantly lower than the corresponding season in subperiod 1-1. Mesotrophic conditions were maintained with little variation in TSIC for the entire duration of periods 1-2 and 2-1, except for September 2016.
The biggest temporal variation in individual TSIs was observed for TSITP. Although TSITP values in many sampling investigations corresponded to oligotrophic conditions, significant variation was observed in subperiod 1-1 when TSITP began in a mesotrophic condition in September 2014, decreased to oligotrophic for the remainder of the post-monsoon season, and significantly increased to eutrophic in Spring 2015. Subperiod 2-2 showed rapid decrease from mesotrophic to oligotrophic condition during the transition from monsoon to post-monsoon season. TSIChl showed a gradually decreasing trend in subperiod 1-1 from eutrophic conditions in the first half to mesotrophic conditions in the second half, and then remained in mesotrophic conditions in the other subperiods. TSISD remained relatively constant near the boundary between oligotrophic and mesostrophic conditions in subperiods 1-1 and 1-2 with values lower than their counterparts in the second period. Eutrophic conditions were indicated in August and September 2016. TSITN values were highest among TSIs measured in this study, indicating eutrophic conditions over the entire duration of this study with marginal temporal variation in index values.
The biggest difference between periods 1 and 2 was the timing of higher TSIs and their association with precipitation. TSIC was highest around the typical monsoon season in Summer 2016 and corresponded to mesotrophic conditions, while eutrophic conditions were observed in Spring 2015 at the end of subperiod 1-1 without any association with monsoon rain. Overall, the observed fluctuations in TSIC were similar to those of TSITP.
Spatial distributions of temporally averaged TSIC in each sampling location showed similar trends in the four subperiods; eutrophic conditions at site A, and then a gradual decrease within the reservoir to mark the minimum values at/near the dam (sites D or E). All intra-reservoir sites were in a mesotrophic condition during subperiod 1-1, while oligotrophic conditions prevailed, except at site B, in the other subperiods. TSIs constituting TSIC showed similar trends with minor variations in values within the reservoir. The biggest variation among the subperiods occurred on TSITP, which showed a greater trophic variation in the transition and lacustrine zones, where mesotrophic conditions were maintained in subperiod 1-1 and oligotrophic conditions were observed in the other subperiods. TSIChl values indicated mesotrophic or eutrophic conditions in subperiod 1-1 and mostly mesotrophic conditions in period 2-2. TSISD was higher in subperiods 2-1 and 2-2, corresponding to mesotrophic conditions, while oligotrophic conditions were represented in the deeper part of the reservoir in subperiods 1-1 and 1-2. TSITN indicated eutrophic conditions with similar values in the two periods and did not show appreciable differences among the sampling locations.
3.4. Trophic State Index Deviation
An analysis of the limiting factors of the trophic status by identifying the trophic state index deviation (TSID) using a two-dimensional graphical method based on the TSIChl–TSITP and TSIChl–TSISD relationships showed pronounced differences among the subperiods in periods 1 and 2 and seasonal variation in P-limitation (Figure 5 and Figure 6). While blue-green algae under P-limited conditions and zooplankton grazing predominated in period 1, non-algal turbidity and smaller particles, including inorganic seston, appeared to be minor. Data for period 2 spanned over blue-green algae under P-limitation, smaller particles, and non-algal turbidity, but no data points were identified in the area of zooplankton grazing.
Comparison of subperiods 1-1 and 2-2 indicated that the major seasonal data shift in subperiod 1-1 occurred in the vertical direction from P-limited blue-green algae in the post-monsoon season (September–December) in 2014 to zooplankton grazing in Spring 2015 (Figure 5). Unlike the data for September 2014, those of September 2016 in subperiod 2-2 mainly showed non-algal turbidity and appeared to shift to blue-green algae in November. As depicted in Figure 2, precipitation patterns around typical monsoon seasons were different between the two subperiods. While intense rain was concentrated in July and August in 2014, high monthly precipitation was sustained from July to October in 2016. The most pronounced difference between the two subperiods was observed in pre-monsoon season data. The domination of zooplankton grazing was observed in the Spring in subperiod 1-1, while smaller particles under P-limited conditions occupied the major fraction of the data in 2-2, followed by blue-green algae without any data in the quadrant indicating zooplankton grazing.
Variation in TSID with sampling locations indicates a shift in TSIChl–TSISD with locations in the reservoir was minor in subperiod 1-1 as most data could be found in the area where TSIChl > TSISD. Zooplankton grazing was found to occur mostly in the transition and lacustrine zone and no data from site A could be found in the area. Most data in subperiod 2-2, however, were observed to be TSIChl < TSISD, indicating that light attenuation was dominated by small particles but not necessarily related to algae. The data that showed TSIChl > TSISD could be found mostly in November 2016 in the transition and lacustrine zones, and in March 2017 those from sites A and B.
The data from subperiod 1-2 were mainly distributed in the first quadrant, followed by the second and a few in the third while many of the data in subperiod 2-1 were located in the third quadrant followed by similar numbers in both the first and second quadrant (Figure 6). Most data of subperiod 1-2 in the months before (June) and after (October) the typical monsoon season were located in the first quadrant, while those in July and August were rather evenly distributed on either side of the axis indicating TSIChl = TSISD. In the case of subperiod 2-1, the data in the Spring (May 2016) were dispersed in the first, the second, and the third quadrant. Among the monsoon season data, the ones in the non-algal turbidity area were mainly from September 2016 and those from August were in the first and the second quadrant. Precipitation in September was significantly higher than that in August.
Spatial distribution of TSID in subperiod 1-2 indicates that data points in non-algal turbidity and P-limited smaller particles were mainly from site A and G, the locations close to tributary inflow, and most data from the transition and lacustrine zones are in the first quadrant regardless of the timing of sampling. In the case of subperiod 2-1, non-algal turbidity predominates in all the longitudinal zones in September 2016. Only site A was located in the third quadrant in May, probably because of the higher monthly precipitation recorded in April. Overall, the distribution of TSID in subperiod 2-1 appears to be sensitively affected by the fluctuating precipitation in the period.
3.5. Empirical Regression Analysis
For the application of empirical regression analysis each period was divided into subperiods based on the consideration of precipitation patterns and trophic behavior. Period 1-1 was divided into September–December 2014 and March and April 2015 to represent post-monsoon and pre-monsoon seasons, respectively. Subperiod 1-2 was not divided as there was no appreciable increase in precipitation during this period and TSID evaluation did not show significant differences between sampling dates. Period 2 was divided into May, August and September, and November 2016 to represent pre-monsoon, monsoon, and post-monsoon periods as there were significant monsoons from July to October and there were variations in TSID between these periods. March 2017 was also separately handled as it marked the end of subperiod 2-2.
There was no significant relationship between log-transformed TN and TP data with R2 values less than 0.1 in all of the seasons constituting subperiods 1-1, 1-2, and 2-2, although pre-monsoon and monsoon seasons of subperiod 2-1 showed significant correlations with the R2 values of 0.41 and 0.32, respectively (Table S3). Site A in all the subperiods in period 1, however, showed a significant relationship between the two nutrients (R2 = 0.64). TN also showed a very weak relationship with TN/TP in most seasons with an R2 value of less than 0.1 except for the post-monsoon season of subperiod 1-1 (R2 = 0.21) and the pre-monsoon season (Spring 2016) of subperiod 2-1 (R2 = 0.42). TP, however, showed a very strong relationship with TN/TP (R2 > 0.90) in all of the subperiods evaluated in this study (Figure 7). Although correlations between nutrients and SD were not very strong when regression analysis was applied to all the data in each period (data not shown), TP showed noticeable differences between the seasons evaluated. The application of a regression analysis to each season did show seasonal fluctuations in correlations. Strong relations between TP and SD could be found in the monsoon season of subperiod 1-2 (R2 = 0.74) and pre-monsoon season of subperiod 2-1 (R2 = 0.95). The same relations in the other two pre-monsoon seasons, however, was much lower than that of TN, which showed strong relations with R2 values of 0.77 and 0.67 in the pre-monsoon seasons of subperiods 1-1 and 2-2, respectively. SD seemed to be affected by Chl-a in period 1 with R2 values ≥ 0.40 with or without seasonal classification with precipitation. Period 2, however, showed a greater seasonal fluctuation with the most significant relationship observed in the monsoon season of subperiod 2-1 (R2 = 0.47) while no appreciable relations could be found in the others (R2 < 0.20). No consistent difference of statistical significance in relationships between Chl-a and two nutrients were found among different seasons. TP only showed some correlation in subperiod 1-2 (R2 = 0.33) and pre-monsoon seasons of subperiods 2-1 and 2-2 (R2 = 0.37 and 0.41, respectively), while TN showed a significant relationship in the pre-monsoon season of subperiod 1-1 (R2 = 0.61). Chl-a did not show a significant correlation with nutrient ratio (TN/TP). The seasons in which the R2 value was higher than 0.3 were the pre-monsoon seasons of subperiods 2-1 and 2-2 (R2 = 0.37 and 0.47), respectively.
The coefficient of non-algal light attenuation (Kna) showed a low correlation with Chl-a in both period 1 and 2 (Table S4). Evaluation of the correlation between the two variables in each season also showed that Kna is not strongly related to Chl-a as appreciable relations could only be found in subperiod 1-2 (R2 = 0.48) and the post-monsoon season of subperiod 2-2 (R2 = 0.42). Kna also showed a very low correlation with TN except during the pre-monsoon seasons of subperiods 1-1 and 2-2, when the R2 values were 0.46 and 0.70, respectively. The evaluation of the relationship between TP and SD, however, showed appreciable increases in correlation in a few seasons. Although TP’s overall correlation with Kna in each period was not very strong, strong correlations were observed in subperiod 1-2 (R2 = 0.88) and strong and significant relationships in pre-monsoon and monsoon seasons of subperiod 2-1 (R2 = 0.98 and 0.59, respectively). SD’s overall correlation with Kna in each period was highest among the parameters evaluated. The seasonal fluctuations in SD’s degree of correlation were different from those of TP. Unlike the case of TP, the strongest correlations with SD (R2 ≥ 0.80) were identified not in the monsoon season but in the pre-monsoon seasons of subperiods 1-1 and 2-2. SD showed contrasting correlations in the post-monsoon seasons of subperiods 1-1 and 2-2, with a stronger correlation in subperiod 2-2 (R2 = 0.81), while no appreciable relation could be observed in the corresponding season in subperiod 1-1 (R2 = 0.15). TN/TP ratio did not show an appreciable correlation with Kna, except in the pre-monsoon season of subperiod 1-1 (R2 = 0.70).
4. Discussion
4.1. Variations in Water Quality Parameters
The observed spatiotemporal variations in nutrients in the reservoir can be partially explained by changes in the physical conditions of the water body associated with low intensity monsoons and seasonal temperature changes. It has been reported that nutrient concentrations, particularly phosphorus, in Korean reservoirs are significantly impacted by concentrated precipitation in the monsoon season as it induces surface runoff that carries dissolved and particulate materials from the surrounding watershed into the reservoir [2,47]. The elevated nutrient concentrations, in combination with clear skies, high temperatures, and increased daily irradiation hours in the late Summer and early Fall, frequently foster the rapid growth of phytoplankton, particularly cyanobacteria [31,48,49]. These characteristics of typical Korean reservoirs, however, were not observed in Yongdam Reservoir for most of the duration of this study. Instead, the most significant increases in nutrient concentrations, particularly TP, were observed in the pre-monsoon season at the end of subperiod 1-1 without any noticeable increase in precipitation during and right before the season.
Phosphorus in the reservoir may be introduced from the watershed through riverine inflow or internally introduced to the water body through biogeochemical cycling within the reservoir. Introduction from the watershed requires either increased pollutant loading in the watershed or heavy rainfall that can carry nutrients contained in the soil. Although early Spring is the time of year at which the possibility of nutrient input from resumed agricultural activities in the watershed cannot be completely ruled out, the increase in TP observed in March and April 2015 is more likely to have been caused by a decrease in water depth changing the stability of the water body and internal loading from the benthic sediments. Without any appreciable precipitation from September 2014 to Spring 2015, the possibility that the observed high TP concentrations resulted from the increased runoff from the watershed is not very high as the scenario requires the occurrence of concentrated precipitation. For the duration of low precipitation, the reservoir maintained negative water balance until July 2015, which caused a steady decrease in water depth (water level). The decrease in water depth increases the potential that surface water quality is affected by chemical compounds that have been released from benthic sediments and/or accumulated in the hypoliminion. The possibility of the contribution of internal loading can also be supported by the spatial concentration profiles around early Spring 2015 (Figure S1). As described previously, elevated concentrations of TP were observed at sites D and F (lacustrine zone), where the concentrations were even higher or comparable to those at site A, which directly receives influent from three tributaries whose watersheds contain most of the pollution sources of the reservoir. Low TP concentrations in the transition zone (sites B and C) during this period reduces the possibility of strong hydrological connection between the riverine and the lacustrine zones that would enable the persistence of material from the watershed over the entire reservoir. March in Korea corresponds to early Spring, when Spring turnover is frequently observed in the reservoirs [50] and the water temperature measurement with depth in March resulted in an almost constant temperature profile, implying low water stability to promote mixing. TN’s behavior in the same season was different, although TP and TN concentrations at site A increased from December to March. TN showed spatial profiles of the highest concentrations at site A and a gradual decrease within the lake without an increase at the sites in the lacustrine zone. This trend continued until June, when the reservoir was expected to fully regain strong stratification based on its temperature profile. These results are in agreement with earlier reports in which contrasting benthic fluxes of N (negative) and P (positive) were observed in a Korean reservoir [51]. The Spring increase in nutrient concentrations in the riverine zone (site A) might have been caused by the agricultural activities in the surrounding watershed. Due to a lack of precipitation, however, it is reasonable to assume that the impact of nutrient input in the form of runoff was not significant, and the contrasting behavior of TP and TN within the reservoir might have been caused by a difference in the nature of incoming nutrients, such as the solubility and mobility of different chemical forms, the identification and quantification of which were unfortunately not made in this study. Additionally, more research is needed to elucidate the true contribution of internal loading by performing sediment release experiments [52] and measuring the nutrient concentrations in the sediments, including different forms of phosphorus as P in the sediments can exist in various forms, such as labile, reductive, metal-bound, calcium-bound, and residual phosphorus that may be released into the overlying water under different physicochemical and redox conditions [53,54,55]. The weak correlation between precipitation and TP under low precipitation conditions might also be explained by the low drainage ratio of the study area. The drainage ratio, the ratio of watershed area to water surface area, of Yongdam Reservoir is 25.7, one of the lowest among the large reservoirs in Korea. The drainage ratio has been used as an indicator to identify the impact of watershed processes on the water quality of a reservoir [56], and the control of the reservoir concentrations by surface runoff is expected to be weaker than the other large reservoirs. It is possible that low precipitation might have decoupled this relatively weak connection between the rainfall and TP concentration in the study area. It is not certain whether the internal loading also played an important role in the early Spring of 2016 as the first measurement in subperiod 2-1 was made in May 2016, when the water was stratified and the increase in TP in the lacustrine was not observed. It is also possible that high concentrations of TN and TP in May 2016 might have been induced by increased precipitation in April 2016 (Figure 2). Increases in TP and TN observed in the late Summer of 2016 may be the result of the increased intensity of monsoon rains.
The increase in TP in March and April 2015 was not associated with an increase in algal biomass in terms of Chl-a. This lack of correlation between algal biomass and nutrients might be the result of low temperature observed in March 2015 when nearly uniform water temperature around 5 °C was measured. This was also supported by the composition of the algal community, more than 50% of which was occupied by diatoms that are known to prefer low water temperatures [57] followed by chlorophytes (Figure 8). Although cyanobacteria are known to prefer high P concentrations and lower N/P ratios [58,59,60], a notable increase in the cyanobacteria population was not observed in the Spring indicating that cyanobacteria did not have a competitive edge as they prefer higher temperatures than the other algal populations [61]. A significant increase in Chl-a in August 2016 seems to have been the result of the impact of Summer monsoons typically observed in Korea and an increase in total cell concentration was also observed. The clarity of water represented by SD was also high in the subperiods of period 1, although Chl-a concentrations at each sampling location in period 1 were higher than or similar to those in period 2. If both phytoplankton cells and non-algal particles contribute to the turbidity or light attenuation of the reservoir water, very weak monsoons in the Summer of subperiod 1-2 may have reduced the impact of non-algal particles to increase SD. The results of the regression analysis also support this argument. When temporal variations in Chl-a and SD were compared, R2 was consistently higher in the subperiods in period 1 than the corresponding subperiods in period 2, when a seasonal fluctuation in R2 was observed. This indicates that algal growth was an important controlling factor of SD in period 1 due to the stationary nature of the water body. Water clarity was also affected by inorganic particles or something other than algal biomass at least in some of the seasons in period 2 due to the occasional input of the runoff. A significant increase in SD observed in Spring 2015, when TP concentrations were high, supports the possibility that an increase in TP was due to the flux of dissolved phosphorus from the sediments. The decrease and increase in SD and Chl-a, respectively, in August 2016 are thought to be the result of the increased intensity of the monsoon precipitation.
4.2. Nutritional Limitation
The TN/TP ratios of water samples analyzed in this study ranged from 13.2 to 1386.2 in period 1 and 19.2 to 1959.8 in period 2, with the averages being 211.5 and 522.4, respectively. Nutritional limitations can be assessed via the ratio and absolute concentration of each nutrient. Although threshold values of TN/TP for N- and P-limitations widely vary in the literature, N/P > 17~20 and < 10 are commonly used thresholds for P- and N-limitations, respectively [33,62,63,64]. The nutrient ratio, however, may not always indicate how algal growth is actually limited when the concentration of each nutrient is high because high, saturating concentrations cause the uncoupling of the concentration from limitation [65] and it has been proposed that neither P nor N may be limiting if the concentration of DIP exceeds about 5 µg/L and DIN about 300–500 µg/L [66]. Very high TN/TP ratios measured in this study clearly indicate mostly P-limited conditions with some co-limitation if the ratio alone is applied to assess nutrient limitation in the reservoir. Phosphorus limitation is a generally observed characteristic of Korean reservoirs regardless of the purpose of reservoir construction [32,33]. The correlation of log-transformed data of TN and TP with TN/TP showed weak and strong correlations, respectively, and TN and TP did not show appreciable relations. These findings indicate that the reservoir’s TN/TP ratio is mainly controlled by spatiotemporal fluctuations in P with relatively stable N concentrations, as observed in other Asian reservoirs under monsoon climates [40].
Since preferred nutritional conditions vary with different algal populations, fluctuation of the ratio may have significant implications on overall and compositional changes in the algal community if algal biomass in the reservoir is solely controlled by nutritional status [67]. Additionally, it has been reported that rapid algal growth in Korean reservoirs, particularly cyanobacterial bloom formations, are mainly induced by the input of phosphorus in the form of surface runoff during the monsoon period and subsequent hot and clear weather in late Summer and early Fall [46]. The results of this study, however, indicate that the nutrient ratio did not have an important influence over phytoplankton growth as evidenced by the consistently low correlation between Chl-a and TN/TP in the regression analysis. Additionally, nutritional input during the monsoon season does not completely explain factors involving the compositional change in the phytoplankton community, such as the domination of cyanobacteria, although the seasonal fluctuation in community size may partially explain this. A significant increase in Chl-a and total cell concentrations in the Summer of 2016 with values much higher than the previous Summer and a significant correlation between Chl-a and TP in the monsoon season of period 2 indicate that the monsoon played an important role in controlling nutrient input and the growth of the phytoplankton community.
The seasonal behavior of cyanobacterial populations, however, was different from the phytoplankton community as it achieved much higher growth in the Summer of 2015 to occupy a dominant fraction (Figure 8). Even though total cell concentrations were significantly higher in the corresponding season of 2016, the fraction occupied by cyanobacteria was low and stable and absolute cell concentrations were much lower. The conditions and processes that are known to explain cyanobacterial dominance include water column stability and buoyancy control [68,69,70], high water temperature [71,72], low N/P ratios [58,73], high P [59,60], low silica [74,75], and zooplankton grazing [76]. Although the N/P ratio has most frequently been used as the most important indicator accounting for cyanobacterial dominance [57,72,73,77], the results here indicate that variability in the cyanobacterial population was linked to other physical and chemical features of the water body rather than the absolute concentrations and ratios of nutrients in the reservoir. In the Summer of 2015, very weak monsoons resulted in a highly stable water body, a negligible increase in average TP concentration, and an increase in irradiation hours, which might provide low turbulence conditions, long residence times, and high temperatures that are known to be preferred by cyanobacteria [70], and cyanobacterial dominance in the year with a weak monsoon was also reported in a large multipurpose reservoir located about 100 km north of the study area [78].
Seasonal behavior of the phytoplankton community and the results of the regression analysis all indicate that, although nutritional concentrations and their fluctuation indicated P-limitation in the reservoir, change in TP and TN/TP did not exert appreciable influence on biological productivity of phytoplankton in the reservoir. This weak relationship was also found in other artificial reservoirs [16,40,79], where the low correlation of Chl-a with TN and TP was attributed to the artificial or modified flow regimes in reservoirs mostly used for hydroelectric energy and anti-flooding purposes.
4.3. Trophic Limiting Factors
Contrasting distributions of TSID data between the corresponding subperiods of the two periods in Figure 5 and Figure 6 seem to result from the differences in the distribution and intensity of monsoon rains in the two study periods. As for monsoon period data in subperiod 1-2, those from site A are located in the third quadrant, which indicates non-algal turbidity regulating light attenuation in the water. Those of site G, meanwhile, were distributed in the second quadrant, representing small particles such as dissolved color clay particles, while calculated values for the putative transition and lacustrine zone are located in the first quadrant—indicating large algal particles. It has been reported that Korean reservoirs influenced by monsoon climate are dominated by turbidity increases during the monsoon season due to the input of particulate matter washed into the reservoir by surface runoff induced by concentrated monsoon rains [46], which provide nutrients for algal growth in the post-monsoon season. The fact that non-algal turbidity and smaller particles were observed only in the riverine zone (close to incoming tributaries) in the monsoon season seems to reflect the fact that the intensity of rainfall was not strong during subperiod 1-2. A weak monsoon season only transported small particles such as dissolved color clay particles to affect the riverine and occasionally transition zones of the reservoir.
The condition of TSI(Chl) > TSI(SD) prevailing in period 1 except for some data in the monsoon season in subperiod 1-2 indicates the dominance of large phosphorus-containing particles. The distribution of data in the post-monsoon season in subperiod 1-1 in P-limited chlorophyll containing large particles (blue-green algae) seems to be in accordance with the aforementioned typical situation in Korean reservoirs as significant amounts of rainfall was observed in the Summer of 2014 right before the beginning of this study. The location of more than half of those from July and August 2015 in the first quadrant could result from weak monsoons that were not able to seriously disturb stable water body and hot temperature with sufficient amounts of solar irradiation and a minimized number of rainfall days. This indicates that the light attenuation in the reservoir was dominated by algal growth under P-limited conditions for the second half of 2015, which can be supported by more significant correlation of Kna with Chl-a in subperiod 1-2 in comparison with other subperiods.
The distribution of pre-monsoon data in Spring 2015 of subperiod 1-1 in the fourth quadrant indicates that algal growth was limited by zooplankton grazing and/or nitrogen limitation. The reservoir in general was in a nitrogen-enriched condition, as were other reservoirs in Korea during this study period, and thus algal growth limitation due to nitrogen can be disregarded [32]. A line of evidence implies that grazing by zooplankton could have been a limiting factor for algal growth in Spring 2015. Zooplankton grazing is a phenomenon that is typically observed in temperate lakes and reservoirs during the Spring to produce the clear water phase [35,36]. Although it is possible that the introduction of nutrients, mainly phosphorus, during the Spring turnover caused rapid enrichment of P in the surface layer of the reservoir such that trophic state deviation is misinterpreted to indicate phosphorus surplus condition, temporal distribution of SD and algal cell concentrations strongly imply the possibility that algal growth was actually limited by zooplankton grazing. SD increased significantly during the period (Figure 3), and the regression analysis indicated that SD was significant correlated with Chl-a while TP’s correlations with SD and Chl-a were weak, indicating the possibility that algal growth limitation was causing the water to become clearer. Additionally, without any important sources of disturbance, Chl-a did not significantly increase from March to June even with high TP concentrations and a gradual increase in water temperature indicating the possibility that some factor(s) other than nutrient concentration and temperature were affecting biological productivity. A decrease in total cell concentration was observed in Spring 2015, and it should be noted that the decrease mainly occurred in diatoms and chlorophytes with a concurrent increase in cyanobacterial cell concentrations (Figure 8). It has been reported that cyanobacteria are more resistant to zooplankton grazing than the other phytoplankton populations because cyanobacteria have attributes as food organisms that can reduce zooplankton growth such as the production of toxic metabolites, causing a deficiency of chemical compounds vital for regulating zooplankton cell functions, and the formation of large, inedible colonies [80,81,82]. These attributes function as defenses against zooplankton grazing and selective grazing of large cells has been reported [26].
The seasonally distinct distribution of data in period 2, most data in March 2017 of subperiod 2-2 in the second quadrant, the third quadrant in the Summer of 2016 (subperiod 2-1), and the distribution of the data from the post-monsoon season (October 2016) in the first quadrant appear to be caused by the increased intensity and duration of Summer monsoons compared to 2015. A much higher fraction of monsoon season data in subperiod 2-1 are located in the areas of non-algal turbidity and smaller particles including dissolved color clay particles, which are expected to be high in the riverine influent during the monsoon season. Additionally, the results obtained from the transition (sites B and C) and lacustrine (sites D, E, and F) zones, along with most of the riverine zone, were located in the areas in the subperiod 1-2. This indicates that the impact of dissolved and particulate components from the watershed transported by the tributaries was extended into the reservoir due to intensified rainfall. Post-monsoon data in subperiods 1-1 and 2-2 are mostly in the area of blue-green algae, which might result from the normal pattern of Summer monsoons and the accompanied input of nutrients during the monsoon seasons fostering algal growth in the fall [49]. It should be noted, however, that data location in this area began much later in subperiod 2-2 due to the extended duration of the Summer monsoon in 2016, indicating the fact that the timing of the transition of the trophic behavior of the reservoir is strongly controlled by the intensity and duration of the Summer monsoon.
Summarizing the results of the TSID distribution and the temporal changes in the phytoplankton community, it can be found that total cell concentrations were higher in the Summer of 2016, while the fraction and absolute concentration of blue-green algae were significantly higher in the corresponding period of 2015 when the weak monsoon period occurred in the Summer. Higher total cell concentrations and a gradual increase from the monsoon season in 2016 might imply that a normal Summer monsoon favored the diversity of the algal community. As for the blue-green algae, whose undesirable biological characteristics make them one of the primary management targets in many reservoirs, very large concentrations in the Summer of 2015 indicates the possibility that drought conditions induced by a weak Summer monsoon fosters explosive growth of the algal population [83]. Among the factors that have been known to favor the growth of blue-green algae, the stability of the water column due to reduced input from tributaries, high P concentration, and/or zooplankton grazing might render conditions that favor them. Although determining the growth of blue-green algae has most frequently been attributed to the N/P ratio, nutritional control in general was not huge in this reservoir where trophic conditions corresponded to oligotrophic or mesotrophic conditions.
5. Conclusions
In this study, spatiotemporal variations in water quality parameters and trophic state of Yongdam Reservoir were evaluated using statistical analysis and trophic state index deviation to determine how the reservoir responds to changes in physicochemical and biological changes and to identify conditions that produced the observed transition in the phytoplankton community, particularly under weak monsoon conditions.
The reservoir was mostly in mesotrophic conditions during this study. Although the trophic state of the reservoir was mainly controlled by the variation in TP concentrations, the variation in nutrient concentrations was not controlled by monsoon-associated surface runoff from the watershed as in other reservoirs under the influence of monsoon climate. This weak correlation might have been caused by a low drainage ratio, particularly under low precipitation. Additionally, the size and composition of the phytoplankton community were not completely controlled by the concentrations of nutrients and their ratios, which implied phosphorus-limited conditions. Instead, changes in physical conditions of water induced by a lack of precipitation were identified to control both nutrient levels and the phytoplankton community. Control of phytoplankton growth by zooplankton grazing and a significant increase in TP due to internal loading in the Spring, in contrast to the responses of total and cyanobacterial concentrations with changing intensity of monsoon rain late in the Summer and the low correlation of Chl-a and cell concentration with nutrient concentrations, imply that monitoring and management of pollution sources in the watershed may not be enough for the management of water quality of a reservoir. The fact that increases in cyanobacterial population, one of the major targets of water quality management, were observed in the Summer with very low intensity monsoons support this argument.
The results of this study indicate that the universal application of water quality management methods based on the assumption that water quality of a reservoir is largely controlled by the precipitation in the monsoon season may not always work, particularly when serious fluctuation in precipitation occurs in a reservoir with a low drainage ratio. As variations in Summer monsoons in terms of duration and intensity are increasing due to climate change, water quality management of the reservoirs under the influence of Summer monsoons should include a policy that can handle all the potential problems that can occur individually or in combination under various climate and reservoir operation conditions. Internal loading of phosphorus in the Spring in combination with strong monsoon in the following Summer, for example, might produce serious eutrophication problems in the post-monsoon season, and eutrophication control policies should be prepared based on simultaneous watershed and benthic sediment monitoring and management.
Supplementary Materials
The following are available online at https://www.mdpi.com/article/10.3390/w13152117/s1; Figure S1: Variations in total phosphorus (TP), total nitrogen (TN), and water temperature profiles from December 2014 to June 2015; Table S1: Threshold concentrations of cyanobacteria and Chl-a applied to an algal alert system in Korea; Table S2: Long-term (2002–2020) precipitation data of study area; Table S3: Overall and seasonal relationships of nutrient (total nitrogen, TN, mg/L; total phosphorus, TP, mg/L), chlorophyll a (Chl-a, μg/L), and Secchi depth (SD, cm) of Yongdam Reservoir in period 1 and 2 based on linear regression models using least squares method. a and b indicate slope and intercept of the regression equations (e.g., log(Chl) = a log(TP) + b) for each pair in the first column; Table S4: Regression analysis of non-algal light attenuation coefficient (Kna) with nutrients (TP: total phosphorus, TN: total nitrogen), Secchi depth (SD), and chlorophyll-a (Chl-a). a and b indicate slope and intercept of the regression equations for each pair in the first column.
Author Contributions
Conceptualization, H.-s.K.; methodology, S.-m.K.; software, S.-m.K.; formal analysis, S.-m.K. and H.-s.K.; data curation, S.-m.K.; writing—original draft preparation, S.-m.K.; writing—review and editing, H.-s.K.; visualization, S.-m.K. and H.-s.K.; supervision, H.-s.K.; project administration, H.-s.K.; funding acquisition, H.-s.K. Both authors have read and agreed to the published version of the manuscript.
Funding
This work was supported by the research grant of the Jeonbuk Green Environment Center (Project No. 19-14-02-02-12).
Institutional Review Board Statement
Not applicable.
Informed Consent Statement
Not applicable.
Data Availability Statement
Not applicable.
Acknowledgments
The authors appreciate the financial support of Jeonbuk Green Environment Center.
Conflicts of Interest
The authors declare no conflict of interest.
References
- Ingole, N.P.; An, K.G. Modifications of nutrient regime, chlorophyll-a, and trophic state relations in daechung reservoir after the construction of an upper dam. J. Ecol. Environ. 2016, 40, 1–10. [Google Scholar] [CrossRef] [Green Version]
- Atique, U.; An, K.G. Reservoir water quality assessment based on chemical parameters and the chlorophyll dynamics in relation to nutrient regime. Pol. J. Environ. Stud. 2019, 28, 1043–1061. [Google Scholar] [CrossRef]
- Mailhot, A.; Talbot, G.; Ricard, S.; Turcotte, R.; Guinard, K. Assessing the potential impacts of dam operation on daily flow at ungauged river reaches. J. Hydrol. Reg. Stud. 2018, 18, 156–167. [Google Scholar] [CrossRef]
- Wetzel, R.G. Limnology Lake and River Ecosystem; Academic Press: Cambridge, MA, USA, 2001; ISBN 9780127447605. [Google Scholar]
- Atique, U.; An, K.G. Landscape heterogeneity impacts water chemistry, nutrient regime, organic matter and chlorophyll dynamics in agricultural reservoirs. Ecol. Indic. 2020, 110, 105813. [Google Scholar] [CrossRef]
- Markad, A.T.; Landge, A.T.; Nayak, B.B.; Inamdar, A.B.; Mishra, A.K. Trophic state modeling for shallow freshwater reservoir: A new approach. Environ. Monit. Assess. 2019, 191, 586. [Google Scholar] [CrossRef]
- Haande, S.; Rohrlack, T.; Semyalo, R.P.; Brettum, P.; Edvardsen, B.; Lyche-Solheim, A.; Sørensen, K.; Larsson, P. Phytoplankton dynamics and cyanobacterial dominance in Murchison Bay of Lake Victoria (Uganda) in relation to environmental conditions. Limnologica 2011, 41, 20–29. [Google Scholar] [CrossRef] [Green Version]
- Spears, B.M.; Carvalho, L.; Dudley, B.; May, L. Variation in chlorophyll a to total phosphorus ratio across 94 UK and Irish lakes: Implications for lake management. J. Environ. Manag. 2013, 115, 287–294. [Google Scholar] [CrossRef] [PubMed]
- Wang, L.P.; Liu, L.S.; Zheng, B.H. Eutrophication development and its key regulating factors in a water-supply reservoir in North China. J. Environ. Sci. 2013, 25, 962–970. [Google Scholar] [CrossRef]
- Redfield, A.C. The biological control of chemical factors in the environment. Am. Sci. 1958, 46, 205–221. [Google Scholar]
- Smith, V.H. The nitrogen and phosphorus dependence of algal biomass in lakes: An empirical and theoretical analysis. Limnol. Oceanogr. 1982, 27, 1101–1112. [Google Scholar] [CrossRef]
- Rowland, F.E.; North, R.L.; McEachern, P.; Obrecht, D.V.; Gurung, T.B.; Jones, S.B.; Jones, J.R. Phytoplankton nutrient deficiencies vary with season in sub-tropical lakes of Nepal. Hydrobiologia 2019, 833, 157–172. [Google Scholar] [CrossRef]
- Maberly, S.C.; King, L.; Dent, M.M.; Jones, R.I.; Gibson, C.E. Nutrient limitation of phytoplankton and periphyton growth in upland lakes. Freshw. Biol. 2002, 47, 2136–2152. [Google Scholar] [CrossRef]
- Huber, W.C.; Brezonik, P.; Heaney, J.P.; Dickinson, R.E.; Preston, S.D. A Classification of Florida Lakes; Final Report; Department of Environmental Regulations: Tallahassee, FL, USA, 1982. [Google Scholar]
- Ptacnik, R.; Andersen, T.; Tamminen, T. Performance of the Redfield ratio and a family of nutrient limitation indicators as thresholds for phytoplankton N vs. P limitation. Ecosystems 2010, 13, 1201–1214. [Google Scholar] [CrossRef]
- Zou, X.; Wan, J.; Pan, X.; Wan, C.; Peng, J.; Chang, J.; Xie, P. Nitrogen and phosphorus relationships to chlorophyll a in 139 reservoirs of China. Fresenius Environ. Bull. 2014, 23, 1689–1696. [Google Scholar]
- Yang, Y.; Pan, J.; Han, B.; Naselli-Flores, L. The effects of absolute and relative nutrient concentrations (N/P) on phytoplankton in a subtropical reservoir. Ecol. Indic. 2020, 115, 106466. [Google Scholar] [CrossRef]
- Naumann, E. The scope and chief problems of regional limnology. Int. Rev. Gesamten Hydrobiol. Hydrogr. 1929, 22, 129–163. [Google Scholar] [CrossRef]
- Dillon, P.J.; Rigler, F.H. The phosphorus-chlorophyll relationship in lakes. Limnol. Oceanogr. 1974, 19, 767–773. [Google Scholar] [CrossRef]
- Carlson, R.E. A trophic state index for lakes. Limnol. Oceanogr. 1977, 22, 361–369. [Google Scholar] [CrossRef] [Green Version]
- Kratzer, C.R.; Brezonik, P.L. A Carlson-type trophic state index for nitrogen in Florida Lakes. J. Am. Water Resour. Assoc. 1981, 17, 713–715. [Google Scholar] [CrossRef]
- Burns, N.M.; Rutherford, J.C.; Clayton, J.S. A monitoring and classification system for New Zealand lakes and reservoirs. Lake Reserv. Manag. 1999, 15, 255–271. [Google Scholar] [CrossRef]
- Edmondson, W.T. Secchi disk and chlorophyll. Limnol. Oceanogr. 1980, 25, 378–379. [Google Scholar] [CrossRef]
- Carlson, R.E. Expanding the trophic state concept to identify non-nutrient limited lakes and reservoirs. In Proceedings of the National Conference on Enhancing the States’ Lake Management Programs. Monitoring and Lake Impact Assessment, Chicago, IL, USA; 1991; pp. 59–71. [Google Scholar]
- Havens, K.E. Using trophic state index (TSI) values to draw inferences regarding phytoplankton limiting factors and seston composition from routine water quality monitoring data. Korean J. Ecol. Environ. 2000, 33, 187–196. [Google Scholar]
- Hara, J.; Atique, U.; An, K.G. Multiyear links between water chemistry, algal chlorophyll, drought-flood regime, and nutrient enrichment in a morphologically complex reservoir. Int. J. Environ. Res. Public Health 2020, 17, 1–22. [Google Scholar] [CrossRef]
- Kim, J.Y.; Atique, U.; Mamun, M.; An, K.-G. Long-term interannual and seasonal links between the nutrient regime, sestonic chlorophyll and dominant bluegreen algae under the varying intensity of monsoon precipitation in a drinking water reservoir. Int. J. Environ. Res. Public Health 2021, 18, 2871. [Google Scholar] [CrossRef]
- Zou, W.; Zhu, G.; Cai, Y.; Vilmi, A.; Xu, H.; Zhu, M.; Gong, Z.; Zhang, Y.; Qin, B. Relationships between nutrient, chlorophyll a and Secchi depth in lakes of the Chinese Eastern Plains ecoregion: Implications for eutrophication management. J. Environ. Manag. 2020, 260, 109923. [Google Scholar] [CrossRef] [PubMed]
- Jones, J.R.; Knowlton, M.F.; An, K.G. Trophic state, seasonal patterns and empirical models in South Korean Reservoirs. Lake Reserv. Manag. 2003, 19, 64–78. [Google Scholar] [CrossRef]
- Knowlton, M.F.; Jones, J.R. Temporal and spatial dynamics of suspended sediment, nutrients, and algal biomass in Mark Twain Lake, Missouri. Arch. Hydrobiol. 1995, 135, 145–178. [Google Scholar] [CrossRef]
- Mamun, M.; An, K.G. Major nutrients and chlorophyll dynamics in Korean agricultural reservoirs along with an analysis of trophic state index deviation. J. Asia Pac. Biodivers 2017, 10, 183–191. [Google Scholar] [CrossRef]
- Mamun, M.; Kwon, S.; Kim, J.; An, G.K. Evaluation of algal chlorophyll and nutrient relations and the N:P ratios along with trophic status and light regime in 60 Korea reservoirs. Sci. Total Environ. 2020, 741, 140451. [Google Scholar] [CrossRef]
- Mamun, M.; Kim, J.Y.; An, G.K. Trophic responses of the Asian reservoir to long-term seasonal and interannual dynamic monsoon. Water 2020, 12, 2066. [Google Scholar] [CrossRef]
- Philips, E.J.; Cichra, M.; Havens, K.; Hanton, C.; Badylak, S.; Rueter, B.; Randall, M.; Hansen, P. Relationships between phytoplankton dynamics and the availability of light and nutrients in a shallow sub-tropical lake. J. Plankton Res. 1997, 19, 319–342. [Google Scholar] [CrossRef]
- Talling, J.F. Phytoplankton-zooplankton seasonal timing and the ‘clear-water phase’ in some English lakes. Freshw. Biol. 2003, 48, 39–52. [Google Scholar] [CrossRef]
- Tirok, K.; Gaedke, U. Spring weather determines the relative importance of ciliates, rotifers and crustaceans for the initiation of the clear-water phase in a large, deep lake. J. Plankton Res. 2006, 28, 361–373. [Google Scholar] [CrossRef] [Green Version]
- Shen, H.; Cai, Q.; Zhang, M. Spatial gradient and seasonal variation of trophic status in a large water supply reservoir for the South-to-North Water Diversion Project, China. J. Freshw. Ecol. 2015, 30, 249–261. [Google Scholar] [CrossRef] [Green Version]
- Saluja, R.; Garg, J.K. Trophic state assessment of Bhindawas Lake, Haryana, India. Environ. Monit. Assess. 2017, 189, 32. [Google Scholar] [CrossRef] [PubMed]
- Kumar, P.; Mahajan, A.K.; Meena, N.K. Evaluation of trophic status and its limiting factors in the Renuka Lake of Lesser Himalaya, India. Environ. Monit. Assess. 2019, 191, 105. [Google Scholar] [CrossRef]
- Bilgin, A. Trophic state and limiting nutrient evaluations using trophic state/level index methods: A case study of Borcka Dam Lake. Environ. Monit. Assess. 2020, 192, 794. [Google Scholar] [CrossRef]
- MOE. Standard Methods for the Examination of Water Quality Contamination, 7th ed.; Ministry of Environemnt (MOE): Gwacheon, Korea, 2014; p. 435. (In Korean) [Google Scholar]
- Carlson, R.E.; Simpson, J. A Coordinator’s Guide to Volunteer Lake Monitoring Methods. North Am. Lake Manag. Soc. 1996, 96. [Google Scholar]
- Walker, W.W. An empirical analysis of phosphorus, nitrogen, and turbidity effects on reservoir chlorophyll-a levels. Can. Water Resour. J. 1982, 7, 88–107. [Google Scholar] [CrossRef] [Green Version]
- Cade, B.S.; Noon, B.R. A gentle introduction to quantile regression for ecologists. Front. Ecol. Environ. 2003, 1, 412–420. [Google Scholar] [CrossRef]
- Calderon, M.S.; An, K.G. Spatio-temporal variabilities of nutrients and chlorophyll, and the trophic state index deviations on the relation of nutrients-chlorophyll–light availability. J. Ecol. Environ. 2016, 39, 31–42. [Google Scholar] [CrossRef] [Green Version]
- Chung, S.W.; Lee, H.; Jung, Y. The effect of hydrodynamic flow regimes on the algal bloom in a monomictic reservoir. Water Sci. Technol. 2008, 58, 1291–1298. [Google Scholar] [CrossRef]
- An, K.G.; Park, S.S. Indirect influence of the summer monsoon on chlorophyll-total phosphorus models in reservoirs: A case study. Ecol. Model. 2002, 152, 191–203. [Google Scholar] [CrossRef]
- Hwang, S.J.; Kwun, S.K.; Yoon, C.G. Water quality and limnology of Korean reservoirs. Paddy Water Environ. 2003, 1, 43–52. [Google Scholar] [CrossRef]
- Kim, B.; Park, J.H.; Hwang, G.; Jun, M.S.; Choi, K. Eutrophication of reservoirs in South Korea. Limnology 2001, 2, 223–229. [Google Scholar] [CrossRef]
- Kim, Y.D.; Yi, Y.; Ko, I.H.; Kim, W.G. Water quality management by reservoir discharge control through selective withdrawal. In Proceedings of the Korea Water Resources Association Conference, Korea, 1 May 2005; pp. 454–458. [Google Scholar]
- Lee, H.W.; Lee, Y.S.; Kim, J.; Lim, K.J.; Choi, J.H. Contribution of internal nutrients loading on the water quality of a reservoir. Water 2019, 11, 1409. [Google Scholar] [CrossRef] [Green Version]
- Dadi, T.; Völkner, C.; Koschorreck, M. A sediment core incubation method to measure the flux of dissolved organic carbon between sediment and water. J. Soils Sediments 2015, 15, 2350–2358. [Google Scholar] [CrossRef]
- Kovar, J.L.; Pierzynski, G.M. Methods of Phosphorus Analysis for Soils, Sediments, Residuals, and Waters, 2nd ed.; South Coop Ser Bull, Virginia Tech University: Blacksburg, VA, USA, 2009; Volume 408, pp. 50–60. [Google Scholar]
- Yang, C.; Yang, P.; Geng, J.; Yin, H.; Chen, K. Sediment internal nutrient loading in the most polluted area of a shallow eutrophic lake (Lake Chaohu, China) and its contribution to lake eutrophication. Environ. Pollut. 2020, 262, 114292. [Google Scholar] [CrossRef] [PubMed]
- Kiani, M.; Tammeorg, P.; Niemistö, J.; Simojoki, A.; Tammeorg, O. Internal phosphorus loading in a small shallow Lake: Response after sediment removal. Sci. Total Environ. 2020, 725, 138279. [Google Scholar] [CrossRef]
- Walter, J.A.; Fleck, R.; Pace, M.L.; Wilkinson, G.M. Scaling relationships between lake surface area and catchment area. Aquat. Sci. 2020, 82, 1–8. [Google Scholar] [CrossRef]
- Suzuki, Y.; Takahashi, M. Growth responses of several diatom species isolated from various environments to temperature. J. Phycol. 1995, 31, 880–888. [Google Scholar] [CrossRef]
- Smith, V.H. Low nitrogen to phosphorus ratios favor dominance by bluegreen algae in lake phytoplankton. Science 1983, 221, 669–671. [Google Scholar] [CrossRef] [Green Version]
- Trimbee, A.M.; Prepas, E.E. Evaluation of total phosphorus as a predictor of the relative biomass of blue-green algae with emphasis on Alberta lakes. Can. J. Fish. Aquatic. Sci. 1987, 44, 1337–1342. [Google Scholar] [CrossRef]
- Watson, S.B.; McCauley, E.; Downing, J.A. Patterns in phytoplankton taxonomic composition across temperate lakes of differing nutrient status. Limnol. Oceanogr. 1997, 42, 487–495. [Google Scholar] [CrossRef] [Green Version]
- Paerl, H.W.; Huisman, J. Blooms like it hot. Science 2008, 320, 57–58. [Google Scholar] [CrossRef] [PubMed] [Green Version]
- Forsberg, C.; Ryding, S.O. Eutrophication parameters and trophic state indices in 30 Swedish waste-receiving lakes. Arch Hydrobiol. 1980, 89, 189–207. [Google Scholar]
- Hellström, T. An empirical study of nitrogen dynamics in lakes. Water Environ. Res. 1996, 68, 55–65. [Google Scholar] [CrossRef]
- Marberly, S.C.; Pitt, J.; Davies, P.S.; Carvalho, L. Nitrogen and phosphorus limitation and the management of small productive lakes. Inland Waters 2020, 10, 159–172. [Google Scholar] [CrossRef] [Green Version]
- Reynolds, C.S. Metabolic sensitivities of lacustrine ecosystems to anthropogenic forcing. Aquat. Sci. 1999, 61, 183–205. [Google Scholar] [CrossRef]
- Reynolds, C.S. The Ecology of Freshwater Phytoplankto; Cambridge University Press: Cambridge, UK, 1984. [Google Scholar]
- Paerl, H.W.; Fulton, R.S.; Moisander, P.H.; Dyble, J. Harmful freshwater algal blooms, with an amphasis on cyanobacteria. Sci. World 2001, 1, 139109. [Google Scholar]
- Reynolds, C.S. Cyanobacterial water-blooms. Adv. Bot. Res. 1987, 13, 67–143. [Google Scholar]
- Paerl, H.W. Nuisance phytoplankton blooms in coastal, estuarine and inland waters. Limnol. Oceanogr. 1988, 33, 823–847. [Google Scholar] [CrossRef]
- Reynolds, C.S. The long, the short and the stalled: On the attributes of phytoplankton selected by physical mixing in lakes and rivers. Hydrobiologia 1994, 289, 9–21. [Google Scholar] [CrossRef]
- Tilman, D.; Kiesling, R.; Sterner, R.; Kilham, S.; Johnson, F.A. Green, blue-green and diatom algae—Taxonomic differences in competitive ability for phosphorus, silica and nitrogen. Arch. Hydrobiol. 1986, 106, 473–485. [Google Scholar]
- McQueen, D.J.; Lean, D.R.S. Influence of water temperature and nitrogen–phosphorus ratios on the dominant bluegreen algae in Lake St. George, Ontario. Can. J. Fish. Aquat. Sci. 1987, 44, 598–604. [Google Scholar] [CrossRef]
- Schindler, D.W. Evolution of phosphorus limitation in lakes. Science 1977, 195, 260–262. [Google Scholar] [CrossRef] [PubMed] [Green Version]
- Kilham, S.S. A hypothesis concerning silica and the freshwater plankton diatoms. Limnol. Oceanogr. 1971, 16, 10–18. [Google Scholar] [CrossRef]
- Sterner, R.W. Resource competition during seasonal succession toward dominance by cyanobacteria. Ecology 1989, 70, 229–245. [Google Scholar] [CrossRef]
- Haney, J.F. Field studies on zooplankton-cyanobacteria interactions. N. Z. J. Mar. Freshw. Res. 1987, 21, 467–475. [Google Scholar] [CrossRef]
- Ryding, S.O.; Rast, W. The Control of Eutrophication of Lakes and Reservoirs; Man and the Biosphere Series; UNESCO and The Parthenon Publishing Group: Nashville, TN, USA, 1989; Volume 1, pp. 54–58. [Google Scholar]
- An, K.; Jones, J.R. Factors regulating bluegreen dominance in a reservoir directly influenced by the Asian monsoon. Hydrobiologia 2000, 432, 37–48. [Google Scholar] [CrossRef]
- Onandia, G.; Dias, J.D.; Miracle, M.R. Zooplankton grazing on natural algale and bacteria under hypertrophic conditions. Limnetica 2015, 34, 541–560. [Google Scholar]
- Gulati, R.D.; Demott, W.R. The role of food quality for zooplankton: Remarks on the state-of-the-art, perspectives and priorities. Freshw. Biol. 1997, 38, 753–768. [Google Scholar] [CrossRef]
- DeMott, W.R.; Gulati, R.D.; Van Donk, E. Daphnia food limitation in three hypereutrophic Dutch lakes: Evidence for exclusion of large-bodied species by interfering filaments of cyanobacteria. Limnol. Oceanogr. 2001, 46, 2054–2060. [Google Scholar] [CrossRef]
- Leflaive, J.P.; Ten-Hage, L. Algal and cyanobacterial secondary metabolites in freshwaters: A comparison of allelopathic compounds and toxins. Freshw. Biol. 2007, 52, 199–214. [Google Scholar] [CrossRef]
- Brasil, J.; Attayde, J.L.; Vasconcelos, F.R.; Dantas, D.D.F.; Huszar, V.L.M. Drought induced water-level reduction favors cyanobacteria blooms in tropical shallow lakes. Hydrobiologia 2016, 770, 145–164. [Google Scholar] [CrossRef]
Figure 1.
A map of the sampling sites and water intake towers of Yongdam Reservoir.

Figure 2.
Inflow, outflow, and water level of Yongdam Reservoir and monthly precipitation in the surrounding area during this study.
Figure 2.
Inflow, outflow, and water level of Yongdam Reservoir and monthly precipitation in the surrounding area during this study.

Figure 3.
Box-and-whisker plots showing spatial distribution and average values in each sampling event (a–e) and temporal distribution and average values at each location (f–j; subperiod 1-1 and 2-2, k–o; subperiod 1-2 and 2-1) of total nitrogen (TN), total phosphorus (TP), chemical oxygen demand (COD), chlrophyll a (Chl-a), and Secchi depth (SD). The dotted lines in a–e were inserted for the division between the two sampling periods.

Figure 4.
Variations in various trophic state indices. (a,b) are temporal distributions in periods 1 and 2, respectively, with subperiods indicated by double-sided arrows. (c,d), and (e,f) are corresponding spatial distributions in subperiods 1-1 and 2-2, 1-2 and 2-1, respectively.
Figure 4.
Variations in various trophic state indices. (a,b) are temporal distributions in periods 1 and 2, respectively, with subperiods indicated by double-sided arrows. (c,d), and (e,f) are corresponding spatial distributions in subperiods 1-1 and 2-2, 1-2 and 2-1, respectively.


Figure 5.
Variations in trophic state index deviation in (a) subperiod 1-1 and 2-2, and with (b) seasons and (c) locations in subperiod 1-1, and (d) seasons and (e) locations in subperiod 2-2.
Figure 5.
Variations in trophic state index deviation in (a) subperiod 1-1 and 2-2, and with (b) seasons and (c) locations in subperiod 1-1, and (d) seasons and (e) locations in subperiod 2-2.

Figure 6.
Variations in trophic state index deviation in (a) subperiod 1-2 and 2-1, and with (b) seasons and (c) locations in subperiod 1-2, and (d) seasons and (e) locations in subperiod 2-1.
Figure 6.
Variations in trophic state index deviation in (a) subperiod 1-2 and 2-1, and with (b) seasons and (c) locations in subperiod 1-2, and (d) seasons and (e) locations in subperiod 2-1.


Figure 7.
Regression analysis between TN/TP and TP in (a) period 1 and (b) period 2. The numbers of regression equations in the figures are in chronological order.
Figure 7.
Regression analysis between TN/TP and TP in (a) period 1 and (b) period 2. The numbers of regression equations in the figures are in chronological order.

Figure 8.
Temporal distribution of cell concentrations of taxonomic groups of phytoplankton. Values depicted are average values of data measured in seven sampling locations.
Figure 8.
Temporal distribution of cell concentrations of taxonomic groups of phytoplankton. Values depicted are average values of data measured in seven sampling locations.


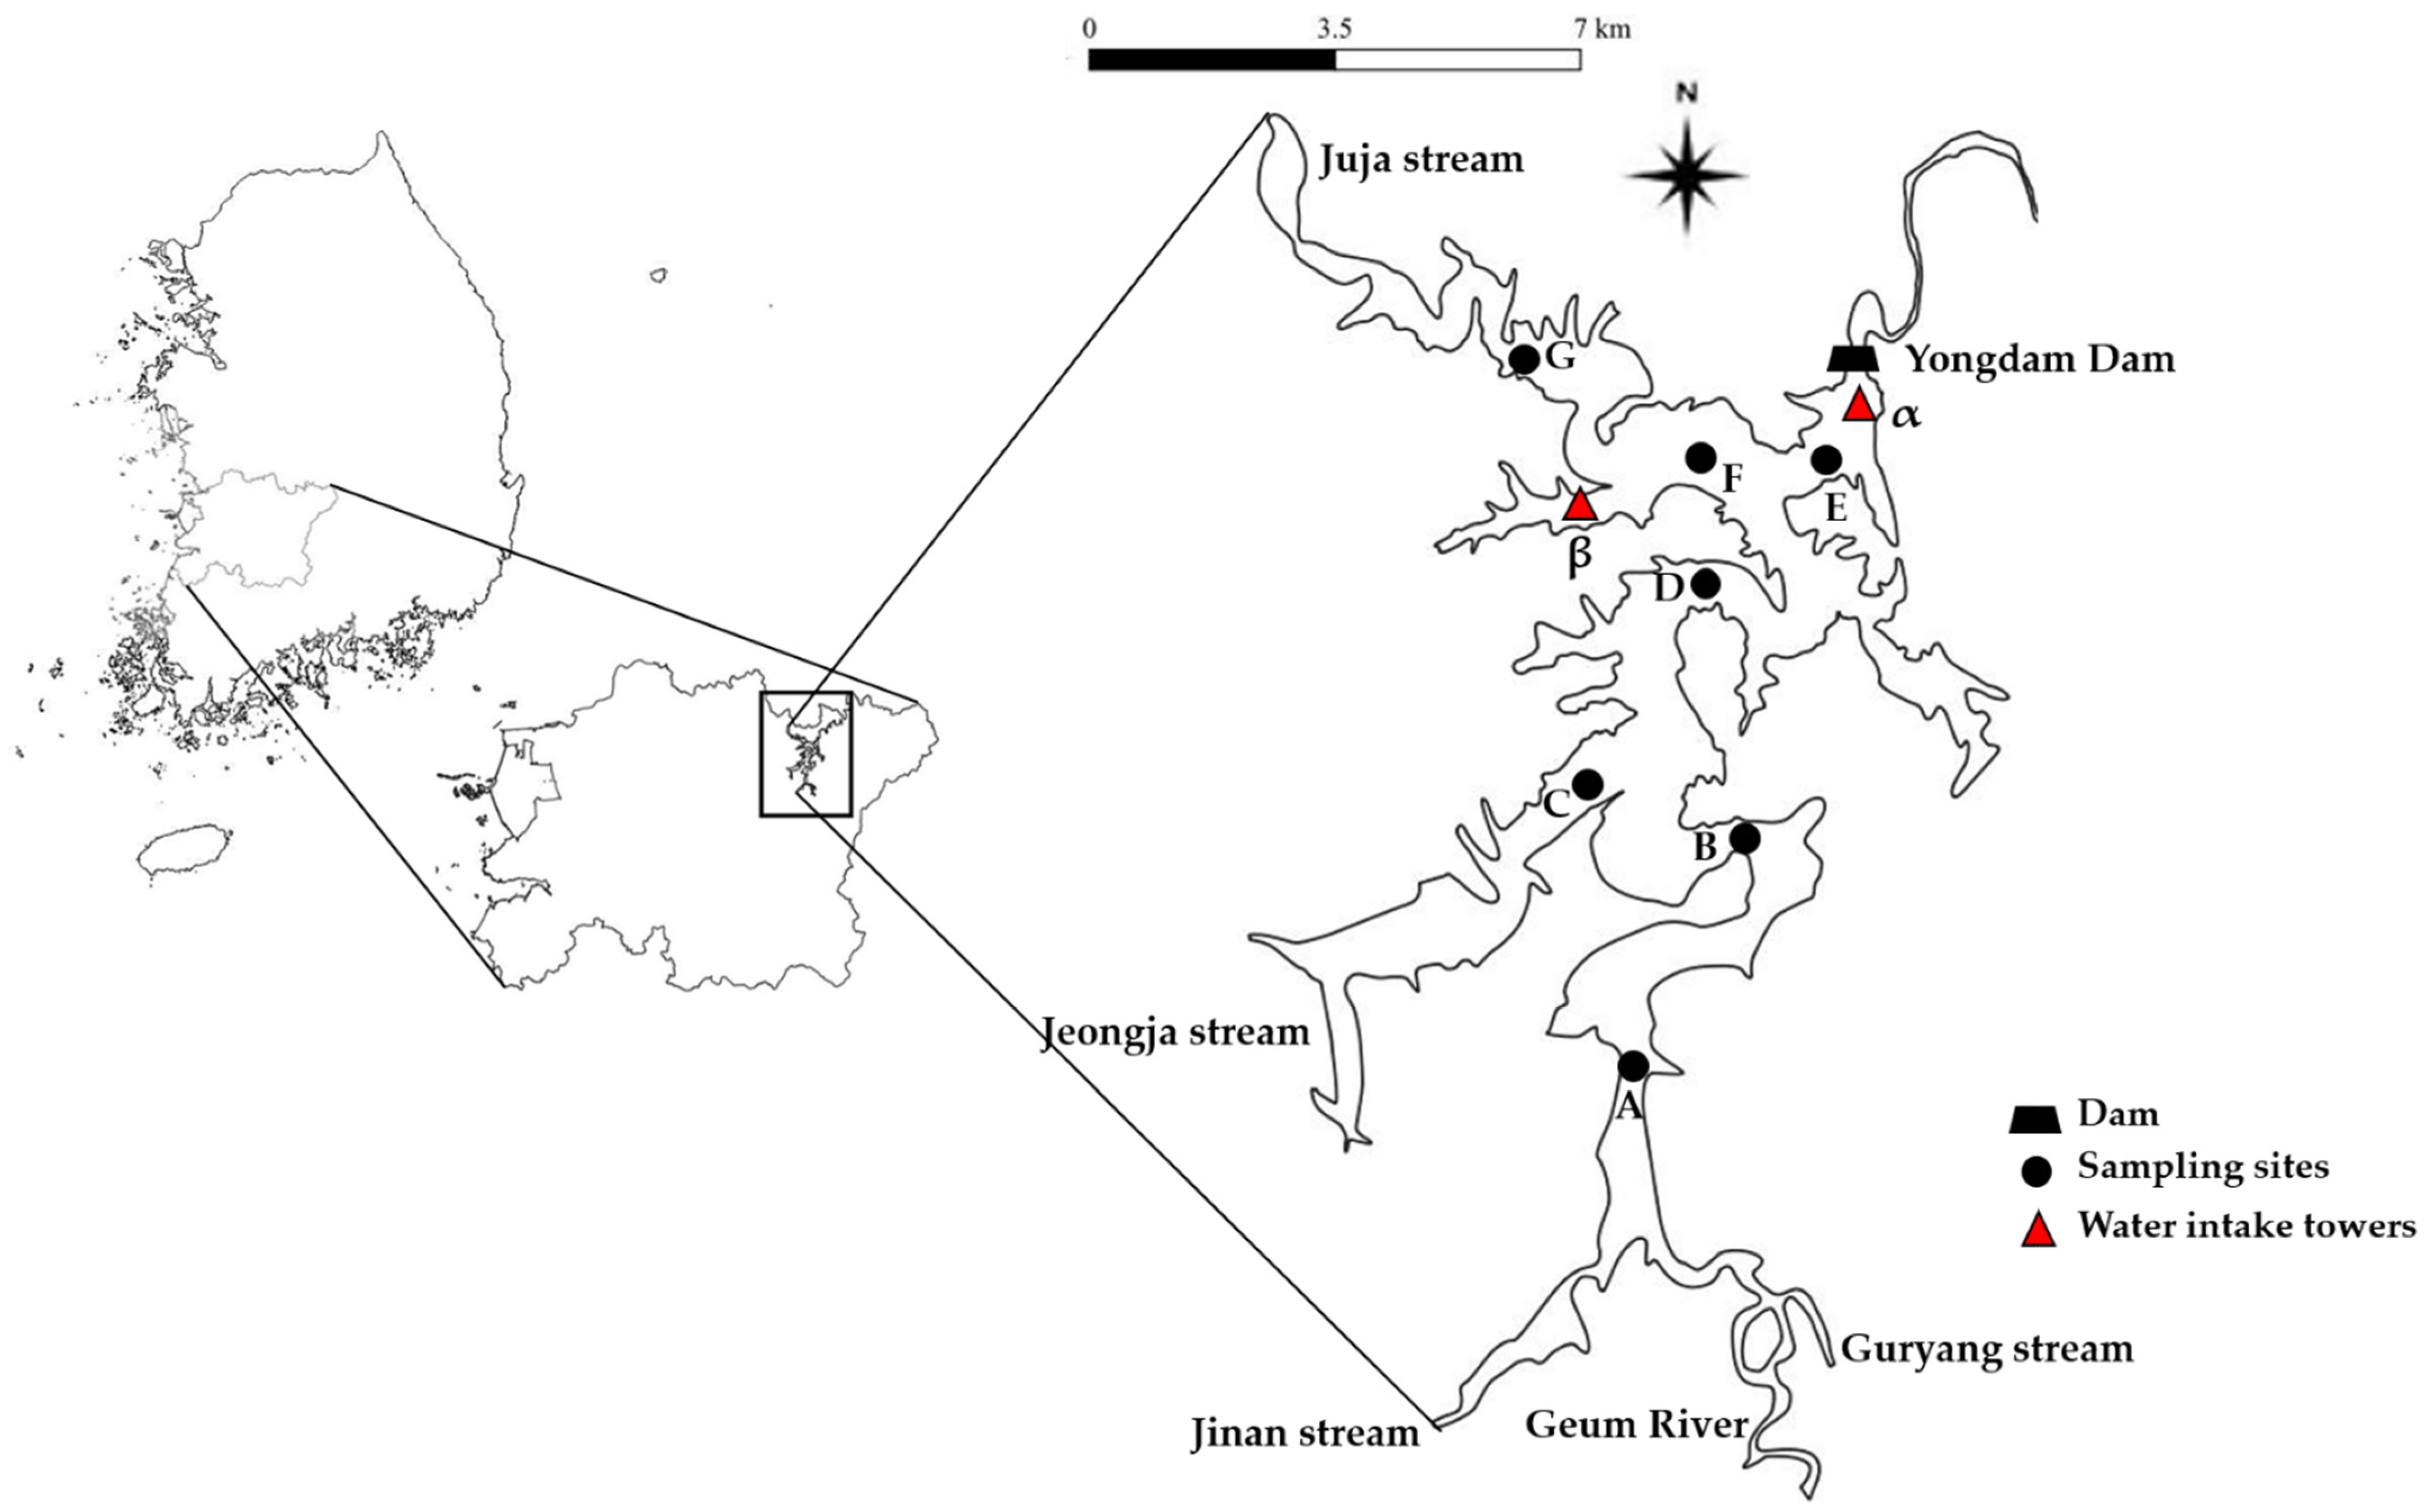
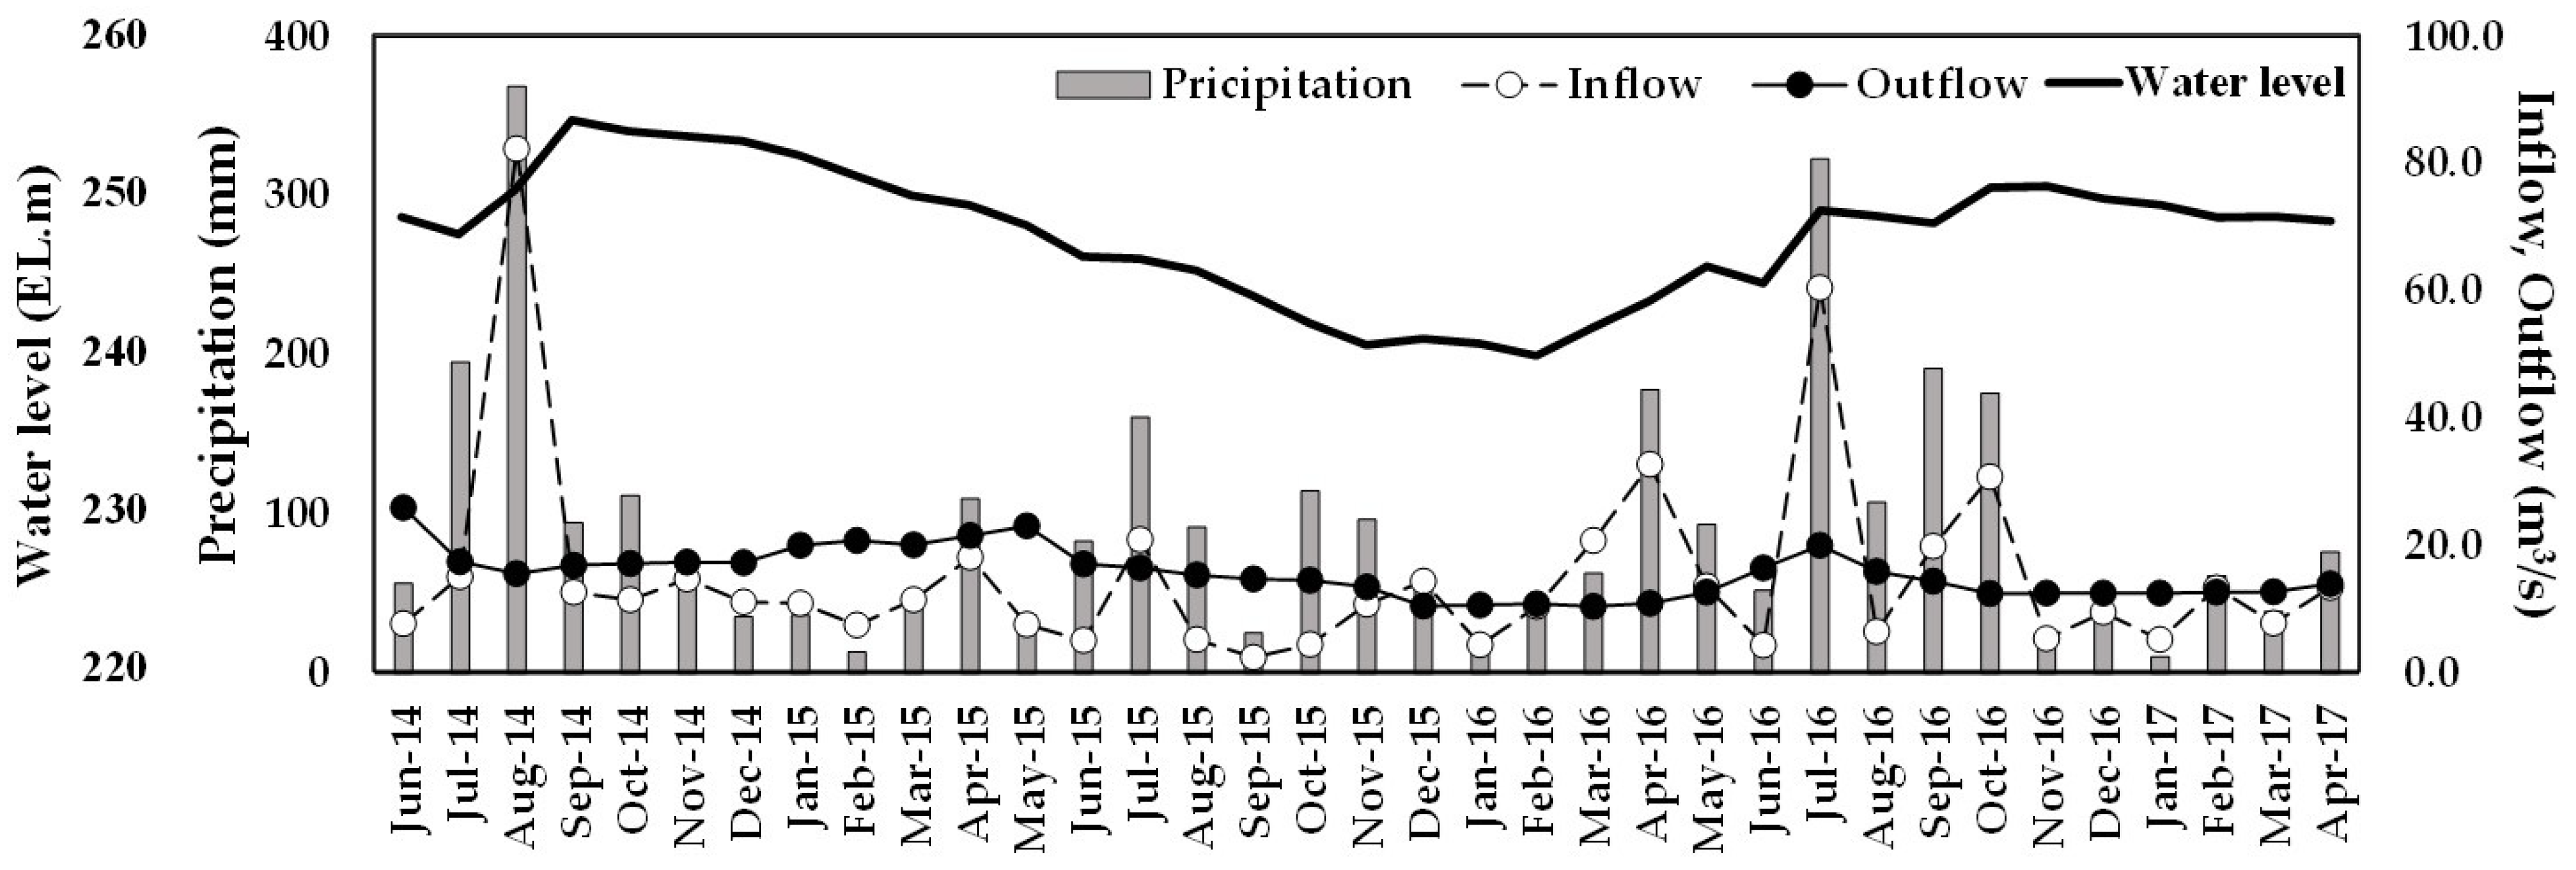
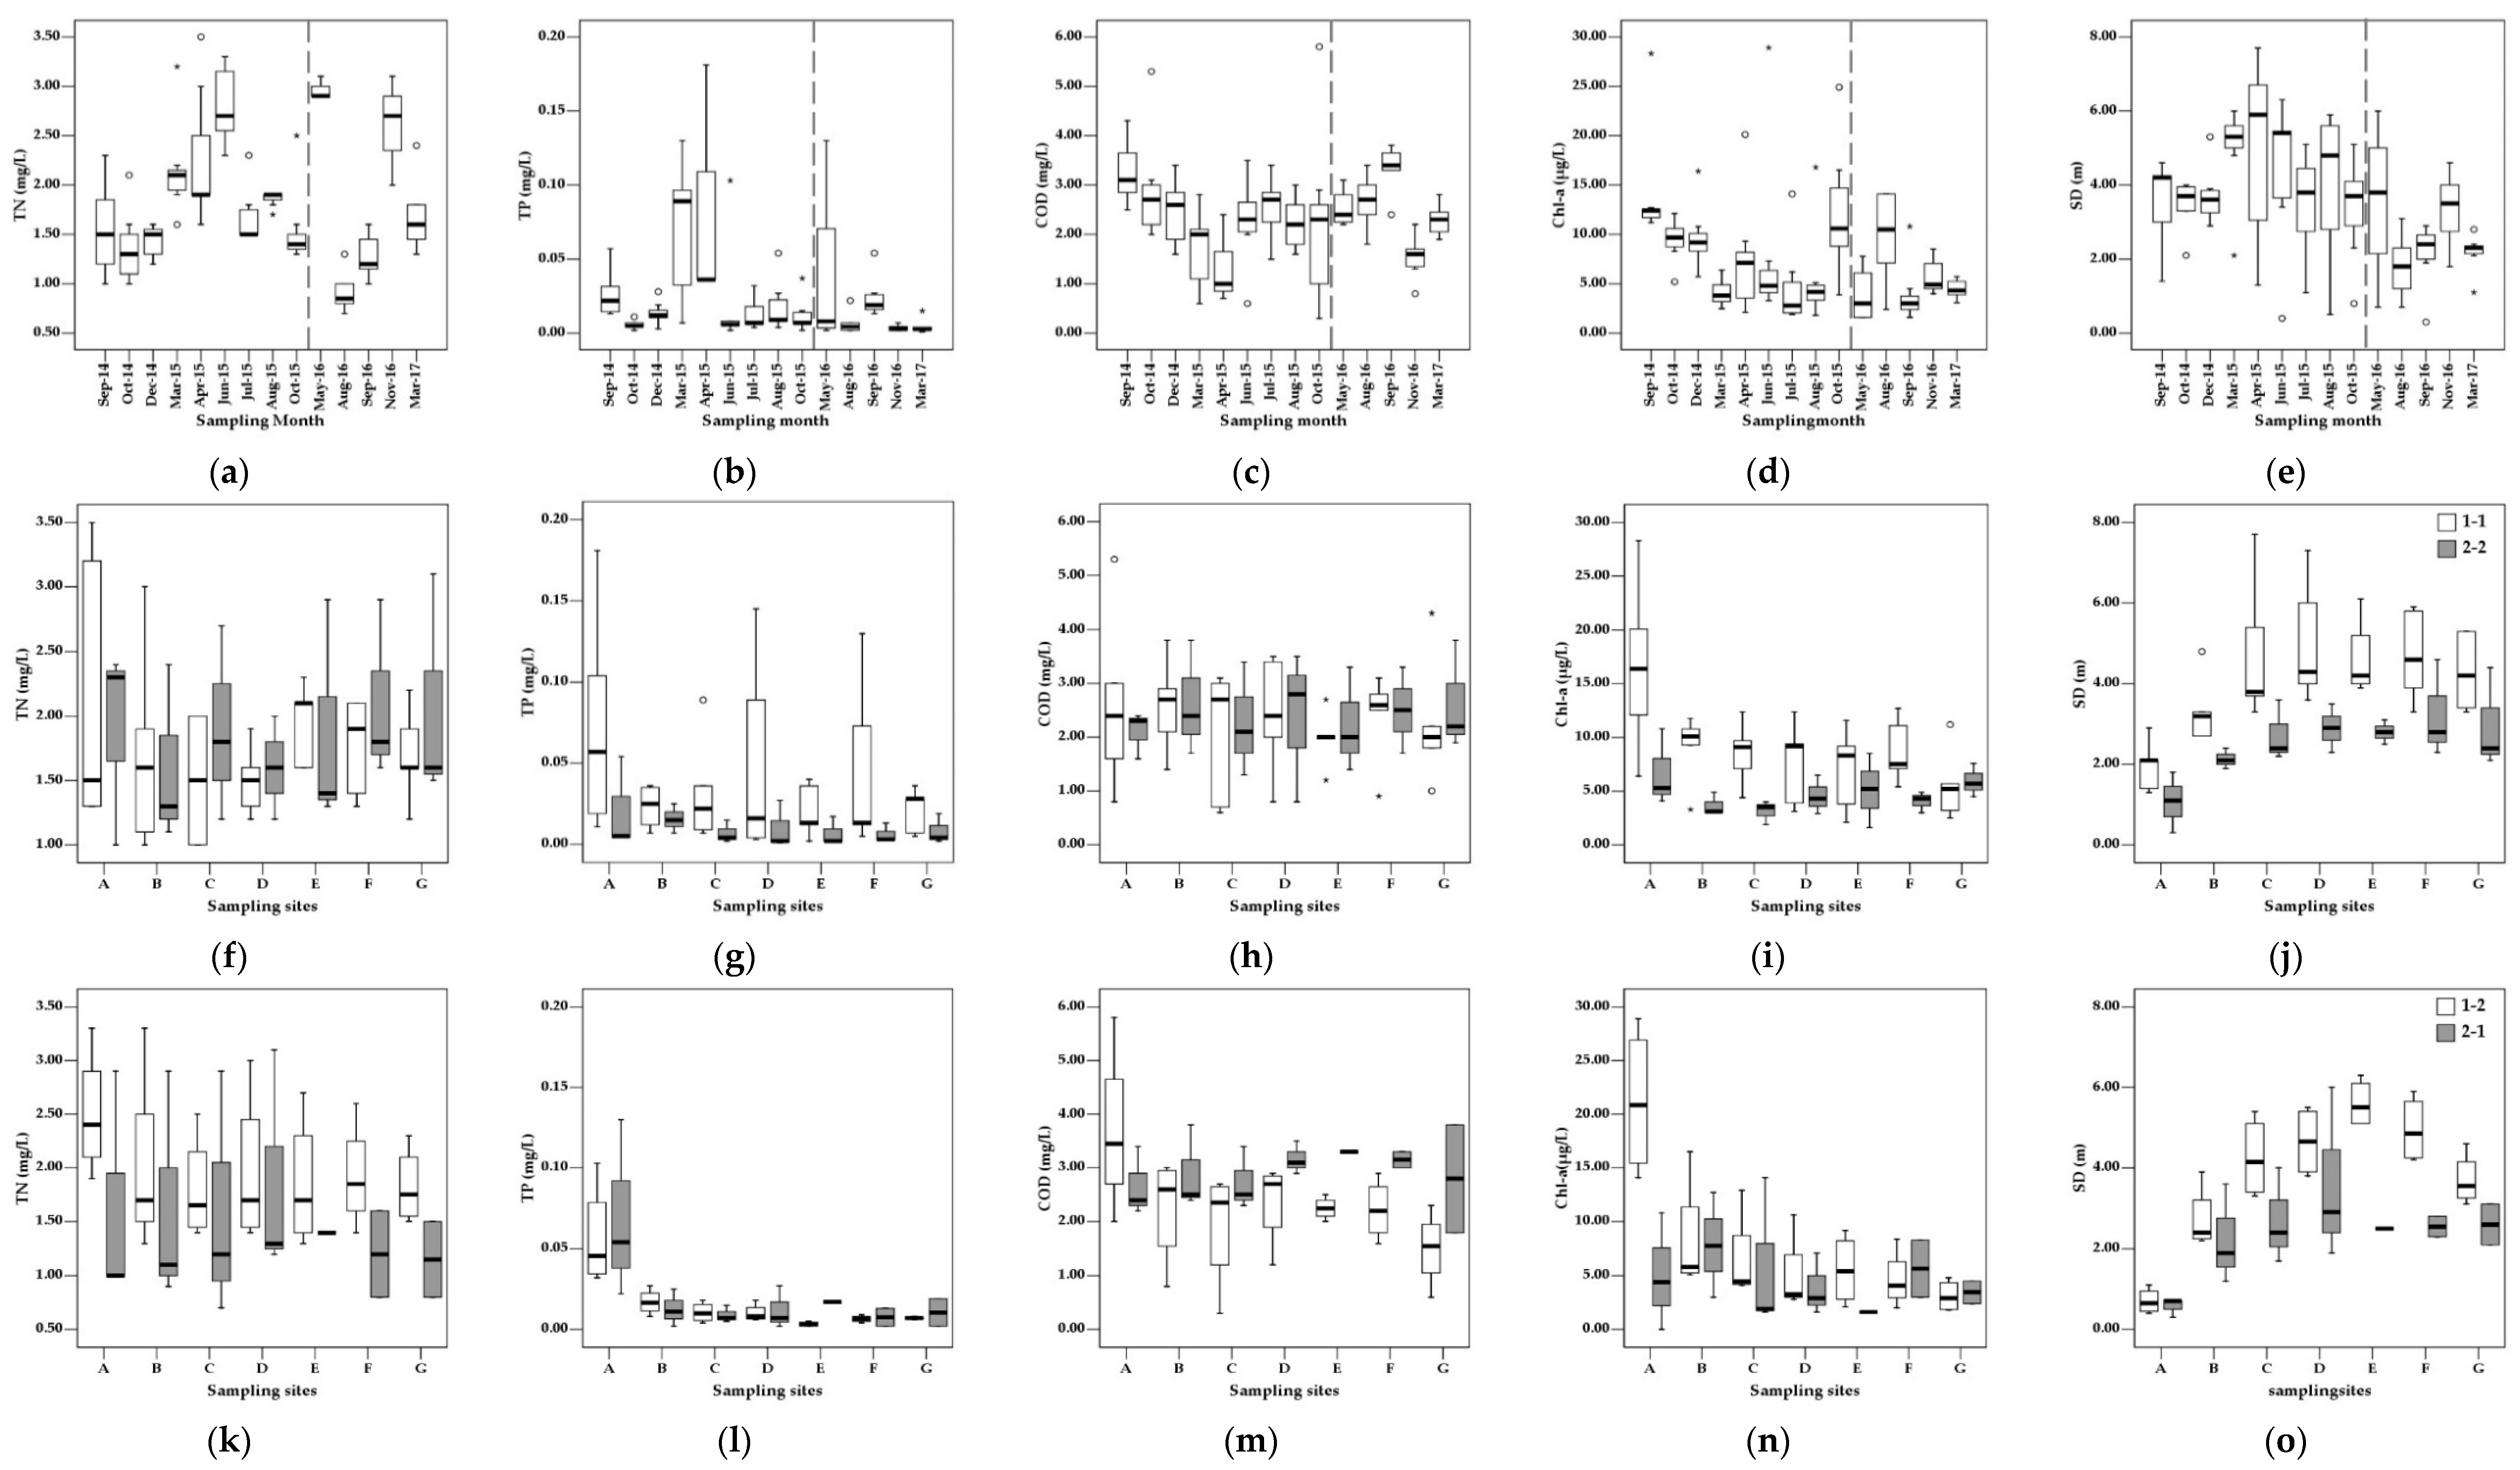
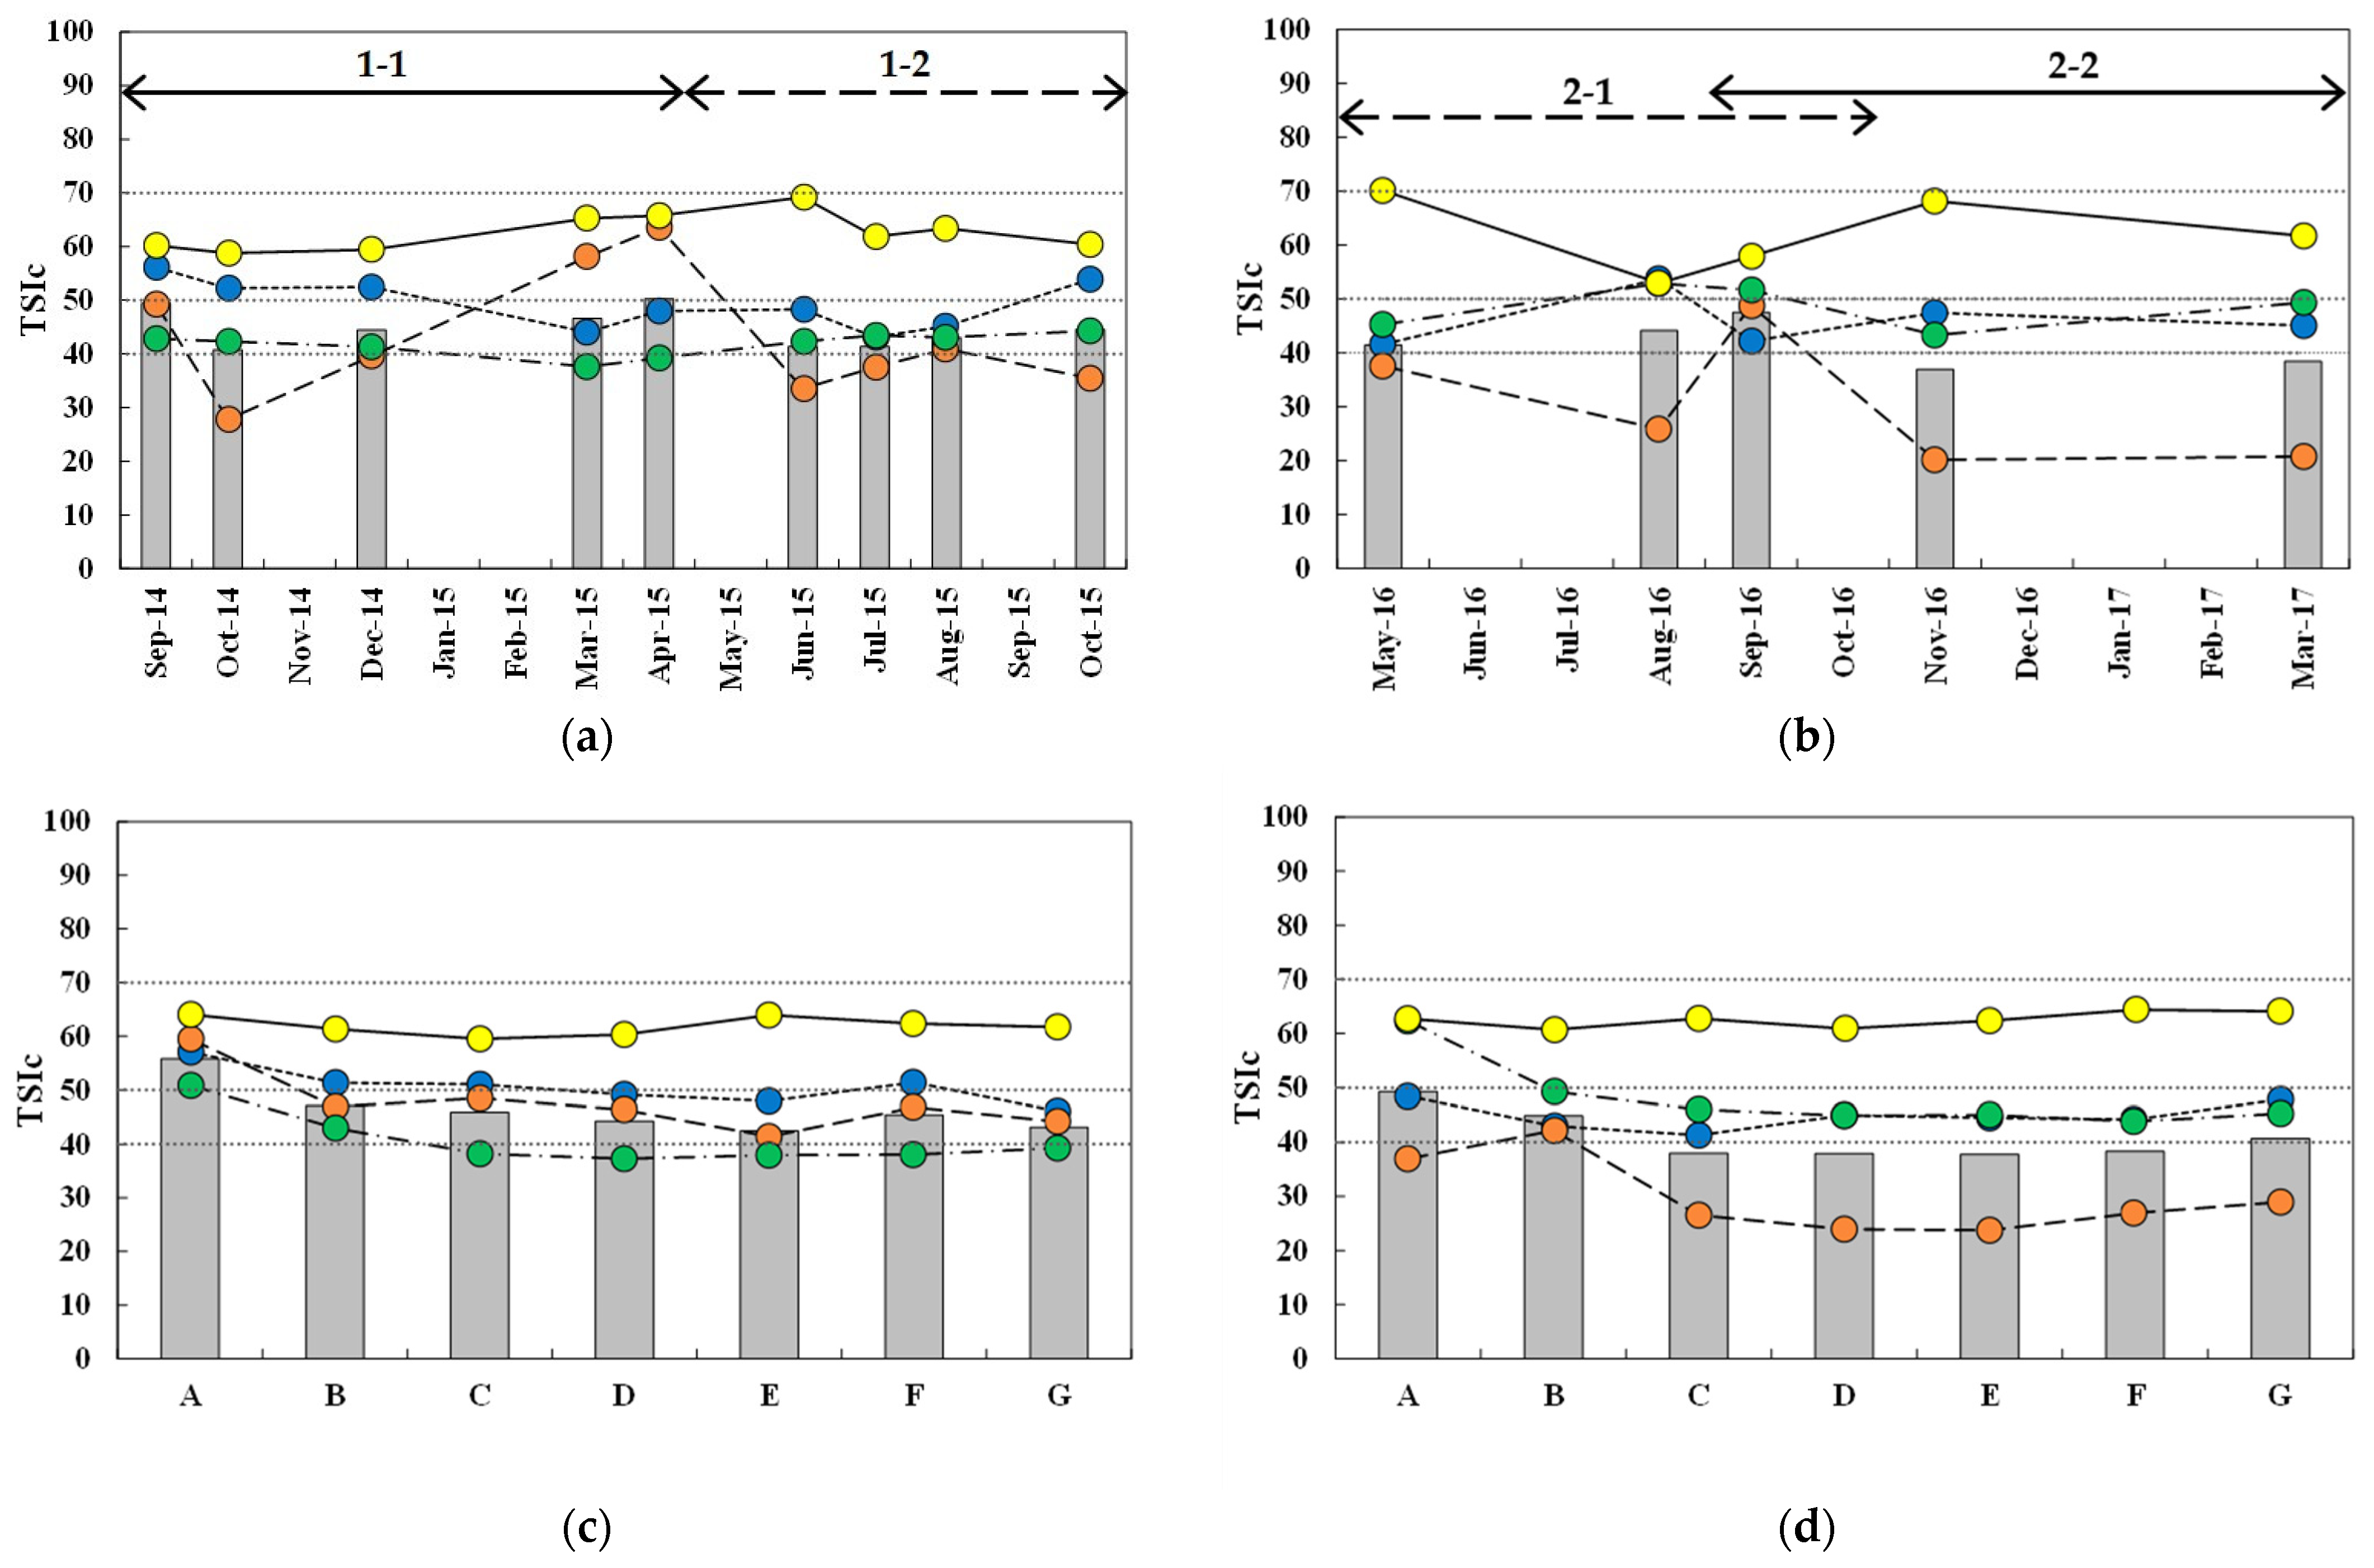
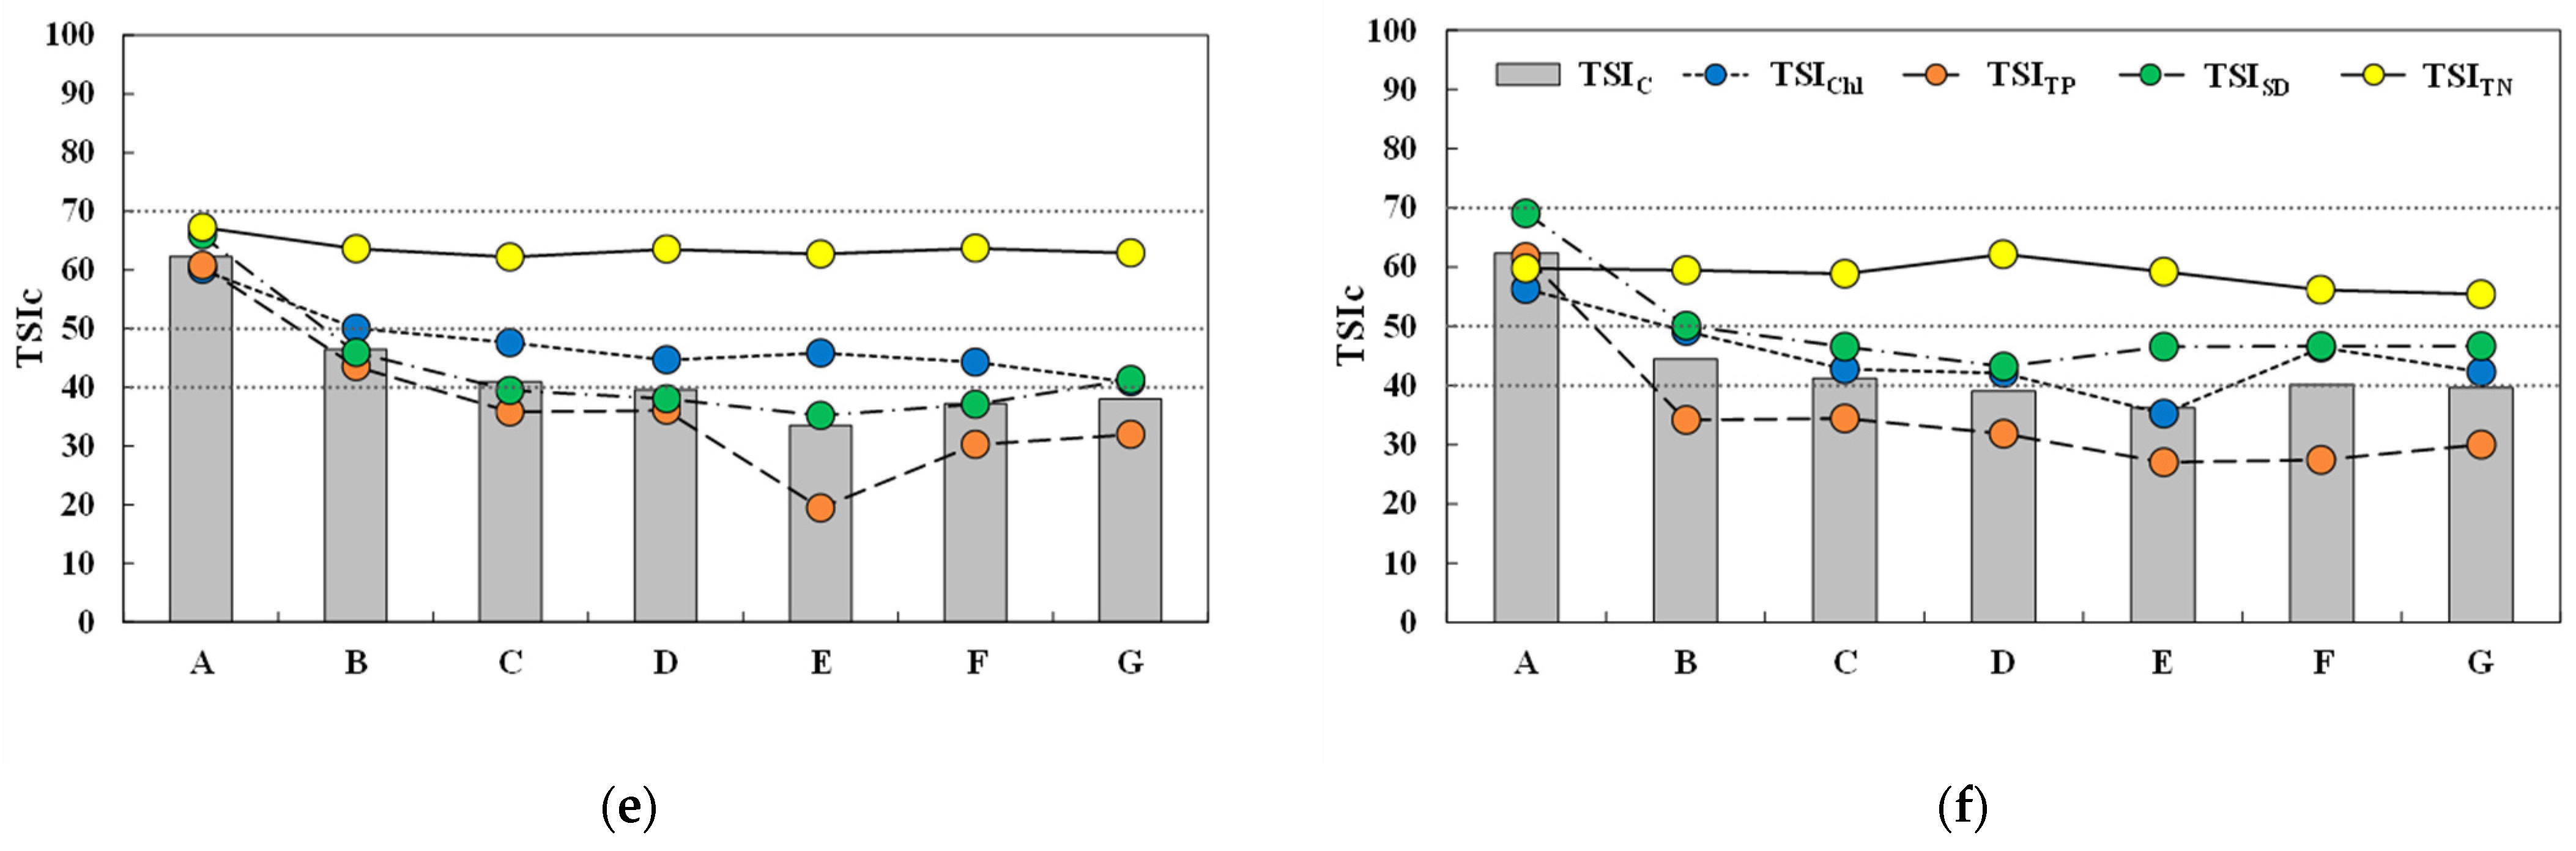
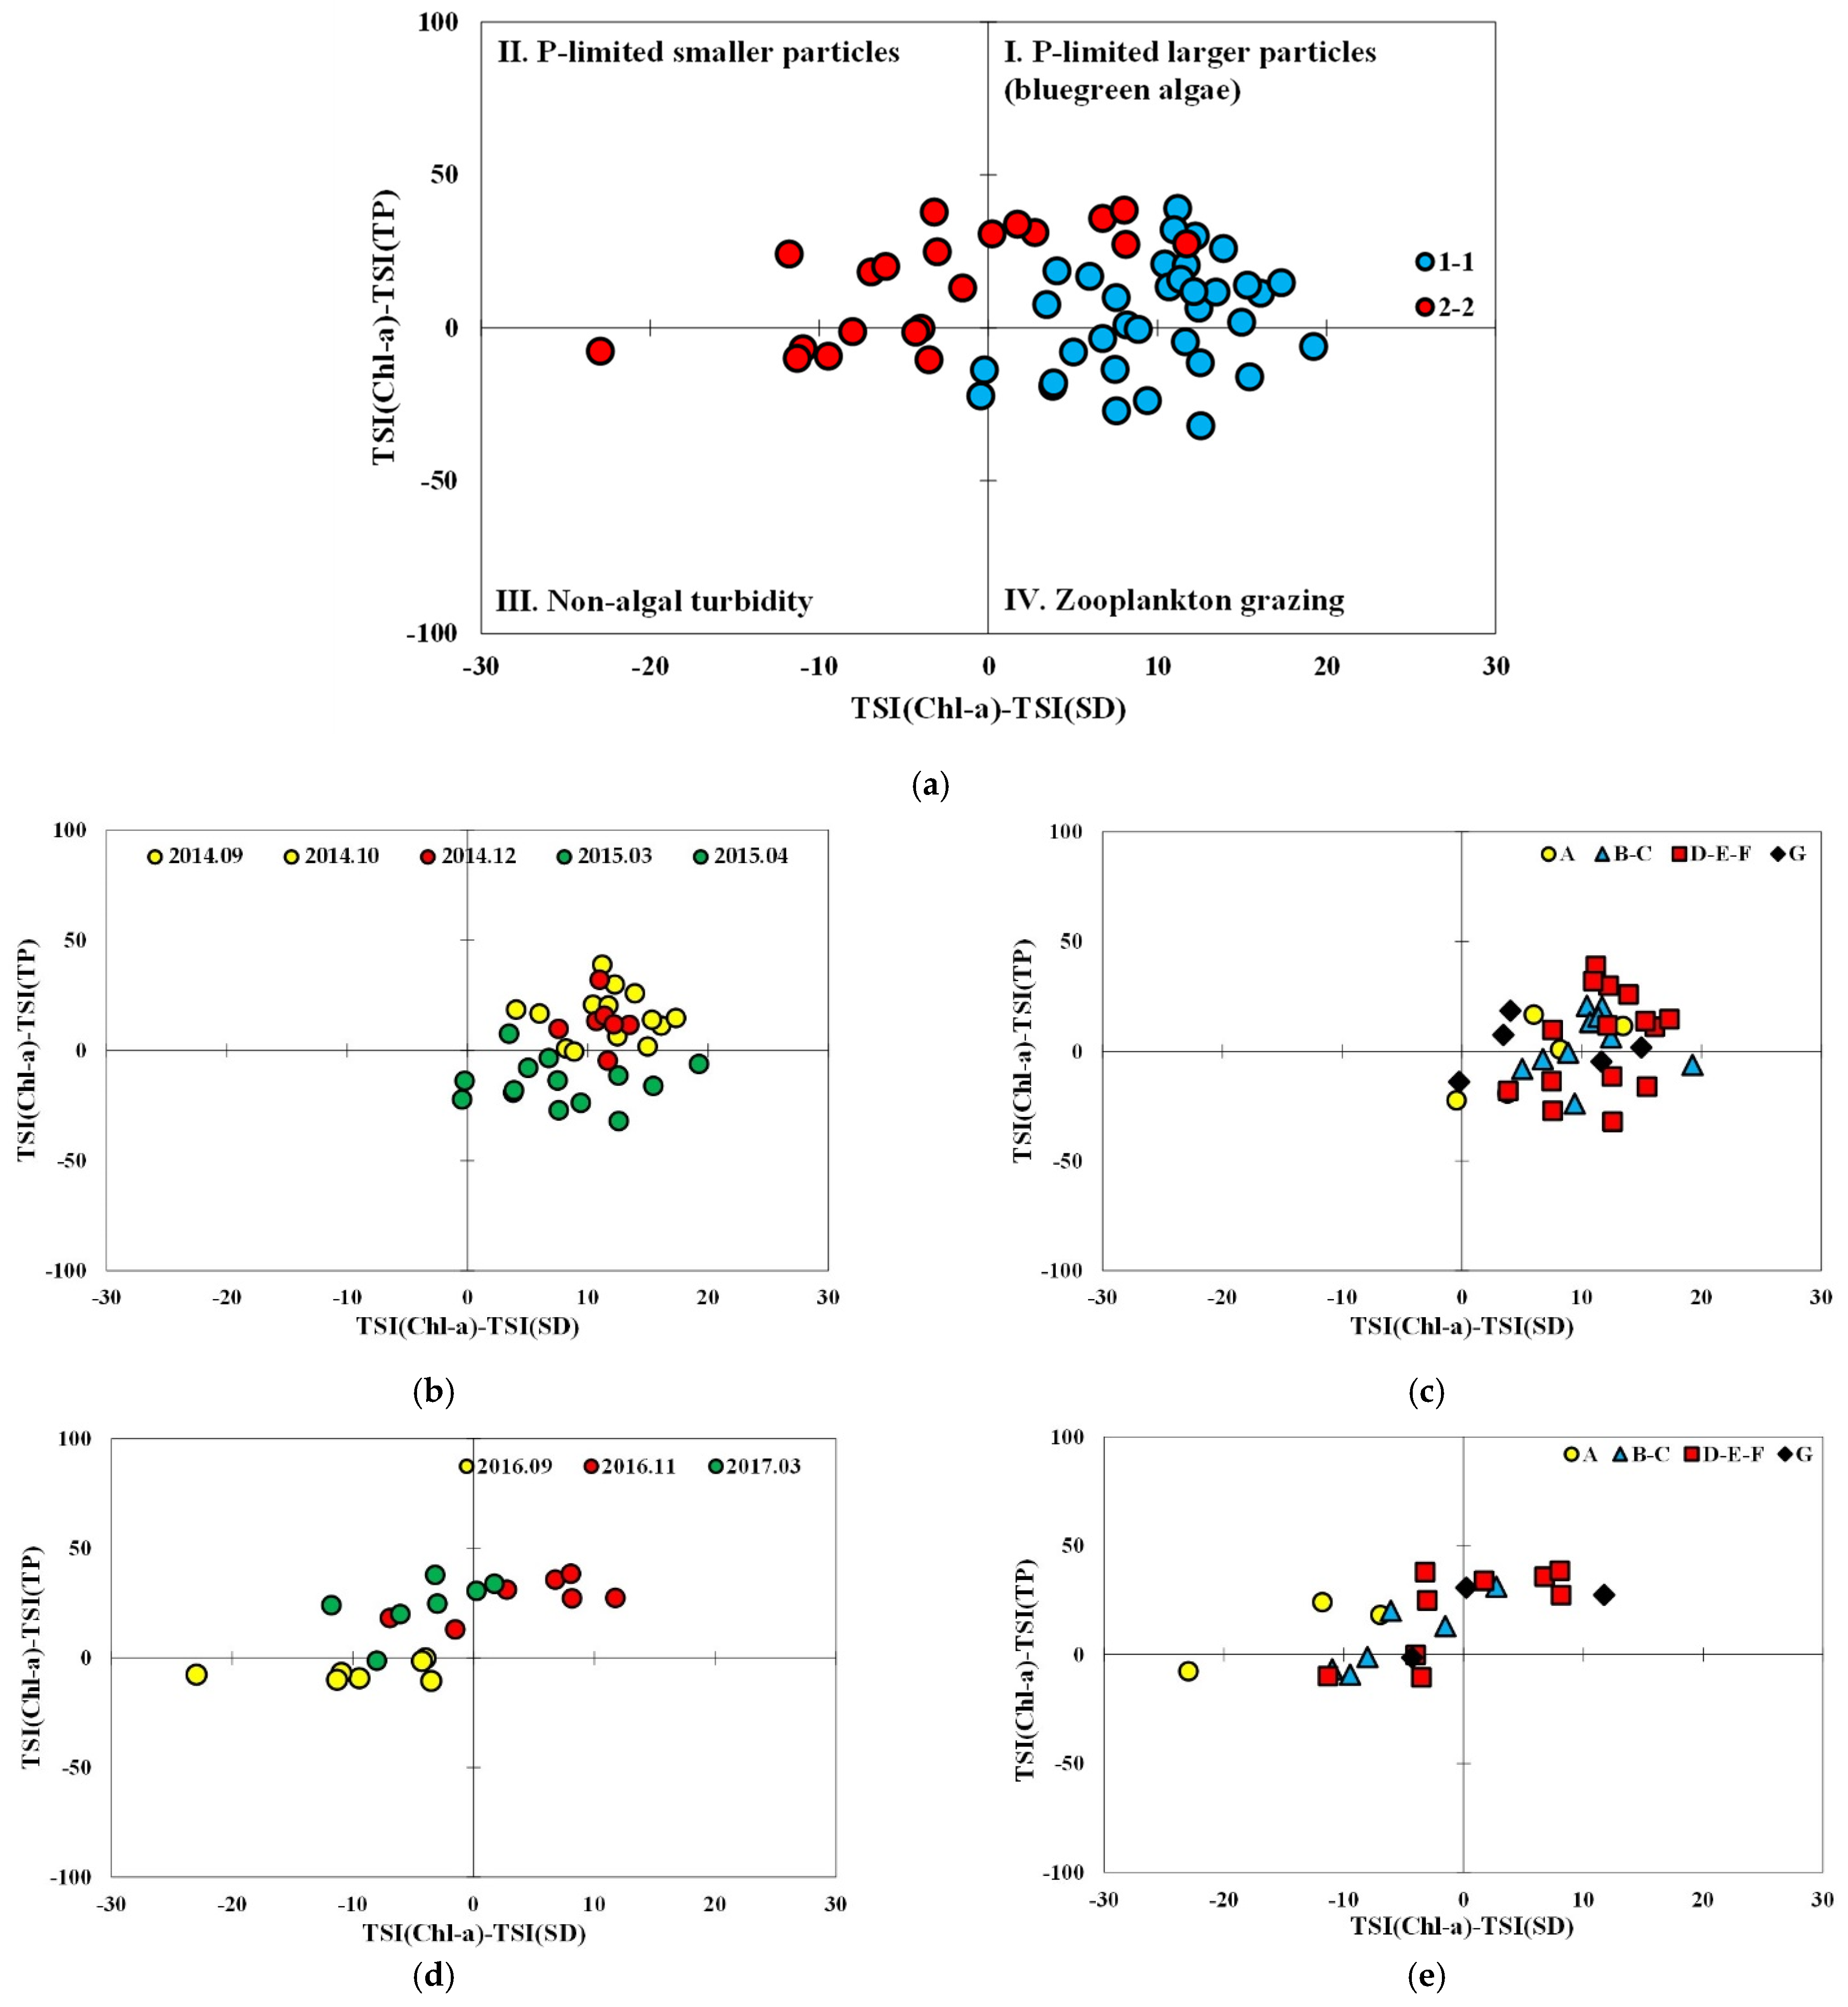
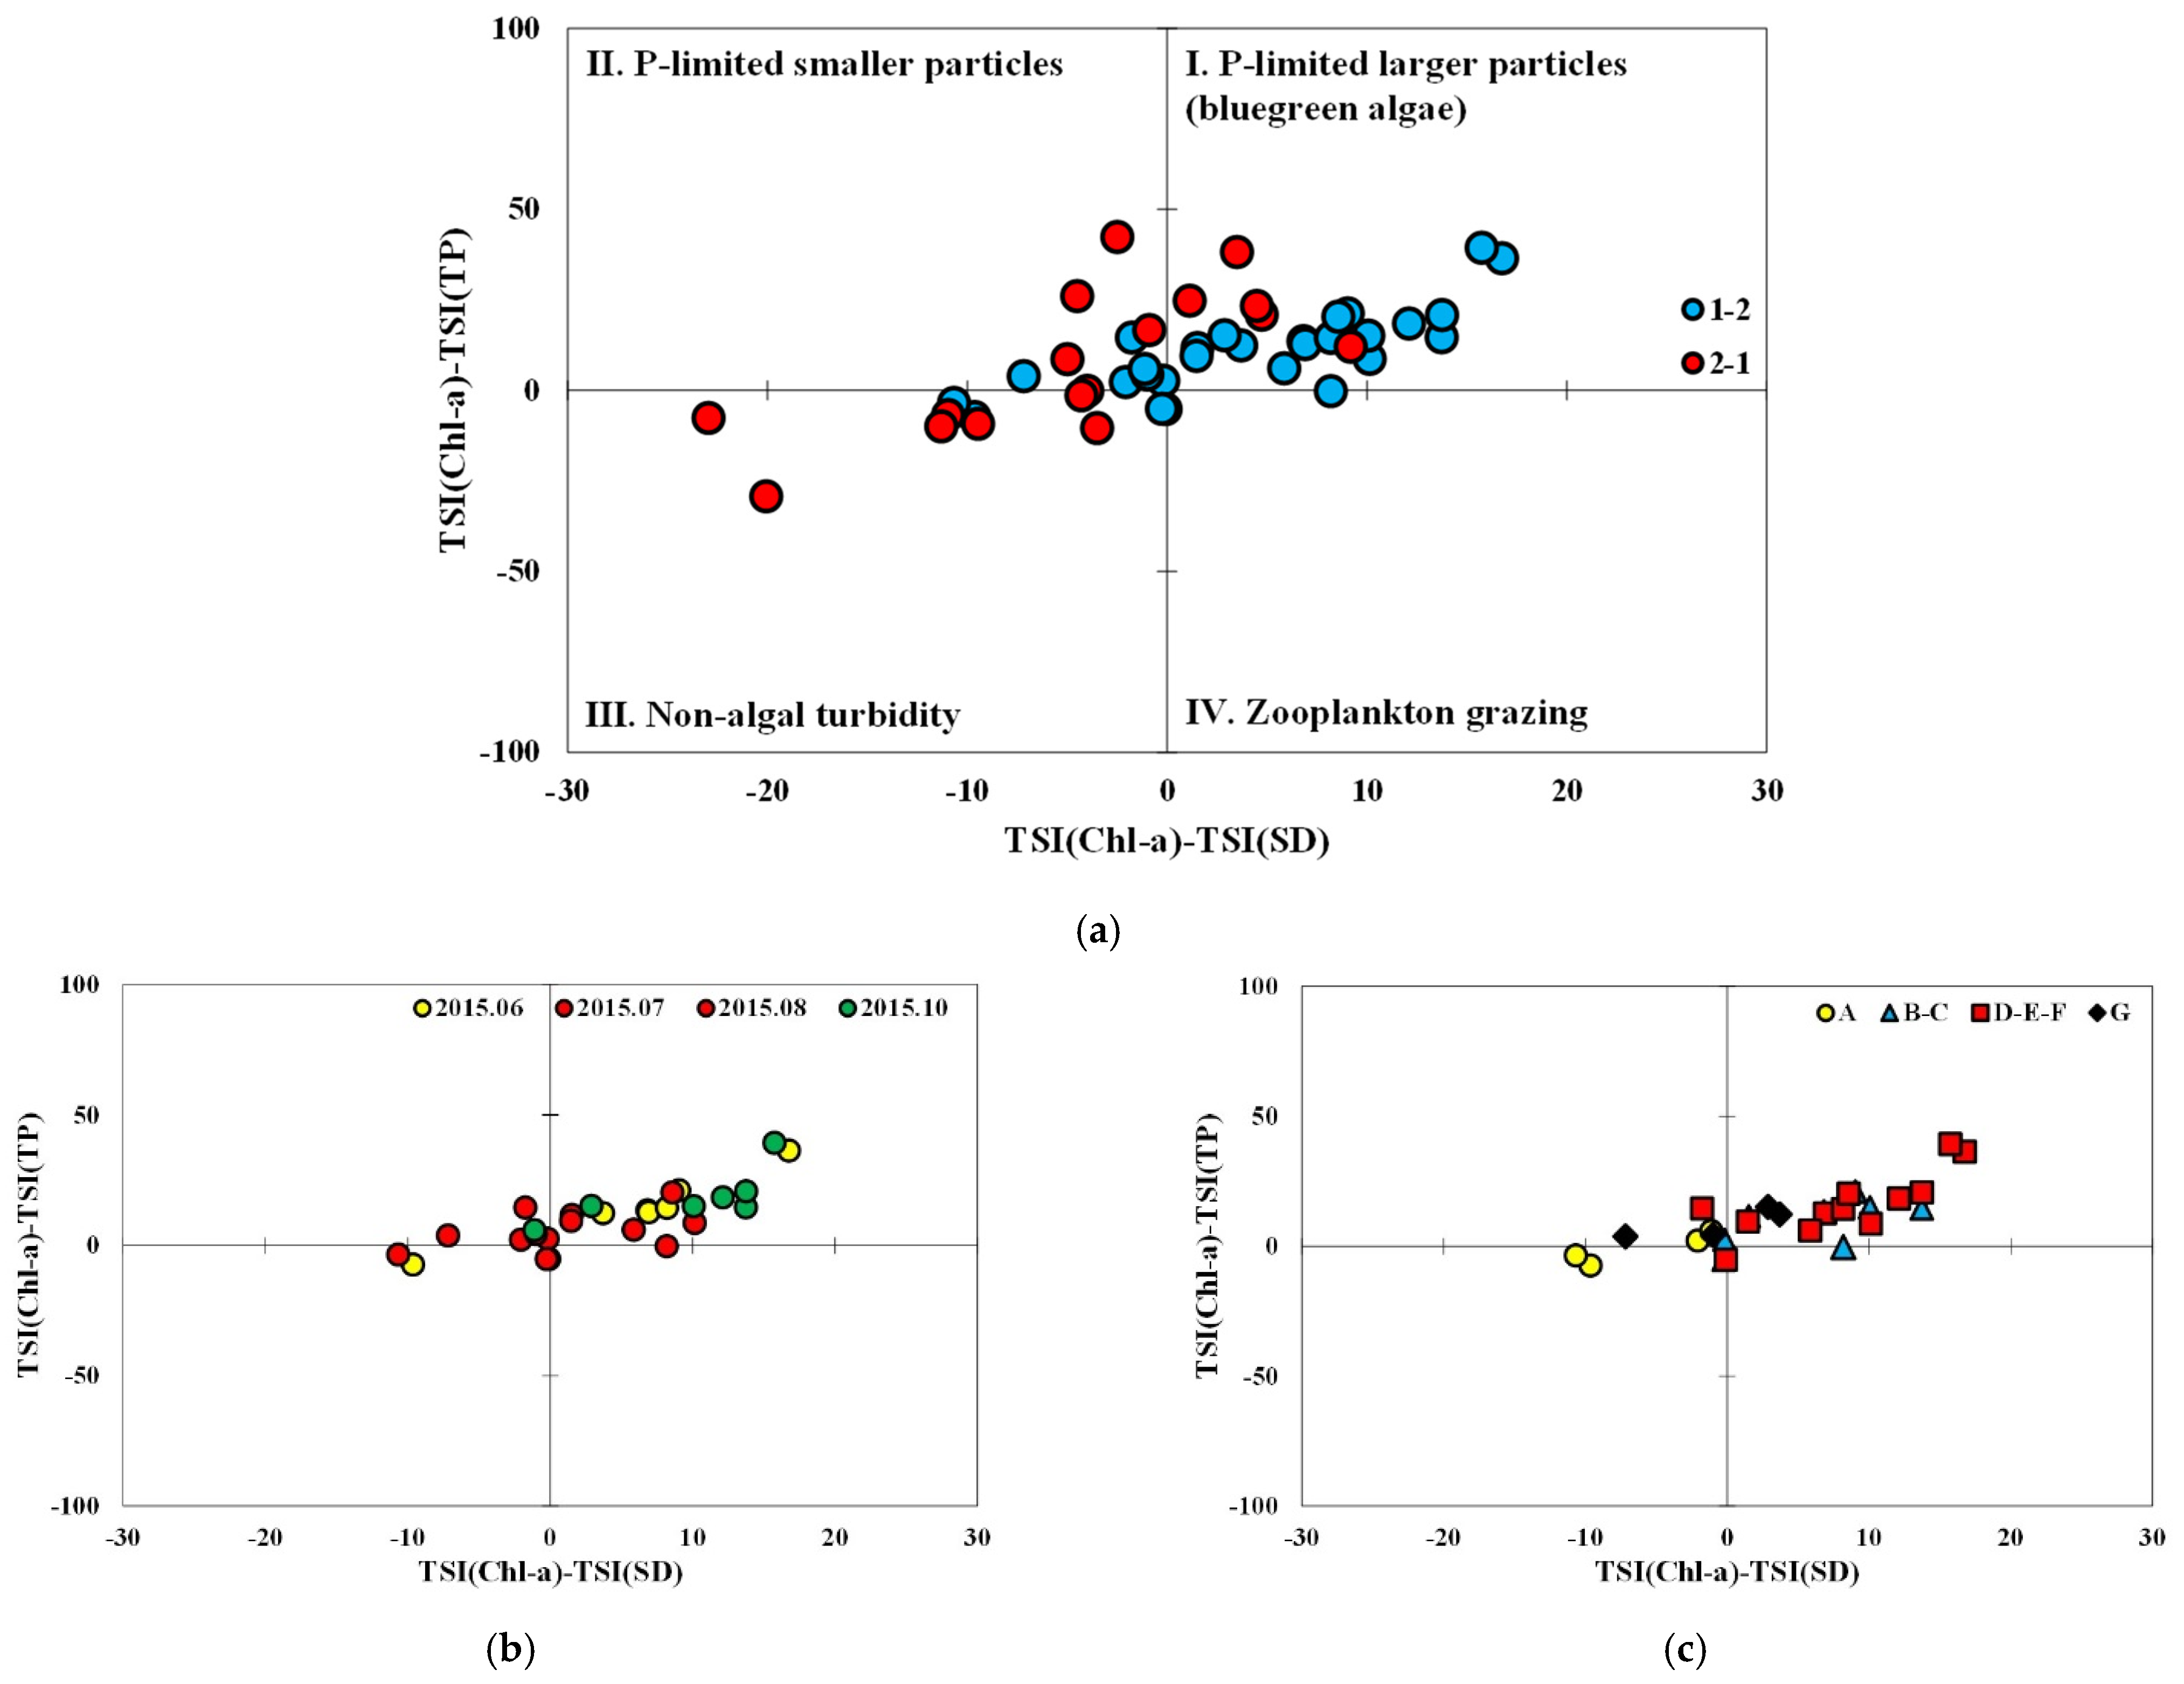
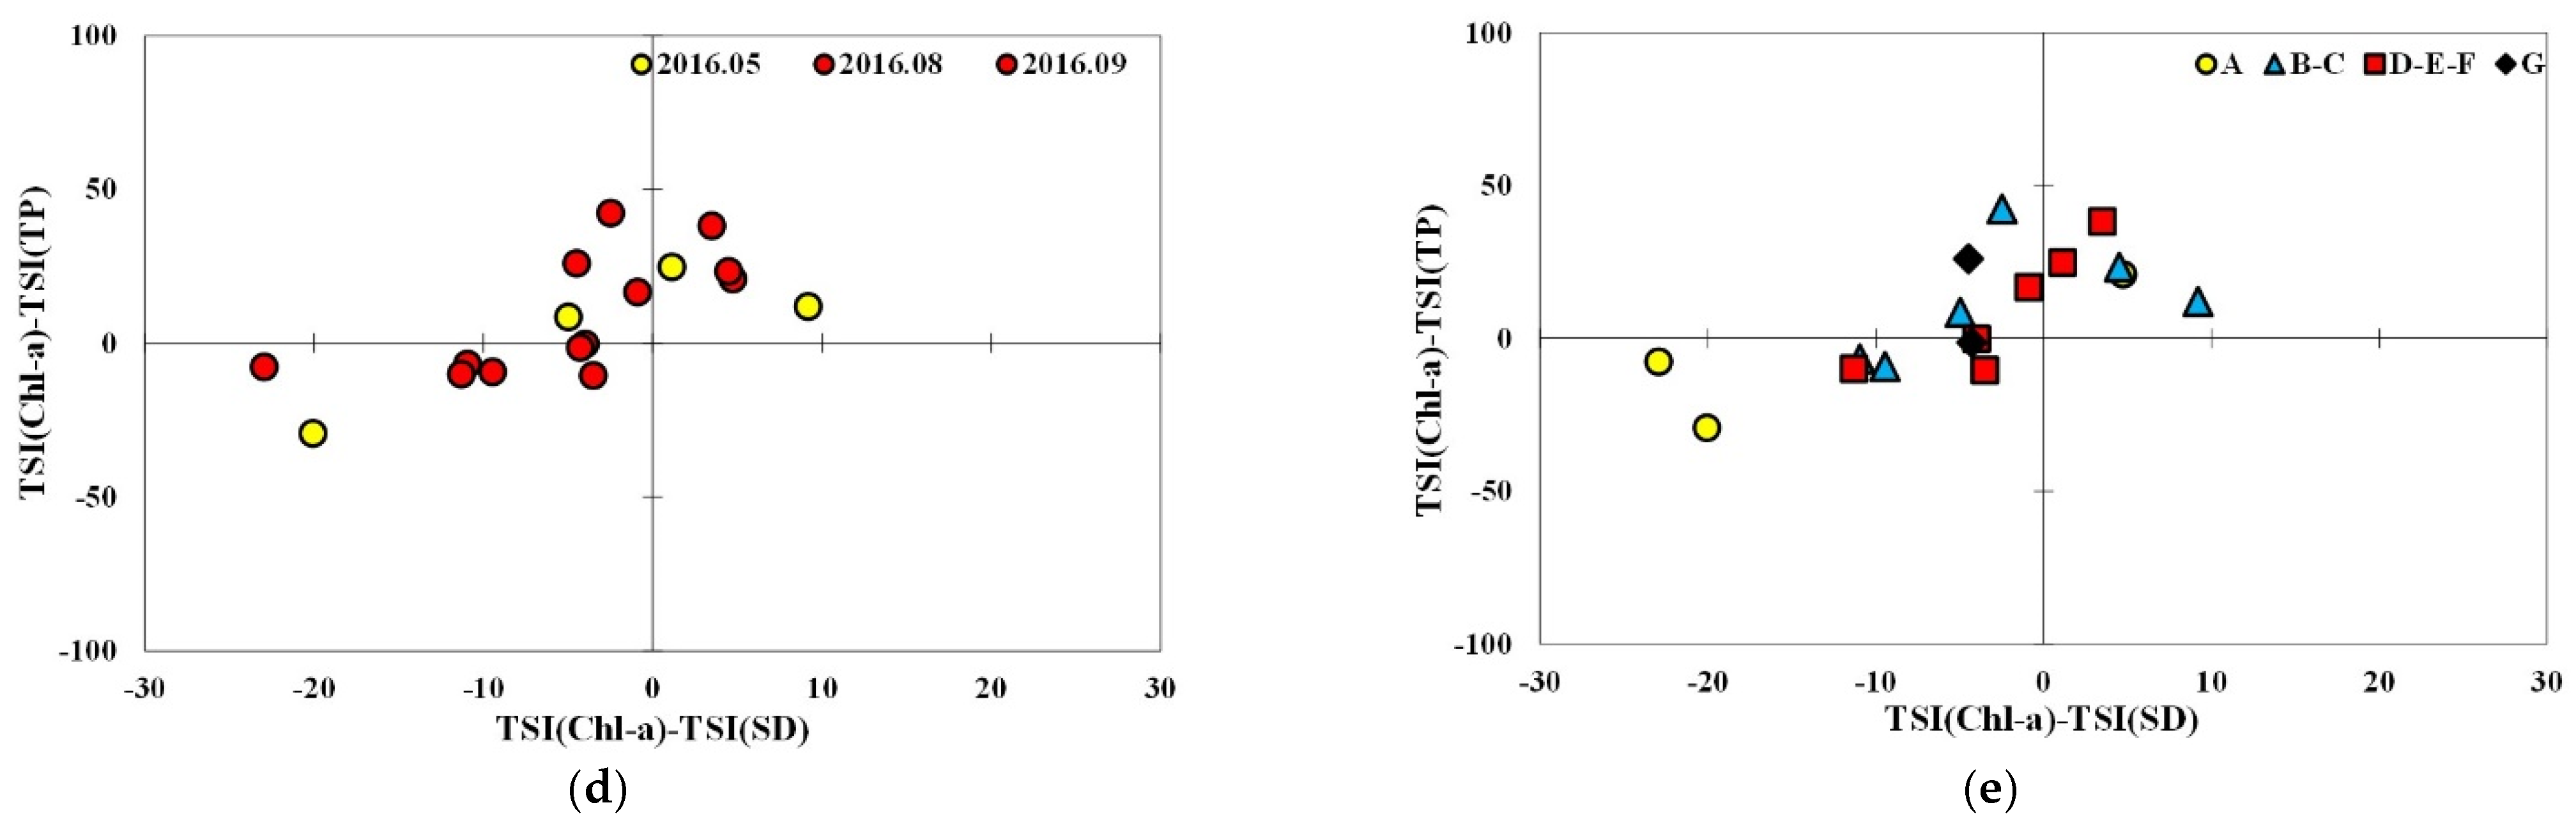
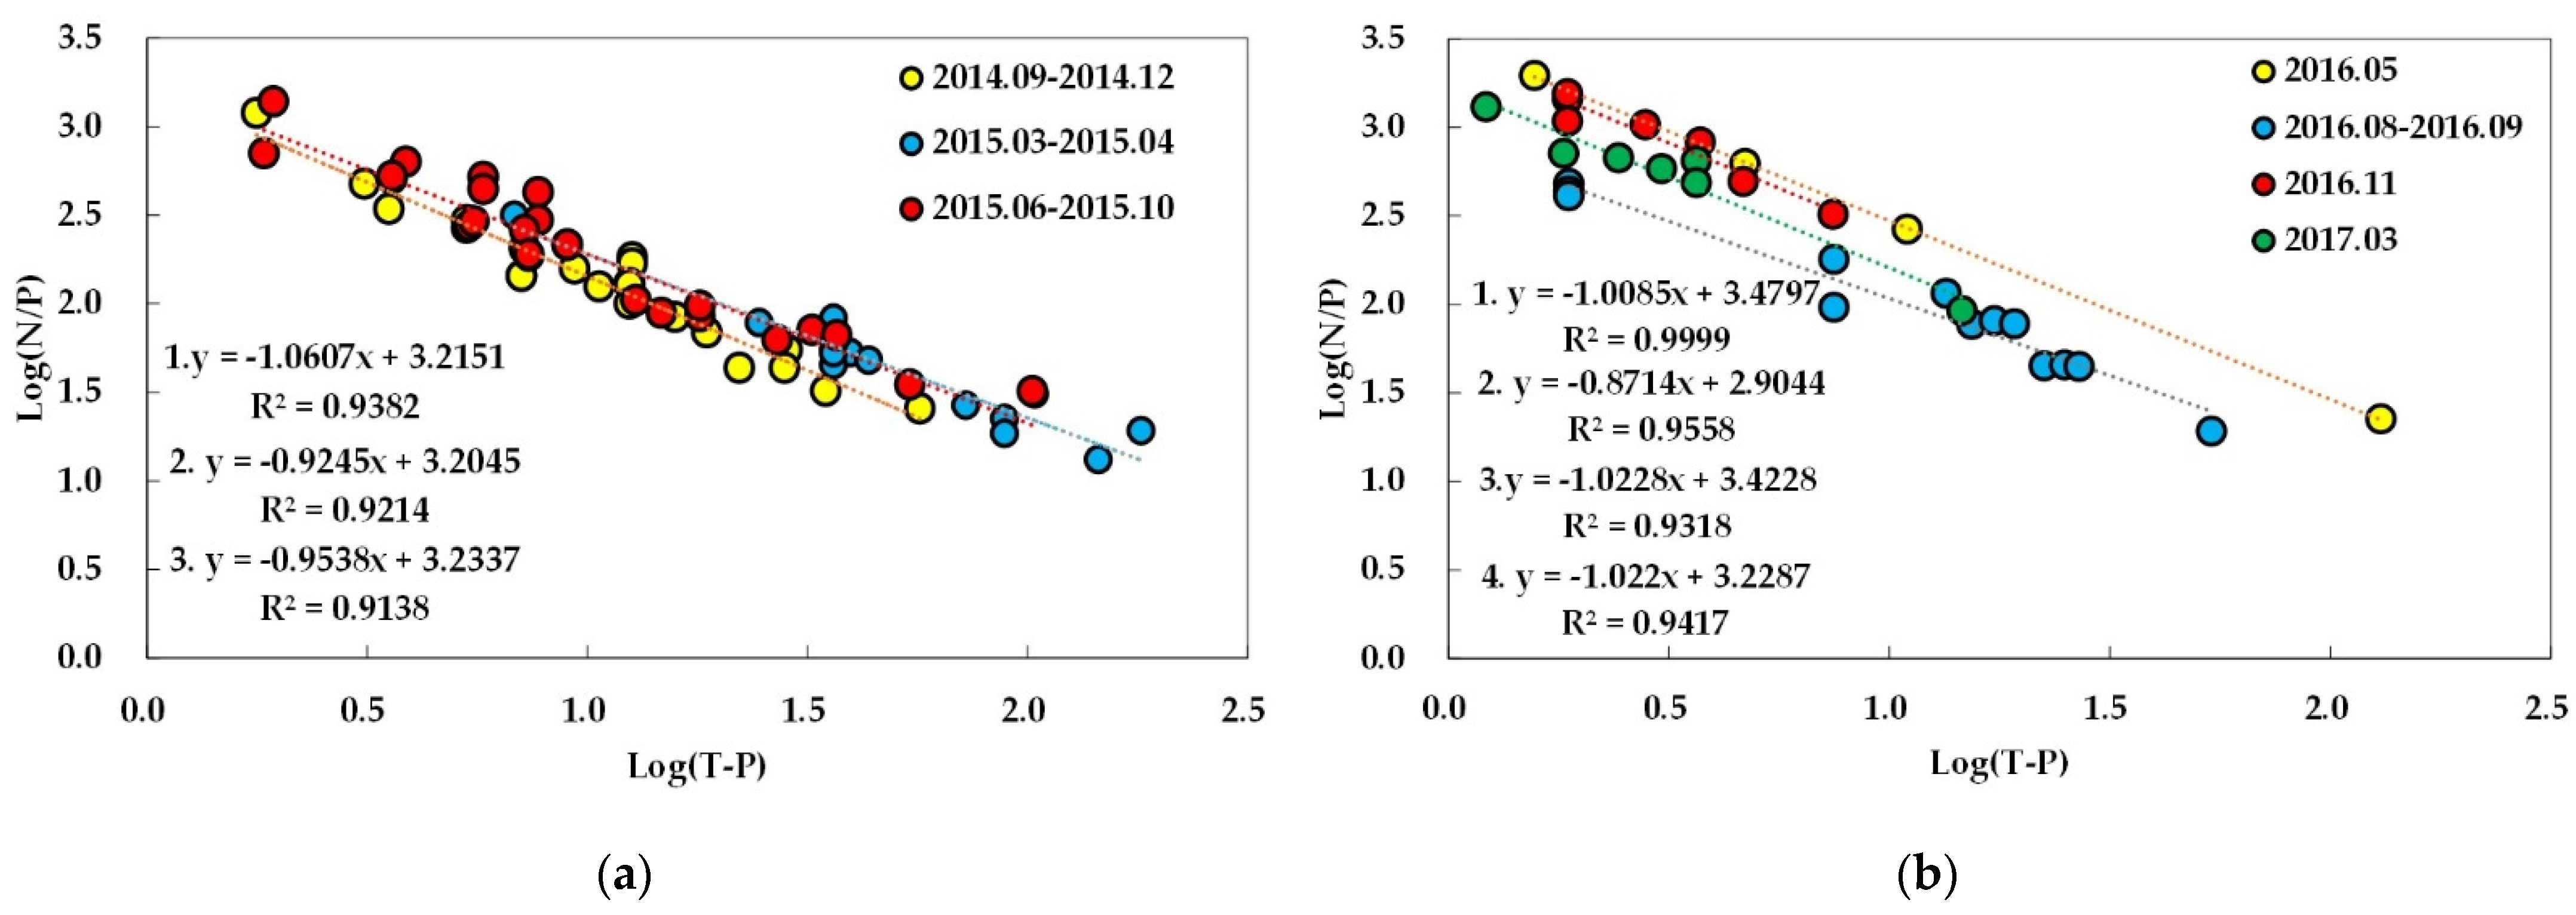
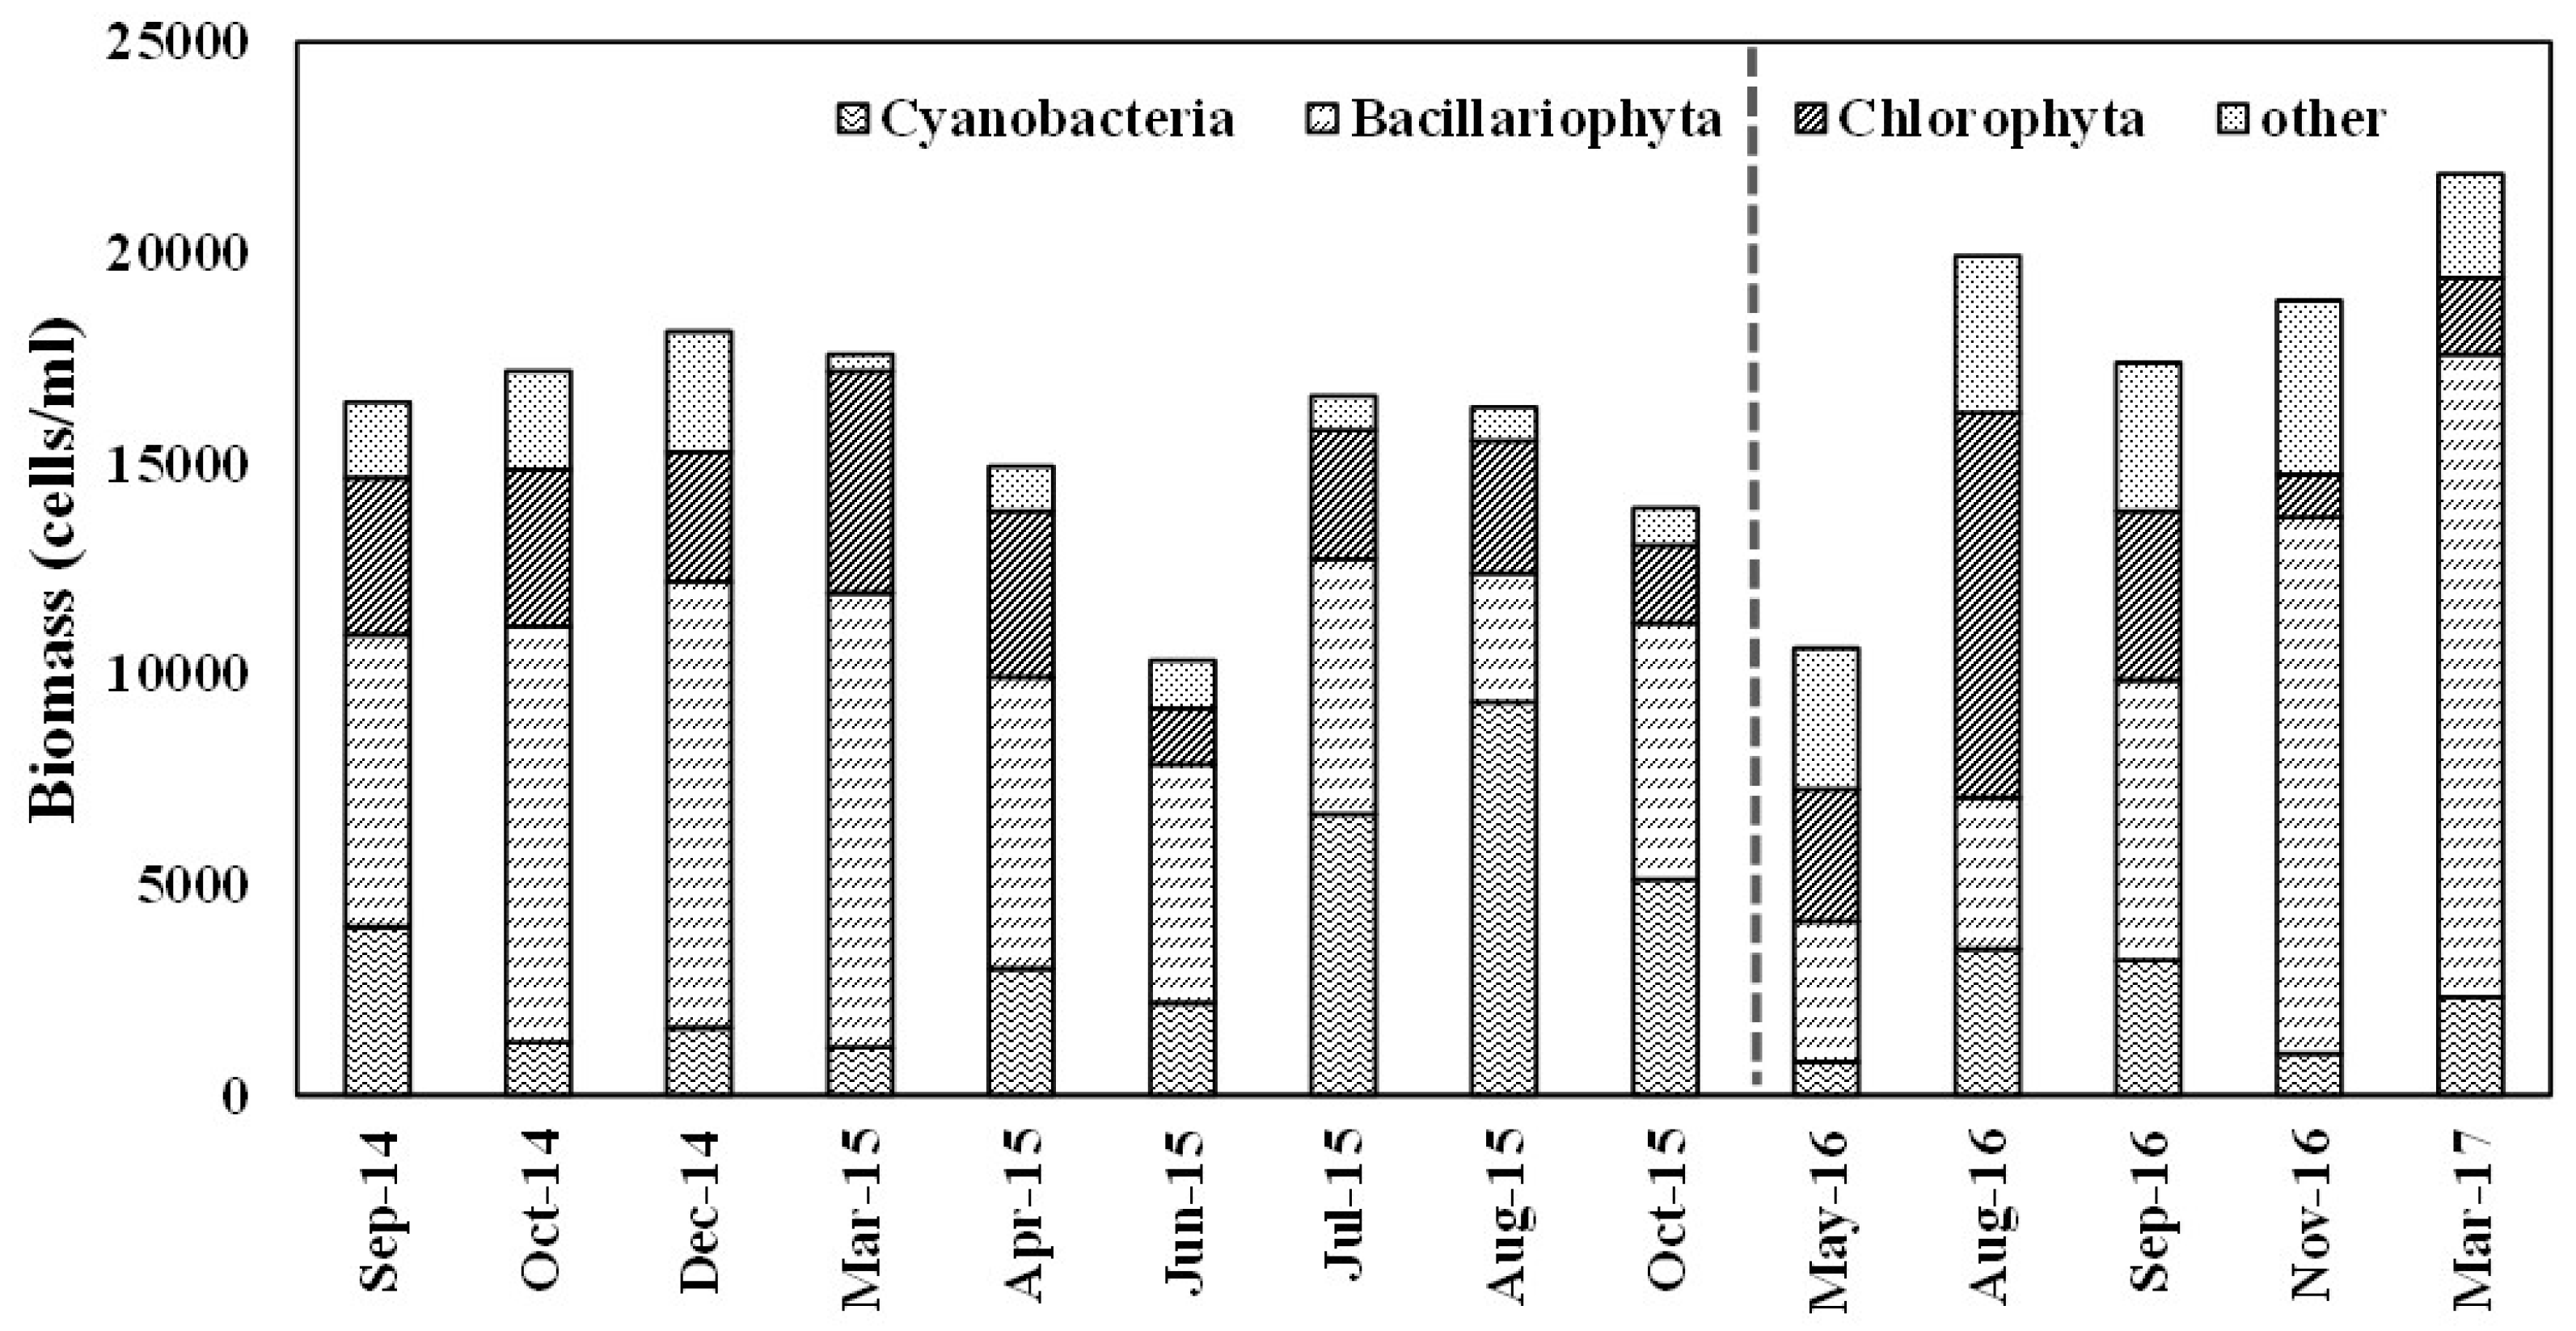
Table 1.
Summary of statistics of measured water quality parameters and calculated trophic state indices.
Table 1.
Summary of statistics of measured water quality parameters and calculated trophic state indices.
| Period | Statistic | Chl-a (mg/L) | TP (mg/L) | TN (mg/L) | SD (m) | TSIChl | TSITP | TSITN | TSISD | Kna | Phytoplankton Concentration (cells/mL) |
|---|---|---|---|---|---|---|---|---|---|---|---|
| 1-1 | Max | 28.3 | 0.181 | 3.5 | 7.7 | 63.3 | 79.2 | 72.5 | 56.2 | 0.32 | 3933 |
| Min | 2.1 | 0.002 | 1.0 | 1.3 | 37.9 | 12.4 | 53.9 | 30.6 | −0.10 | 1333 | |
| Avg | 9.0 | 0.036 | 1.8 | 4.1 | 50.6 | 47.7 | 61.9 | 40.6 | 0.06 | 2410 | |
| Stdev | 5.3 | 0.041 | 0.6 | 1.5 | 5.8 | 16.2 | 4.5 | 5.8 | 0.09 | 667 | |
| 1-2 | Max | 28.9 | 0.103 | 3.3 | 6.3 | 63.6 | 71.0 | 71.7 | 73.2 | 1.78 | 5933 |
| Min | 1.8 | 0.002 | 1.3 | 0.4 | 36.5 | 13.0 | 58.3 | 33.4 | −0.04 | 933 | |
| Avg | 7.7 | 0.016 | 2.0 | 3.8 | 47.6 | 36.8 | 63.7 | 43.3 | 0.26 | 2043 | |
| Stdev | 6.9 | 0.021 | 0.6 | 1.7 | 7.6 | 13.6 | 4.0 | 10.5 | 0.41 | 987 | |
| 2-1 | Max | 55.0 | 0.130 | 3.1 | 6.2 | 69.9 | 74.4 | 70.6 | 76.9 | 2.95 | 3667 |
| Min | 1.1 | 0.002 | 0.7 | 0.3 | 31.6 | 10.6 | 49.7 | 33.7 | 0.05 | 1000 | |
| Avg | 7.2 | 0.021 | 1.7 | 2.8 | 44.3 | 38.0 | 60.2 | 48.4 | 0.44 | 2283 | |
| Stdev | 11.6 | 0.031 | 0.9 | 1.7 | 9.6 | 18.2 | 7.8 | 10.9 | 0.63 | 717 | |
| 2-2 | Max | 10.8 | 0.054 | 3.1 | 4.6 | 54.0 | 61.6 | 70.6 | 76.9 | 2.95 | 3600 |
| Min | 1.6 | 0.001 | 1.0 | 0.3 | 35.3 | 7.0 | 54.9 | 38.0 | 0.04 | 2000 | |
| Avg | 4.7 | 0.011 | 1.9 | 2.5 | 44.9 | 29.9 | 62.6 | 48.1 | 0.43 | 2768 | |
| Stdev | 2.2 | 0.013 | 0.6 | 1.0 | 4.5 | 16.0 | 4.9 | 8.0 | 0.60 | 469 |
Table 2.
Pearson correlation analysis of water quality parameters and precipitation in subperiods in period 1 and 2 (Chl-a: chlorophyll-a, TP: total phosphorus, TN: total nitrogen, SD: Secchi depth, COD: chemical oxygen demand).
Table 2.
Pearson correlation analysis of water quality parameters and precipitation in subperiods in period 1 and 2 (Chl-a: chlorophyll-a, TP: total phosphorus, TN: total nitrogen, SD: Secchi depth, COD: chemical oxygen demand).
| Periods | Variables | Chl-a | TP | TN | SD | COD | Precipitation |
|---|---|---|---|---|---|---|---|
| 1-1 | Chl-a | 1 | |||||
| TP | 0.01 | 1 | |||||
| TN | −0.06 | 0.58 ** | 1 | ||||
| SD | −0.66 ** | 0.14 | −0.05 | 1 | |||
| COD | 0.47 ** | −0.35 * | −0.40 * | −0.48 ** | 1 | ||
| Precipitation | 0.24 | −0.07 | −0.05 | −0.11 | 0.16 | 1 | |
| 1-2 | Chl-a | 1 | |||||
| TP | 0.80 ** | 1 | |||||
| TN | 0.25 | 0.36 | 1 | ||||
| SD | −0.73 ** | −0.75 ** | −0.07 | 1 | |||
| COD | 0.36 | 0.40 * | 0.34 | −0.34 | 1 | ||
| Precipitation | −0.10 | −0.12 | −0.49 ** | −0.18 | 0.11 | 1 | |
| 2-1 | Chl-a | 1 | |||||
| TP | 0.00 | 1 | |||||
| TN | −0.28 | 0.29 | 1 | ||||
| SD | −0.46 | −0.50 * | 0.54 * | 1 | |||
| COD | 0.08 | −0.17 | −0.18 | 0.04 | 1 | ||
| Precipitation | −0.22 | 0.01 | −0.46 | −0.24 | 0.64 ** | 1 | |
| 2-2 | Chl-a | 1 | |||||
| TP | 0.18 | 1 | |||||
| TN | 0.33 | −0.61 ** | 1 | ||||
| SD | −0.07 | −0.55 ** | 0.59 ** | 1 | |||
| COD | −0.49 * | 0.52 * | −0.66 ** | −0.32 | 1 | ||
| Precipitation | −0.26 | 0.78 ** | −0.67 ** | −0.34 | 0.83 ** | 1 | |
| * p < 0.05, ** p < 0.01 | |||||||
Publisher’s Note: MDPI stays neutral with regard to jurisdictional claims in published maps and institutional affiliations. |
© 2021 by the authors. Licensee MDPI, Basel, Switzerland. This article is an open access article distributed under the terms and conditions of the Creative Commons Attribution (CC BY) license (https://creativecommons.org/licenses/by/4.0/).
Share and Cite
MDPI and ACS Style
Kim, S.-m.; Kim, H.-s. Assessment of Trophic Responses of a Reservoir to Seasonal and Annual Variations in Monsoon. Water 2021, 13, 2117. https://doi.org/10.3390/w13152117
AMA Style
Kim S-m, Kim H-s. Assessment of Trophic Responses of a Reservoir to Seasonal and Annual Variations in Monsoon. Water. 2021; 13(15):2117. https://doi.org/10.3390/w13152117
Chicago/Turabian StyleKim, Su-mi, and Hyun-su Kim. 2021. "Assessment of Trophic Responses of a Reservoir to Seasonal and Annual Variations in Monsoon" Water 13, no. 15: 2117. https://doi.org/10.3390/w13152117
Note that from the first issue of 2016, this journal uses article numbers instead of page numbers. See further details here.