
Treatment of Effluent of Upflow Anaerobic Sludge Blanket Bioreactor for Water Reuse


1
School of Engineering, University of Guelph, Guelph, ON N1G 2W1, Canada
2
Department of Building, Civil and Environmental Engineering, Concordia University, Montreal, QC H3G 1M8, Canada
3
Department of Civil, Geological and Mining Engineering, Polytechnique Montreal, Montreal, QC H3T 1J4, Canada
*
Author to whom correspondence should be addressed.
Water 2021, 13(15), 2123; https://doi.org/10.3390/w13152123
Submission received: 12 June 2021
/
Revised: 30 July 2021
/
Accepted: 30 July 2021
/
Published: 1 August 2021
(This article belongs to the Special Issue Enhancement of Anaerobic Digestion for Energy and Resource Recovery)
Abstract
:The low-pressure reverse osmosis (LPRO) process is a recent development of reverse osmosis (RO) technology for the reduction in RO energy consumption and operation cost. The goal of this study was to investigate the performance of LPRO processes for the treatment and reuse of effluent discharged from brewery upflow anaerobic sludge blanket bioreactors (UASB). In this study, three different commercially available LPRO membranes were tested to evaluate the water quality that can be achieved under different operational and pretreatment conditions. It was found that the filtration performance and the effluent quality of the LPRO membranes can be considerably affected by the operation conditions and the selection of the pretreatment processes. The ultrafiltration (UF) pretreatment and the control of the operation pressure were found to be essential for mitigating LPRO membrane fouling, which could be caused by Ca2+ associated precipitates and organic gelation, in the treatment of the brewery UASB effluent. Water quality analyses showed that an integrated process of the UASB + UF + LPRO could achieve an effluent quality characterized by concentrations of 10.4–12.5 mg/L of chemical oxygen demand (COD), 1.8–2.1 mg/L of total nitrogen (TN), 1.3–1.8 mg/L of ammonia nitrogen (NH3-N) and 0.8–1.2 mg/L of total phosphorus (TP). The effluent quality and the LPRO performance could be further improved by adding a granular activated carbon (GAC) adsorption process between the UF and LPRO processes, which reduced the concentration of COD to 7–10 mg/L and those of TN, TP, NH3-N to below 1 mg/L. For the treatment of the UASB effluent tested in this study, the UF, UF + GAC (retention time 4 hrs), UF + LPRO, and UF + GAC + LPRO, respectively, achieved overall COD removal efficiencies of 89.6–93.7%, 94.5–96.7%, 99.3–99.1% and 99.3–99.4%; TN removal efficiencies of 73.0–78.2%, 89.2–97.2%, 97.1–98.2% and 94.3–99.7%; and TP removal efficiencies of 29.3–46.2%, 77.0–95.4%, 95.9–97.6z% and 98.0–98.3%. This study showed that both UASB + UF + LPRO and UASB + UF + GAC + LPRO are effective treatment processes for treating brewery wastewater toward reuse water quality standards set by the United States Environmental Protection Agency (US EPA). Therefore, the results of this study would help to answer whether a LPRO can treat the brewery UASB effluent to meet the requirements of wastewater reuse standards.
1. Introduction
The increased demand for clean water has led to industrial wastewater being viewed as more of a resource rather than a burden. The wastewater generated from beer production typically contains chemical oxygen demand (COD) of 1800 to 50,000 mg/L, total suspended solids (TSS) of 550 to 3000 mg/L, total Kjeldahl nitrogen (TKN) of 20–600 mg/L, and total phosphorus (TP) of 4 to 103 mg/L [1]. A common treatment scheme for brewery wastewater involves the use of a Upflow Anaerobic Sludge Blanket (UASB) Reactor. UASB can typically achieve COD removals ranging from 57% to 80% in the treatment of brewery wastewater, implying that a relatively high COD residual exists in the UASB effluent [2]. While the brewery industry is facing increased pressure to reduce water for cost reduction and production expansion, it is important to look into water reuse through tertiary treatment of the UASB effluent.
Werkneh et al. [1], who reviewed some of the recent advances in areas of water reuse and energy recovery, highlighted membrane bioreactors (MBR), nanofiltration (NF) and reverse osmosis (RO), and fluidized bed reactors (FBR) as areas of important developments of brewery wastewater treatment and reuse. Han et al. [3] reported that an anaerobic membrane bioreactor used in the treatment of brewery wastewater achieved a COD removal higher than 98% at an organic loading rate of 5 g/L/d, where the membrane filtration made a substantial improvement in the removal of COD and total suspended solids. Alvarado-Alssman [4] showed that anaerobic inverse fluidized bed reactor (IFBR) achieved around 90% of COD removal in the treatment of brewery wastewater. Asensio et al. [5] assessed a microbial electrochemical FBR (ME-FBR) for the brewery wastewater treatment and reported 80 to 90% of COD removal achieved under conditions of the COD overloading, presence of biocide, long-time starvation, and low temperatures. Braeken et al. [6] evaluated NF for the treatment of biologically treated brewery wastewater and reported that NF could achieve a 100% of COD removal, 55% of sodium removal and 70% of chloride removal. A further improvement in the removal of ionic species to meet the reuse requirement of brewery wastewater can be achieved by the inclusion of reverse osmosis into the treatment chain [7]. Verhuelsdonk et al. [8] completed an economic evaluation of brewery wastewater reuse and reported that UASB wastewater could be treated to drinking water quality with a yield of 63% by using an MBR + UF + RO system.
Although reverse osmosis (RO) is a well-established technology for water reuse and desalination [7,9], its application in brewery wastewater reuse has been limited by its high energy consumption and operating costs. An emerging area in the RO membrane technology is the low-pressure RO (LPRO) membranes which have been developed to reduce the RO operation pressure when maintaining high rejections to small soluble organic molecules and ionic species [10]. Venzke et al. [11] showed that the DOW Filmtec LPRO spiral wound membrane module coupled with sand filtration and activated carbon adsorption achieved over 92% rejections to conductivity, total dissolved solids, total phosphorus, chlorides, and alkalinity in the treatment of petrochemical wastewater. Xu et al. [12] tested two LPRO membranes for the treatment of wastewater produced from the natural gas extraction process in a two-stage lab scale unit and reported that the LPRO membranes had similar rejection of divalent cations and better rejection of TOC compared to a conventional RO membrane process. Although studies have shown that effluents generated by LPRO processes could meet various water reuse standards [11,12], the water qualities obtained from LPRO processes could vary with the wastewater characteristics, water chemistry, membrane properties, pretreatment processes, LPRO operational conditions and the compositions of the pretreatment prior to the LPRO filtration.
Although LPRO is a promising technology for water reuse, to the best of our knowledge, it has not been tested for brewery wastewater reuse. The goal of this study is to investigate the performance of LPRO processes for the treatment and reuse of brewery wastewater UASB effluent using commercially available LPRO membranes. The microfiltration (M F), UF, and GAC adsorption were evaluated as the pretreatment processes in terms of their impacts on the membrane performance and water quality. The qualities of the effluents produced by the UASB + UF, UASB + UF + LPRO, UASB + UF + GAC + LPRO were assessed against the US EPA guidelines as well as requirements taken from industrial case studies. This applied study sheds a light on water qualities that can be achieved by integrating LPRO with different pretreatment processes in the treatment of brewery UASB effluent.
2. Materials and Methods
2.1. Wastewater Sample Collection and Characterization
Samples were taken from a local brewery which used a UASB bioreactor as the biological treatment step in their wastewater treatment regime. These samples were taken from the recycle stream and stored at 4 °C and were characterized within a week of collection apart from the first batch collected. HACH chemical analysis kits and a DR 5000 UV-Vis Spectrophotometer (HACH) were used to measure Chemical Oxygen Demand (COD), Total Phosphorus (TP), Orthophosphate phosphorus (PO43−-P), Total Nitrogen (TN), Kjeldahl Nitrogen (TKN), Nitrate Nitrogen (NO3−-N), Nitrite nitrogen (NO2−-N), and Ammonia Nitrogen (NH3-N). Alkalinity (AlK), conductivity, and pH of wastewater and treated effluent were measured using a TitraLab 854 pH-Stat Titration Workstation (HACH). EPS constituents (Protein and Humic acids) were characterized using the modified lowery method, as detailed by Shen et al. [13]. Total carbohydrates were measured using the Phenol-Sulfuric Acid method [14]. Metal and anion analysis were done at an ALS Global laboratory in Waterloo, Ontario using inductive coupled plasma mass spectrometry (ICP-MS). In this study, four batches of wastewater were used to study various parameters of LPRO filtration. Table 1 summarizes the main parameters of the four batches of wastewater.
2.2. Sample Pretreatment by Microfiltration, Ultrafiltration and GAC Adsorption
As shown in Figure 1, a process stream used for UASB effluent treatment could include gravity settling, low pressure membrane filtration, granular carbon adsorption, and LPRO. Figure 1a shows the treatment scheme involves microfiltration or ultrafiltration, and LPRO processes, while the scheme described in Figure 1b includes a GAC adsorption between the low-pressure membrane filtration and the LPRO processes. Among these processes, the LPRO treatment is the essential step to treat the UASB effluent toward reuse standards, while the low-pressure membrane filtration and GAC adsorption are the pretreatment processes prior to the LPRO treatment. The purpose of the pretreatment is to minimize the particulate and soluble substances in the feed to the LPRO processes to mitigate the LPRO membrane fouling and improve water quality of the final effluent. The selection of the pretreatment processes will depend on how they affect the performance and water quality of the LPRO treatment.
To evaluate the effect of different pretreatment process on the LPRO filtration and water quality, the UASB effluent samples were pre-treated by settling and the 1.5 µm filter paper (Whatman Glass Microfiber Filter, Sigma Aldrich, St. Louis, MO, USA) vacuum filtration prior to the microfiltration, ultrafiltration and RO treatment. Microfiltration was done using an Amicon Stirred Cell Model 8400 (Sterlitech Corporation, Auburn, WA, USA) with a PVDF membrane developed by Tongji University in China. A Bronkhorst EL-PRESS Digital Electronic Pressure Controller was used to control the filtration pressure at between 5 to 20 kPa. Ultrafiltration was performed using Sepro PS-20 polysulfone, or with Microdyne Nadir PM UP150 polyethersulfone membranes with a nominal pore size of 0.04 microns and a molecular weight cut off (MWCO) of 150 kD, respectively. The filtrations were done in the Amicon dead end filter with the pressure controlled at between 5 and 50 kPa. The accumulated weight of collected during the filtration was monitored using a balance that was connected to a computer equipped with a LabView program. The UF and MF filtration tests were conducted in batch mode with 180 mL of the UASB effluent filtered in each batch of the filtration test at a stirring speed of 200 rpm.
Granular activated carbon (GAC) used in the activated carbon adsorption pretreatment was purchased from Sigma Aldrich, which has nominal sizes between 2.4–4.6 mm and active surface areas ranged from 600–800 m2/g based on the information provided by the supplier. The GAC material was washed using DI water and then dried at 105 °C prior to the adsorption tests [15]. The GAC column used in this study was 24 cm tall with an ID of 2.54 cm giving it a total working volume of 121.6 cm3. The column was packed with 27 grams of washed GAC. The pretreatment with GAC was carried out after the UASB effluent was treated by ultrafiltration. The retention time of the feed water within the adsorption column was controlled by a peristaltic pump to achieve the desired GAC adsorption retention times. In each GAC column adsorption test, 250 mL of effluent was collected for the further LPRO filtration experiments.
2.3. Reverse Osmosis Stirred Cell Operation
Reverse osmosis experiments were done as a batch process using a Sterlitech HP4750 stirred cell connected to a nitrogen pressure vessel. The RO filtration was conducted at constant pressure with the pressure controlled by a pressure regulator. Effluent of the LPRO filtration was collected in a beaker placed on an analytical balance with the accumulated weight data collected every second using a LabView (National Instruments) program to determine the instant filtration flux at different filtration times. The batch LPRO filtration experiments were started with an initial effluent volume of 250 mL and run until a filtrate volume of 180 mL was collected.
In this study three different commercial membranes (DOW XLE, Toray 73HA and GE AK) were tested. These membranes were all purchased from Sterlitech Corporation and identified by the supplier as the LPRO membranes. The clean water permeabilities (Liter/m2/h/bar) measured using the Sterlitech HP4750 stirred cell at 10 bar and 200 rpm were 6.32 for the DOW XLE membrane, 2.77 for the Toray 73HA membrane, and 4.32 for the GE AK membrane. The membrane performance was studied based on the flux profiles at constant RO operation pressures and the changes in membrane resistance after the filtration. The change in the membrane resistance during each LPRO filtration run was determined using clear water filtration conducted before and after the filtration. The membrane filtration resistance is calculated by using the Darcy Law [16]:
where J is the flux (in m/s), is the applied pressure (in pascal), is the osmotic pressure of the influent (in pascal), is the dynamic viscosity (in Pa × s), and is the total resistance (in 1/m). When filtering clean water, the total resistance is equal to the membrane resistance () and the osmotic pressure is zero, allowing the following equation for the calculation of membrane resistance:
The resistance caused by the fouling layer and osmosis pressure (cake resistance, , units 1/m) was calculated by subtracting the pristine membrane resistance from the total resistance as shown below:
Removal efficiency was calculated with the following equations:
2.4. Fouling Characterization by SEM/EDS and CLSM
The membrane foulant deposited on the membrane surface during the LPRO filtration was characterized using Scanning Electron Microscope (SEM)-Energy Dispersive X-ray Spectroscopy (EDS). SEM-EDS samples were prepared by air drying for a minimum of 24 h before being placed on a microscope slide using double sided tape. The samples were then fixed to an EDS stud with carbon tape which also acted as the required electrical connection. Samples were coated in gold using sputter deposition. SEM imaging was done using a FEI Inspect S50 equipped with an Oxford X-Max 20 Silicon Drift Detector (SSD). The EDS analysis was performed using Oxford Aztec Software. On each sample, images were taken of the tip, middle and outer edge of the membranes, after which EDS spectra were done for a minimum of four sites on each SEM image of the membrane samples.
3. Results
3.1. Pretreatment of the UASB Effluent
Table 2 shows the removal efficiency of COD, TP, TN, and TKN by 1.5 µm glass filter paper, 0.45 µm microfiltration, and 0.04 µm ultrafiltration membrane based on the characteristics of the UASB effluents of the four batch samples taken from the local brewery over an one-year period. As seen in Table 2, there was significant variation in water quality of the samples in terms of COD, phosphorus, and nitrogen contents, which could be caused by the types of beer brewed and the daily productivities over different seasons, as the UASB operator noted that the higher production rates in the summer months affected the effluent quality negatively.
For the UASB effluent tested in this study, the COD concentrations of the filtrates obtained from the 1.5 µm filter, 0.45 µm membrane filtration, and 0.04 µm membrane filtration were in the ranges of 271.3 mg/L to 436 mg/L, 206.7 mg/L to 300 mg/L, and 92.2 mg/L to 190 mg/L, respectively. The TP in the effluents varied from 43 mg/L to 84.2 mg/L for 1.5 µm filtration, 40.7 mg/L to 80.3 mg/L for 0.45 µm filtration, and 35.1 mg/L to 75.5 mg/L for the 0.04 µm ultrafiltration. The TN concentrations in the effluents varied from 21.3 mg/ L to 33.7 mg/L for 1.5 µm filtration, 16.7 mg/L to 24.2 mg/L for 0.45 µm filtration, and 12.9 mg/L to 20.3 mg/L for the 0.04 µm ultrafiltration. These results indicated the water quality obtained from the filtration of 1.5 µm filter paper, 0.45 µm membrane, and 0.04 µm membrane varied significantly with the UASB effluent characteristics.
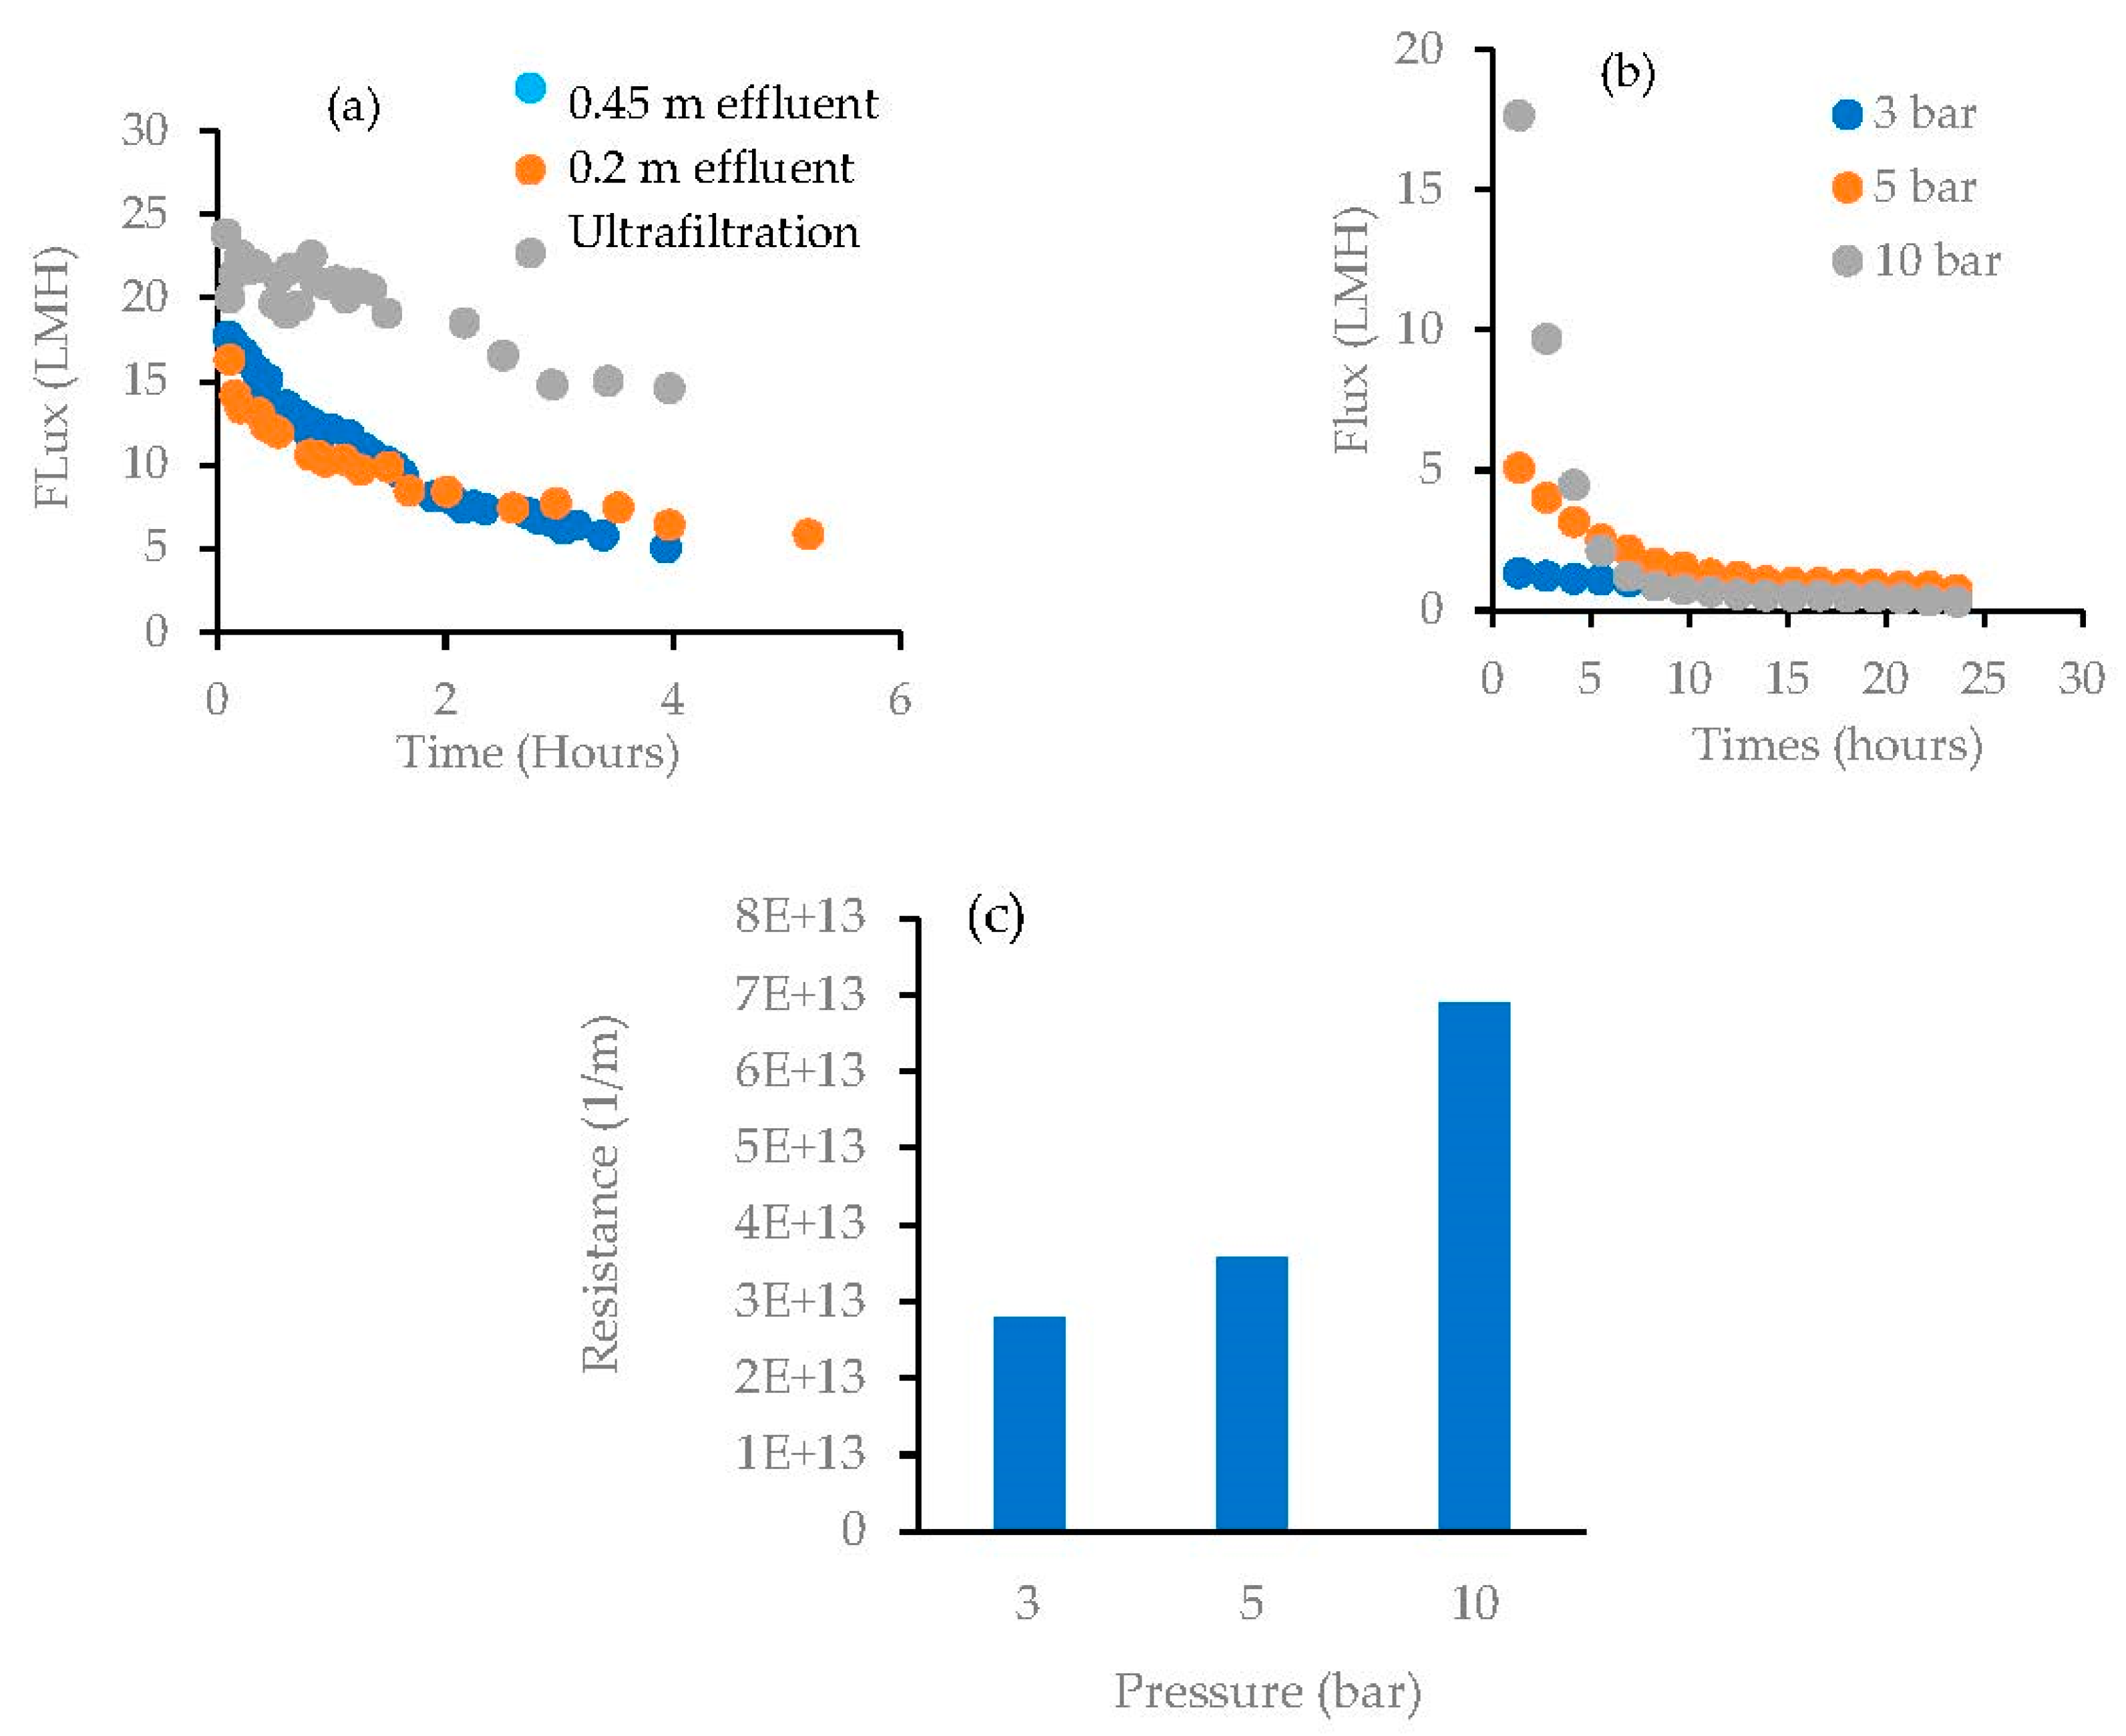
The concentrations of the COD, TP and TN in the filtrate were reduced by 31.1%, 56.4% and 4.6%, respectively, when the pore size of the filter was reduced from 1.5 µm to 0.45 µm, resulted from the complete rejection of particulate species by the 0.45 µm microfiltration membrane. When the pore size of the filter was further reduced from 0.45 µm to 0.04 µm, the removal of the COD, TP, and TN was increased by 10.3%, 28.2% and 39.8%, respectively. Compared to 0.45 µm microfiltration, 0.04 µm ultrafiltration could achieve significantly higher TN removal, which could be attributed to the improvement in the rejection of soluble proteinaceous substances by the UF membrane. The improvement in the removal of soluble organic species in the UASB effluent by UF showed significant impact on the filtration behavior of LPRO membranes. The LPRO treatment of the UF effluent showed both a higher initial and overall flux and a much smaller drop in flux over the 4 h of the filtration than those with the MF effluent (Figure 2a). This result confirmed that ultrafiltration is a necessary pretreatment method for the RO treatment of the UASB effluent of brewery wastewater.
3.2. Effect of RO Operation Pressure
The operation pressure is an important operation parameter of LPRO, which affects the filtration productivity (flux), membrane fouling, and energy consumption. Figure 2b shows the change in flux over time in the filtration at 3, 5 and 10 bars with GE membrane. A clear difference in the flux drops with the different operation pressures was noted in the LPRO filtration of the UF treated UASB effluent. The filtration at 10 bars showed a fast decline in flux. An initial flux drops was also observed with filtration at 5 bars but at a slightly lower rate than the filtration at 10 bars. For the filtration at 3 bars the flux decline was significantly lower than that with the filtration at 10 and 5 bars. The changes in the membrane resistance after the filtration are shown in Figure 2c which emphasizes the increase in the membrane resistance with filtration at higher pressures. These preliminary results indicate that the filtration fluxes of the LPRO membranes are sensitive to the operational pressures in the pressure range from 3 bars 10 bars, implying that the operation pressure is a deterministic factor of membrane fouling in the LPRO filtration of the UF treated UASB effluent. In addition, the sensitivity of the flux to the filtration pressure suggests that the pressure distribution along a membrane module will exert a significant impact on the filtration performance of the commercial LPRO module and thus, a special attention should be paid to the pressure drops along the membrane module in the design of LPRO processes.
The observed flux decline in the LPRO filtration can be mainly caused by the retention of small inorganic and organic species or the formation of inorganic salt precipitation, given the UF pretreatment can remove suspended particles, bacterial cells and a large fraction of polysaccharides [17]. The insignificant flux drop in the filtration at 3 bars might suggest that for the stirred cell constant pressure filtration there is a pressure below which a stable flux can be established. As analogous to the definition of the critical flux for the constant flux filtration, the critical pressure for the constant pressure filtration can be regarded as the maximum pressure at which the initial flux obtained is lower than the critical flux [18,19,20]. Since operating the LPRO above the critical pressure yields little improvement in the long-term flux (Figure 2b), identifying the critical pressure is important for the optimization of the operation pressure to minimize membrane fouling and energy consumption in the LPRO treatment of UASB effluent.
3.3. Filtration Behavior of Different Low-Pressure RO Membranes
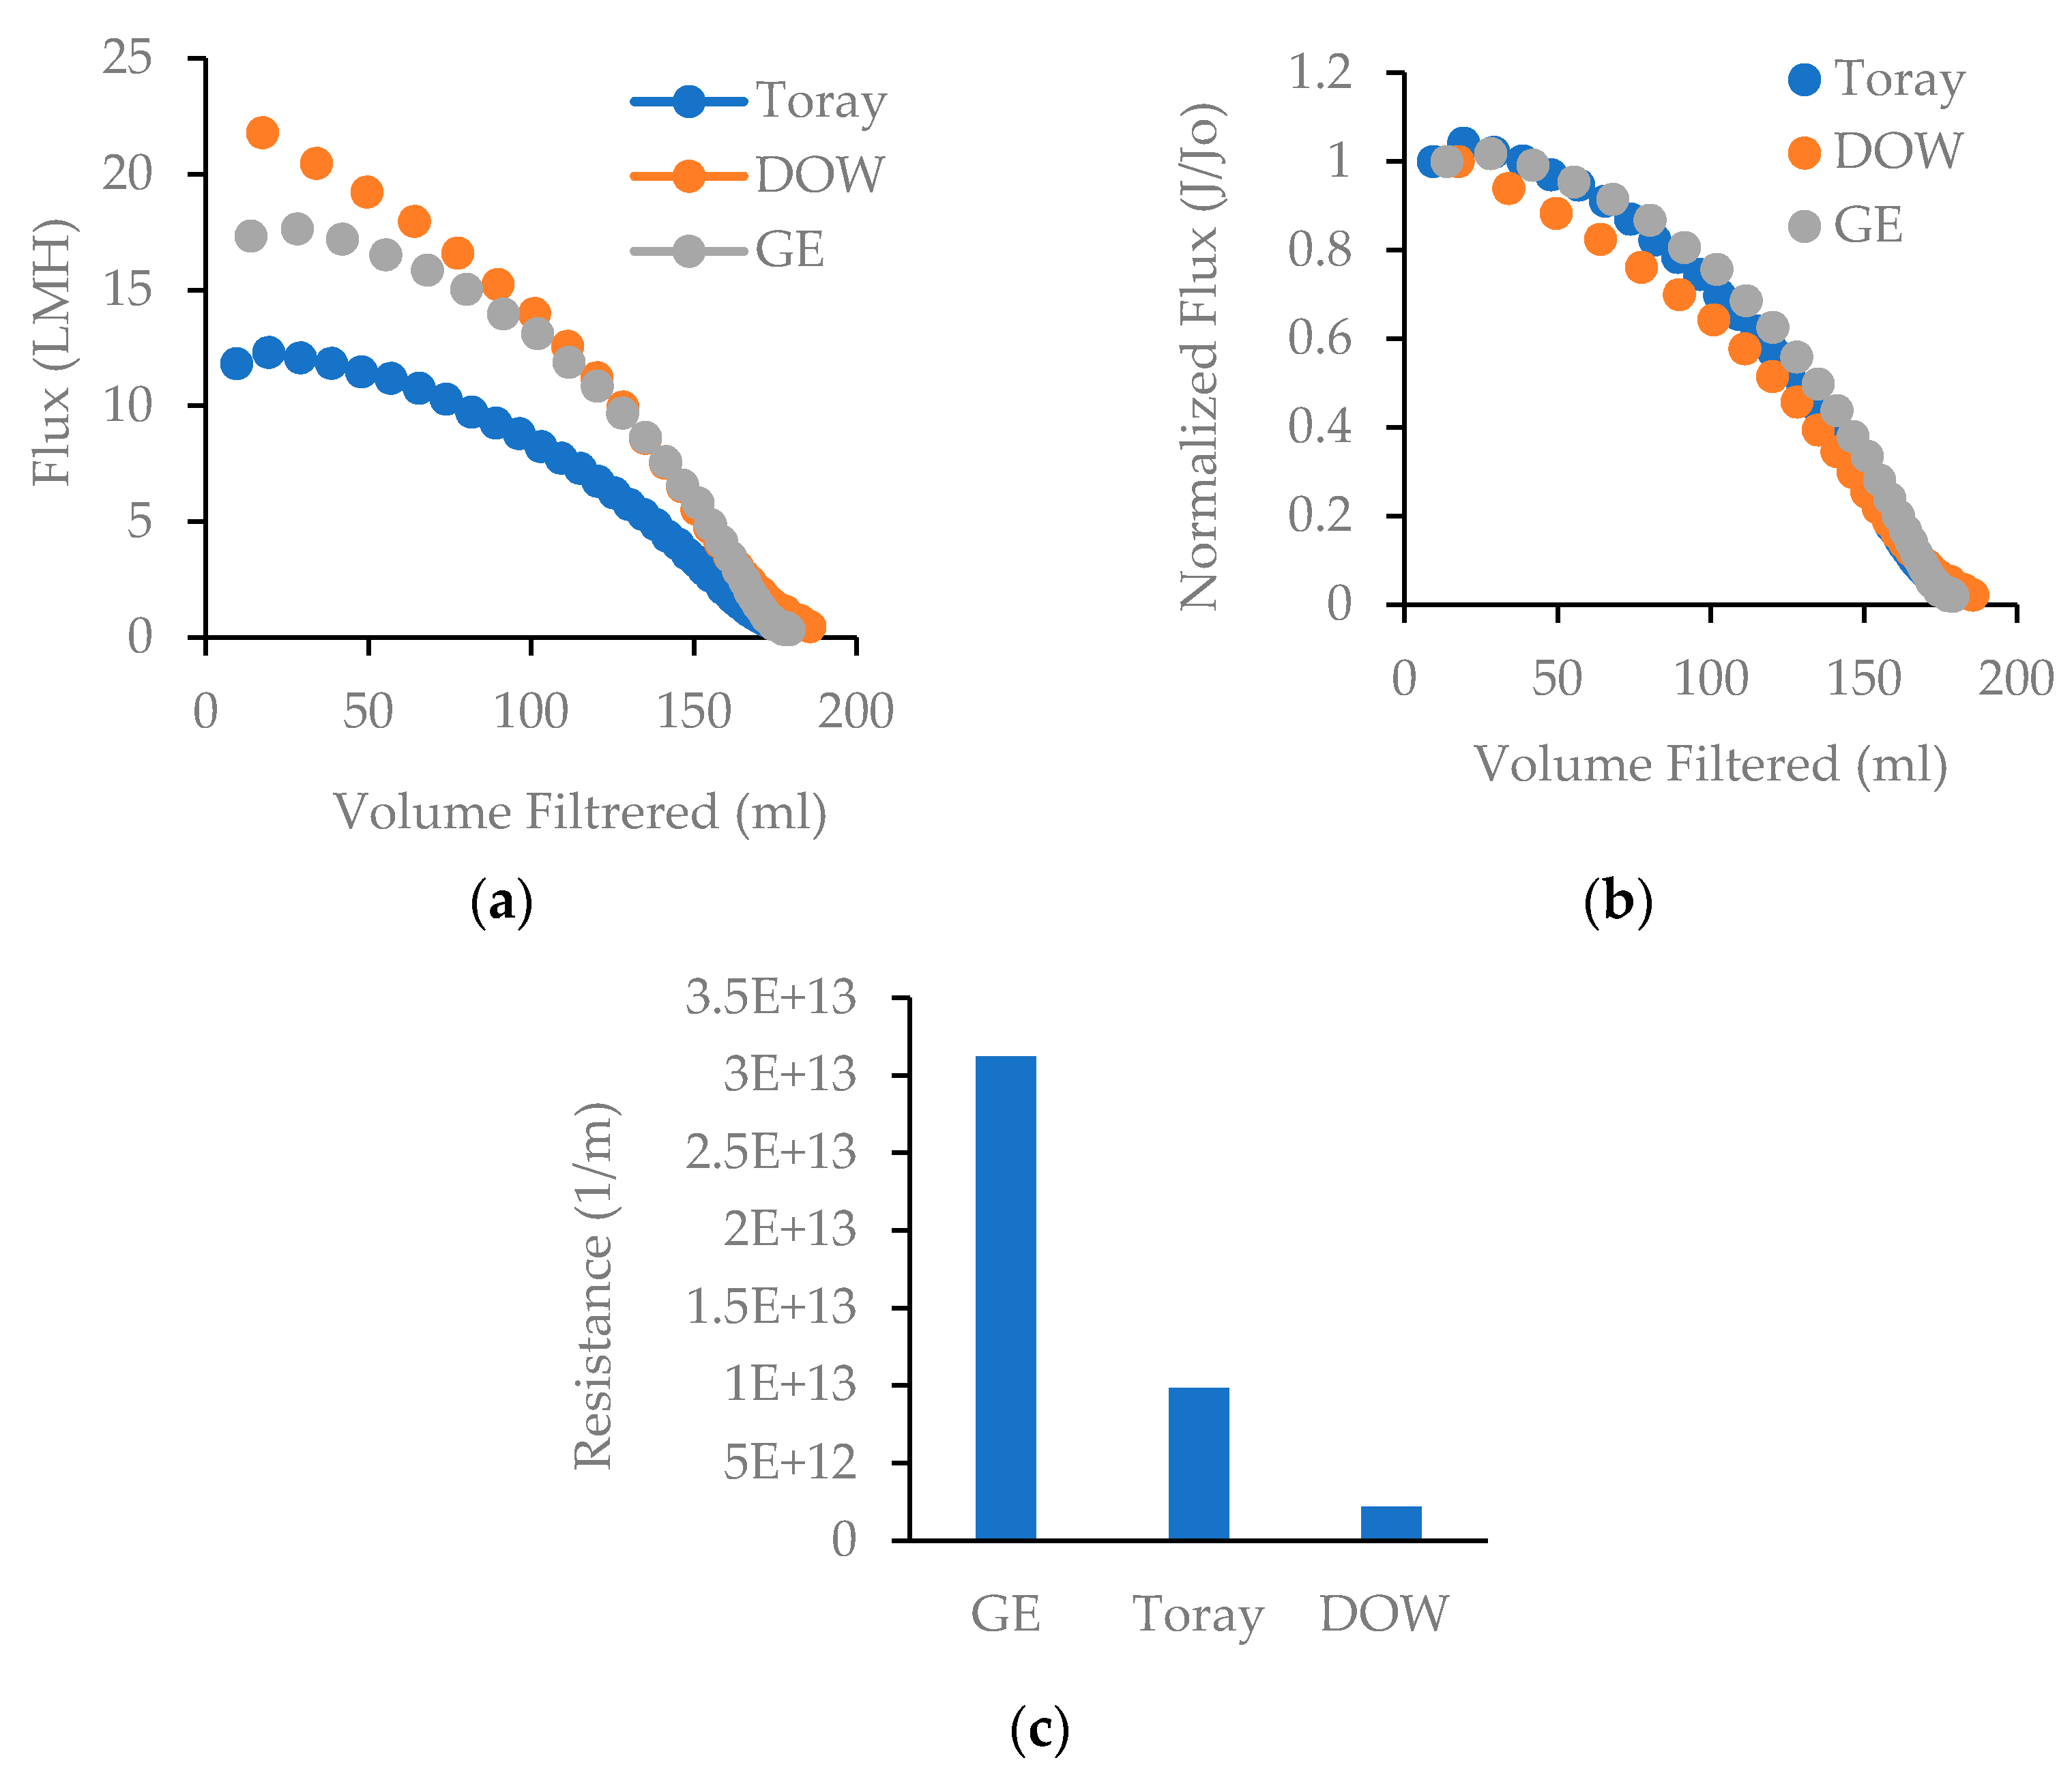
In this study, stirred cell constant pressure filtration tests were conducted to assess the filtration behaviors of different commercial LPRO membranes for the treatment of the UF pre-treated UASB effluent. Figure 3a shows the flux-volume profiles of the Toray, DOW, and GE membranes obtained in the filtrations at 10 bars. The Toray membrane showed the lowest flux, while the DOW membrane outperformed the GE membrane during the first 100 mL of filtration but later showed similar flux as the GE membrane. Overall, the Dow membrane had the highest production rate, followed by the GE and Toray membranes, respectively. For the constant pressure filtration, the flux drop reflects the increase in the filtration resistance caused by the organic and inorganic solutes retained by membranes. Although the three commercial membranes had different instant flux-time profiles, they exhibited similar normalized flux drops (J/Jo) with respect to the filtrate volume, which suggests that the flux drops during the filtration were directly related to the filtrate volume and the increases in the filtration resistance were dominated by the amount of solutes retained by the membranes. The LPRO membrane can retain monovalent and divalent inorganic ionic species and soluble organic compounds, such as volatile fatty acids (VFAs), proteins, sugars, nucleic acids, etc. The retained chemical species can form a concentration polarization layer at the membrane surface, which can result in a high osmosis pressure, high filtration resistance, and the formation of irreversible fouling layer through organic gelation or precipitation of inorganic species. The clean water tests conducted before and after filtration revealed an irreversible fouling layer formed at the surfaces of all three membranes tested, but the residual filtration resistance or the irreversible resistance caused by membrane fouling were different with those three commercial membranes (Figure 3c). The permeabilities reduction after the filtration tests were 29.2%, 66.0% and 33.3% for Toray, GE and DOW membranes, respectively. The Toray membrane which had the lowest pristine membrane permeability showed a lowest permeability drop, while GE membrane had the highest drop in permeability of the three. The SEM results revealed more deposit on the GE membrane surface than that on the Dow and Toray membranes.
3.4. Membrane Fouling Characterization
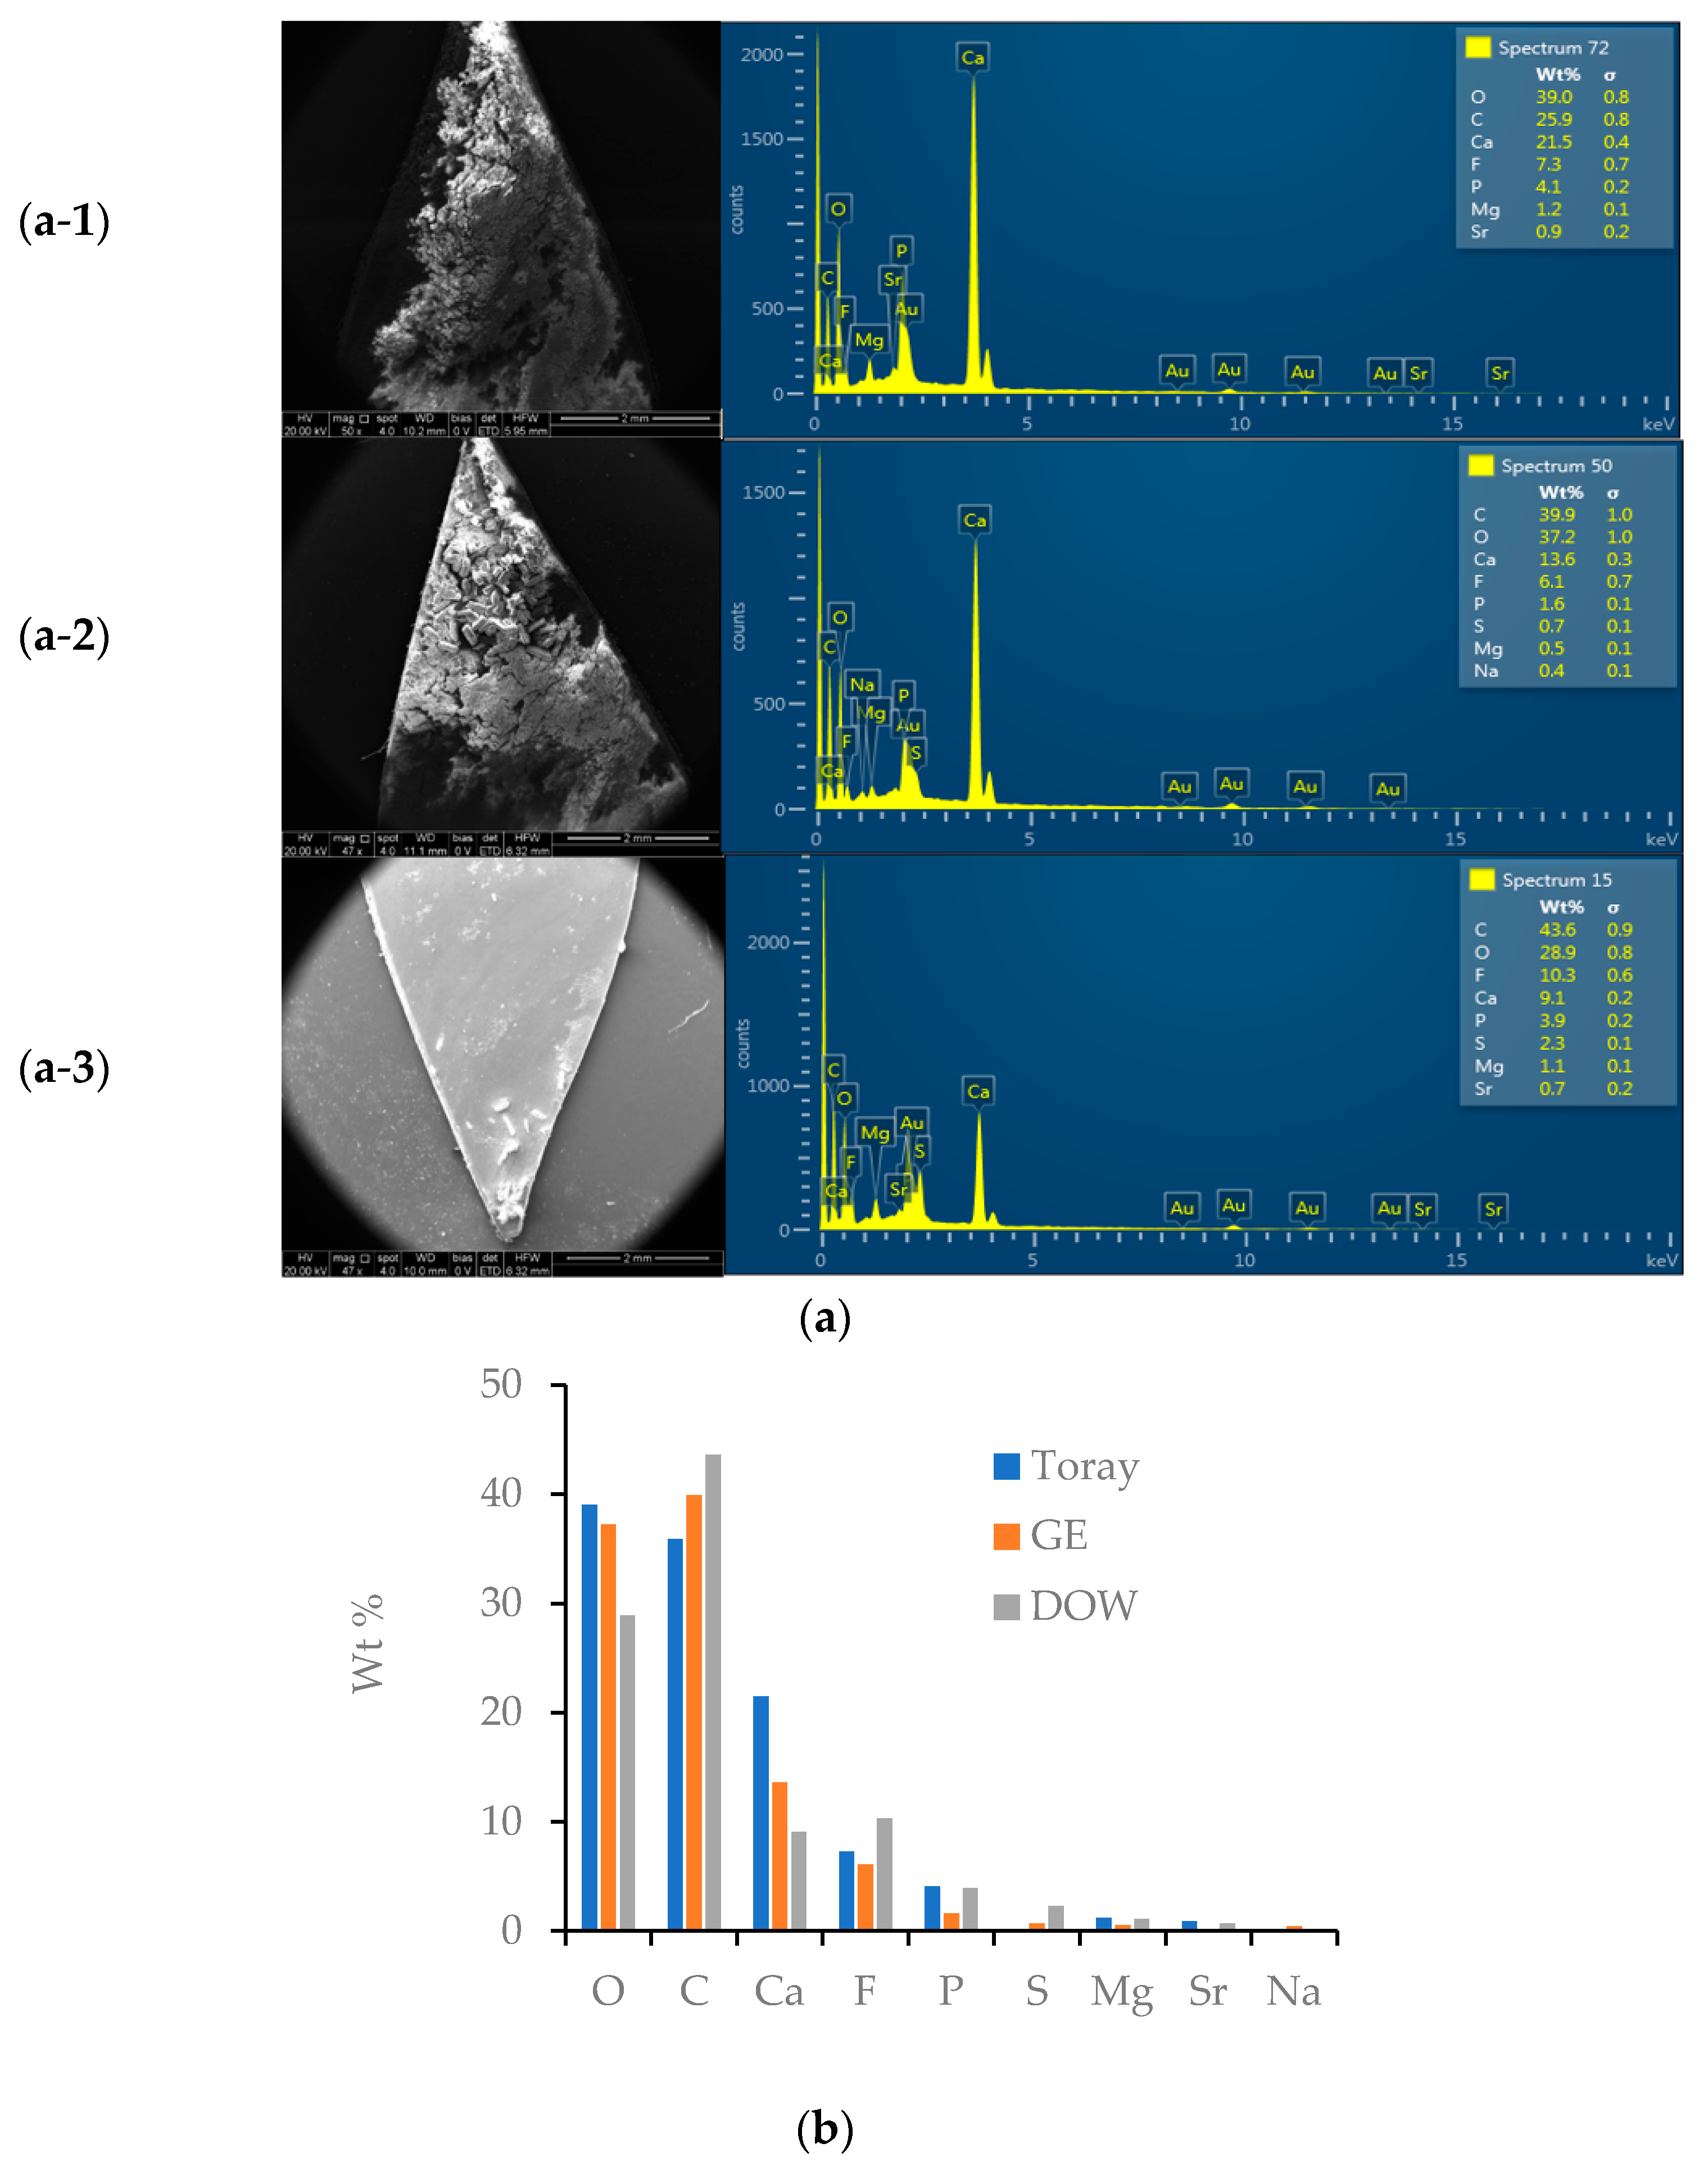
Membrane fouling was analyzed using Energy-Dispersive X-ray Spectroscopy (EDS) coupled with a Scanning Electron Microscope (SEM) to identify the major elements found on the membrane surface. The SEM/EDS analysis revealed that in the stirred cell filtration, the fouling layer formed primarily in the center and around the edges of the membrane with little build up in the areas between the edge and center. The uneven distribution of fouling layer observed might reflect the effect of distribution of shear force on membrane fouling. Figure 4 shows the SEM images of the center tips of three membranes (Toray (Figure 4a-1), GE (Figure 4a-2), DOW (Figure 4a-3) from top to bottom) and the associated EDS spectrograms. The SEM observation revealed not only differences in the quantities of foulant but also in the morphology of the fouling layers formed on different commercial LPRO membranes. The DOW membrane had very little deposit compared to the Toray and GE membranes. With respect to the morphologies of the fouling layers, the fouling layers formed on the Toray and GE membrane showed a rough surface structure like ones resulted from inorganic precipitation, while that formed on the DOW membrane surface looked more like a gel layer with a smooth and dense surface structure (Figure 4). This result suggests that the formation of the irreversible membrane fouling was highly affected by the surface chemistry and physical properties of the LPRO membranes. It can be postulated that a membrane with a high affinity to organic polymeric compounds, e.g., proteins and polysaccharides, could tend to form a gel-like fouling layer, while one with a low affinity to organic polymeric substances will be mainly susceptible to fouling caused by inorganic precipitation.
The spectrum of EDS shows the weight percent of different elements detected in the fouling layers as well as their standard deviation. The major elements identified by the EDS analysis were carbon, oxygen, calcium, fluorine, and phosphorus. The fraction of carbon element reflects the organic content of the foulant. The fouling layer on the DOW membrane showed the highest carbon content, followed by those detected on the GE and Toray membranes. The high carbon content of the foulant on the Dow membrane surface somehow matches with the morphologic characteristics of the fouling layers revealed by the SEM images, considering that an increase in the organic content could result in a smoother or gel-like fouling layer. The high content of oxygen of the foulant could be related to carbonate and phosphate species, resulting from precipitation of metal ions. Of the elements found in the fouling layers, calcium stood out as the most significant element outside of carbon and oxygen. Our previous study identified calcium was the dominant divalent ion in the UASB effluent tested in this study with a concentration around 128 mg/L [21]. The precipitation of divalent ions is one of the main fouling mechanisms in RO operation [22,23]. Calcium precipitates formed on the LPRO membranes tested in this study likely included calcium carbonate (CaCO3) and calcium phosphates (hydroxyapatite (Ca5(PO4)OH) and fluoroapatite (Ca5(PO4)3F)), considering that C, O, Ca, P and F were identified as the main elements of the membrane foulant by the EDS analysis. In addition to the formation of inorganic precipitates, calcium can also play an important role in the formation of EPS gel layer [24]. Thus, the SEM/EDS analysis revealed that Ca2+ played an important role in the formation of membrane fouling layer in the LPRO filtration of the UASB effluent. It is worth noting that the foulant substances identified in this study were based on short-term batch filtration experiments. For the long-term operation, the organic and nutrient substances retained by the LPRO membranes will become nutrient-rich substrate for biofilm growth, causing membrane biofouling. Therefore, a regular chemical cleaning is necessary for the real-world application of LPRO membranes for the treatment of the brewery UASB effluent.
3.5. Water Qualities Achieved by UF-LPRO
Table 3 shows the main water quality parameters obtained in the LPRO membrane filtration of the UF pre-treated UASB effluent. With the three commercial LPRO membranes, the COD, TP, and TN concentrations of the LPRO effluents obtained at 10 bars of the filtration pressure were 10.4 to 12.5 mg/L, 0.7 to 1.2 mg/L, and 1.3 to 2.1 mg/L, respectively. The LPRO membranes achieved around 95% removal of total COD, 93.1 to 96.0% of TP removal, and 68.2% to 80.3% TN removal in the treatment of UF-pretreated effluent. Compared to COD and TP removal, the LPRO membrane showed a relatively lower TN removal. The main component of TN in the UF treated effluent was NH3-N, which was reduced from 4 mg/L to concentrations around 1.3 to 1.6 mg/L. The residual COD in the LPRO effluent might include soluble microbial products (SMP), which mainly consists of proteins, polysaccharides and humic acids. All three LPRO membranes showed around 95% removal of polysaccharides but exhibited slightly different removal efficiencies for proteins and humic acids. Toray membranes showed the highest rejection to proteins and the similar humic acids removal efficiencies with Dow membranes, while GE membrane showed slightly lower protein and humic acid rejection than other two LPRO membrane tested (Table 3). Compared to the conventional RO, the LPRO membranes likely have a slightly lower SMP rejection. Nasseri et al. [25] showed that RO membranes can reject up to 99.3% of humic acids, also noting that those rejected species form a considerable portion of the organic fouling on RO membranes. The membranes showed 97.2% to 98.6% rejections of Ca2+ and 97.5% to 98.3% rejections of Mg2+ but lower rejections of Na+ (86.5% to 89.7%) and K+ (85.2% to 89.4) (Table 3). The high rejection of divalent can in turn encourage the precipitation of the concentrated constituents on the membrane surface, causing membrane fouling [26].
It was noted that the operation pressure of LPRO filtration could affect the water quality of the effluent. When the pressure increased from 3 to 10 bars the concentrations of TCOD, TP, PO4-P, and Alk (HCO3−) in the effluent were reduced but the NH4-N concentration were slightly increased (Table 3). The reduction in the concentrations of TCOD, TP, and PO4-P in the LPRO effluents could be resulted from the formation of denser fouling layers at the higher operation pressures, which increased the rejections of those chemical species. However, the increased concentrations of NH4-N in the effluent at higher pressures might suggest that the transport of NH4-N through the LPRO membrane was not limited by the size exclusion effect of the fouling layers but by the concentration gradient across the membranes. The higher operation pressures increased the concentration polarization of NH4+, resulting in a higher concentration gradient or a high driving force for diffusion of NH4+ across the LPRO membranes. Nevertheless, it is important to note the impact of operation pressures on the rejection behavior of LPRO membrane might vary with chemical species in the feed water.
3.6. Water Qualities Achieved by UF + GAC + LPRO
Activated carbon filters are widely used for water purification, tertial treatment of secondary effluent, and water reuse. In this study, activated carbon adsorption was performed to determine the adsorption capacity of activated carbon to remove COD species in the UF treated brewery UASB effluent. It was found that the soluble COD adsorption isotherm can fit into a Freundlich adsorption model: , where q is the solid phase concentration (mg/g) and Ce is the liquid phase concentration (mg/L). The equilibrium test results showed the COD adsorption equilibrium was reached after around 100 h of adsorption.
To evaluate the impact of GAC adsorption pretreatment on water quality of the LPRO effluent, a series of treatments including UF, GAC adsorption, and LPRO filtration were performed on the UASB effluent with the retention times of the GAC column set at 1 h, 4 h and 6 h, respectively. Table 4 shows the removal efficiency of GAC column and the water quality achieved by the UF + GAC + LPRO at different GAC column retention times. As shown in Table 4, a clear difference was seen between the GAC removal efficiency archived with the three GAC retention times. The removal of COD ranged from 42.9% for 1 hr of retention time to 89.4% for 6 hrs of retention time. Similarly, for the 1 h and 6 h retention times, TP was removed by 39.4% and 63.3%, and TN was removed by 51.5% and 85.6%, respectively. The COD concentration was reduced to below 10 mg/L, TP below 1 mg/L, and TN below 0.5 mg/L after the UASB effluent was treated in series by the UF, GAC and LPRO processes. It was noted that the final water quality of the UF + GAC + LPRO treatment was insensitive to the GAC retention time. The overall rejection of COD was 95.8%, 96.3% and 96.8% for the 1, 4 and 6 hr GAC retention times, respectively. However, comparing with the water qualities achieved with UF + LPRO, the addition of the GAC adsorption between the UF and LPRO reduced the COD, TN and NH3-N concentrations from 10.4, 2.1 and 1.8 mg/L to lower than 10, 0.3 and 0.0 mg/L, respectively.
In addition to the impact on water quality, it was found that GAC adsorption could significantly mitigate LPRO membrane fouling. The total resistances in the 24 h LPRO filtration of the UF effluent treated at GAC retention times of 6, 4, and 1 h were 2.44 × 10¹² 1/m, 3.15 × 10¹³ 1/m, and 2.18 × 10¹⁴ 1/m, respectively, indicating that significant reduction in the LPRO filtration resistance with the increase in the GAC adsorption times. This result shows that the quantity of constituents removed directly effects the fouling potential of the wastewater. Activated carbon adsorption also showed a similar impact on membrane fouling in microfiltration and ultrafiltration filtration. For example, Johir et al. used GAC as a suspended media in a submerged membrane bioreactor system and found that the membrane resistance was greatly reduced by the addition of 2 g/L of GAC [27]. The effect of GAC adsorption on membrane fouling might suggest that organic components removed by activated carbon adsorption could have a high potential to bind to the surface of polymeric membranes, causing serious membrane fouling.
3.7. Water Reuse Potential
One of the main focuses of this study is to assess the water quality of the effluent from the low-pressure RO experiments. For the treatment of the UASB effluent tested in this study, the UF, UF + GAC (retention time 4 hrs), UF + LPRO and UF + GAC + LPRO, respectively, achieved overall COD removal efficiencies of 89.6–93.7%, 94.5–96.7%, 99.3–99.1% and 99.3–99.4%; TN removal efficiencies of 73.0–78.2%, 89.2–97.2%, 97.1–98.2% and 94.3–99.7%; and TP removal efficiencies of 29.3–46.2%, 77.0–95.4%, 95.9–97.6% and 98.0–98.3%. As shown above, although the UF + GAC processes could achieved close to 95% or even higher COD, TN and TP removal, its performance could be less stable comparing to the UF + LPRO and UF + GAC + LPRO processes, specially considering the fluctuation in water quality of UASB effluent over operation times. Moreover, for the removal of ionic species in the UASB effluent, the use of LPRO process would be desired to ensure the concentrations of ionic species to meet the reuse requirement.
To understand the water reuse potential of brewery UASB effluent, the water qualities achieved by the LPRO processes were compared with various water reuse standards. The first comparison was made with the suggested reuse standards from the US EPA for both the once-through cooling and recirculating cooling. The guidelines call for a pH of between 6 and 9, a BOD of less than 30 mg/L, and TSS less than 30 mg/L [28]. The effluents obtained from the UASB + UF + LPRO and UASB + UF + GAC + LPRO treatment had pHs between 8.4 and 8.8 and the COD between 7.5 and 12.5. All samples showed no TSS in the effluent. Thus, the effluent obtained from both UASB + UF + LPRO and UASB + UF + GAC + LPRO can meet the reuse criteria of EPA.
However, the criteria of water reuse for brewery production could exceed the criteria suggested by US EPA water reuse guidelines [6,29]. Braeken et al. [6] suggested that the most important standards for regenerating brewery wastewater for cooling could include COD concentrations in the range of 0 to 2 mg/L, Na+ of 0 to 200 mg/L, Cl− of 50–250 mg/L, and pH of 6.5–9.5. Camezzana [29] reported that the water quality parameters required by brewers for the steam generation, cooling systems, and pasteurization could be close to those of ultra-pure water, including pH (5–7), conductivity (<250 µS/cm), TDS (<130 mg/L), TSS (<0.1 mg/L), turbidity (<0.5 NTU), total alkalinity (34 mg/L), Chlorides (22 mg/L), total hardness (<5 mg/L), calcium (<1.0 mg/L), magnesium (<1.0 mg/L), sodium (<100 mg/L) and silica (<0.5 mg/L). The water quality obtained in this study by the UASB + UF + LPRO and UASB + UF + GAC + LPRO failed to meet the strict requirement of brewery process water suppletion purpose. For example, the final COD levels seen in LPRO effluent 10–13 mg/L range (7.5–10 mg/L when GAC adsorption was used), which is well above the limits for both rinsing and cooling of 2 mg/L [6]. Thus, although the results obtained in this study showed evidence that the low-pressure RO membranes can produce effluent to meet the US EPA reuse standards [27], a conversional RO may be required to meet more strict water quality requirements for brewery production process reuses.
4. Conclusions
The goal of this study was to investigate the performance of LPRO processes for the treatment and reuse of brewery wastewater UASB effluent. Three different commercially available low-pressure membranes were chosen and tested for a variety of pretreatment and operational conditions. Effluent was compared to both US EPA guidelines as well as requirements taken from industrial case studies. Based on the experiments completed the following conclusions can be made:
- Low Energy RO membranes with UF pretreatment can treat brewery UASB effluent to meet US EPA reuse standards for various reuse purposes, but may not meet standards set by private brewery companies for cooling, steam generation, and rinsing due to the high conductivity/salt and COD contents of the effluent.
- The short-term filtration studies showed that the flux behavior of the LPRO can be significantly affected by the operation pressures in the range between 3 and 10 bars.
- The LPRO filtration behavior and the water quality of LPRO membrane can be significantly affected by the pretreatment methods. Ultrafiltration is more effective than microfiltration as a pretreatment process for LPRO operation. A GAC column treatment between the ultrafiltration pretreatment and the LPRO processes can significantly reduce LPRO membrane fouling and improve the quality of LPRO effluent.
- Calcium precipitates was identified as the main inorganic foulant in the LPRO treatment of the UASB effluent.
Author Contributions
Conceptualization, P.I., S.C. and M.S.R.; methodology, P.I., S.C. and M.S.R.; validation, P.I., S.C. and M.S.R.; formal analysis, P.I.; investigation, P.I., S.C.; resources, S.C. and M.S.R.; data curation, P.I.; writing—original draft preparation, P.I.; writing—review and editing, P.I., S.C. and M.S.R.; supervision, S.C. and M.S.R.; project administration, S.C.; funding acquisition, S.C. All authors have read and agreed to the published version of the manuscript.
Funding
This research was funded by the Ontario Ministry of Agriculture Food and Rural Affairs (OMAFRA) through the Quebec-Ontario Cooperation for Agi-Food Research Fund (Project number: IA114253/SF9299).
Institutional Review Board Statement
Not applicable.
Informed Consent Statement
Not applicable.
Data Availability Statement
This study did not include any publicly available datasets.
Acknowledgments
Specials thanks to our industrial partner for providing UASB effluent samples.
Conflicts of Interest
The authors declare no conflict of interest.
References
- Werkneh, A.; Beyene, H.; Osunkunle, A. Recent advances in brewery wastewater treatment; approaches for water reuse and energy recovery: A review. Environ. Sustain. 2019, 2, 199–209. [Google Scholar] [CrossRef]
- Enitan, A.M.; Kumari, S.; Odiyo, J.O.; Bux, F.; Swalaha, F.M. Principal component analysis and characterization of methane community in a full-scale bioenergy producing UASB reactor treating brewery wastewater. Phys. Chem. Earth 2018, 108, 1–8. [Google Scholar] [CrossRef]
- Han, C.; Chang, S.; Guo, Q.; Hong, Y.W.P. Brewery wastewater treatment using an anaerobic membrane bioreactor. Biochem. Eng. J. 2016, 105, 321–331. [Google Scholar]
- Alvarado-Lassman, A.; Rustria, E.; Garcia-Alvarado, M.A.; Rodrıguez-Jimenez, G.C.; Houbron, E. Brewery wastewater treatment using anaerobic inverse fluidized bed reactors. Bioresour. Technol. 2008, 99, 3009–3015. [Google Scholar] [CrossRef] [PubMed]
- Asensio, Y.; Llorente, M.; Fernández, P.; Tejedor-Sanz, S.; Manuel, O.J.; Francisco, C.J.; Monsalvo, V.; Rogalla, F.; Esteve-Núñez, A. Upgrading fluidized bed bioelectrochemical reactors for treating brewery wastewater by using a fluid-like electrode. Chem. Eng. J. 2021, 406, 127103. [Google Scholar] [CrossRef]
- Braeken, L.; Van der Bruggen, B.; Vandecasteele, C. Regeneration of brewery waste water using nanofiltration. Water Res. 2004, 38, 3075–3082. [Google Scholar] [CrossRef] [PubMed]
- Bunani, S.; Yörükoğlu, E.; Yüksel, Ü.; Kabay, N.; Yuksel, M.; Sert, G. Application of Reverse Osmosis for Reuse of Secondary Treated Urban Wastewater in Agricultural Irrigation. Desalination 2015, 364, 68–74. [Google Scholar] [CrossRef]
- Verhuelsdonk, M.; Glas, K.; Parlar, H. Economic evaluation of the reuse of brewery wastewater. J. Environ. Manag. 2021, 281, 111804. [Google Scholar] [CrossRef]
- Tchobanoglous, G.; Burton, F.L.; Stensel, H.D. Wastewater Engineering: Treatment and Reuse, 4th ed.; McGraw-Hill Education: New York, NY, USA, 2003. [Google Scholar]
- Ozaki, H.; Sharma, K.; Saktaywin, W.; Wang, D.; Yu, Y. Application of Ultra Low Pressure Reverse Osmosis (ULPRO) Membrane to Water and Wastewater. Water Sci. Technol. 2000, 42, 123–135. [Google Scholar] [CrossRef]
- Venzke, C.D.; Rodrigues, M.A.S.; Giacobbo, A.; Bacher, L.E.; Lemmertz, I.S.; Viegas, C.; Striving, J.; Pozzebon, S. Application of Reverse Osmosis to Petrochemical Industry Wastewater Treatment Aimed at Water Reuse. Manag. Environ. Qual. Int. J. 2017, 28, 70–77. [Google Scholar] [CrossRef]
- Xu, P.; Drewes, J.E.; Heil, D. Beneficial Use of Co-Produced Water Through Membrane Treatment: Technical-Economic Assessment. Desalination 2008, 225, 139–155. [Google Scholar] [CrossRef]
- Shen, Y.-X.; Xiao, K.; Liang, P.; Ma, Y.-W.; Huang, X. Improvement on the Modified Lowry Method against Interference of Divalent Cations in Soluble Protein Measurement. Appl. Microbiol. Biotechnol. 2013, 97, 4167–4178. [Google Scholar] [CrossRef]
- Nielsen, S.S. Food Analysis Laboratory Manual, 2nd ed.; Springer Science+Business Media: Berlin, Germany, 2010. [Google Scholar] [CrossRef]
- Nguyen, T.V.; Jeong, S.; Pham, T.T.N.; Kandasamy, J.; Vigneswaran, S. Effect of Granular Activated Carbon Filter on the Subsequent Flocculation in Seawater Treatment. Desalination 2014, 354, 9–16. [Google Scholar] [CrossRef]
- Pansare, V.J.; Tien, D.; Thoniyot, P.; Prud’homme, R.K. Ultrafiltration of Nanoparticle Colloids. J. Membr. Sci. 2017, 538, 41–49. [Google Scholar] [CrossRef]
- Grenier, A.; Meireles, M.; Aimar, P.; Carvin, P. Analysing Flux Decline in Dead-End Filtration. Chem. Eng. Res. Des. 2008, 86, 1281–1293. [Google Scholar] [CrossRef] [Green Version]
- Lisitsin, D.; Hasson, D.; Semiat, R. Critical Flux Detection in a Silica Scaling RO System. Desalination 2005, 186, 311–318. [Google Scholar] [CrossRef]
- Velasco, C.; Calvo, J.; Palacio, L.; Carmona, J.; Prádanos, P.; Hernández, A. Flux Kinetics, Limit and Critical Fluxes for Low Pressure Dead-End Microfiltration. The Case of BSA Filtration through a Positively Charged Membrane. Chem. Eng. Sci. 2015, 129, 58–68. [Google Scholar] [CrossRef] [Green Version]
- Mcgovern, R.K.; Mcconnon, D.; Lienhard, J.H. The Effect of Very High Hydraulic Pressure on the Permeability and Salt Rejection of Reverse Osmosis Membranes. In Proceedings of the International Desalination Association World Congress on Desalination and Water Reuse, San Diego, CA, USA, 4 September 2015; pp. 1–7. [Google Scholar]
- Liu, Y.; Chang, S.; Defersha, F.M.; Guo, Q.; Chen, R. Characterization of proton binding properties of extracellular polymeric substances in an Expanded Granular Sludge Bed using linear programming analysis. J. Adv. Biol. Biotechnol. 2015, 4, 1–11. [Google Scholar] [CrossRef]
- Pandey, S.R.; Jegatheesan, V.; Baskaran, K.; Shu, L. Fouling in Reverse Osmosis (RO) Membrane in Water Recovery from Secondary Effluent: A Review. Rev. Environ. Sci. Bio Technol. 2012, 11, 125–145. [Google Scholar] [CrossRef]
- Chesters, S.P. Innovations in the Inhibition and Cleaning of Reverse Osmosis Membrane Scaling and Fouling. Desalination 2009, 238, 22–29. [Google Scholar] [CrossRef]
- Jamal, S.; Chang, S.; Zhou, H. Filtration behaviour and fouling mechanisms of polysaccharides. Membranes 2014, 4, 319–332. [Google Scholar] [CrossRef] [PubMed] [Green Version]
- Zazouli, M.A.; Nasseri, S.; Mahvi, A.H.; Gholami, M.; Mesdaghinia, A.R.; Younecian, M. Studies on Rejection and Fouling of Polyamide Reverse Osmosis Membrane in the Treatment of Water Solutions Containing Humic Acids. World Appl. Sci. J. 2008, 3, 434–440. [Google Scholar]
- Tu, K.; Chivas, A.; Nghiem, L. Effects of Membrane Fouling and Scaling on Boron Rejection by Nanofiltration and Reverse Osmosis Membranes Publication Details Effects of Membrane Fouling and Scaling on Boron Rejection by Nanofiltration and Reverse Osmosis Membranes. Desalination 2011, 289, 269–277. [Google Scholar] [CrossRef] [Green Version]
- Johir, M.A.H.; Aryal, R.; Vigneswaran, S.; Kandasamy, J.; Grasmick, A. Influence of Supporting Media in Suspension on Membrane Fouling Reduction in Submerged Membrane Bioreactor (SMBR). J. Membr. Sci. 2011, 374, 121–128. [Google Scholar] [CrossRef]
- US EPA. Guidelines for Water Reuse; EPA: Washington, DC, USA, 2012.
- Camezzana, J.P. Treatment for Water Reuse with Filtration and Reverse Osmosis. Water Technology, 2017. Available online: https://www.watertechonline.com/wastewater/article/15550350/reducing-water-consumption-using-filtration-and-ro (accessed on 4 September 2015).
Figure 1.
Potential process compositions for the UASB effluent treatment. (a) UASB + gravity settling + ultrafiltration + LPRO; (b) UASB + gravity settling+ ultrafiltration + GAC adsorption + LPRO.
Figure 1.
Potential process compositions for the UASB effluent treatment. (a) UASB + gravity settling + ultrafiltration + LPRO; (b) UASB + gravity settling+ ultrafiltration + GAC adsorption + LPRO.

Figure 2.
(a) Flux behavior of LPRO membrane in the filtration of the UASB effluent pretreated by the MF and UF (Wastewater Batch 1), (b) Flux behavior of LPRO at different transmembrane pressure (Wastewater Batch 3), (c) Change in the filtration resistances after the filtration (Wastewater Batch 3) (GE AK membrane).

Figure 3.
Filtration behavior of different LPRO membranes at 10 bar (wastewater: Bach 4). (a) Flux-filtrate volume relation, (b) normalized flux-volume relation, and (c) Change in the membrane resistances after the filtration.
Figure 3.
Filtration behavior of different LPRO membranes at 10 bar (wastewater: Bach 4). (a) Flux-filtrate volume relation, (b) normalized flux-volume relation, and (c) Change in the membrane resistances after the filtration.

Figure 4.
(a) SEM/EDX images of the fouled LPRO membranes (wastewater: Bach 4), (a-1) Toray 73HA, (a-2) GE AK, and (a-3) DOW XLE; (b) Factions of elements detected by EDX at surfaces of different used membranes.
Figure 4.
(a) SEM/EDX images of the fouled LPRO membranes (wastewater: Bach 4), (a-1) Toray 73HA, (a-2) GE AK, and (a-3) DOW XLE; (b) Factions of elements detected by EDX at surfaces of different used membranes.


Table 1.
Wastewater characteristics of different batches of wastewater tested, where COD: Chemical Oxygen Demand; TP: Total Phosphorus; PO4-P: Orthophosphate Phosphorus; TN: Total Nitrogen; TKN: Kjeldahl nitrogen; NOx-N: Nitrite and Nitrate nitrogen; and NH3-N: Ammonia Nitrogen.
Table 1.
Wastewater characteristics of different batches of wastewater tested, where COD: Chemical Oxygen Demand; TP: Total Phosphorus; PO4-P: Orthophosphate Phosphorus; TN: Total Nitrogen; TKN: Kjeldahl nitrogen; NOx-N: Nitrite and Nitrate nitrogen; and NH3-N: Ammonia Nitrogen.
| Bach 1 | Bach 2 | Bach 3 | Bach 4 | ||
|---|---|---|---|---|---|
| COD | mg/L | 1473 (13.14) * | 1835 (35.49) | 1739 (38.13) | 1388 (32.00) |
| TP | mg/L | 65.25 (0.15) | 106.90 (0.70) | 75.80 (0.80) | 29.28 (0.24) |
| PO4-P | mg/L | 36.45 (0.35) | 66.10 (0.10) | 48.90 (0.70) | 18.92 (0.00) |
| TN | mg/L | 59.20 (0.15) | 75.30 (1.80) | 107.10 (9.60) | 72.40 (0.80) |
| TKN | mg/L | 57.80 (0.30) | 73.56 (1.77) | 105.75 (9.45) | 70.40 (0.80) |
| NOx-N | mg/L | 1.40 (0.15) | 1.74 (0.03) | 1.35 (0.15) | 2.00 (0.00) |
| NH3-N | mg/L | 11.56 (0.45) | 13.70 (1.40) | 23.54 (0.11) | 7.68 (0.38) |
* () standard deviation.
Table 2.
UASB effluent characteristics and the contaminant removal achieved by the filtration with the 1.5 µm filter paper, 0.45 µm MF and 0.04 µm UF.
Table 2.
UASB effluent characteristics and the contaminant removal achieved by the filtration with the 1.5 µm filter paper, 0.45 µm MF and 0.04 µm UF.
| UASB Effluent | 1.5 µm Filter Paper | 0.45 µm MF | 0.04 µm UF | |
|---|---|---|---|---|
| mg/L | (%) | (%) | (%) | |
| COD | 1388–1835 | 71.5–85.6 | 83.7–86.0 | 89.6–93.7 |
| TP | 29.3–106.9 | 21.2–34.0 | 24.9–31.6 | 29.3–46.2 |
| TN | 59.2–107.1 | 55.2–64.0 | 67.9–71.8 | 73.0–78.2 |
| TKN | 57.8–105.7 | 55.3–65.6 | 67.8–72.3 | 73.1–78.9 |
Table 3.
Effluent quality achieved by UF + LPRO processes (Wastewater Batch 4), where COD: Chemical Oxygen Demand; TP: Total Phosphorus; PO4—P: Orthophosphate Phosphorus; TN: Total Nitrogen; TKN: Kjeldahl nitrogen; NOx-N: Nitrite and Nitrate nitrogen; and NH3-N: Ammonia Nitrogen, Alk: Alkalinity.
Table 3.
Effluent quality achieved by UF + LPRO processes (Wastewater Batch 4), where COD: Chemical Oxygen Demand; TP: Total Phosphorus; PO4—P: Orthophosphate Phosphorus; TN: Total Nitrogen; TKN: Kjeldahl nitrogen; NOx-N: Nitrite and Nitrate nitrogen; and NH3-N: Ammonia Nitrogen, Alk: Alkalinity.
| Parameter | RO | GE | DOW | Toray | ||
|---|---|---|---|---|---|---|
| mg/L | Influent | 3 Bar | 5 Bar | 10 Bar | 10 Bar | 10 Bar |
| COD | 238.0 | 14.5 (6.6) * | 14.0 (1.4) | 12.5 (3.5) | 11.2 (1.86) | 10.4 (1.1) |
| TP | 17.3 | 3.5 (0.03) | 1.5 (0.03) | 0.8 (0.01) | 0.7 (0.01) | 1.2 (0.01) |
| PO43−-P | 15.3 | 3.3 (0.03) | 1.3 (0.1) | 0.8 (0.01) | 0.4 (0.01) | 0.9 (0.01) |
| TN | 6.6 | 1.5 (0.03) | 2.1 (0.4) | 2.1 (0.03) | 1.3 (0.03) | 1.8 (0.03) |
| TKN | 6.0 | 1.4 (0.06) | 1.9 (0.4) | 1.9 (0.03) | 1.2 (0.00) | 1.7 (0.04) |
| NOx-N | 0.6 | 0.1 (0.03) | 0.1 (0.01) | 0.1 (0.00) | 0.1 (0.03) | 0.1 (0.01) |
| NH3-N | 4.0 | 0.0 (0.00) | 1.1 (0.01) | 1.8 (0.02) | 1.8 (0.01) | 1.3 (0.01) |
| Alk (meq/L) | 55.6 | 11.7 (0.3) | 6.2 (0.00) | 4.1 (0.5) | 5.0 (0.02) | 4.6 (0.6) |
| pH | 8.5 | 9.0 (0.01) | 8.7 (0.02) | 8.5 (0.02) | 8.5 (0.03) | 8.4 (0.03) |
| Cl− | - | - | {80.2} ** | {72.1} | {79.4} | |
| Ca2+ | - | - | {97.6} | {98.6} | {97.2} | |
| Fe (total) | - | - | {89.4} | {89.5} | {90.0} | |
| Mg2+ | - | - | {98.1} | {98.3} | {97.5} | |
| K+ | - | - | {89.4} | {85.2} | {89.3} | |
| Si (total) | - | - | {89.8} | {87.8} | {89.7} | |
| Na+ | - | - | {89.7} | {86.5} | {88.8} | |
| SO42− | - | - | {97.5} | {97.3} | {96.7} | |
| Proteins | - | - | {94.6} | {94.0} | {98.2} | |
| Humic acid | - | - | {95.6} | {97.7} | {97.4} | |
| Carbohydrate | - | - | {95.4} | {95.6} | {95.9} | |
*: (-) standard deviation. **: {-} removal efficiency (%).
Table 4.
GAC column removal efficiency and the effluent quality from UF + GAC + LPRO (wastewater: Bach 4).
Table 4.
GAC column removal efficiency and the effluent quality from UF + GAC + LPRO (wastewater: Bach 4).
| Parameters | GAC Column Removal (%) | UF + GAC + LPRO (mg/L) | ||||
|---|---|---|---|---|---|---|
| 1 h | 4 h | 6 h | 1 h | 4 h | 6 h | |
| TCOD | 42.9 (2.4) * | 68.0 (0.6) | 89.4 (0.4) | 9.9 (1.9) | 8.8 (2.2) | 7.5 (4.6) |
| TP | 39.4 (0.4) | 61.0 (0.4) | 63.3 (0.1) | 0.6 (0.01) | 0.5 (0.0) | 0.4 (0.0) |
| PO43−-P | 38.8 (0.1) | 60.5 (0.4) | 61.7 (0.1) | 0.6 (0.01) | 0.5 (0.01) | 0.4 (0.01) |
| TN | 51.5 (0.6) | 62.1 (0.9) | 85.6 (6.4) | 0.3 (0.2) | 0.2 (0.02) | 0.2 (0.02) |
| TKN | 48.0 (0.9) | 59.8 (0.8) | 85.3 (6.7) | 0.3 (0.2) | 0.2 (0.0) | 0.2 (0.02) |
| NOx-N | 86.4 (2.4) | 85.6 (1.20) | 88.7 (3.2) | 0.04 (0.01) | 0.03 (0.01) | 0.03 (0.0) |
| NH3-N | 71.1 (1.6) | 100.0 (0.0) | 100.0 (0.0) | 0.0 (0.0) | 0.0 (0.0) | 0.0 (0.0) |
| Alk | 18.6 (5.0) | 21.6 (0.8) | 23.2 (1.4) | 4.6 (0.5) | 4.4 (0.2) | 4.2 (0.03) |
* () Standard deviation.
Publisher’s Note: MDPI stays neutral with regard to jurisdictional claims in published maps and institutional affiliations. |
© 2021 by the authors. Licensee MDPI, Basel, Switzerland. This article is an open access article distributed under the terms and conditions of the Creative Commons Attribution (CC BY) license (https://creativecommons.org/licenses/by/4.0/).
Share and Cite
MDPI and ACS Style
Innes, P.; Chang, S.; Rahaman, M.S. Treatment of Effluent of Upflow Anaerobic Sludge Blanket Bioreactor for Water Reuse. Water 2021, 13, 2123. https://doi.org/10.3390/w13152123
AMA Style
Innes P, Chang S, Rahaman MS. Treatment of Effluent of Upflow Anaerobic Sludge Blanket Bioreactor for Water Reuse. Water. 2021; 13(15):2123. https://doi.org/10.3390/w13152123
Chicago/Turabian StyleInnes, Peter, Sheng Chang, and Md. Saifur Rahaman. 2021. "Treatment of Effluent of Upflow Anaerobic Sludge Blanket Bioreactor for Water Reuse" Water 13, no. 15: 2123. https://doi.org/10.3390/w13152123
Note that from the first issue of 2016, this journal uses article numbers instead of page numbers. See further details here.