
Occurrence of the Freshwater Chrysophyte Poterioochromonas malhamensis in a High Arctic Marine Ecosystem


1
MNR Key Laboratory for Polar Science, Polar Research Institute of China, Shanghai 200136, China
2
Key Laboratory of Mariculture, Ministry of Education, Ocean University of China, Qingdao 266003, China
3
Frontiers Science Center for Deep Ocean Multispheres and Earth System, Ocean University of China, Qingdao 266100, China
*
Authors to whom correspondence should be addressed.
†
Two corresponding authors contributed equally to this work.
Water 2021, 13(15), 2129; https://doi.org/10.3390/w13152129
Submission received: 28 June 2021
/
Revised: 27 July 2021
/
Accepted: 28 July 2021
/
Published: 2 August 2021
(This article belongs to the Special Issue River Restoration Technologies for the Improvement of Biodiversity and Ecosystem Functioning)
Abstract
:Kongsfjorden is a small Arctic fjord but with great hydrographic complexity and has changed greatly due to the climate change. Arctic warming has increased melts of sea ice and glaciers that results in higher freshwater content. Microbial community variability and increasing terrestrial input were detected continuously in recent years ITag eukaryotic 18S rRNA V4 metabarcoding, photosynthetic pigments analysis and epifluorescence microscopy were used to reveal the dominant species of small eukaryotic community (<20 μm). Both Spearman correlation and redundant analysis were used to study the correlation between the small eukaryotes and the environmental conditions. In the present study, the surface water with salinity lower than 34 was thicker than in summers of previous years. The freshwater mixotrophic chrysophyte Poterioochromonas malhamensis was found for the first time as the dominant species. No general trends were found for the contributions of P. malhamensis to the total reads of small eukaryotes in water depths; and no obvious differences were found at different stations and water masses. Phagotrophy, which is more common than phototrophy at all times in P. malhamensis, is thought to be the main reason for the prevalence of P. malhamensis in Kongsfjorden. The occurrence of P. malhamensis induced a disorder in the small eukaryotic community, which biodiversity and composition showed weak correlation with the water masses. The dominance of the freshwater-originating phytoplankton may indicate an ecosystem change in the Kongsjforden, which probably might become more remarkable in the future as the climate continues to change.
1. Introduction
Microbes with a diameter of less than 20 µm are fundamental components of marine food webs [1]. Autotrophic and heterotrophic organisms play important roles in the microbial loop. They are particularly important in polar oceans [1] being responsible for up to 98% of the primary production and accounting for most of the biomass [2]. Small phytoflagellates with diameter of less than 10 µm are vital to polar marine ecosystems because they dominate the photosynthetic biomass during most of the year [3,4,5,6]. Several phytoflagellates are mixotrophic and contribute to primary production and to secondary production by grazing bacteria [3,7]. The 2 µm Micromonas is a dominant pan-Arctic genus, and the approximately 4–6 µm Phaeocystis blooms in spring and summer [3].
Kongsfjorden (79°N) is an open inlet of the Arctic Ocean, 5 km long and 5–10 km wide, and located on the northwest coast of Svalbard. An active tidal glacier is at the head of the fjord. Kongsfjorden is warmer compared with other fjords at the same latitude [8,9,10] as a result of the inflow of Atlantic waters carried by the West Spitsbergen Current [11]. The freshwater runoff from calving glaciers and snowmelt carries large quantities of inorganic particles into the fjord in the summer [3]. Warm saline Atlantic water and cold fresh Arctic water also mix in the fjord [3]. The complex hydrological conditions create steep gradients of salinity, temperature, and light availability along the fjord [9]. Global warming is responsible for glacier retreat, increased inflow of meltwater and inorganic suspended sediments, and salinity and temperature fluctuations in the fjord [3,9,12]. This increased inflow of meltwater and inorganic suspended sediments, and salinity and temperature fluctuations in the fjord. This phenomenon makes the environmentally complex Kongsfjorden an ideal site for research on the impact of climate change in the Arctic [9,11,12,13]. Protists with a size of <20 μm are the most abundant in July, representing >95% of the total abundance of autotrophic and heterotrophic plankton [1]. Several studies have been conducted on the distribution and community composition of protists in Kongsfjorden during summer and found that chrysophytes, dinoflagellates, chlorophytes, pico-prasinophytes, and ciliates may all dominate [1,6,14,15,16]; however, they are all of marine origin. This study is different from all the previous ones because it presents the first time that a small mixotrophic phytoflagellate outcompeted the marine phytoplankton in the coastal water of Kongsfjorden. Although it was accidental, it represents a new phenomenon, that consisted in a small freshwater mixotrophic phytoflagellate outcompeting the marine phytoplankton in Arctic coastal marine water. It is very interesting, and we confirmed the prevalence of this phytoflagellate with DNA boarding, characteristic pigment, and microscopic observation. Both biotic and abiotic aspects were analyzed to find the cause of the prevalence of a freshwater phytoflagellate in a marine environment.
2. Material and Methods
2.1. Sampling and Environmental Factors Analyses
Samples were collected from five stations in the Kongsfjorden, Svalbard (Figure 1, [17]), during the summer (5 and 7 July) of 2013. Ten liters of seawater were collected from 0, 5,10, 20 30, 50, 75, 100, 150 and 200 m at stations K1–K3, from the first 7 depths at station K4, and from the first 5 depths at station K5 by using a Niskin bottle attached to an SBE 911plus CTD rosette system (Sea Bird Inc., Bellevue, WA, USA). Samples for discrete nutrient analyses, including phosphate (PO43−), nitrate+nitrite (NO3− + NO2−), silicate (Si) and ammonia (NH4+), were collected at each depth. They were frozen at −20 °C and were measured in the Key Laboratory of Marine Ecosystem and Biogeochemistry, State Oceanic Administration, China, by a Skalar San++ nutrient automatic analyser [18].
2.2. Biodiversity and Taxonomy of Small Eukaryotes (<20 μm) by Miseq Sequencing
Two-liter subsamples were collected from 29 depths at the five stations. The process for analyzing the biodiversity and community composition of small eukaryotes, including DNA extraction and PCR amplification of rRNA genes is described in detail in [17]. Both 3 and 0.2 μm filters of were used for analysis. Instead of GS FLX platform, Miseq platform using a 2 × 300 cycle V3 kit were used to for sequencing after quantitation.
The SSU rRNA gene sequences generated were analyzed using the bioinformatic software package Mothur (v1.32.0) [19] and the MiSeq SOP Pipeline (http://www.mothur.org/wiki/MiSeq_SOP accessed on 12 March 2020) to analyze a multiplexed set of samples on a single run. All sequences were sorted into different samples according to barcodes, retaining only high-quality sequences. Finally, sequences of high quality (matched to dual barcodes ≥200 bp in length, containing no ambiguous characters, <8 bp homologous sequences and having no chimeras) were clustered to operational taxonomic units (OTUs) at 98% similarity using the furthest algorithm. R (Version 3.1.2) was used to construct an alpha-diversity index (ACE, Chao1, Shannon and Simpson), Good’s coverage and a rarefaction curve. Variation in alpha-diversity between groups of samples were evaluated using a one-way ANOVA. Taxonomy was assigned to OTUs using the Silva database (Silva v121). [20] used the Wang method with a confidence threshold of 80%. The community diversity and similarity among all water samples from SW, IW an TAW were also analyzed with 97% similarity in Perl and Mothur. The sequence data were submitted to the National Center for Biotechnology Information Sequence Read Archives (SRA) under BioProject ID PRJNA320788.
2.3. Phytoplankton Identification by HPLC Pigment Analysis
Three-liter subsamples were collected from the different depths of stations K3–K5. Sample processing and data analysis followed the procedures described by [21]. Both 3 and 0.2 μm filters were used for analysis. Generally, the samples were processed according to methods of van Heukelem and Thomas [22] and data were analyzed according to the methods of [15,23].
2.4. Microbial Community Biomass Obtained by Epifluorescence Microscopy
The abundance of bacteria and diatom were determined by epifluorescence microscopy of filters (black-stained 0.2 and 0.8 µm Waterman polycarbonate membrane) stained with 4′,6-diamidino-2-phenylindole (DAPI) [24]. Their biomass was calculated using methods similar to those of [25,26].
Quantification and size measurement were conducted using an image analysis system with an epifluorescence microscope (Nikon 80i, Tokyo, Japan) with a charge-coupled device (CCD); UV and blue light excitation were used for heterotrophic and autotrophic microbe counting, respectively. Twenty pictures were taken for each 0.2 µm filter to count the heterotrophic bacteria (HB) and diatoms <20 µm; diatoms of ≥20 µm on 0.8 µm filters were counted directly. The numbers and sizes were analyzed using an image analysis system (JD 801, Jiangsu JEDA Science-Technology Development Co., Ltd., Jiangsu, China). A 1000 × objective lens was used for counting microbes <20 µm [25] at least 400 cells were counted per filter for bacteria and 1–4 lines were counted for diatoms. The bacterial biomass was estimated using a conversion factor of 0.02 pg C cell-1 [26] and diatom biomass was estimated from empirically determined biovolumes using equations proposed by Menden-Deuer and Lessard [27].
2.5. Statistical Analysis of Microbial and Environmental Factors
The relations between all the present OTUs of samll eukaryotic group and their corresponding environmental factors, including water depth, temperature, salinity and nutrients were analyzed using redudant analysis (RDA) (Canoco for Windows 4.5 software). Detrended correspondence analysis was used for the selection of redundancy analysis (RDA), as all the largest axial lengths were < 3 [28]. Spearman rank correlation analysis (SPSS Inc., Chicago, IL, USA) was used to evaluate correlations between small eukatyotes and the physicochemical factors.
3. Results and Discussion
3.1. Water Masses and Physicochemical Factors in the Study Area
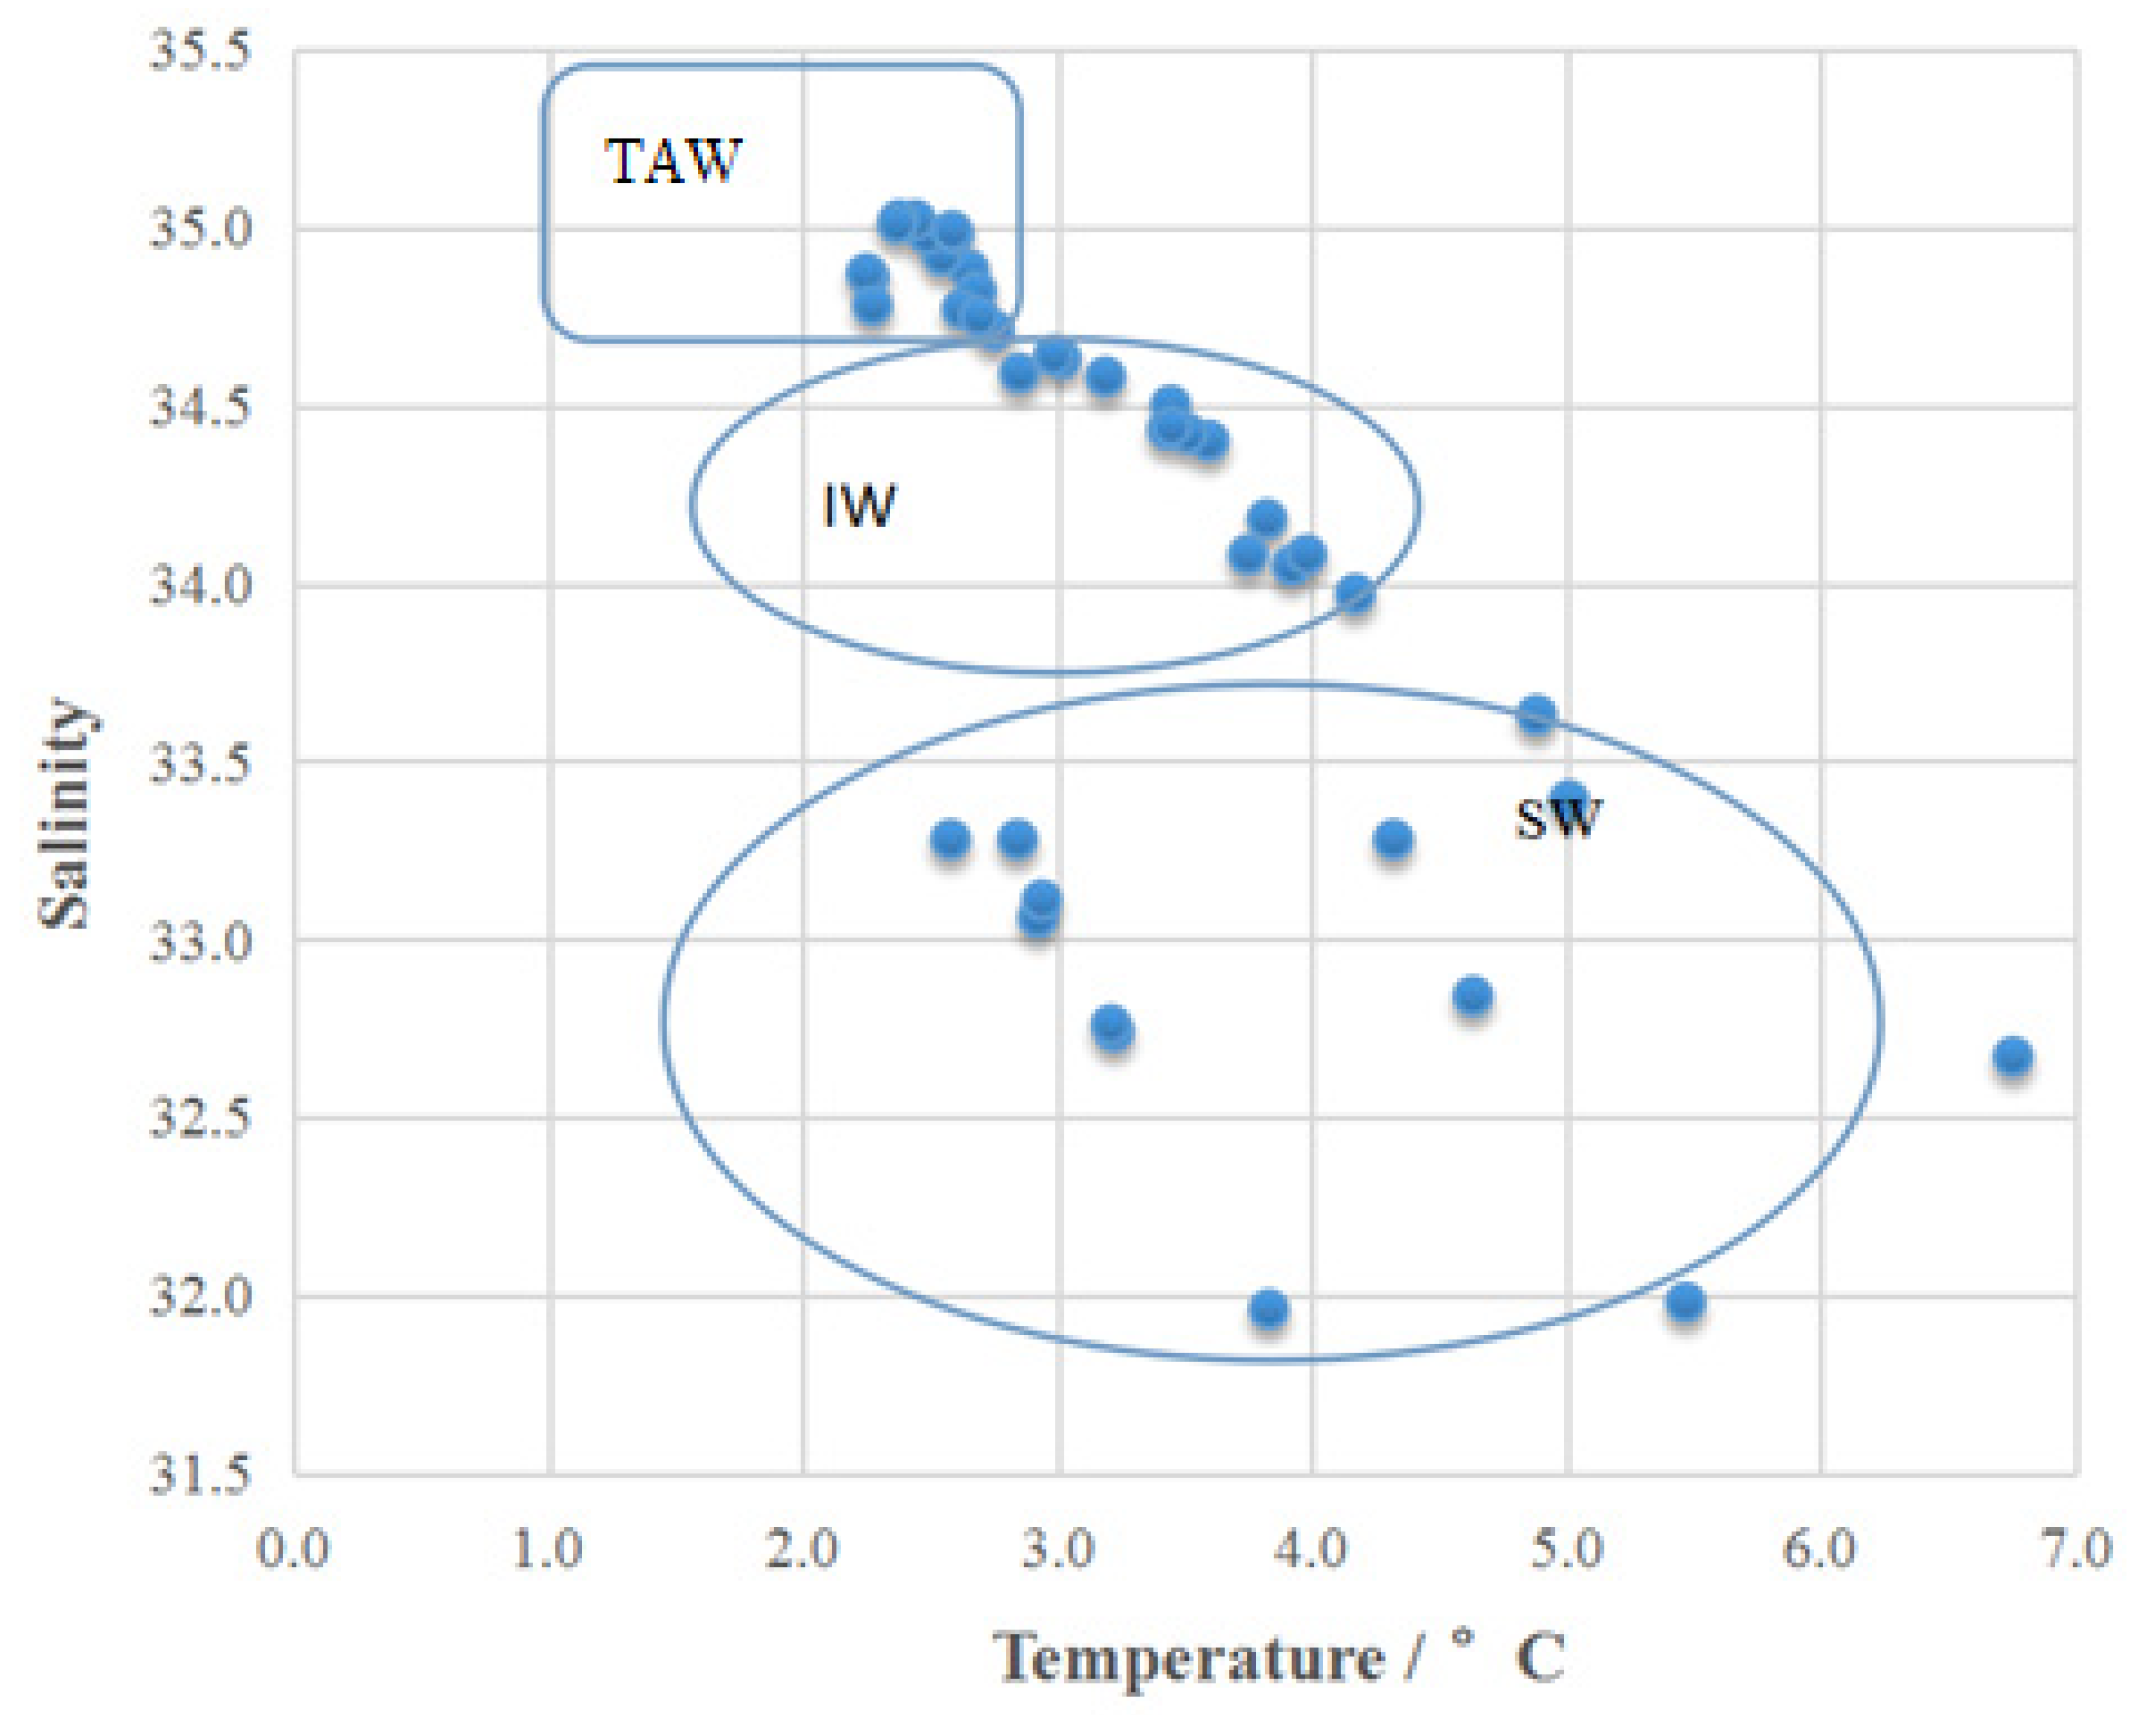
Three types of water mass were identified based on temperature and salinity (Figure 2) in summer of 2013 in Kongsfjorden: Surface Water (SW), Intermediate Water (IW) and Transformed Atlantic Water (TAW), following the classification schemes of [9,29] Cottier. SW included water depths of 0–10 m at the two outer stations (K1 and K2) and 0–20 m at the three inner stations (K3–K5) among samples of different water masses, TAW included water depths of ≥75 m for the four stations in relatively deep waters, and IW consisted of the remaining water depths between SW and TAW. Although the water temperatures (Electronic Supplementary Material) (2.25 °C–6.75 °C, average of 3.35 °C) were a little lower than those in 2012 (2.14 °C–6.84 °C, average of 3.63 °C) (p > 0.05), the SW in 2013 was considerably thicker than in 1996–2000 [9] and 2012 [30]. Salinity and macronutrients in both years exhibited stratification in the water column during the summer. The other physicochemical factors with their maximum and minimum values as well as their respective average data with errors in 2013 (The supplementary material presents these physicochemical factors in water depths from 0 m up to 200 m in Kongsfjorden area in summer 2013) were, salinity:31.96–35.02 (34.11 ± 0.87), nitrite: 0.08–0.33 (0.16 ± 0.06) μmol L−1, phosphate: 0.13–0.73 (0.32 ± 0.17) μmol L−1, silicate: 1.05–3.95 (1.90 ± 0.26) μmol L−1 and nitrate: 0–6.76 (1.30 ± 1.83) μmol L−1. Their respecitve p values of were >0.05 (salinity), <0.0001 (nitrite), 0.00011 (phosphate), 0.0006 (silicate) and 0.02831 (nitrate). These values were lower than those in 2012 except for the value of phosphate.
Although small in size, Kongsfjorden has a complex aquatic environment, making it particularly suitable for exploring the potential impact of future climate change [8]. Arctic and North Atlantic waters enter the fjord as does glacial meltwater, which creates different water masses, and the composition of which changes within the fjord across the seasons. The rate of global climate change has increased rapidly over the past decade [29]. Sea ice and glacier melt have increased dramatically as the Arctic continues to become warm, thereby intensifying the influx of freshwater into the SW of Kongsfjorden. Moreover, deep water temperatures increase due to the continuous warming of the West Spitsbergen Current [31]. These phenomena and other changes would greatly alter, if not entirely transform, the physiochemical environment of Kongsfjorden.
3.2. Community Diversity of Small Eukaryotes (<20 μm) by High-Throughput Sequencing and the Prevalence of a Small Chrysophyte
A total of 1,680,468 sequences (reads) and 13,983 operational taxonomic units (OTUs) at 97% similarity were identified in this study (Electronic Supplementary Material: Table S1). The sequence number of each sample ranged from 59,942 to 60,139, from which 246–707 OTUs were recognized. All Good’s coverages were larger than 99%, indicating that the sequences adequately represented the diversity of microbial populations in the samples. However, no obvious correlations were found among different stations or water masses to all the community factors, including both richness (Chao and Ace) and diversity (Shannon and Simp) indices (Electronic Supplementary Material: Figure S1). This is different from the resutls in the year of 2012 [16], when diversity showed significant differences in different water masses.
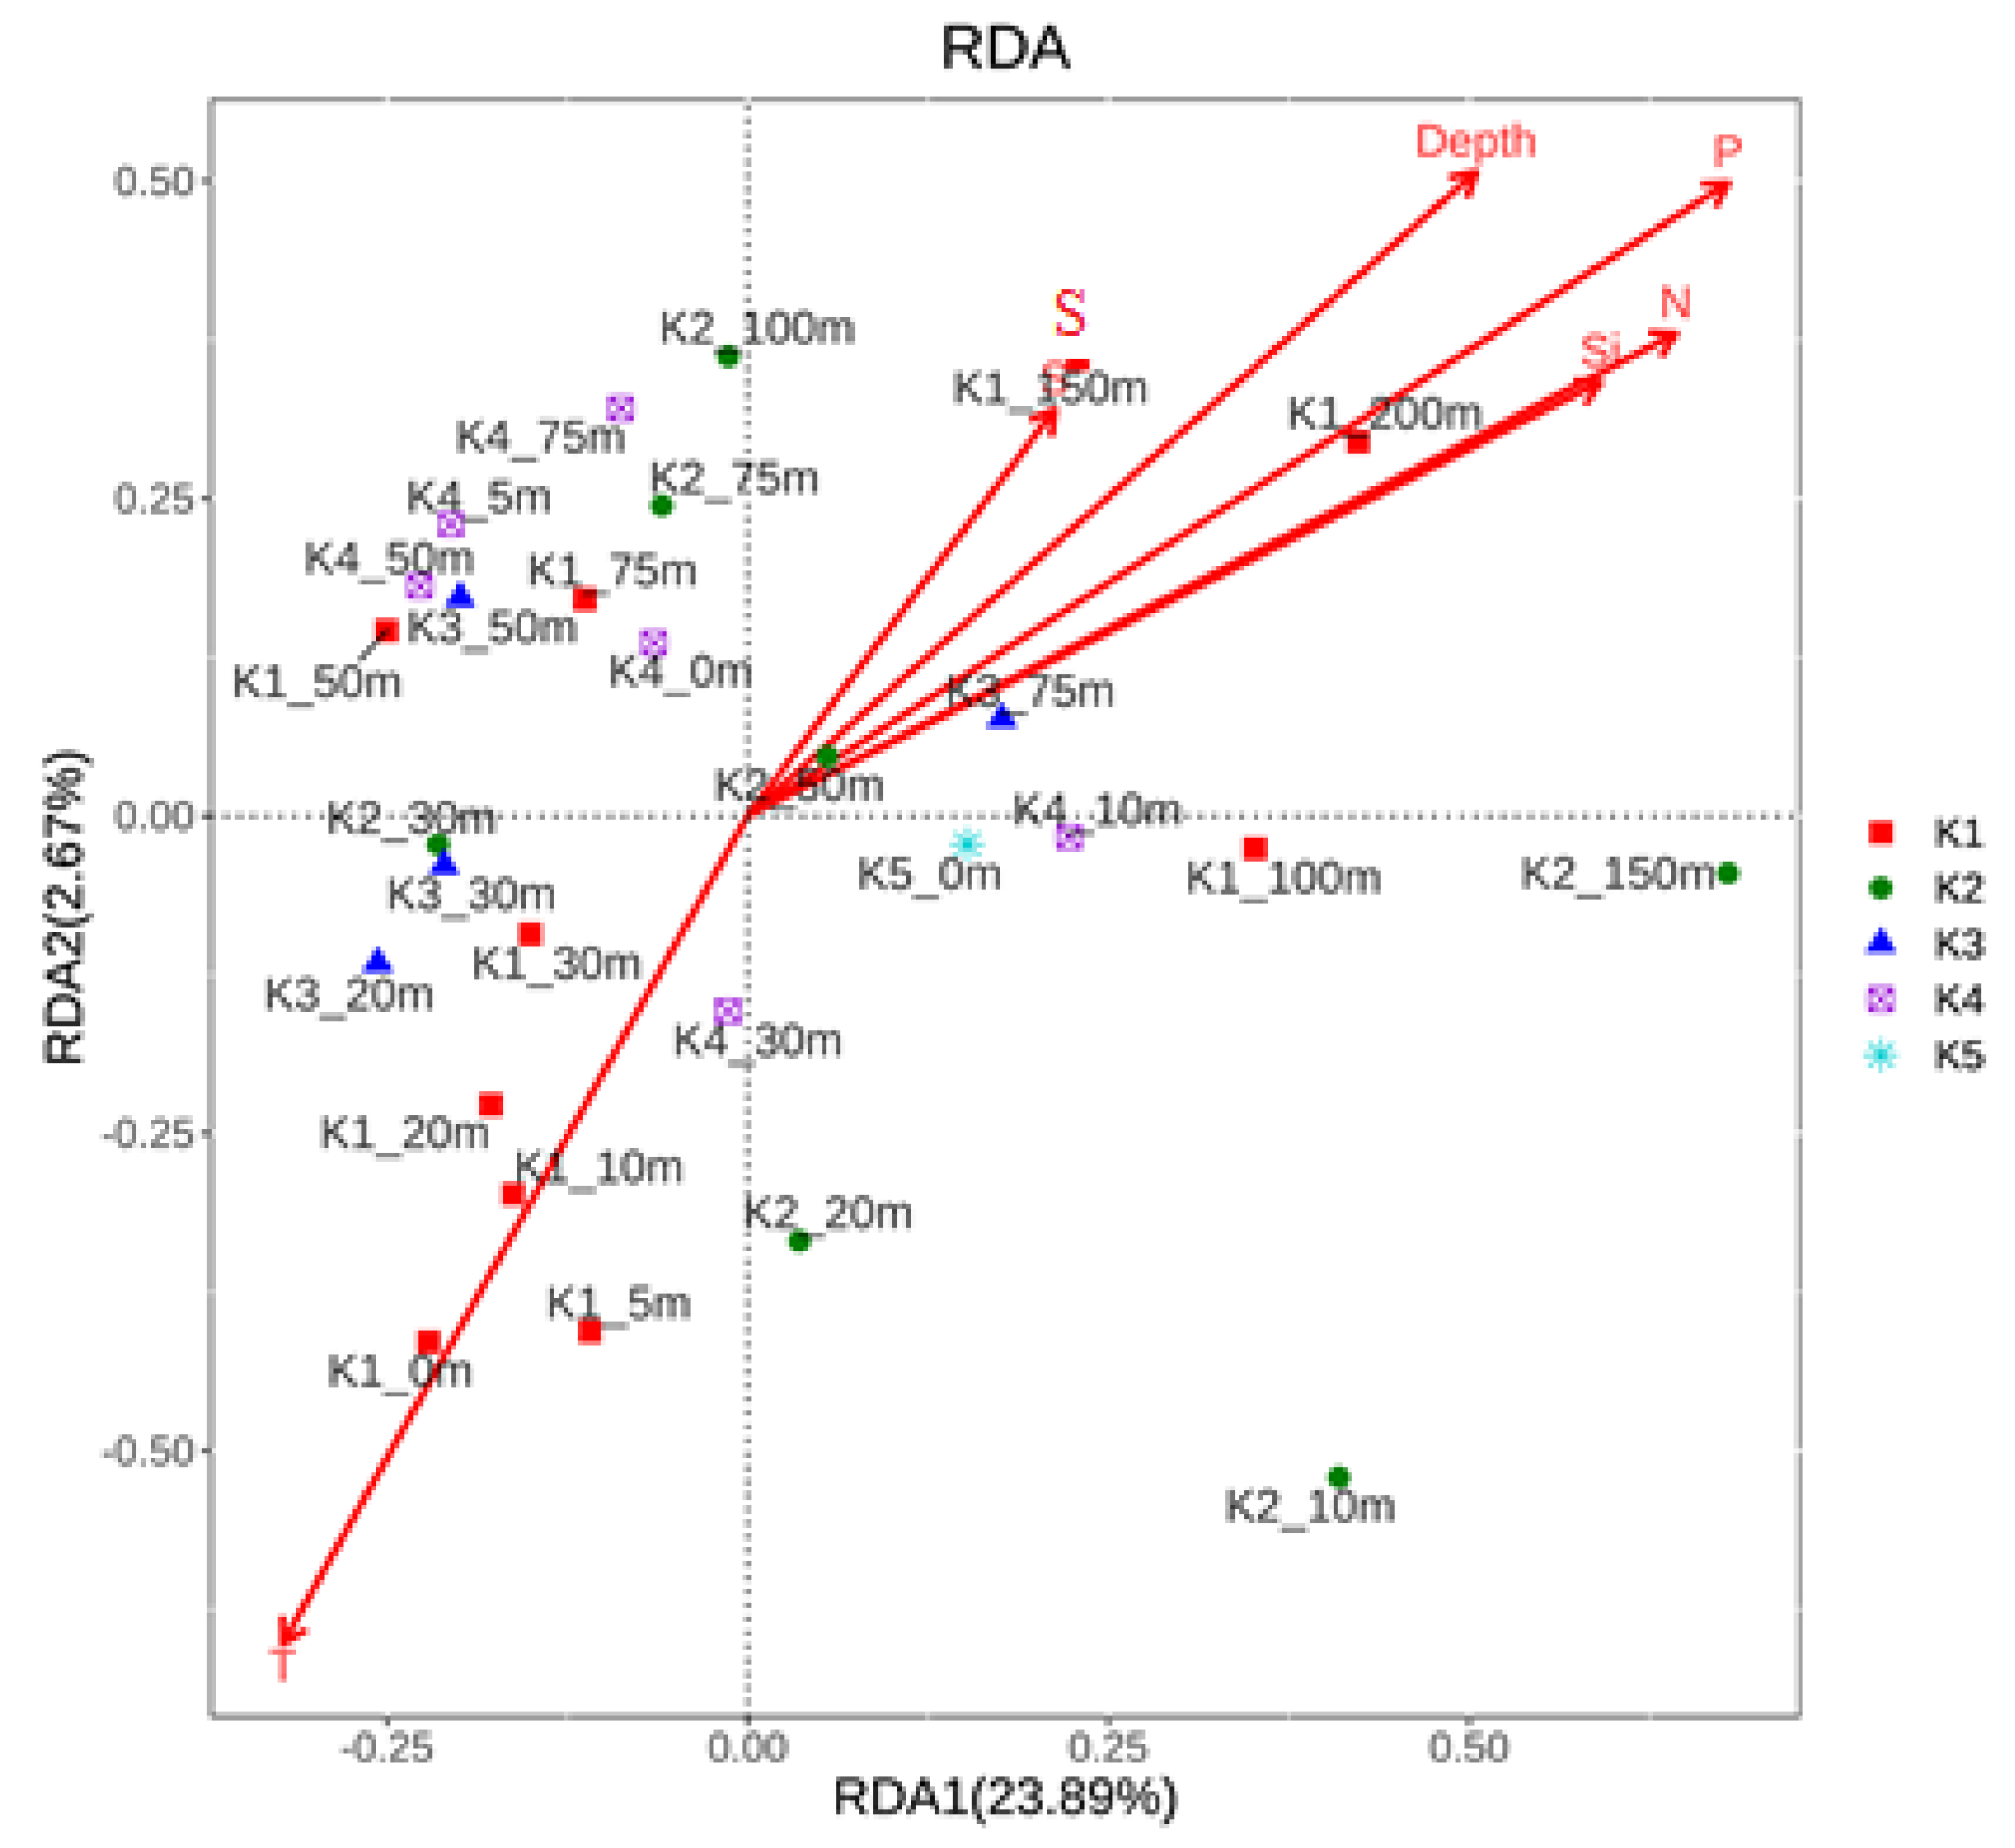
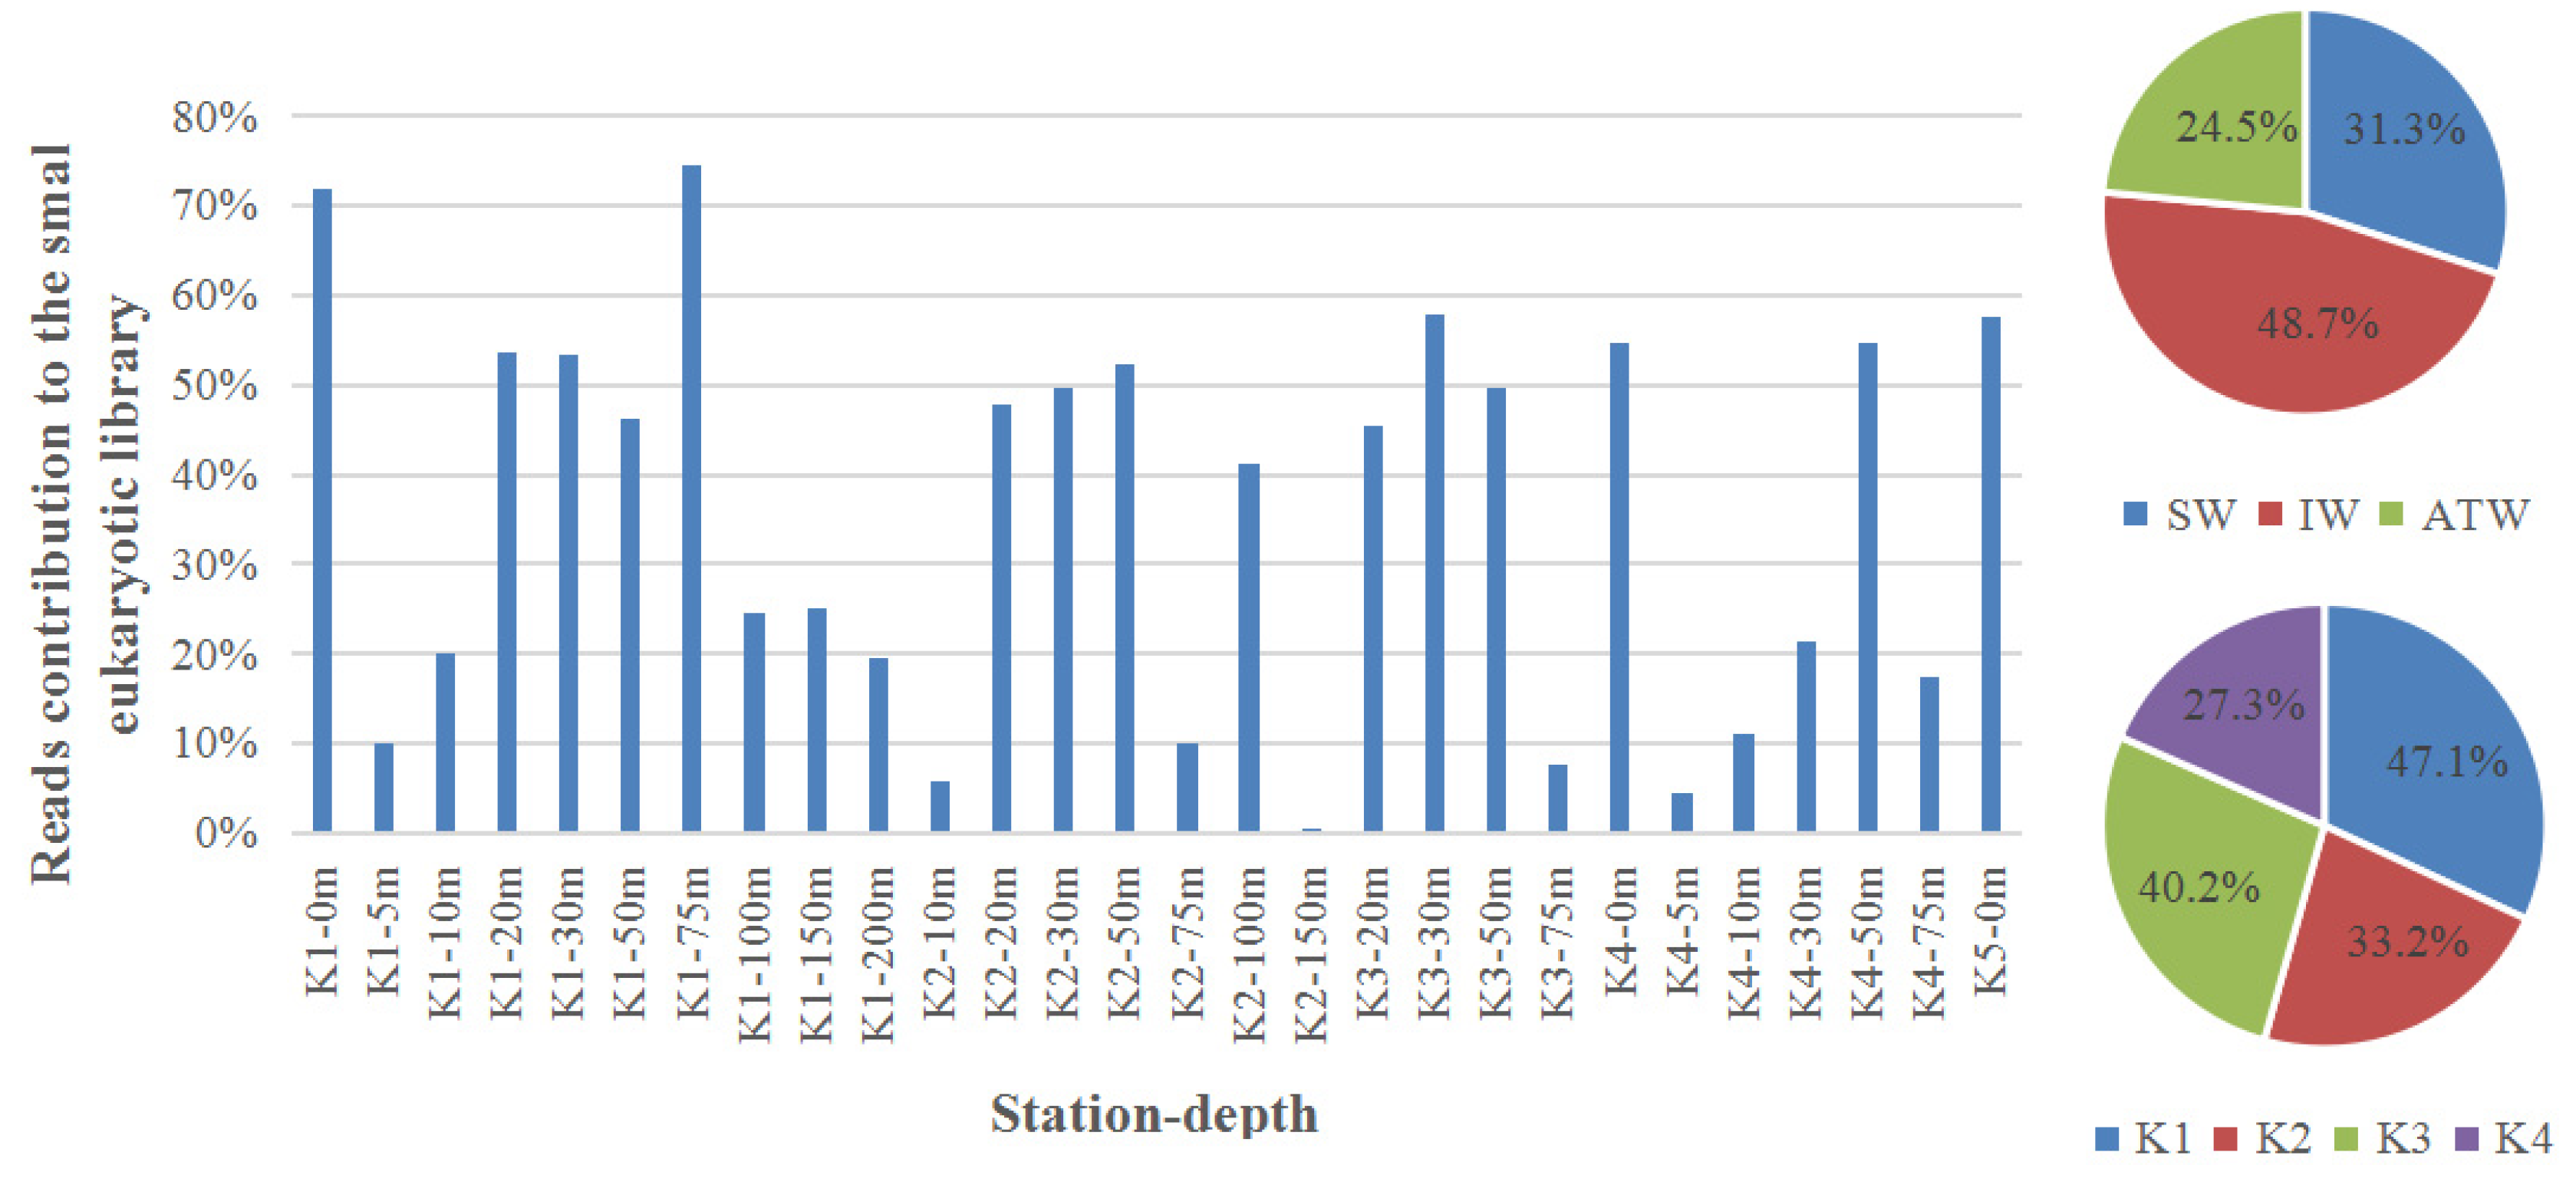
Both types of water mass and nutrients in water mass can shape the microbial community. The microbial distribution is regarded to be correlated with water mass because their movements are primarily determined by passive lateral advection and vertical mixing in the water column [32,33]. Temperature, macronutrients, and other abiotic factors affect the community structure [16,17,20]. However, the enviromental factors only accounted for 29.67% to the composition of small eukaryotic community in 2013. The enviromental factors only had distinct effects on the community at station K1 (Figure 3). Comparatively, the physicochemical factors accounted for 66.96% of the total relationships in 2012, with different effects on community at different water masses [16]. This difference was probably due to the prevalence of Poterioochromonas malhamensis in 2013. P. malhamensis took account 0.2%~74.6% of the totall reads in the small eukaryotic library, with an average of 36.3%, and even higher than 70% at 0 and 75 m of station K1 (Figure 4). It is the first time detecting P. malhamensis, a freshwater mixotrophic chrysophyte (ca. 8 μm; [34]) thatdominated the small eukaryotic community in a summer in Kongsfjorden. In order to make sure its existence in Kongsfjorden, a sea water environment, both HPLC analysis of photosynthetic pigments and microscopic observation were used. Fucoxanthin was the most abundant pigment (average of 12.49 μg L−1) in our study area. This indicates there were large amount of diatoms and/or P. malhamensis [34,35,36]. However, “However, diatoms (<1% in relative DNA abundance) were rarely observed by the microscopy (biomass of 0–1.28 μgC/L). This confirmed there were high densities of P. malhamensis in Kongsfjorden”.
3.3. Possible Reasons for the Prevalence of P. malhamensis
There is no significant differences (p > 0.5) among the contributions of P. malhamensis to the totall reads in the small eukaryotic library at different water depths, with maximum relative abundance of 47.1% and 48.7% at station K1 and IW (Figure 3). The contributions had no obvious correlations to all the environmental factors, including temperature, salinity, nitrogen, phosphate and silicate (p > 0.5). As freshwater phylotype, P. malhamensis undoubtedly entered Kongsfjorden via runoff from glacial melt. Although whether this species was alive in Kongsfjorden was not revealed, this species may well adapt to the marine environment because it was distributed in the entire fjord and had negative impact on other microbes. Mixotrophy is thought to be the main reason for the prevalence of P. malhamensis. Phagotrophy is considerably more common than phototrophy at all times in P. malhamensis [34]. P. malhamensis could ingest and digest bacteria, pico-, nano-, and micro-planktons, including cyanobacteria, diatoms, chrysomonads, and green algae [34]. Bacteria were abundant in Kongsfjorden, with an integrated biomass of 2000 mg m−2 in the whole water column in July, which was considerably greater than the biomass of autotrophic flagellates and heterotrophic flagellates [1]. However, such was not the case in the present work. The biomass of bacteria in the upper 50 m of the water column (0–6.73 μg L−1) was approximately 5–30 times lower than in 2005 (3.87–33.47 μg L−1) (own unpublished data) and 2006 (47.8–178.2 μg L−1; [16]). Consequently, bacteria and diatoms, as well as other small microplankton, likely provided sufficient food for P. malhamensis in the summer of 2013. Mixotrophy enhanced the transfer of biomass to large-sized classes further up the food web, which resulted in an approximately three-fold increase in organism size and approximately 35% increase in sinking carbon flux [37]. It is interesting that salinity has no obvious effects on distribution of this freshwater algae. Alghough no obvious changes happened to salinity between year 2012 and 2013, great differences were shown between the same maronutrient. So, the nutrient structure has changed a lot although little differences were shown only from data themselves. Nutrients is the fundation of an ecosystem, so, it means a potential change of ecological enviroment, which will ultimately change the whole marine ecosystem. However, we are not sure the prevalence of P. malhamensis, a freshwater-originating phylotype, was only one episode or a constant occurrence. So, we need a long-term monitoring. We speculate that such exceptions will usually happen in the future, so it potentially indicates an obvious ecological change in the Kongsjforden.
Supplementary Materials
The following are available online at https://www.mdpi.com/article/10.3390/w13152129/s1. Figure S1: Physicochemical factors in Kongsfjorden of 2013; Table S1: Summary information for pyrosequencing data from the 31 samples in Kongsfjorden of 2013.
Author Contributions
F.Z. wrote the paper; Y.T. provide the data and fund; J.H. provide the data and fund to analyze samples. All authors have read and agreed to the published version of the manuscript.
Funding
This work was supported by the National Natural Science Foundation of China (41206189), Natural Science Foundation of Shanghai (16ZR1439800), and Laboratory of Marine Ecosystem and Biogeochemistry, MNR (LMEB200902).
Institutional Review Board Statement
All the data has been submitted to our institute and have been checked by them.
Data Availability Statement
Part of data are supplied in the electronic supplementary materials and someothers are deposited in the in the National Center for Biotechnology Information Sequence Read Archives (SRA) under BioProject ID PRJNA320788.
Acknowledgments
The data were issued by the Data-sharing Platform of Polar Science (http://www.chinare.org.cn accessed on 12 March 2020) maintained by Polar Research Institute of China (PRIC) and Chinese National Arctic & Antarctic Data Center (CN-NADC). Thank Haiyan Jin, Zhongqiang Ji and Yanpei Zhuang, as well as other colleagues in the Second Institute of Oceanography, MNR for providing the nutrients and chlorophyll a data and data analysis for HPLC.
Conflicts of Interest
The authors declare no conflict of interest.
References
- Rokkan Iversen, K.; Seuthe, L. Seasonal microbial processes in a high-latitude fjord (Kongsfjorden, Svalbard): I. Heterotrophic bacteria, picoplankton and nanoflagellates. Polar. Biol. 2011, 34, 731–749. [Google Scholar] [CrossRef] [Green Version]
- Whitman, W.B.; Coleman, D.C.; Wiebe, W.J. Prokaryotesethe unseen majority. Proc. Natl. Acad. Sci. USA 1998, 95, 6578e6583. [Google Scholar] [CrossRef] [Green Version]
- Lovejoy, C.; Vincent, W.F.; Bonilla, S.; Roy, S.; Martineau, M.-J.; Terrado, R. Distribution, phylogeny and growth of cold-adapted picoprasinophytes in arctic seas. J. Phycol. 2007, 43, 78–89. [Google Scholar] [CrossRef]
- Vaulot, D.; Eikrem, W.; Viprey, M.; Moreau, H. The diversity of small eukaryotic phytoplankton (≤3 μm) in marine ecosystems. FEMS Microbiol. Rev. 2008, 32, 795–820. [Google Scholar] [CrossRef] [Green Version]
- Piwosz, K.; Spich, K.; Całkiewicz, J.; Weydmann, A.; Kubiszyn, A.M.; Wiktor, J.M. Distribution of small phytoflagellates along an Arctic fjord transect. Environ. Microbiol. 2015, 17, 2393–2406. [Google Scholar] [CrossRef]
- Zubkov, M.V.; Tarran, G.A. High bacterivory by the smallest phytoplankton in the North Atlantic Ocean. Nature 2008, 455, 224–226. [Google Scholar] [CrossRef] [PubMed]
- Loeng, H. Features of the physical oceanographic conditions of the Barents Sea. Polar Res. 1991, 10, 5–18. [Google Scholar] [CrossRef] [Green Version]
- Hop, H.; Pearson, T.; Hegseth, E.N. The marine ecosystem of Kongsfjorden, Svalbard. Polar Res. 2002, 21, 167–208. [Google Scholar] [CrossRef]
- Svendsen, H.; Beszczynska-Møller, A.; Hagen, J.O.; Lefauconnier, B.; Tverberg, V.; Gerland, S. The physical environment of Kongsfjorden–Krossfjorden, an Arctic fjord system in Svalbard. Polar Res. 2002, 21, 133–166. [Google Scholar]
- Walczowski, W.; Piechura, J. Influence of the West Spitsbergen current on the local climate. Int. J. Climatol. 2011, 31, 1088–1093. [Google Scholar] [CrossRef]
- Bourriquen, M.; Mercier, D.; Baltzer, A.; Fournier, J.; Costa, S.; Roussel, E. Paraglacial coasts responses to glacier retreat and associated shifts in river floodplains over decadal timescales (1966–2016), Kongsfjorden, Svalbard. Land. Degrad. Dev. 2018, 29, 1–13. [Google Scholar] [CrossRef]
- Jankowska, K.; Włodarska-Kowalczuk, M.; Wieczorek, P. Abundance and biomass of bacteria in two Arctic glacial fjords. Pol. Polar Res. 2005, 26, 77–84. [Google Scholar]
- Keck, A.; Wiktor, J.; Hapter, R.; Nilsen, R. Phytoplankton assemblages related to physical gradients in an arctic, glacier-fed fjord in summer. ICES J. Mar. Sci. 2001, 56, 203–214. [Google Scholar] [CrossRef]
- Luo, W.; Li, H.; Cai, M.; He, J. Diversity of microbial eukaryotes in Kongsfjorden, Svalbard. Hydrobiologia 2009, 636, 233–248. [Google Scholar] [CrossRef]
- Piwosz, K.W.; Walkuz, R.; Hapter, P.; Wieczorek, H.; Wiktor, H.J. Comparison of productivity and phytoplankton in a warm (Kongsfjorden) and a cold (Hornsund). Polar Biol. 2009, 32, 549–559. [Google Scholar] [CrossRef]
- Zhang, F.; Cao, S.; Gao, Y.; He, J. Distribution and environmental correlations of picoeukaryotes in an Arctic fjord (Kongsfjorden, Svalbard) during the summer. Polar Res. 2019, 38, 3390–3401. [Google Scholar] [CrossRef]
- Zhang, F.; Lin, L.; Gao, Y.; Cao, S.; He, J. Ecophysiology of picophytoplankton in different water masses of the northern Bering Sea. Polar Biol. 2016, 39, 1381–1397. [Google Scholar] [CrossRef]
- Schloss, P.D.; Westcott, S.L.; Ryabin, T.; Hall, J.R.; Hartmann, M.; Hollister, E.B. Introducing mothur: Open-source, platform-independent, community-supported software for describing and comparing microbial communities. Appl. Environ. Microbiol. 2009, 75, 7537–7541. [Google Scholar] [CrossRef] [Green Version]
- Pruesse, E.; Quast, C.; Knittel, K.; Fuchs, B.M.; Ludwig, W.; Peplies, J.; Glöckner, F.O. SILVA: A comprehensive online resource for quality checked and aligned ribosomal RNA sequence data compatible with ARB. Nucleic Acids Res. 2007, 35, 7188–7196. [Google Scholar] [CrossRef] [Green Version]
- Zhang, F.; He, J.; Lin, L.; Jin, H. Dominance of picophytoplankton in the newly open surface water of the central Arctic Ocean. Polar. Biol. 2015, 38, 1081–1089. [Google Scholar] [CrossRef]
- van Heukelem, L.; Thomas, C.S. Computer-assisted high-performance liquid chromatography method development with applications to the isolation and analysis of phytoplankton pigments. J. Chromatogr. A 2001, 910, 31–49. [Google Scholar] [CrossRef]
- Mackey, M.D.; Mackey, D.J.; Higgins, H.W.; Wright, S.W. CHEMTAX-a program for estimating class abundances from chemical markers: Application to HPLC measurements of phytoplankton. Mar. Ecol. Prog. Ser. 1996, 144, 265–283. [Google Scholar] [CrossRef] [Green Version]
- Wright, S.W.; Ishikawa, A.; Marchant, H.J.; Davidson, A.T. Composition and significance of picophytoplankton in Antarctic waters. Polar. Biol. 2009, 32, 797–808. [Google Scholar] [CrossRef]
- Porter, K.G.; Feig, Y.S. The use of DAPI foridentifying and counting aquatic microflora. Limnol. Oceanogr. 1980, 25, 943–948. [Google Scholar] [CrossRef]
- Sherr, E.B.; Sherr, B.F.; Wheeler, P.A.; Thompson, K. Temporal and spatial variation in stocks of autotrophic and heterotrophic microbes in the upper water column of the central Arctic Ocean. Deep-Sea Res. I 2003, 50, 557–571. [Google Scholar] [CrossRef]
- Sherr, E.B.; Sherr, B.F.; Fesseden, L. Heterotrophic protists in the central Arctic Ocean. Deep Sea Res. II 1997, 44, 1665–1682. [Google Scholar] [CrossRef]
- Menden-Deuer, S.; Lessard, E.J. Carbon to volume relationships for dinoflagellates, diatoms, and other protist plankton. Limnol. Oceanogr. 2000, 45, 569–579. [Google Scholar] [CrossRef] [Green Version]
- Leps, J.; Smilauer, P. Multivariate Analysis of Ecological Data Using CANOCO; Cambridge University Press: Cambridge, UK, 2003. [Google Scholar]
- Cottier, F.; Tverberg, V.; Inall, M.E.; Svendsen, H.; Nilsen, F.; Griffiths, C. Water mass modification in an Arctic fjord through cross-shelf exchange: The seasonal hydrography of Kongsfjorden, Svalbard. J. Geogr. Res. Oceans 110 2005, C12005. [Google Scholar] [CrossRef] [Green Version]
- Feng, M.; Zhang, W.; Xiao, T. Spatial and temporal distribution of tintinnid (Ciliophora: Tintinnida) communities in Kongsfjorden, Svalbard (Arctic), during summer. Polar. Biol. 2014, 37, 291–296. [Google Scholar] [CrossRef]
- Piquet, A.T.; Van de Poll, W.H.; Visser, R.J.W.; Wiencke, C.; Bolhuis, H.; Buma, A.G.J. Springtime phytoplankton dynamics in Arctic Krossfjorden and Kongsfjorden (Spitsbergen) as a function of glacier proximity. Biogeosciences 2014, 11, 2263–2279. [Google Scholar] [CrossRef] [Green Version]
- Hamilton, A.K.; Lovejoy, C.; Galand, P.E.; Ingram, R.G. Water masses and biogeography of picoeukaryote assemblages in a cold hydrographically complex system. Limnol. Oceanogr. 2008, 53, 922–935. [Google Scholar] [CrossRef] [Green Version]
- Zhang, F.; Ma, Y.; Lin, L.; Zhang, J.; He, J. Hydrophysical correlation and water mass indication of optical physiological parameters of picophytoplankton in Prydz Bay during autumn 2008. J. Microbiol. Meth. 2012, 91, 559–565. [Google Scholar] [CrossRef] [PubMed]
- Zhang, X.; Watanabe, M.M.; Inouye, I. Light and electron microscopy of grazing by Poterioochromonas malhamensis (Chrysophyceae) on a range of phytoplankton taxa. J. Phycol. 1996, 32, 37–46. [Google Scholar] [CrossRef]
- Withers, N.W.; Fiksdah, A.; Tuttle, R.C.; Liaaen-Jensen, S. Carotenoids of the chrysophyceae. Comp. Biochem. Physiol. 1981, 68, 345–349. [Google Scholar] [CrossRef]
- Jeffrey, S.W.; Vesk, M. Introduction to marine phytoplankton and their pigment signatures. In Phytoplankton Pigments in Oceanography: Guidelines to Modern Methods; Jeffrey, S.W., Mantoura, R.F.C., Wright, S.W., Eds.; UNESCO: Paris, France, 2005; pp. 37–84. [Google Scholar]
- Rodriguez, H.M.; Robertson, A.D.; Gregoret, L.M. Native state EX2 and EX1 hydrogen exchange of Escherichia coli CspA, a small β-sheet protein. Biochemistry 2002, 41, 2140–2148. [Google Scholar] [CrossRef]
Figure 1.
Sampling sites in Kongsfjorden of Svalbard: K1 to K5 were the five sampling stations from outer to inner fjord. Created by Ocean Data View (ODV 4.5, http://odv.awi.de accessed on 24 May 2016), and modified by Painter Windows Operating System in-built Toolkit of image editor (adopted from Zhang et al. [16], Reproduced with permission from [Zhang et al., 2019].).

Figure 2.
Composition of water masses at the five stations in the Kongsfjorden: SW: Surface Water, IW: Intermediate Water, and TAW: Transformed Atlantic Water.
Figure 2.
Composition of water masses at the five stations in the Kongsfjorden: SW: Surface Water, IW: Intermediate Water, and TAW: Transformed Atlantic Water.

Figure 3.
Relationships of small eukaryote community structure at different sampling sites with physiochemical factors in an ordination diagram with the first two axes of the Redundant Analysis (RDA). Red arrows with different lengths denote relative correlations of different independent variables with the community structure factors.

Figure 4.
Reads of contributions to the small eukaryotic library of P. malhamensis at different sites in the Kongsfjorden: SW: Surface Water, IW: Intermediate Water, and TAW: Transformed Atlantic Water. K1–K4 stands for four sampling stations from outer to inner fjord.: The upper pie presents the average propertions of P. malhamensis at different water masses; and the lower pie presents the average propertions of P. malhamensis at different stations.

Publisher’s Note: MDPI stays neutral with regard to jurisdictional claims in published maps and institutional affiliations. |
© 2021 by the authors. Licensee MDPI, Basel, Switzerland. This article is an open access article distributed under the terms and conditions of the Creative Commons Attribution (CC BY) license (https://creativecommons.org/licenses/by/4.0/).
Share and Cite
MDPI and ACS Style
Zhang, F.; Tian, Y.; He, J. Occurrence of the Freshwater Chrysophyte Poterioochromonas malhamensis in a High Arctic Marine Ecosystem. Water 2021, 13, 2129. https://doi.org/10.3390/w13152129
AMA Style
Zhang F, Tian Y, He J. Occurrence of the Freshwater Chrysophyte Poterioochromonas malhamensis in a High Arctic Marine Ecosystem. Water. 2021; 13(15):2129. https://doi.org/10.3390/w13152129
Chicago/Turabian StyleZhang, Fang, Yongjun Tian, and Jianfeng He. 2021. "Occurrence of the Freshwater Chrysophyte Poterioochromonas malhamensis in a High Arctic Marine Ecosystem" Water 13, no. 15: 2129. https://doi.org/10.3390/w13152129
Note that from the first issue of 2016, this journal uses article numbers instead of page numbers. See further details here.