
Mapping of Coastline Changes in Athens Riviera over the Past 76 Year’s Measurements


1
Department of Geology, University of Patras, 26504 Patras, Greece
2
UK Centre for Ecology & Hydrology, Wallingford OX10 8BB, UK
3
Faculty of Finance and Statistics, University of Piraeus, Lampraki 126 Str., 18534 Piraeus, Greece
*
Author to whom correspondence should be addressed.
Water 2021, 13(15), 2135; https://doi.org/10.3390/w13152135
Submission received: 10 July 2021
/
Revised: 27 July 2021
/
Accepted: 31 July 2021
/
Published: 3 August 2021
(This article belongs to the Special Issue Anthropogenic and Geoenvironmental Impacts on the Hydrosphere: Diagnosis, Monitoring, Assessment, and Sustainable Management)
Abstract
:Mapping of coastline changes assists in coastal development and monitoring. Athens Riviera, located in the southwestern coastal zone in Attica in central Greece, has undergone major and radical changes generated by human interference during the last decades. The aim of this paper is to map record and measure the coastline changes in Athens Riviera over the past 76 years. Aerial photographs and satellite images from 1945 to 2021 as well as geographic information system (GIS) techniques were used to depict the spatial and temporal variations of the coastline. The results show that 60% of the total length of the coastline is artificial coast, while 29% is rocky coast and 12% beach. The study of seven subareas showed that human interventions caused significant coastline changes in Faliro Bay, Alimos and Glyfada. The adjacent coastal regions to Athens metropolitan area illustrate the highest modifications in the coastline. The main changes in the coastlines are recorded from 1960 to 1987, while the rate of changes in coastline slowed down from 1987 to 2021. The total changes in the coastline of Athens Riviera demonstrate that, during the past 76 years, the coastline was enhanced by 40% while land reclaimed to the sea area approaches 2.67 km2. The applied method is effective and rapid and may utilize in the coastal monitoring and management.
1. Introduction
Coastlines are areas of utmost importance because they host multiple activities worldwide [1]. Today, numerous countries hold a large amount of population along their coastlines. More than 600 million people, approximately 10% of the world’s population, live in coastal areas that are less than 10 m above sea level (m.a.s.l.). Additionally, 2.4 billion people, around 40% of the world’s population live within 100 km of the coastline [2].
The features of a coastline form through the continuous interaction of the geosphere, the hydrosphere and the atmosphere. Dolan et al. [3] defined that coastline is the physical interface of land and water. Moreover, the position of the coastline changes frequently throughout time, because of several morphodynamic parameters such as sediment movement in the littoral zone and the dynamic nature of water levels at the coastal boundary (e.g., currents, tides, waves, etc.) [4].
The coastline locations, as well as its boundary changes are of essential significance to coastal studies [5]. Thus, analysis of coastline information is needed in several scientific works, such as to assess sea-level changes [6,7,8,9], for coastal zone protection [10], to estimate coastal development [11], to assist in coastal monitoring [12], as well as in coastal evolution [13,14,15], and to assess coastal hazards [16,17,18,19].
Coastline changes are phenomena, which vary in magnitude, speed and duration. In the last decades, earth observation (EO) data such as aerial photography, satellite imagery, and GPS data have become integral means for the evaluation of shoreline changes over a long period of time. They have availability of temporal data at the same locations and are cost effective [20,21]. Moreover, geographical information systems (GIS) are excellent tools in the spatial analysis of various natural phenomena [22,23,24,25,26,27,28,29,30]. These current geospatial technologies have been proved to be a unique tool for environmental research because the mapping of the coastline is accurate and provides with multiple and up-to-date information.
More than 40% of the population of Greece lives in the metropolitan urban area of Athens, the capital. The plain of Athens has been extremely urbanized during the last seventy-five years and the environment has changed dramatically [31,32]. Apart from this, Athens’ southern coastal area, referred to as the Athens Riviera, has been subject to constant changes due to human interference during the same period of time. Its vicinity to the city of Athens is the cause of being affected by human activities. Human interventions caused the destruction of natural beaches and dunes as well as the drying up of wetlands and lagoons. These coastline changes affected the natural environment, caused significant ecological damage and increased the risk of flooding in several areas of the coastal zone of Athens Riviera [33,34]. On the other hand, climate changes and their impacts, such as sea level rise and the resulting coastal inundation, are potential hazards for coastal areas and communities. Coastline changes increase the vulnerability of the coastal population and ecosystems [19]. Thus the spatial monitoring of the coastline changes is a significant issue for the reduction of these vulnerabilities and the integrated coastal zone management.
In this work, an effort has been made to identify, justify and calculate the changes in the coastline of Athens Riviera from 1945 to 2021, as well as to recognize vulnerable coastal areas and to provide information for coastal management practices. Aerial photographs and satellite images have been used to measure the coastline changes due to human interference. While being extremely efficient, this methodology is rapid, reliable and economical. In one word, it is a useful tool for the recording and monitoring of the coastline changes.
2. Materials and Methods
2.1. Study Area
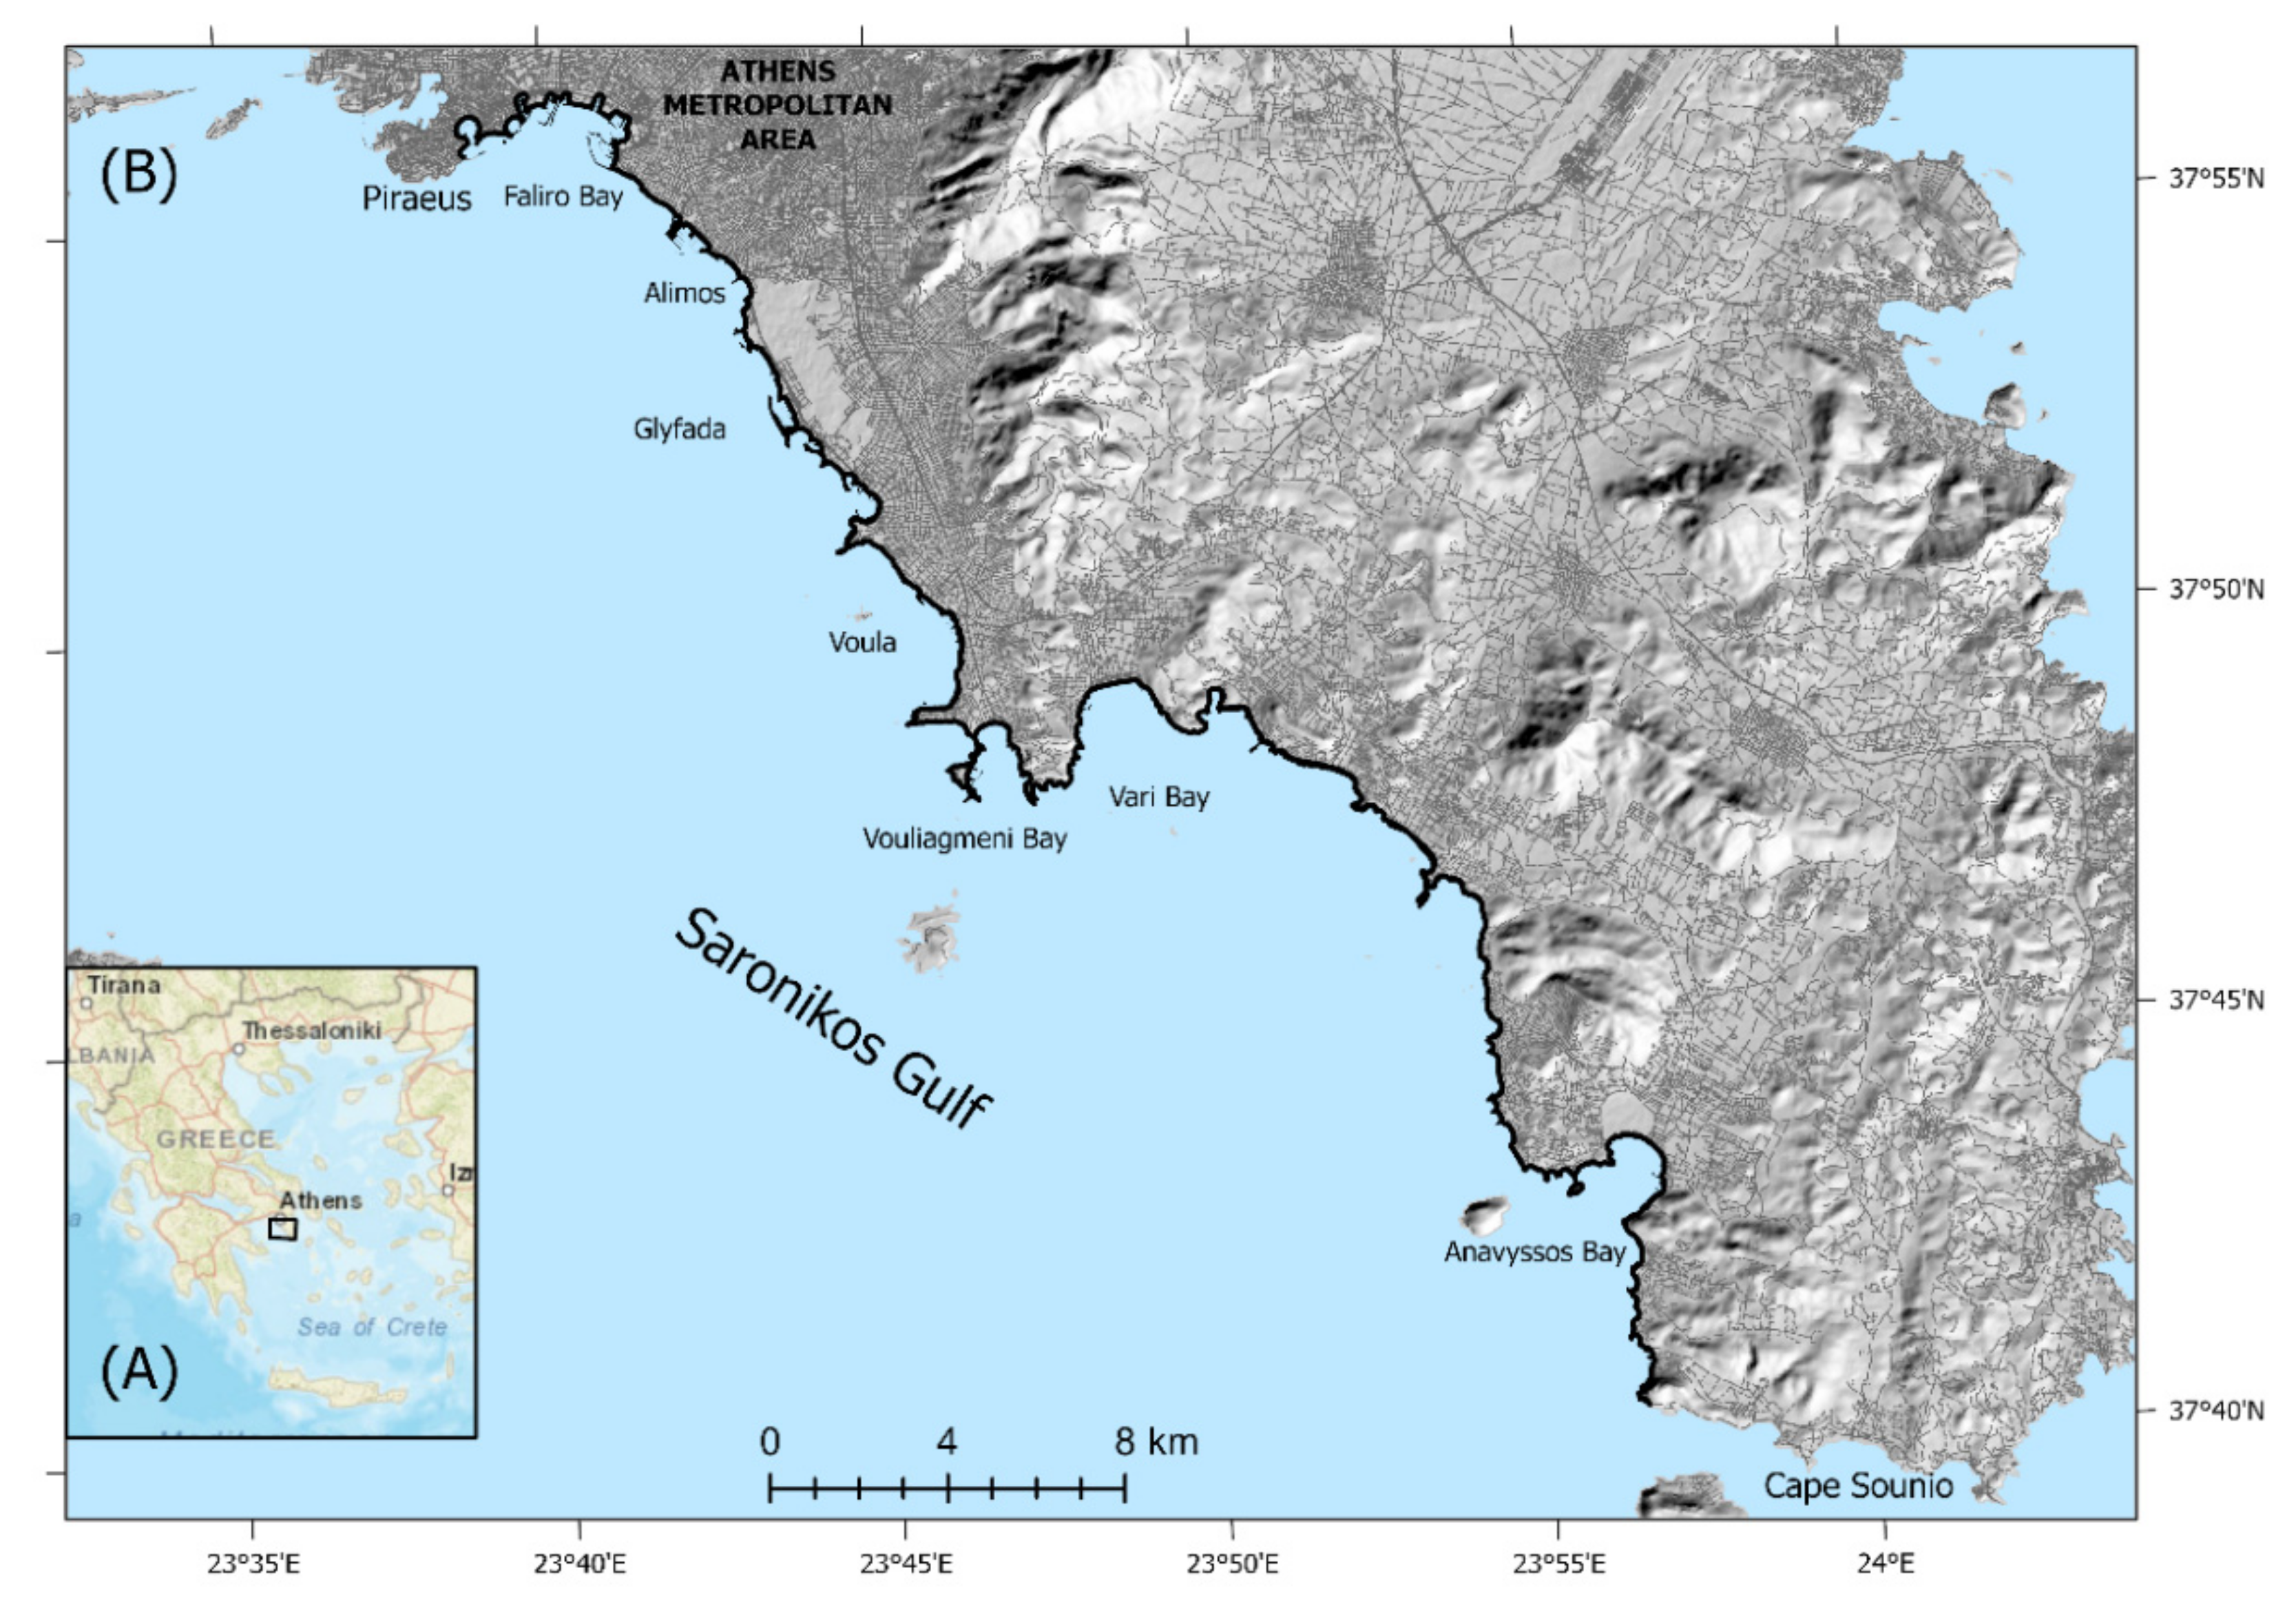
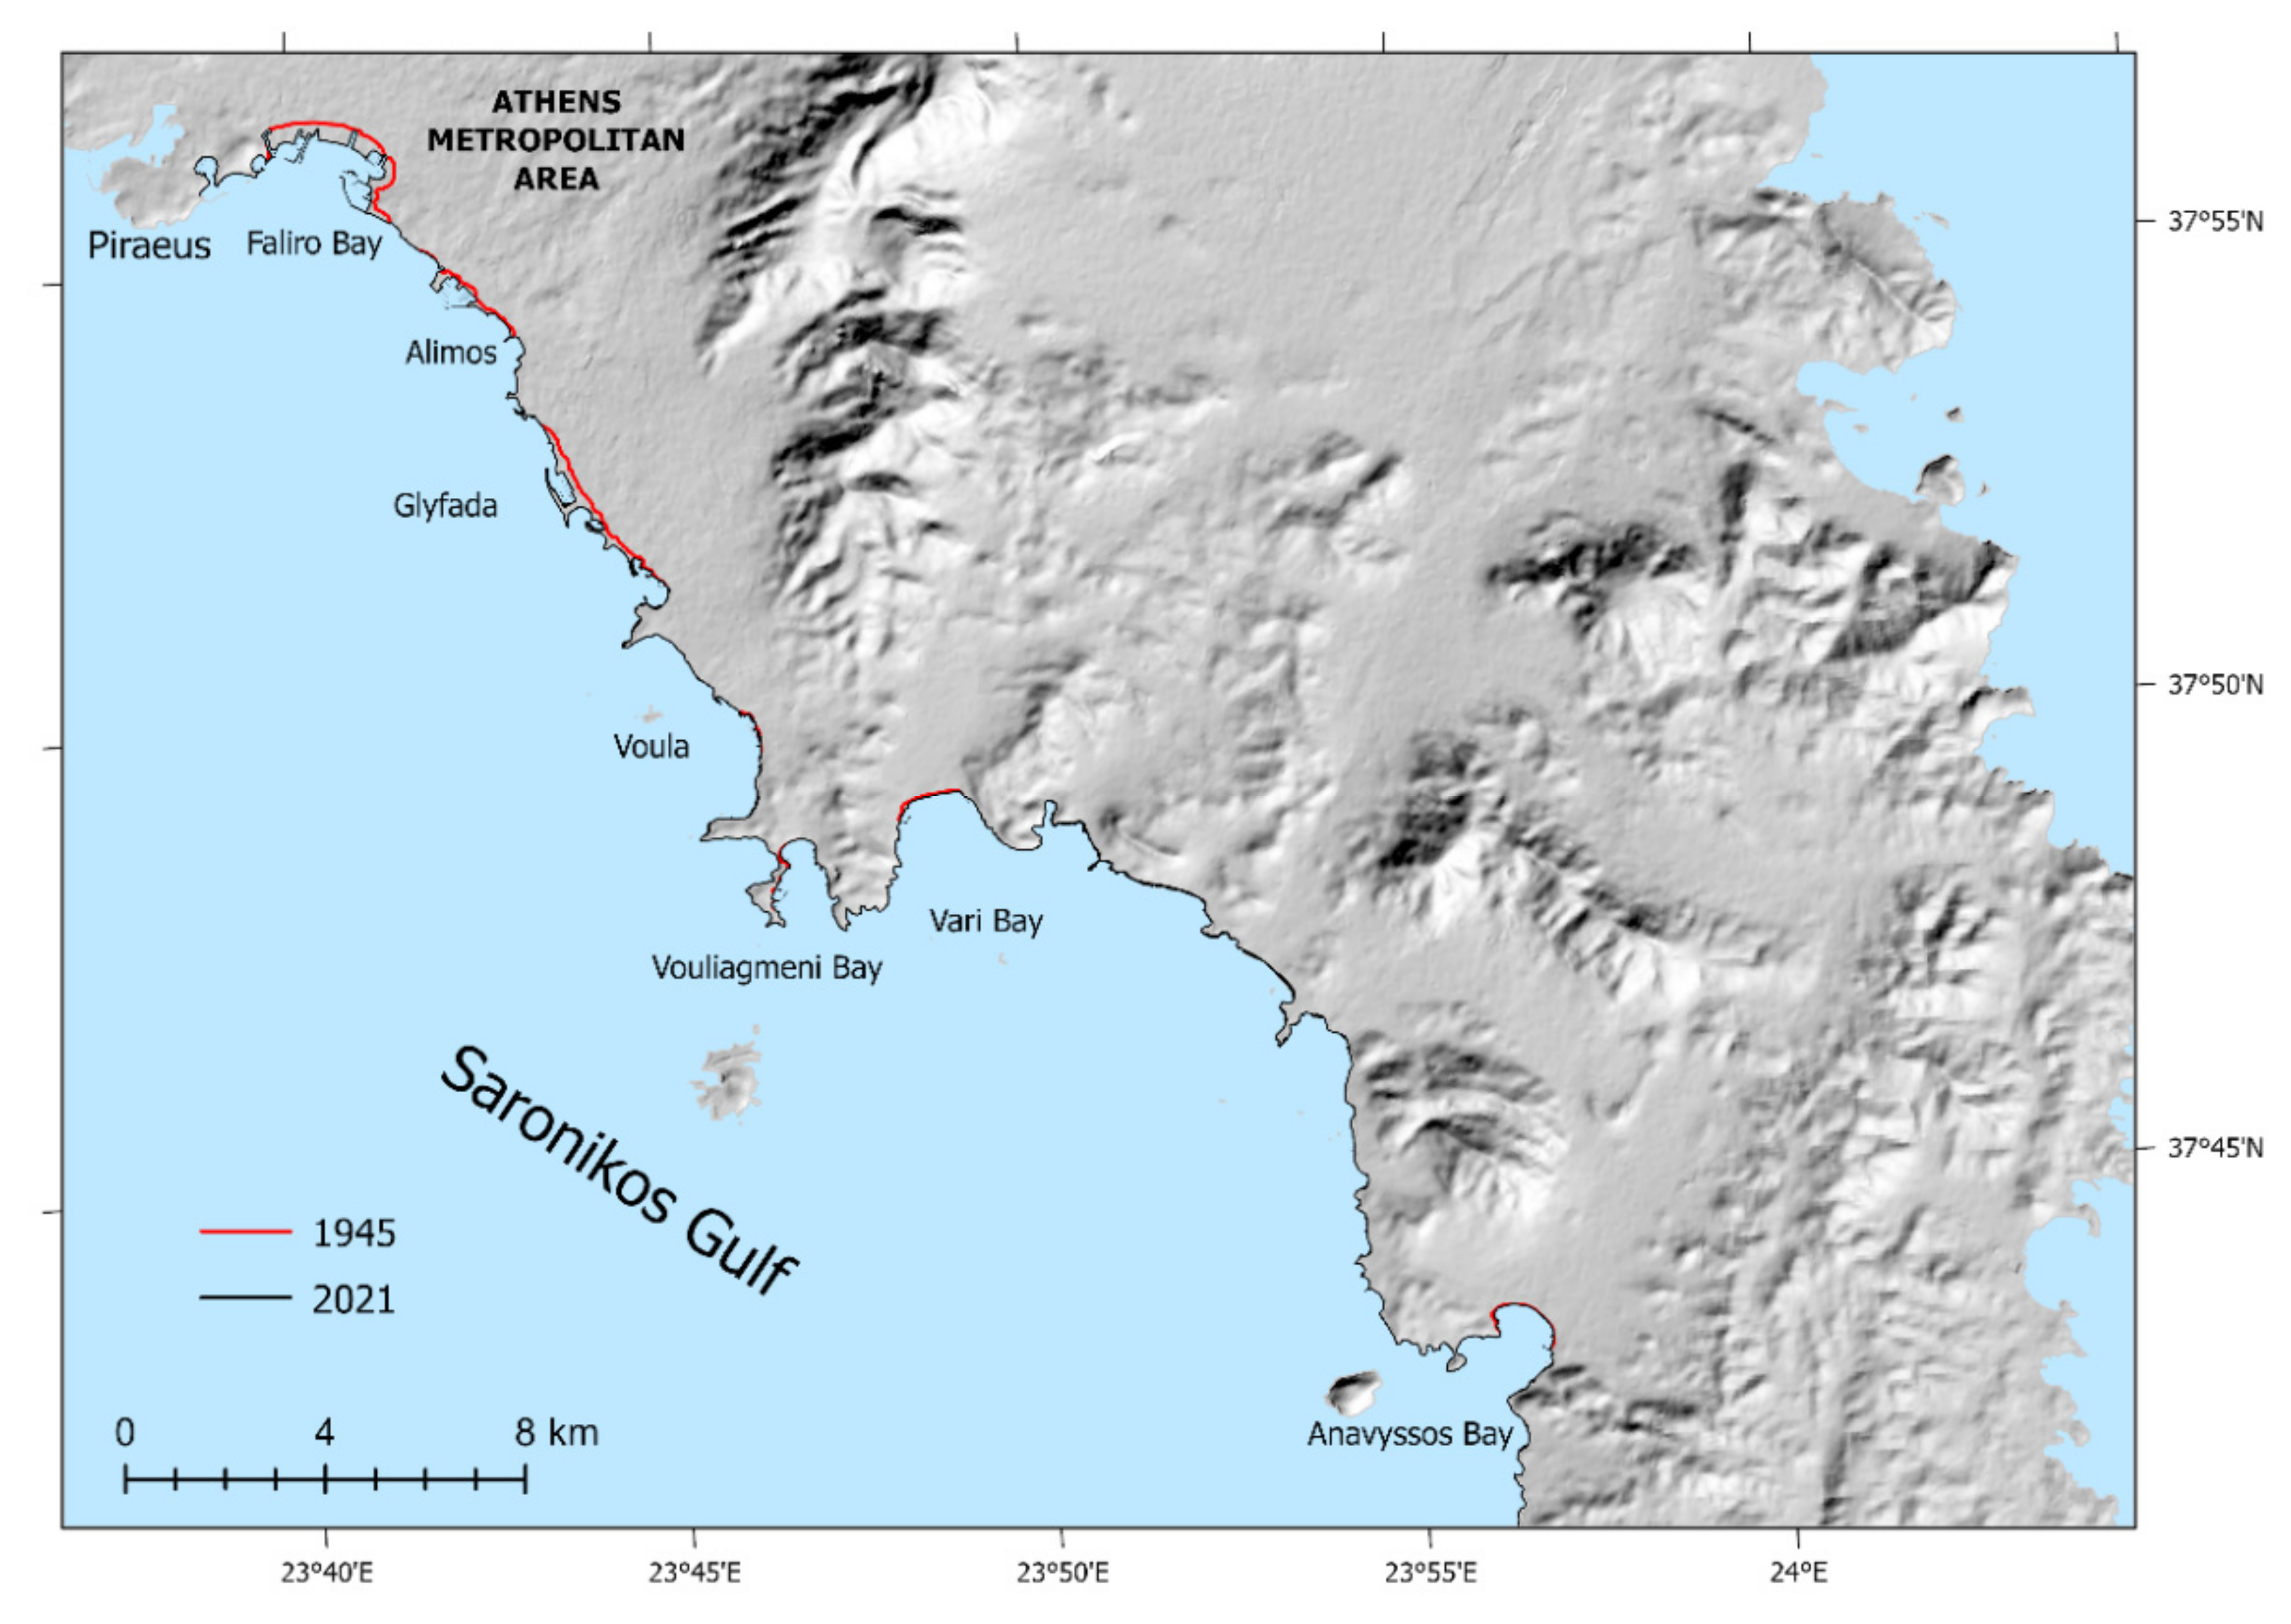
Athens Riviera is the coastal area in the southern suburbs of Athens metropolitan area, in central Greece (Figure 1A). It is located about 16 km from downtown Athens stretching from the city of Piraeus to the southernmost point of Attica, Cape Sounio. The study area is a part of Athens Riviera and is extended from the Faliro Bay up to the Anavyssos Bay (Figure 1B).
The coastal zone from Faliro Bay to Anavyssos Bay, during the last decades and especially after 1960, has undergone major and radical changes. The intense and anarchic construction, as well as the lack of planning in infrastructure projects led to the alteration of the natural environment and the degradation of the life of the inhabitants of the area [33]. The development of facilities for commercial and mainly tourist exploitation, along the coasts, have affected the southern areas, where there is more intense residential development of summer houses [31]. Natural changes have also been observed in the coastal zone, such as significant movements of sediments towards the shores, which are corrosive materials. Between 1971 and 1992, Attica was the most fire-stricken region of Greece in terms of surface. Thus, in some areas, the movement of sediments is due to the effects of fires in recent decades, both on forests and on lower and sparser vegetation [35].
The study area consists of hills and valleys, which create a complex but low relief with gentle slopes. The lowlands of the wider area are relatively limited with the exception of the plain of Athens. The study area includes the southwestern part of the Athens Basin and the bay of Faliro, in which Kifissos and Ilissos rivers flow. The main wide plains, included in the area, are Vari, Anavyssos, which are developed with general direction NE-SW. The drainage network is consisted of parallel streams of temporary flow; with general direction NE-SW. Artificial beaches characterize the coastal morphology of the area, similarly to other coastal areas of Attica. The substrate of area is formed mainly of Neocene and Quaternary deposits [34].
Athens Riviera has a Mediterranean climate. The mean annual temperature is of 18.5 °C, while the average annual precipitation reached about 368 mm for the years 1955 to 2015 [31].
2.2. Data
The aerial photographs employed were taken from 1945 and onwards because there were no available data before that year. Specifically, the aerial photographs dated from 1945 (scale 1:42,000), 1960 (scale 1:30,000), 1972 (scale 1:40,000), and 1987 (scale 1:35,000). The aerial photographs with variable spatial resolution were derived from Hellenic Geographic Military Service.
Two Landsat 7 TM satellite images have been used and its characteristics are: sensor: thematic mapper ETM+, spectral bands (μm): B1: 0.45–0.515 B2: 0.525–0.605 B3: 0.63–0.690 B4: 0.75–0.90 B5: 1.55–1.75 B6: 10.40–12.5 B7: 2.09–2.35 B8: 0.52–0.90 (panchromatic), spatial resolution: 30 m/(60 m for Band 6) (15 m for Band 8), radiometric resolution: 8 BIT PATH/ROW: 183/034, acquisition date: 16/05/2010 and 05/09/2010. Additionally a Sentinel-2A with a single multispectral instrument (MSI) sensor was used for the year 2021. The spectrum characteristics (central wavelength/bandwidth) are B1: 442.7/21, B2: 492.4/66, B3: 559.8 B4: 664.6/31, B5: 704.1/15, B6: 740.5/15, B7: 782.8/20, B8: 832.8, B8a 864.7/21, B9: 945.1/20, B10: 1373.5/31, B11: 1613.7/91, B12: 2204.4/175, Tile: T34SGG, radiometric resolution: 12 BIT, acquisition date: 25/05/2021, spatial resolution, 10 m. These satellite images do not have video data.
Fieldwork for this study was carried out during 2020–2021. Fieldwork data were collected for the geological and geomorphologic mapping of coastline forms, as well as the recognition of the coastline changes using a standard GPS receiver with 3 m accuracy.
2.3. Methodology
Image-processing coupled with GIS techniques were used to accomplish the present work. As a first step aerial photos were used. They are common data used for coastline mapping and to determine shoreline changes (Dolan, 1980). Shorelines are identified by grey scale tonal variations. Nevertheless, they have several geometric distortions, which in many cases associated with errors [36,37].
The aerial photos belonged to different periods of time, between 1945 and 1987, and at different scales. They were scanned and converted to tiff format. Hence, they were adjusted into the projective system EGSA of the two topographic maps. Thus, each aerial photograph is characterized by a georeference adjusting their common points with the ones of the topographic maps. Furthermore, the coastline was digitized in each aerial photograph for all the four different data, and then they were compared. The further processing of the images occurred by the software ArcMap (Version 10.8). The final shorelines were manually digitized within GIS capabilities.
The quality of black and white copies of aerial photos was not good due to their low contrast to a medium gray tone. For this reason field work was done to verify the results of their processing. The identification and mapping of both man-made and natural changes on the shoreline of the Athens Riviera was done with precision of 1 m, as it shown by the necessary control of the results in the fieldwork.
A data fusion georeferenced image has been produced using bands 4, 4, 7 fold Landsat 7 and bands 1, 3, 4 for Sentinel 2 and the panchromatic one, in order to map the coastline on a recent date. Overlaying techniques have been used to identify the changes and measure the land expansion from 1945 to 2021. The studied coast includes a varied geomorphology marked by the presence of both natural and artificial coastal forms. Natural coastal areas with beaches and smooth slopes, rocky cliffs of considerable heights and artificial coastal areas by the implementation of structures and buildings were observed though aerial photo interpretations, satellite imagery and field work. Thus, the shoreline of the Athens Riviera was mapped and divided in beaches, rocky coasts and artificial coasts. The studied coastline corresponds to the coastline of the year 2021. The lengths of each type of coast were measured.
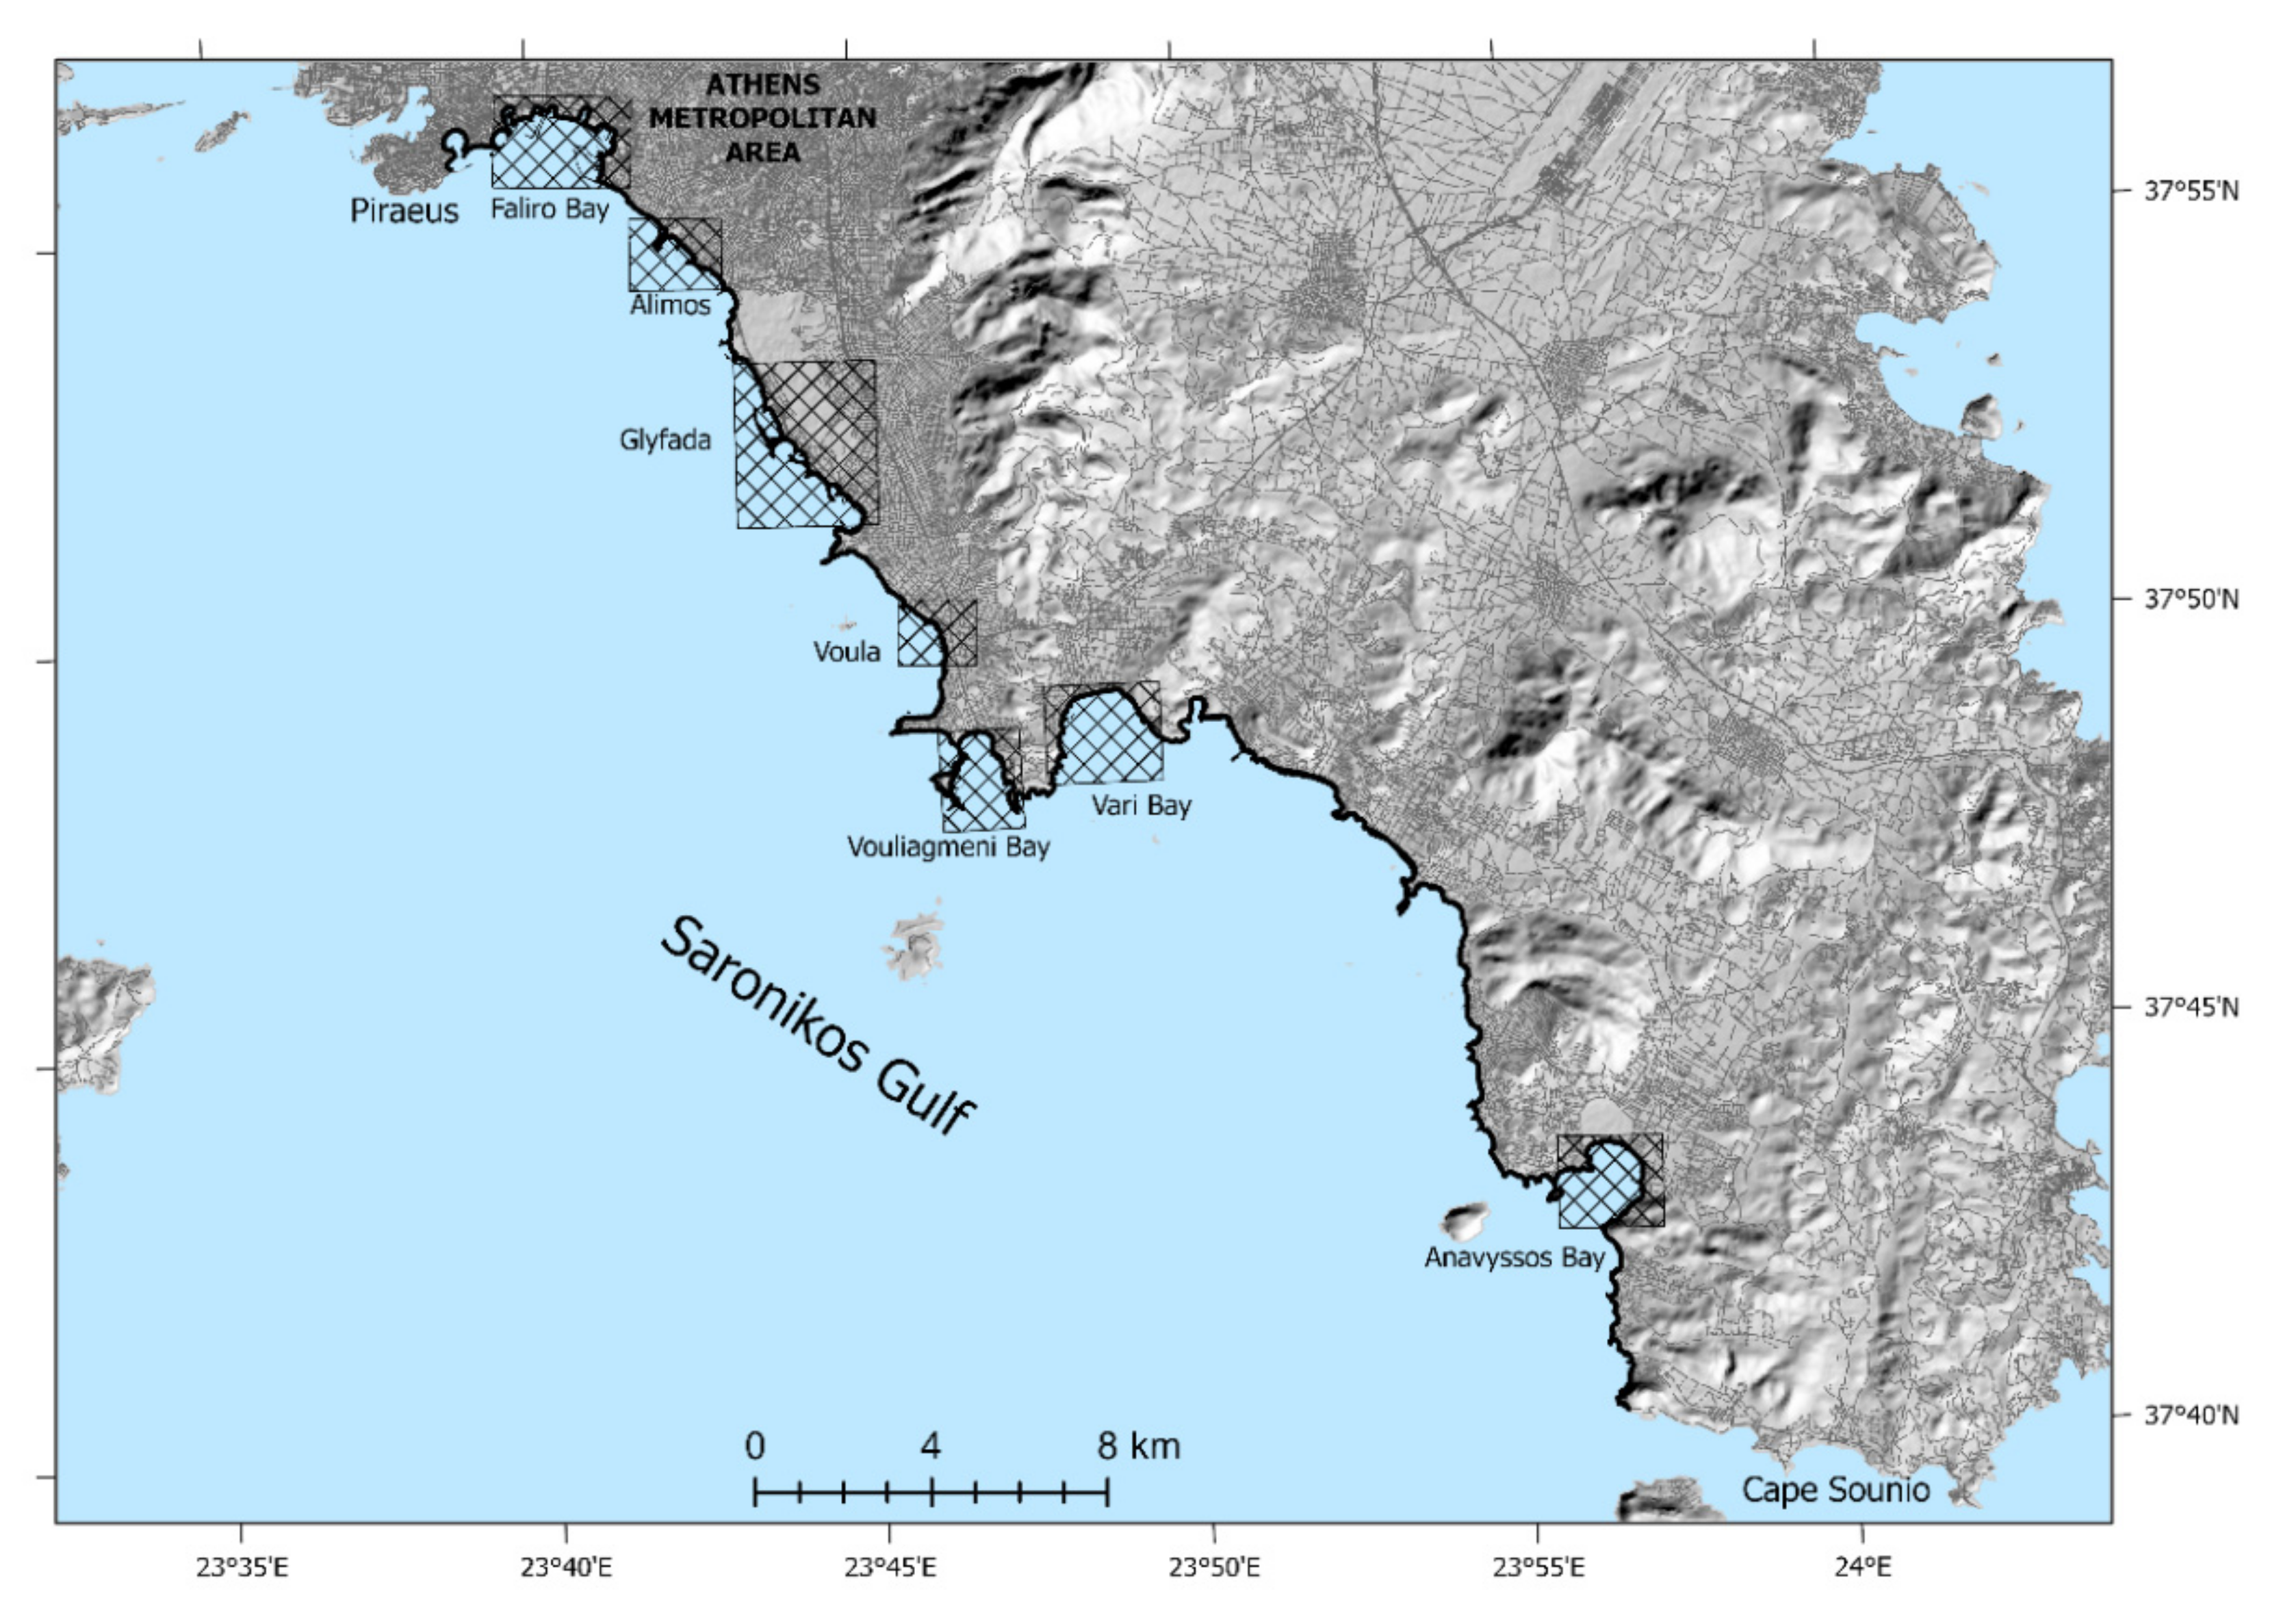
Moreover from the coastal areas with beaches and smooth slopes, seven sub-areas were selected and studied. They cover the entire length of Athenian Riviera and they are: Faliro Bay, Alimos, Glyfada, Voula, Vouliagmeni Bay, Barkiza Bay and Anavyssos Bay (Figure 2). The identification and selection of these subareas was done after the identification of specific environmental problems, through aerial interpretations, satellite imagery, as well as from oral information of residents during field work. The coastline changes in these areas from 1945 to 2021 were studied. The length of the coastline and the surfaces of the earth filled area in each studied period were measured for each subarea using ArcGiS capabilities. Finally, the total changes in length and area for the Athenian Riviera were calculated.
3. Results
3.1. Classification of Coastlines
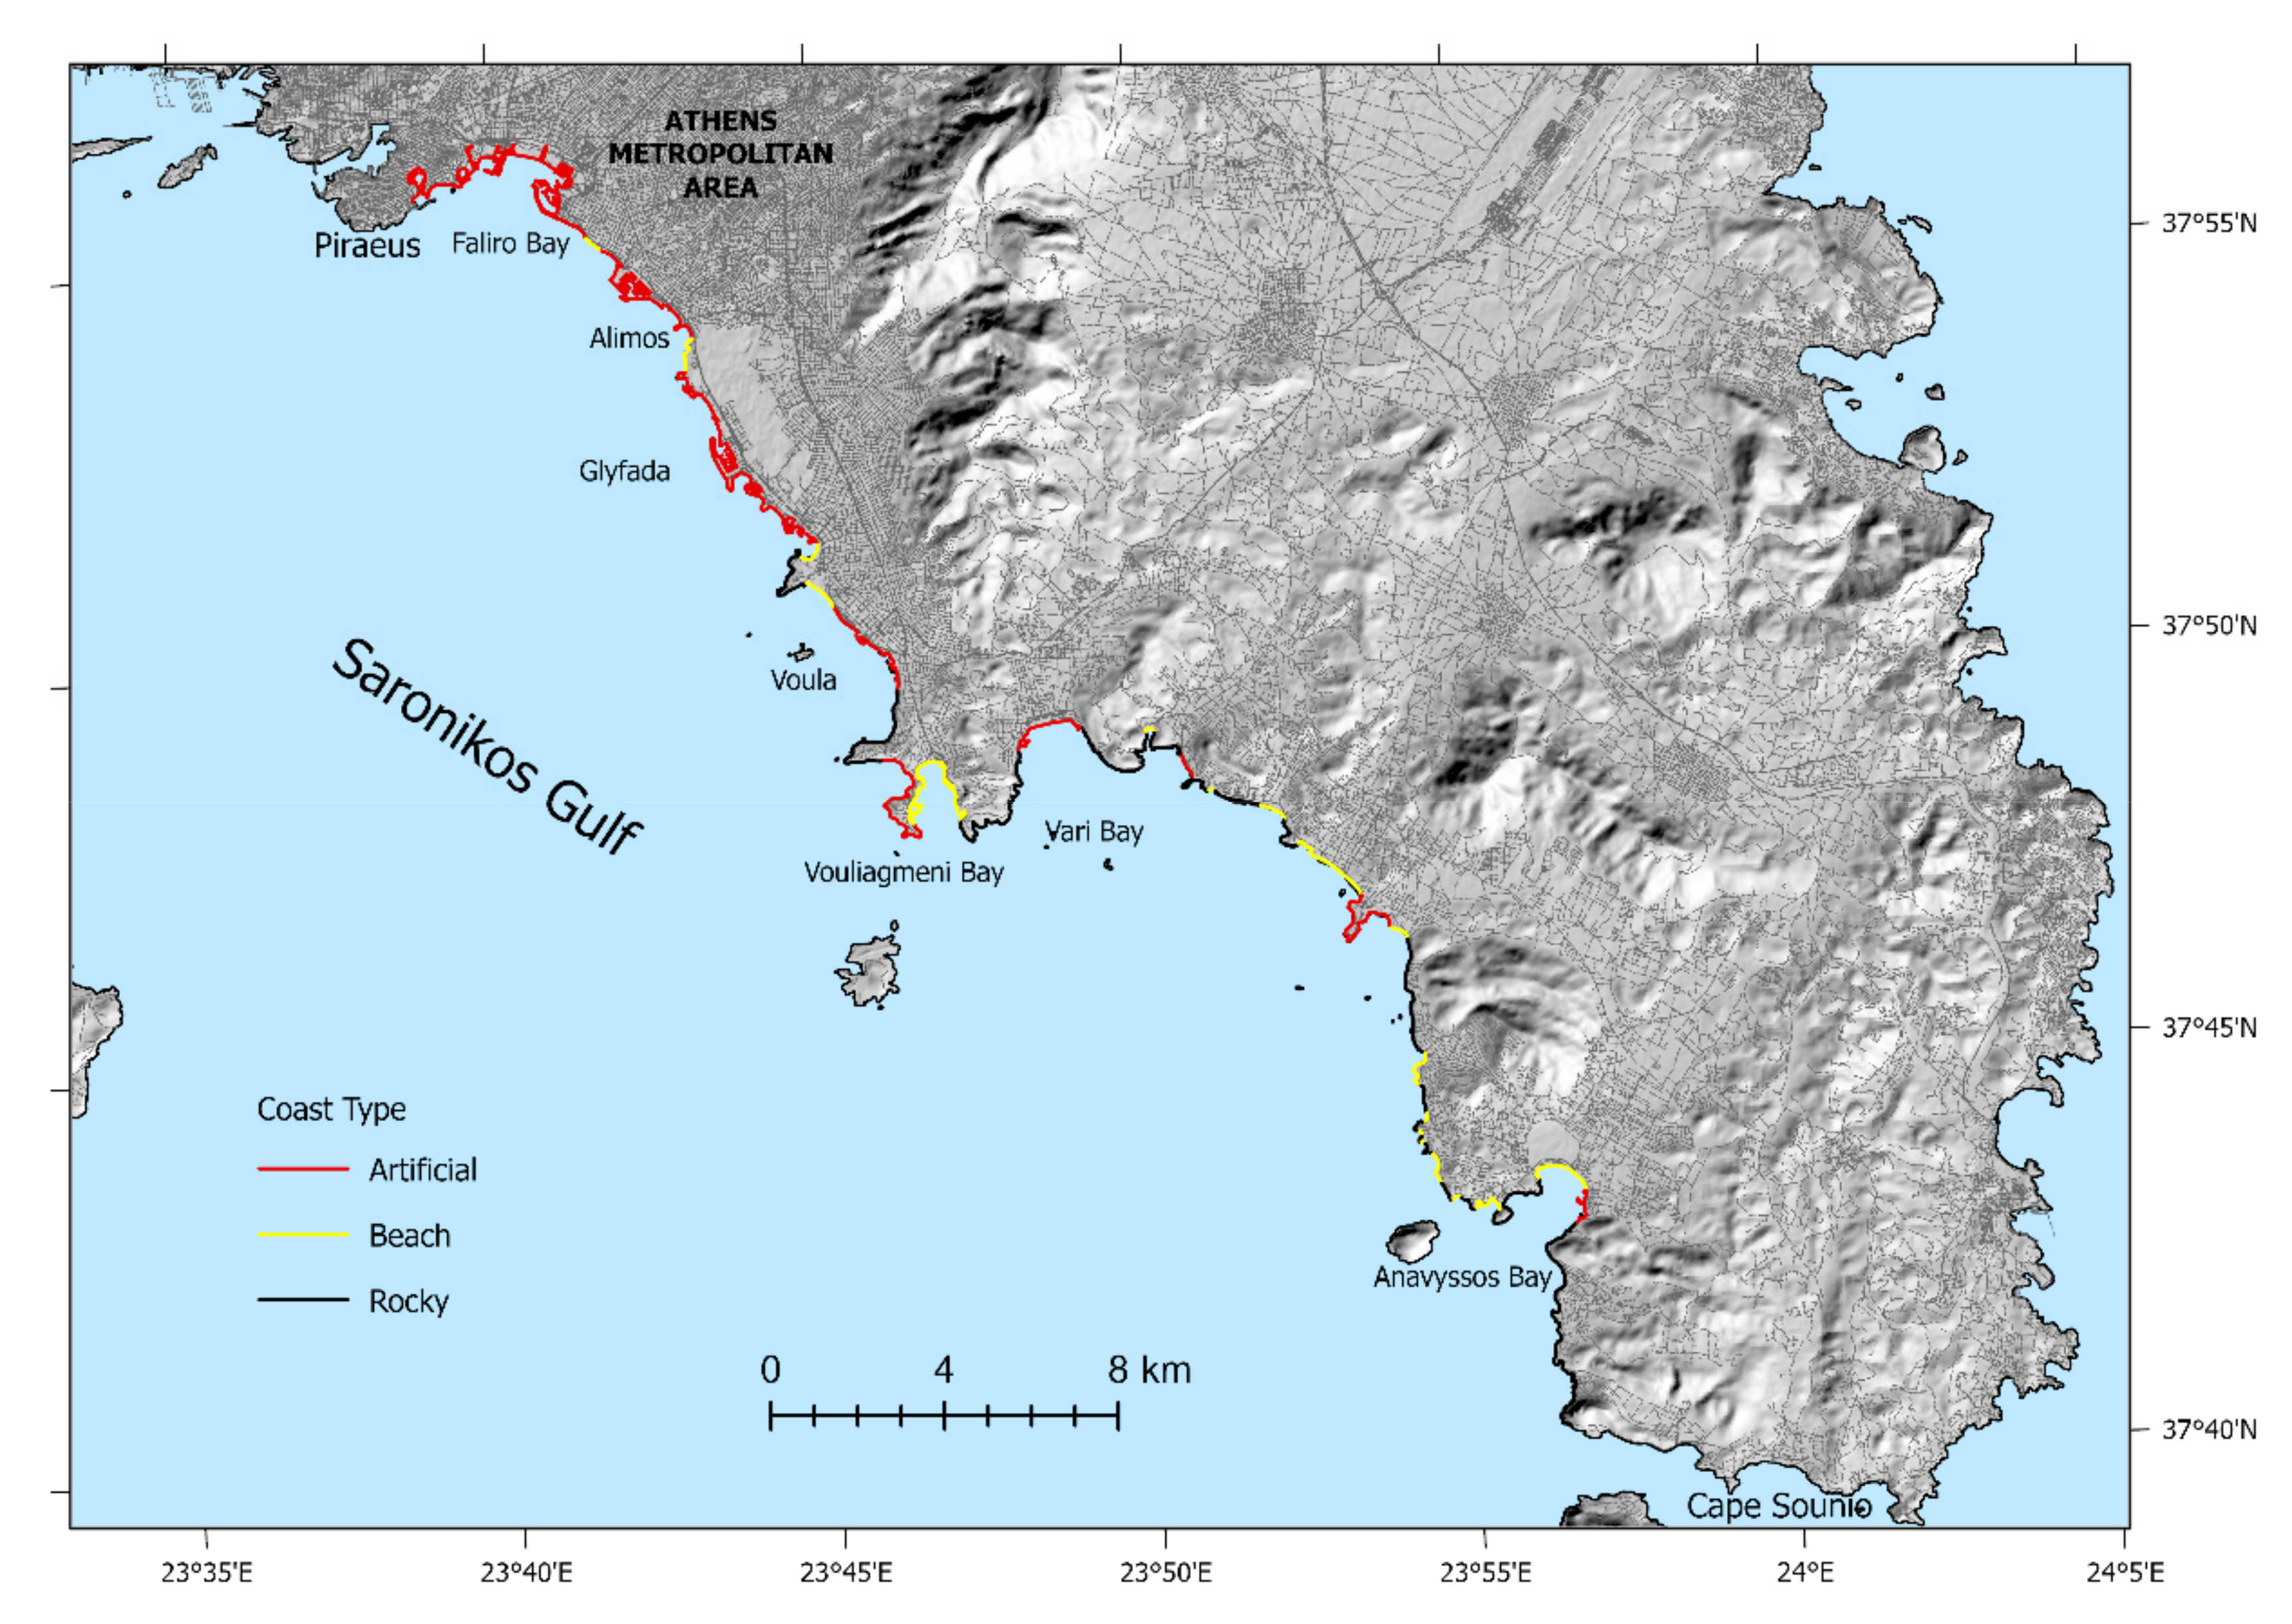
The coastline of the year 2021 was classified in three different types. The spatial distribution of the coastline types of Athenian Riviera is illustrated in Figure 3. The artificial coasts are mainly observed in the northern part of the study area. The beaches with smooth slopes are located mainly in bays while rocky coasts are observed mainly where the geological stratum consists of carbonate formations. Table 1 shows the lengths and their percentages of each type of coast. The total length of the coastline of the study area was found to be 122.1 km. The artificial coasts are very extensive representing 60% of the total length of the coastline. Artificial structures such as ports, marinas, etc. increase the length of the coastline. The length of the rocky coasts reaches about 36 km, while the most limited in length are the beaches which constitute 12% of the total coastline.
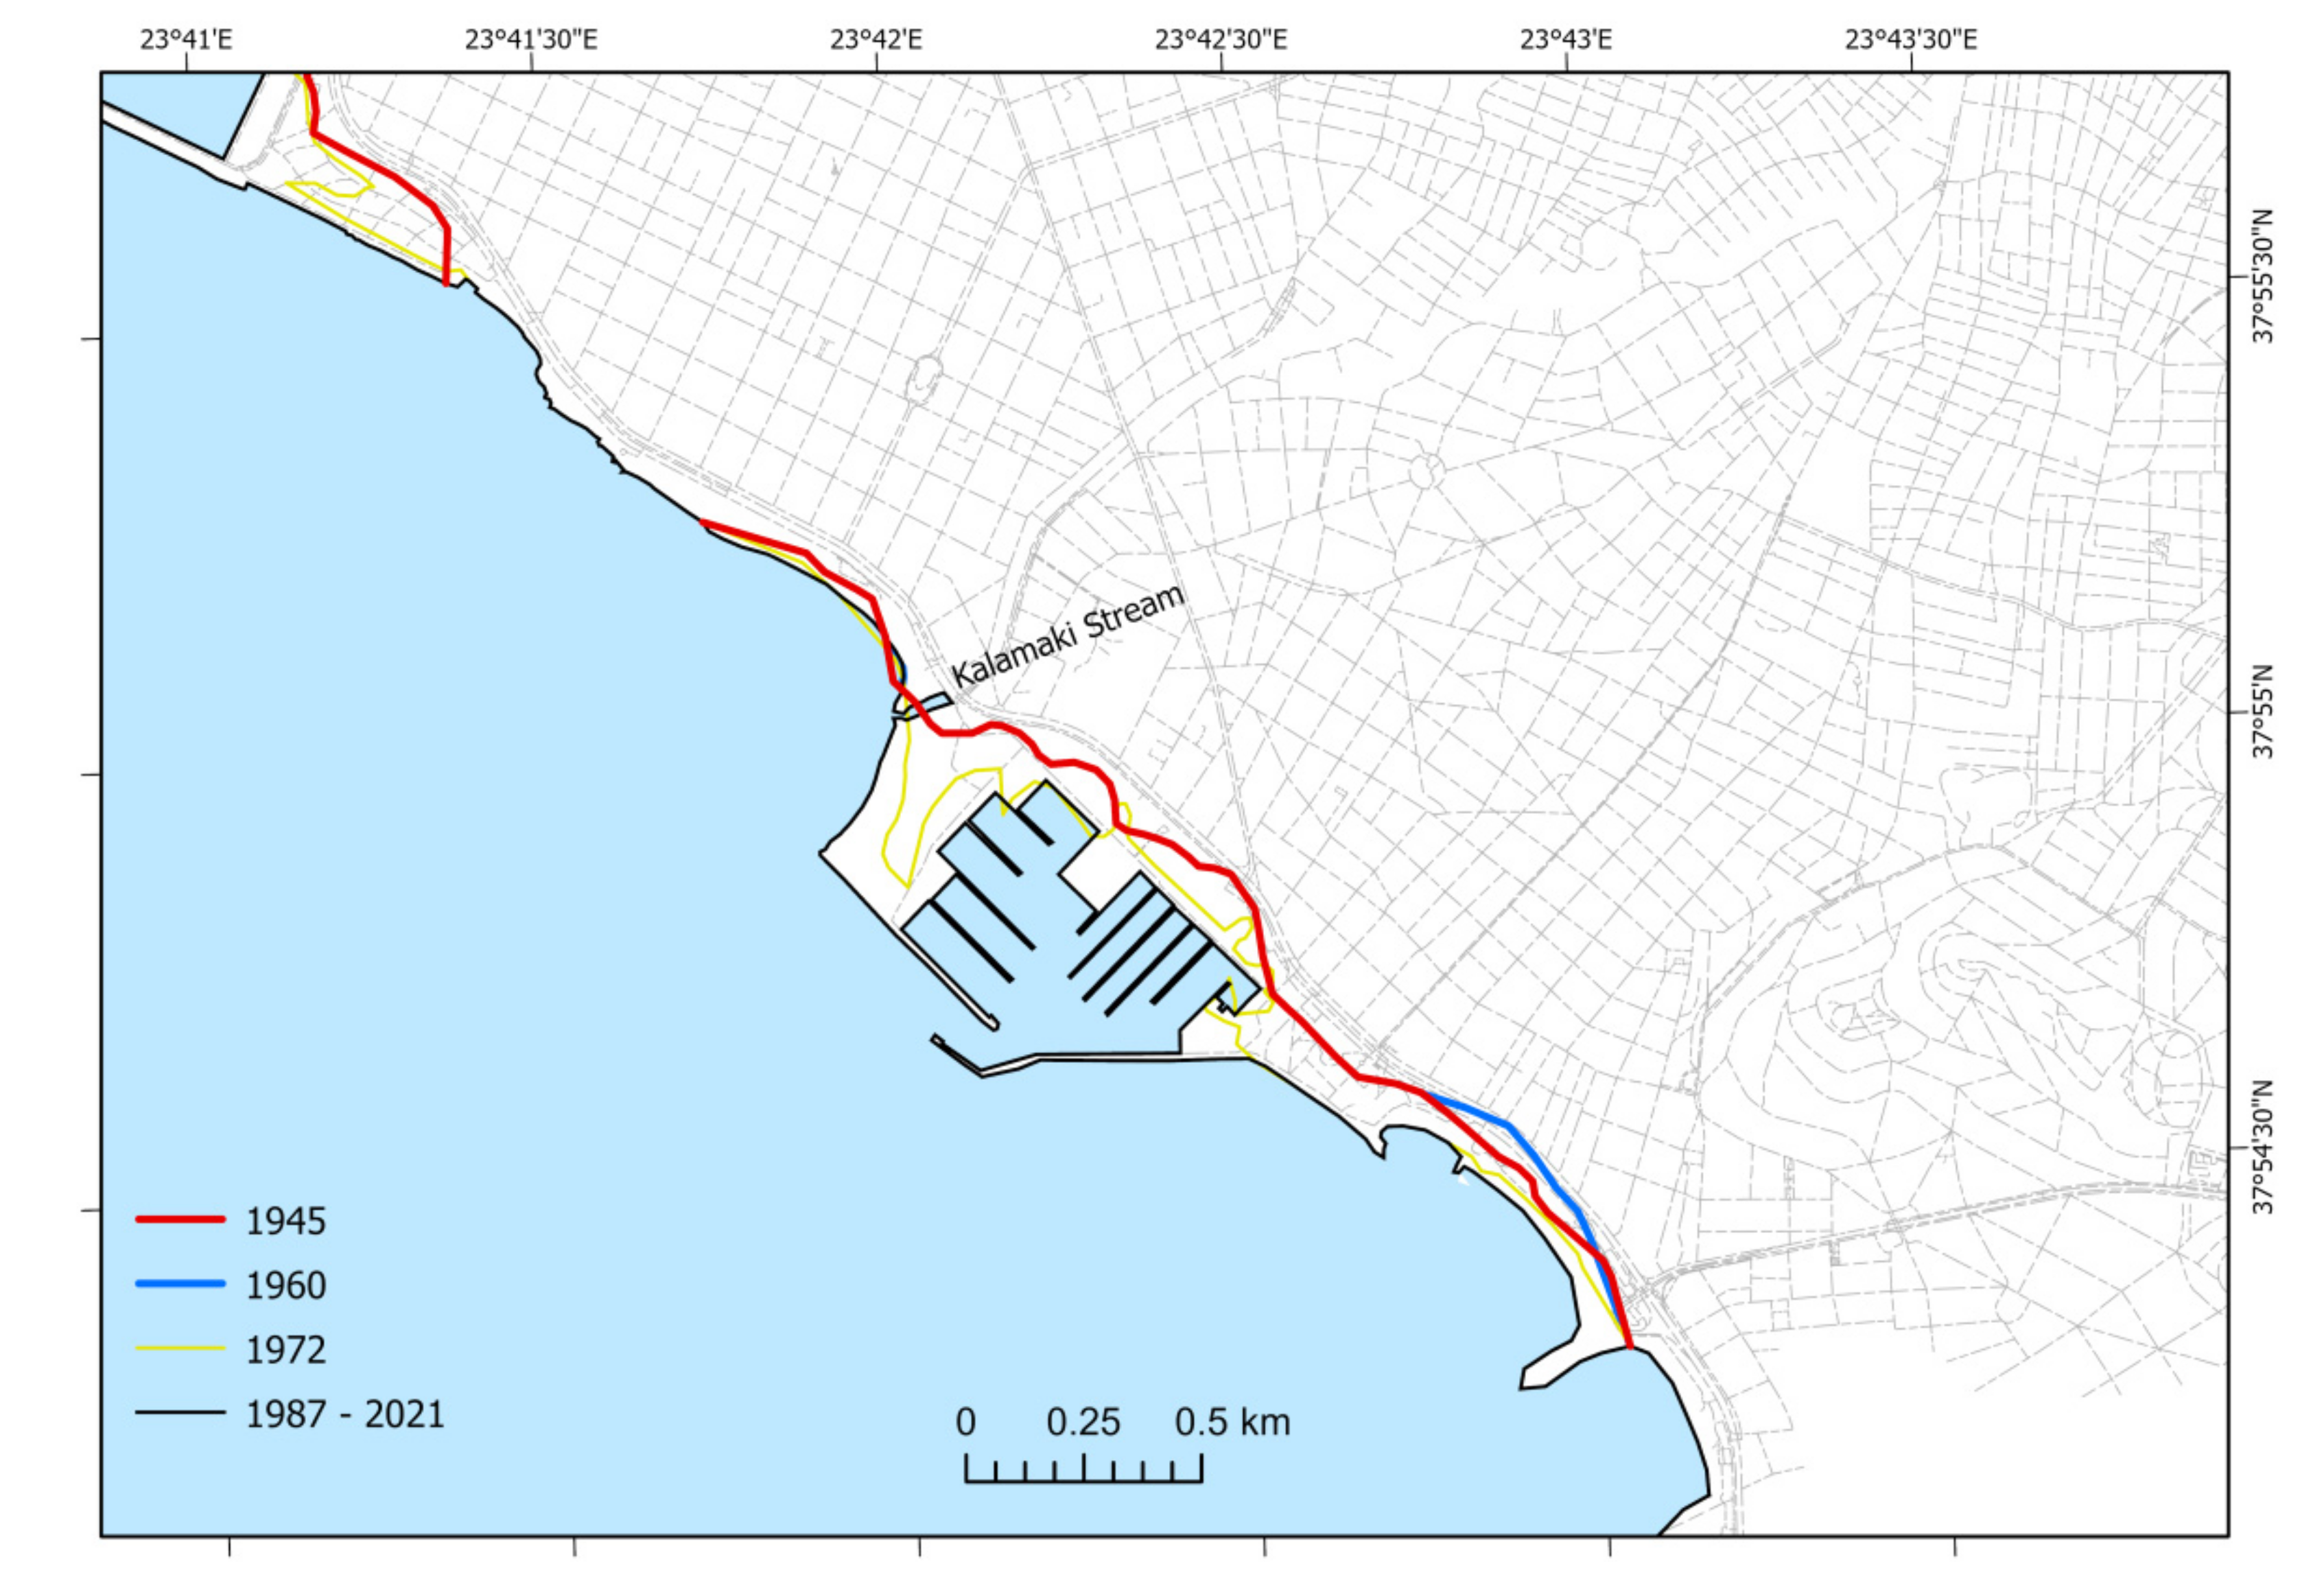
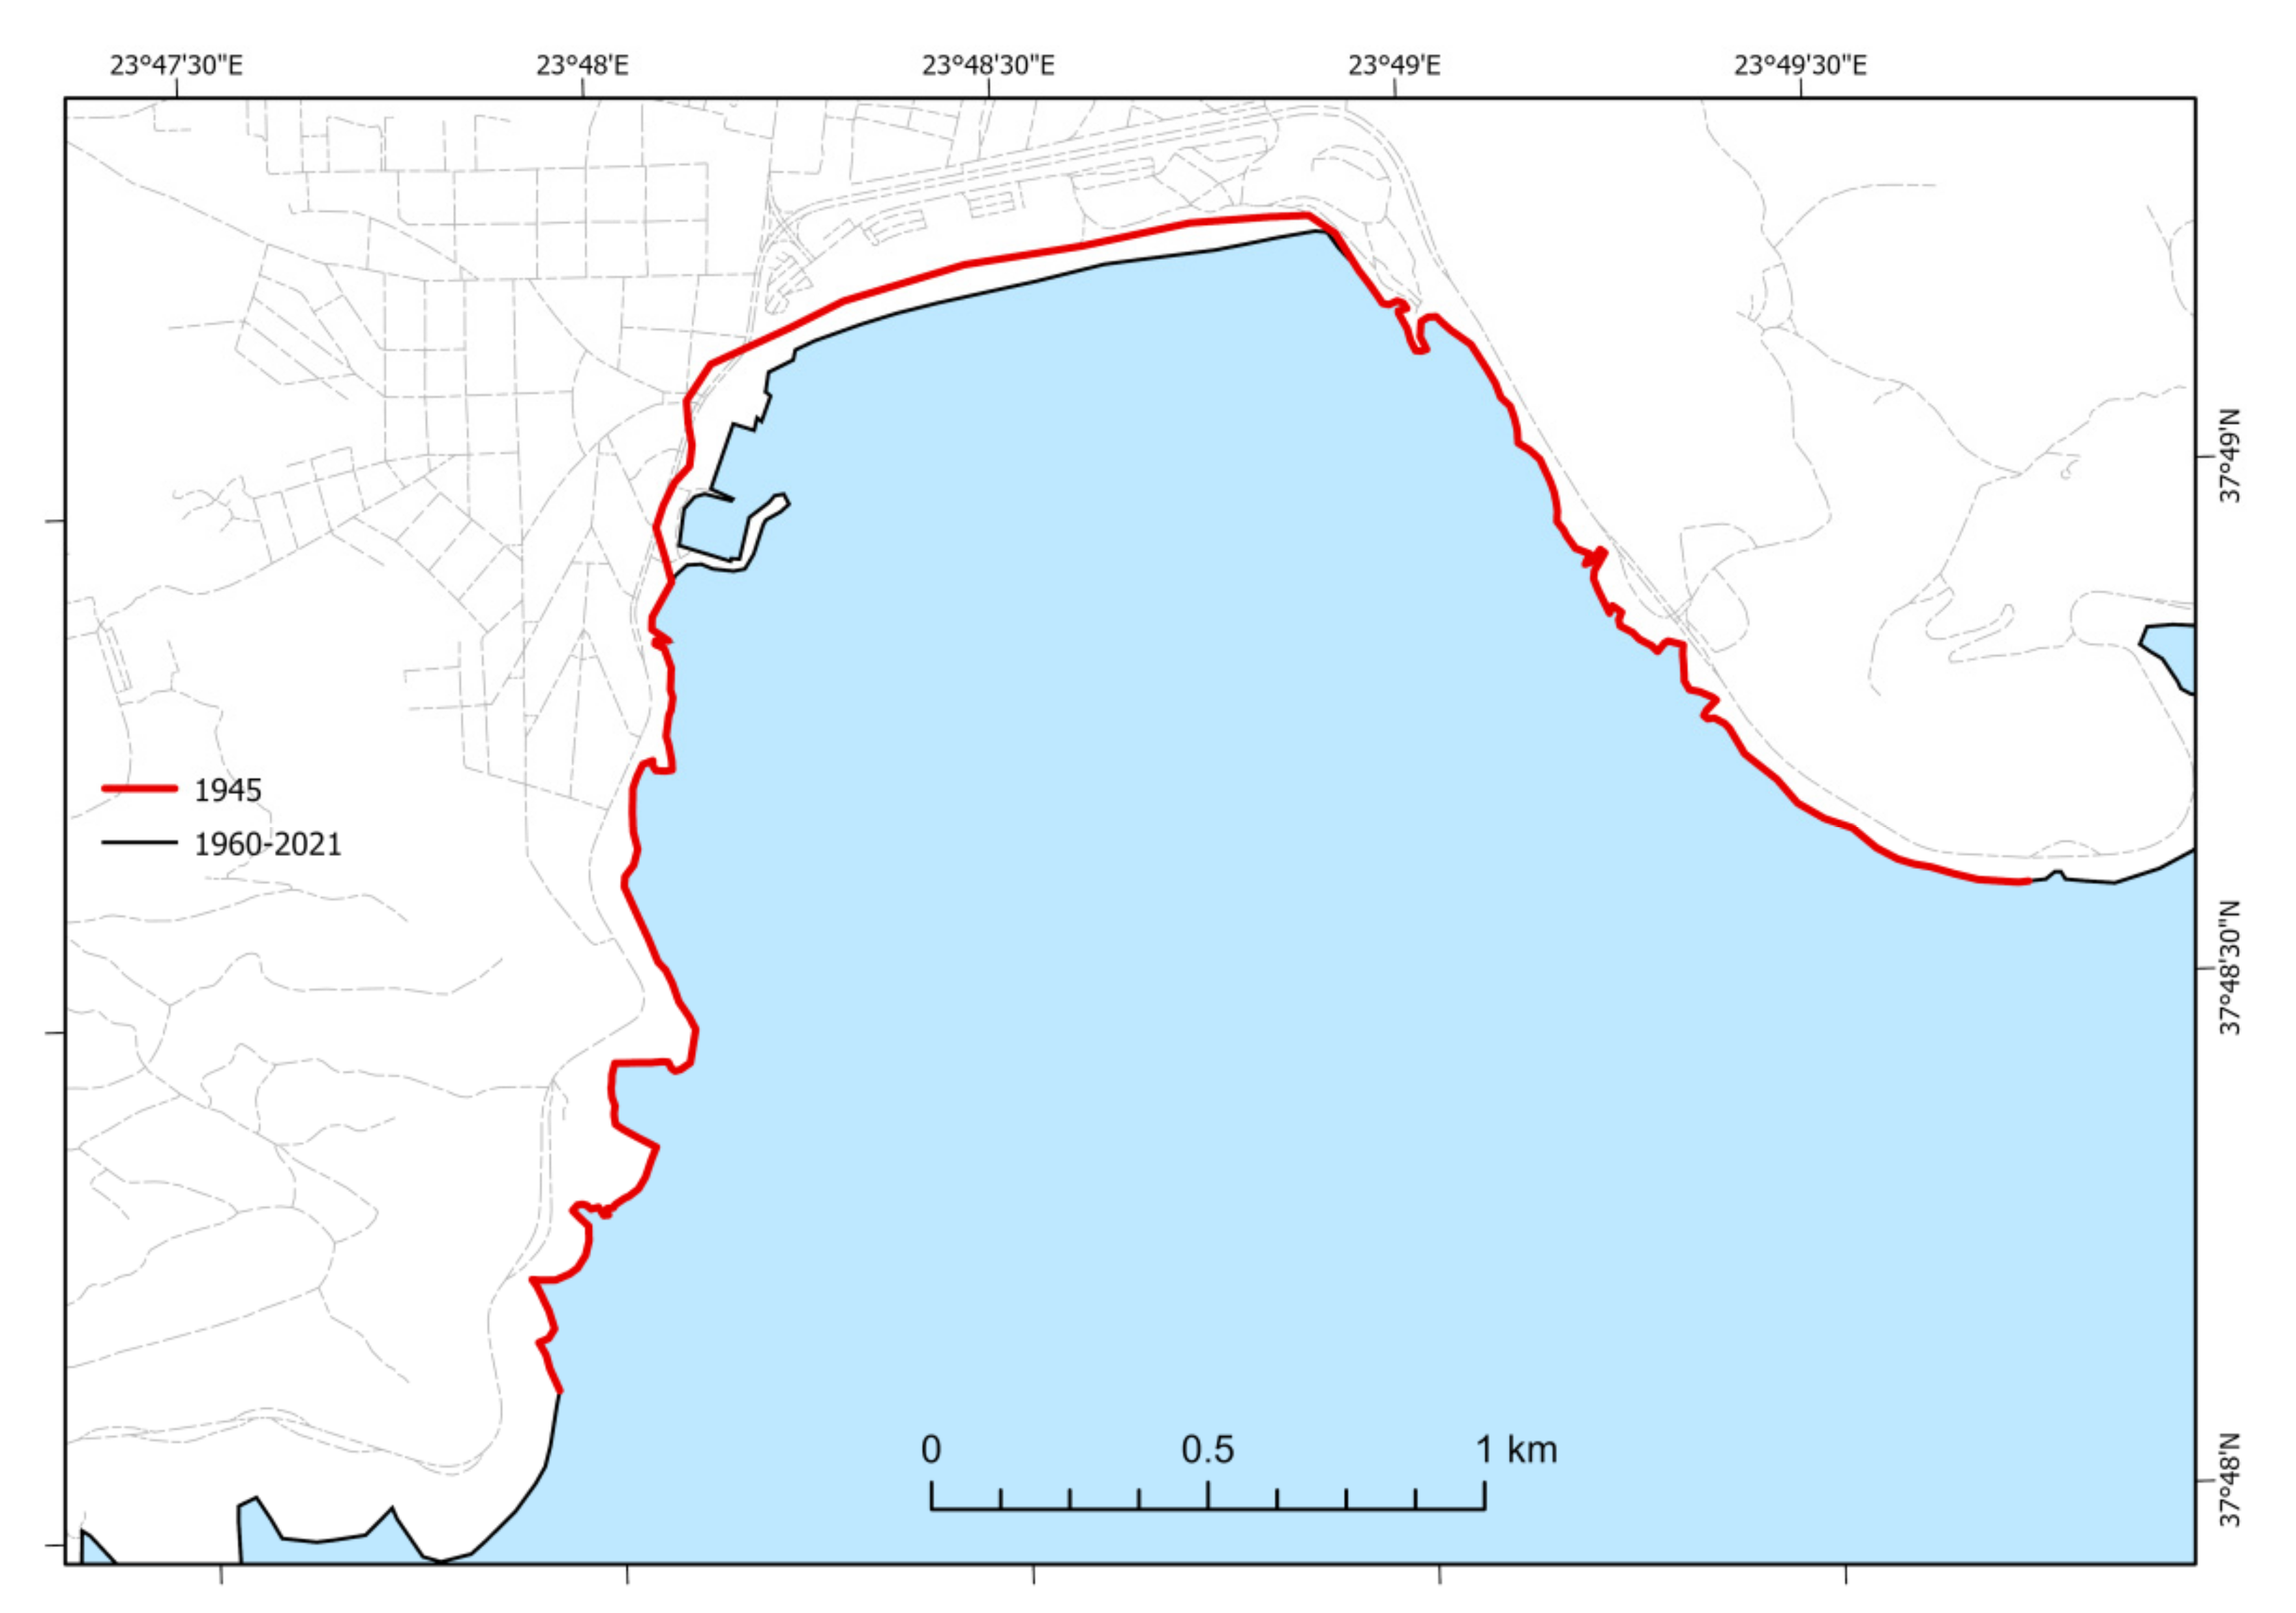
3.2. Faliro Bay
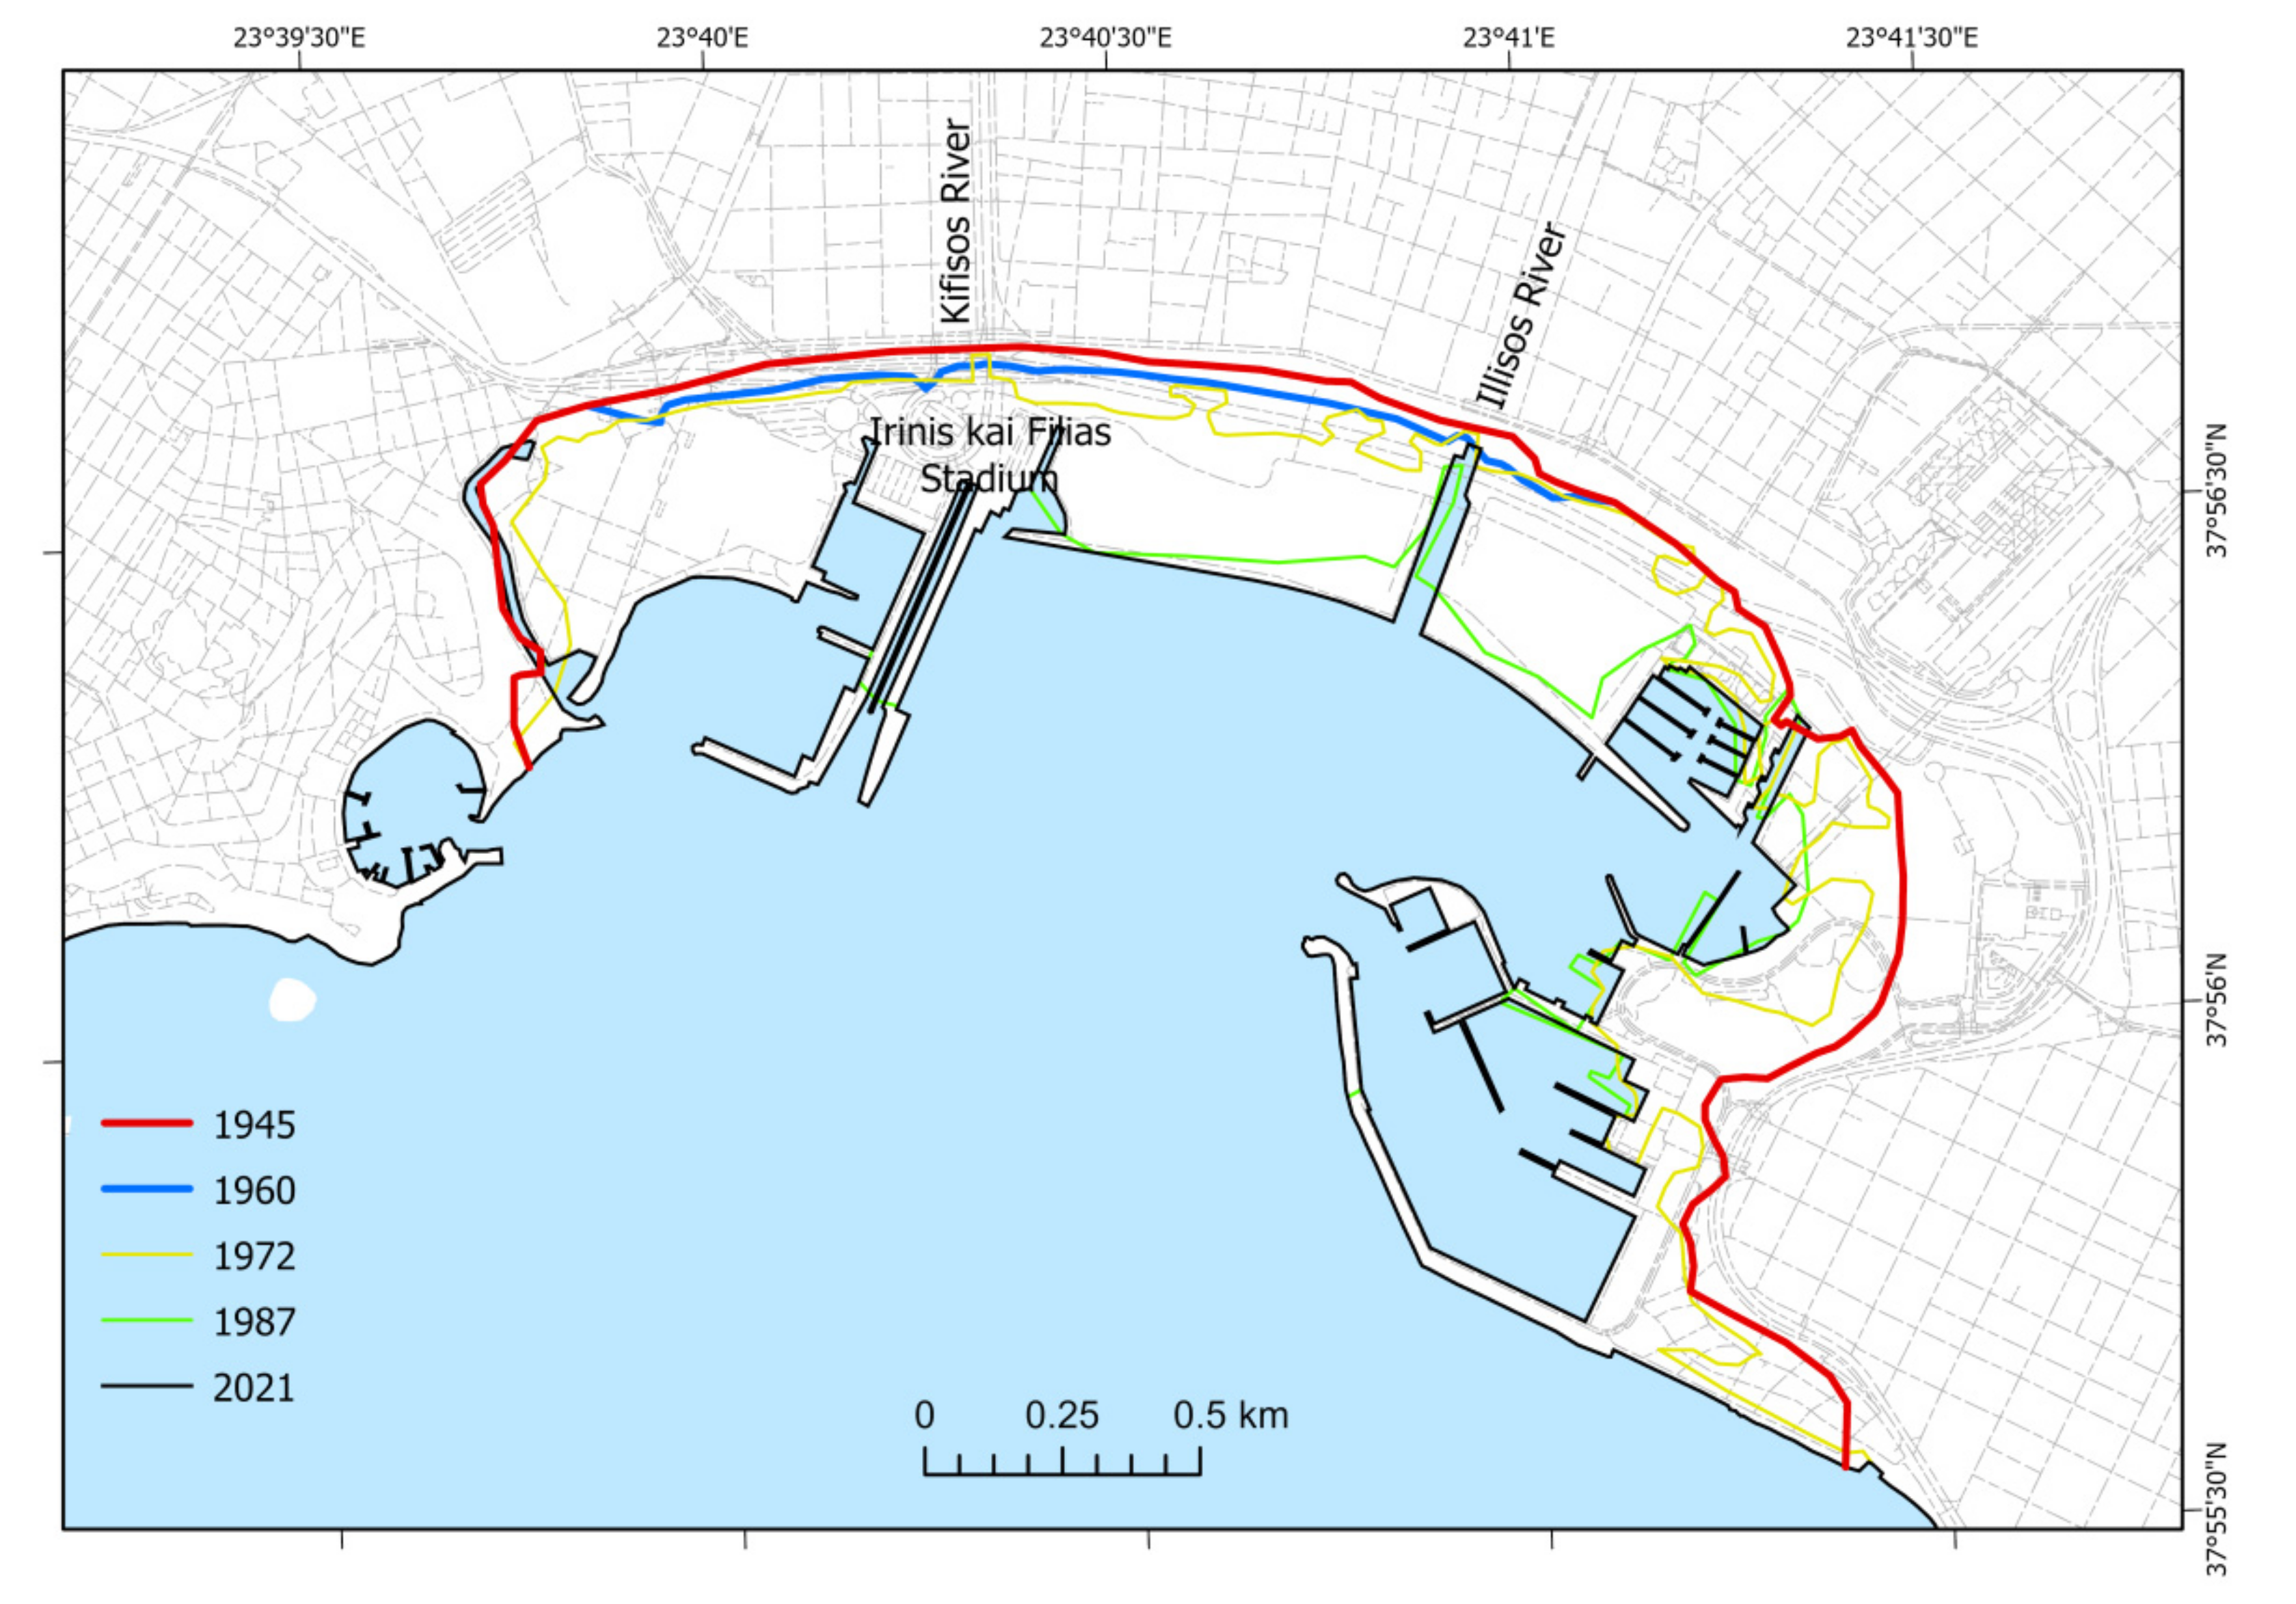
The changes that occurred in the Faliro Bay were recorded by comparing aerial photographs and satellite images and were examined in six periods of time: the first from 1945 to 1960, the second from 1960 to 1972, the third from1972 to 1987, the fourth from 1987 to 2010 the fifth from 2010 to 2021 and the sixth from 1945 to 2021. Moreover, the lengths of the coastline as well as the extended areas of each subarea are presented in Table 2 and Table 3 respectively.
The examination of the 1945 to 1960 aerial photos reveals that minor changes of the coastline occurred in Faliro Bay during this period. Figure 4 depicts the coastlines of the two different dates. According to Table 2 the length of the coastline increased by 1%, while the coastline extended to the sea covering an area of 0.07 km2 (Table 3). The change in the middle of the coastline stems from the natural deposits of Kifisos and Ilissos rivers. Consequently, the bay is not yet affected by human activities.
Between the years 1960 and 1972 human interventions are significant leading to the first hints of alterations in the coastline (Figure 4). The length of coastline grew from 5.3 km in 1960 to 9.5 km in 1972 (Table 2). The alteration observed at the western part of the bay is originated from the earth filling in favor of the technical works. The same works take place between the rivers Kifisos and Ilissos aiming at the management of their beds. As for the eastern part of the bay, it has been banked up to construct new marinas.
Changes of the coastline occurred between 1972 and 1987 are depicted in Figure 4 as well as Table 2 and Table 3. The coastline extended to the sea covering an area of 1 km2 and increased about 1500% (Table 3). The present Irinis–Filias stadium and secondary marinas were constructed at the western part of the Bay (Figure 4). The bed of the Kifisos river has been rearranged and, thus, flows into the bay through an artificial channel. In addition, the government constructed central roads onto the earth-filled locations. At the eastern side of the bay, a modified entrance in the marina is constructed and a second marina is added.
The changes during 1987–2010 (Figure 4) are detected between the Kifisos and Ilisos rivers mouth due the continuous filling in the area. The length of the coastline increased by 84% and the area of the constructions rose by 18% (Table 2 and Table 3). The Kifisos discharges through an artificial channel, and, consequently has increased its length; a breakwater has been constructed face to the channel to protect it from the wave activity. An additional change of the coastline occurred with the expansion of the beach in front of the Irinis–Filias stadium that was produced by the construction of another breakwater to protect the beach from sea-erosion. The expansion is, however, the result of a sediment deposit from the sea. Moreover, the jetty of the marinas located at the eastern part of the bay, was artificially extended further in the years between 1987 and 2021.
The changes from 2010 to 2021 are shown in Figure 4. During the last examined period the coastline length increased by 6% and the artificial constructions increased their area by 1% (Table 2 and Table 3).
Between the years 1945 and 2021, the coastline of the Faliro Bay was artificially expanded (Figure 4). Its length grew from 5.2 km in 1945 to 20.4 km in 2021 and it increased by 287%. All technical works such as the Irinis–Filias stadium, the crossroads, the marinas are constructed onto locations that were covered by sea in the past years, specifically in 1945. Moreover the surface of the earth-filled area now approaches 1.27 km2, an increase of 1922%.
3.3. Alimos
In Alimos, the coastlines of 1945 and 1960 seem to coincide (Figure 5, Table 2 and Table 3). The only technical work observed in the area is the addition of a small jetty. On the contrary a small retreat of the coastline was observed in the southern part of the coastal area, which is probably due to coastal erosion. During the period from 1960 and 1972, human interventions in the area began to be felt (Figure 5). The length of the coastline in 1972 increased by 49% (Table 2). The first facilities of the marina were built and the first earth fillings were carried out, while concrete construction was created in the southern part of the coast as a protection measure against coastal erosion. By 1987, the public works in the area are completed, with the final construction of the marina, which still exists today. The surrounding area is transformed into a recreation area. The riverbed and the estuary of the Kalamaki stream in its northern part are settled and the artificial beach of Alimos is formed with earth fillings. An earth jetty is also being constructed, the aim of which is to protect the coast from erosion (Figure 5). In 1987 the length of the coastline more than doubled compared to the coastline of 1972 increasing by 134%. The coastline that was extended covered an area of 0.29 km2.
Comparing the coastlines of 1987 and 2010, we observe that the interventions in the area continued (Figure 5). The length of coastline in 2010 increased by 129 m, while the artificial interventions covered an area of 0.33 km2 (Table 2 and Table 3). As it is shown in Figure 5 as well as Table 2 and Table 3, from 2010 to 2021 no changes were observed in the coastline. The interventions from 1945 to 2021 caused a 287% increase in the length of the coastline. They cover an area of 0.33 km2 (Table 2 and Table 3).
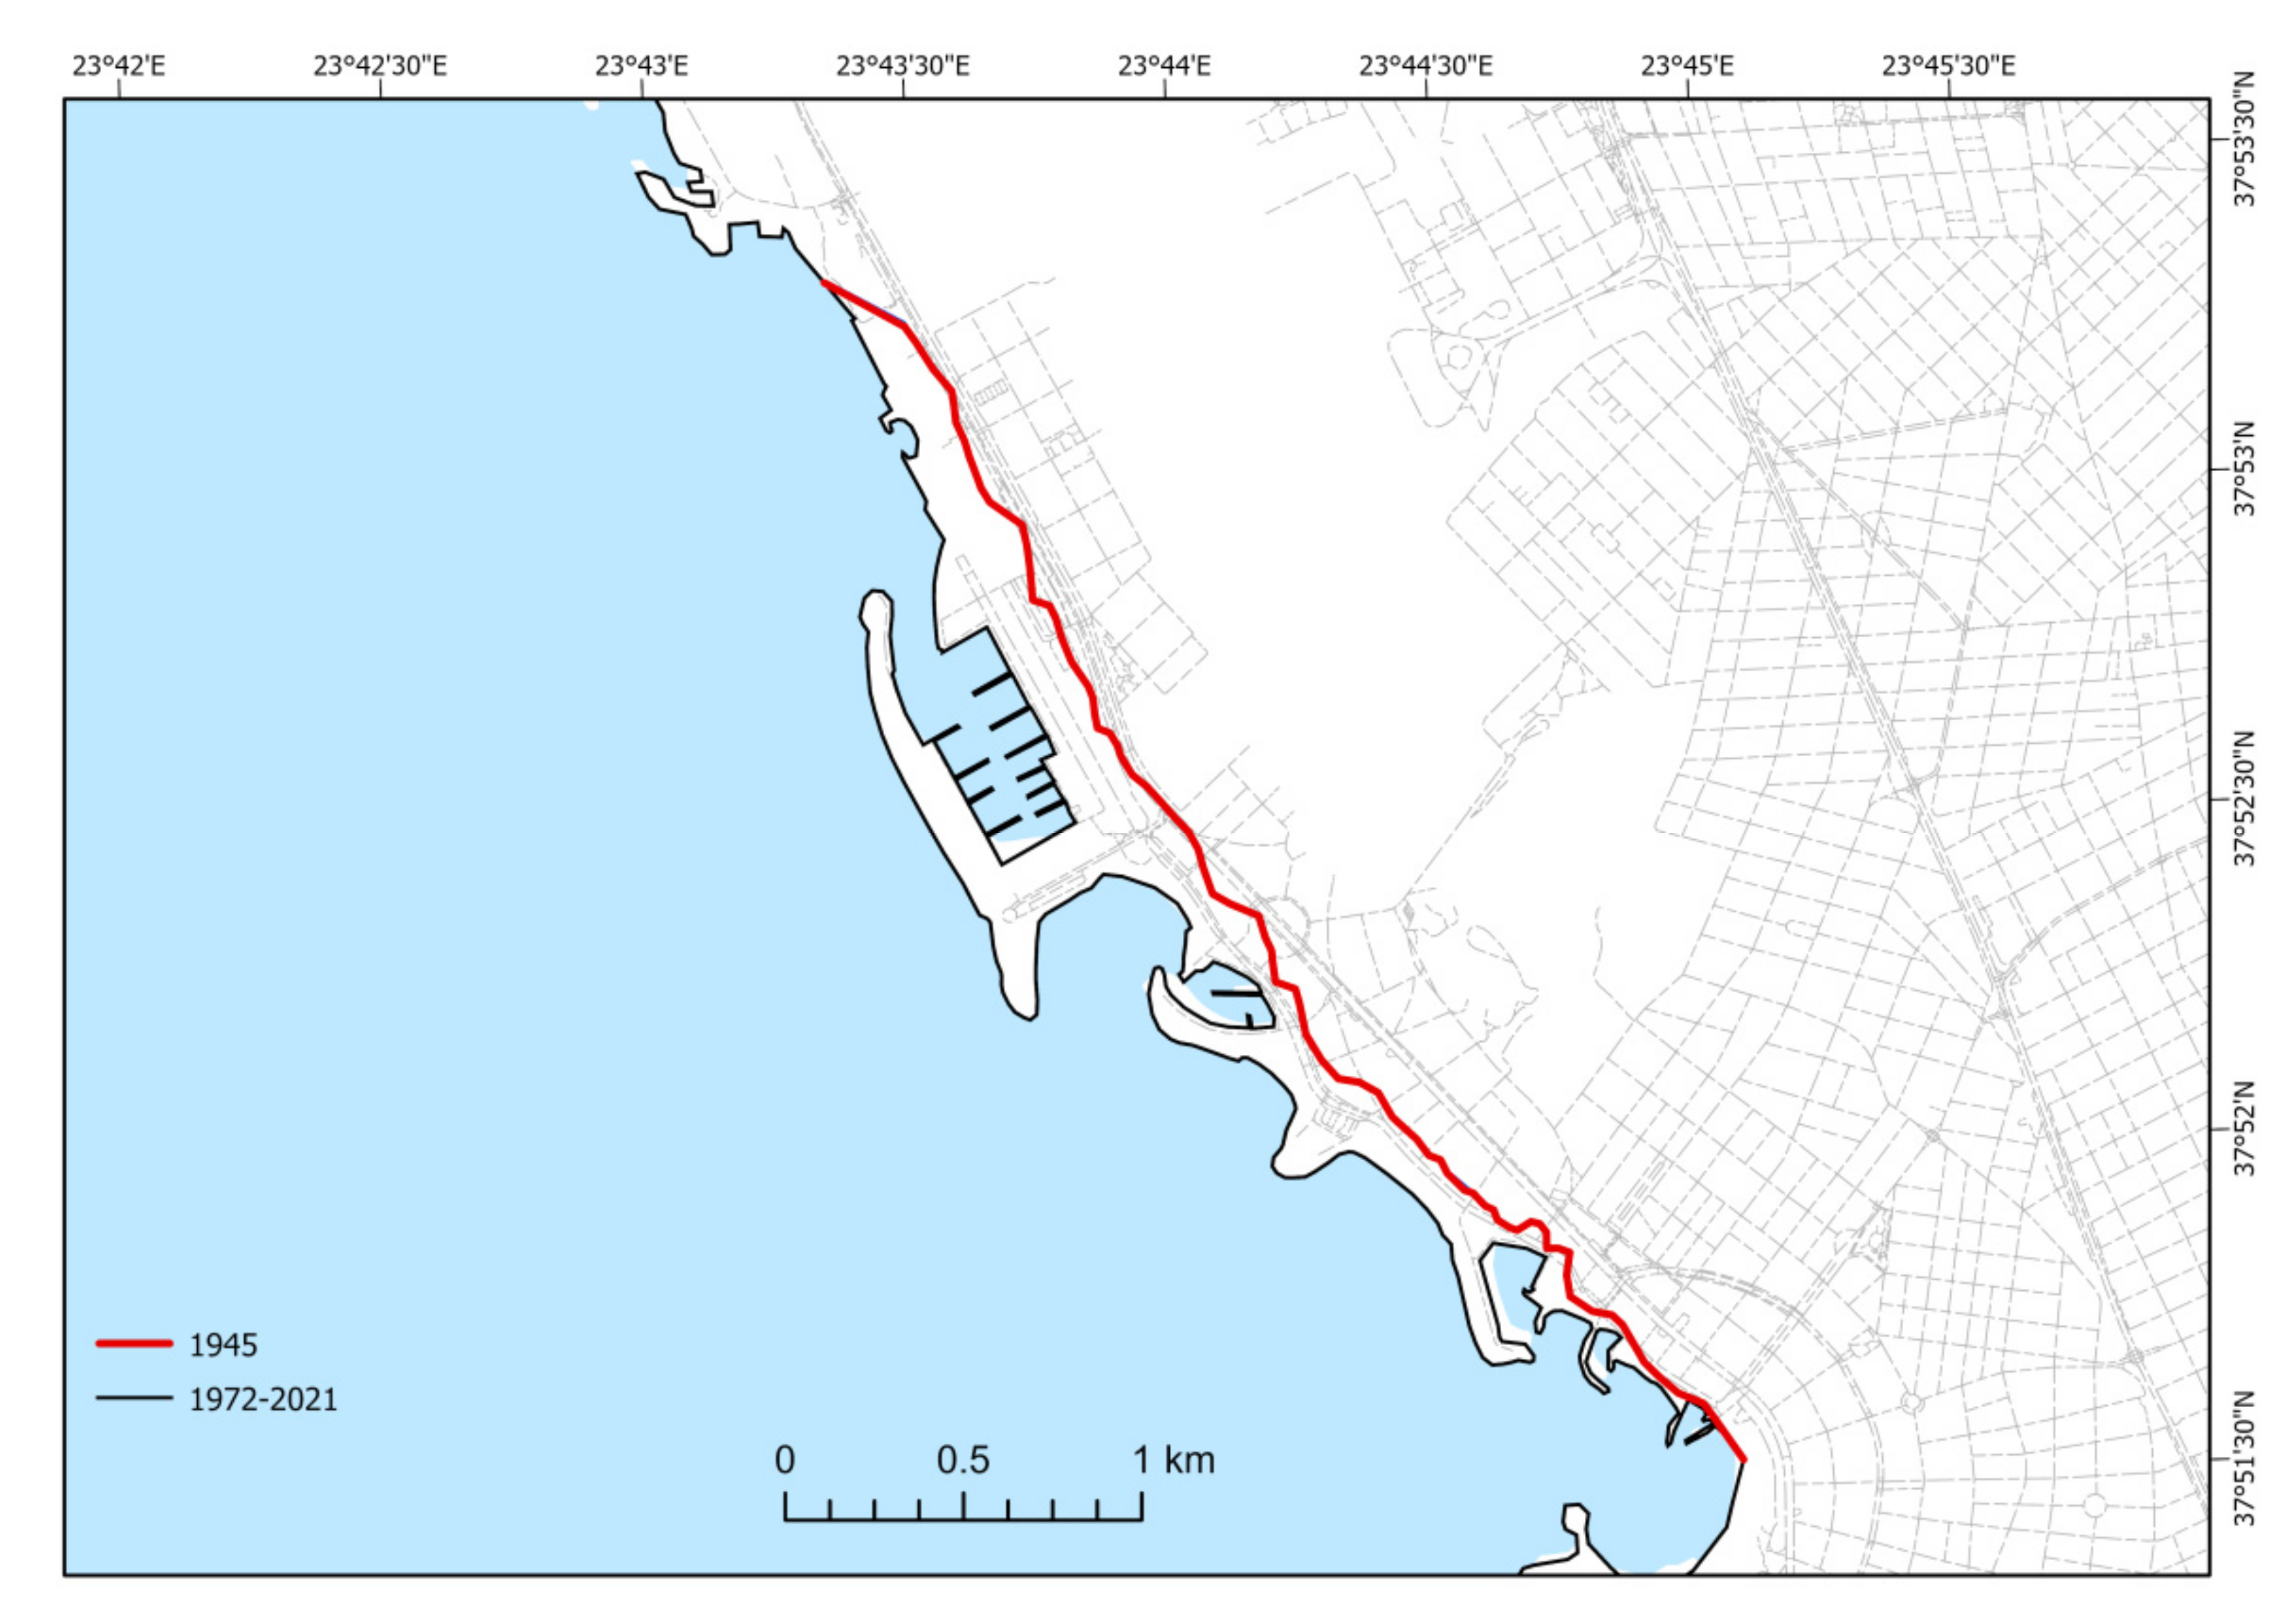
3.4. Glyfada
In the area of Glyfada, from 1945 to 1960 the changes of the coastal zone were minimal. Comparing the coastlines of 1960 and 1987 we observe that human interventions in the area were extensive.
Marinas and an artificial peninsula were built in the area. In the northern part of the peninsula, an artificial beach was created through the earthworks (Figure 6). The length of coastline grew from 4.5 km in 1960 to 13.5 km in 1987, and the artificial extension of the land covered an area of 0.85 km2 (Table 2 and Table 3). During the period 1987–2021 there were no changes in the coastal zone of Glyfada.
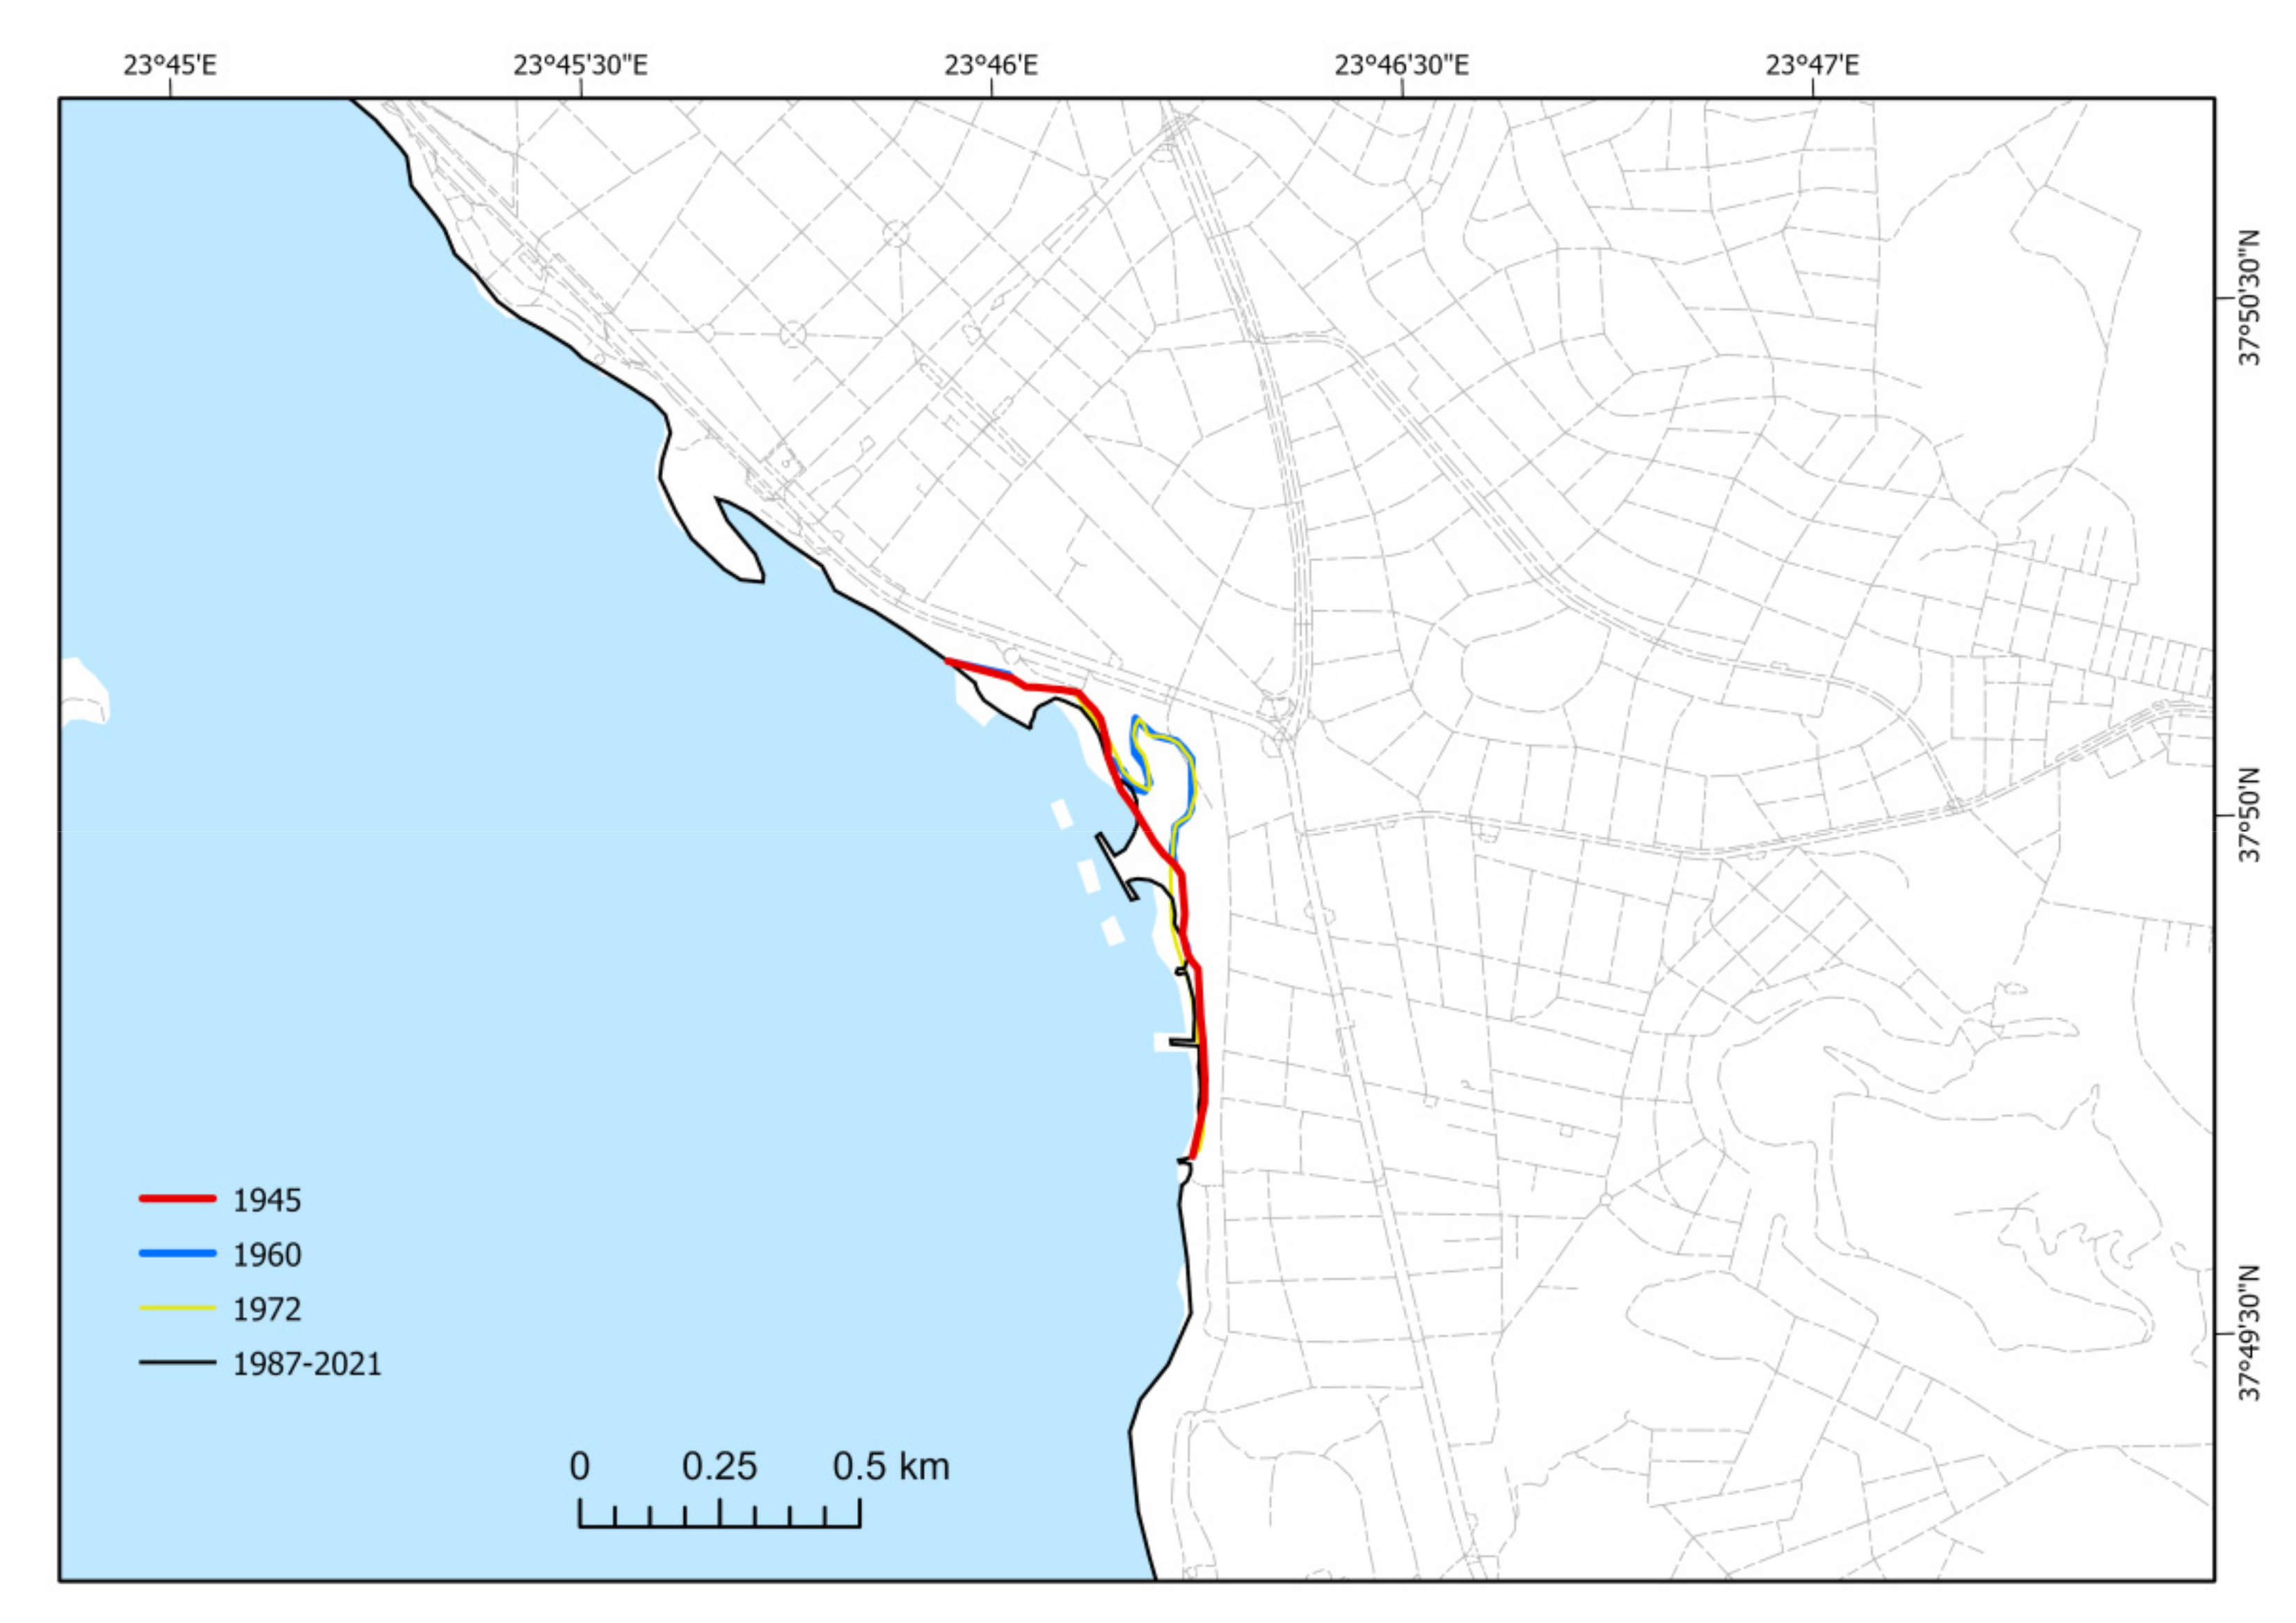
3.5. Voula
Figure 7 shows the coastlines of 1945 and 1960. The coastline of 1960 illustrates very little difference from that of 1945, except for the area that appears to be retreating (Table 2 and Table 3). This change is probably due to the retreating of waters and the appearance of land behind the beach rocks which existed in the area during the aerial photography of 1945. This phenomenon is often observed in the coasts of Attica with a similar morphology during the winter. Coastal zone changes between 1960 and 1972 include land expansion in the northern part of the study area. The beach of Voula was created, with the simultaneous construction of three concrete platforms parallel to the coastline. The beach rocks of the area were removed and boxed under the platforms. During the period 1972 to 1987, the changes in the coastline of the area were limited (Figure 7, Table 2 and Table 3). There was an extension of the coast to the artificial concrete platforms. There was a sandy zone added to the central platform, connecting it with the opposite land. In fact, a coast form of tombolo was created which is preserved to this day. The coastline has remained unchanged from 1987 onwards.
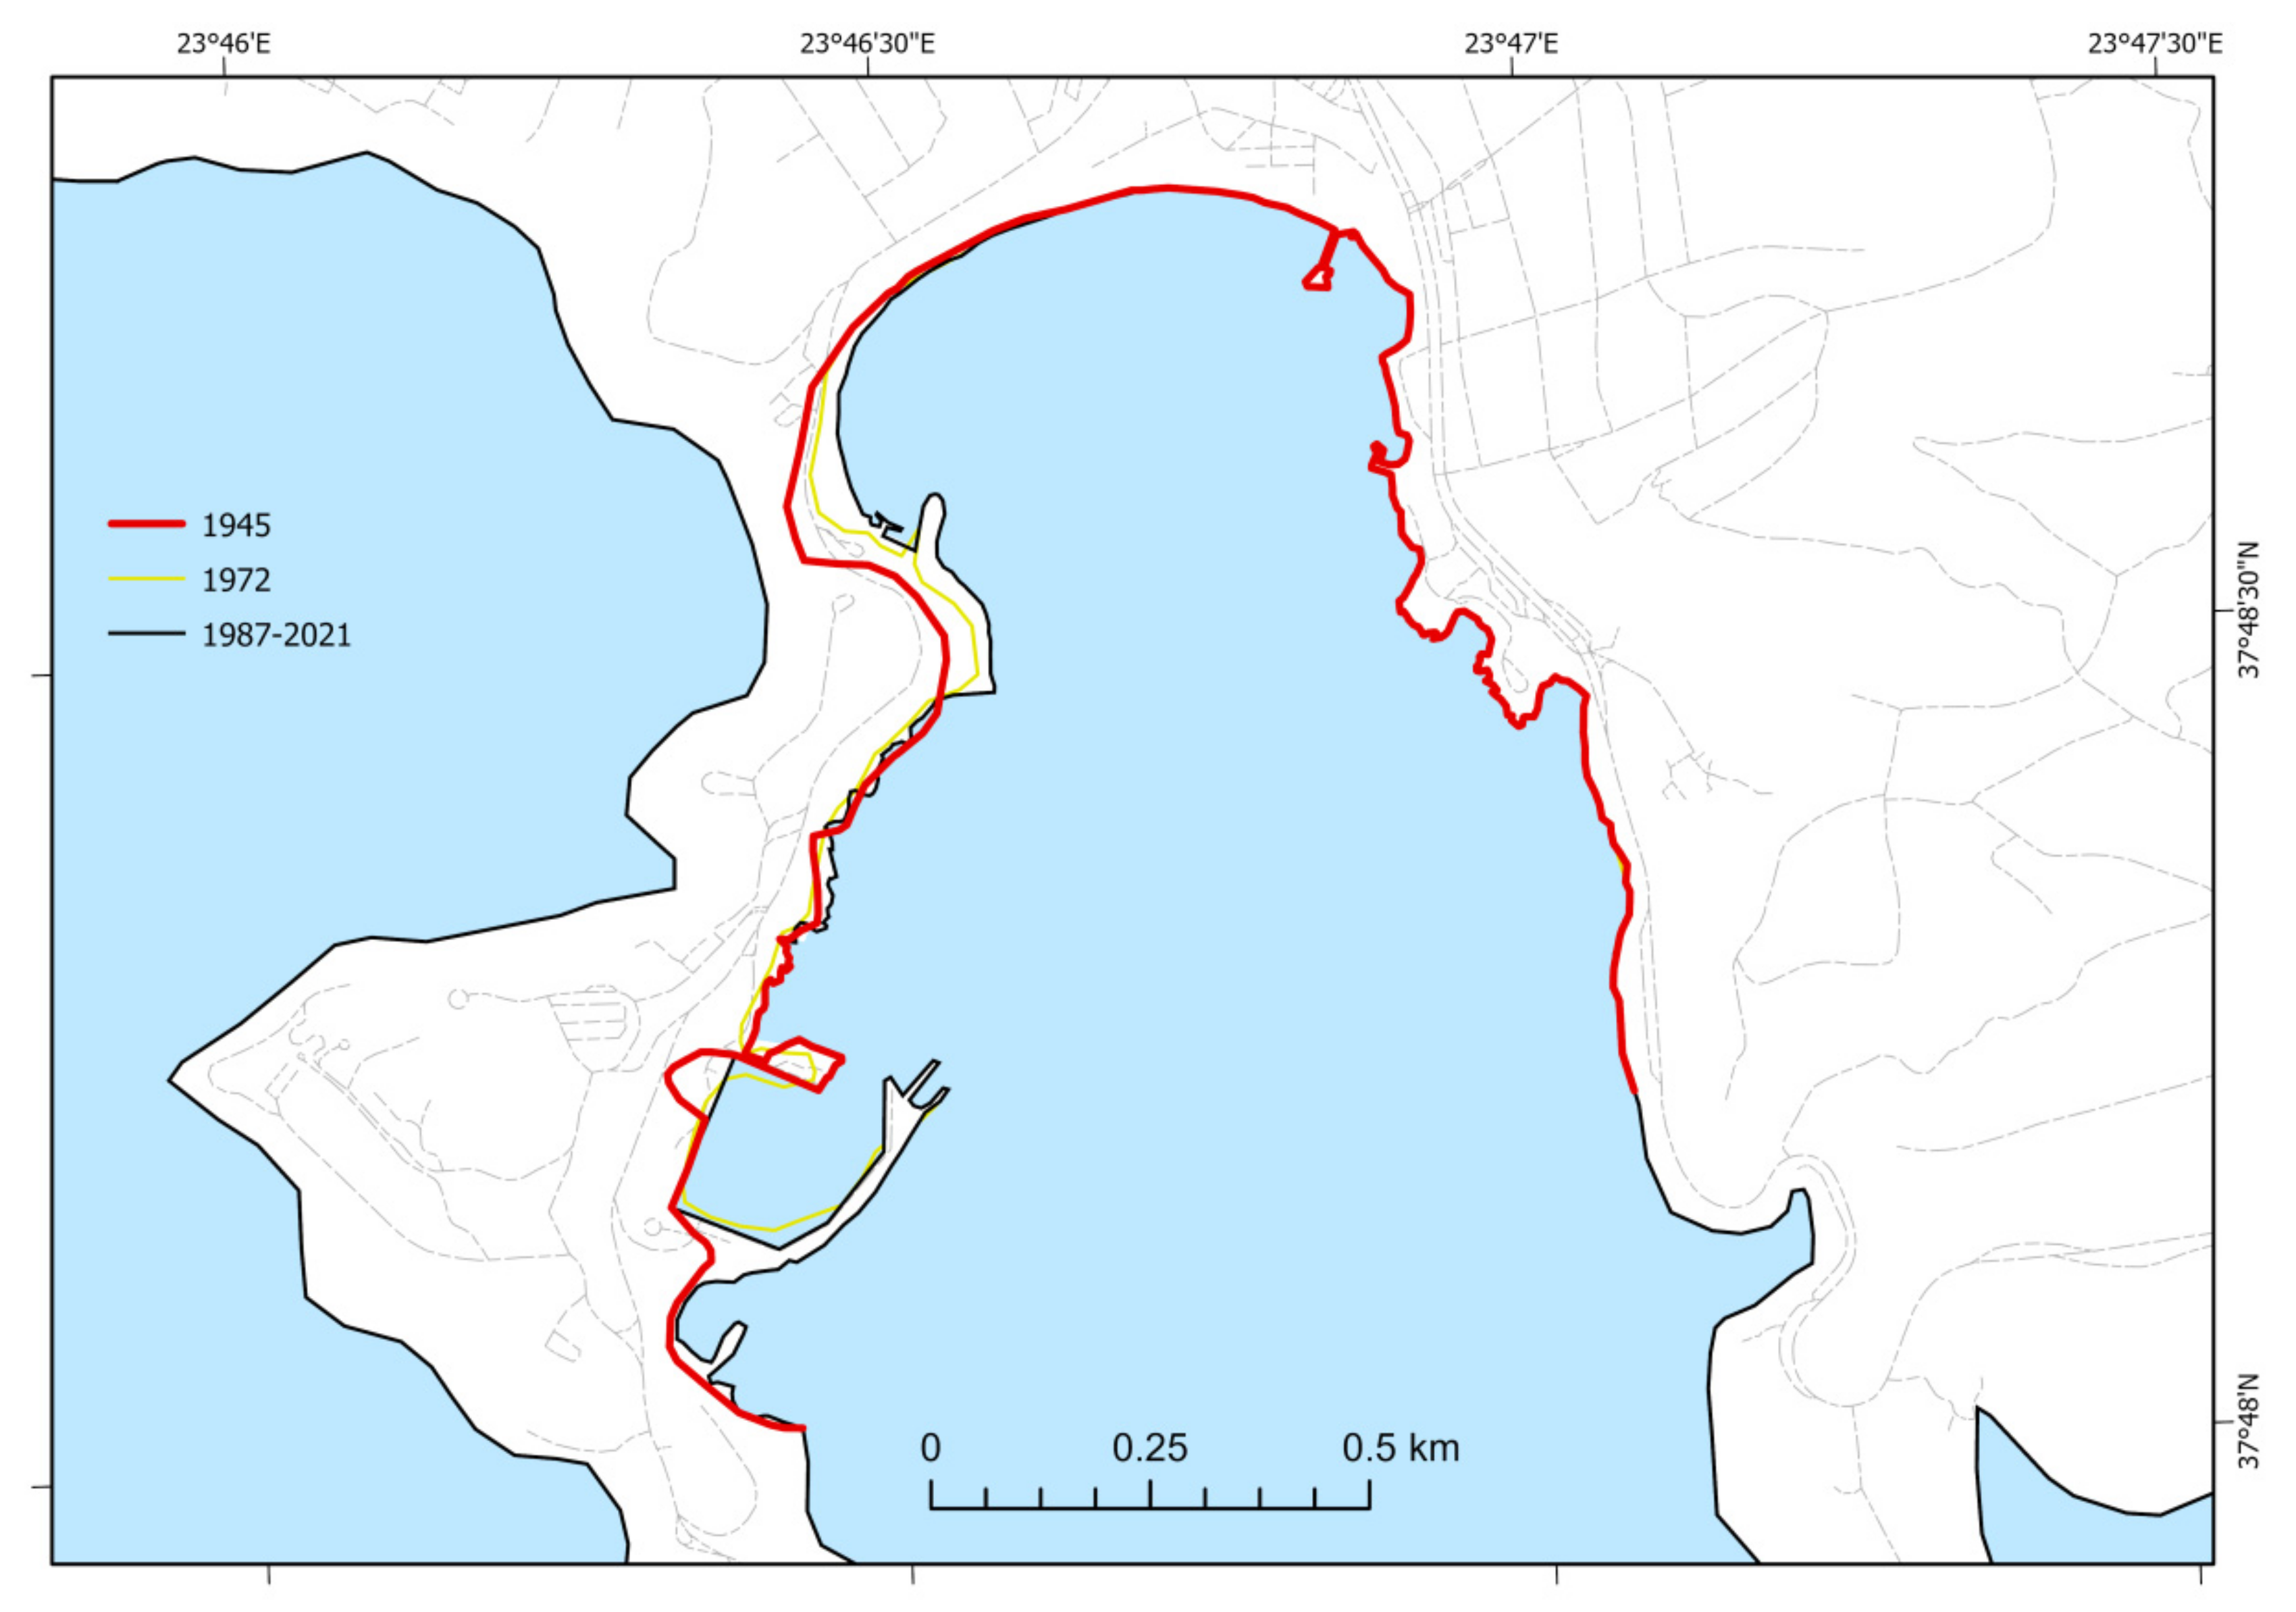
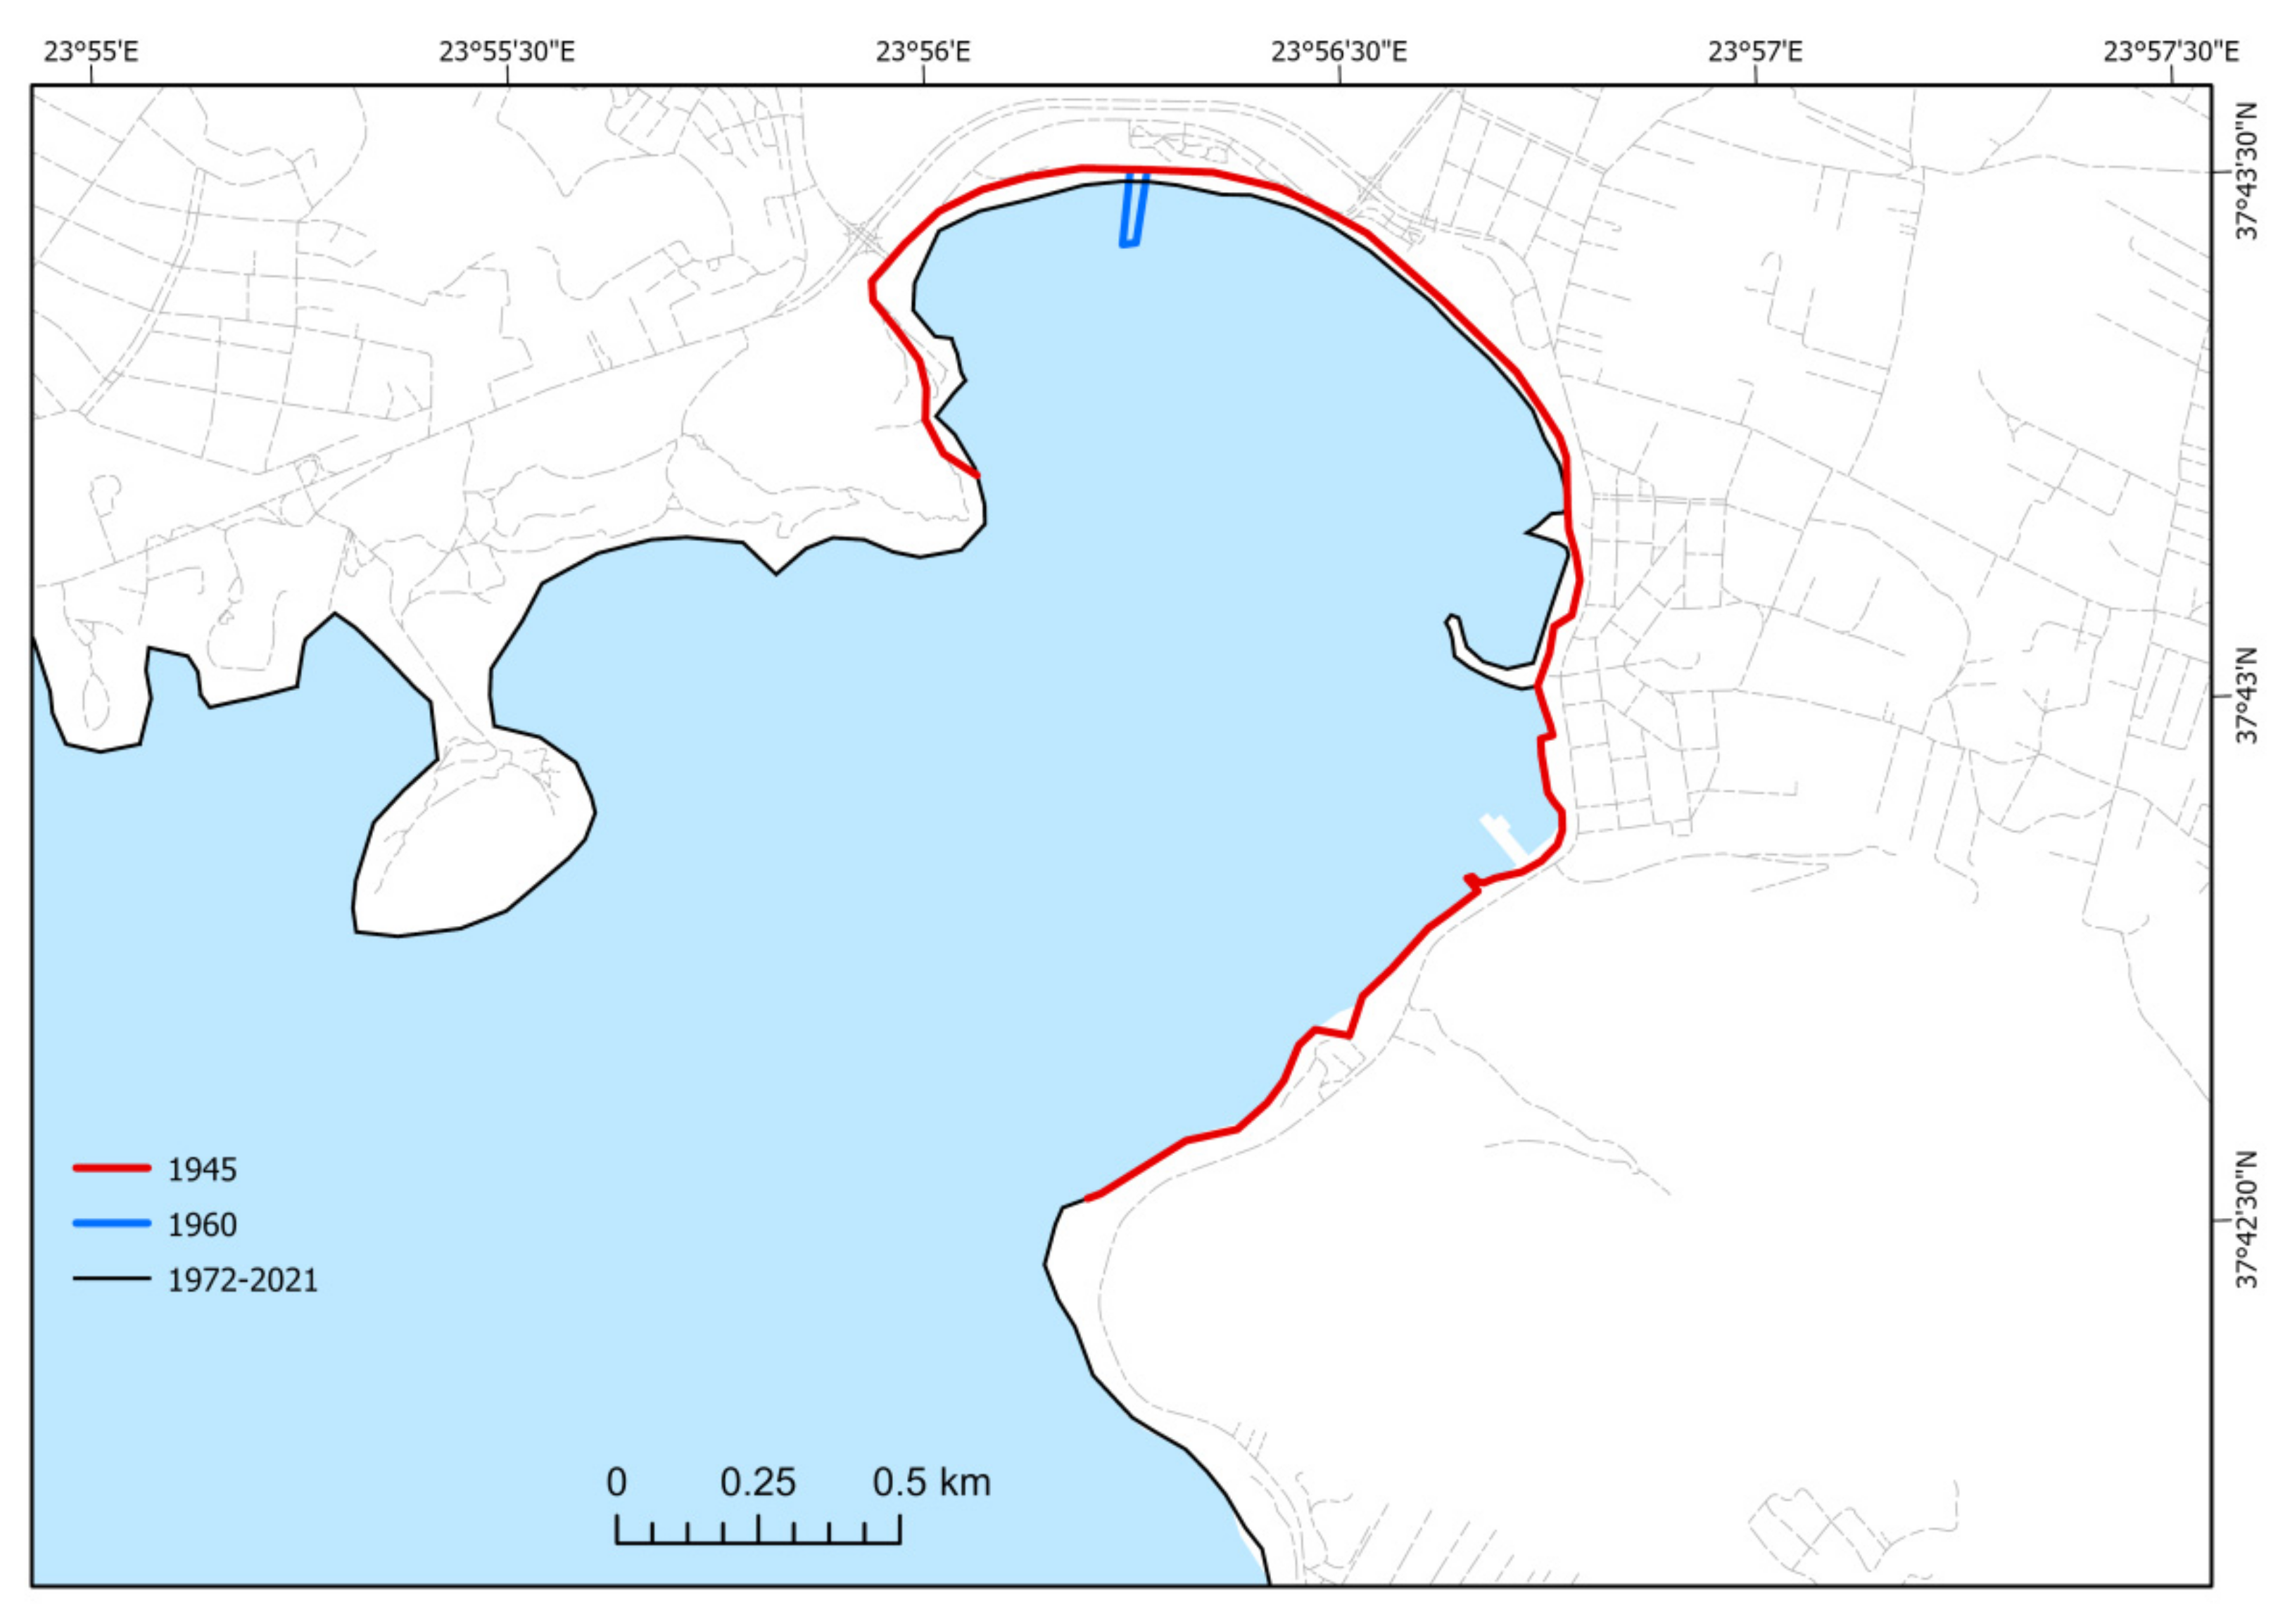
3.6. Vouliagmeni Bay
Figure 8 shows all the coastlines of each year and their temporal changes can be seen. On the coastline of 1945 there were two islands in the western part of the area and on the coast of 1960 the first operation was made with the construction of the marina, which does not extend to the height of the islands. On the other hand, on the coastline of 1972, the extension of the works is clearly visible and the islets are connected on land with the concrete construction of the marina. The coast of 1987 was slightly different from that of 1972 in this area (Table 2 and Table 3).
Another change is observed further north on the beach of Vouliagmeni. The coasts of 1945 and 1960 remained unchanged at this location. The coastline of 1972 showed the first changes, with the construction of a jetty. The final changes of the coastline were made by 1987, following the extension of the pre-existing jetty and the extension of the beach with the artificial deposition of sediments (Figure 8).
3.7. Vari Bay
The consecutive changes of the coastline from 1945 to 1987 are shown in Figure 9. The greatest alterations in the coastline were between the years 1960 and 1972. Particularly, the coasts of 1945 and 1960 were approximately similar without important changes. On the contrary, in 1972 there were the first hints of human interventions (Table 2 and Table 3). In 1987, the final interventions came when new marine works in Varkiza took place as well as coastal management for a beach, which is currently used as recreation area. No temporal changes of the coastline from 1987 to 2021 were recorded (Figure 9, Table 2 and Table 3).
3.8. Anavyssos Bay
In the coastal zone of the Anavyssos Bay, anthropogenic interventions during the period from 1945 to 1972 were not particularly noticeable (Figure 10).
Comparing the coastline of 1987 with those of previous years, we notice the obvious differences (Table 2 and Table 3). The northwestern part of the bay was expanded by small port projects, which were done with the aim of launching small boats. Also, the beach was expanded due to the technical works that were done in the wider area, in order to conduct summer water sports (wind-surfing, etc.). The coastline has remained unchanged from 1987 to 2021 (Figure 10, Table 2 and Table 3).
3.9. Total Coastline Changes in Athens Riviera
Figure 11 illustrates the changes between 1945 and 2021 in Athens Riviera. High changes are observed in the bay of Faliro, in Alimos and Glyfada. The artificial interventions on the coastline are more intense in the areas that are very close to Athens metropolitan area. Small changes are recorded in the southern part of the study area and specifically in the bays of Vouliagmeni, Vari and Anavyssos.
As already mentioned before, the length of the coastline in the study area was estimated to be 122.1 km. The coastline of 1945 was 87.4 km long. Thus, the length of coastline increased by 39% from 1945 to 2021.
As it is shown in Table 3, between 1945 and 2021 the expanded surface approaches the 2.67 km2. This extension caused to the earth filling of the study area and the artificial structures that took place. The area of artificial land varies from 1.27 km2 in Faliro Bay to 0.07 km2 in Anavyssos Bay.
4. Discussion
In the present study, the changes in the coastline of Athenian Riviera were identified during the time interval of 1945–2021. Aerial photos and satellite images were compared in a GIS environment to record and compare the coastlines of the years 1945, 1960, 1972, 1987, 2010 and 2021.
As a first step the artificial coast of the current coastline of the year 2021 were measured. This type of coast corresponds to 60% of the total length of the coastline (Table 1). According to Sengupta et al. [38] the coastal reclamation and the construction of buildings beyond land increase the length of artificial coast line. Therefore the long length of the artificial shoreline in the study area is justified. Moreover, 10% of the European Union’s coastlines are artificial, while more than 8% of the European Mediterranean coastline has been converted into artificial coast [39]. Although, the percentage of artificial coastline of the study area is higher than the average of Europe, it is probably due to the proximity of the study area to the Athens metropolitan area.
In a second step, seven subareas in which human intervention is intense were examined. These areas are: Faliro Bay, Alimos, Glyfada, Voula, Vouliagmeni Bay, Barkiza Bay and Anavyssos Bay. The area in which the highest changes in the coastline were observed because of human interventions is Faliro Bay. According to Table 2 the length of the coastline increased by 287% from 1945 to 2021, because of the artificial expansion of the land to the sea. The increased rate of coastline was 3.8, more specifically because the effects of anthropogenic activities the length of the coastline increased 1% from 1945 to 1960, 80% from 1960 to 1972, 10% from 1972 to 1987, 84% from 1987 to 2021 and 22% from 2010 to 2021. The rates of increase were 0.06 (1945–1960), 6.6 (1960–1972), 0.06 (1972–1987), 3.6 (1987–2010), 2.2 (2010–2020), with a trend of reduction growth. Additionally, the extension of the land to the sea nowadays occupies an area of 1.27 km2 (Figure 12, Table 3). The increase in the length of the artificial coastline as well as the decrease in its growth trend has been observed and in other coastal urban areas. Li et al. [40] compared the coastlines in Xiangshan Bay of China and Tampa Bay of USA from 1985 to 2015 and they resulted that the length of artificial coastline increased first and then maintained stable. Additionally, Faliro bay has undergone extensive coastline modifications and is probably a vulnerable area to a future sea level rise.
Moreover in the other two subareas, Alimos and Glyfada the artificial surfaces took up the coastal area. In Alimos, the length of the coastline increased by 256%, while the artificial interventions covered an area of 0.33 km2 from 1945 to 2021 (Table 2 and Table 3, Figure 12). It should be mentioned that, after the year 2010, no changes in the coastal zone of Alimos were observed. In Glyfada, from 1945 to 2021 the human interventions caused a 194% increase in the length of the coastline and they cover an area of 0.85 km2 (Figure 12). After the year 2010 no changes in the coastline of Glyfada were recorded. These three subareas are suburbs of Athens and are located close to the city Centre. Thus, they are impacted extent of human activities. As it is shown in Table 2, the closer an area is to the capital, the greater the results of artificial interventions in the coastal zone. According to Skilodimou et al. [34] Alimos and Glyfada are locations with high vulnerability to flooding. The elimination of the vegetation cover, the urbanization of the streams and coastal zone, are causes of flooding generation in the study area.
Voula is the subarea with important changes in coastline compared to the other rest subareas. In Voula the length of coastline increased by 31%, while the extended area was 0.02 km2 (Table 2 and Table 3, Figure 12). On the other hand Anavyssos Bay recorded the lowest changes in relation to the other subareas. In this region, the length of the coastline increased by 31%, and the artificial extension of the land towards the sea has an area of 0.09 km2 (Table 2 and Table 3, Figure 12).
The main changes in the coastlines of the seven subareas were from 1960 to 1987. Exceptions are Faliro Bay where changes in coastline were observed until the present, as well as Alimos where the changes were recognized until 2010. According to [33,34], this is because the coastal reclamation project of the study area started in 1970 and was completed before 1987. Thus, although the intensity of human activities was enhanced in Athens Riviera, the degree of changes in coastlines slowed down from 1987 to 2021.
Finally, the total changes in the coastline of Athenian Riviera were examined. The length of coastline was 87.4 km in 1945 and 122.1 km in 2021. During the past 76 years, the coastline was enhanced by 40% while the land reclaimed to the sea area now approaches 2.67 km2 because of human interventions. The growth of urban fronts in the coastal area resulted this artificial increase of coastline length. For example in Asia, Yasir et al. [41] found from 2000 to 2019 a rise of 68% in the length of artificial coastline of Qingdao in East China, compared to the total length of about 500 km. Chee et al. [42] found 21 km of artificial coast in a coastline 106 km-long in Penang Island, in Malaysia. In the Mediterranean Sea, Llorens et al. [43] registered changes in southeastern coastline of Spain due to human land reclaimed to the sea from different times (1956–1957 and 2014–2016). Anthony [44], reports that the Mediterranean coastline has been drastically modified by human interventions over the last two centuries. These modifications have been notably associated with the construction of marinas, leisure harbours and artificial beaches, and have resulted in the emergence of artificial shorelines.
Regarding the applied methodology, aerial photos and remote sensing data are often used to map and estimate the coastline changes worldwide [33,37,43,45]. Aerial photos supply high-resolution images, but they are an expensive and time-consuming process when covering a large area. On the other hand, medium spatial resolution satellite images such as Landsat can be very helpful in the case of provincial, national or global scale temporal mapping processes and are available for free of charge [20]. Another advantage of the method is that aerial photos and remote sensing data can easily and quickly combined and processed in a GIS environment. Thus, it can provide fast and reliable results to the estimation of coastline changes.
Therefore, engineers, planners and environmental managers may utilize the proposed procedure in the recording and monitoring of the coastline changes. Additionally, it may be used by the local authorities to guide the adoption of policies and strategies aiming towards coastal management.
5. Conclusions
The total length of the coastline in Athens Riviera was found to be 122.1 km. Sixty percent of the total length of the coastline are artificial coasts, while rocky coasts and beaches represent 29% and 12% respectively of the total length.
The examination of seven subareas showed that human interventions caused the highest coastline modifications in Faliro Bay. The length of the coastline increased by 287% from 1945 to 2021 and surface of the technically filled area now approaches 1.27 km2. High coastline changes were found in Alimos and Glyfada, while the lowest coastline modification was recognized in Anavyssos Bay. The nearest coastal regions to Athens metropolitan area show the highest modifications in the coastline. The main changes in the coastlines were recorded from 1960 to 1987, with the exception of the coastal area of Faliro Bay and Alimos. The degree of changes in coastline slowed down from 1987 to 2021.
The study of the total changes in the coastline of Athenian Riviera shows that during the past 76 years, the coastline was enhanced by 40% while land reclaimed to the sea area approached 2.67 km2 because of human interventions. Engineers, planners and environmental managers may utilize the proposed method in the recording and monitoring of the coastline changes.
Author Contributions
Conceptualization, H.D.S. and V.A.; methodology, H.D.S., V.A. and G.D.B.; software, V.A. and G.D.B.; validation, G.D.B. and E.T.; formal analysis, E.T.; investigation, H.D.S., V.A. and G.D.B.; resources, H.D.S., V.A., G.D.B. and E.T.; data curation, H.D.S.; writing—original draft preparation, H.D.S.; writing—review and editing, V.A., G.D.B. and E.T.; visualization H.D.S., V.A. and G.D.B.; supervision, H.D.S. and G.D.B. All authors have read and agreed to the published version of the manuscript.
Funding
This research received no external funding.
Data Availability Statement
Data that support the findings of this study are available from the corresponding author upon reasonable request.
Acknowledgments
The constructive and thorough reviews of anonymous reviewers are warmly acknowledged.
Conflicts of Interest
The authors declare no conflict of interest.
References
- Jonah, F.E.; Boateng, I.; Osman, A.; Shimba, M.J.; Mensah, E.A.; Adu-Boahen, K.; Chuku, E.O.; Effah, E. Shoreline change analysis using end point rate and net shoreline movement statistics: An application to Elmina, Cape Coast and More section of Ghana’s coast. Reg. Stud. Mar. Sci. 2016, 7, 19–31. [Google Scholar] [CrossRef] [Green Version]
- United Nations. Facsheet: People and Oceans. In Proceedings of the Ocean Conference, New York, NY, USA, 5–9 June 2017; 2017; pp. 1–7. Available online: https://www.un.org/sustainabledevelopment/wp-content/uploads/2017/05/Ocean-fact-sheet-package.pdf (accessed on 10 July 2021).
- Dolan, R.; Hayden, B.P.; May, P.; May, S.K. The reliability of shoreline change measurements from aerial photographs. Shore Beach 1980, 48, 22–29. [Google Scholar]
- Boak, E.H.; Turner, I.L. Shoreline definition and detection: A review. J. Coast. Res. 2005, 21, 688–703. [Google Scholar] [CrossRef] [Green Version]
- Douglas, B.C.; Crowell, M. Long-term shoreline position prediction and error propagation. J. Coast. Res. 2000, 16, 145–152. [Google Scholar]
- Pirazzoli, P.A. Global sea-level changes and their measurement. Glob. Planet. Chang. 1993, 8, 135–148. [Google Scholar] [CrossRef]
- Dean, R.G.; Houston, J.R. Determining shoreline response to sea level rise. Coast. Eng. 2016, 114, 1–8. [Google Scholar] [CrossRef]
- Bathrellos, G.D.; Skilodimou, H.D.; Maroukian, H. The significance of tectonism in the glaciations of Greece. Geol. Soc. SP 2017, 433, 237–250. [Google Scholar] [CrossRef]
- Pendleton, E.A.; Thieler, E.R.; Williams, S.J. Importance of coastal change variables in determining vulnerability to sea-and lake-level change. J. Coast. Res. 2010, 26, 176–183. [Google Scholar] [CrossRef]
- Currin, C.A. Living Shorelines for Coastal Resilience. Coast. Worl. 2019, 2, 1023–1053. [Google Scholar]
- Manca, E.; Pascucci, V.; Deluca, M.; Cossu, A.; Andreucci, S. Shoreline evolution related to coastal development of a managed beach in Alghero, Sardinia, Italy. Ocean Coast. Manag. 2013, 85, 65–76. [Google Scholar] [CrossRef]
- Kalther, J.; Itaya, A. Coastline changes and their effects on land use and cover in Subang, Indonesia. J. Coast. Conserv. 2020, 24, 1–9. [Google Scholar] [CrossRef]
- Almonacid-Caballer, J.; Sánchez-García, E.; Pardo-Pascual, J.E.; Balaguer-Beser, A.A.; Palomar-Vázquez, J. Evaluation of annual mean shoreline position deduced from Landsat imagery as a mid-term coastal evolution indicator. Mar. Geol. 2016, 372, 79–88. [Google Scholar] [CrossRef]
- Skilodimou, H.D.; Bathrellos, G.D.; Maroukian, H.; Gaki-Papanastassiou, K. Late Quaternary evolution of the lower reaches of Ziliana stream in south Mt. Olympus (Greece). Geogr. Fis. Din. Quat. 2014, 37, 43–50. [Google Scholar] [CrossRef]
- Kokinou, E.; Skilodimou, H.D.; Bathrellos, G.D.; Antonarakou, A.; Kamberis, E. Morphotectonic analysis, structural evolution/pattern of a contractional ridge: Giouchtas Mt., Central Crete, Greece. J. Earth Syst. Sci. 2015, 124, 587–602. [Google Scholar] [CrossRef] [Green Version]
- Bathrellos, G.D.; Skilodimou, H.D.; Soukis, K.; Koskeridou, E. Temporal and spatial analysis of flood occurrences in drainage basin of Pinios River (Thessaly, central Greece). Land 2018, 7, 106. [Google Scholar] [CrossRef] [Green Version]
- Bio, A.; Bastos, L.; Granja, H.M.; Pinho, J.L.; Gonçalves, J.A.; Henriques, R.F.; Madeira, D.; Magalhães, A.; Rodrigues, D. Methods for coastal monitoring and erosion risk assessment: Two Portuguese case studies. J. Integr. Coast. Zone Manag. 2015, 15, 47–63. [Google Scholar] [CrossRef] [Green Version]
- Bathrellos, G.D.; Skilodimou, H.D. Land use planning for natural hazards. Land 2019, 8, 128. [Google Scholar] [CrossRef] [Green Version]
- Saxena, S.; Purvaja, R.; Suganya, G.M.D.; Ramesh, R. Coastal hazard mapping in the Cuddalore region, South India. Nat. Hazards 2013, 66, 1519–1536. [Google Scholar] [CrossRef]
- Warnasuriya, T.W.S.; Gunaalan, K.; Gunasekara, S.S. Google earth: A new resource for shoreline change estimation–Case study from Jaffna Peninsula, Sri Lanka. Mar. Geod. 2018, 41, 546–580. [Google Scholar] [CrossRef]
- Li, J.; Ye, M.; Pu, R.; Liu, Y.; Guo, Q.; Feng, B.; He, G. Spatiotemporal change patterns of coastlines in Zhejiang Province, China, over the last twenty-five years. Sustainability 2018, 10, 477. [Google Scholar] [CrossRef] [Green Version]
- Bathrellos, G.D.; Skilodimou, H.D.; Maroukian, H.; Gaki-Papanastassiou, K.; Kouli, K.; Tsourou, T.; Tsaparas, N. Pleistocene glacial and lacustrine activity in the southern part of Mount Olympus (central Greece). Area 2017, 49, 137–147. [Google Scholar] [CrossRef]
- Tsolaki-Fiaka, S.; Bathrellos, G.D.; Skilodimou, H.D. Multi-Criteria Decision Analysis for an Abandoned Quarry in the Evros Region (NE Greece). Land 2018, 7, 43. [Google Scholar] [CrossRef] [Green Version]
- Rahmati, O.; Zeinivand, H.; Besharat, M. Flood hazard zoning in Yasooj region, Iran, using GIS and multi-criteria decision analysis. Geomat. Nat. Hazards Risk 2016, 7, 1000–1017. [Google Scholar] [CrossRef] [Green Version]
- Bathrellos, G.D.; Skilodimou, H.D.; Zygouri, V.; Koukouvelas, I.K. Landslide: A recurrent phenomenon? Landslide hazard assessment in mountainous areas of central Greece. Z. Geomorphol. 2021, 63, 95–114. [Google Scholar] [CrossRef]
- Youssef, A.M.; Abu-Abdullah, M.M.; AlFadail, E.A.; Skilodimou, H.D.; Bathrellos, G.D. The devastating flood in the arid region a consequence of rainfall and dam failure: Case study, Al-Lith flood on 23th November 2018, Kingdom of Saudi Arabia. Z. Geomorphol. 2021, 63, 115–136. [Google Scholar] [CrossRef]
- Alexakis, D.E.; Bathrellos, G.D.; Skilodimou, H.D.; Gamvroula, D.E. Land suitability mapping using geochemical and spatial analysis methods. Appl. Sci. 2021, 11, 5404. [Google Scholar] [CrossRef]
- Karpouza, M.; Chousianitis, K.; Bathrellos, G.D.; Skilodimou, H.D.; Kaviris, G.; Antonarakou, A. Hazard zonation mapping of earthquake-induced secondary effects using spatial multi-criteria analysis. Nat. Hazards 2021, 5, 1–33. [Google Scholar]
- Skilodimou, H.D.; Bathrellos, G.D.; Chousianitis, K.; Youssef, A.M.; Pradhan, B. Multi-hazard assessment modeling via multi-criteria analysis and GIS: A case study. Environ. Earth Sci. 2019, 78, 47. [Google Scholar] [CrossRef]
- Alexakis, D.E.; Bathrellos, G.D.; Skilodimou, H.D.; Gamvroula, D.E. Spatial distribution and evaluation of Arsenic and Zinc content in the soil of a karst landscape. Sustainability 2021, 13, 6976. [Google Scholar] [CrossRef]
- Bathrellos, G.D.; Karymbalis, E.; Skilodimou, H.D.; Gaki-Papanastassiou, K.; Baltas, E.A. Urban flood hazard assessment in the basin of Athens Metropolitan city, Greece. Environ. Earth Sci. 2016, 75, 319. [Google Scholar] [CrossRef]
- Makri, P.; Stathopoulou, E.; Hermides, D.; Kontakiotis, G.; Zarkogiannis, S.D.; Skilodimou, H.D.; Bathrellos, G.D.; Antonarakou, A.; Scoullos, M. The Environmental Impact of a Complex Hydrogeological System on Hydrocarbon-Pollutants’ Natural Attenuation: The Case of the Coastal Aquifers in Eleusis, West Attica, Greece. J. Mar. Sci. Eng. 2020, 8, 1018. [Google Scholar] [CrossRef]
- Skilodimou, H.D.; Stefouli, M.T.; Bathrellos, G.D. Spatio-temporal analysis of the coastline of Faliro Bay, Attica, Greece. Estud. Geol. 2002, 58, 87–93. [Google Scholar] [CrossRef]
- Skilodimou, H.D.; Livaditis, G.; Bathrellos, G.D.; Verikiou-Papaspiridakou, E. Investigating the flooding events of the urban regions of Glyfada and Voula, Attica, Greece: A contribution to Urban Geomorphology. Geogr. Ann. A 2003, 85, 197–204. [Google Scholar] [CrossRef]
- Skilodimou, H.D.; Bathrellos, G.D.; Alexakis, D.E. Flood Hazard Assessment Mapping in Burned and Urban Areas. Sustainability 2021, 13, 4455. [Google Scholar] [CrossRef]
- Aernouts, D.; Héquette, A. L’évolution du rivage et des petits-fonds en baie de Wissant pendant le XXe siècle (Pas-de-Calais, France). Géomorphologie 2006, 12, 49–64. Available online: http://journals.openedition.org/geomorphologie/477 (accessed on 10 July 2021). [CrossRef] [Green Version]
- Otmani, H.; Belkessa, R.; Bengoufa, S.; Boukhediche, W.; Djerrai, N.; Abbad, K. Assessment of shoreline dynamics on the Eastern Coast of Algiers (Algeria): A spatiotemporal analysis using in situ measurements and geospatial tools. Arab. J. Geosci. 2020, 13, 1–15. [Google Scholar] [CrossRef]
- Sengupta, D.; Chen, R.; Meadows, M.E. Building beyond land: An overview of coastal land reclamation in 16 global megacities. Appl. Geogr. 2018, 90, 229–238. [Google Scholar] [CrossRef]
- European Environmental Agency. The Changing Faces of Europe’s Coastal Areas. EEA 2006, 6. Available online: https://www.eea.europa.eu/publications/eea_report_2006_6 (accessed on 10 July 2021).
- Li, J.; Liu, Y.; Pu, R.; Yuan, Q.; Shi, X.; Guo, Q.; Song, X. Coastline and landscape changes in bay areas caused by human activities: A comparative analysis of Xiangshan Bay, China and Tampa Bay, USA. J. Geogr. Sci. 2018, 28, 1127–1151. [Google Scholar] [CrossRef] [Green Version]
- Yasir, M.; Hui, S.; Hongxia, Z.; Hossain, M.S.; Fan, H.; Zhang, L.; Jixiang, Z. A Spatiotemporal Change Detection Analysis of Coastline Data in Qingdao, East China. Sci. Program. 2021, 2021, 6632450. [Google Scholar] [CrossRef]
- Chee, S.Y.; Othman, A.G.; Sim, Y.K.; Adam, A.N.M.; Firth, L.B. Land reclamation and artificial islands: Walking the tightrope between development and conservation. Glob. Ecol. Conserv. 2017, 12, 80–95. [Google Scholar] [CrossRef] [Green Version]
- Llorens, P.M.; Pedreño, J.N.; Mingorance, J.M.S. Coastal line changes in Mediterranean cities: Man or nature? WTBE 2018, 179, 103–112. [Google Scholar]
- Anthony, E.J. The Human influence on the Mediterranean coast over the last 200 years: A brief appraisal from a geomorphological perspective. Geomorphol. Relief Process. Environ. 2014, 20, 219–226. [Google Scholar] [CrossRef] [Green Version]
- Xu, N.; Gao, Z.; Ning, J. Analysis of the characteristics and causes of coastline variation in the Bohai Rim (1980–2010). Environ. Earth Sci. 2016, 75, 719. [Google Scholar] [CrossRef]
Figure 1.
(A) Location map of the study area; (B) the elevations of the study area, the road network and the main towns.
Figure 1.
(A) Location map of the study area; (B) the elevations of the study area, the road network and the main towns.

Figure 2.
Spatial distribution of subareas in which the shoreline changes were measured.

Figure 3.
Classification of the coastline based on 2021 imagery and fieldwork. The north part of the study area is characterized as mainly artificial.
Figure 3.
Classification of the coastline based on 2021 imagery and fieldwork. The north part of the study area is characterized as mainly artificial.

Figure 4.
Changes of the Faliro coastline from 1945 to 2021.

Figure 5.
Changes of the Alimos coastline from 1945 to 2021.

Figure 6.
The coastlines of Glyfada from 1945 to 2021.

Figure 7.
The locations of the coastline from 1945 to 2021 in the coastal zone of Voula.

Figure 8.
The coastlines and their temporal changes from 1945 to 2021 in Vouliagmeni Bay.

Figure 9.
The coastlines of Vari Bay from 1945 to 2021.

Figure 10.
The coastline changes from 1945 to 2021 in Anavyssos Bay.

Figure 11.
The coastlines of 1945 and 2021 as well as their temporal changes in Athens Riviera.

Figure 12.
Graphical presentation of land increase in each examined year for the seven subareas.


Table 1.
The type of coasts, their length and percentage.
| Type of Coast | Length (in km) | Percentage (%) |
|---|---|---|
| Beaches | 14.8 | 12 |
| Rocky | 35.6 | 29 |
| Artificial | 71.8 | 59 |
| Total | 122.1 | 100 |
Table 2.
The lengths of the coastline in each year, the changes in length (in km) and their percentage (%) between different years for each subarea.
Table 2.
The lengths of the coastline in each year, the changes in length (in km) and their percentage (%) between different years for each subarea.
| Subarea | Faliro Bay | Alimos | Glyfada | Voula | Vouliagmeni Bay | Vari Bay | Anavyssos Bay | ||
|---|---|---|---|---|---|---|---|---|---|
| Length in meters | |||||||||
| Year | 1945 | 5279 | 2895 | 4543 | 1137 | 4330 | 5900 | 3803 | |
| 1960 | 5316 | 2911 | 4543 | 1477 | 4330 | 5900 | 4061 | ||
| 1972 | 9569 | 4339 | no data | 1459 | 5171 | 6452 | 4192 | ||
| 1987 | 10,480 | 10,171 | 13,368 | 1486 | 5504 | 6452 | 4192 | ||
| 2010 | 19,267 | 10,300 | 13,368 | 1486 | 5513 | 6452 | 4192 | ||
| 2020 | 20,407 | 10,300 | 13,368 | 1486 | 5513 | 6452 | 4192 | ||
| Changes in length | m | 1945–1960 | 37 | 16 | 0 | 340 | 0 | 0 | 258 |
| % | 1 | 1 | 0 | 30 | 0 | 0 | 7 | ||
| m | 1960–1972 | 4253 | 1428 | no data | −18 | 841 | 552 | 51 | |
| % | 80 | 49 | no data | −1 | 19 | 9 | 1 | ||
| m | 1972–1987 | 911 | 5832 | no data | 27 | 333 | 844 | 0 | |
| % | 10 | 134 | no data | 2 | 6 | 13 | 0 | ||
| m | 1987–2010 | 8787 | 129 | 0 | 0 | 9 | 0 | 0 | |
| % | 84 | 1 | 0 | 0 | 0.2 | 0 | 0 | ||
| m | 2010–2021 | 1140 | 0 | 0 | 0 | 0 | 0 | 0 | |
| % | 6 | 0 | 0 | 0 | 0 | 0 | |||
| m | 1945–2021 | 15,128 | 7405 | 8825 | 349 | 1183 | 552 | 389 | |
| % | 287 | 256 | 194 | 31 | 27 | 9 | 10 | ||
Table 3.
The extended areas in each year, the changes in area (in km2) and their percentage (%) between different years for each subarea.
Table 3.
The extended areas in each year, the changes in area (in km2) and their percentage (%) between different years for each subarea.
| Subarea | Faliro Bay | Alimos | Glyfada | Voula | Vouliagmeni Bay | Vari Bay | Anavyssos Bay | ||
|---|---|---|---|---|---|---|---|---|---|
| Area in km2 | |||||||||
| Year | 1960 | 0.07 | 0.00 | 0.00 | −0.02 | 0.00 | 0.00 | 0.00 | |
| 1972 | 0.07 | 0.00 | no data | 0.02 | 0.02 | 0.00 | 0.00 | ||
| 1987 | 1.06 | 0.29 | 0.85 | 0.02 | 0.05 | 0.09 | 0.07 | ||
| 2010 | 1.26 | 0.33 | 0.85 | 0.02 | 0.05 | 0.09 | 0.07 | ||
| 2020 | 1.27 | 0.33 | 0.85 | 0.02 | 0.05 | 0.09 | 0.07 | ||
| Changes in area | km2 | 1945–1960 | 0.07 | 0.00 | 0.00 | −0.02 | 0.00 | 0.00 | 0.00 |
| km2 | 1960–1972 | 0.00 | 0.00 | no data | 0.02 | 0.02 | 0.00 | 0.00 | |
| % | 0 | 0 | 0 | 200 | 0 | 0 | |||
| km2 | 1972–1987 | 1.00 | 0.29 | 0.85 | 0.02 | 0.05 | 0.09 | 0.07 | |
| % | 1510 | 0 | 112 | ||||||
| km2 | 1987–2010 | 0.19 | 0.33 | 0.00 | 0.00 | 0.00 | 0.00 | 0.00 | |
| % | 18 | 113 | 0 | 0 | 0 | 0 | 0 | ||
| km2 | 2010–2021 | 0.09 | 0.00 | 0.00 | 0.00 | 0.00 | 0.00 | 0.00 | |
| % | 1 | 0 | 0 | 0 | 0 | 0 | 0 | ||
| km2 | 1945–2021 | 1.27 | 0.33 | 0.85 | 0.02 | 0.05 | 0.09 | 0.07 | |
| % | 1922 | 113 | 200 | 112 | |||||
Publisher’s Note: MDPI stays neutral with regard to jurisdictional claims in published maps and institutional affiliations. |
© 2021 by the authors. Licensee MDPI, Basel, Switzerland. This article is an open access article distributed under the terms and conditions of the Creative Commons Attribution (CC BY) license (https://creativecommons.org/licenses/by/4.0/).
Share and Cite
MDPI and ACS Style
Skilodimou, H.D.; Antoniou, V.; Bathrellos, G.D.; Tsami, E. Mapping of Coastline Changes in Athens Riviera over the Past 76 Year’s Measurements. Water 2021, 13, 2135. https://doi.org/10.3390/w13152135
AMA Style
Skilodimou HD, Antoniou V, Bathrellos GD, Tsami E. Mapping of Coastline Changes in Athens Riviera over the Past 76 Year’s Measurements. Water. 2021; 13(15):2135. https://doi.org/10.3390/w13152135
Chicago/Turabian StyleSkilodimou, Hariklia D., Vasileios Antoniou, George D. Bathrellos, and Eleni Tsami. 2021. "Mapping of Coastline Changes in Athens Riviera over the Past 76 Year’s Measurements" Water 13, no. 15: 2135. https://doi.org/10.3390/w13152135
Note that from the first issue of 2016, this journal uses article numbers instead of page numbers. See further details here.