
Mesocosm- and Field-Scale Evaluation of Lignocellulose- Amended Soil Treatment Areas for Removal of Nitrogen from Wastewater


Abstract
:1. Introduction
2. Materials and Methods
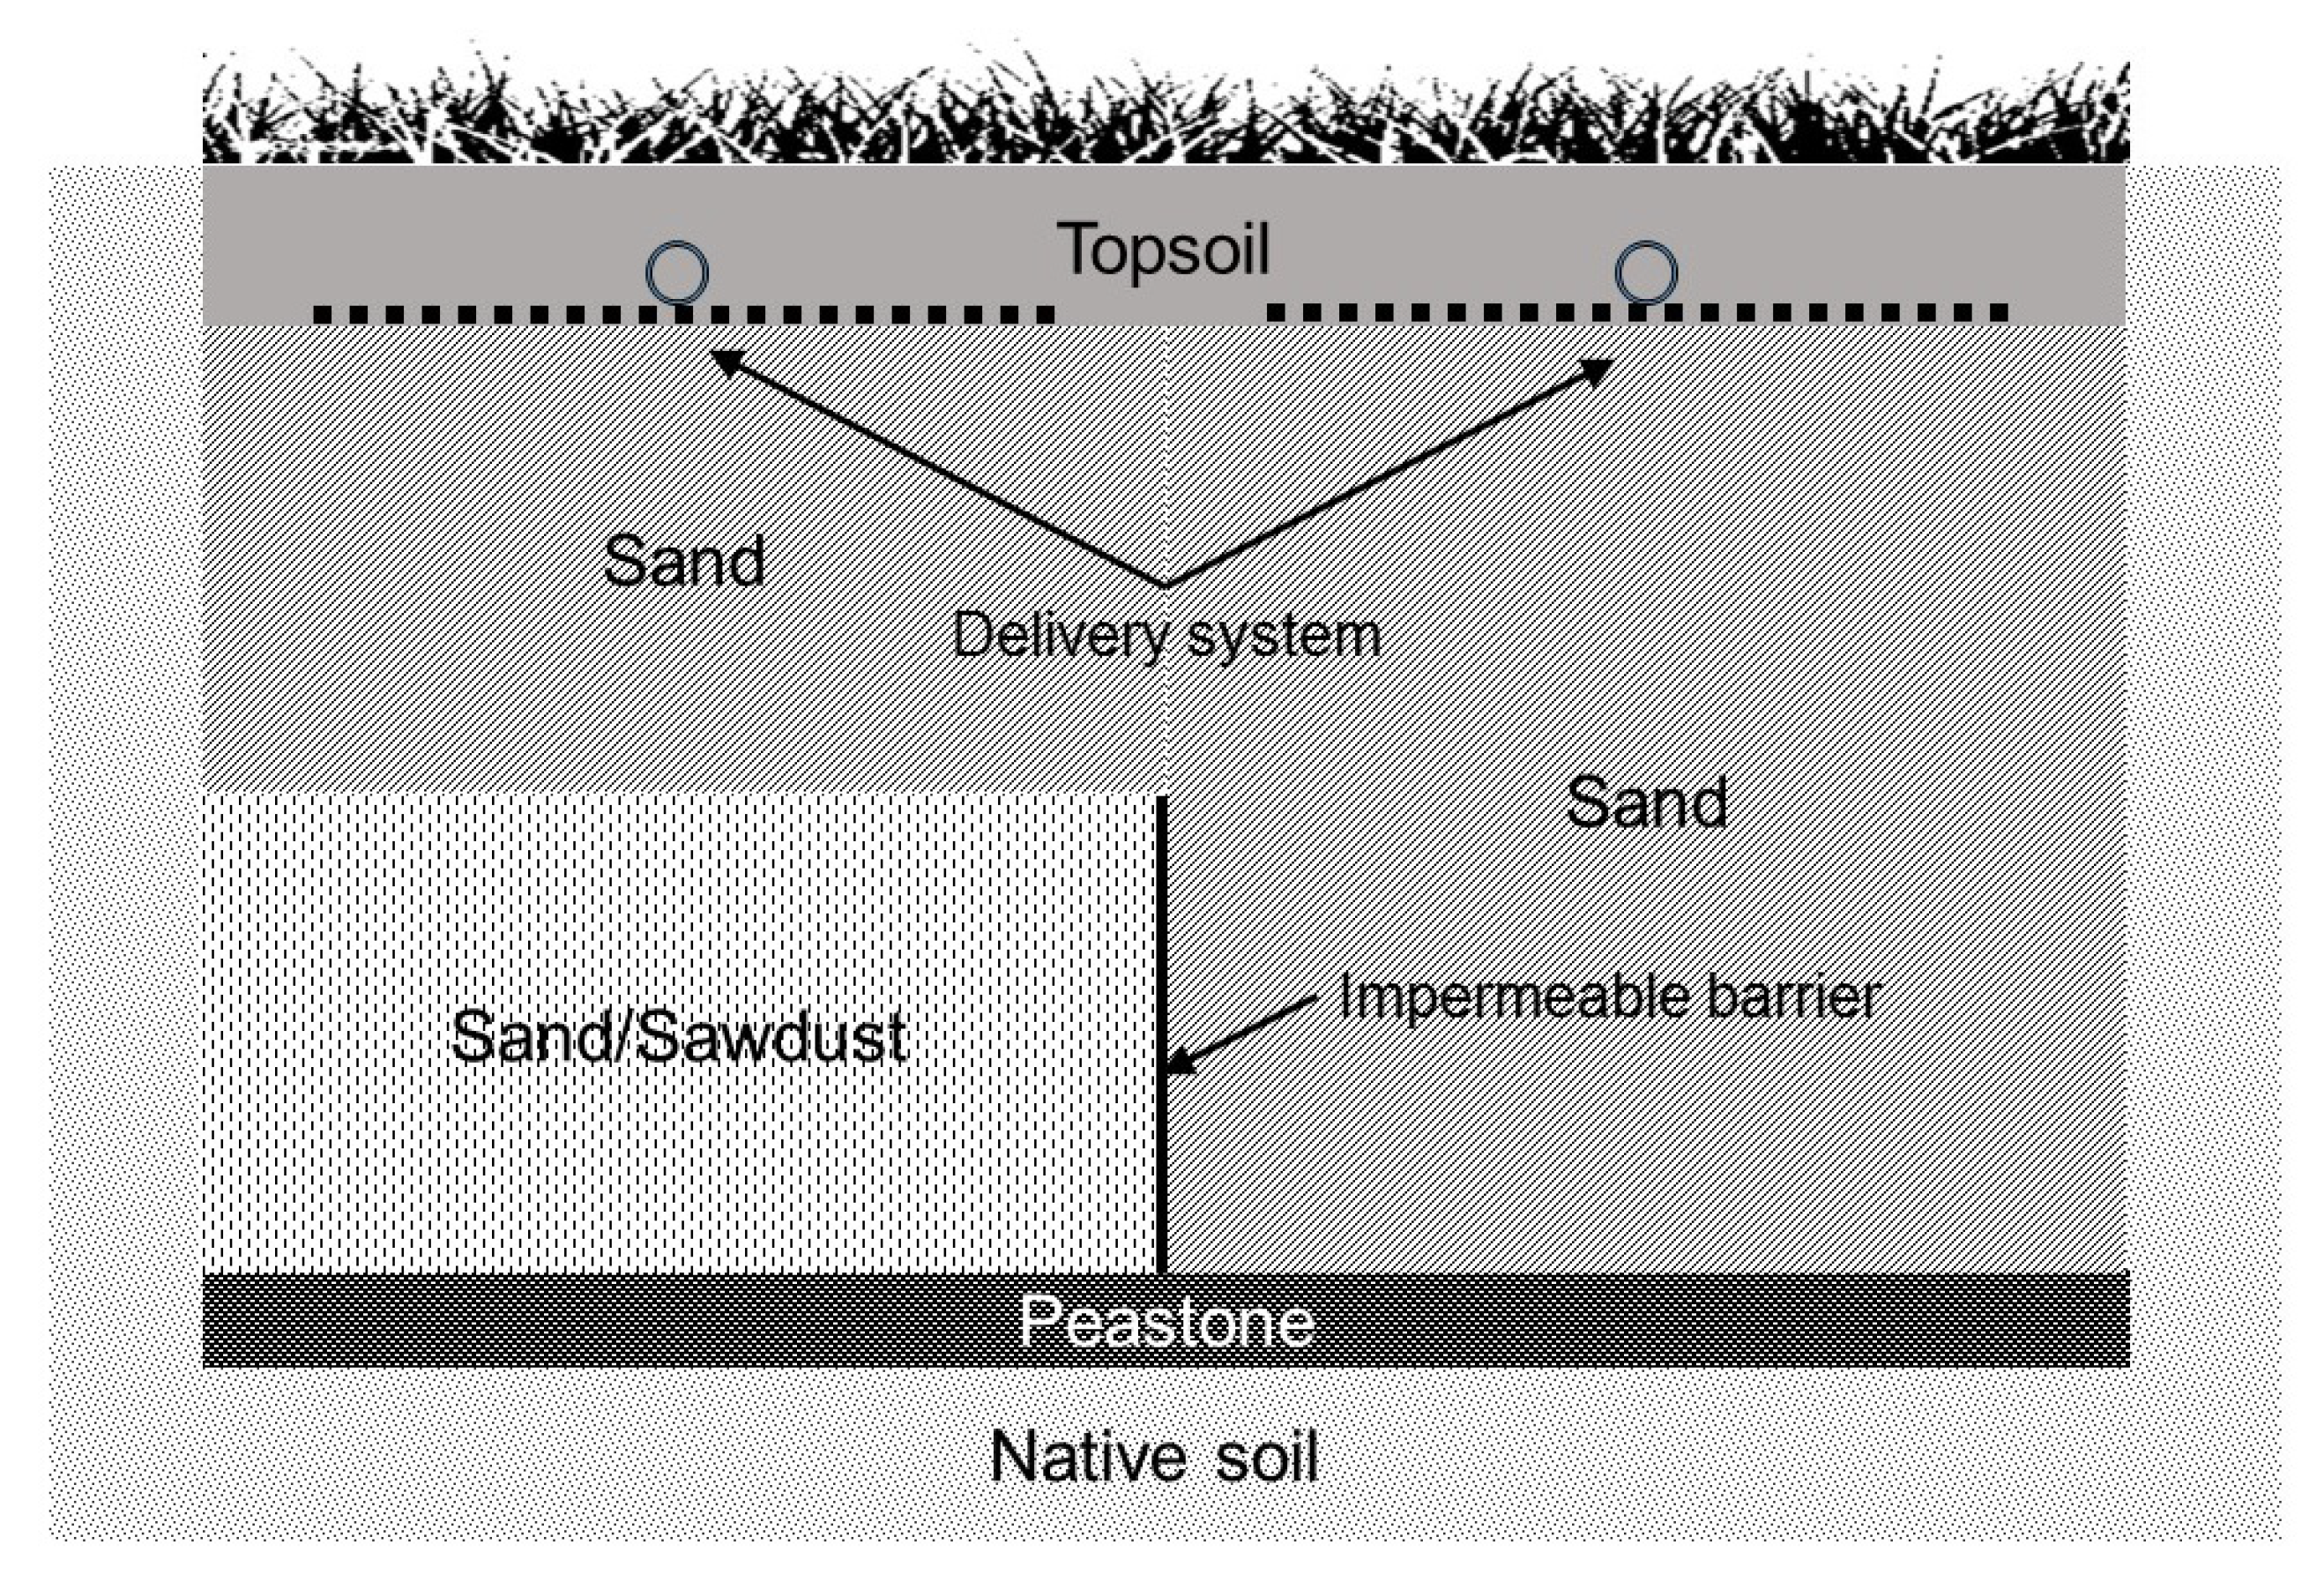
2.1. Mesocosm
2.2. Field Systems
2.3. Sampling and Analysis
2.4. Statistical Analyses
3. Results and Discussion
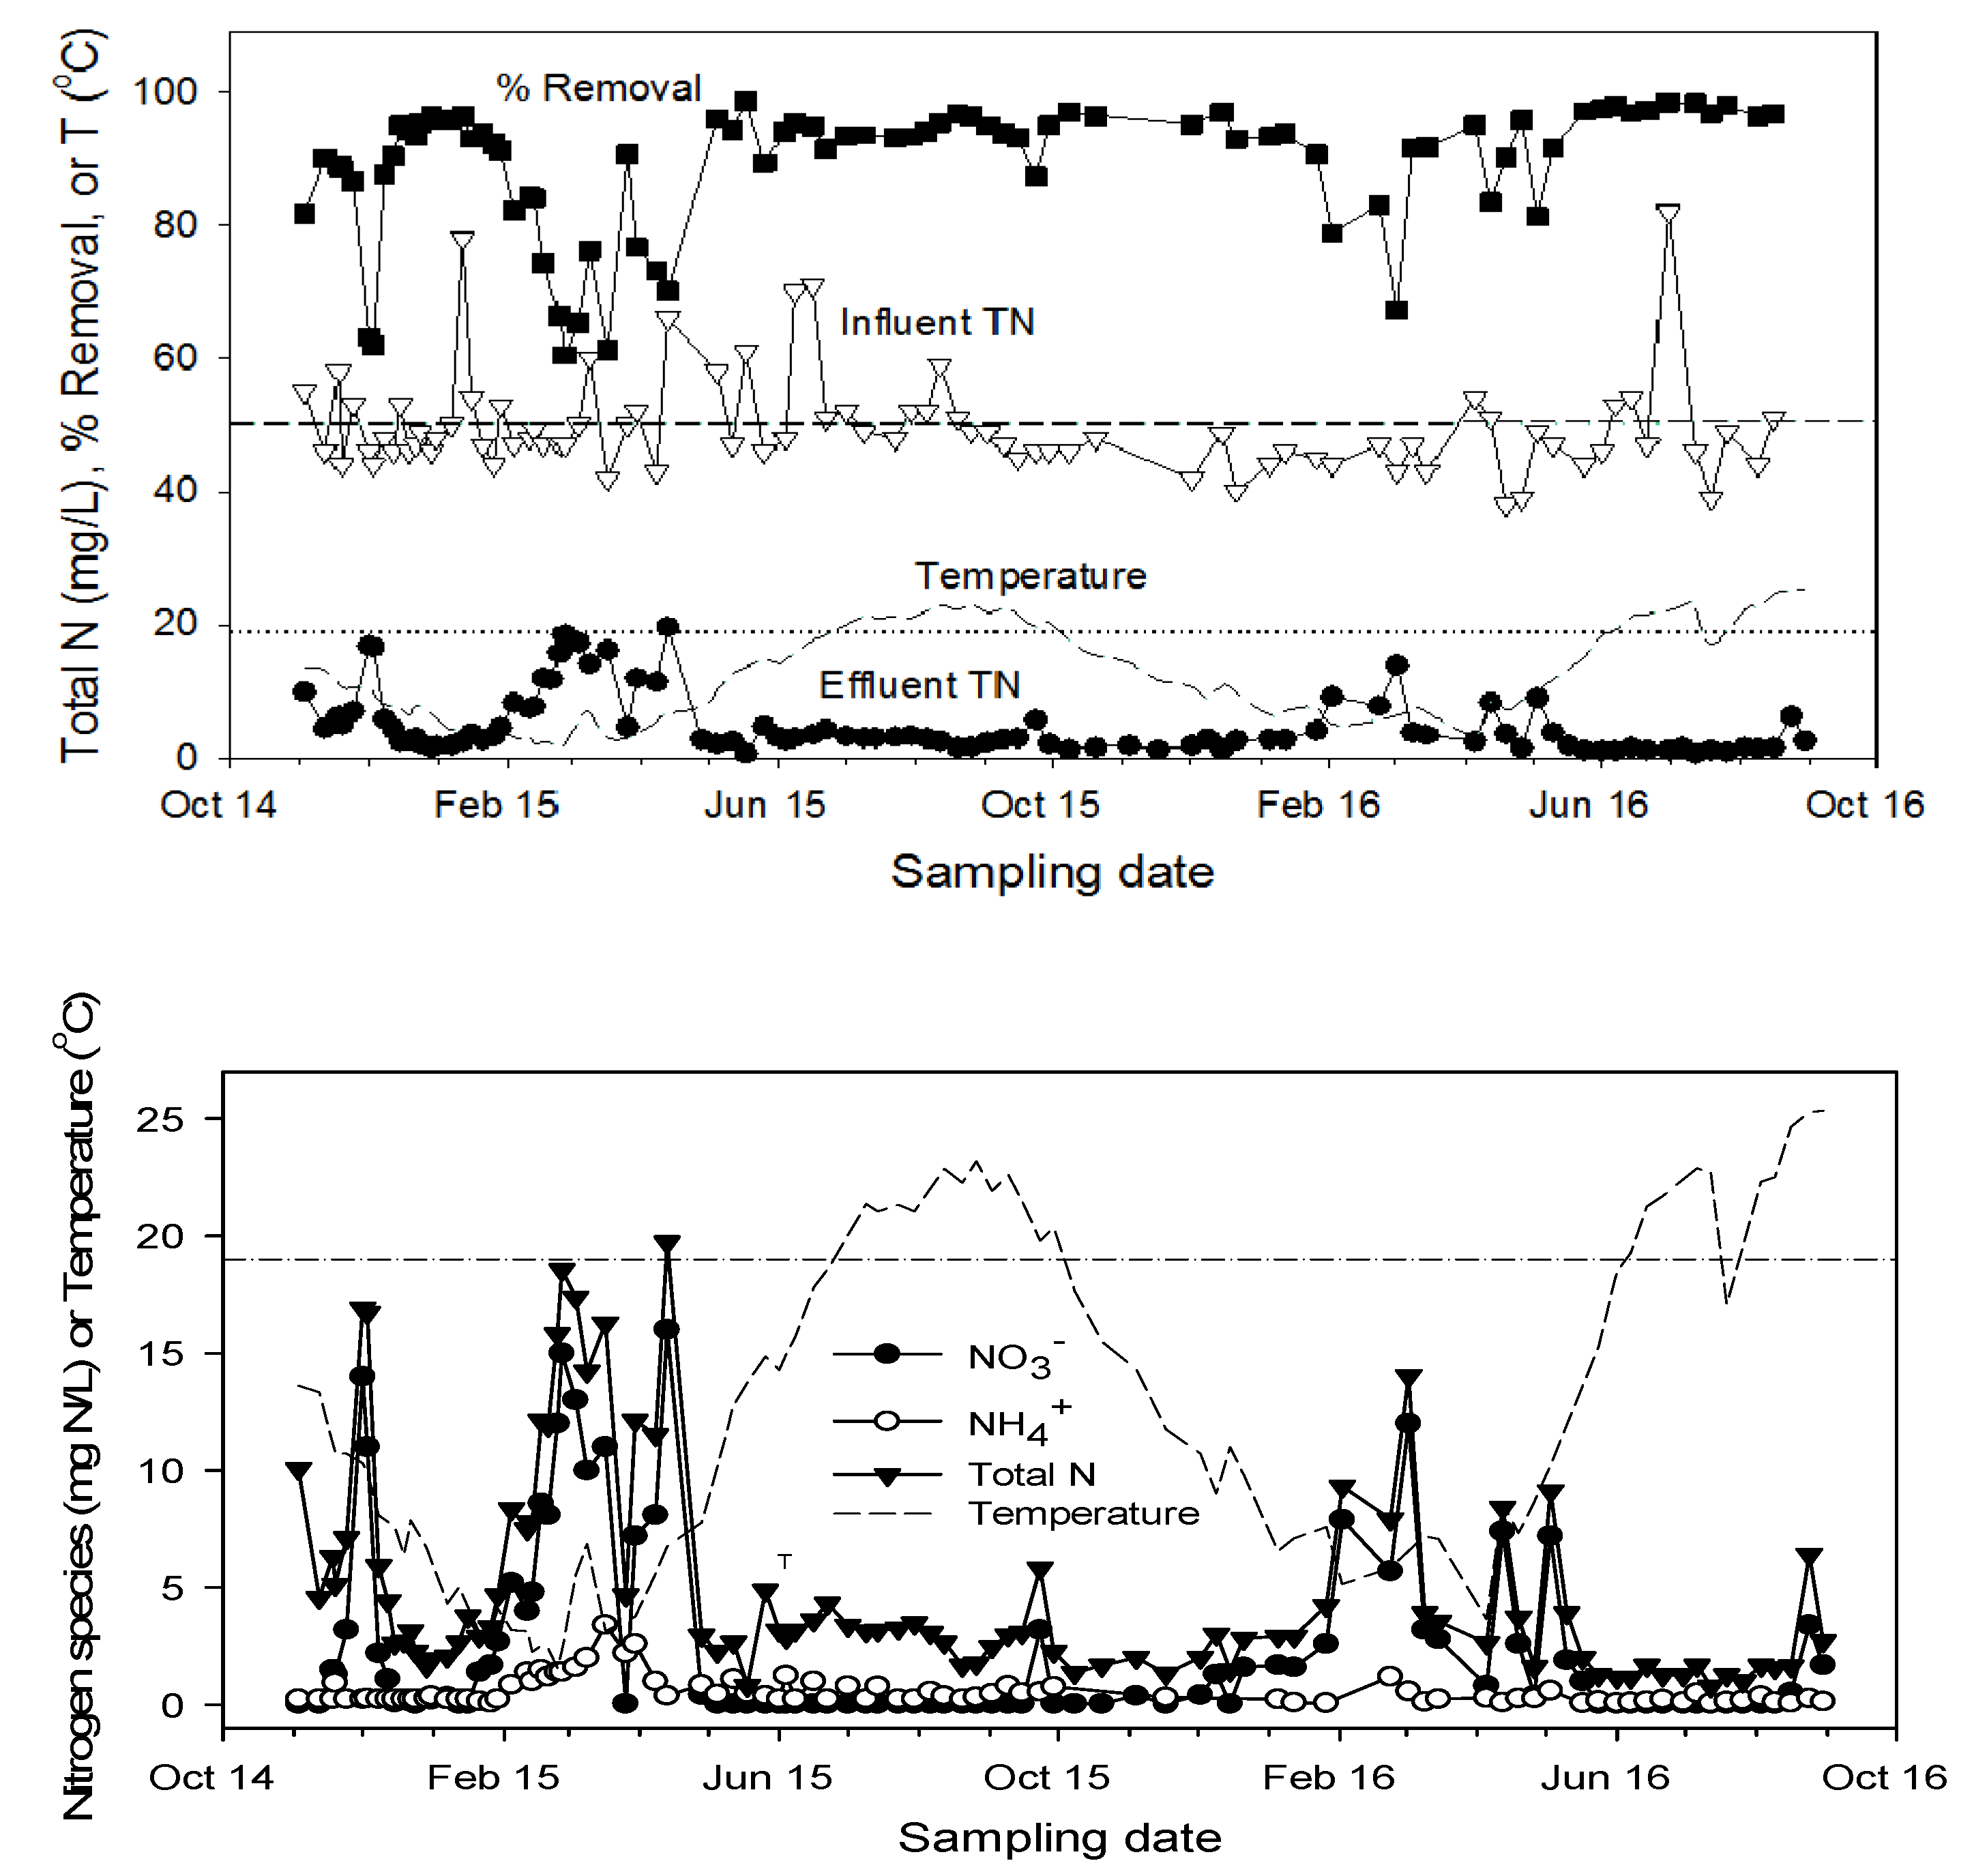
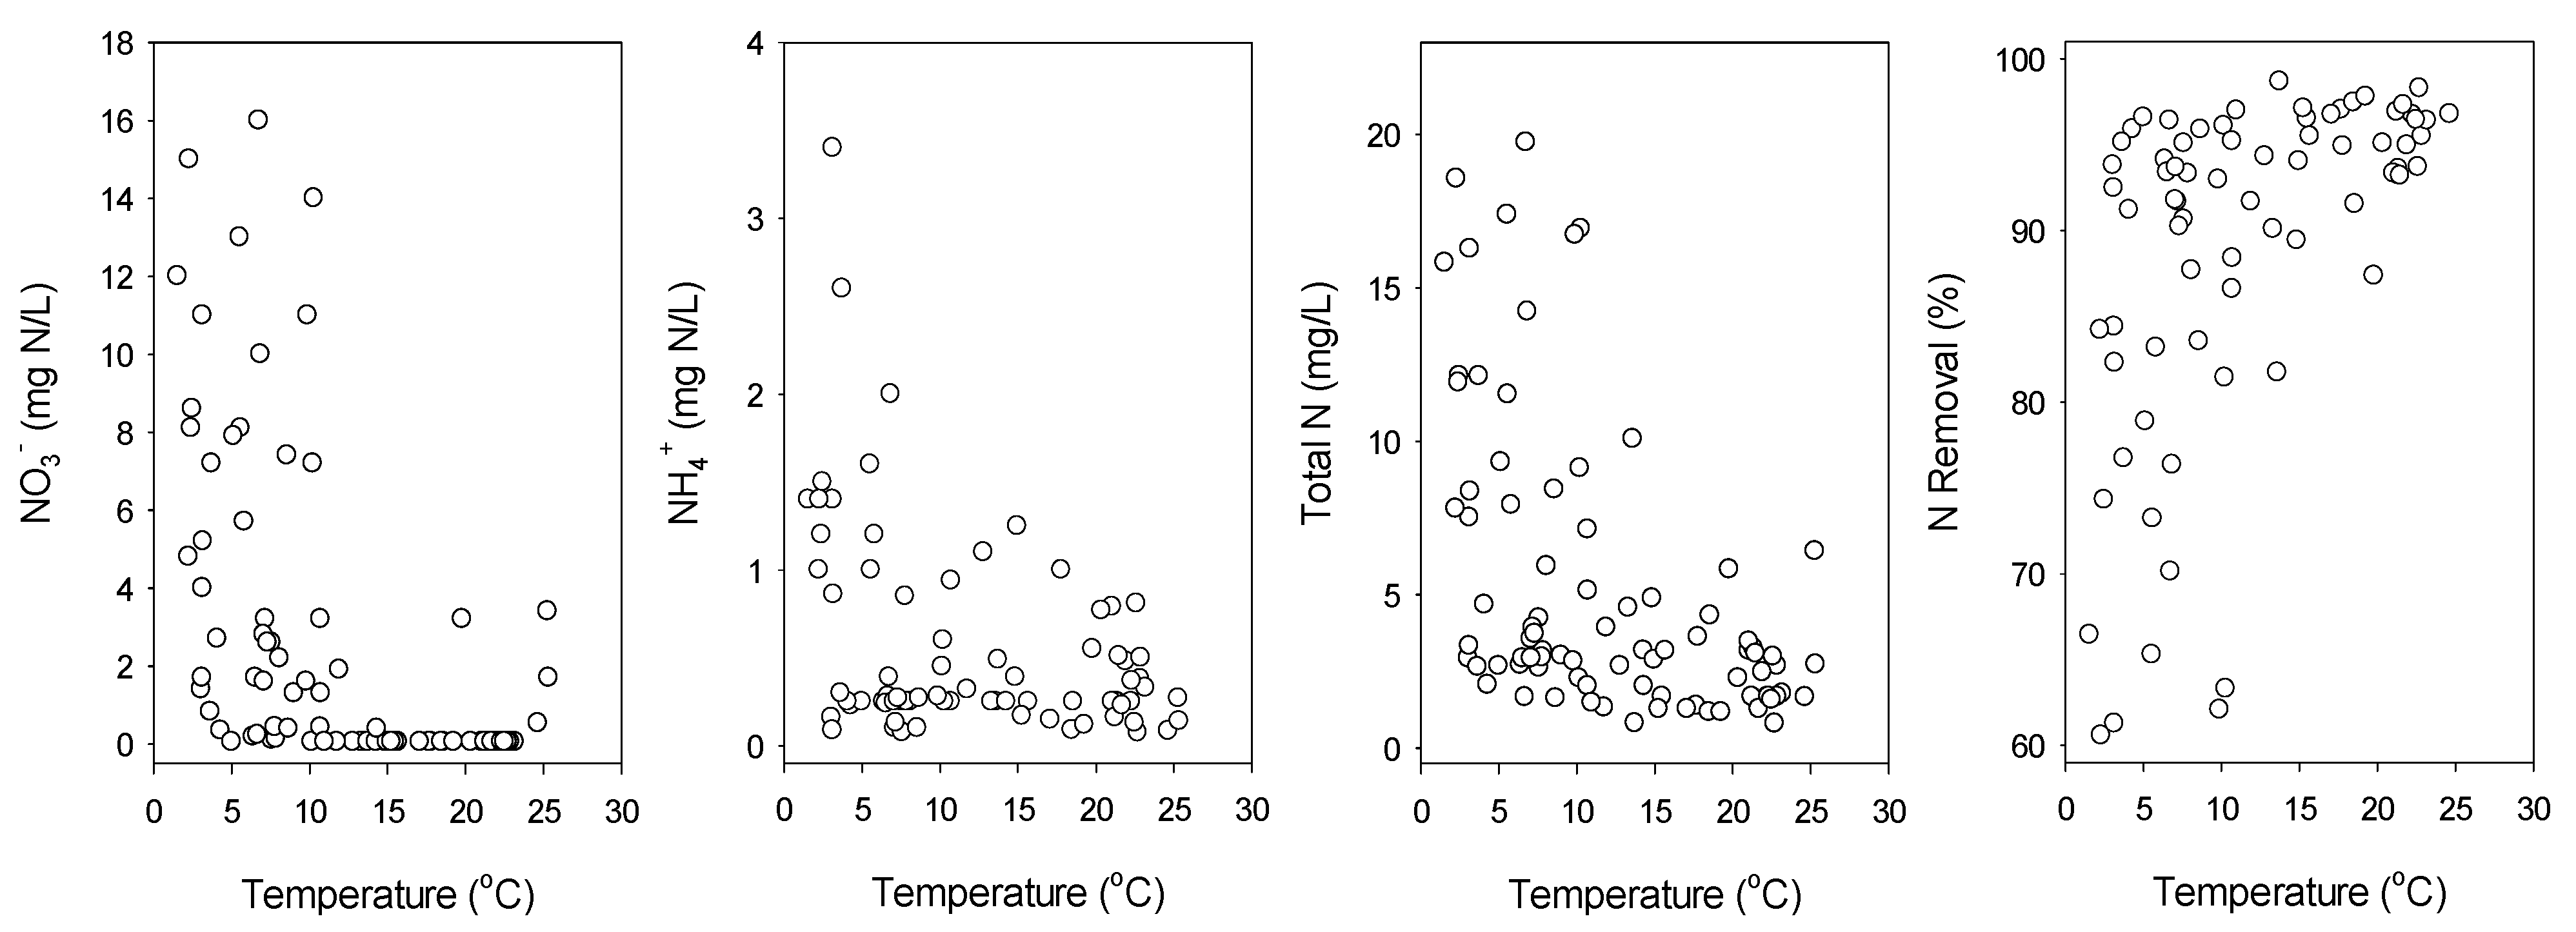
3.1. Mesocosm
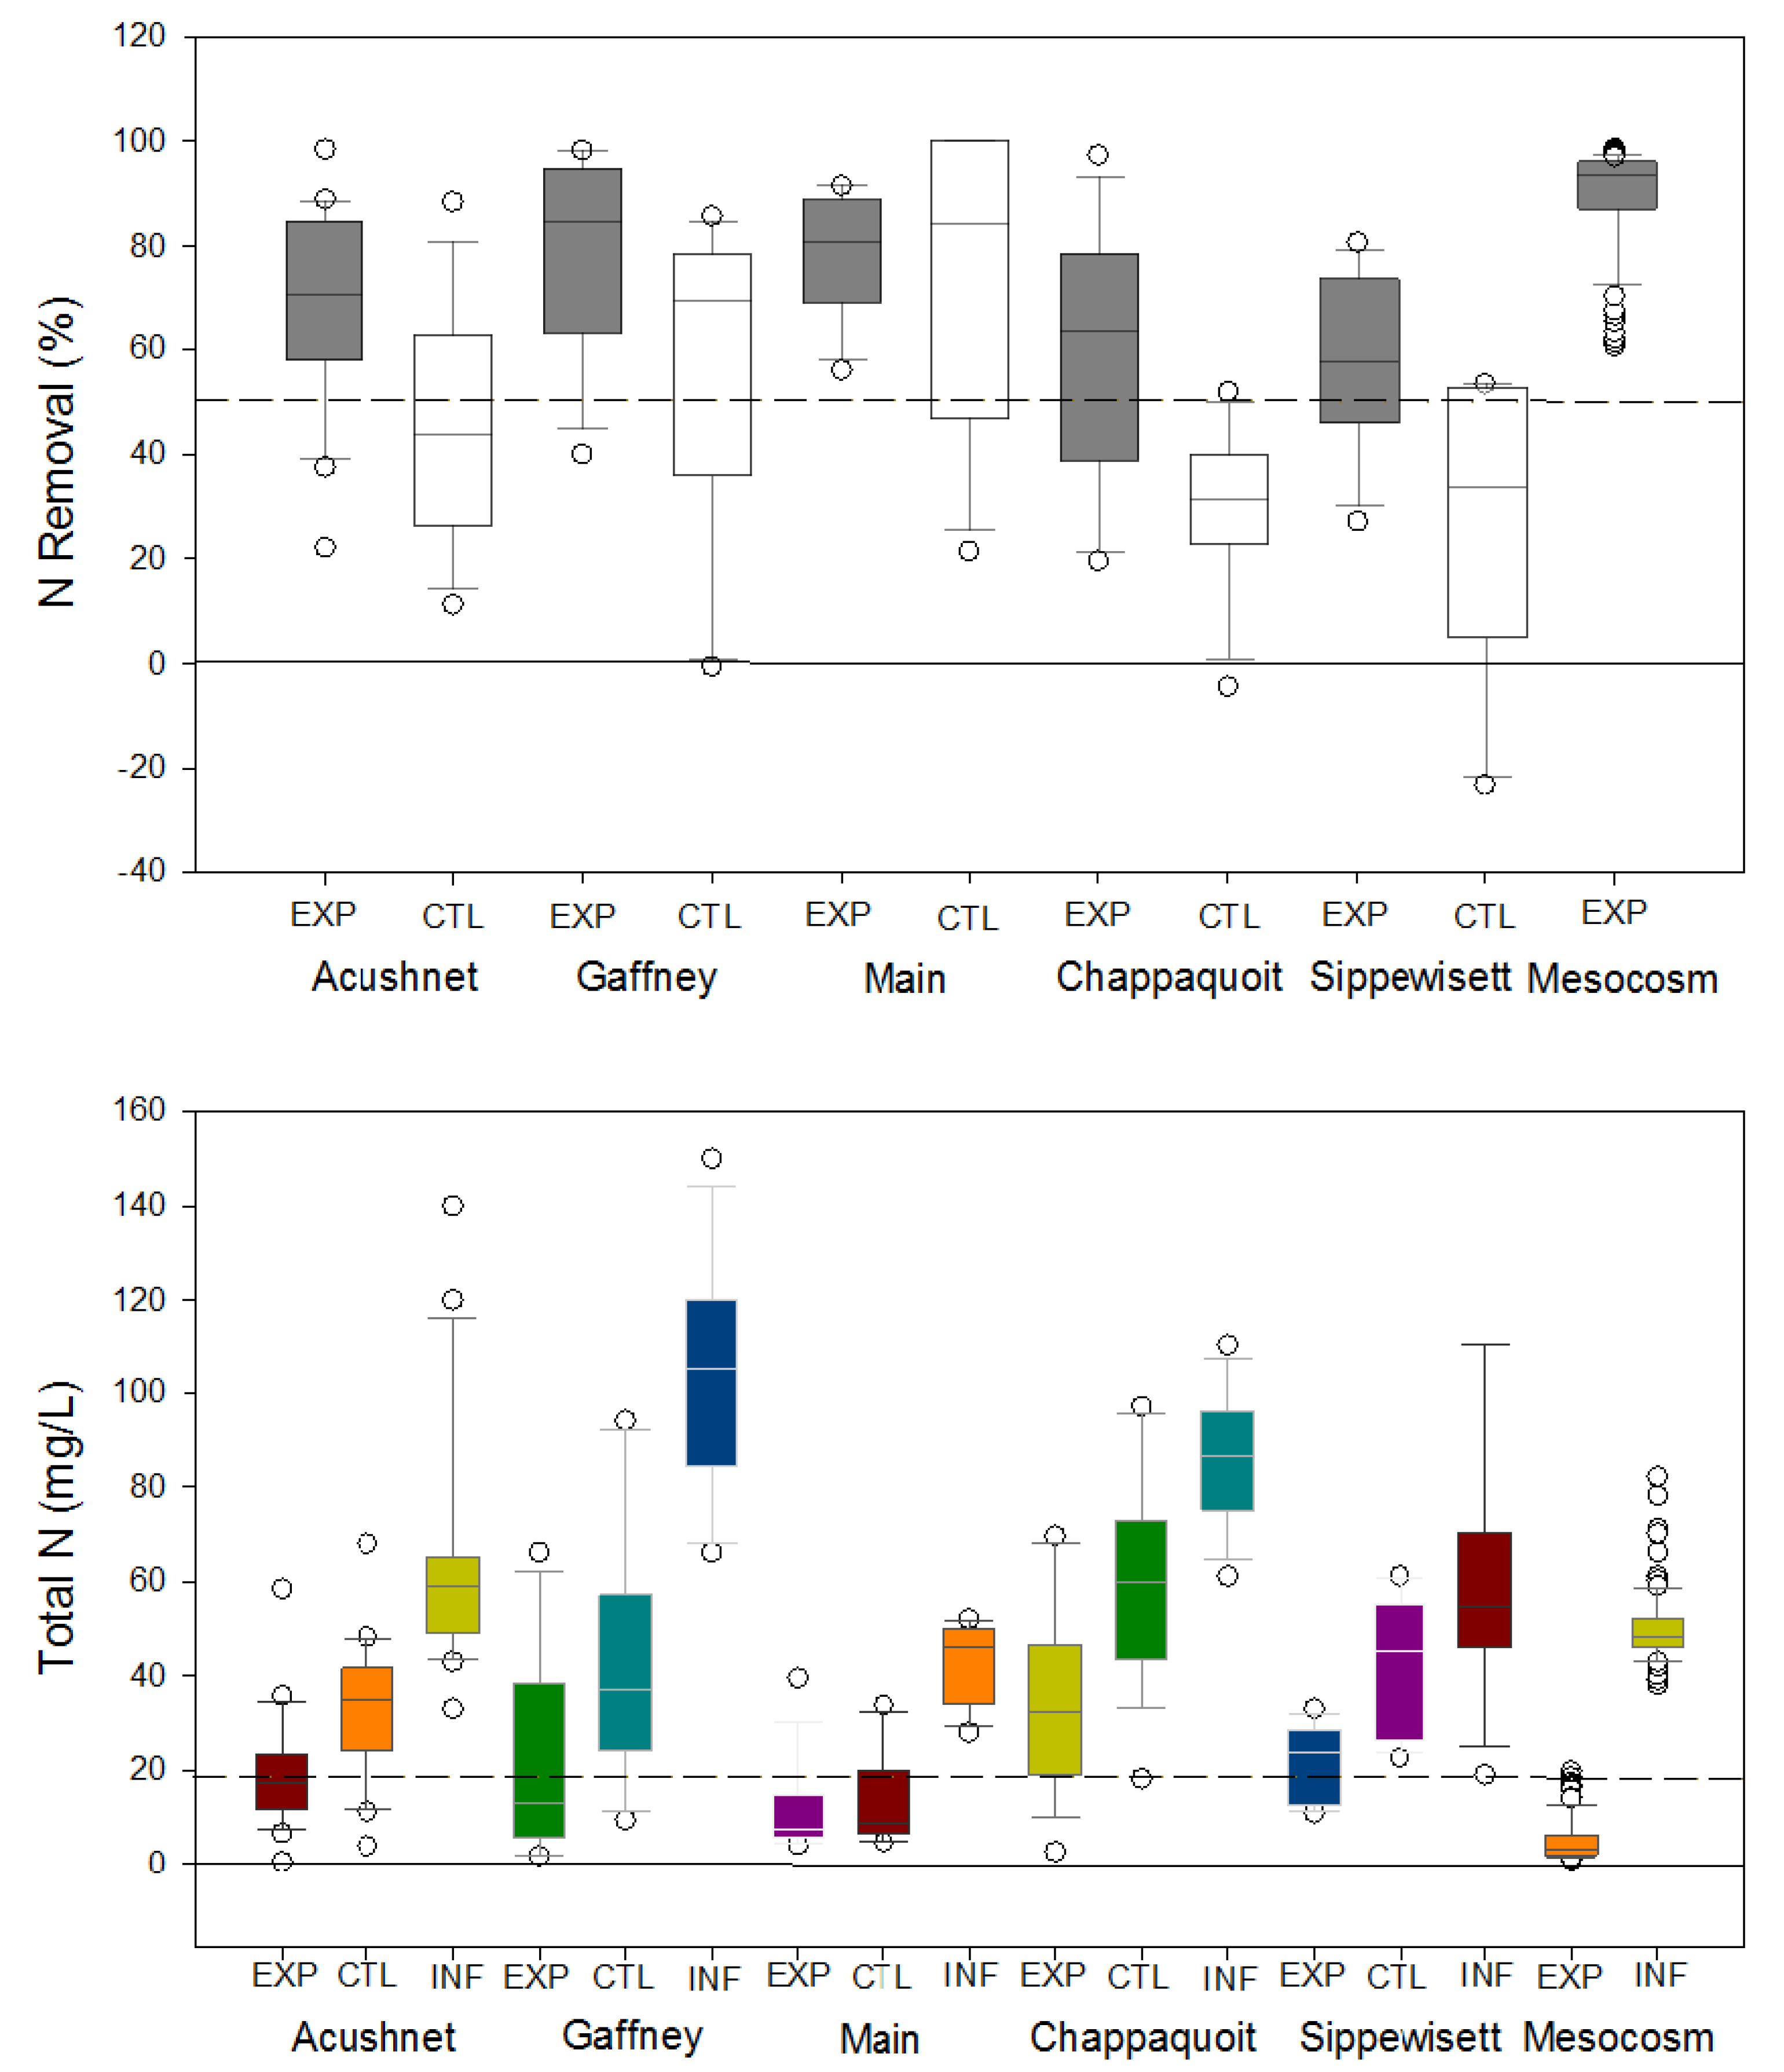
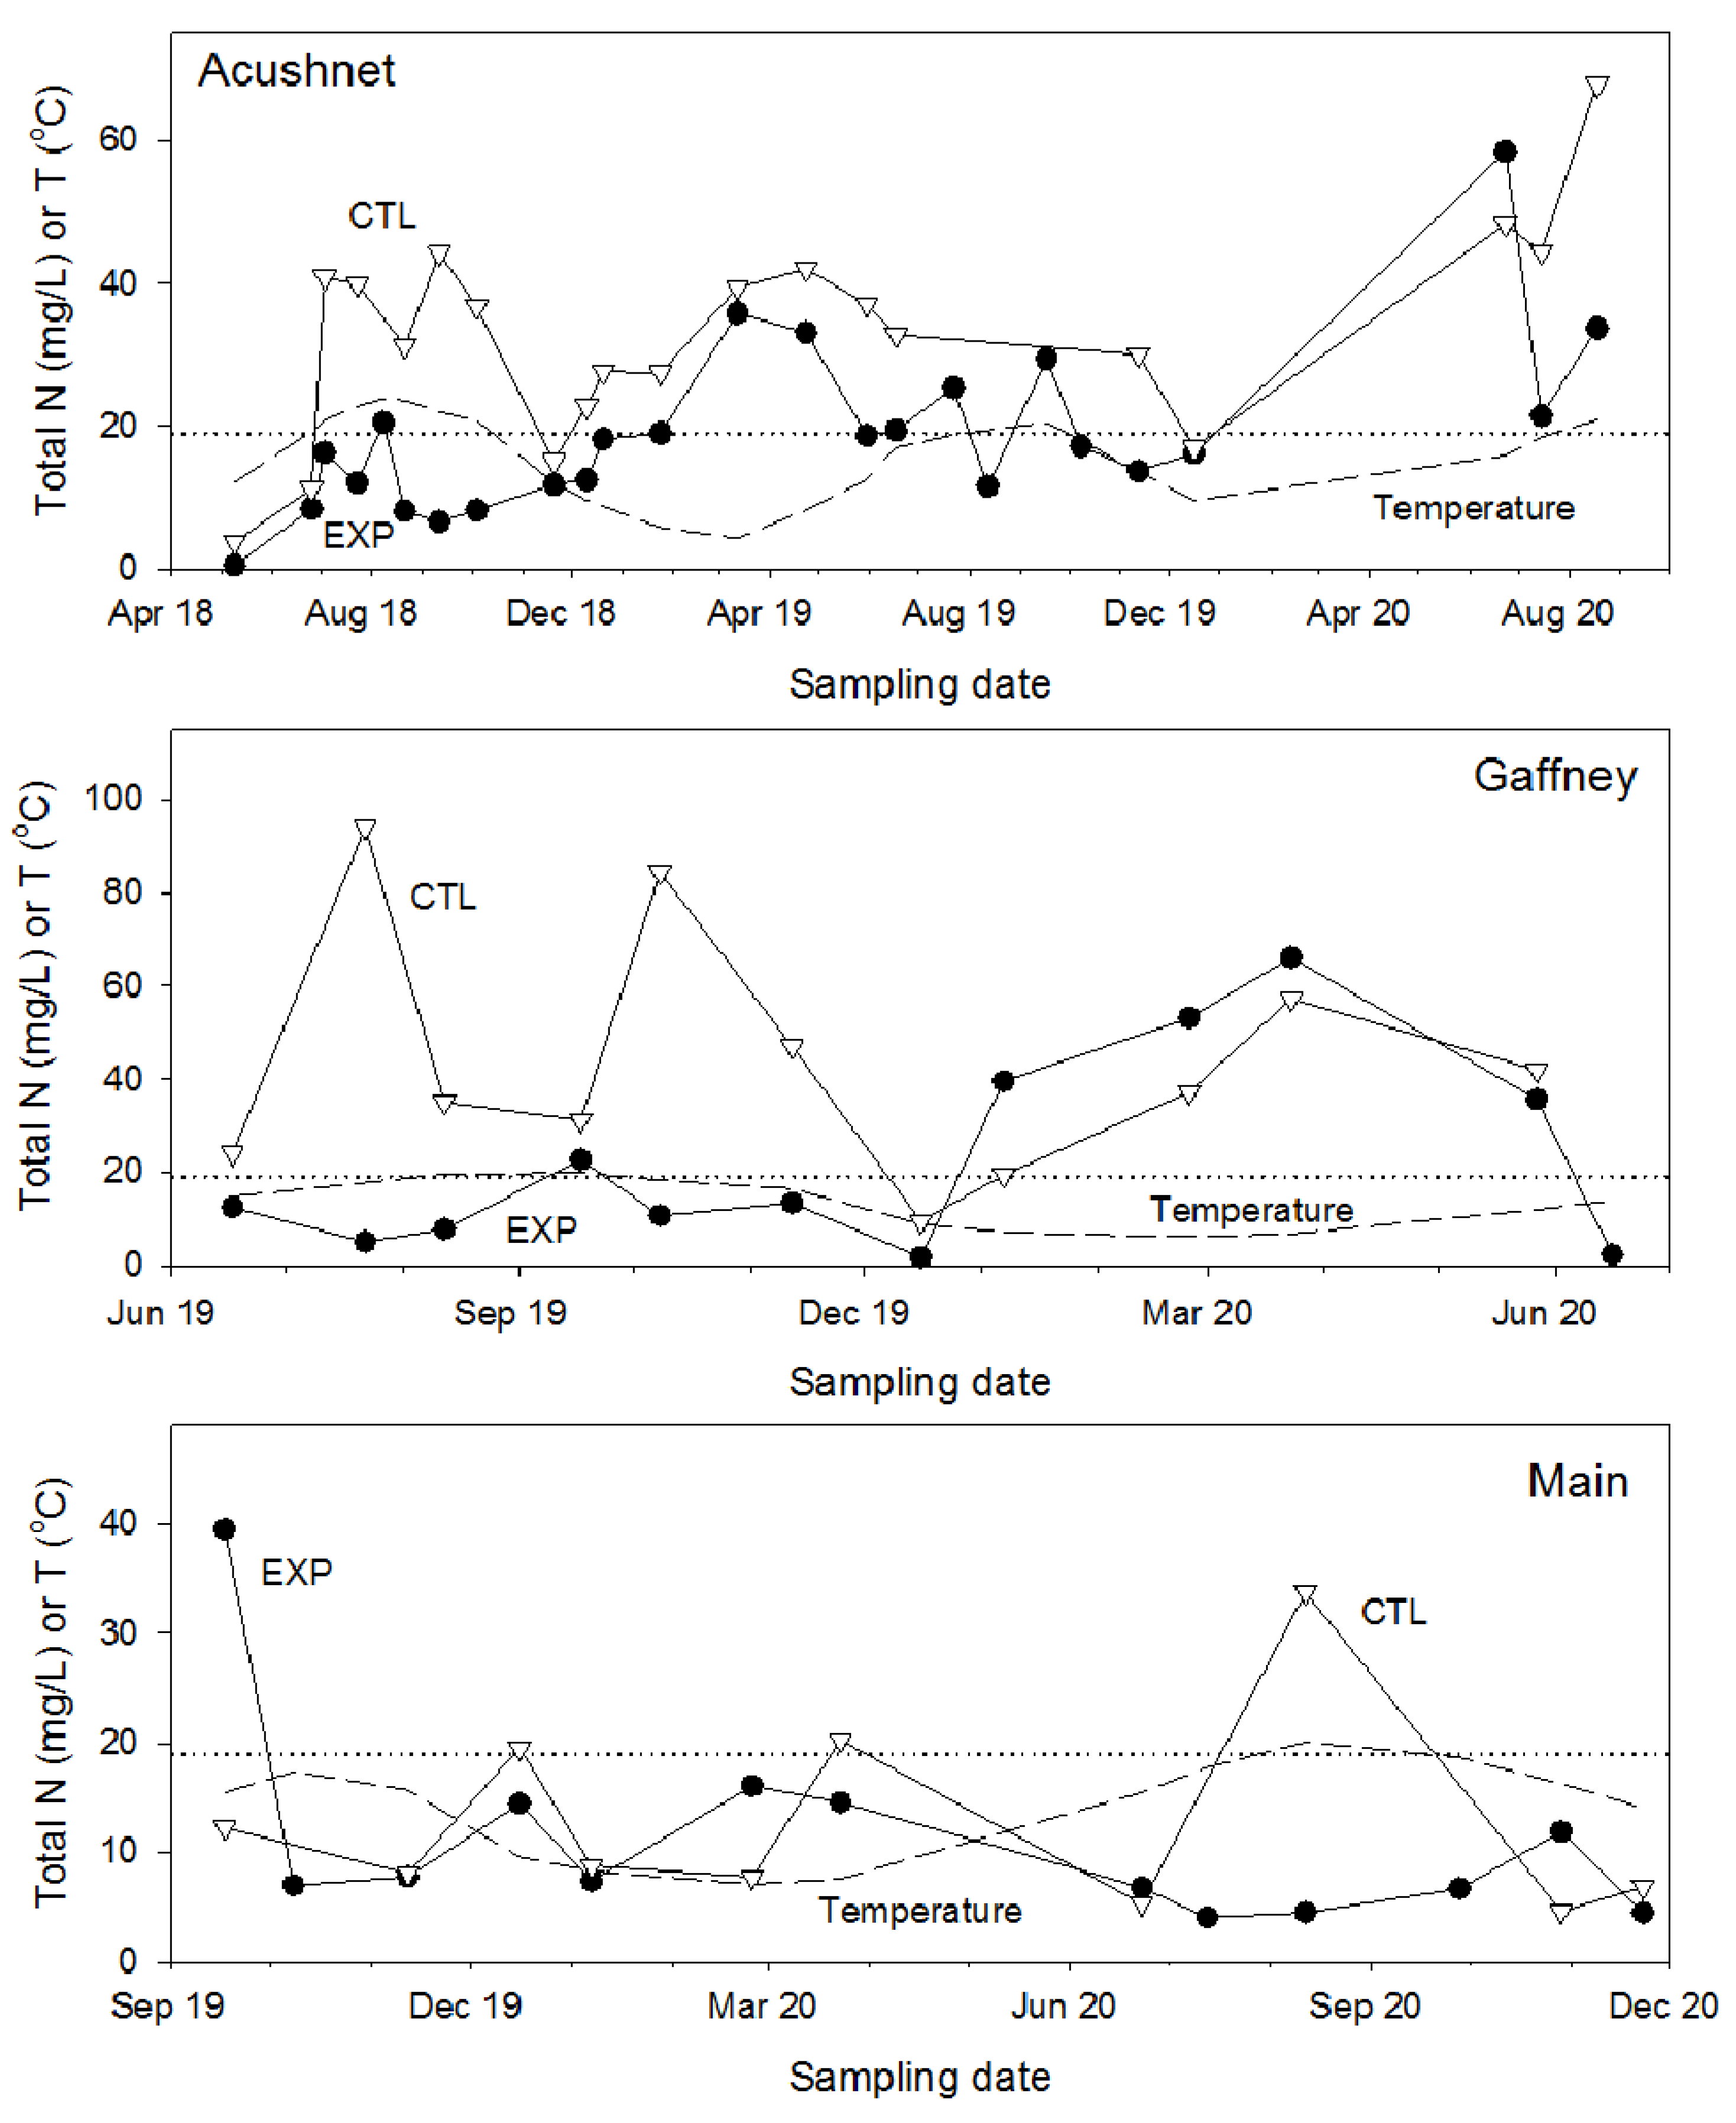
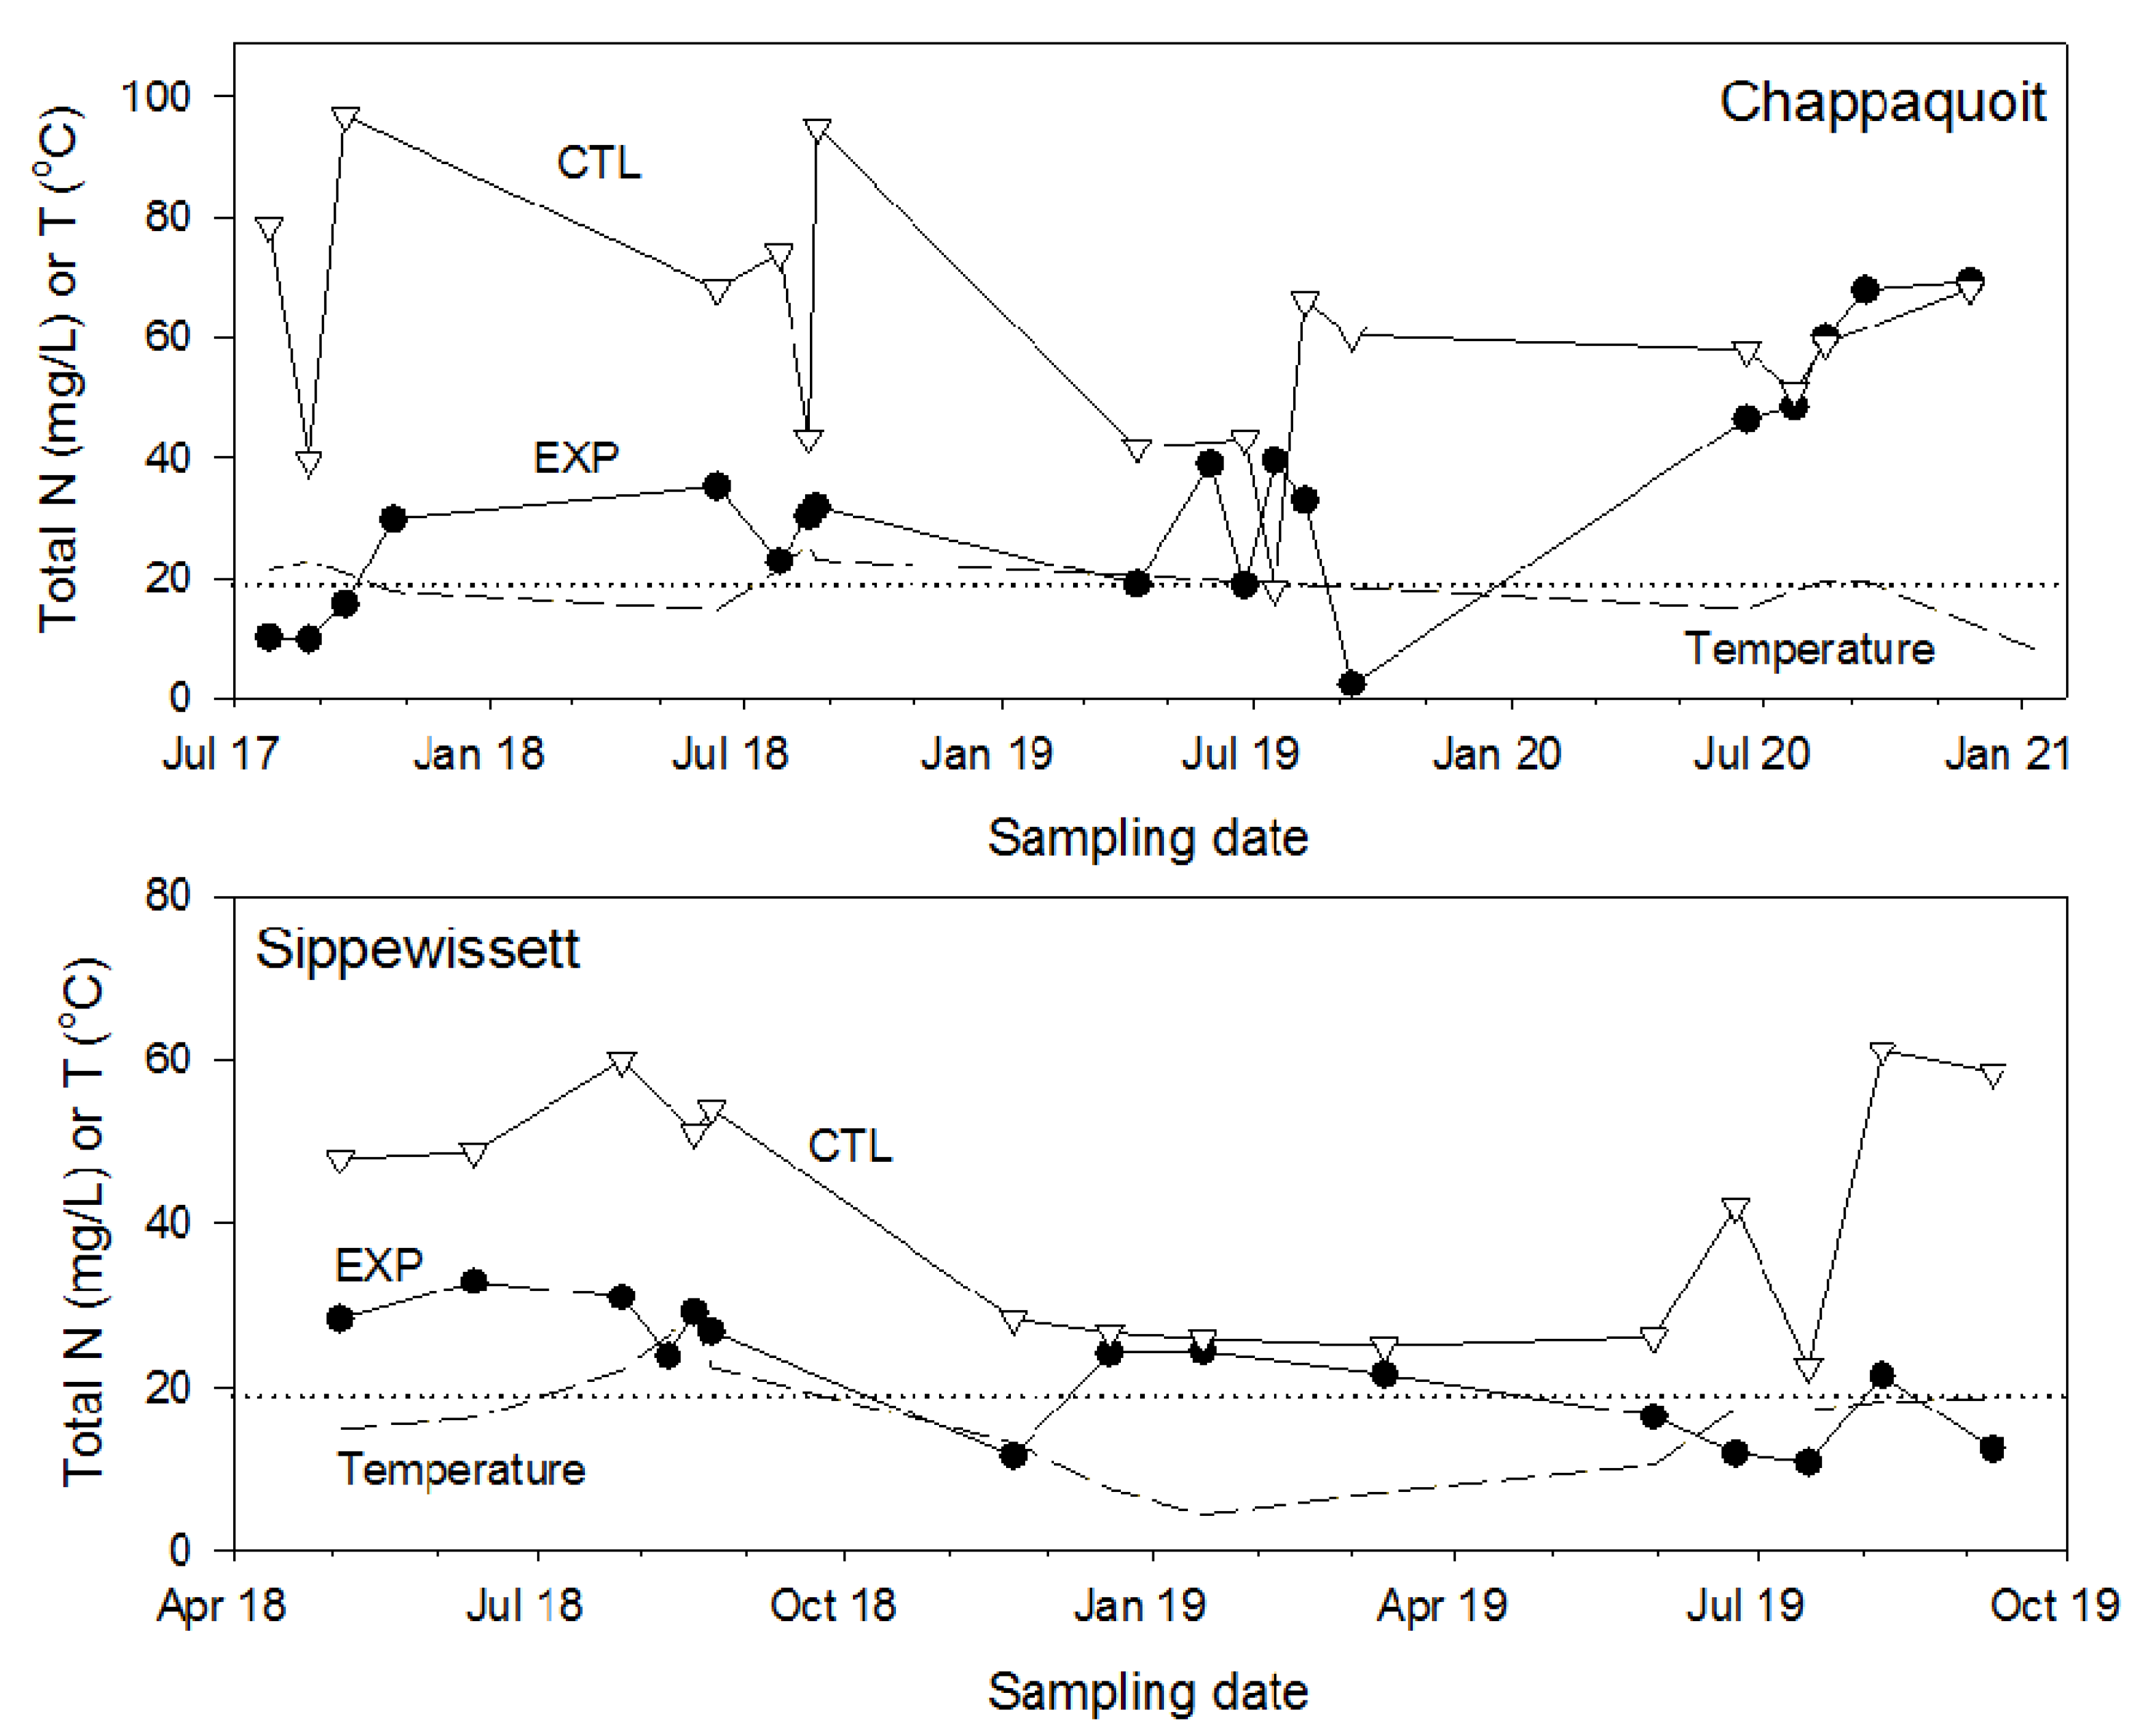
3.2. Field Systems
4. Conclusions
Author Contributions
Funding
Institutional Review Board Statement
Informed Consent Statement
Data Availability Statement
Acknowledgments
Conflicts of Interest
References
- Ward, M.H.; Jones, R.R.; Brender, J.D.; De Kok, T.M.; Weyer, P.J.; Nolan, B.T.; Villanueva, C.M.; Van Breda, S.G. Drinking water nitrate and human health: An updated review. Int. J. Environ. Res. Public Health 2018, 15, 1557. [Google Scholar] [CrossRef] [PubMed] [Green Version]
- Bergondo, D.L.; Kester, D.R.; Stoffel, H.E.; Woods, W.L. Time–series observations during the low sub–surface oxygen events in Narragansett Bay during summer 2001. Mar. Chem. 2005, 97, 90–103. [Google Scholar] [CrossRef]
- Anderson, D.M.; Gilbert, P.M.; Burkholder, J.M. Harmful algal blooms and eutrophication: Nutrient sources, composition, and consequences. Estuaries 2002, 25, 704–726. [Google Scholar] [CrossRef]
- Amador, J.A.; Görres, J.H.; Loomis, G.W.; Lancellotti, B.V. Nitrogen loading from onsite wastewater treatment systems in the Greater Narragansett Bay (Rhode Island, USA) watershed: Magnitude and reduction strategies. Water Air Soil Pollut. 2018, 229, 65. [Google Scholar] [CrossRef]
- Lancellotti, B.V.; Loomis, G.W.; Hoyt, K.P.; Avizinis, E.; Amador, J.A. Evaluation of nitrogen concentration in final effluent of advanced nitrogen–removal onsite wastewater treatment systems (OWTS). Water Air Soil Pollut. 2017, 228, 383. [Google Scholar] [CrossRef]
- Oakley, S.M.; Gold, A.J.; Oczkowski, A.J. Nitrogen control through decentralized wastewater treatment: Process performance and alternative management strategies. Ecol. Eng. 2010, 36, 1520–1531. [Google Scholar] [CrossRef]
- Ross, B.N.; Hoyt, K.P.; Loomis, G.W.; Amador, J.A. Effectiveness of advanced nitrogen–removal onsite wastewater treatment systems in a New England coastal community. Water Air Soil Pollut. 2020, 231, 1–10. [Google Scholar] [CrossRef]
- Suffolk County. Septic Improvement Program, 4 Bedroom Quote List I/A OWTS Vendor List Contact Information. 2018. Available online: https://www.ehamptonny.gov/DocumentCenter/View/2426/Vendor-Ranking-Document-PDF (accessed on 3 August 2021).
- Sohngen, J.; Jobin, J.; Priolo, J. 2018 Report on the Performance of Innovative and Alternative Onsite Wastewater Treatment Systems. 2019. Available online: https://www.suffolkcountyny.gov/Portals/0/FormsDocs/health/EnvironmentalQuality/2018_Performance_Evaluation_of_IAOWTS_Appendices_11-18-2019.pdf (accessed on 3 August 2021).
- Gobler, C.J.; Waugh, S.; Asato, C.; Clyde, P.M.; Nyera, S.C.; Graffam, M.; Brownawell, B.; Venkatesan, A.K.; Goleski, J.A.; Price, R.E.; et al. Removing 80–90% of nitrogen and organic contaminants with three distinct passive, lignocellulose–based on–site septic systems receiving municipal and residential wastewater. Ecol. Eng. 2021, 161, 106157. [Google Scholar] [CrossRef]
- Hazen and Sawyer Environmental Engineers & Scientists. Florida Onsite Sewage Nitrogen Reduction Strategies Study. Evaluation of Full Scale Prototype Passive Nitrogen Reduction Systems (PNRS) and Recommendations for Future Implementation–Volume I of II. Prepared for: Florida Department of Health, Division of Disease Control and Health Protection, Bureau of Environmental Health, Onsite Sewage Programs. 2015. Available online: http://www.floridahealth.gov/environmental-health/onsite-sewage/research/_documents/rrac/hazensawyervolireportrmall.pdf (accessed on 3 August 2021).
- Robertson, W.; Cherry, J. In situ denitrification of septic–system nitrate using reactive porous media barriers: Field trials. Ground Water 1995, 33, 99–111. [Google Scholar] [CrossRef]
- Robertson, W.; Blowes, D.; Ptacek, C.; Cherry, J. Long–term performance of in situ reactive barriers for nitrate remediation. Ground Water 2000, 38, 689–695. [Google Scholar] [CrossRef]
- Robertson, W.; Vogan, J.; Lombardo, P. Nitrate removal rates in a 15 year old permeable reactive barrier treating septic system nitrate. Groundwater Monit. Remed. 2008, 28, 65–72. [Google Scholar] [CrossRef]
- Robertson, W. Nitrate removal rates in woodchip media of varying age. Ecol. Eng. 2010, 36, 1581–1587. [Google Scholar] [CrossRef]
- State of Florida Department of Health. Chapter 64E–6, Florida Administrative Code Standards for Onsite Sewage Treatment and Disposal Systems; Florida Administrative Code & Florida Administrative Register: Tallahassee, FL USA, 2018. Available online: https://www.flrules.org/gateway/ChapterHome.asp?Chapter=64e-6 (accessed on 30 July 2021).
- Barnstable County Department of Health and Environment. The Performance Monitoring of Non–Proprietary Layered Systems Presently under Site–Specific Pilot Approvals; Annual Report; Massachusetts Department of Environmental Protection: Sandwich, MA, USA, 2018. Available online: https://www.eastham-ma.gov/sites/g/files/vyhlif4371/f/uploads/annualreport_2018_layeredsystems.pdf (accessed on 30 July 2021).
- Jobin, J.; Priolo, J. Draft 2018 Report on the Performance of Innovative and Alternative Onsite Wastewater Treatment Systems; Suffolk County Department of Health Services: Great River, NY, USA, 2020. [Google Scholar]
- Rhode Island Department of Environmental Management. Alternative & Experimental Technologies; Rhode Island Department of Environmental Management (RIDEM): Providence, RI, USA, 2021.
- Cooper, J.A.; Morales, I.; Amador, J.A. Nitrogen transformations in different types of soil treatment areas receiving domestic wastewater. Ecol. Eng. 2016, 94, 22–29. [Google Scholar] [CrossRef]
- Gill, L.W.; O’Súlleabháin, C.; Misstear, B.D.; Johnston, P.M. Comparison of stratified sand filters and percolation trenches for on–site wastewater treatment. J. Environ. Eng. 2009, 135, 8–16. [Google Scholar] [CrossRef]
- Holden, S.A.; Stolt, M.H.; Loomis, G.W.; Gold, A.J. Seasonal variation in nitrogen leaching from shallow–narrow drainfields. In Proceedings of the 10th Symposium on Individual and Small Community Sewage Systems, Sacramento, CA, USA, 21–24 March 2004. [Google Scholar]
- Massachusetts Department of Environmental Protection. The State Environmental Code, Title 5: Standard Requirements for the Siting, Construction, Inspection, Upgrade and Expansion of on–Site Sewage Treatment and Disposal Systems and for the Transport and Disposal of Septage. Available online: https://www.mass.gov/regulations/310-CMR-15-state-environmental-code-title-5-standard-requirements-for-the-siting (accessed on 30 July 2021).
- Wigginton, S.K.; Loomis, G.W.; Amador, J.A. Greenhouse gas emissions from lignocellulose–amended soil treatment areas for removal of nitrogen from wastewater. Sci. Total Environ. 2020, 744, 140936. [Google Scholar] [CrossRef] [PubMed]
- O’Dell, J.W. Method 351.2 Determination of Total Kjeldahl Nitrogen by Semi–Automated Colorimetry, Rev. 2.0; US Environmental Protection Agency, Office of Research and Development, Environmental Monitoring Systems Laboratory: Cincinnati, OH, USA, 1993. [Google Scholar]
- Pfaff, J.D. Method 300.0, Rev 2.1. Determination of Inorganic Anions by Ion Chromatography, Rev 2.1; US Environmental Protection Agency, Office of Research and Development Environmental Monitoring Systems Laboratory: Cincinnati, OH, USA, 1993. [Google Scholar]
- O’Dell, J.W. Method 350.1 Determination of Ammonia Nitrogen by Semi–Automated Colorimetry; US Environmental Protection Agency, Office of Research and Development, Environmental monitoring Systems Laboratory: Cincinnati, OH, USA, 1993. [Google Scholar]
- USEPA. Method 160.2 Residue, Non–Filterable (Gravimetric, Dried at 103–105 °C); US Environmental Protection Agency, Office of Research and Development, Environmental Monitoring Systems Laboratory: Cincinnati, OH, USA, 1983.
- USEPA. Method 350.1 Alkalinity by Titration; US Environmental Protection Agency, Office of Research and Development, Environmental Monitoring Systems Laboratory: Cincinnati, OH, USA, 1983.
- USEPA. Method 405.1 Biochemical Oxygen Demand; US Environmental Protection Agency, Office of Research and Development, Environmental Monitoring Systems Laboratory: Cincinnati, OH, USA, 1983.
- Heufelder, G.R.; Rask, S.; Burt, C. Performance of Innovative Alternative Onsite Septic Systems for the Removal of Nitrogen in Barnstable County, Massachusetts 1999–2007. Available online: https://buzzardsbay.org/etistuff/bched–alternative–septic–sytems–2007.pdf (accessed on 30 July 2021).
- Ross, B.N.; Wigginton, S.K.; Cox, A.H.; Loomis, G.W.; Amador, J.A. Influence of season, occupancy pattern, and technology on structure and composition of nitrifying and denitrifying bacterial communities in advanced nitrogen–removal onsite wastewater treatment systems. Water 2020, 12, 2413. [Google Scholar] [CrossRef]
- Wigginton, S.K.; Amador, J.A. Structure and composition of nitrifying and denitrifying bacterial communities of lignocellulose–amended soil treatment areas receiving wastewater. Appl. Environ. Microbiol. 2021, in press. [Google Scholar]
- Atoyan, J.A.; Staroscik, A.M.; Nelson, D.R.; Patenaude, E.L.; Potts, D.A.; Amador, J.A. Microbial community structure of a leachfield soil: Response to intermittent aeration and tetracycline additions. Water 2013, 5, 505–524. [Google Scholar] [CrossRef] [Green Version]
- Patenaude, E.L.; Atoyan, J.A.; Potts, D.A.; Amador, J.A. Effects tetracycline on water quality, soil and gases in aerated and unaerated leachfield mesocosms. J. Environ. Sci. Health, Part A 2008, 43, 1054–1063. [Google Scholar] [CrossRef]
- Climate Smart Farming. CSF Growing Degree Day Calculator. Available online: http://climatesmartfarming.org/tools/csf-growing-degree-day-calculator/ (accessed on 30 July 2021).


| Characteristic | System | ||||
|---|---|---|---|---|---|
| Acushnet | Chappaquoit | Sippewissett | Gaffney | Main | |
| Occupancy Pattern | Year– round | Seasonal (May–September) | Seasonal (June–September) | Year– round | Year– round |
| Installation Date | April 2018 | April 2017 | November 2017 | May 2019 | September 2019 |
| Number of Occupants | 2 adults, 1 infant | 2 adults | 1 adult | 2 adults | 2 adults |
| Average Daily Flow, Occupied (L/d) | 825 | 303 | 423 | 416 | 306 |
| System | ||||||||||
|---|---|---|---|---|---|---|---|---|---|---|
| Sippewissett | Chappaquoit | Main | Gaffney | Acushnet | ||||||
| Property | Mean | sd | Mean | sd | Mean | sd | Mean | sd | Mean | sd |
| TSS | 39 | 23 | 34 | 11 | 128 | 105 | 50 | 20 | 80 | 83 |
| Alkalinity | 288 | 74 | 388 | 81 | ND | ND | 520 | 60 | 232 | 42 |
| BOD5 | 80 | 61 | 253 | 162 | 103 | 74 | 82 | 74 | 192 | 79 |
| DO | 3.3 | 3.9 | 1.4 | 1.6 | 0.3 | 0.3 | 0.3 | 0.8 | 1.1 | 1.5 |
| pH | 6.8 | 0.5 | 7.0 | 0.3 | 6.8 | 0.3 | 7.8 | 0.4 | 7.5 | 0.7 |
| Temp. | 14.4 | 6.9 | 17.7 | 3.1 | 15.2 | 5.4 | 13.0 | 5.0 | 17.2 | 6.2 |
| Total N | 60.7 | 26.5 | 87.3 | 15.9 | 43.1 | 8.1 | 103.8 | 24.4 | 63.3 | 25.8 |
Publisher’s Note: MDPI stays neutral with regard to jurisdictional claims in published maps and institutional affiliations. |
© 2021 by the authors. Licensee MDPI, Basel, Switzerland. This article is an open access article distributed under the terms and conditions of the Creative Commons Attribution (CC BY) license (https://creativecommons.org/licenses/by/4.0/).
Share and Cite
Wigginton, S.; Amador, J.; Baumgaertel, B.; Loomis, G.; Heufelder, G. Mesocosm- and Field-Scale Evaluation of Lignocellulose- Amended Soil Treatment Areas for Removal of Nitrogen from Wastewater. Water 2021, 13, 2137. https://doi.org/10.3390/w13152137
Wigginton S, Amador J, Baumgaertel B, Loomis G, Heufelder G. Mesocosm- and Field-Scale Evaluation of Lignocellulose- Amended Soil Treatment Areas for Removal of Nitrogen from Wastewater. Water. 2021; 13(15):2137. https://doi.org/10.3390/w13152137
Chicago/Turabian StyleWigginton, Sara, Jose Amador, Brian Baumgaertel, George Loomis, and George Heufelder. 2021. "Mesocosm- and Field-Scale Evaluation of Lignocellulose- Amended Soil Treatment Areas for Removal of Nitrogen from Wastewater" Water 13, no. 15: 2137. https://doi.org/10.3390/w13152137