
An Integrated Assessment and Factor Analysis of Water Related Environmental Risk to Cities in the Yangtze River Economic Belt


1
College of Geomatics, Xi’an University of Science and Technology, Xi’an 710054, China
2
Key Laboratory of Land Surface Pattern and Simulation, Institute of Geographic Sciences and Natural Resources Research, Chinese Academy of Sciences, Beijing 100101, China
3
University of Chinese Academy of Sciences, Beijing 100049, China
4
School of Soil and Water Conservation, Beijing Forestry University, Beijing 100083, China
*
Author to whom correspondence should be addressed.
Water 2021, 13(16), 2140; https://doi.org/10.3390/w13162140
Submission received: 13 July 2021
/
Revised: 30 July 2021
/
Accepted: 31 July 2021
/
Published: 4 August 2021
(This article belongs to the Special Issue Optimal Utilization and Management of Natural Resources)
Abstract
:With rapid development of the economy and urbanization, water-related environmental risk in urban areas has increased and hindered social-economic development and ecological protection. The assessment of water-related environmental risk is of vital importance to the sustainable development of the Yangtze River Economic Belt (YREB). This study constructed a comprehensive assessment index system for water-related environmental risks from three perspectives: the hazards posed by risk sources, the effectiveness of the control mechanisms, and the vulnerability of the risk receptors. Employing the entropy method, the water-related environmental risks of cities in the YREB from 2000 to 2015 were comprehensively evaluated, and the obstacle degree model was used to analyze the associated influencing factors of the water-related environmental risk. The results showed that the overall level of water-related environmental risk of the YREB presented a significant spatial gradient characterized by “downstream risk > midstream risk > upstream risk”. The areas with higher risks were mainly distributed in the Yangtze River Delta in the downstream area, and Wuhan and Changsha in the midstream area, where their risk receptors were highly vulnerable, and efforts should be made to improve the resilience of these areas. In terms of temporal change, the average value of the comprehensive water-related environmental risk of the YREB dropped from 0.493 in 2005 to 0.392 in 2015, with a reduction rate ranging from about 16.55 to 25.76%. The number of cities with medium-high to high risk had gradually decreased, and the number of cities with medium, medium-low, and low risk continued to increase. The water-related environmental risk of the YREB as a whole is in the transition stage from high risk level to medium and low risk level. Specifically, the hazards posed by risk sources had increased continually, and especially increased significantly in the midstream of the YREB; the effectiveness of risk control mechanisms had increased throughout the region, with downstream cities mainly having a high level of effectiveness; the areas with high vulnerability of the risk receptors were mainly concentrated in the Yangtze River Delta and showed an upward trend. Overall, the main source of water-related environmental risks and differences among the upstream, midstream and downstream cities had shifted from the hazards posed by risk sources to the effectiveness of risk control mechanisms and the vulnerability of the risk receptor. The main factors affecting the water-related environmental risk in the order of average obstacle degree were per capita GDP (34.43%), the number of beds per thousand people (18.70%) and the industrial structure height (15.55%). Therefore, promoting the adjustment of industrial structure, improving economic efficiency, developing the regional social economy, and improving and perfecting the construction of environmental protection infrastructure are effective ways to realize the mitigation and resolution of water-related environmental risks.
1. Introduction
The water environment is the entire body of water that surrounds a populated space and can directly or indirectly affect human life and development. It is the sum of various natural and social factors that have a feedback effect on the body of water. Risk assessment is a quantitative assessment of the possible impact or loss caused by an event, and the assessment result is often expressed as a risk value or level [1]. Rapid industrialization and urbanization have brought increasing pressure on the environment. The United States proposed the concept of water-related environmental risk assessment in the 1970s [2,3]. Water-related environmental risk assessment is the process of determining all potential impacts on the water environment and estimating the probability of the occurrence of water-related environmental events following the principles of locality, systemicity, dynamics, and consistency [4,5]. It also involves determining the possibility of risk occurrence, the vulnerability of the water environment, and the process resulting from the consequences of the hazard [6]. The accumulation of water-related environmental risks and the increase in risk receptors will heavily burden urban land and water resources [7]. Therefore, scientific assessment of water-related environmental risks plays an important role in the prediction and prevention of water-related environmental problems.
Water-related environmental risk assessment is an effective tool for water-related environmental risk management. Through risk assessment, it can identify high-risk areas which allows the subsequent proposal of effective water-related environmental risk prevention, control, and management methods. The current aspects of water-related environmental risk include health risks, environmental risks, and economic risks caused by water environmental pollution [8,9]. The methods adopted in the risk assessment mainly include analytic hierarchical processes, the Delphi method, principal component analysis, the entropy weight method, the index evaluation method and canonical correlation analysis. The scale of risk assessment spans from small-scale local evaluation to medium and large-scale regional or watershed scale evaluation [10,11,12,13,14,15]. In addition, remote sensing and geographic information system (GIS) technology have been widely used in the water-related environmental risk assessment [16], in monitoring the pollution factors of the river basins, such as nitrogen and phosphorus, and revealing the distribution characteristics of water-related environmental risks to formulate control strategies [11]. Water-related environmental risk influencing factors include both natural and socioeconomic factors. Increasing human activities, social and economic development, industrial layout along the rivers, emergencies and other factors will increase the water-related environmental risks [17,18]. In response to water-related environmental problems, many scholars have carried out extensive research work related to water-related environmental risk and have achieved promising results. Cao et al. evaluated the risk of environmental events in China at a national scale with a resolution of 1 km×1 km based on the theory of risk and vulnerability. The results showed that higher or above risk levels were mainly distributed in the Yangtze River Delta region, the Pearl River Delta region, the Bohai Sea Rim region, and the Chengdu-Chongqing region [19]. Yang et al. established a conceptual model of risk response by identifying ecological risk sources, pressure sources, end-points, and corresponding response mechanisms. They employed the Canberra distance improved TOPSIS model, which was combined with the analytic hierarchy process (AHP) and Critic weighting methods, to analyze the comprehensive ecological risk of rivers in semi-arid areas from the points of view of agriculture, industry, and urbanization [20]. Di et al. proposed a water-related environmental risk index (WERI) model, which adopted disaster, exposure, vulnerability, and regional management capability indicators to assess the water-related environmental risk of the Yinma River Basin [21]. Leng et al. constructed a water-related environmental risk assessment index system based on the DPSIR model, and analyzed the water environment in the Beijing-Tianjin-Hebei region using AHP, fuzzy comprehensive evaluation, and GIS technology. Their index system revealed the leading factors of high-risk units, the relationship between risk level and social economy, and the uncertainty of risk assessment [1]. Xu et al. established an integrated environmental risk assessment and management (IERAM) framework which adopted a multilayer DPSIR conceptual approach to assess the environmental risks of protected marine areas. They also established a database to assist in determining the priority of management options [22]. In summary, most research on water-related environmental risks focused on the impact of emergencies and pollutants on the water environment. The research focused mostly on watersheds, enterprises, or industrial parks, etc. [23,24]. In terms of temporal scale, the mentioned studies emphasized the short-term risks, and there is a lack of research on the evolution of the long-term water-related environmental risks. In these risk assessments, more attention has been paid to the evaluation of physical risks such as water quality, water volume, and water environmental carrying capacity. There is little mention of the regulatory risks represented by the water management level of the decision makers and the degree of policy implementation [25].
Improving the water environment is an important part of the ecological environmental protection of the Yangtze River Economic Belt (YREB), as well as an important prerequisite for promoting the development of the YREB and the construction of the Golden Waterways. The YREB is an important inland river economic belt in China. It spans the three major regions of China’s east, middle, and west. The region is rich in resources and is economically, industrially, and technologically developed. It is the zone with the greatest potential for economic growth in China [26]. However, the rapid economic growth and large-scale development of cities along the Yangtze River come at the expense of its the water environment. The rapid urbanization process has accelerated the establishment of industrial enterprises [27], which has huge impacts on the urban water environment. The ecological environment of some areas has exceeded the carrying capacity, particularly in relation to water resources. The heavy chemical industries in the YREB are concentrated in areas along the Yangtze River. About one-third of companies posing environmental risks are located within 5 km of drinking water sources [28]. The migration of polluting enterprises with high water and energy consumption along the river to the middle and upper reaches is still predominant. The highly polluting and high-risk industries along the Yangtze River have increased the water-related environmental risks. The environmental emergencies in the YREB from 2006 to 2015 accounted for about 60% of the national review. The frequency of emergencies was higher in three regions, namely, Shanghai, Zhejiang, and Jiangsu [29]. Therefore, assessing the water-related environmental risks of the YREB has become an urgent matter to further enhance water-related environmental risk prevention, improve the control capabilities and formulate risk management and prevention and control strategies, and to achieve the sustainable development of the YREB.
This study aims to construct a comprehensive water-related environmental risk assessment index system to assess the water-related environmental risks of cities in the YREB from 2005 to 2015, and analyze the obstacle factors affecting water-related environmental risks, in the hope of revealing the evolution characteristics of water-related environmental risks along the YERB and the key influencing factors. It contributes to the ecological environmental protection and green development of the YREB. It also helps managers make more effective and sustainable decisions on water-related environmental risk management in the context of joint-protection and high-quality development of the Yangtze River. The rest of this article is structured as follows. The next section introduces the materials and methods, including research area, data sources, construction of water-related environmental risk assessment system and research methods. The third section gives an analysis of the results, including the water-related environmental risk assessment results and obstacle factor identification analysis, the fourth section is the discussion, and the final conclusion part summarizes this paper.
2. Materials and Methods
2.1. Study Area
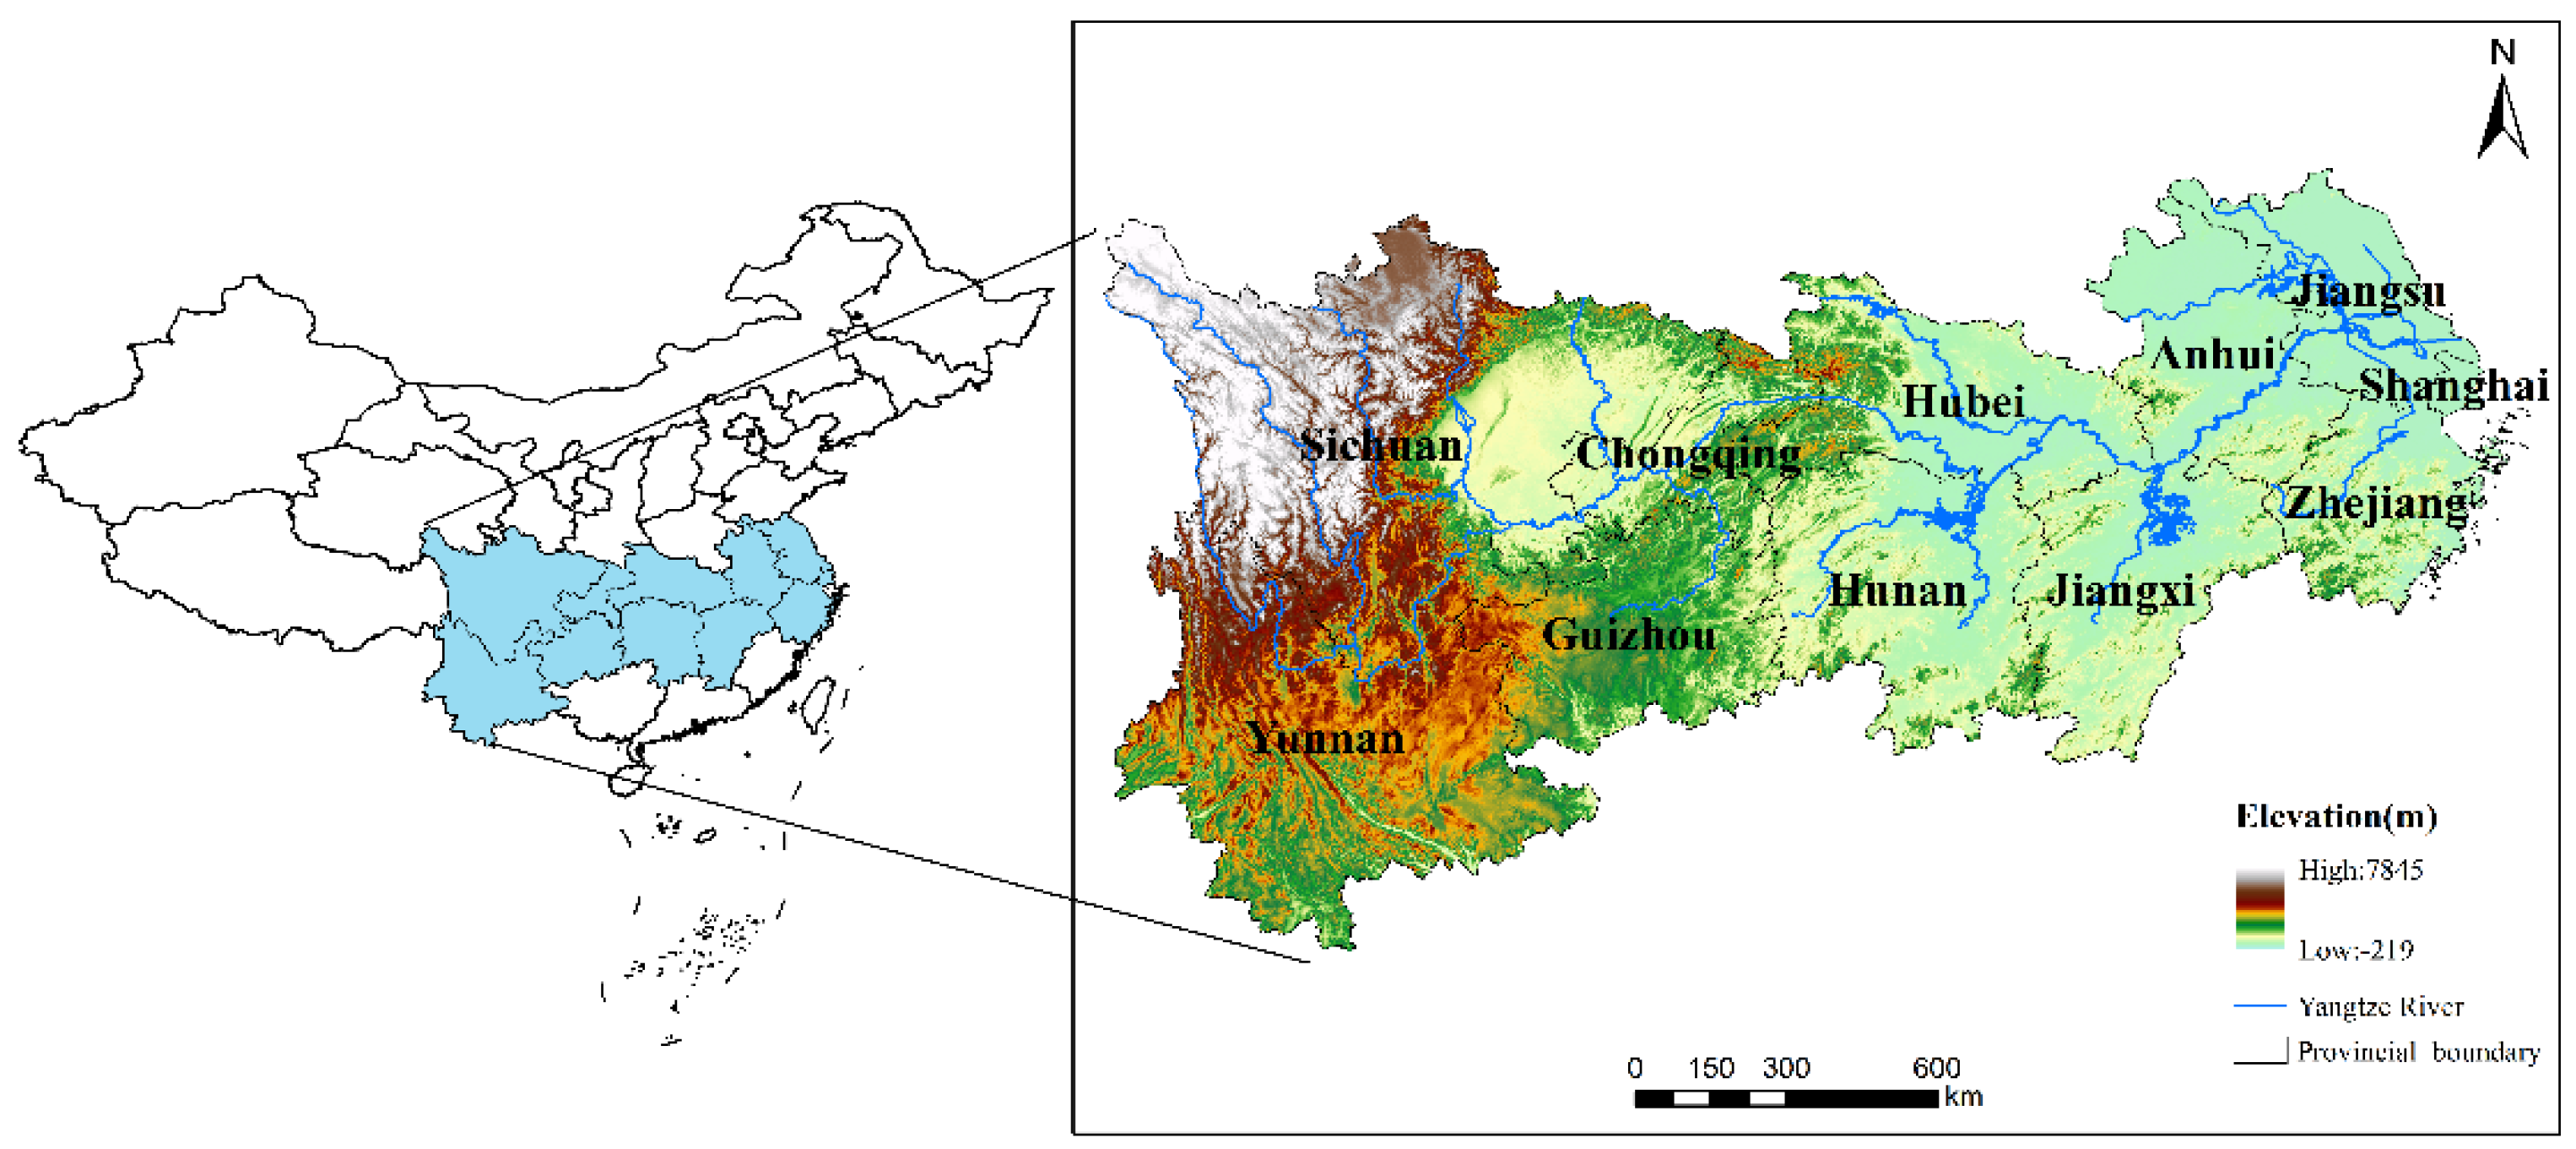
The YREB is one of China’s three national strategic regions, covering an area of approximately 2.05 million km2, accounting for 21.4% of the country’s total area (Figure 1). The YREB and the Eastern Coastal Economic Belt constitute an important T-shaped zone of China’s economic development. It covers nine provinces (Sichuan, Yunnan, Guizhou, Hunan, Hubei, Jiangxi, Anhui, Jiangsu, and Zhejiang) and two municipalities (Shanghai and Chongqing) under the jurisdiction of the central government, with both the population and economy exceeding 40% of the national total. It includes three national first-class urban agglomerations, namely the Yangtze River Delta urban agglomerations, the Yangtze River Middle Reaches urban agglomerations, and the Chengdu-Chongqing urban agglomeration [30,31]. However, rapid urbanization, infrastructural projects, and extensive human activities have adversely affected the water environment. The YREB has a high volume and intensity of pollution discharge. Its wastewater discharge accounts for more than 40% of the country’s total. In 2015, 83.3% of the 60 main lakes in the Yangtze River Basin did not meet the water quality standards [32]. Heavy chemical companies line the Yangtze River, and 30% of companies with environmental risks in the basin are located within 5 km of drinking water sources. This has increased the water-related environmental risks [28]. Therefore, identifying and scientifically assessing the water-related environmental risks of the YREB is of great significance for improving water-related environmental risk control and emergency response capabilities in the region, beside improving the water environmental status of the YREB.
2.2. Water-Related Environmental Risk Assessment Index System and Data Sources
The index system of regional water-related environmental risk is constructed according to the theory of the regional environmental risk system. The construction of a scientific and reasonable water-related environmental risk index system is the key to water-related environmental risk management and prevention. The water environment of the YREB is important for social and economic development. Human activities and industrial development have negatively affected the water environment by releasing pollution discharges. Therefore, the index system of water-related environmental risk assessment should be comprehensively considered from the points of view of society, the economy, water resources, and water environment. This study uses the prefectural city as the evaluation unit to constructs a comprehensive index system for water-related environmental risk assessment in the YREB. It includes three system layers and four criterion layers, making a total of fourteen indices (Table 1). This index system conforms with the mainstream water-related environmental risk research, and is useful for the measurement and calculation of water-related environmental risk. According to the process of environmental risk occurrence, which consists of risk origin, risk occurrence, and risk control, the assessment framework is divided into risk source hazard, the effectiveness of control mechanisms, and risk receptor’s vulnerability. The hazard index of the risk source refers to the degree of threat stemming from the source of the environmental risk. The study selected the density of industrial enterprises, the amount of industrial wastewater discharge, and the amount of chemical fertilizers used per unit area as the indicators. The effectiveness of control mechanisms mainly evaluates the level of source control of pollution sources. The centralized treatment rate of sewage treatment plants, the non-hazardous treatment rate of domestic waste, and the comprehensive utilization rate of industrial solid waste were selected for characterizing the city’s level of source control. The aforementioned six indicators collectively reflect the potential threat to the water environment due to the sources of water pollution. The vulnerability of the risk receptors reflects the sensitivity and resilience of the disaster-bearers (i.e., urban residents, infrastructure, etc.) to environmental risks. Therefore, the vulnerability of the risk receptors comprises two criteria: sensitivity and resilience. In this study, considering the availability of data and information from previous studies [1,21,33], the industrial structure height, industrial scale, and industrial structure optimization indicators have been identified as suitable indicators to reflect receptor’s sensitivity, while technological progress was deemed as an appropriate indicator to reflect receptor’s resilience. Sensitivity refers to the nature of the risk receptor, i.e., whether they are susceptible to the impacts and damages caused by the environmental risks. Five indicators consisting of green coverage in built-up areas, industrial structure height, population density, industrial scale, and industrial structure optimization were selected to evaluate sensitivity. Resilience evaluates the ability of risk receptors to recover to the original state after the manifestation of water-related environmental risks. It is expressed in terms of per capita GDP, number of beds per thousand people, and technological progress. The data for the index system were derived from the China City Statistical Yearbook and the Statistical Yearbook of various provinces and cities of China.
2.3. Methods
2.3.1. Entropy Weight Method
Entropy is a physical quantity in physics that describes the degree of chaos in a system. Entropy was first introduced into the information theory by Shannon [34]. Entropy weight method is an important information weight model, which has been widely used in engineering technology, social sciences, economics, and other fields [35]. The entropy method is an objective evaluation method. Its advantage is that it can avoid the interference of human factors and improve the objectivity of the comprehensive evaluation result. It is more credible than the weight determined by subjective weighting methods [36].
The basic idea of the entropy method is to determine the objective weight according to the variability of the index. Generally speaking, if the information entropy of a certain index is smaller, the degree of variation of the index value is greater and more information is provided. Hence, the index can play a greater role in the comprehensive evaluation, and it assumes a greater weight [37,38]. Therefore, information entropy can be used to calculate the weight of each indicator, which provides the basis for comprehensive evaluation using multiple indicators. For example, Zhao et al. used the entropy weight method to evaluate the water security of Jiangxi Province [39], and Dong et al. used the AHP and the entropy weight method to evaluate the water security status of Luoyang City from 2006 to 2016 [40]. Aiming at the city-scale water-related environmental risk assessment of the YREB, the entropy weight method was used to determine the weights of various indicators that reflect the vulnerability based on the information in the actual data. This confers the index system the advantage of strong applicability.
The first step in entropy weight method is standardization. In this method, indicators and samples were set in the evaluation, and the measured value of the indicator in the sample is recorded as [41]. The standardized formulas for positive and negative indicators are as follows.
Subsequently, is generated by
In EWM, the entropy value of the sample is defined as
when , is set to 0.
lies in the [0, 1] domain. In EWM, the weight parameter is calculated as
Since the weights obtained in each year are different, the calculation results are not inter-yearly comparable. Therefore, after calculating the weights of each indicator in 2005, 2010, and 2015, the arithmetic average weight of the three years is used as the final weight of the indicator:
Based on the framework of water-related environmental risk assessment of the YREB, the entropy weight method was used to determine the weight of each index. The results are shown in Table 2. In terms of the average weight of indicators, the index with the highest weight is per capita GDP, followed by the number of hospital beds per thousand people, and the height of industrial structure, while the weights of other indicators vary in a small range.
Finally, the comprehensive score of each sample is calculated as follows:
2.3.2. Obstacle Degree Model
On the basis of the water-related environmental risk assessment of the YREB, the main obstacle factors affecting the level of water-related environmental risk need to be clarified. The obstacle degree model is often used to identify the obstacle factors affecting the development of things based on the comprehensive evaluation mode [40]. Therefore, this study introduces the obstacle degree model identifying the influencing factors of the water-related environmental risk. The obstacle degree model employs three indicators to perform the analysis and identification, i.e., contribution degree, index deviation degree, and obstacle degree. The specific calculation formula is as follows [42].
where represents the obstacle degree to the target of the indicator. The factor contribution degree represents the contribution degree of the indicator to the target, which can be expressed by the weight of the indicator. The indicator deviation degree represents the difference between the indicator and the ideal value, which is .
3. Results
3.1. Spatiotemporal Variations of Water Environmental Sub-System Risk in the YREB
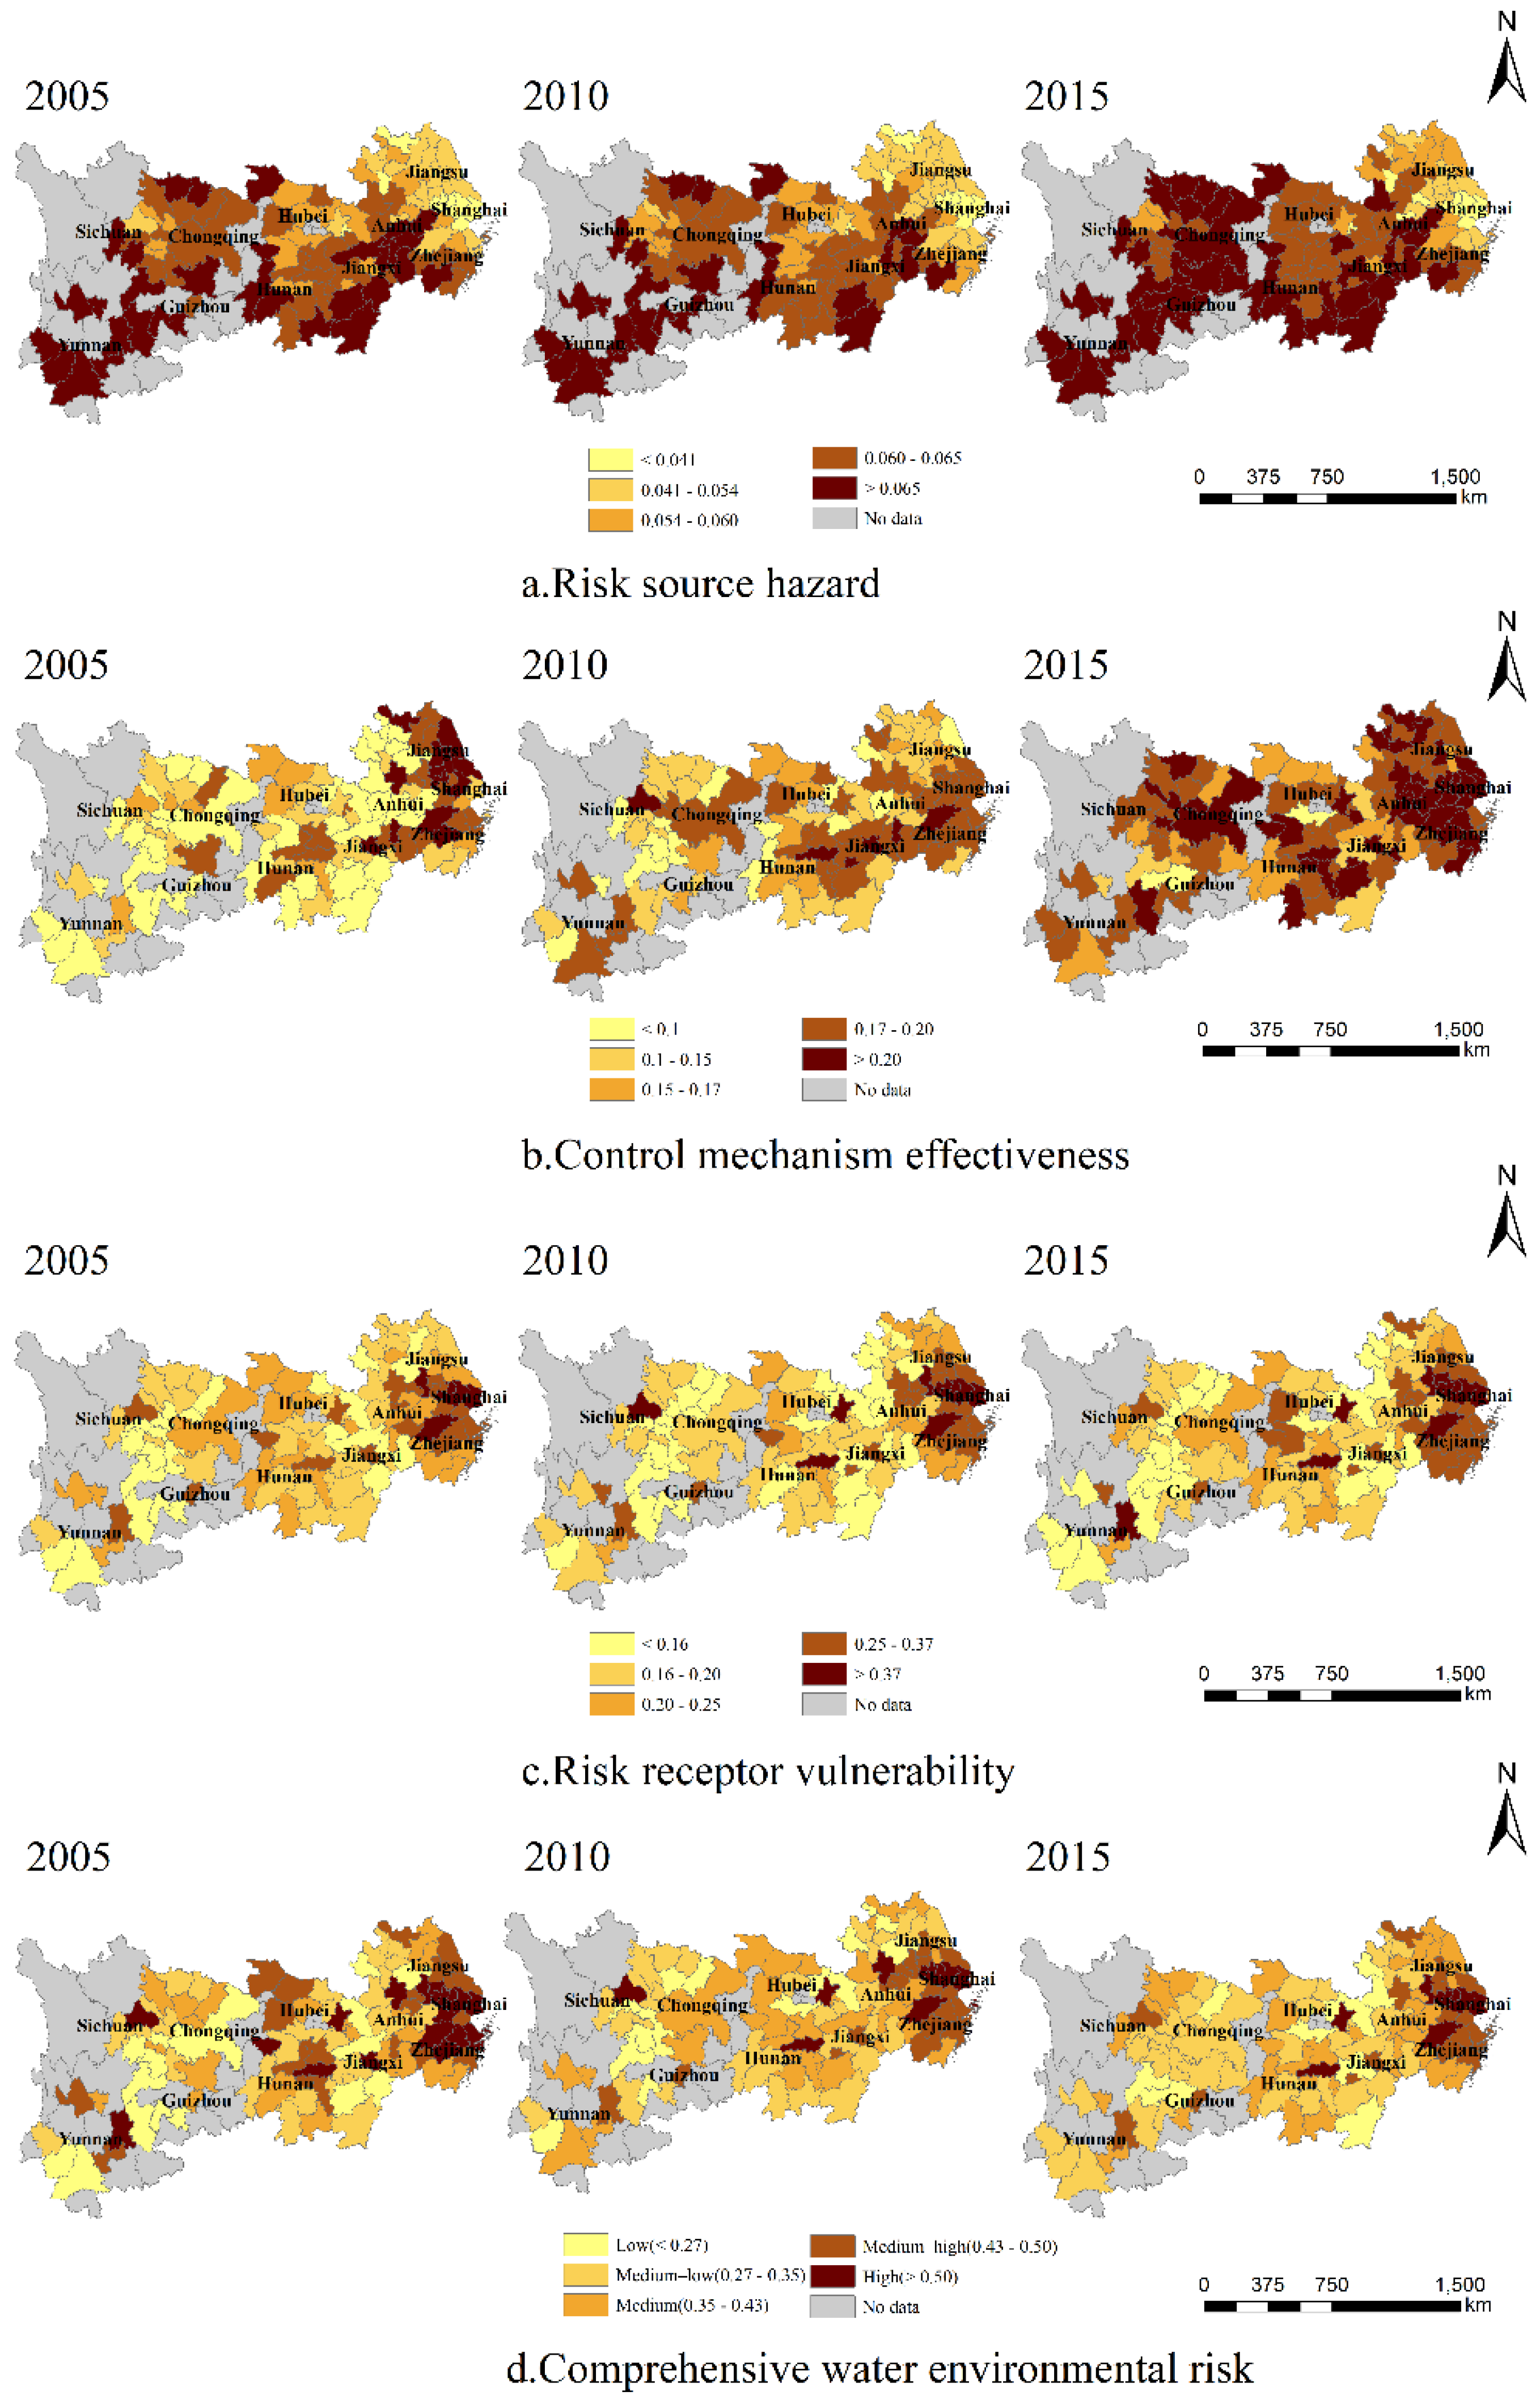
The spatiotemporal evolution results of the risk source hazards, the effectiveness of control mechanisms, the vulnerability of the risk receptors, and the comprehensive water-related environmental risks of the cities in the YREB were obtained (Figure 2). It can be seen that the risk sources hazards in the YREB gradually increased from 2005 to 2015 (Figure 2a). The spatial distribution of the risk sources hazards showed that in the areas with high hazard, there is the greater pressure on water-related environmental risk sources, were mainly concentrated in the upstream and midstream areas, such as Yunnan and Guizhou in the upstream area and Hubei and Jiangxi in the midstream area. From 2005 to 2015, there were apparent changes in the risk sources hazards in the midstream area, with most areas changing from low hazards to high hazards. The risk sources hazards in downstream cities did not show apparent change and maintained a low risk. The level of hazard of the risk sources was mainly affected by the use of chemical fertilizers and industrial wastewater treatment. The upstream and midstream area risk sources consisted of areas of high hazard, such as Yunnan, Guizhou, Sichuan, Hubei, etc., where there is more arable land so the use of chemical fertilizers was relatively high, the investment in environmental protection was low, and the wastewater discharge treatment facilities were not well-maintained. The economy of the downstream area was relatively more developed with fewer chemical fertilizers used, and greater emphasis on the management of water pollution. In this area, corresponding measures had been taken to control the use of chemical fertilizers and the discharge of industrial wastewater, and there was better environmental governance leading to a lower hazard level of the risk sources.
The effectiveness of water-related environmental risk control mechanisms is used to characterize the city’s ability to control the water pollution sources. The higher the effectiveness of the control mechanisms, the lower the water-related environmental risk will be. The spatiotemporal evolution of the effectiveness of control mechanisms showed that it had gradually increased throughout the basin from 2005 to 2015 (Figure 2b). In particular, the cities in the midstream and downstream areas had experienced significant changes, while the downstream cities had been in a constant state of high effectiveness. In 2005, the control mechanisms in Jiangsu, Zhejiang, and Shanghai, located in the downstream area, were significantly more effective than those in the upstream and midstream areas. In 2010, the effectiveness of the control mechanisms in most cities in the upstream and midstream areas, such as Chongqing, Wuhan, and Changsha, had increased significantly, while those Shanghai and Zhejiang in the downstream area had not changed significantly, but the effectiveness of northern Jiangsu (Yancheng City, Huai’an City, Yangzhou City, Lianyungang City, Xuzhou City, etc.) had decreased noticeably. This might be attributed to the greater attention being paid to environmental protection and increased infrastructure construction in the upstream and midstream areas, which had narrowed the gap in effectiveness of control mechanisms with the downstream cities. In 2015, the effectiveness of the control mechanisms of all cities in the YREB had increased overall, with downstream cities having the most apparent increase, followed by those in the upstream and midstream areas. The increase in the effectiveness of the control mechanisms showed that the ability to prevent water-related environmental risks had improved, and the government had paid more attention to water pollution problems, industrial wastewater treatment, and the protection of the water environment. It also reflects that, over the years, provincial and municipal governments have continuously promoted pollutant emission control measures, improved the level of urban environmental infrastructure, and carried out ecological civilization construction to achieve the results. However, in areas of low-effectiveness, there is an impetus to continue to enhance the effectiveness of solid waste, sewage, and garbage treatment.
The vulnerability of the included risk receptors is characterized by the sensitivity of the bearing body to water-related environmental risks and the resilience to the risks. The vulnerability of the risk receptors of the cities in the YREB increased slightly from 2005 to 2015, indicating that the bearing body’s carrying capacity was slightly reduced (Figure 2c). The Yangtze River Delta, Wuhan, Changsha, Chengdu, Guiyang, and other regions were at a relatively high vulnerability level, mainly due to the small proportion of green space, high population density and unbalanced industrial structure, resulting in high vulnerability and the areas being affected to a large extent. In comparison, Yibin, Dazhou, Qujing, and Fuyang, etc. had lower vulnerability, which means that they could withstand risks to a greater extent and minimize the losses caused by water-related environmental incidents. The analysis of the results of various evaluation indicators shows that the resilience of risk receptors in the study area has significantly improved. This indicates that investment in environmental protection infrastructure, technological progress, and medical and health conditions became more important as influencing factors.
3.2. Spatiotemporal Variations of Comprehensive Water-Related Environmental Risk in the YREB
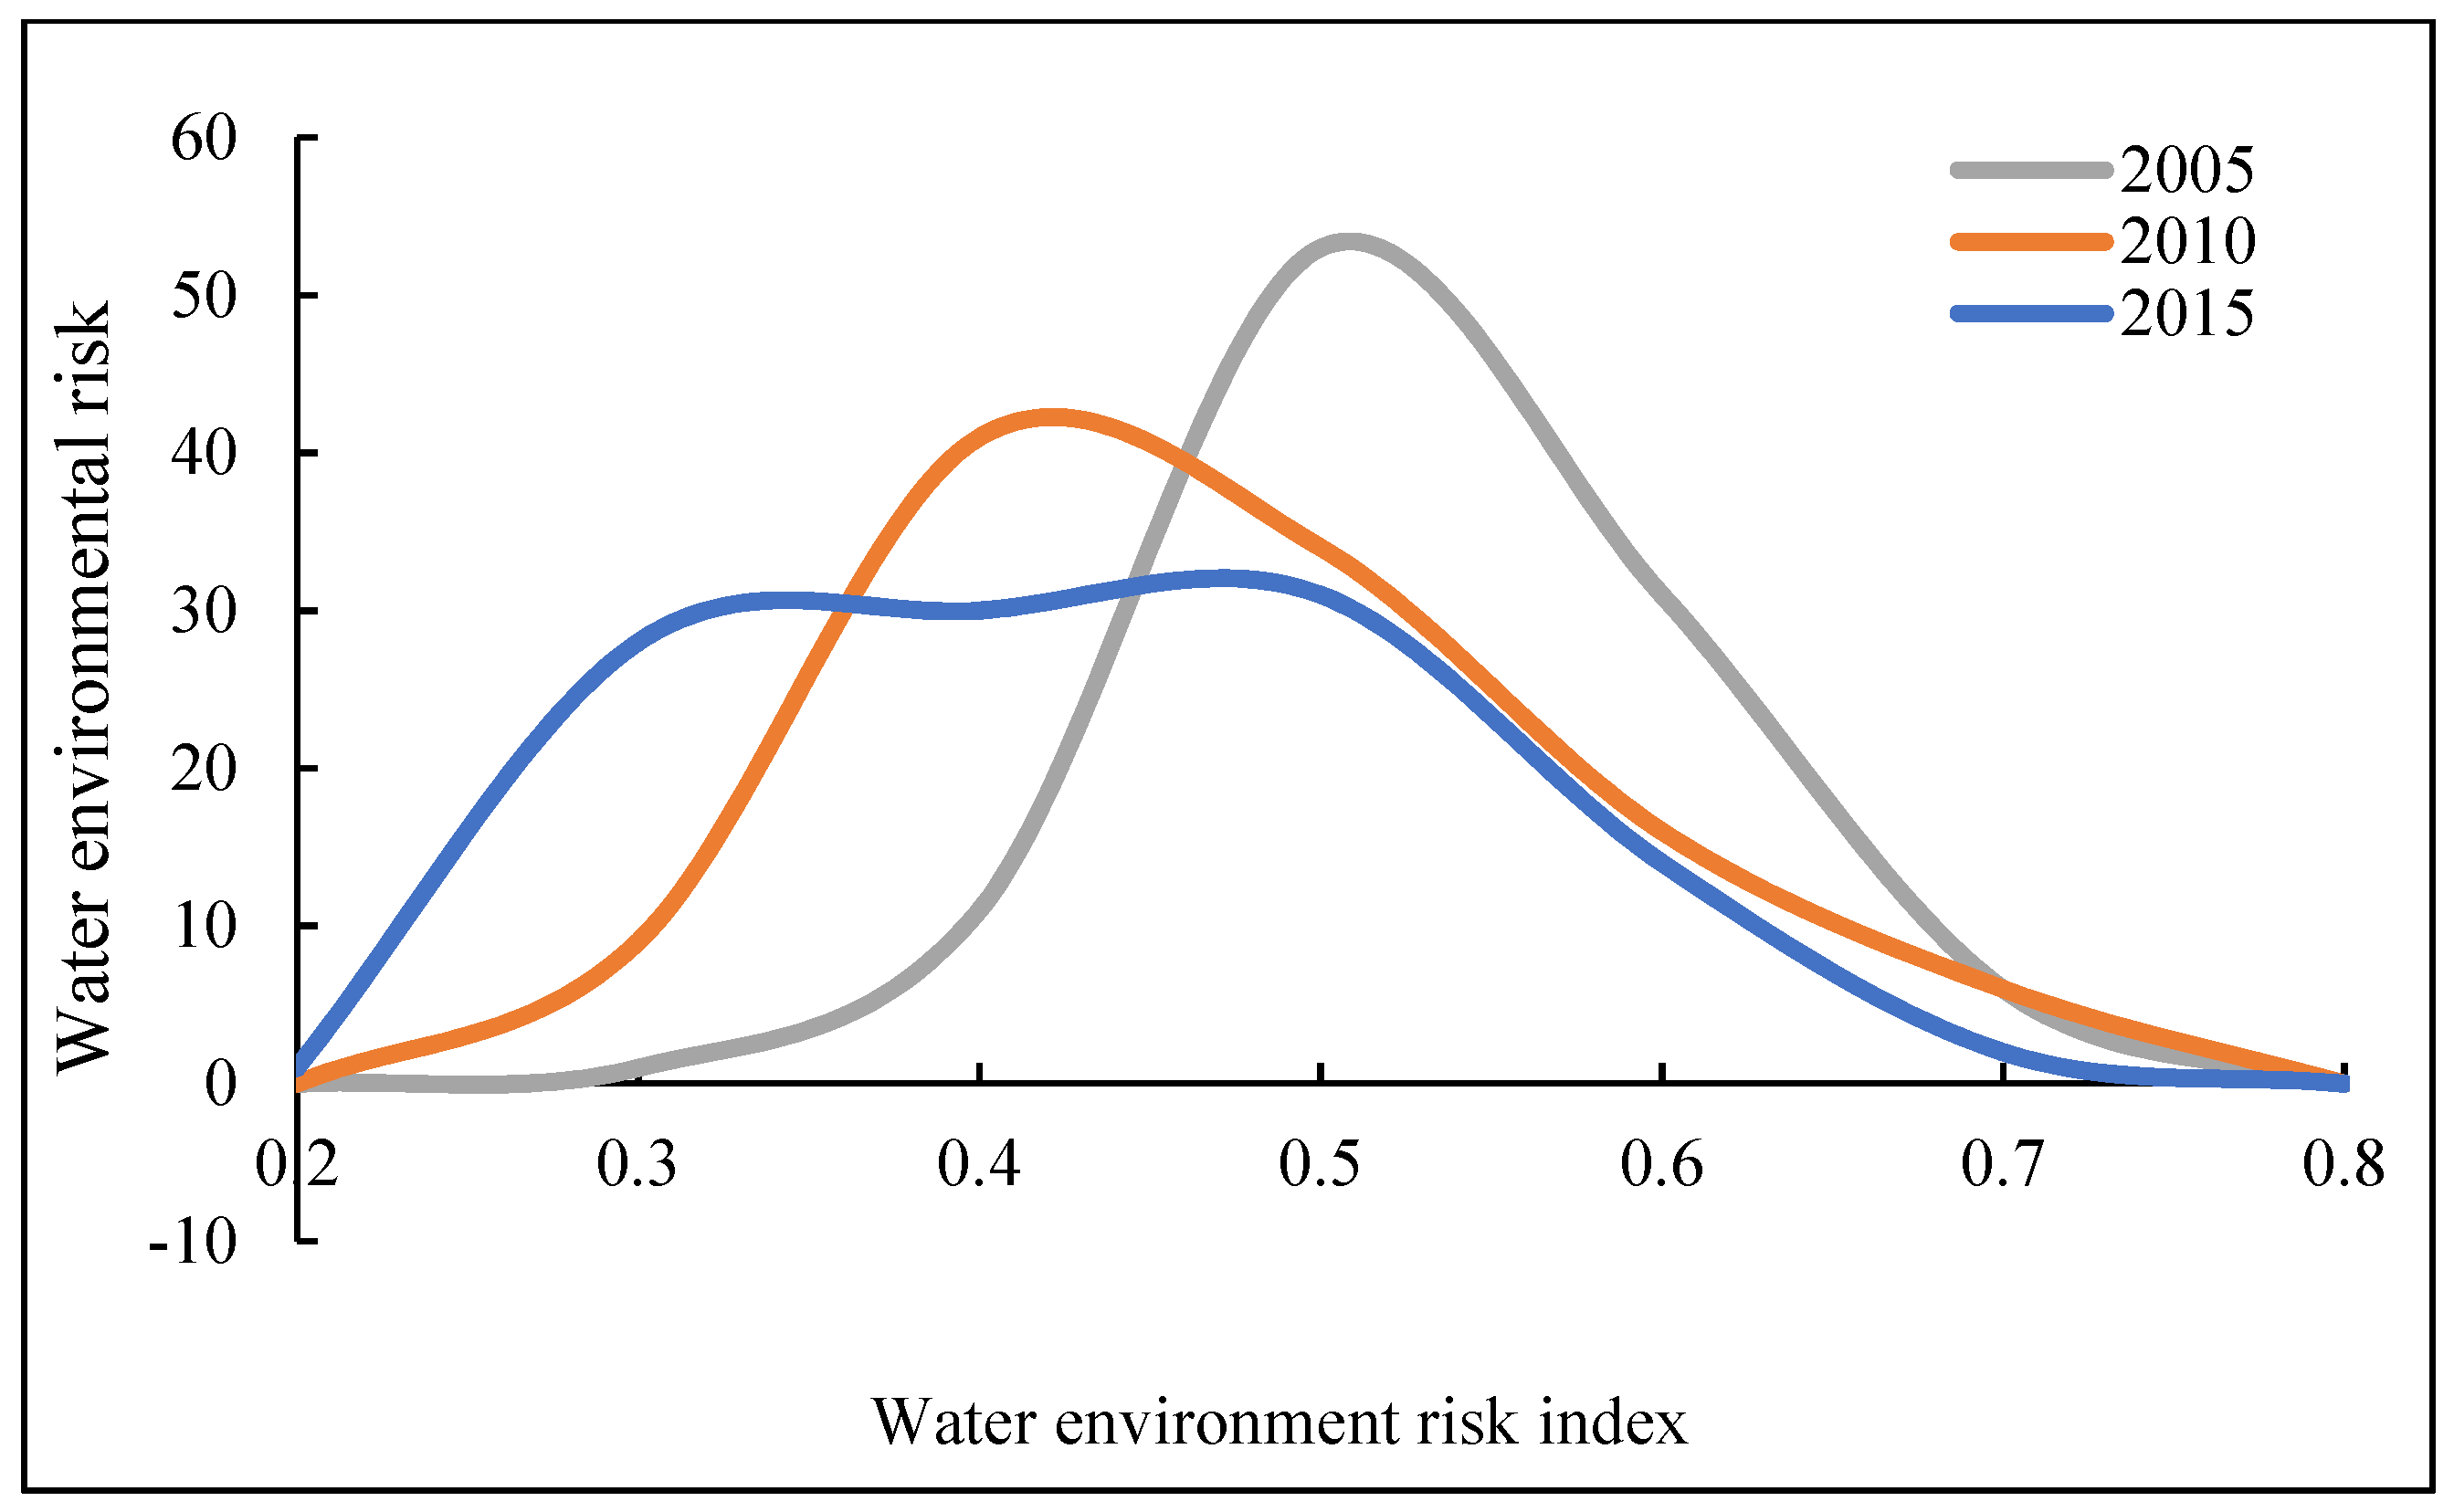
The comprehensive water-related environmental risk in the YREB presented a spatial distribution characteristic of being high in the east and low in the west (Figure 2d). In 2005, the comprehensive water-related environmental risk of cities in the YREB were relatively high. The high-risk areas were mainly located along the Yangtze River, including Chengdu, Wuhan, Changsha, Shanghai, Hefei, Wuxi, Nanjing, Changzhou, Suzhou, Hangzhou, Shaoxing, and Ningbo, etc. In comparison with 2005, the number of cities with high comprehensive water-related environmental risk decreased significantly in 2010, especially in the Yangtze River Delta region. However, Shanghai, Hangzhou, Wuxi, Changzhou, and Suzhou, which are located in the downstream area of the Yangtze River, were still at high risk level, while the risks of Yichang, Shiyan, Yueyang, Xiangtan, Zhangjiajie, and Zhuzhou in the midstream area were lower. The water-related environmental risk of the remaining cities did not differ significantly. In 2015, the water-related environmental risk was at a medium-low level. The regions with medium-high risk were distributed in the Yangtze River Delta and the capital cities of Hunan and Hubei provinces (Changsha and Wuhan) in the midstream area (Figure 3). From 2005 to 2015, the overall comprehensive water-related environmental risk showed a downward trend. The average comprehensive water-related environmental risk dropped from 0.493 in 2005 to 0.392 in 2015, and the risk reduction rate was approximately 25.76–16.55%. The comprehensive water-related environmental risk of the cities in the midstream area had decreased the most, with a decrease rate of more than 18%. Based on the frequency distribution diagram of the water-related environmental risk index (Figure 4), it can be seen that in 2005, the water-related environmental risk had only one peak and was at a medium-to-high level, distributed around 0.5. In 2010, the peak of the risk index shifted to around 0.4, which was at a medium level, showing a slight decrease from that of 2005. The frequencies of the peak risk index in 2005 and 2010 were both greater than 40, indicating that most cities were at a medium-to-high risk level. In 2015, the risk index peaked in the range of 0.2–0.5, and the frequency of high-risk areas dropped to less than 30, indicating that most cities had changed from medium-high risk to medium-low risk. Most cities had changed from being high-risk to medium-risk, relatively low-risk, and low-risk. The number of cities that had high risk or medium-high risk had gradually become fewer, and overall, there was a crucial transition of water-related environmental risk from high risk to medium-low risk. Judging from the results of various indicators, from 2005 to 2015, the hazard levels of risk sources and the sensitivity of risk receptors gradually increased, but the effectiveness of control mechanisms and the resilience of risk receptors also continuously improved. Combining the weights of various indicators, a comprehensive analysis showed that the water-related environmental risk depends largely on the changes of the latter two components, which contributed to the gradual reduction in the water-related environmental risk.
3.3. Analysis of Obstacle Factors of Water-Related Environmental Risk in the YREB
3.3.1. Analysis of Index Layer Obstacle Factors on Water-Related Environmental Risk
Based on the obstacle model, this study further analyzed and explored the obstacle factors that affected water-related environmental risk in the YREB. Due to the large number of indicators at the index level, this study only lists the top five obstacle factors for different water-related environmental risk level regions in 2005, 2010, and 2015 according to the degree of obstacles (Table 3). It can be seen that in three years, per capita GDP (C12), number of beds per thousand people (C13), and industrial structure height (C8) had the highest frequencies. Among them, the obstacle degree of per capita GDP reached an average of 34.43%, followed by the number of beds per thousand people and the industrial structure height, with the average values of 18.70% and 15.55%, respectively. Looking at individual years, the top five obstacles that occurred most frequently in 2005 were GDP per capita (C12), number of beds per thousand people (C13), industrial structure height (C8), centralized treatment rate of sewage treatment plants (C4), and industrial structure optimization (C11). The centralized treatment rate of sewage treatment plants and industrial structure optimization fall under the aspects of the effectiveness of the control mechanisms and risk receptor’s vulnerability, respectively. This indicates that the water-related environmental risk in 2005 had insufficient control mechanisms, and the industrial structure was not optimized. The reason for the lack of control mechanisms was that the construction of sewage treatment plants was relatively low, and the infrastructure was not complete. In 2010, per capita GDP (C12), number of hospital beds per thousand people (C13), industrial structure height (C8), and industrial structure optimization (C11) were still the main obstacle factors. In addition, technological progress (C14) was also added to the list, which showed the slow development of water-related environmental risk mitigating technology. In 2015, per capita GDP (C12), number of hospital beds per thousand people (C13), industrial structure height (C8), and industrial structure optimization (C11) had the same frequency, and the frequency of technological progress (C14) was only four, meaning that the obstacle of technological progress became smaller. In general, the overall water-related environmental risk obstacle factors did not change much from 2005 to 2015. Looking at the main obstacle factors in areas with different risk levels, the most prominent obstacle factor in low risk, medium-low risk, and medium risk areas from 2005 to 2015 was GDP per capita. The most prominent obstacle factor in medium-high risk and high risk areas had shifted from GDP per capita to industrial structure height and industrial structure optimization. This implies that the industrial structure in medium-high risk and high risk areas was not optimized. There is a need to enhance industrial structure transformation in order to more effectively mitigate and reduce the water-related environmental risks.
In addition, based on the frequencies of the top three obstacle factors at the provincial level (Table 4), it can be seen that GDP per capita (C12), industrial structure height (C8), and number of hospital beds per thousand people (C13) appeared 33 times, 33 times, and 29 times. Therefore, these three indicators were the leading obstacle factors affecting the water-related environmental risks of the YREB from 2005 to 2015. In addition to per capita GDP and industrial structure height, Shanghai had two other important obstacle factors which were the non-hazardous treatment of domestic waste and technological progress. For Hubei and Hunan, the important obstacle factors were number of beds per thousand people, GDP per capita, and the centralized treatment rate of the sewage treatment plants. The obstacle factors which ranked third in 2005 varied greatly in each province, and there was no significant change of the factors within each province from 2010 to 2015. From 2005 to 2015, the overall obstacle factors of different provinces did not change substantially. In addition, some indicators such as the non-harmful treatment rate of domestic waste and the comprehensive utilization rate of industrial solid waste posed a relatively small obstacle to water-related environmental risks. The results of the obstacle indicator distribution showed that the main obstacle indicators affecting the water-related environmental risks were relatively evenly distributed among the various risk levels. Therefore, whether it is a low-risk area or a high-risk area, various factors should be considered comprehensively to improve industrial production efficiency, strictly control pollution discharge, increase the development of tertiary industries, strengthen the construction of environmental protection infrastructure, promote the adjustment and optimization of industrial structure, further improve economic efficiency, develop the regional social economy and increase the awareness of environmental protection. This eventually leads to the mitigation and minimization of water-related environmental risks.
3.3.2. Analysis of Criterion Layer Obstacle Factors on Water-Related Environmental Risk
This study further calculated the obstacle degrees of criterion layer factors to the water-related environmental risk in the YREB, and divided them into five categories according to the dominant obstacles: industrial source (B1), agricultural source (B2), source control (B3), sensitivity (B4), and resilience (B5) (Table 5). The obstacle degree of each criterion layer factor to the water-related environmental risk at each risk level was different. The obstacle degree of the industrial source (B1) factors all exhibited an increasing trend. The obstacle degree of agricultural source (B2) factors gradually increased only in high risk areas, and experienced initial increase and subsequent decrease in all other areas. The obstacle degree of the source control (B3) factor decreased in all five risk areas. The obstacle degree of the sensitivity (B4) factor decreased in low risk areas. In high risk areas, the sensitivity obstacle degree first decreased and then increased, while in medium-low risk, medium risk, and medium-high risk areas, it all showed an increasing trend. The obstacle degree of the resilience (B5) factor declined in low risk, medium-high risk, and high risk areas, suggesting that these areas had the ability to recover to their original state after the occurrence of water-related environmental risks had increased. In low risk areas, the obstacle degree resilience factor increased, and it first increased and then decreased in the medium risk areas. The distribution of the obstacle indicators showed that reducing the hazard levels of risk sources, strictly controlling the discharge of pollutants, maintaining and promoting source control, and improving the resilience of risk receptors are important for mitigating and reducing water-related environmental risks.
4. Discussion
Water environmental issues have always been a focus of sustainable development of the YREB. A comprehensive and systematic index system, combined with appropriate evaluation methods, forms the basis of the water-related environmental risk evaluation. In existing studies, there are relatively few studies on water-related environmental risk assessment using prefecture-level cities in the YREB, therefore, the research reported in this paper has a typicality. This study comprehensively assessed the water environment of the prefecture cities in the YERB during 2005–2015, analyzed the spatiotemporal evolution characteristics and further analyzed the influencing factors. The results of this study revealed that the effectiveness of control mechanisms and the resilience of the receptors of each city still needed to be improved, and the potential should be investigated using the sources of the risk hazards as an entry point. At the same time, efforts should be made to control the emissions of industrial enterprises and agricultural pollution sources, as well as to actively promote the transformation, optimization, and upgrading of industrial infrastructure. These efforts would alleviate the risks to the water environment. The results of this study show that areas of high water-related environmental risk were located in the downstream area of the YREB, which was consistent with the findings of Li et al. (2018) highlighting the Yangtze River Delta as an environmental risk hotspot [43]. However, this study is limited by the availability of reference materials and data. It did not fully examine the water environment of the YREB in detail. In addition, this study is only based on the data for years, 2005, 2010, and 2015. For future research, the timeline can be gradually extended to further explore its regularity. However, due to the different developmental stages these cities are in, some indicators may differ from city to city. The entropy method is an objective weighting method with a sound mathematical basis. This can help us to overcome the bias of previous subjective weighting methods which rely on personal factors. Our research also shows that the index weight is not static, but constantly changes with the development of social economy. Therefore, it is more reasonable to use the entropy method to comprehensively evaluate the risk for different years. Besides, the index system could be further enriched and improved.
5. Conclusions
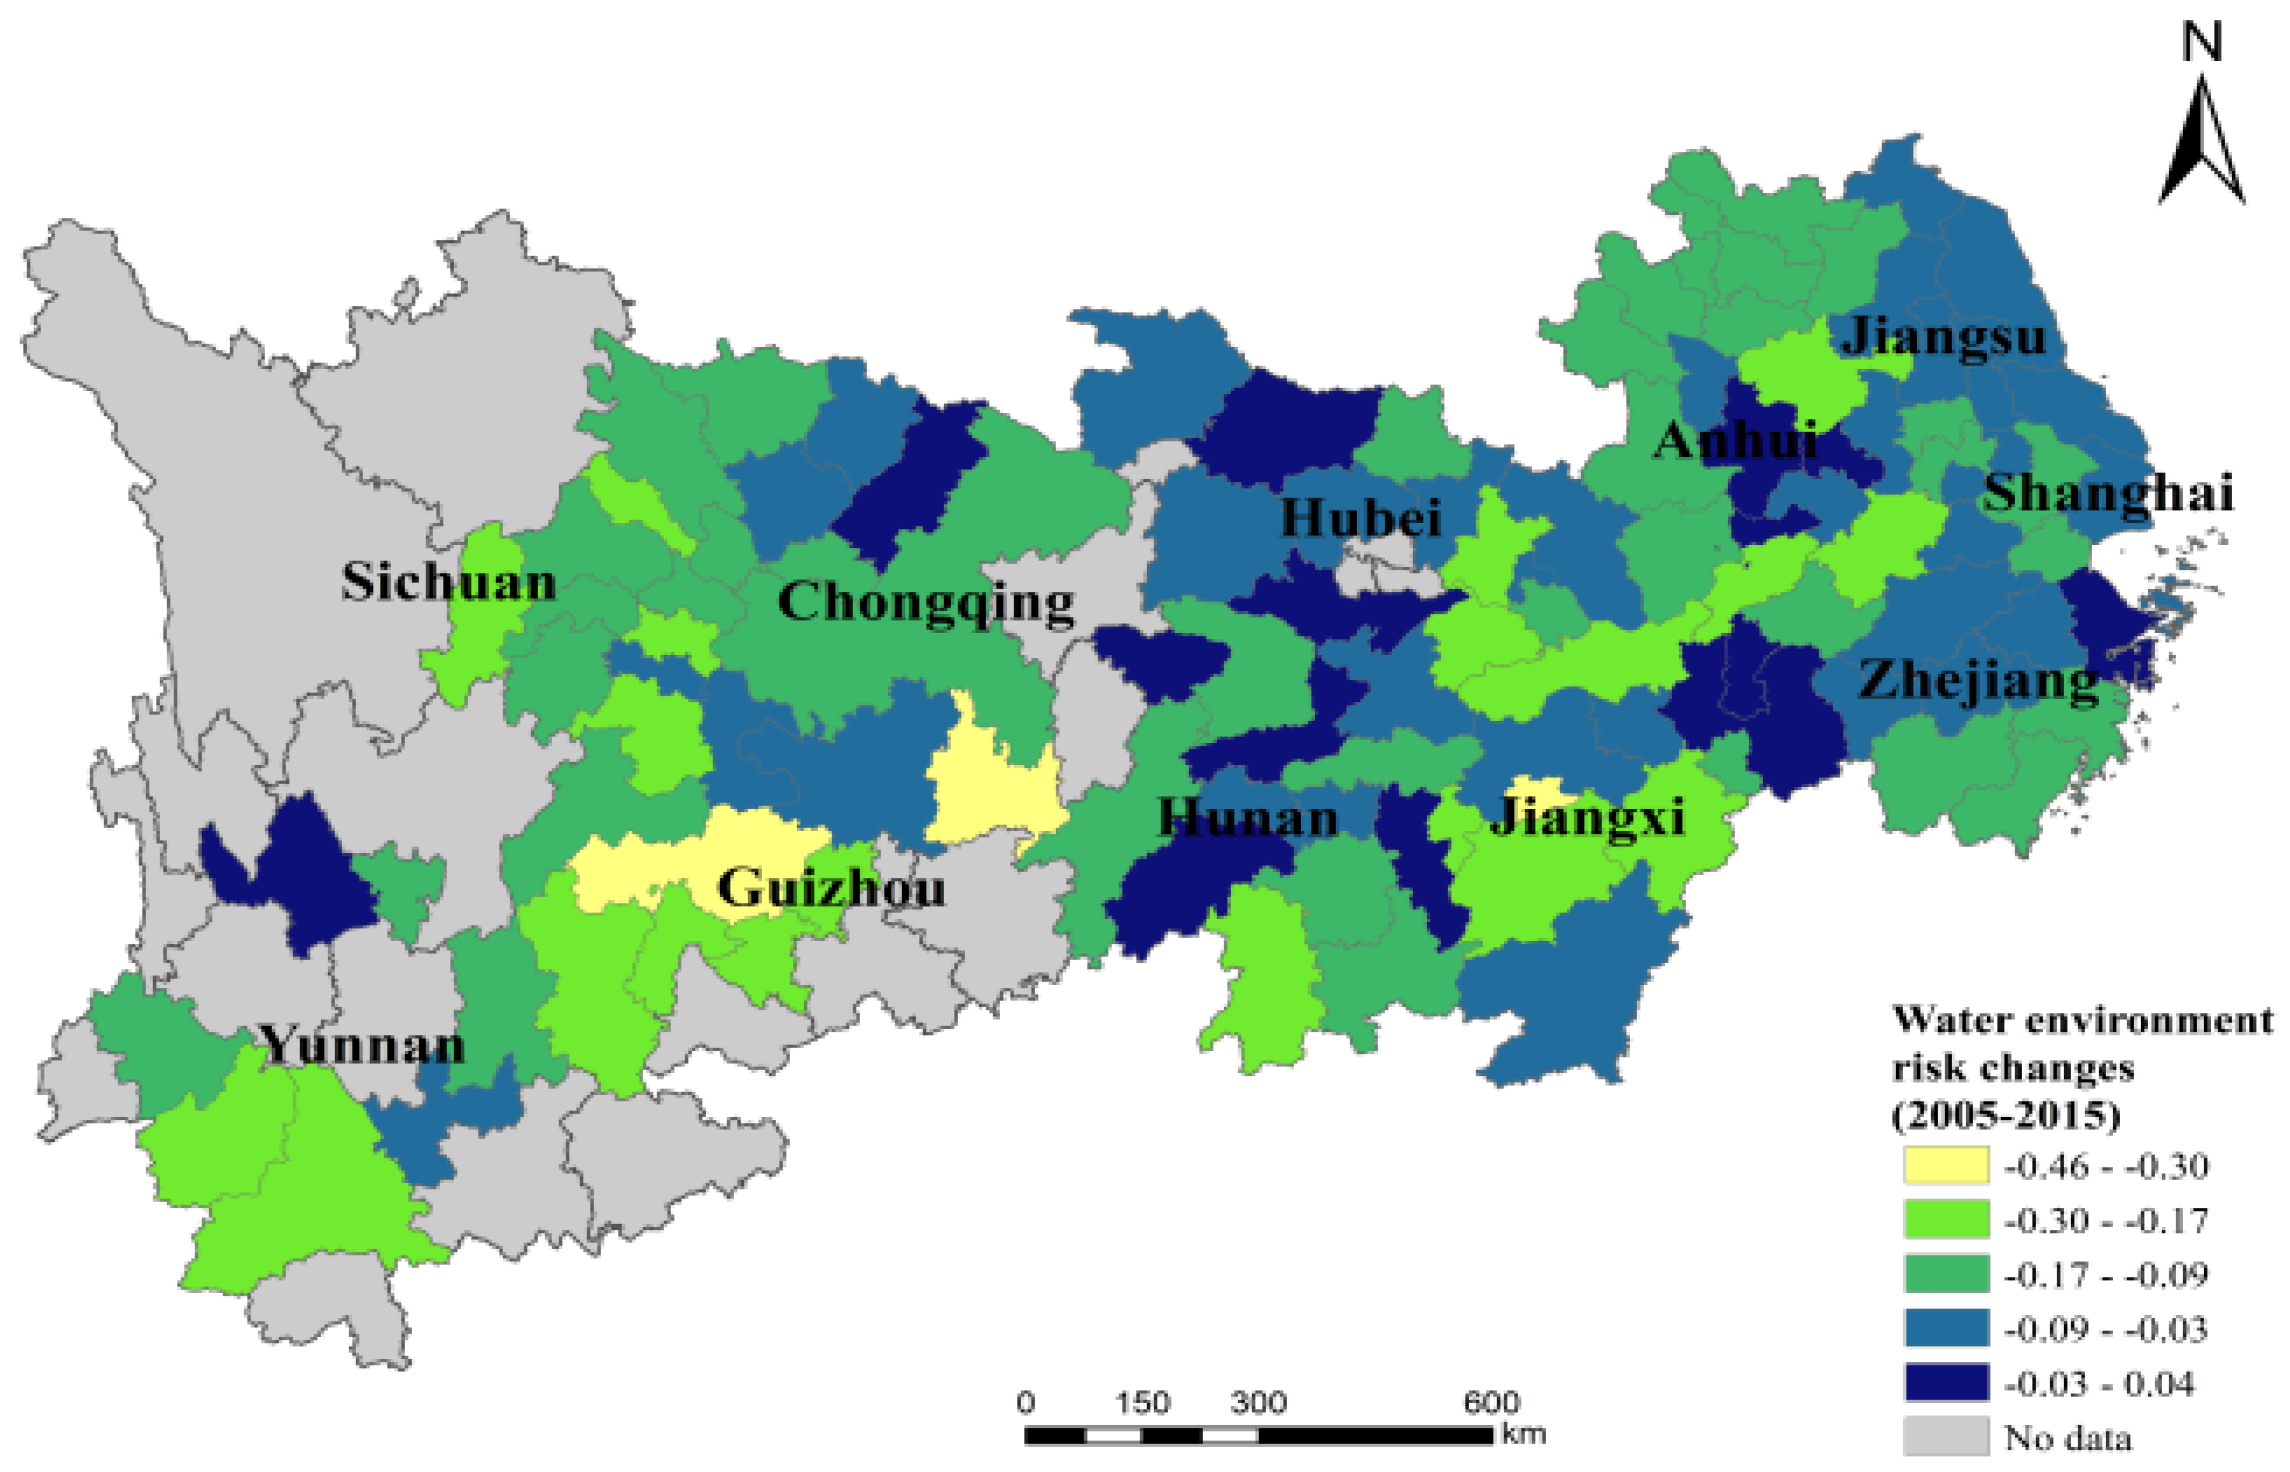
To facilitate ecological environmental protection and green development and to support the prevention, control, and management of water-related environmental risks in the YREB, this study used prefecture-level cities as the evaluation unit to construct a water-related environmental risk assessment index system based on three aspects, i.e., the risk sources hazards, the effectiveness of the control mechanisms, and the vulnerability of the risk receptors. The entropy weight method was used to determine the index weighting and to assess the city-scale water-related environmental risks of the YREB in 2005, 2010, and 2015. The obstacle degree model was applied to analyze the main obstacle factors that affected the water-related environmental risk. The results showed that the overall water-related environmental risk of cities in the YREB presented a downward trend from 2005 to 2015. Among them, the upstream and midstream cities, such as Zhangjiajie, Zhuzhou, Yichang, Nanchang, etc. showed the most obvious reduction. This was due to government’s timely attention and management. From the perspective of spatial pattern changes, the water-related environmental risk of the YREB presented a characteristic of high in the east and low in the west. The areas with higher risk were mainly distributed in the Yangtze River Delta and areas along the Yangtze River such as Shanghai, Wuxi, and Hangzhou, etc. The vulnerability of the risk receptors in these areas was high. Therefore, efforts should be made to improve the resilience of the carrying body and conduct water-related environmental risk management, prevention, and control to achieve urban ecological environmental protection and sustainable development.
In terms of water-related environmental risk sources, the risk sources hazards in cities in the upstream and midstream areas of the YREB were higher than those in the downstream area. The risk sources hazards during 2005–2015 showed a continued increasing trend, especially for the cities in the midstream area, and this was mainly due to the large area of arable land, serious agricultural pollution, high pollution emissions from industrial enterprises, and faulty environmental protection facilities in the upstream and midstream areas. Therefore, prevention and control of water-related environmental problems caused by industrial enterprises and agricultural pollution should be strengthened. Reducing emissions and fertilizer use and enhancing wastewater treatment capacity should be the aim of ecological protection. The effectiveness of control mechanisms during 2005–2015 increased significantly, especially in the upstream and midstream areas, which reduced the water-related environmental risk. Meanwhile, the effectiveness of the control mechanisms in the downstream cities has always been high, which was beneficial to water-related environmental risk control. It is worth noting that, in general, the vulnerability of risk receptors was not high, but vulnerability in Shanghai, northeastern Anhui, northern Zhejiang, and southern Jiangsu still need to be monitored. The downstream area was one of the regions with the highest population density and the highest economic strength in China, thus its high vulnerability. It should further enhance the receptor’s resilience, reduce the receptor’s vulnerability, and strengthen water environmental management. Enterprises should also be encouraged to participate in water-related environmental risk governance, adjust industrial infrastructure, improve economic benefits, and develop a sustainable social economy. In addition, the main obstacles to water-related environmental risks in the Yangtze River Economic Zone were GDP per capita, the number of beds per thousand people, and the height of the industrial structure. Among them, the most prominent obstacle factor in low risk, medium-low risk, and medium risk areas was GDP per capita. The most prominent obstacle factors in medium-high risk and high risk areas had changed from GDP per capita to the industrial structure height and optimization of industrial structure, indicating that the industrial structure in medium-high risk and high risk areas was undesirable, and further adjustments and changes were needed. The identification of obstacle factors revealed the shortcomings in alleviating water-related environmental risk. Therefore, promoting industrial restructuring, strictly controlling pollutant emissions, accelerating the development of tertiary industries, improving economic benefits, developing the regional social economy, and strengthening the construction of environmental protection infrastructure are proposed as effective ways to mitigate and reduce water-related environmental risks.
Author Contributions
Conceptualization, X.C., Z.L., L.P.; methodology, J.W., J.B., Z.L.; formal analysis, J.W., Z.S.; data curation, Z.S., J.B., L.P.; writing—original draft preparation, J.W., Z.L.; writing—review and editing, X.C., Z.L.; supervision, Z.L. All authors have read and agreed to the published version of the manuscript.
Funding
This research was funded by National Natural Science Foundation of China (Grant No.41890824 and 71804175) and the Ministry of Education Philosophy and Social Sciences Fund (Grant No.17YJC790122).
Acknowledgments
This research was supported by the Major Program of the National Natural Science Foundation of China (Grant No. 41890824), the Young Scientists Fund of the National Natural Science Foundation of China (Grant No. 71804175) and the Ministry of Education Philosophy and Social Sciences Fund (Grant No. 17YJC790122). We also would like to thank the reviewers for their thoughtful comments that helped improve the quality of this work.
Conflicts of Interest
The authors declare no conflict of interest.
References
- Leng, S.; Zhai, Y.; Jiang, S.; Lei, Y.; Wang, J. Water-environmental risk assessment of the Beijing-Tianjin-Hebei collaborative development region in China. Hum. Ecol. Risk Assess. Int. J. 2016, 23, 141–171. [Google Scholar] [CrossRef]
- Ziajahromi, S.; Khanizadeh, M.; Nejadkoorki, F. Using the RESRAD Code to Assess Human Exposure Risk to226Ra,232Th, and40K in Soil. Hum. Ecol. Risk Assess. Int. J. 2015, 21, 250–264. [Google Scholar] [CrossRef]
- Liu, S.; Wang, H.; Li, Y. Current Progress of Environmental Risk Assessment Research. Procedia Environ. Sci. 2012, 13, 1477–1483. [Google Scholar] [CrossRef] [Green Version]
- Yin, R.; Yang, X.; Sun, X.; Zhu, X. Environmental risk rankings and prior management strategies on chemical industry parks in the coastal area of Jiangsu Province. China Environ. Sci. 2011, 31, 1225–1232. [Google Scholar]
- Skinner, D.J.; Rocks, S.A.; Pollard, S.J.; Drew, G.H. Identifying uncertainty in environmental risk assessments: The development of a novel typology and its implications for risk characterization. Hum. Ecol. Risk Assess. 2014, 20, 607–640. [Google Scholar] [CrossRef] [Green Version]
- Gómez, A.G.; Ondiviela, B.; Puente, A.; Juanes, J.A. Environmental risk assessment of water quality in harbor areas: A new methodology applied to European ports. J. Environ. Manag. 2015, 155, 77–88. [Google Scholar] [CrossRef]
- Sun, S.; Wang, Y.; Liu, J.; Cai, H.; Wu, P.; Geng, Q.; Xu, L. Sustainability assessment of regional water resources under the DPSIR framework. J. Hydrol. 2016, 532, 140–148. [Google Scholar] [CrossRef]
- Peng, J.; Song, Y.; Yuan, P.; Xiao, S.; Han, L. An novel identification method of the environmental risk sources for surface water pollution accidents in chemical industrial parks. J. Environ. Sci. 2013, 25, 1441–1449. [Google Scholar] [CrossRef]
- Xiao, J.; Wang, L.; Deng, L.; Jin, Z. Characteristics, sources, water quality and health risk assessment of trace elements in river water and well water in the Chinese Loess Plateau. Sci. Total Environ. 2019, 650, 2004–2012. [Google Scholar] [CrossRef] [PubMed]
- Hasily, M.; Golabi, M.; Nasab, S.B. Study and evaluation of irrigation and drainage networks using analytic hierarchy process in Khuzestan Province: A virtual water approach. Agric. Water Manag. 2020, 241, 106305. [Google Scholar] [CrossRef]
- Wei, J.; Zhang, N.; Cheng, Q.; Wu, S.; Liu, Z. Simulation and evaluation of the spatial heterogeneity of shallow-groundwater environmental risk in an urban–rural fringe of megacity: A case study of Shenyang city, northeast China. Environ. Earth Sci. 2020, 79, 1–11. [Google Scholar]
- Shi, E.; Shang, Y.; Li, Y.; Zhang, M. A cumulative-risk assessment method based on an artificial neural network model for the water environment. Environ. Sci. Pollut. Res. 2021, 7, 1–10. [Google Scholar] [CrossRef]
- Xiao, Z.; Gao, J.; Su, Y. China’s water risk assessment and industrial source analysis based on the localization of WWF water risk assessment tools. EIA Rev. 2019, 78, 106285. [Google Scholar] [CrossRef]
- De Souza, A.T.; Carneiro, L.A.T.X.; Junior, O.P.D.S.; De Carvalho, S.L.; Pinheiro, J.H.P.A. Assessment of water quality using principal component analysis: A case study of the Marrecas stream basin in Brazil. Environ. Technol. 2020, 1–10. [Google Scholar] [CrossRef] [PubMed]
- Deng, C.; Liu, L.; Li, H.; Peng, D.; Wu, Y.; Xia, H.; Zhang, Z.; Zhu, Q. A data-driven framework for spatiotemporal character-istics, complexity dynamics, and environmental risk evaluation of river water quality. Sci. Total Environ. 2021, 785, 147134. [Google Scholar] [CrossRef] [PubMed]
- Wang, D.; Chen, X.; Zhang, J.; Zhong, Y.; Liu, R.; Ding, P. Geographic information system–based health risk assessment of rural drinking water in Central China: A case study of You County, Hunan. Environ. Monit. Assess. 2021, 193, 1–13. [Google Scholar] [CrossRef]
- Yang, Y.; Lei, X.; Long, Y.; Tian, Y.; Zhang, Y.; Yao, Y.; Hou, X.; Shi, M.; Wang, P.; Zhang, C.; et al. A novel comprehensive risk assessment method for sudden water accidents in the Middle Route of the South–North Water Transfer Project (China). Sci. Total Environ. 2020, 698, 134167. [Google Scholar] [CrossRef] [PubMed]
- Yan, R.; Gao, Y.; Li, L.; Gao, J. Estimation of water environmental capacity and pollution load reduction for urban lakeside of Lake Taihu, eastern China. Ecol. Eng. 2019, 139, 105587. [Google Scholar] [CrossRef]
- Cao, G.; Gao, Y.; Wang, J.; Zhou, X.; Bi, J.; Ma, Z. Spatially resolved risk assessment of environmental incidents in China. J. Clean. Prod. 2019, 219, 856–864. [Google Scholar] [CrossRef]
- Yang, T.; Zhang, Q.; Wan, X.; Li, X.; Wang, Y.; Wang, W. Comprehensive ecological risk assessment for semi-arid basin based on conceptual model of risk response and improved TOPSIS model-a case study of Wei River Basin, China. Sci. Total Environ. 2020, 719, 137502. [Google Scholar] [CrossRef]
- Di, H.; Liu, X.; Zhang, J.; Tong, Z.; Ji, M. The spatial distributions and variations of water environmental risk in Yinma River Basin, China. Int. J. Environ. Res. Public Health 2018, 15, 521. [Google Scholar] [CrossRef] [PubMed] [Green Version]
- Xu, E.G.; Leung, K.M.; Morton, B.; Lee, J.H. An integrated environmental risk assessment and management framework for enhancing the sustainability of marine protected areas: The Cape d’Aguilar Marine Reserve case study in Hong Kong. Sci. Total Environ. 2015, 505, 269–281. [Google Scholar] [CrossRef]
- Ming, Z.; Xiang, L. Regional risk assessment for urban major hazards based on GIS geoprocessing to improve public safety. Saf. Sci. 2016, 87, 18–24. [Google Scholar]
- Huang, L.; Chen, J.; Ban, J.; Han, Y.; Li, F.; Yang, J.; Gao, J. A framework for fuzzy evaluation of emergency responses to chemical leakage accidents. Environ. Eng. Manag. J. 2016, 15, 1109–1119. [Google Scholar] [CrossRef]
- Chai, N.; Yi, X.; Xiao, J.; Liu, T.; Liu, Y.; Deng, L.; Jin, Z. Spatiotemporal variations, sources, water quality and health risk assessment of trace elements in the Fen River. Sci. Total Environ. 2021, 757, 143882. [Google Scholar] [CrossRef]
- Zhang, Y.; Sun, M.; Yang, R.; Li, X.; Zhang, L.; Li, M. Decoupling water environment pressures from economic growth in the Yangtze River Economic Belt, China. Ecol. Indic. 2021, 122, 107314. [Google Scholar] [CrossRef]
- Jin, G.; Deng, X.; Zhao, X.; Guo, B.; Yang, J. Spatiotemporal patterns in urbanization efficiency within the Yangtze River Economic Belt between 2005 and 2014. J Geogr. Sci. 2018, 28, 1113–1126. [Google Scholar] [CrossRef] [Green Version]
- Li, L.; Liu, Y. Industrial green spatial pattern evolution of Yangtze River Economic Belt in China. Chin. Geogr. Sci. 2017, 27, 660–672. [Google Scholar] [CrossRef]
- Yu, X.; Li, C.; Huo, T.; Ji, Z. Information diffusion theory-based approach for the risk assessment of meteorological disasters in the Yangtze River Basin. Nat. Hazards 2021, 107, 2337–2362. [Google Scholar] [CrossRef]
- Liu, Y.; Zhang, X.; Kong, X.; Wang, R.; Chen, L. Identifying the relationship between urban land expansion and human ac-tivities in the Yangtze River Economic Belt, China. Appl. Geogr. 2018, 94, 163–177. [Google Scholar] [CrossRef]
- Lin, M.; Lin, T.; Sun, C.; Jones, L.; Sui, J.; Zhao, Y.; Liu, J.; Xing, L.; Ye, H.; Zhang, G.; et al. Using the Eco-Erosion Index to assess regional ecological stress due to urbanization – A case study in the Yangtze River Delta urban agglomeration. Ecol. Indic. 2020, 111, 106028. [Google Scholar] [CrossRef]
- Xu, X.; Yang, G.; Tan, Y.; Liu, J.; Hu, H. Ecosystem services trade-offs and determinants in China’s Yangtze River Economic Belt from 2000 to 2015. Sci. Total Environ. 2018, 634, 1601–1614. [Google Scholar] [CrossRef]
- Li, C.; Sun, L.; Jia, J.; Cai, Y.; Wang, X. Risk assessment of water pollution sources based on an integrated k-means clustering and set pair analysis method in the region of Shiyan, China. Sci. Total Environ. 2016, 557–558, 307–316. [Google Scholar] [CrossRef]
- Lesne, A. Shannon entropy: A rigorous notion at the crossroads between probability, information theory, dynamical systems and statistical physics. Math. Struct. Comput. Sci. 2014, 24, 240311. [Google Scholar] [CrossRef] [Green Version]
- Ding, X.; Chong, X.; Bao, Z.; Xue, Y.; Zhang, S. Fuzzy Comprehensive Assessment Method Based on the Entropy Weight Method and Its Application in the Water Environmental Safety Evaluation of the Heshangshan Drinking Water Source Area, Three Gorges Reservoir Area, China. Water 2017, 9, 329. [Google Scholar] [CrossRef] [Green Version]
- Liu, L.; Zhou, J.; An, X.; Zhang, Y.; Yang, L. Using fuzzy theory and information entropy for water quality assessment in Three Gorges region, China. Expert Syst. Appl. 2010, 37, 2517–2521. [Google Scholar] [CrossRef]
- Qian, B.; Zhu, Y.; Wang, Y.; Yan, F. Can Entropy Weight Method Correctly Reflect the Distinction of Water Quality Indices? Water Resour. Manag. 2020, 34, 3667–3674. [Google Scholar]
- Zhu, Y.; Tian, D.; Yan, F. Effectiveness of Entropy Weight Method in Decision-Making. Math. Probl. Eng. 2020, 3564835. [Google Scholar] [CrossRef]
- Zhao, J.; Chen, Y.; Xu, J.; Jin, J.; Wang, G.; Shamseldin, A.; Guo, Y.; Cheng, L. Regional water security evaluation with risk control model and its application in Jiangsu Province, China. Environ. Sci. Pollut. Res. 2021, 2021, 1–16. [Google Scholar] [CrossRef]
- Dong, G.; Shen, J.; Jia, Y.; Sun, F. Comprehensive Evaluation of Water Resource Security: Case Study from Luoyang City, China. Water 2018, 10, 1106. [Google Scholar] [CrossRef]
- Zhang, K.; Shen, J.; He, R.; Fan, B.; Han, H. Dynamic analysis of the coupling coordination relationship between urbanization and water resource security and its obstacle factor. Int. J. Environ. Res. Public Health 2019, 16, 4765. [Google Scholar] [CrossRef] [PubMed] [Green Version]
- Wang, D.; Shen, Y.; Zhao, Y.; He, W.; Liu, X.; Qian, X.; Lv, T. Integrated assessment and obstacle factor diagnosis of China’s scientific coal production capacity based on the PSR sustainability framework. Resour. Policy 2020, 68, 101794. [Google Scholar] [CrossRef]
- Li, F.; Jiang, H. Study on the Environmental Risk Assessment of the Yangtze River Economic Zone. Resour. Environ. Yangtze Basin 2018, 027, 939–948. [Google Scholar]
Figure 1.
Geographic location of the Yangtze River Economic Belt (YREB) in China.

Figure 2.
Spatiotemporal variations of water-related environmental risks of cities in the YREB during 2005–2015. (a) Risk source hazard; (b) control mechanism effectiveness; (c) risk receptor’s vulnerability; (d) comprehensive water-related environmental risk.
Figure 2.
Spatiotemporal variations of water-related environmental risks of cities in the YREB during 2005–2015. (a) Risk source hazard; (b) control mechanism effectiveness; (c) risk receptor’s vulnerability; (d) comprehensive water-related environmental risk.

Figure 3.
Changes in water-related environmental risk of cities in the YREB from 2005 to 2015.

Figure 4.
Frequency statistics of water-related environmental risk in the YREB from 2005 to 2015.


Table 1.
Index system of water-related environmental risk assessment of cities in the YREB.
| System Layer | Criterion Layer | Code | Index Layer | Code | Attribute | Units | Function |
|---|---|---|---|---|---|---|---|
| Risk source hazard | Industrial source | B1 | Density of industrial enterprises | C1 | − | pcs/km2 | Reflects industrial strength |
| Industrial wastewater discharge | C2 | − | 10,000 tons/km2 | Reflects the potential hazards of industrial wastewater | |||
| Agricultural source | B2 | Amount of chemical fertilizers used per unit area | C3 | − | 10,000 tons/km2 | Reflects the pollution caused by agricultural production to the water environment | |
| Effectiveness of control mechanisms | Source control | B3 | Centralized treatment rate of sewage treatment plant | C4 | + | % | Reflects the control effect of sewage |
| Non-harmful treatment rate of domestic garbage | C5 | + | % | Reflects the ability to control garbage pollution | |||
| Comprehensive utilization rate of industrial solid waste | C6 | + | % | Reflects the treatment of industrial solid waste | |||
| Risk receptor’s vulnerability | Sensitivity | B4 | Green coverage rate in built-up area | C7 | + | % | Reflects the range of ecologically sensitive areas in the region |
| Industrial structure height | C8 | + | % | Reflects the sensitivity of industrial structure | |||
| Population density | C9 | − | Person/km2 | Reflects the density of human society | |||
| Industrial scale | C10 | − | Ten thousand yuan | Reflects the results of the overall business activities of the three industries in the region | |||
| Industrial structure optimization | C11 | + | % | Reflects changes in the industrial structure | |||
| Resilience | B5 | GDP per capita | C12 | + | Ten thousand yuan/person | Reflects overall regional economic condition | |
| Number of beds per thousand people | C13 | + | Number/thousand people | Reflects regional medical and health level | |||
| Technological progress | C14 | + | CNY/person | Reflects the comprehensive level of production technology, operational management, and employee skills of all enterprises in the region |
Table 2.
Index weights for water-related environmental risk assessment of cities in the YREB.
| Year | 2005 | 2010 | 2015 | Average Weight | |
|---|---|---|---|---|---|
| Indicators | |||||
| Industrial enterprise density | 0.007 | 0.018 | 0.036 | 0.020 | |
| Industrial wastewater discharge | 0.013 | 0.022 | 0.029 | 0.021 | |
| The usage of fertilizers per unit area | 0.022 | 0.035 | 0.027 | 0.028 | |
| Population density | 0.010 | 0.013 | 0.015 | 0.012 | |
| Industrial scale | 0.006 | 0.010 | 0.015 | 0.010 | |
| Centralized treatment rate of sewage treatment plant | 0.177 | 0.052 | 0.021 | 0.083 | |
| Harmless treatment rate of domestic waste | 0.183 | 0.090 | 0.030 | 0.101 | |
| Comprehensive utilization rate of industrial solid waste | 0.050 | 0.022 | 0.047 | 0.040 | |
| Green cover rate of built-up area | 0.040 | 0.049 | 0.077 | 0.055 | |
| Industrial structure height | 0.079 | 0.118 | 0.151 | 0.116 | |
| Industrial structure optimization | 0.058 | 0.101 | 0.116 | 0.092 | |
| GDP per capita | 0.197 | 0.219 | 0.215 | 0.210 | |
| Number of beds per thousand people | 0.105 | 0.141 | 0.157 | 0.134 | |
| Skill improved | 0.052 | 0.109 | 0.066 | 0.076 | |
Table 3.
Top five index layer obstacle factors on water-related environmental risk assessment in different risk level areas of the YREB from 2005 to 2015.
Table 3.
Top five index layer obstacle factors on water-related environmental risk assessment in different risk level areas of the YREB from 2005 to 2015.
| Risk Levels | Obstacle Factors in 2005 | Obstacle Factors in 2010 | Obstacle Factors in 2015 | ||||||||||||
|---|---|---|---|---|---|---|---|---|---|---|---|---|---|---|---|
| 1 | 2 | 3 | 4 | 5 | 1 | 2 | 3 | 4 | 5 | 1 | 2 | 3 | 4 | 5 | |
| Low risk | C12 | C13 | C8 | C11 | C14 | C12 | C13 | C8 | C14 | C11 | C12 | C8 | C13 | C11 | C14 |
| Medium-low risk | C12 | C13 | C8 | C4 | C5 | C12 | C13 | C8 | C14 | C11 | C12 | C8 | C13 | C11 | C14 |
| Medium risk | C12 | C13 | C8 | C4 | C14 | C12 | C13 | C8 | C14 | C11 | C12 | C8 | C13 | C11 | C14 |
| Medium-high risk | C12 | C13 | C8 | C4 | C11 | C12 | C8 | C13 | C14 | C11 | C8 | C12 | C13 | C11 | C14 |
| High risk | C12 | C8 | C13 | C4 | C11 | C8 | C12 | C14 | C13 | C11 | C8 | C11 | C12 | C13 | C7 |
Table 4.
Top three index layer obstacle factors on water-related environmental risk assessment in provinces of the YREB from 2005 to 2015.
Table 4.
Top three index layer obstacle factors on water-related environmental risk assessment in provinces of the YREB from 2005 to 2015.
| Provinces | Obstacle Factors in 2005 | Obstacle Factors in 2010 | Obstacle Factors in 2015 | ||||||
|---|---|---|---|---|---|---|---|---|---|
| 1 | 2 | 3 | 1 | 2 | 3 | 1 | 2 | 3 | |
| Shanghai | C5 | C8 | C12 | C8 | C14 | C12 | C12 | C8 | C14 |
| Jiangsu | C8 | C12 | C13 | C8 | C12 | C13 | C8 | C13 | C12 |
| Zhejiang | C12 | C13 | C8 | C12 | C8 | C13 | C8 | C12 | C13 |
| Anhui | C12 | C13 | C4 | C12 | C8 | C13 | C12 | C8 | C13 |
| Jiangxi | C12 | C13 | C8 | C12 | C13 | C8 | C12 | C8 | C13 |
| Hubei | C12 | C13 | C4 | C12 | C13 | C8 | C12 | C8 | C13 |
| Hunan | C12 | C13 | C4 | C12 | C13 | C8 | C12 | C8 | C13 |
| Chongqing | C12 | C13 | C8 | C12 | C13 | C8 | C12 | C8 | C13 |
| Sichuan | C12 | C13 | C5 | C12 | C8 | C8 | C12 | C8 | C11 |
| Guizhou | C12 | C13 | C8 | C12 | C13 | C14 | C12 | C8 | C13 |
| Yunnan | C12 | C13 | C8 | C12 | C13 | C14 | C12 | C8 | C13 |
Table 5.
Top five criterion layer obstacle factors on water-related environmental risk assessment in the YREB from 2005 to 2015.
Table 5.
Top five criterion layer obstacle factors on water-related environmental risk assessment in the YREB from 2005 to 2015.
| Risk Level | 2005 | 2010 | 2015 | ||||||||||||
|---|---|---|---|---|---|---|---|---|---|---|---|---|---|---|---|
| B1 | B2 | B3 | B4 | B5 | B1 | B2 | B3 | B4 | B5 | B1 | B2 | B3 | B4 | B5 | |
| Low risk | 0.002 | 0.013 | 3.19 | 5.54 | 13.27 | 0.004 | 0.023 | 0.43 | 5.00 | 9.54 | 0.006 | 0.005 | 0.067 | 4.48 | 6.45 |
| Medium-low risk | 0.004 | 0.022 | 6.06 | 5.53 | 15.39 | 0.011 | 0.050 | 0.74 | 10.69 | 20.51 | 0.041 | 0.024 | 0.13 | 16.39 | 22.42 |
| Medium risk | 0.004 | 0.019 | 4.36 | 4.42 | 12.20 | 0.016 | 0.051 | 0.44 | 11.31 | 21.18 | 0.053 | 0.026 | 0.13 | 16.32 | 19.47 |
| Medium-high risk | 0.008 | 0.024 | 2.92 | 5.08 | 11.98 | 0.039 | 0.031 | 0.26 | 7.28 | 10.40 | 0.076 | 0.012 | 0.034 | 6.94 | 7.94 |
| High risk | 0.030 | 0.024 | 3.18 | 5.99 | 9.78 | 0.060 | 0.021 | 0.16 | 4.98 | 4.78 | 0.12 | 0.005 | 0.024 | 5.17 | 2.69 |
Publisher’s Note: MDPI stays neutral with regard to jurisdictional claims in published maps and institutional affiliations. |
© 2021 by the authors. Licensee MDPI, Basel, Switzerland. This article is an open access article distributed under the terms and conditions of the Creative Commons Attribution (CC BY) license (https://creativecommons.org/licenses/by/4.0/).
Share and Cite
MDPI and ACS Style
Cui, X.; Wu, J.; Li, Z.; Peng, L.; Shen, Z.; Bi, J. An Integrated Assessment and Factor Analysis of Water Related Environmental Risk to Cities in the Yangtze River Economic Belt. Water 2021, 13, 2140. https://doi.org/10.3390/w13162140
AMA Style
Cui X, Wu J, Li Z, Peng L, Shen Z, Bi J. An Integrated Assessment and Factor Analysis of Water Related Environmental Risk to Cities in the Yangtze River Economic Belt. Water. 2021; 13(16):2140. https://doi.org/10.3390/w13162140
Chicago/Turabian StyleCui, Xiaolin, Jia Wu, Zhihui Li, Lu Peng, Zhan Shen, and Jia Bi. 2021. "An Integrated Assessment and Factor Analysis of Water Related Environmental Risk to Cities in the Yangtze River Economic Belt" Water 13, no. 16: 2140. https://doi.org/10.3390/w13162140
Note that from the first issue of 2016, this journal uses article numbers instead of page numbers. See further details here.