
Experimental Validation of a Solar Powered Multistage Flash Desalination Unit with Alternate Storage Tanks


Department of Mechanical Engineering, College of Engineering, Taif University, P.O. Box 11099, Taif 21944, Saudi Arabia
Water 2021, 13(16), 2143; https://doi.org/10.3390/w13162143
Submission received: 29 June 2021
/
Revised: 27 July 2021
/
Accepted: 31 July 2021
/
Published: 4 August 2021
(This article belongs to the Section Wastewater Treatment and Reuse)
Abstract
:The fossil fuels that power conventional desalination systems cause substantial environmental impact. Solar desalination can satisfy critical water needs with only a minimal contribution to global warming. The current work presents an attractive new design suitable for regions with limited water resources and high solar radiation rates. This work is an experimental study of a newly designed, solar-powered, multi-stage flash (MSF) desalination plant. The design could address the need to increase the limited water resources in solar energy-rich areas. The prototype consists of a solar collector, an MSF unit, and a novel dual thermal storage tank design. In this prototype, preheated brine is directly heated by circulation through the solar collector. Two tanks serve the MSF unit; one tank feeds the MSF unit while the other receives the preheated feed water. The two tanks alternate roles every 24 h. The study was conducted in Taif, Saudi Arabia, throughout the month of September 2020. The results of the experiment showed that 1.92 square meters of solar collector area is needed for an average daily production of 19.7 kg of fresh water, at a cost of approximately $0.015 per liter.
1. Introduction
Resource shortages for both energy and water production are expected to be a crucial challenge in the coming decades. Some countries suffer from a lack of water resources due to pollution, while others endure dry weather conditions. In addition, the exponential increase in the world population drives the demand for fresh water. According to the United Nations (UN), the world population was 2.6 billion in 1950. In 1987, it had doubled to 5 billion, followed by an estimated 7.7 billion in 2020. The available data predicts further rapid exponential growth in the global population, with an expected increase to 9.7 billion by 2050 [1]. The basic human right of consuming fresh water is threatened, as almost 30% of the world’s population lacks access to fresh drinking water [2]. Consequently, there is an urgent need for the desalination of salt water to meet the global demand for fresh water. Today’s enormous desalination plants require a high energy consumption to supply fresh water to satisfy daily needs, which cannot be met by the available groundwater. Currently, an estimated 15,906 desalination plants operate in over 177 countries around the world [3], mostly in the Middle East, with a total capacity of more than 95 million cubic meters/day. A subset of 4826 of these plants supply more than 47% of the global production of fresh water to populations in need. The high energy consumption of today’s enormous desalination plants cannot be met in many locales due to high energy costs or scarcity of affordable energy. Additionally, the high energy consumption of traditional desalination plants contributes heavily to global warming, which has the effect of exacerbating the current water shortages and is not sustainable in the long term, emphasizing the need to consider alternative approaches. Satisfying the fresh water needs of growing populations will be possible if non-renewable energy sources are replaced with renewable, environmentally friendly systems.
Desalination processes are generally divided into two types: thermal and membrane desalination. Each type can be further subdivided. For instance, thermal processes can be classified as multi-effect boiling (MEB), multistage flash (MSF), or vapor compression (VC). Membrane processes are divided into the reverse osmosis (RO) and electro dialysis (ED). Furthermore, based on energy supply sources, the desalination processes can be classified into four main categories: thermal, mechanical, electrical, and chemical energies. According to Stewart, 28% of the world’s desalination is performed using thermal process desalination, while membrane process accounts for 72% [4].
In terms of energy consumption, the thermal desalination of seawater is considered to be an energy-intensive process [3]. In a thermal process, the distillation of seawater is attained by using a thermal energy source. Thermal energy may be obtained from nuclear energy, fossil fuel, or a free non-conventional source such as solar thermal energy, geothermal energy, and other energy efficient techniques. Currently, renewable energy only powers about 0.02% of the desalination market [5].
The MSF desalination process is employed by about 21% of the world’s total installed or contracted desalination systems [4]. The MSF process has been improved dramatically in its capacity and thermal performance, and it is used in areas where the fuel is available at a reasonable price. The reason for the popularity of MSF processes is their capacity for high plant availability. They tolerate seawater salinity and are highly reliable. The major disadvantage of MSF is that the process is highly energy-intensive [6]. The total specific energy requirement for MSF has been reported to be as high as 20–28 kWh/m3 [7]. With of all these factors in play, it would seem that the best solution to water shortage issues in the long and short terms lies in the MSF desalination of sea water being integrated with renewable energy sources. The use of solar energy in desalination is one of the most promising applications of renewable energy sources. Solar energy occupies nearly 57% of the renewable energy-based desalination market [8].
There are many schemes of solar integrated MSF systems worldwide. Some of them only use daylight hours, while others have thermal storage and control systems for the continuous production of desalinated water. Rates of desalinated water production based on solar collector areas vary from 10 to 60 L/m2/day [9]. According to recent literature reviews, considerable research has been done to study solar desalination systems using the MSF principle. The following is a summary of some studies:
In 1979, Manjarrez carried out a project to prove the feasibility of solar energy as a source of the energy required in the MSF process [10].
In 1979, Ibarra presented a project on solar desalination. The project consisted of three parts: MSF desalination system, solar energy flat collectors, and a system to store energy and run the unit continuously. The project was developed to provide the MSF unit with solar energy by increasing the temperature of a medium fluid, instead of the steam system that is usually used as a thermal energy source [11].
In 1980, Rajvanshi designed an MSF desalination system that uses solar energy. The scheme was designed to produce about 5.25 × 10 m3/yr with 11.52 km2 located in the Thar Desert of India as the collector area [12].
In 1985, Moustafa proposed a solar multistage flash desalination system consisting of a solar line-concentrating collector field with a total area of 4700 m2, a thermal storage tank, and a 12-stage multistage flash desalination subsystem to produce about 300 L/h. The function of the thermal storage subsystem was to supply heat during periods of low radiation and during nighttime [13].
In 1997, Farwati examined a solar multistage flash desalination system consisting of collectors, a storage tank, a heat exchanger, and a multistage flash desalination to produce about 13.1 m3 of distilled water. The function of the heat exchanger was to pass the thermal energy from the medium fluid to brine [14].
In 2001, Lu H et al. presented an MSF system coupled with salinity-gradient solar ponds. The system was installed at El Paso, USA. The study focused on the technical feasibility of the system [15].
In 2014, Nafey et al. presented a small-capacity top brine temperature (TBT) MSF system. The systems consisted of a flat plate solar collector, a vertical flash unit, and a condenser unit. During the summer, the system’s daily production was 4.2 to 7 kg/day/m2 of fresh water [16].
In 2016, Al-Sehli designed a new system for a multi-stage solar water desalination unit, characterized by continuous operation with a limited solar collector area. The daily production of distilled water reached 53 kg per square meter of the solar collector area [17].
In 2018, Al-Othman et al. designed a novel solar driven MSF desalination plant in the UAE. The system consisted of parabolic trough collectors (PTC), a solar pond, a fire tube boiler, and MSF desalination. The function of the fire tube boiler was to supply heat during periods of low radiation [13]. The total area of PTCs and the solar pond were 3160 m2 and 0.53 km2, respectively. The system’s daily production was 1880 m3 of fresh water [18].
In 2020, Mendez et al. proposed a solar multistage flash (MSF) desalination unit integrated with a solar chimney. The goal of this system was the dual production of electricity and water. The system consisting of a solar chimney, a hydro-storage system, a water turbine, and a thermal desalination unit. The system produces about 8.3 kg/s of fresh water [19].
Previous work shows that the major disadvantage of solar desalination is limited freshwater production. Desalination cannot compete with a conventional MSF desalination process in terms of capacity. While some solar designs operate only during the daytime because they have no energy storage system, other designs use energy storage systems but need a huge area of solar collectors to increase the temperature of the medium fluid up to the design value.
To overcome all the previous disadvantages, in this work MSF desalination is coupled with a solar system to provide the required thermal energy. The design has the following advantages and novel aspects, compared to previous work from the literature:
- No brine heater or heating steam needed to reach to TBT.
- The novel dual tank storage system is used to operate the desalination plant continuously and at full capacity.
- There is no medium fluid; sea water is heated and stored directly.
- Minimized area of solar field by using the circulating system in the thermal storage tank.
The description of the design, experiment setup, and the results will be discussed in the following sections.
2. Materials and Methods
2.1. Solar-Powered MSF Desalination Plant Design
A prototype solar desalination plant was built and tested for this study. The average capacity of the model in September 2020 was 19.7 kg per day per collector area of distilled water. The system has a thermal storage system capable of running the desalination plant continually for all day at full load. This design uses solar energy to directly heat the sea water then store it for later use. This means that the current system consists of two separate subsystems: the energy storage unit and the desalination unit. The energy storage is the subsystem that collects and stores the solar energy. The desalination unit is an MSF unit that has a similar conventional design divided into stages; each stage contains a preheated seawater tube, a brine flashing chamber, a demister, and a distillate collector.
In a conventional MSF, the feed water is heated in the brine heater by thermal energy obtained from fossil fuels or indirect solar energy, while in the solar MSF–thermal storage tank design, the brine heater is eliminated. Instead, the stages are connected to thermal storage tanks to provide them with hot brine.
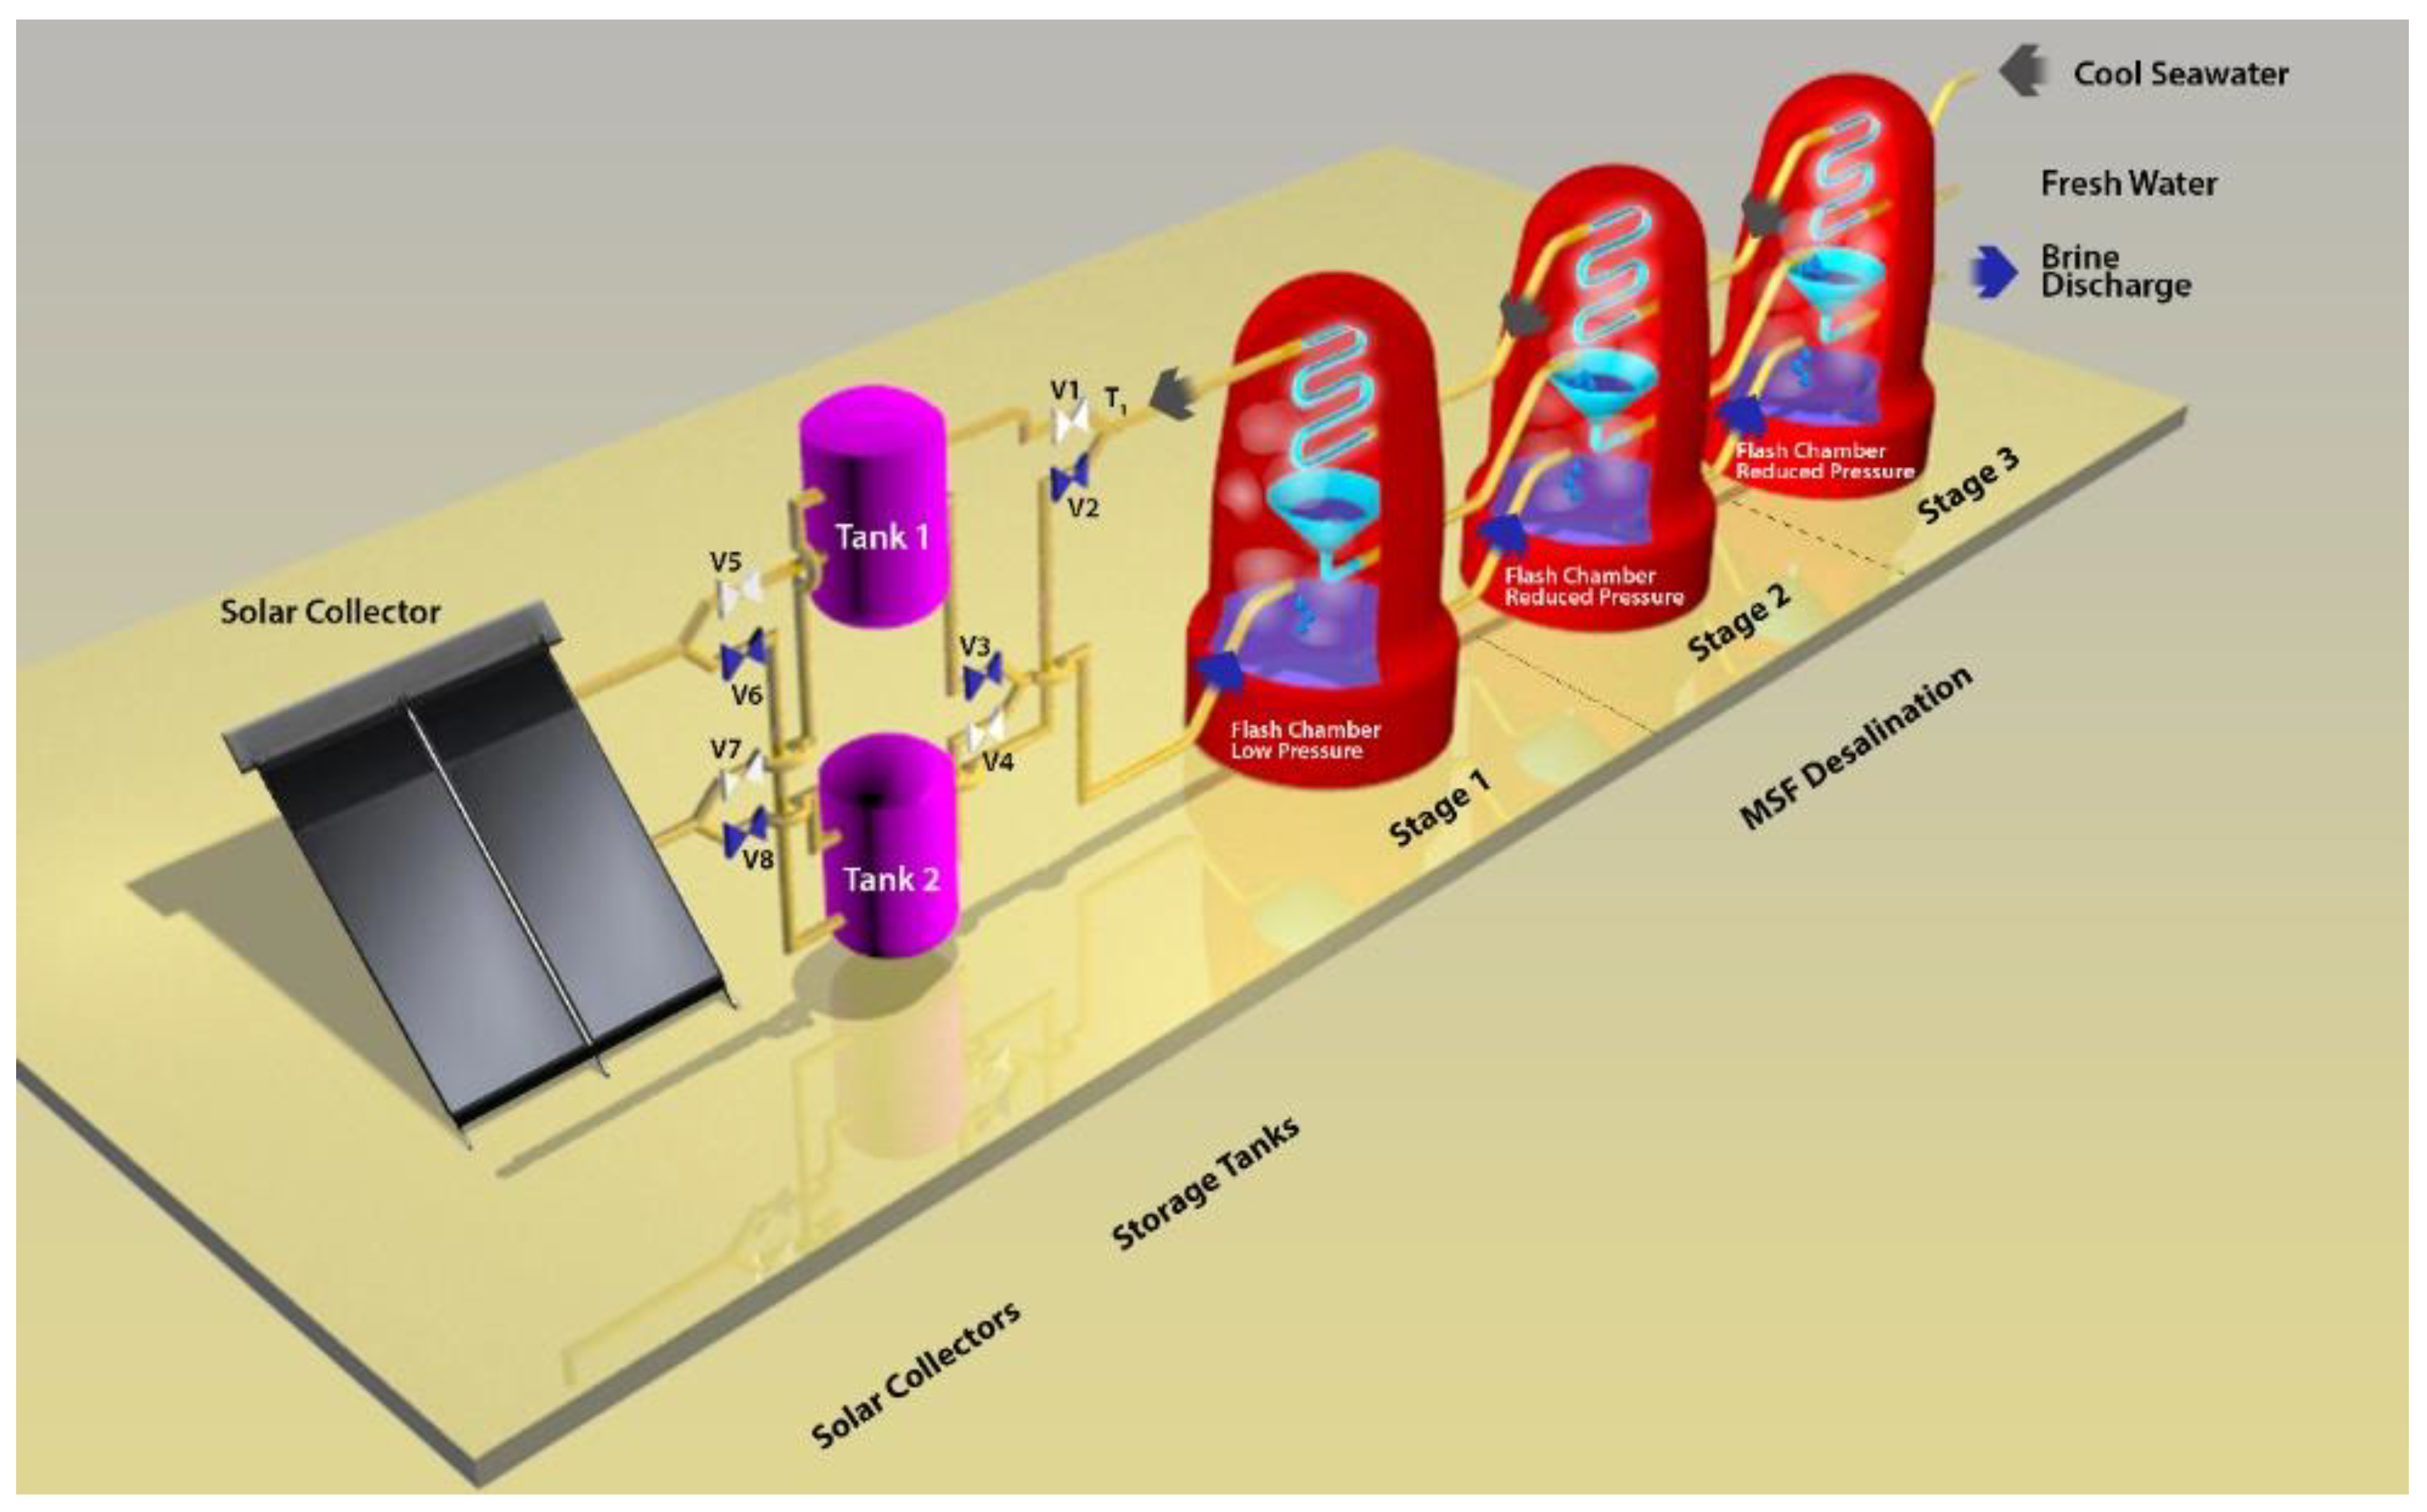
The structure of this desalination plant can be divided into three blocks: the multistage flash, the solar field, and the thermal storage tanks. The complete layout of the plant is shown in Figure 1.
The solar field consists of a flat plate collector that converts solar energy into thermal energy to be absorbed by the sea water to increase its temperature to TBT. The thermal storage system consists of two tanks to store the hot sea water. One will be in service (discharging mode) to provide the MSF unit with hot brine, while the other will be on hold (charging mode) to store the sea water and provide the MSF unit with hot brine on the next day.
In general, the complete storage cycle includes three steps: charging, storing, and discharging. On the first day, tank 1 is filled up with sea water, which is heated by circulating it through the solar collectors. The filling and heating processes for tank 1 is called charging/storing mode. Tank 2, which was filled up with hot water at TBT on the previous day, provides the desalination unit (stages) with hot brine. Feeding the stages with the hot brine is called discharging mode. The TBT is the maximum temperature that the sea water reaches; it is the temperature of the feed water leaving the brine heater in conventional desalination. Its designed value is approximately 70 °C. On the second day, the processes are switched in such a way that tank 2 is filled with sea water and simultaneously heated by circulating it through solar collectors. This way, tank 2 is in charging/storing mode and tank 1 is in discharging mode. The circulating pumps circulate the sea water (feed water) through the solar field during the daytime to absorb the solar energy, which increases the sea water temperature.
2.2. MSF Operational Process
All MSF process steps are depicted in Figure 1 and are described as follows: sea water starts from the last stage, where it enters a bundle of tubes located at the top of the stages to heat sea water up due to the latent heat from the vaporization of the flashing brine. The brine condenses around these tubes as a distillate water free of any salt. The temperature of the sea water increases gradually as it moves towards the first stage. In conventional desalination, seawater leaves the first stage and enters the brine heater to increase its temperature to TBT. In this design, the thermal storage system is the heating section, where the seawater enters the storage tank and heats up at the solar collector field. It stays there for a whole day to absorb the heat during daytime, when its temperature increases to the maximum design value, known as the top brine temperature. Simultaneously, the other tank in service provides the stages of desalination with the hot brine. The brine is pumped into the bottom of the first stage where it begins to flash progressively under vacuum along each stage. Flashed vapor condenses on the outer surface of the condenser tubes at the top of each stage, and carry the feed water inside for heating. Condensation helps to improve the heat recovery, making the unit more efficient. The distillate water, which forms the condensing vapor at the stages, is collected in a tray connecting all the stages, and then is removed at the last stage. Each stage is connected to the next via an orifice, causes the brine to flow from one stage to the next due to the vacuum. At the last stage, the high-salinity, concentrated brine is discharged. A vacuum ejector is provided to create a vacuum in the successive stages, allowing the brine to flash into steam below the boiling temperature of water. The arrangement is made to permit a gradual decrease in pressure during successive stages. Removing the non-condensable gases is another role of the vacuum ejector.
2.3. Experiment Setup
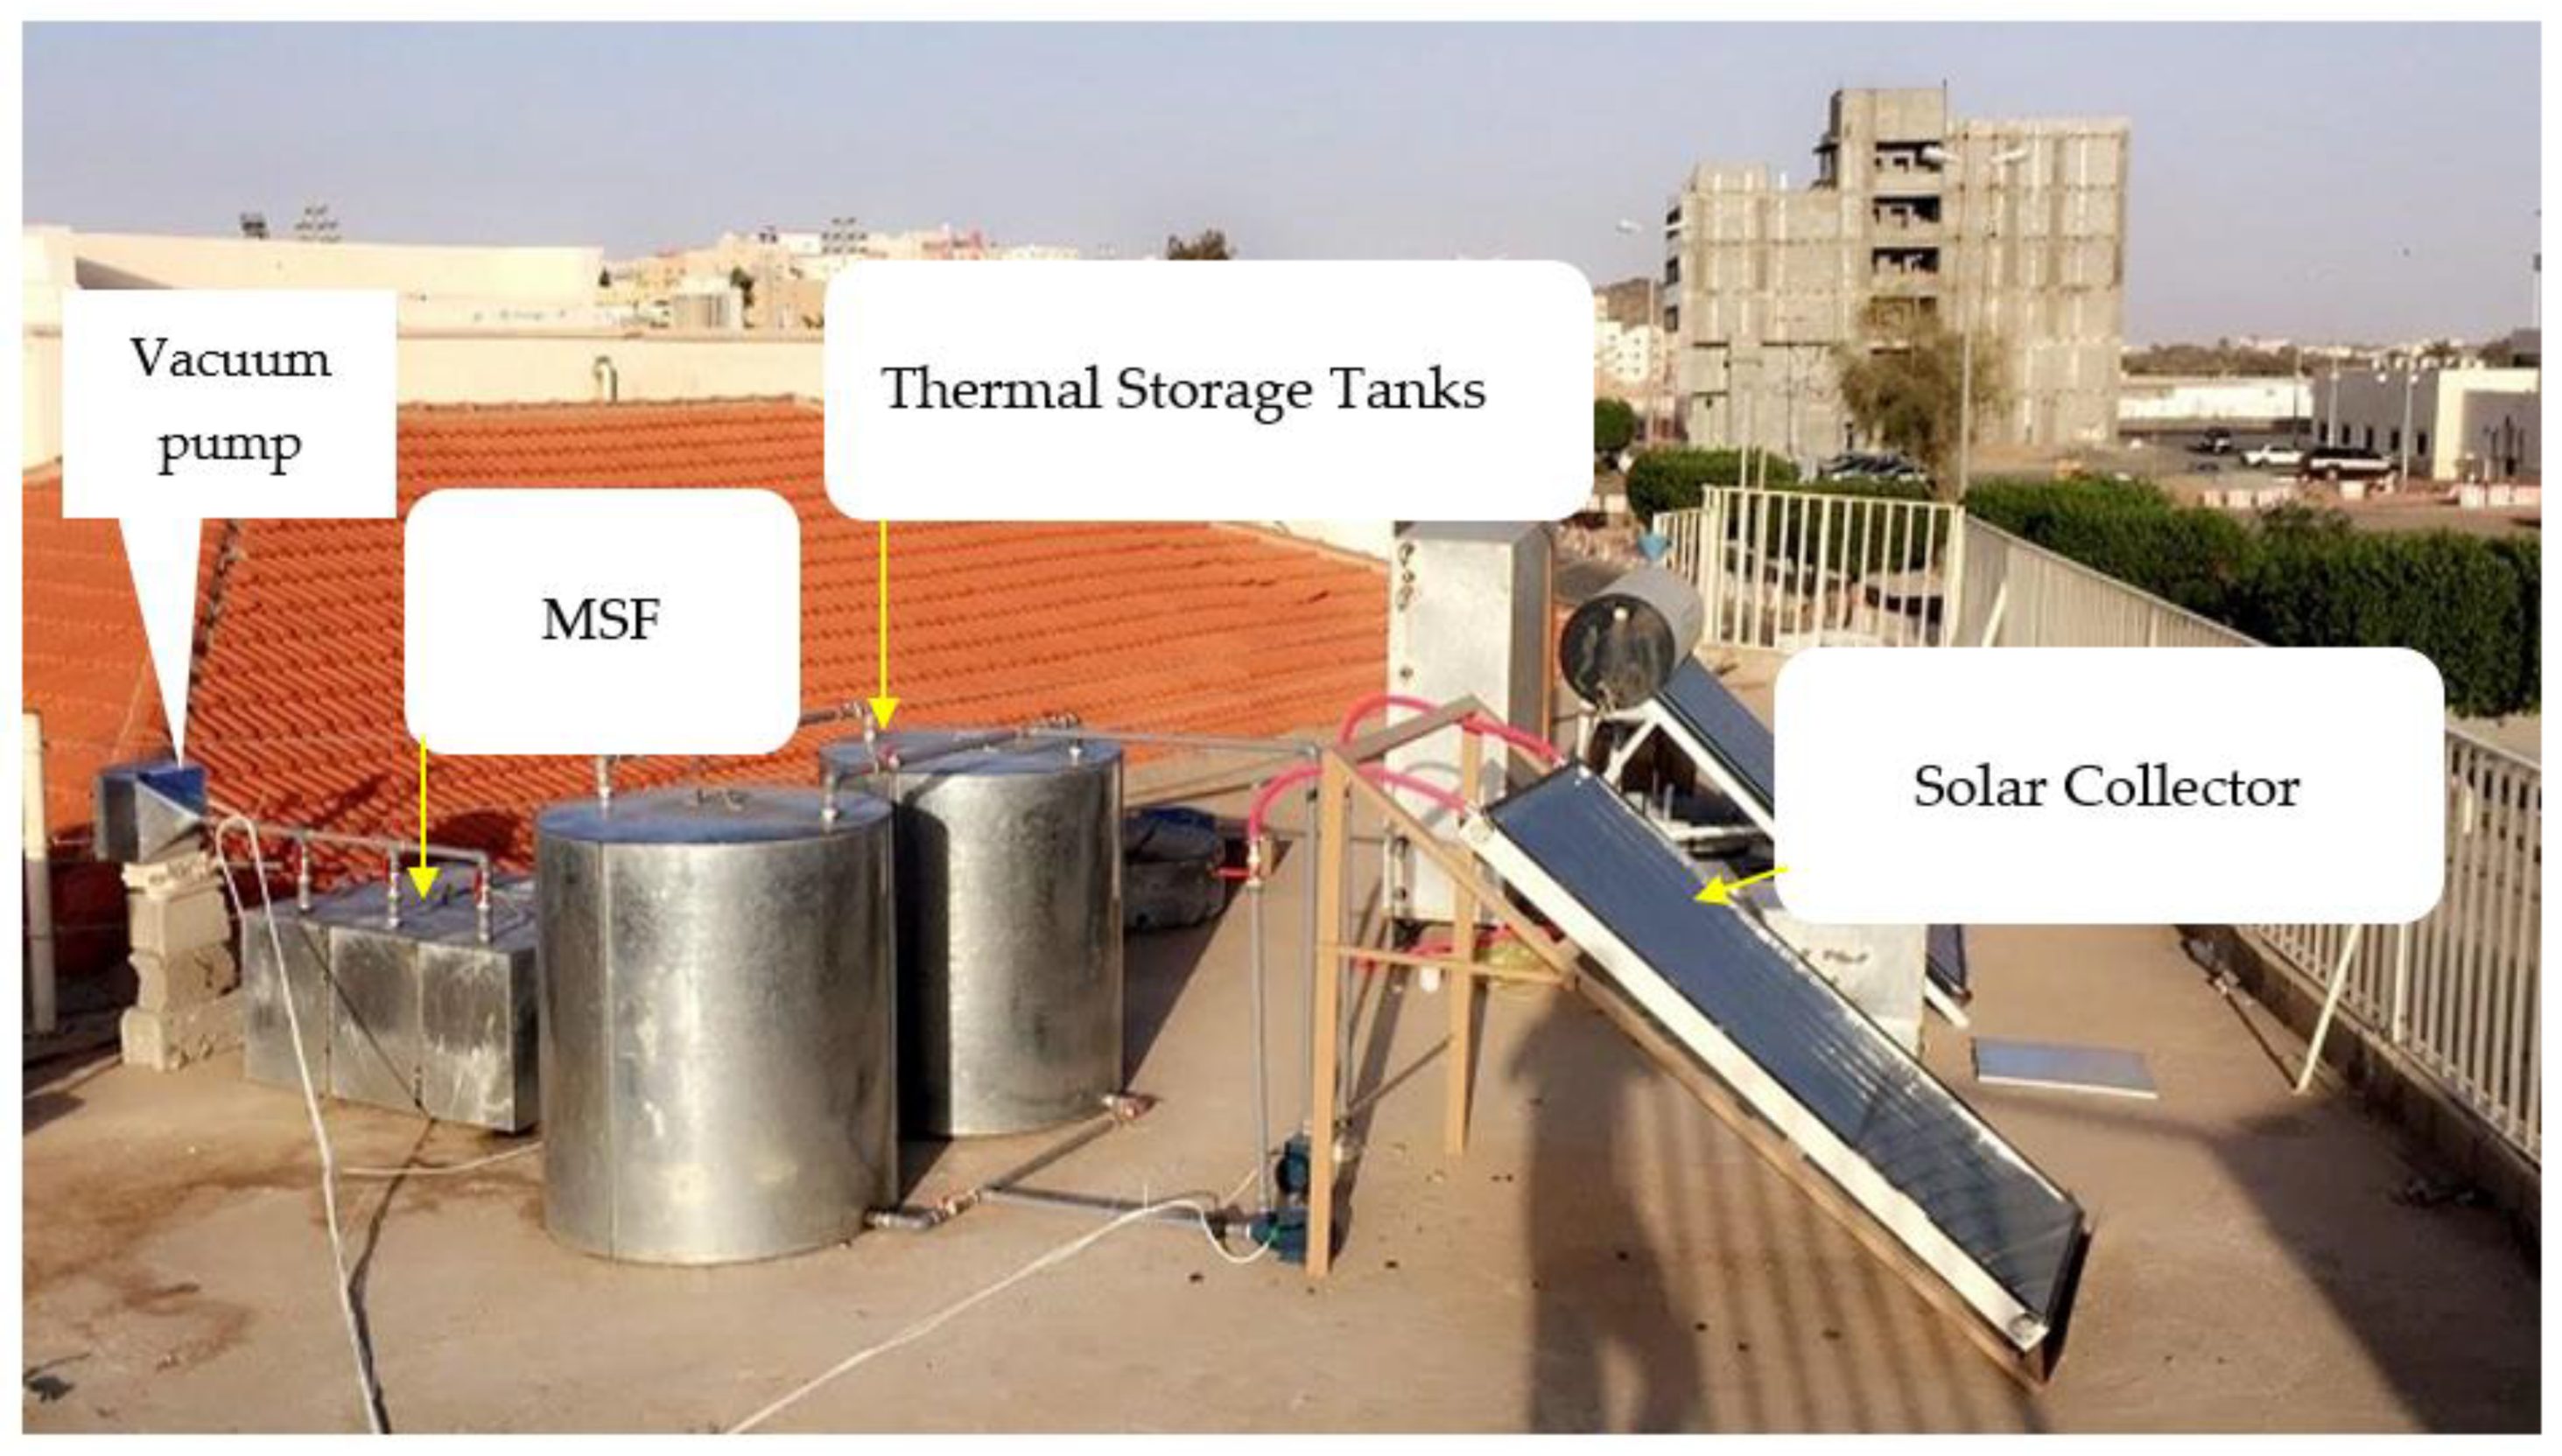
A small-scale solar powered MSF desalination was designed and built. Figure 2 is an illustration of this design, which enables the study of the solar MSF system. To understand the system mathematically, see Appendix A. The model consists of three components: a flat plate collector, storage tanks, and a multistage flash desalination unit.
The MSF chamber consists of several parts which are from top to bottom as follows: heat exchanger tubes, steam space, demister for steam purification, a tray for collecting condensed water, a small orifice at the bottom of the chamber to enable brine flow through the stages, and a brine well. The chamber is rectangular in shape, with dimensions 70 cm long, 35 cm wide, and 35 cm high. Its walls have a thickness of 2 mm, and are made from 316 L low-carbon stainless steel coated with rust-resistant paint to prevent corrosion and reduce heat loss. The system includes two tanks. The volume of each tank is 1.30 cubic meters, which is sufficient to feed the MSF unit with feed water for a whole day. A flat-plate solar collector is placed on a frame inclined at an angle of 45°. Table 1 shows the technical specifications of the solar collector.
A distillate storage tank is located next to the last stage. The distillate storage tank collects the desalinated water via tubes connecting it with the distillate tray. The different parts of the experiment are connected to the system unit by PVC tubes with 1-inch diameters.
2.4. Experimental Measurements
Four parameters were tracked and measured while the experiment was in progress: temperature, solar radiation, wind velocity, and flow rate. The different types of measurements employed are explained below.
Temperature
Lascar EL USB-TC-LCD thermocouples (Lascar Electronics Co., Ltd., Whiteparish, UK) were used to measure system temperatures with an accuracy of ±1.0 °C.
Solar Radiation
A pyranometer to measure solar radiation was placed outside the collector with calibration accuracy equal to ±10 W/m2 and short-wave sensitivity from 7 to 14 μV/Wm2.
Wind Velocity
A MagiDeal MS6252B digital anemometer with accuracy of ±3.0% was used to measure the wind speed.
Flow Rates
DIGITEN G1/’’; Flow Water Sensor Meters (Shenzhen Hui Qi Mei Technology Co., Ltd., Shenzhen, Guangdong, China) with accuracy of ±1% were used to measure the flow rate of the feedwater, brine, condensate, and blowdown.
Details of the measurement instruments include, type, reading range, and accuracy, as summarized in Table 2.
3. Results
The experiment described in this paper was performed in the western region of Saudi Arabia. This region is known for its considerable exposure to sunlight year-round, allowing the solar desalination plant to operate 24 h a day for the entirety of a year. Table 3 presents the technical specifications used for the experiment. For the purposes of the experiment, the system operated continuously during both September and December of 2020. During December 2020, the system was subjected to the lowest temperatures experienced by the region at any one time, which verified that the storage system would supply the unit with sufficient heat for the duration of the year.
Given a surface collection area of 1.92 m2, the system produced an average of 19.7 kg of distilled water per day. The average solar irradiance measured at the surface of the solar collector was 6.3 kWh/m2/day.
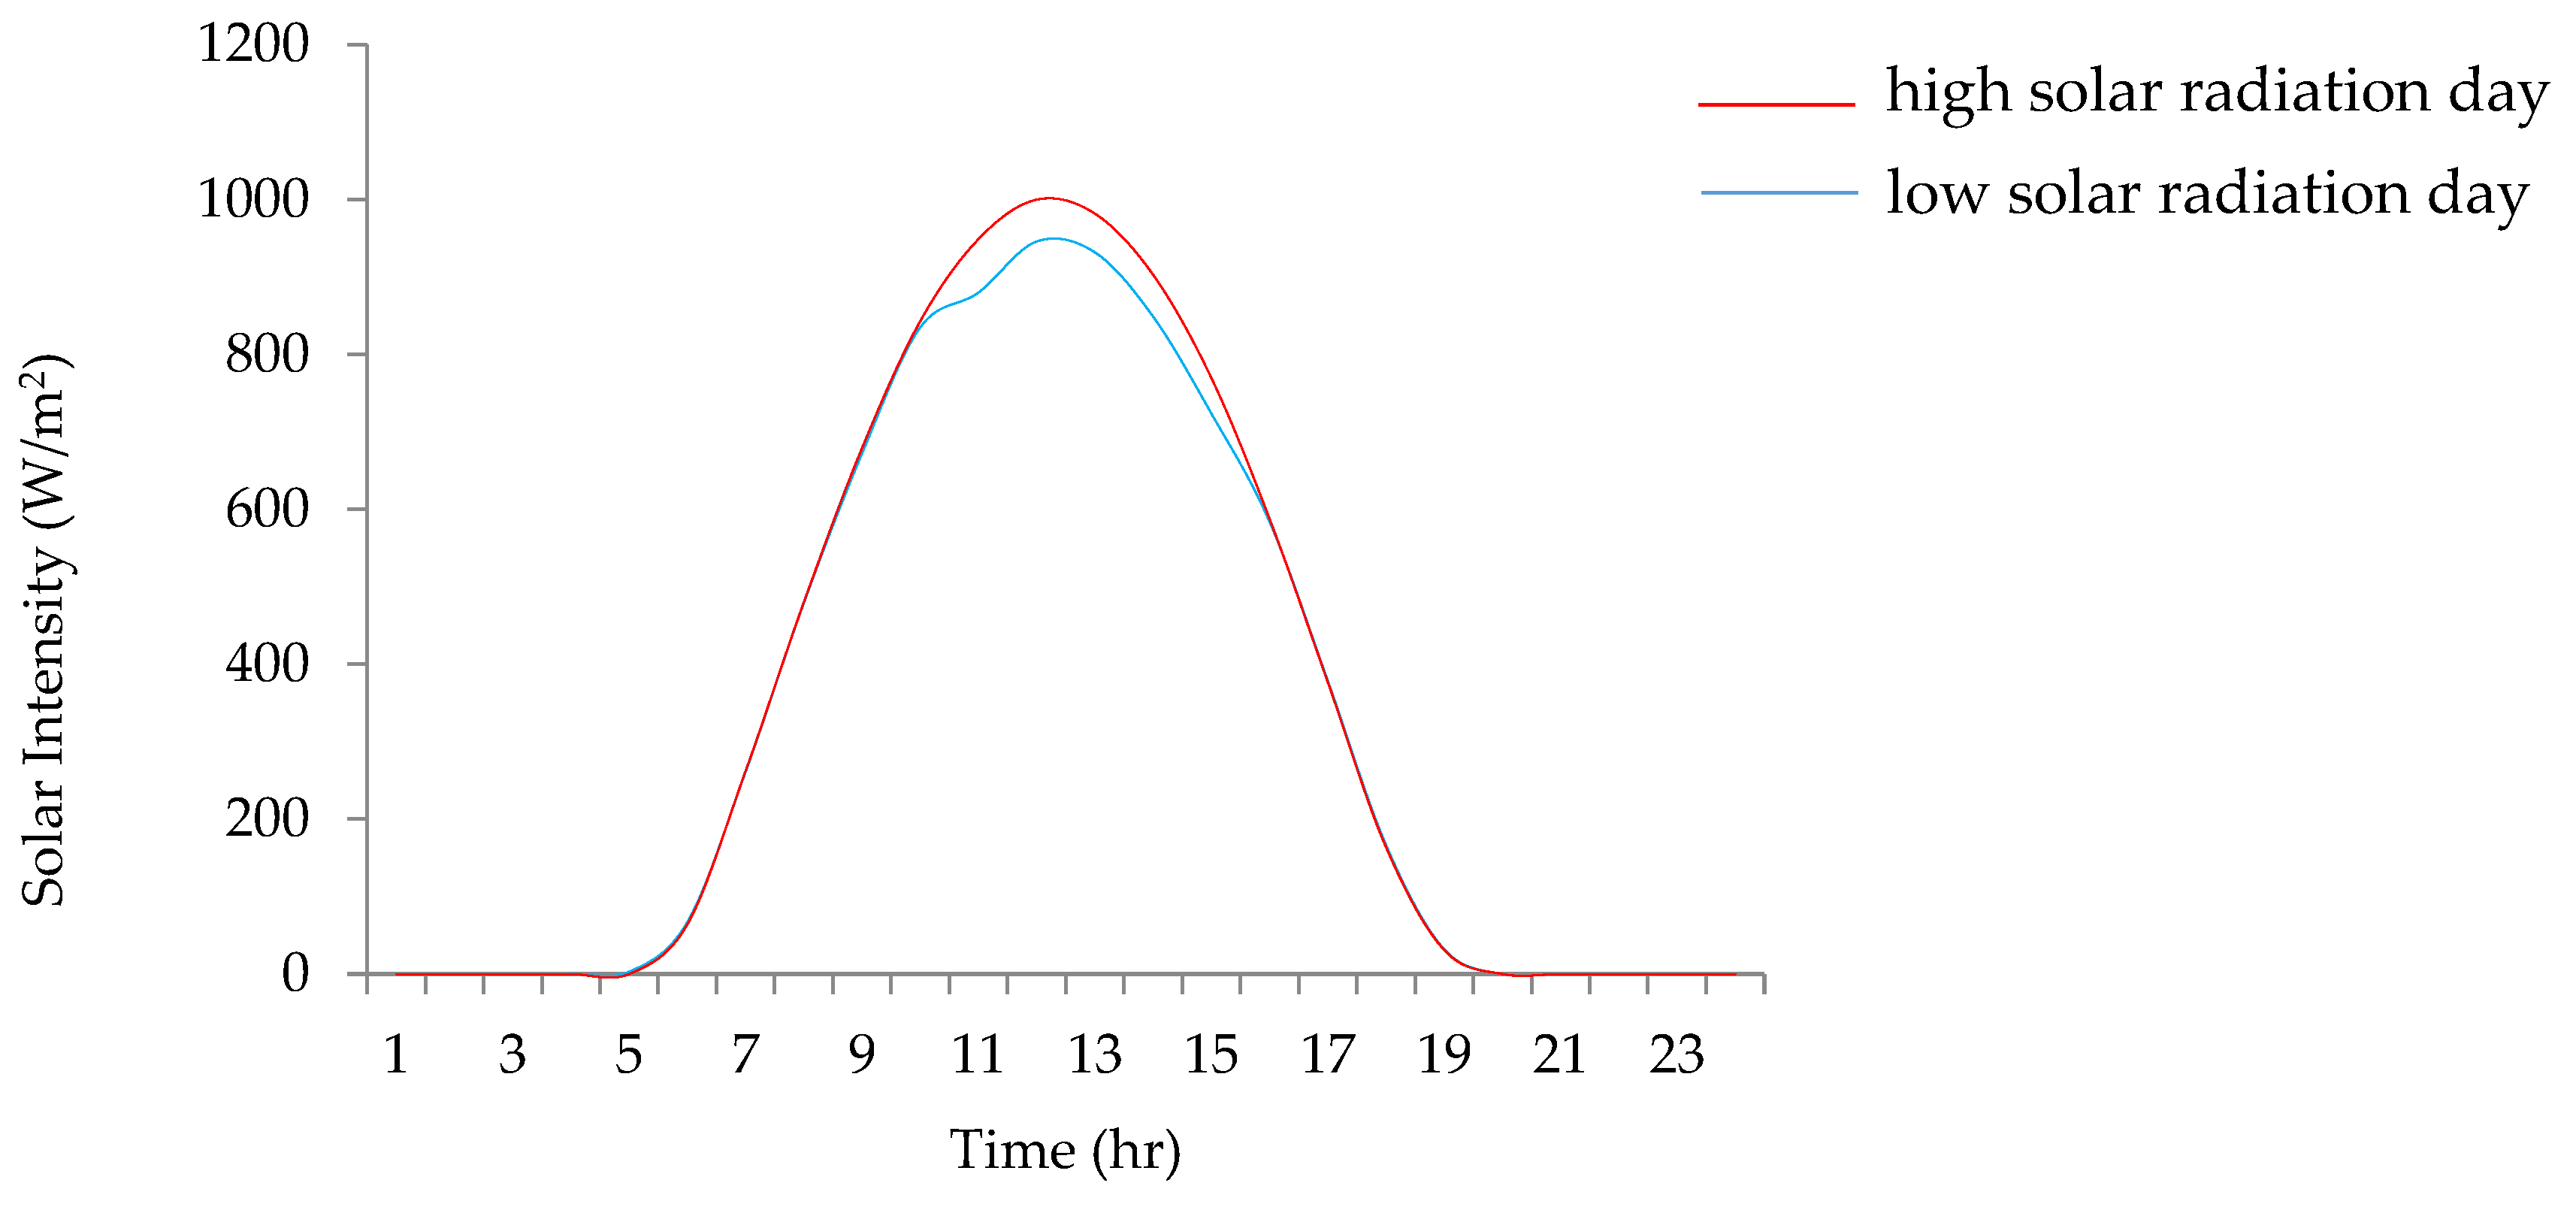
The highest value of solar field outlet temperature occurs at around 2:00 p.m. when solar radiation is at its highest value. Additionally, the duration of sunlight in a given day during the summer is greater than that of the winter, resulting in greater heat absorption during the summer season. As shown in Figure 3, the availability of solar energy in September occurs for a 12 h period between 5:00 a.m. and 5:00 p.m. The red line represents the highest solar radiation day, while the blue represents the lowest solar radiation day.
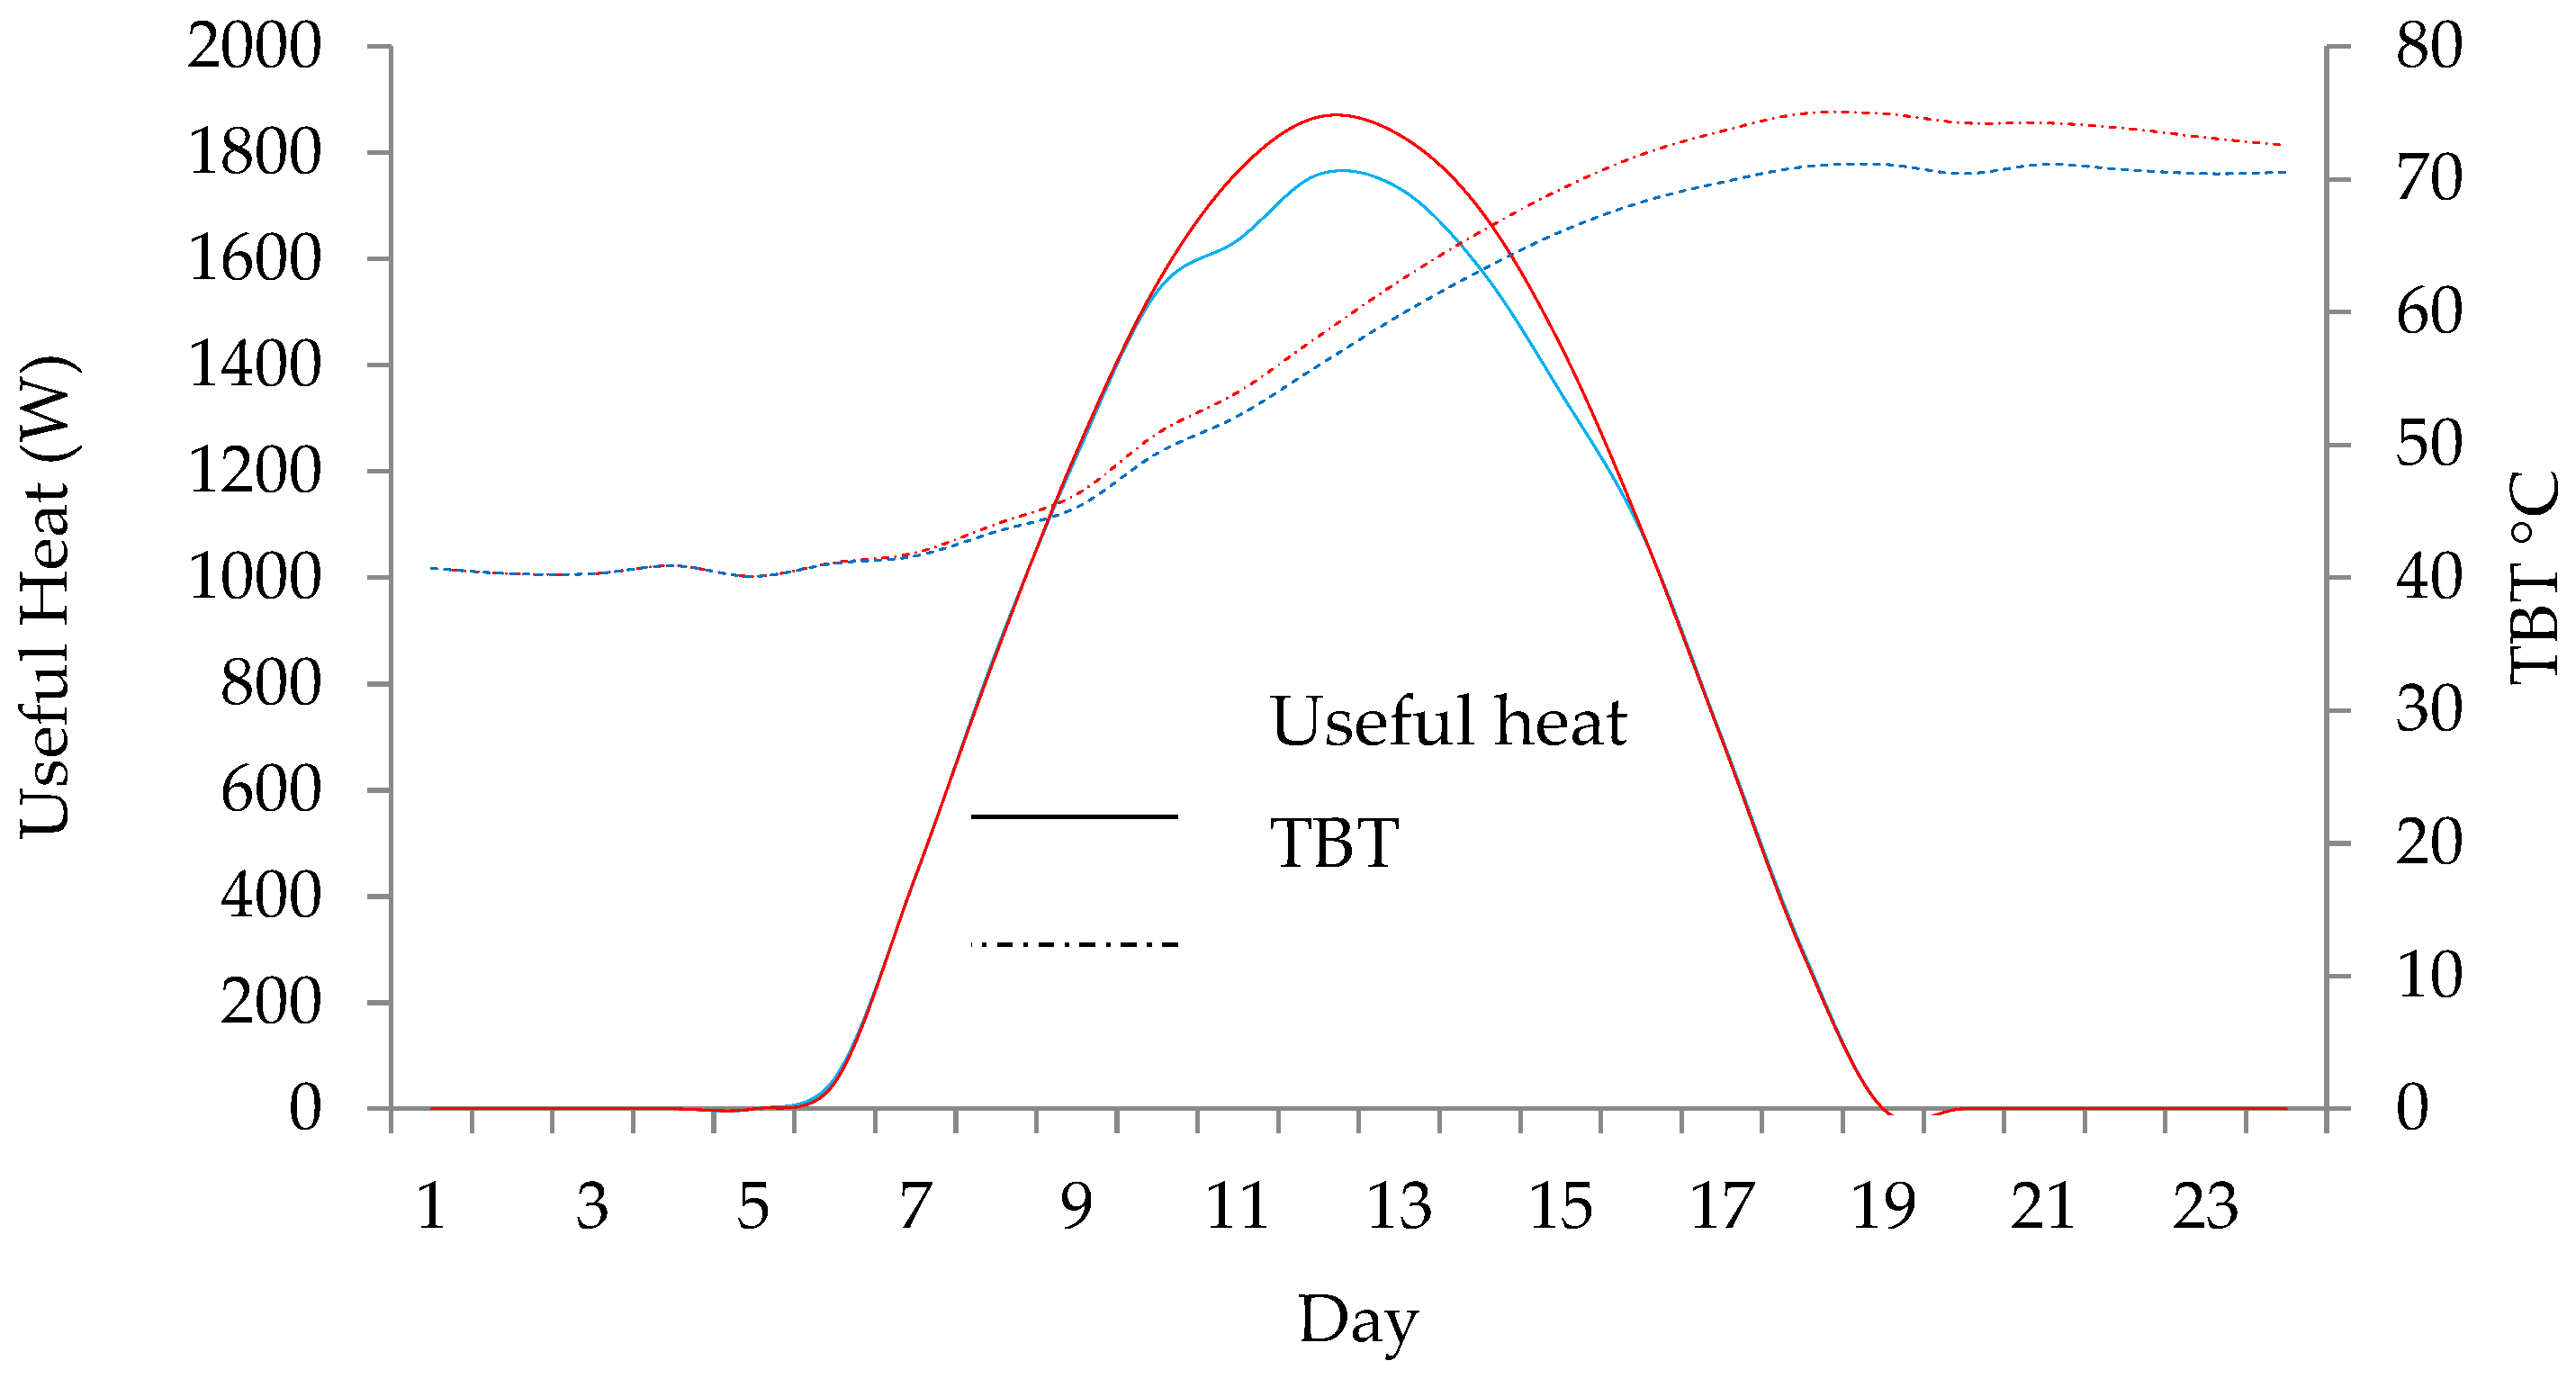
Figure 4 shows the useful hourly heat absorbed by the brine in the charging tank over two days. The red line represents the absorption during the highest solar radiation day, while the blue represents the absorption on the lowest solar radiation day. Their peaks were 1.8 kW and 1.6 kW, respectively. This comparison indicates two different weather conditions: a bright sunny summer day and a day with less sun irradiance.
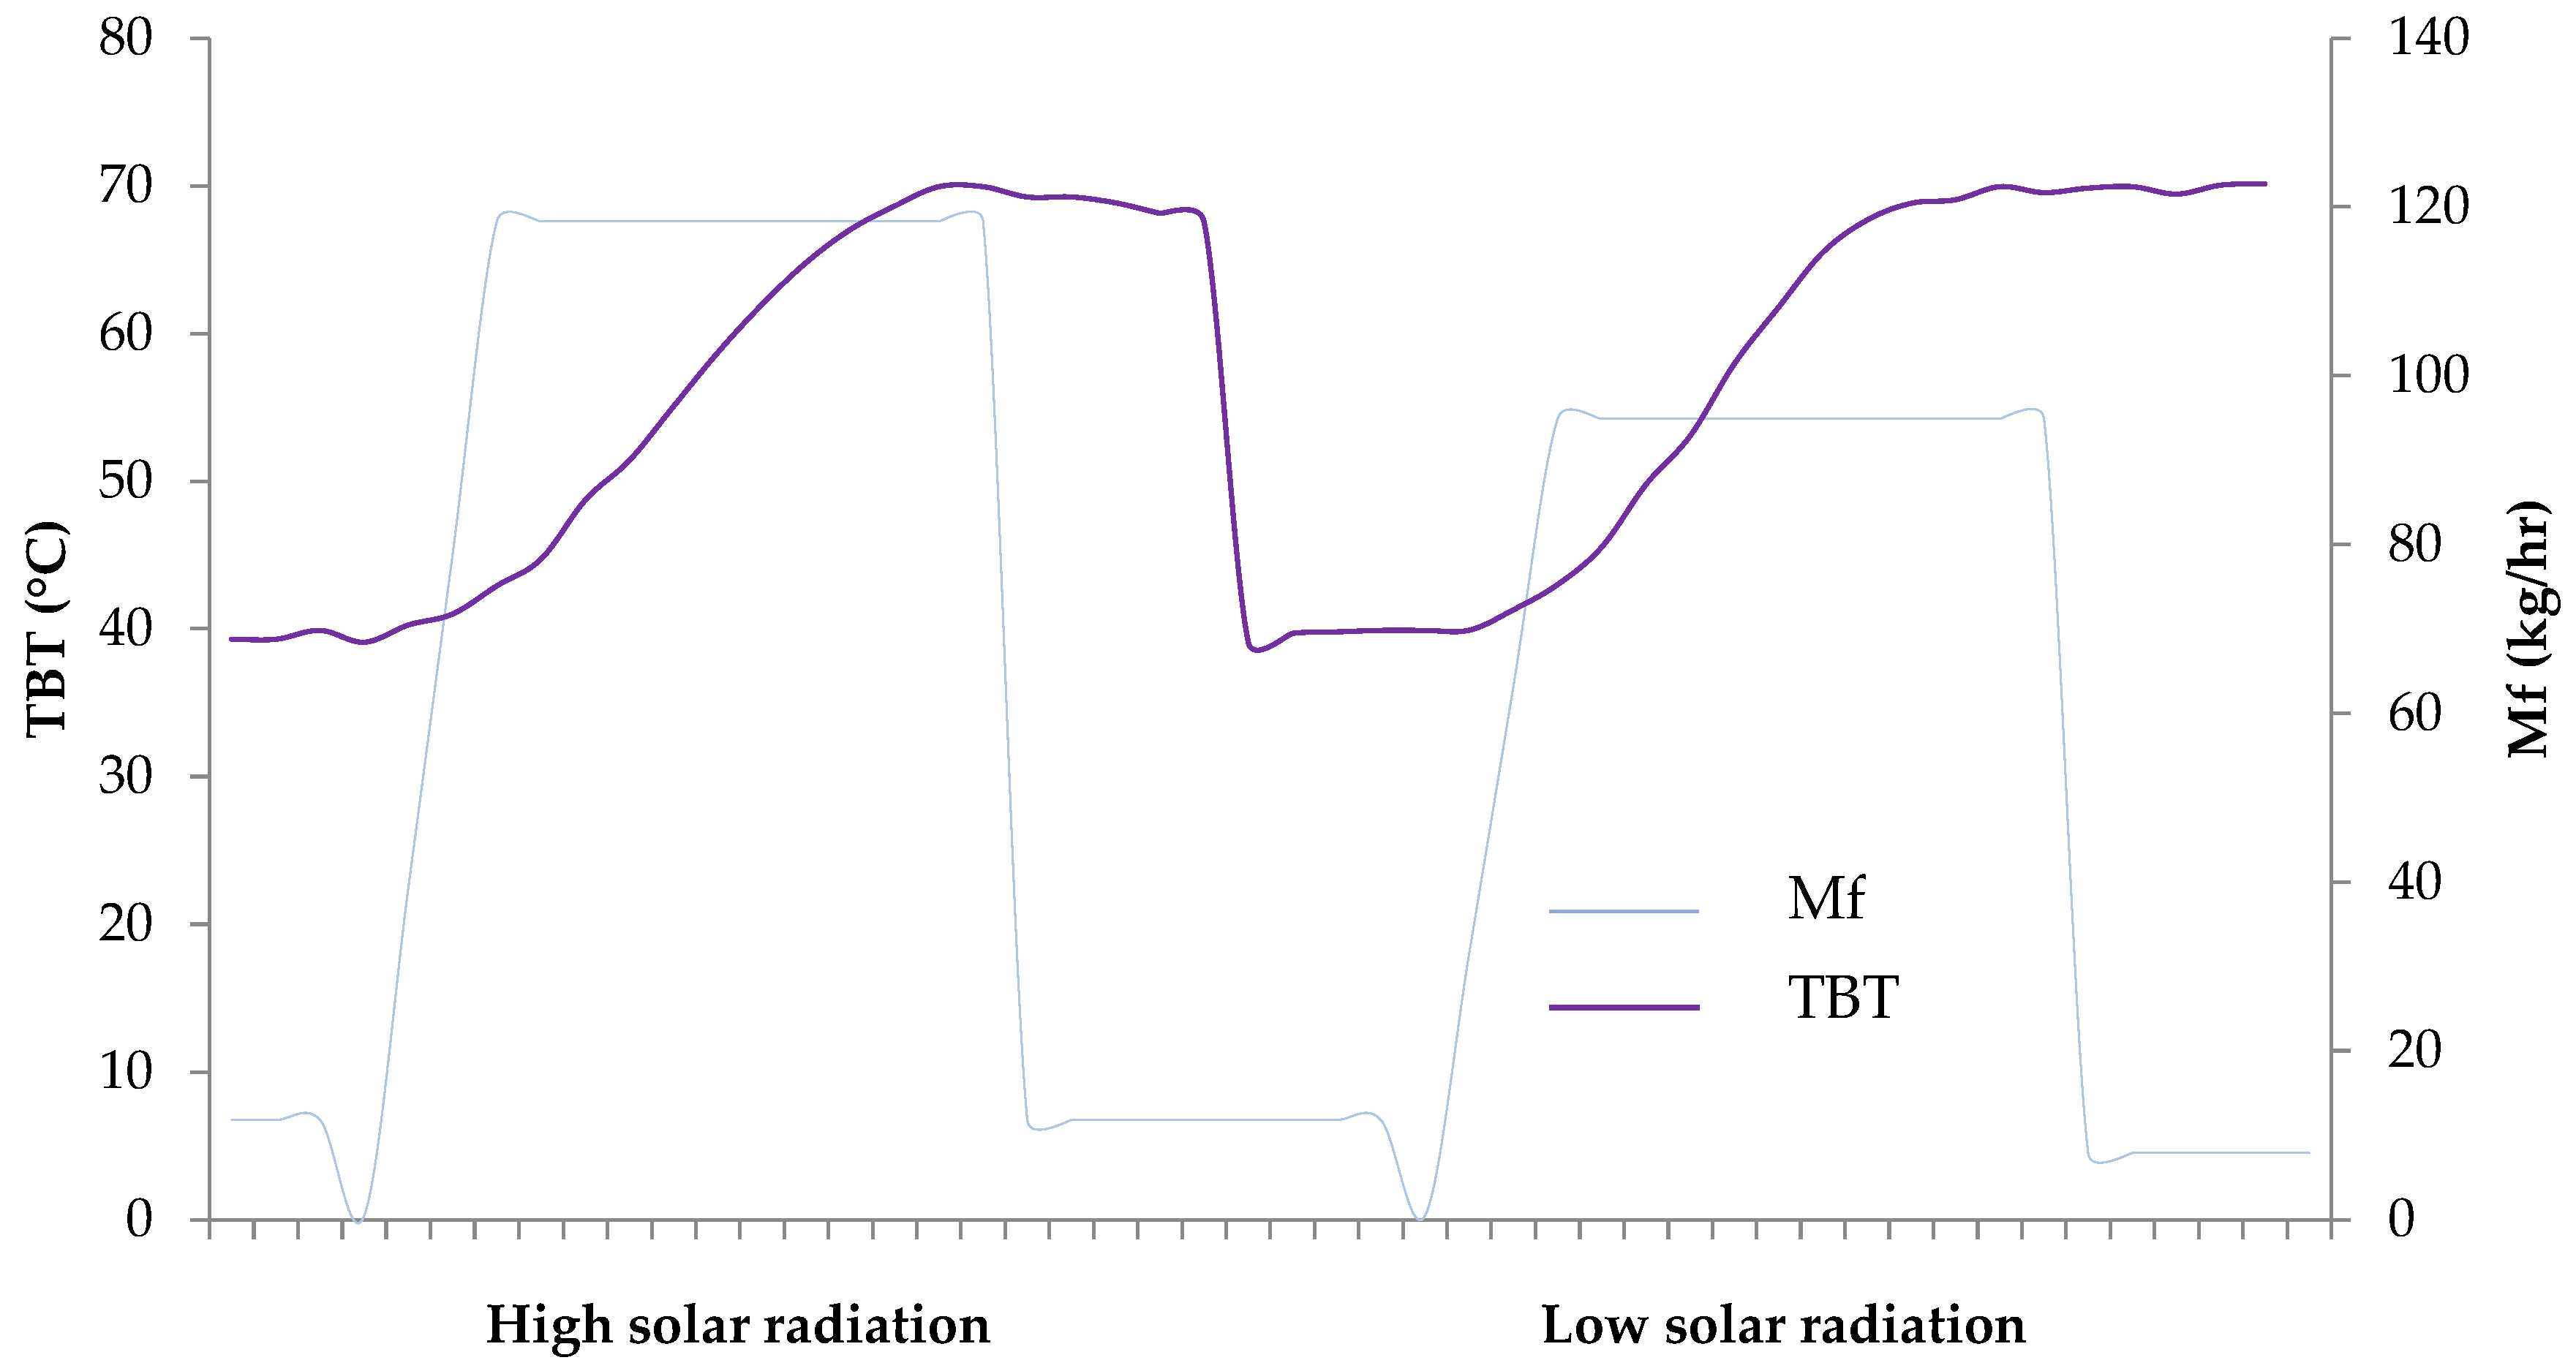
The variations in mass flow rate and maximum temperature of the brine for each tank were evaluated hourly. The resulting relationships showed a relatively linear relationship in mass flow rate and a non-linear relationship in temperature. Figure 5, below, shows the temperature and the feed mass profiles of the tank for two days. Both the variations in mass flow rate and temperature were evaluated over 24 h periods. The first 24 h show the charging process at high solar radiation levels while the second 24 h show the charging process at low solar radiation levels. In order to make the charging tank temperature reach the designed TBT gradually without exceeding the desired value, the switching time was set to align with the sunset, approximately 8 p.m. By starting the filling process during this period, a large amount of preheated brine enters the storage tank, and no further heating occurs until the following morning. At sunrise, the circulation through the collector starts, which not only helps to achieve the acceptable TBT, but also assists in avoiding thermal losses. Every tank has a minimum level of water at the end of the discharging process. The temperature of the water in the tank at the end of discharging process is the TBT of that day. Once the tank switches from discharging to charging mode, the tank receives the preheated brine at a temperature of about 40 °C. This huge difference between the TBT and the preheated brine temperature causes the temperature in the tank to go from its minimum level to the new TBT value at a gradual rate. This new TBT will be nearly equivalent to the TBT for the previous day, because the amount of the incoming water will be calculated according to sun availability. For this reason, the TBT is almost the same for the two days even with the difference in the amount of the feedwater, as shown in Figure 5.
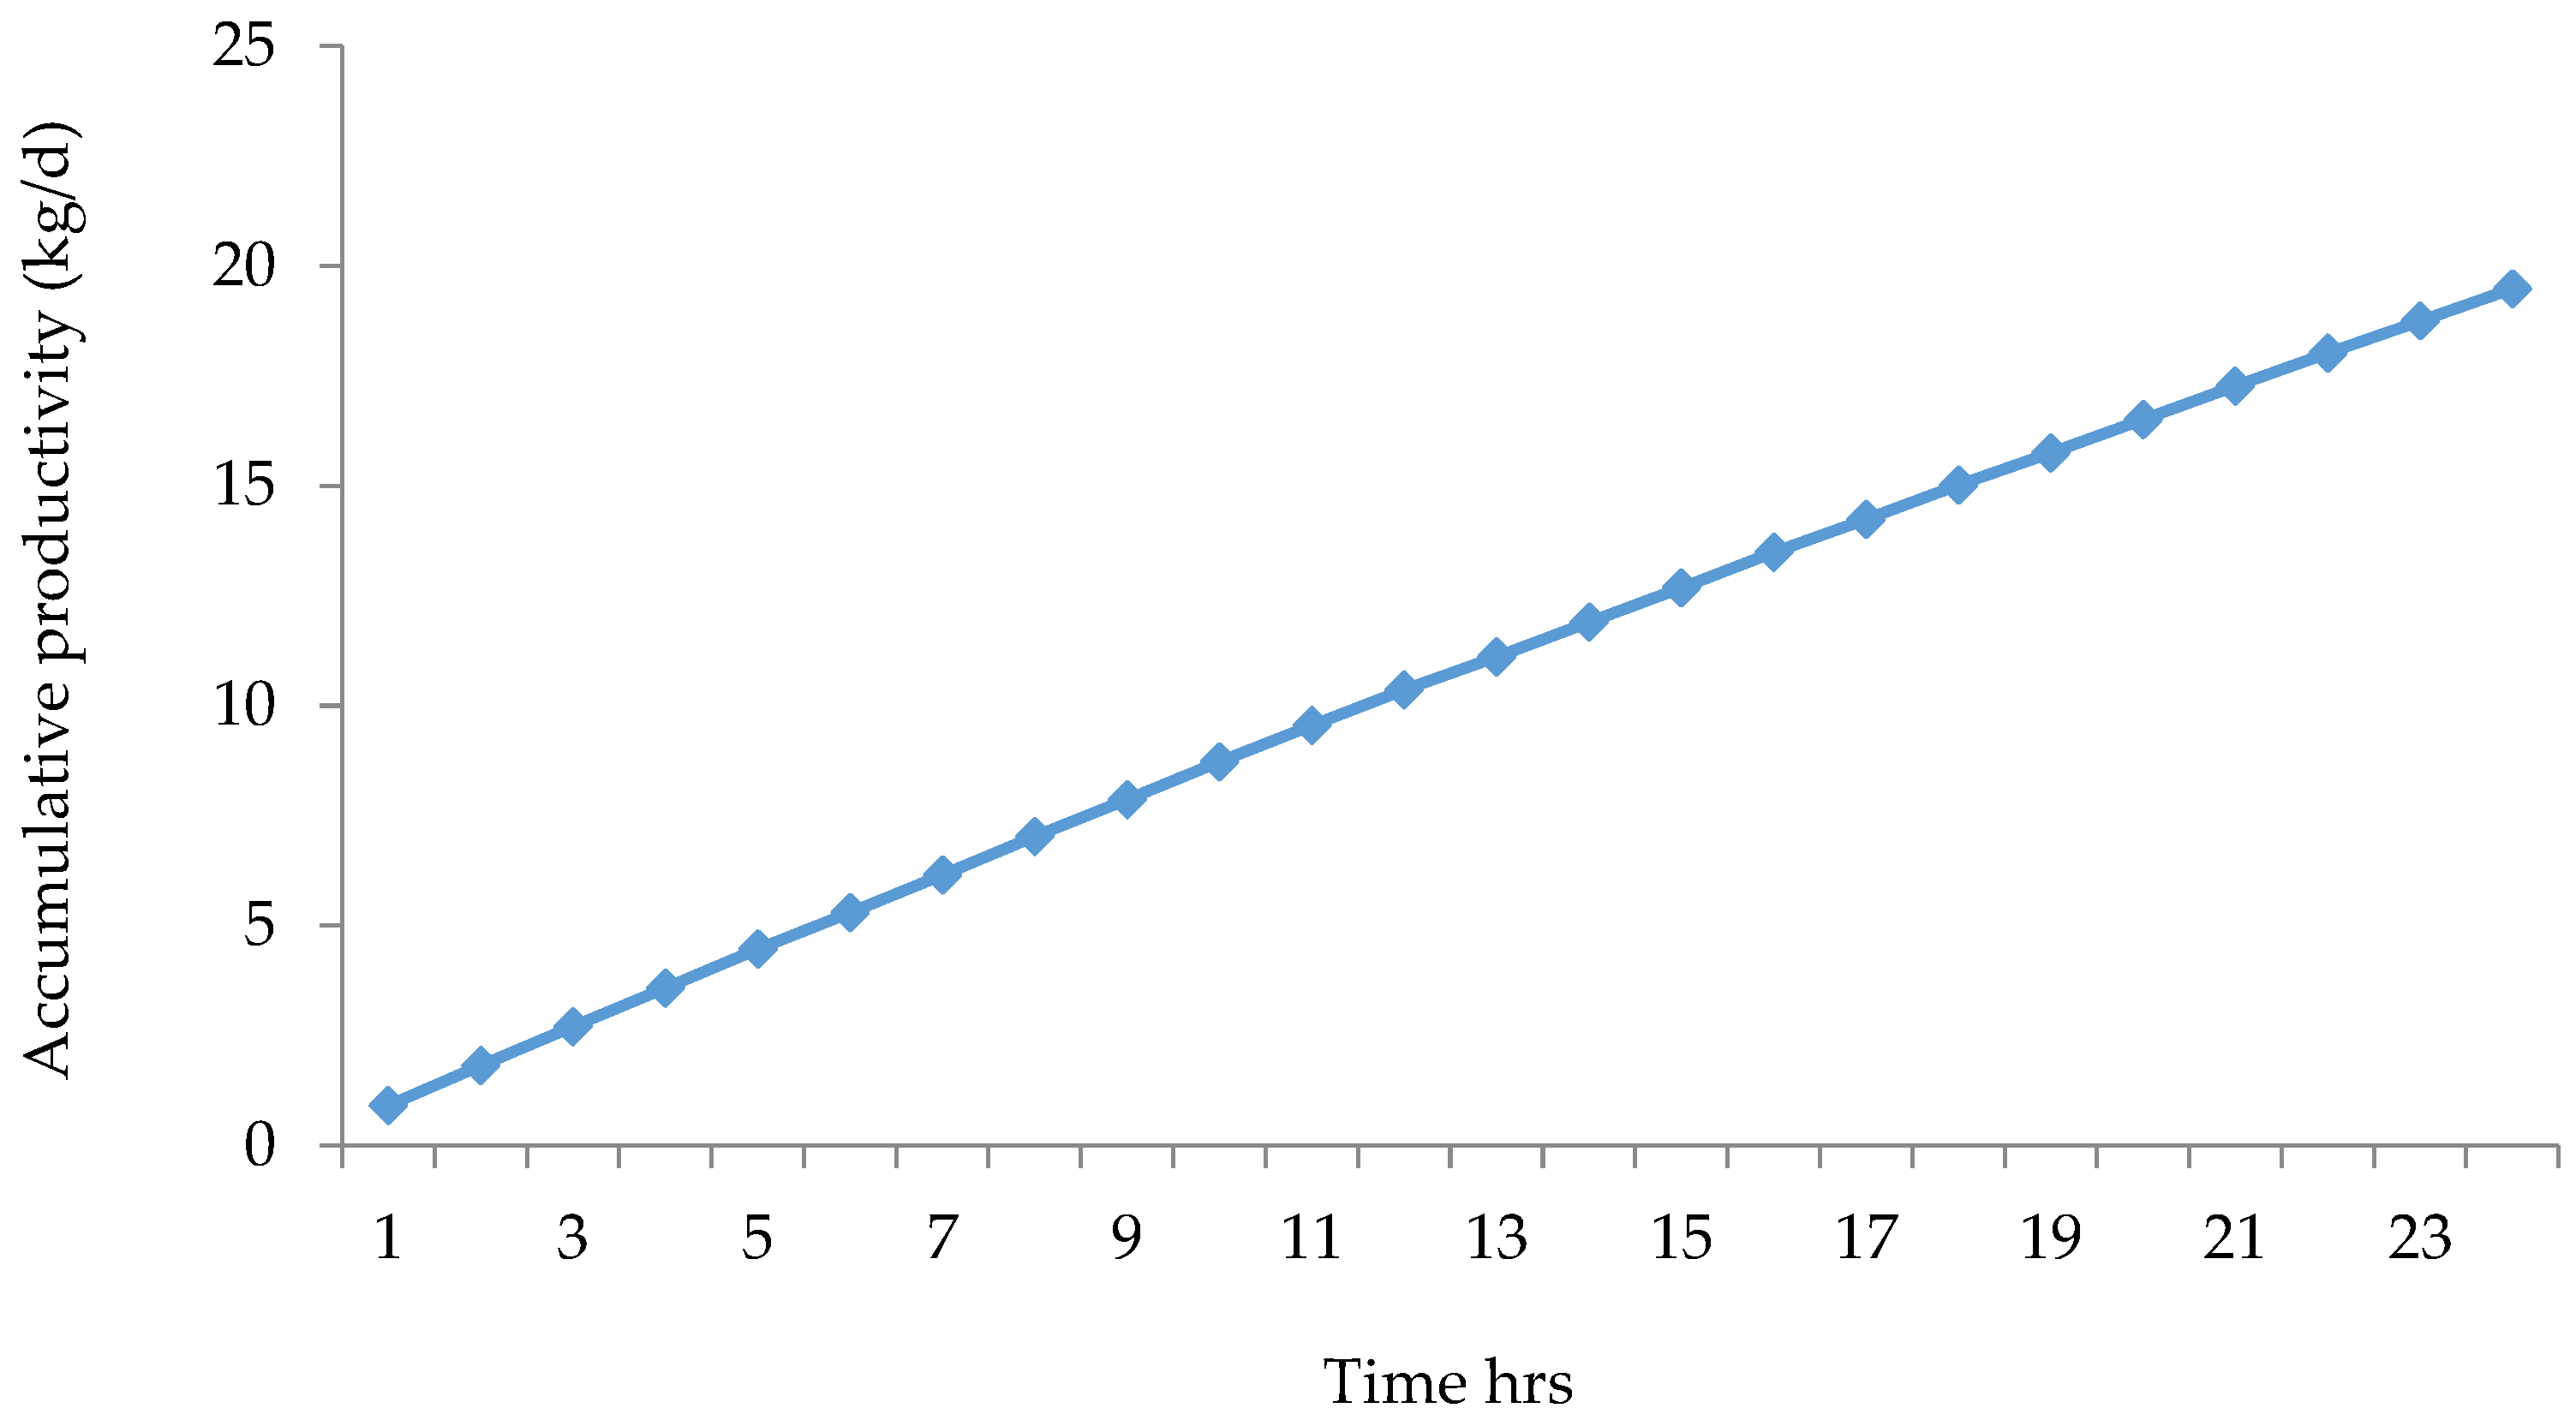
Figure 6 shows the cumulative distillate production rate per hour on 26 September 2020. The total production for this day was 19.7 kg, while the average production rate was approximately 0.78 kg/h. As shown in Figure 6, the production increase was linear with time. This indicates that the MSF unit was working continuously without any interruption, and the production rate was steady throughout the day, regardless of the variation in the solar energy. This production rate could only be achieved by using the new thermal dual tank storage system, where the MSF was separated from the variation in the solar energy during the day, resulting in a constant distillate production rate without interference from solar energy variation.
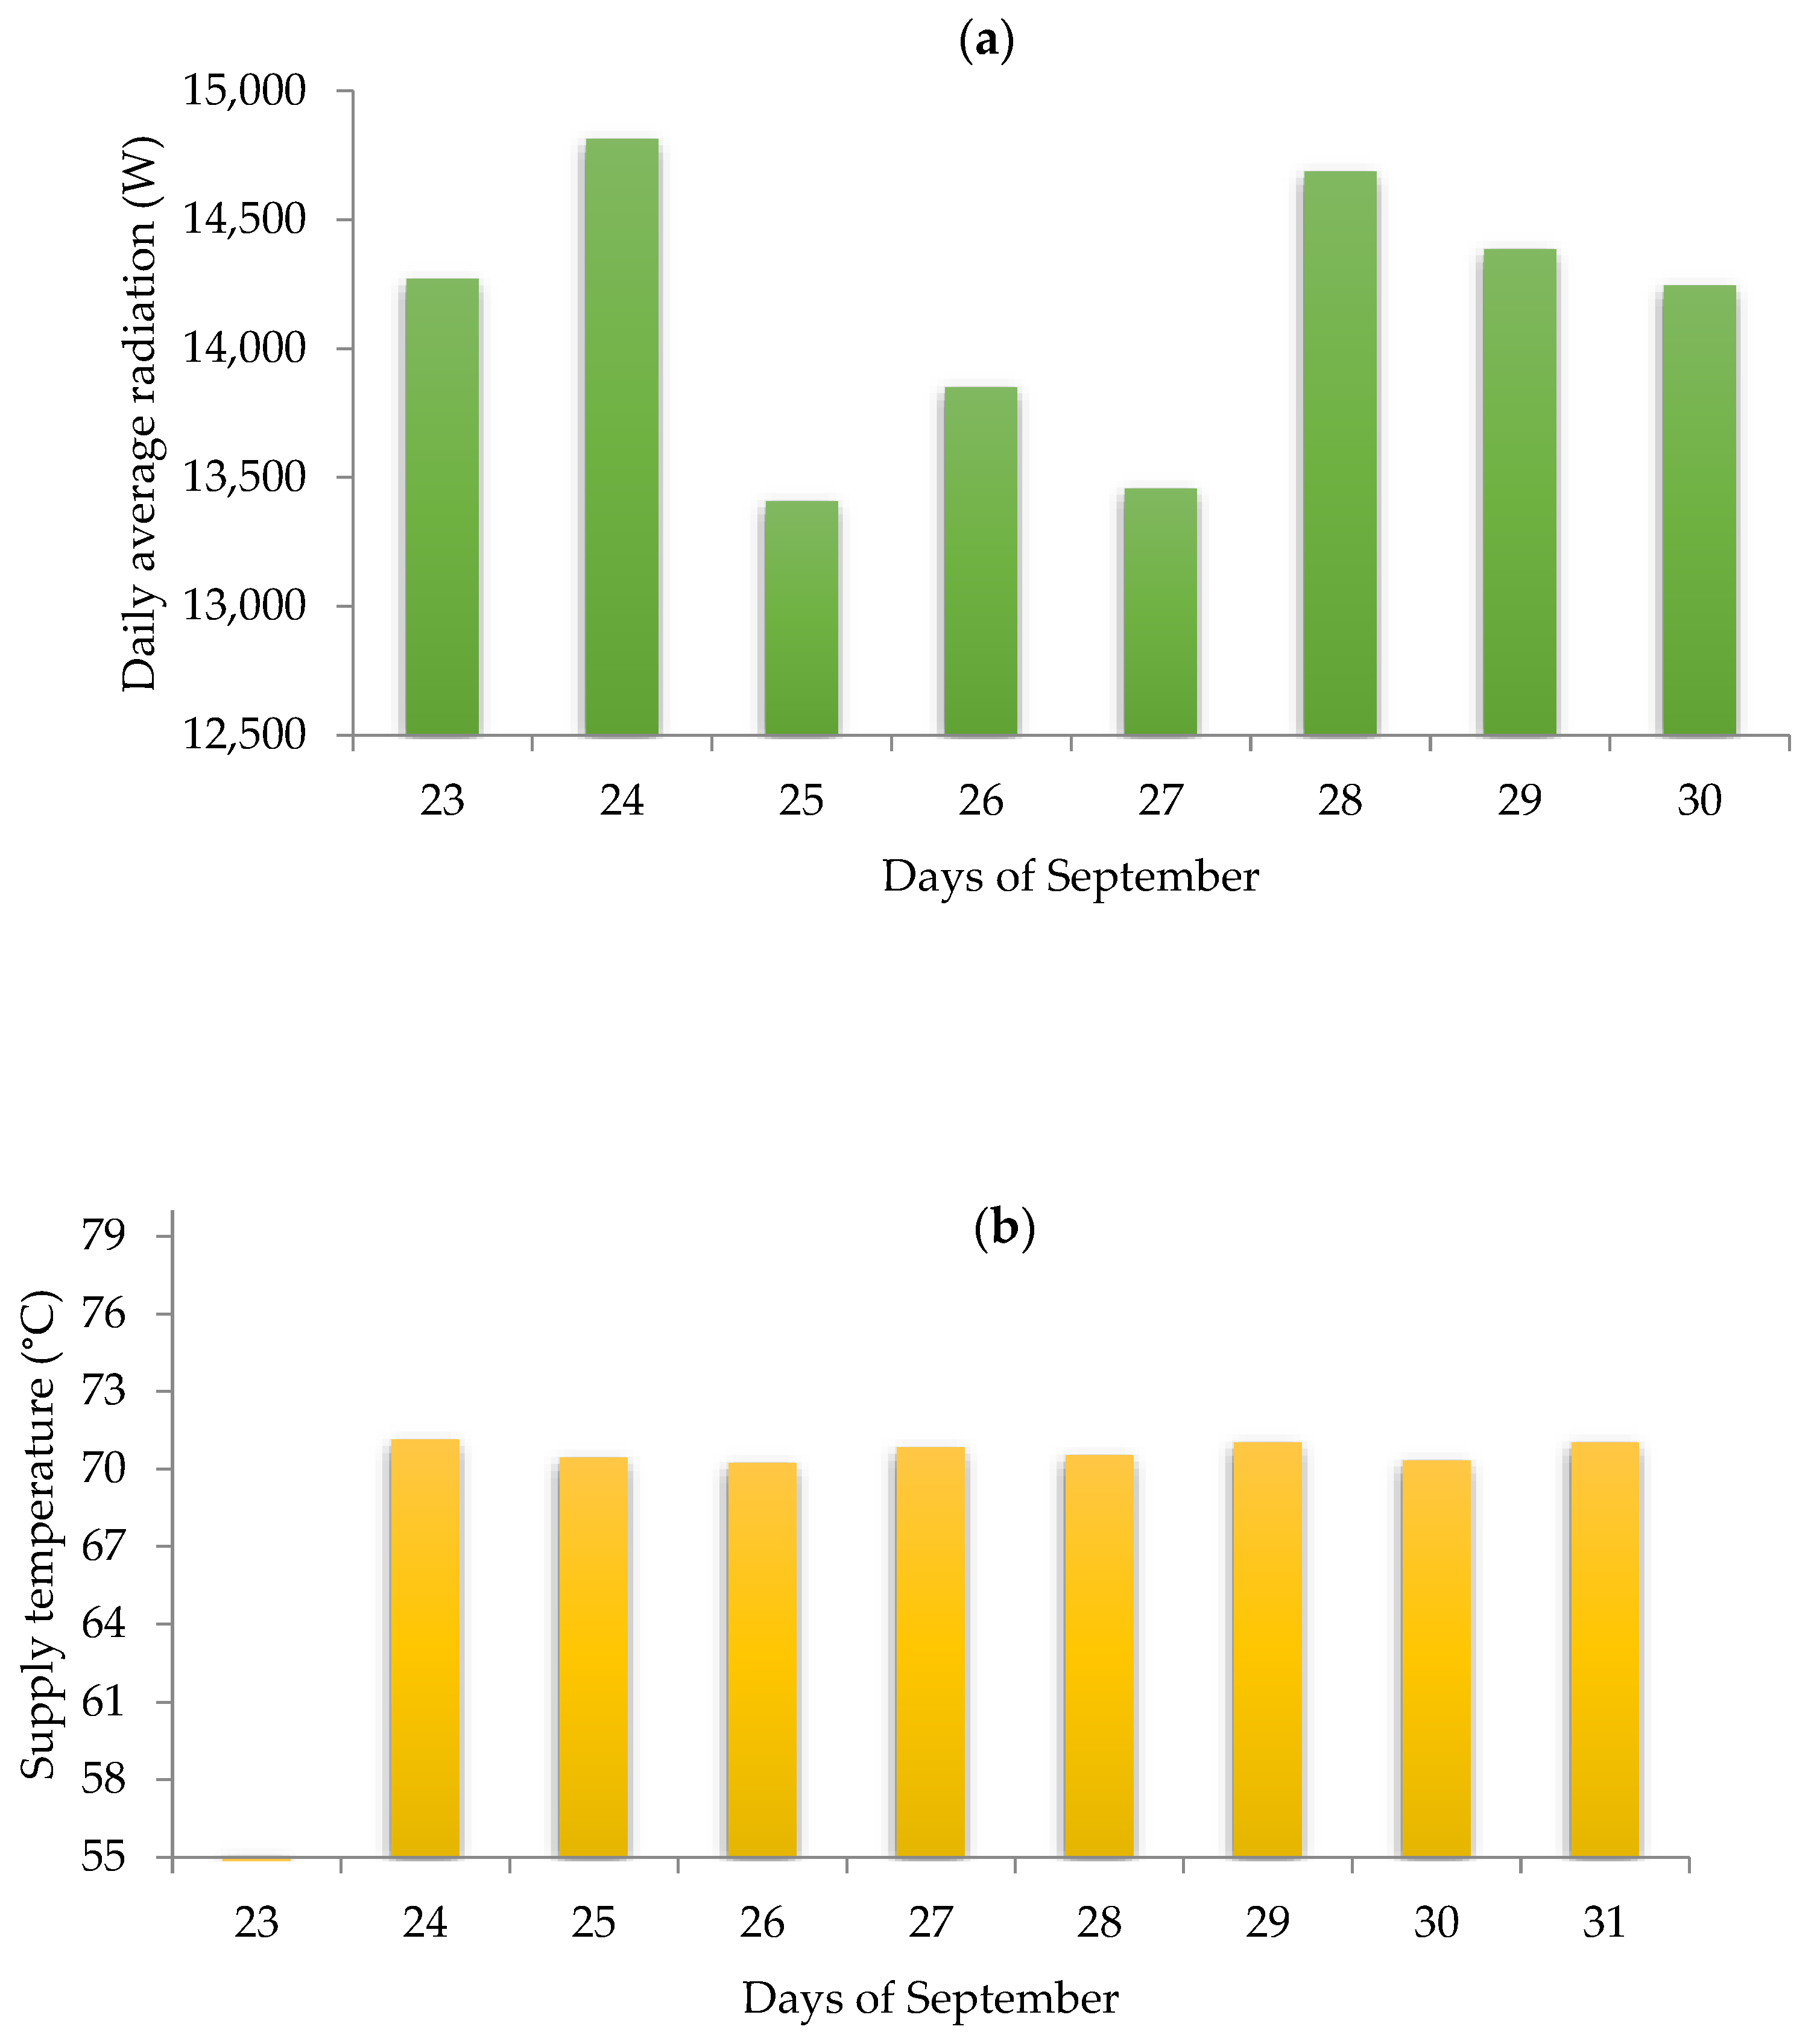
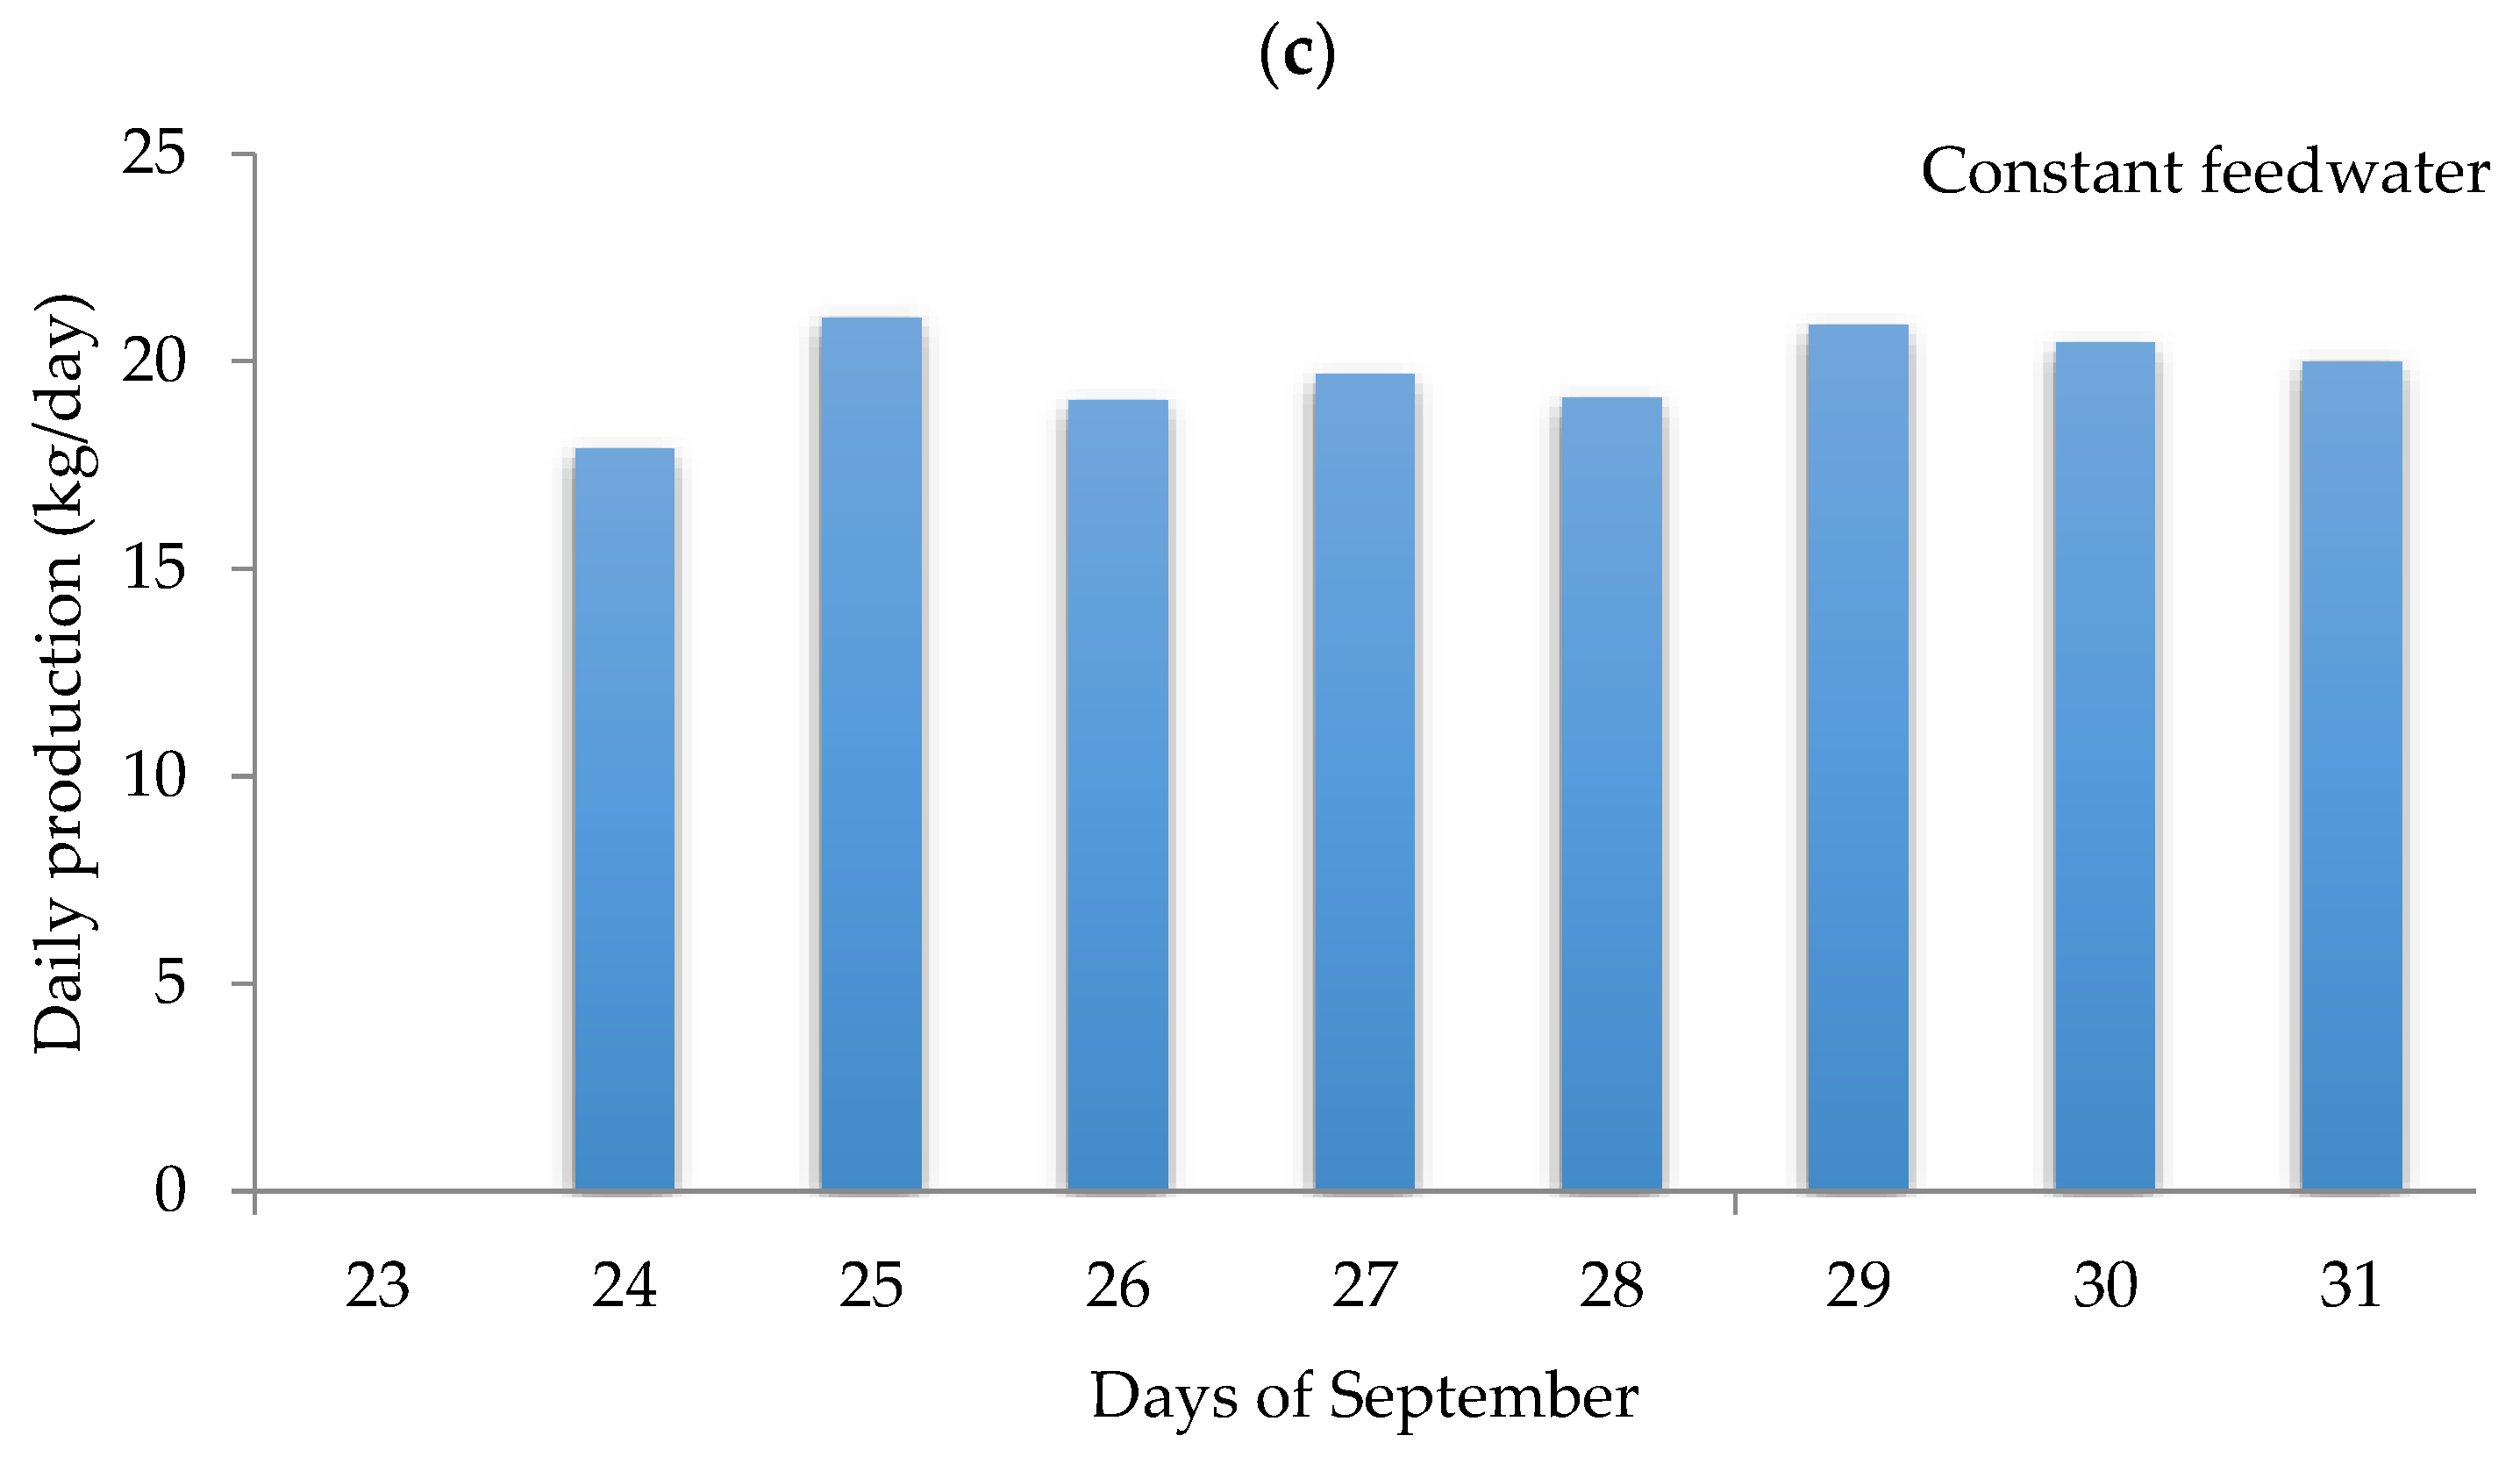
Figure 7 serves to better visualize the daily changes in mass flow and temperature. This Figure is composed of three bar graphs: one for energies, one for temperatures, and one for mass flows over a week-long span from 23–30 September. The first graph shows the daily total useful heat gain; the second shows the corresponding daily temperature change for the feedwater; and the third shows the total distillate production. The second and the third graphs start a day after the first graph, because the values of the daily temperature and the distillate production depended on the useful heat gain on the previous day.
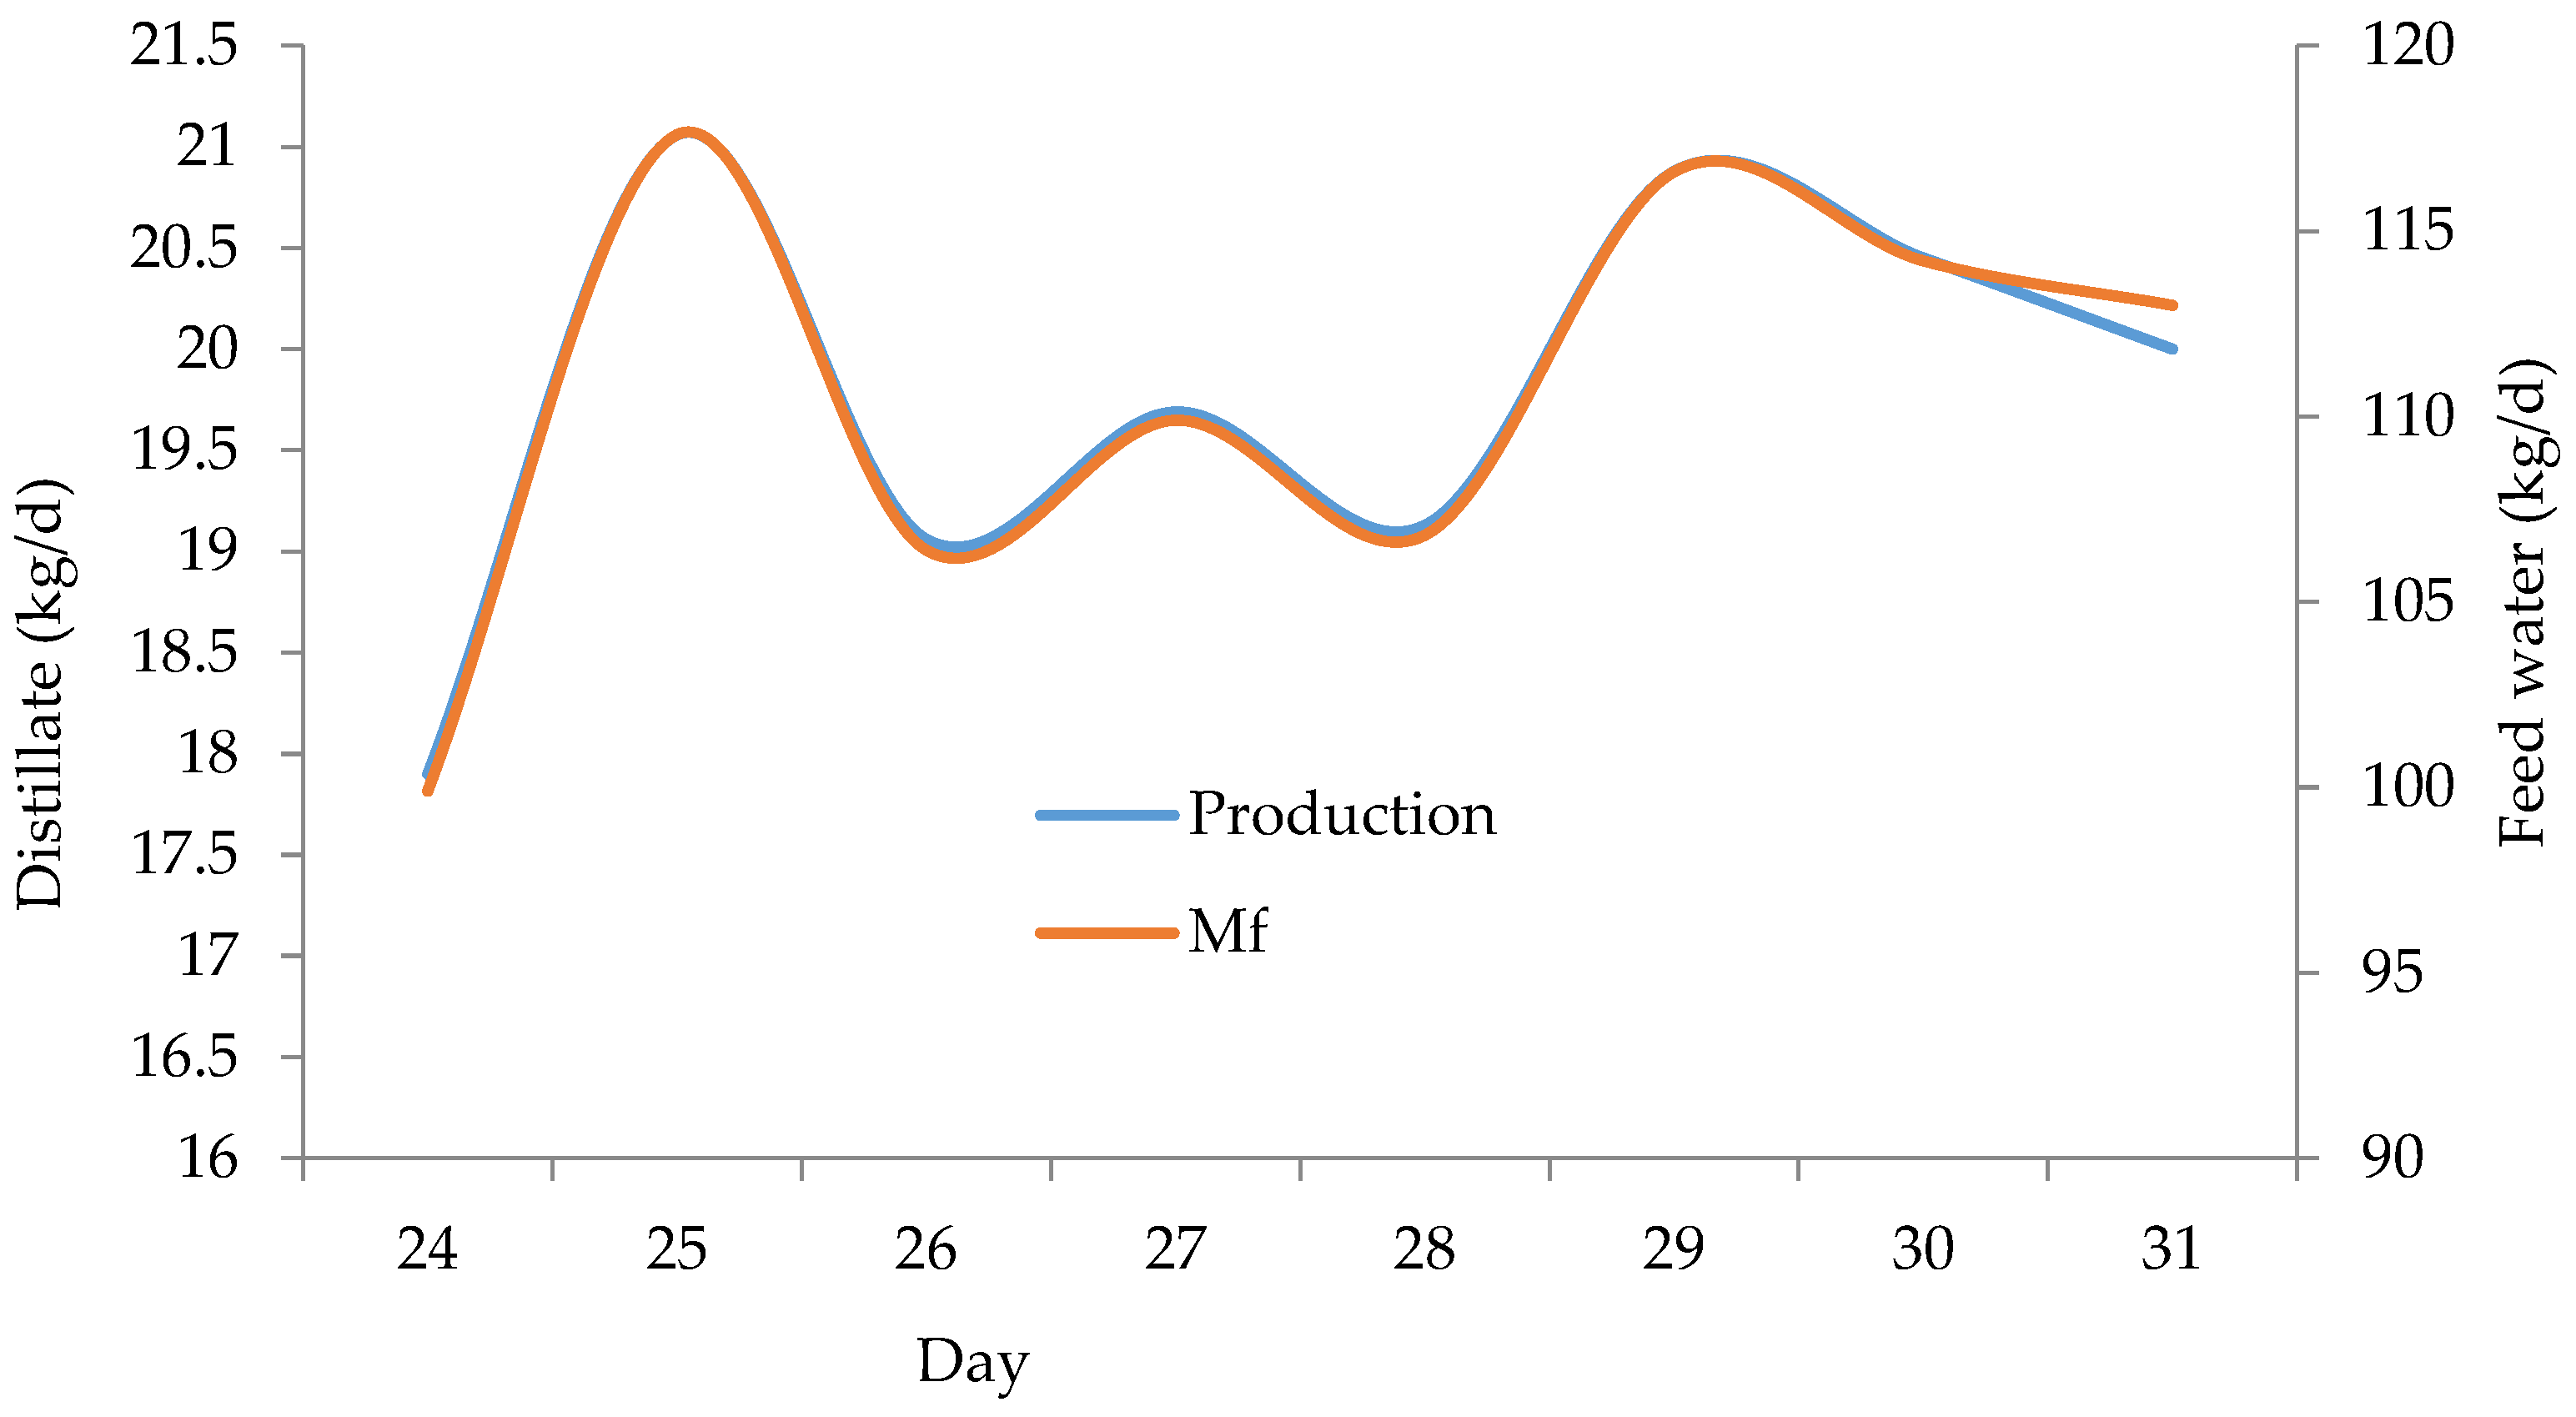
Figure 8 shows the feedwater and the distillate production during a week of September 2020. The left y-axis represents the distillate production while the right axis represents the feedwater. As shown in the Figure, the values of the feedwater were within the range of 100 to 117 kg/day, while the distillate production was between 17 and 20 kg daily. The variations in the feedwater and the distillate production were according to the solar energy availability.
System Performance
For further study and to compare alternative methods for desalination, the following criteria were used:
Distillate Production and Recovery Ratio (RR)
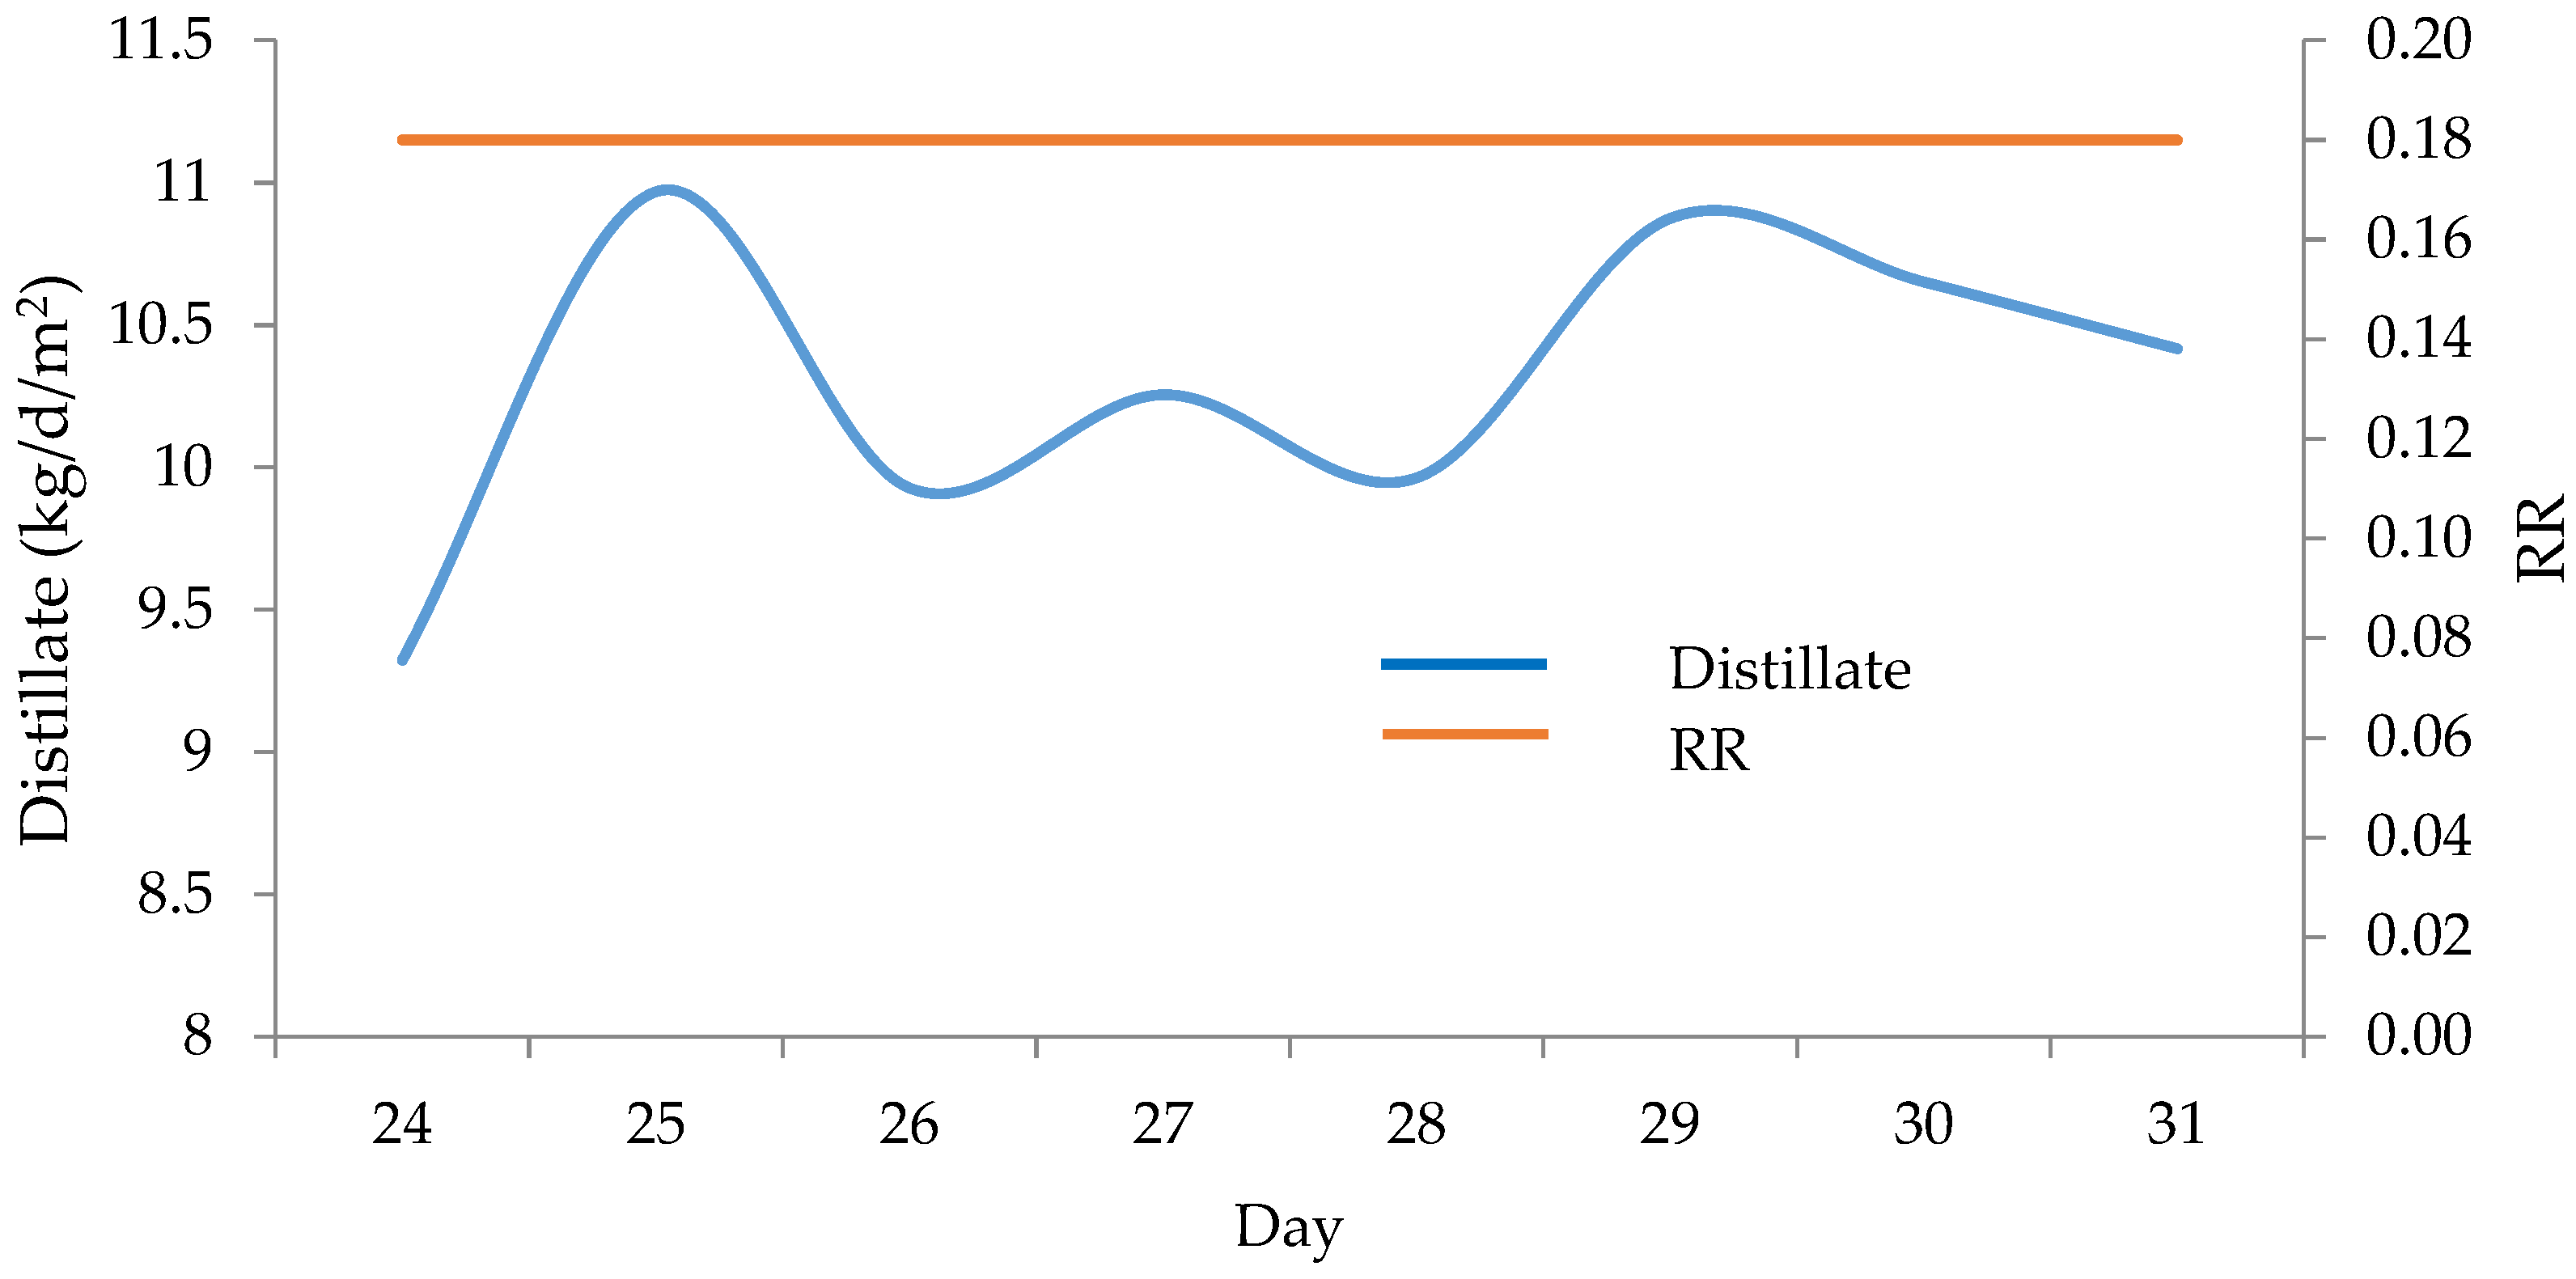
The variation in the distillate production is related to the solar energy that the system absorbs. The daily distillate production per unit area of solar collector is a very important factor that can be used in the performance analysis to show the effectiveness of the solar desalination unit. Dividing the maximum and minimum values of the distillate productions by the solar collector area (1.92 m2) leads to the value range between 8.8 and 10.7 kg/day/m2.
The ratio of distillate produced to the feedwater mass is called the recovery ratio, shown as a constant value in Figure 9. Its value is approximately 18%, which means that 100 kg of feedwater is required to produce 18 kg of distillate. This value is acceptable for a three-stage system.
Performance Ratio (PR)
PR is the ratio between the required power for evaporating the brine to the total solar power incident on the collector. Equation (1) was used for this calculation, where the numerator represents the evaporating power through the three stages, while the denominator represents the incident solar power on the collector.
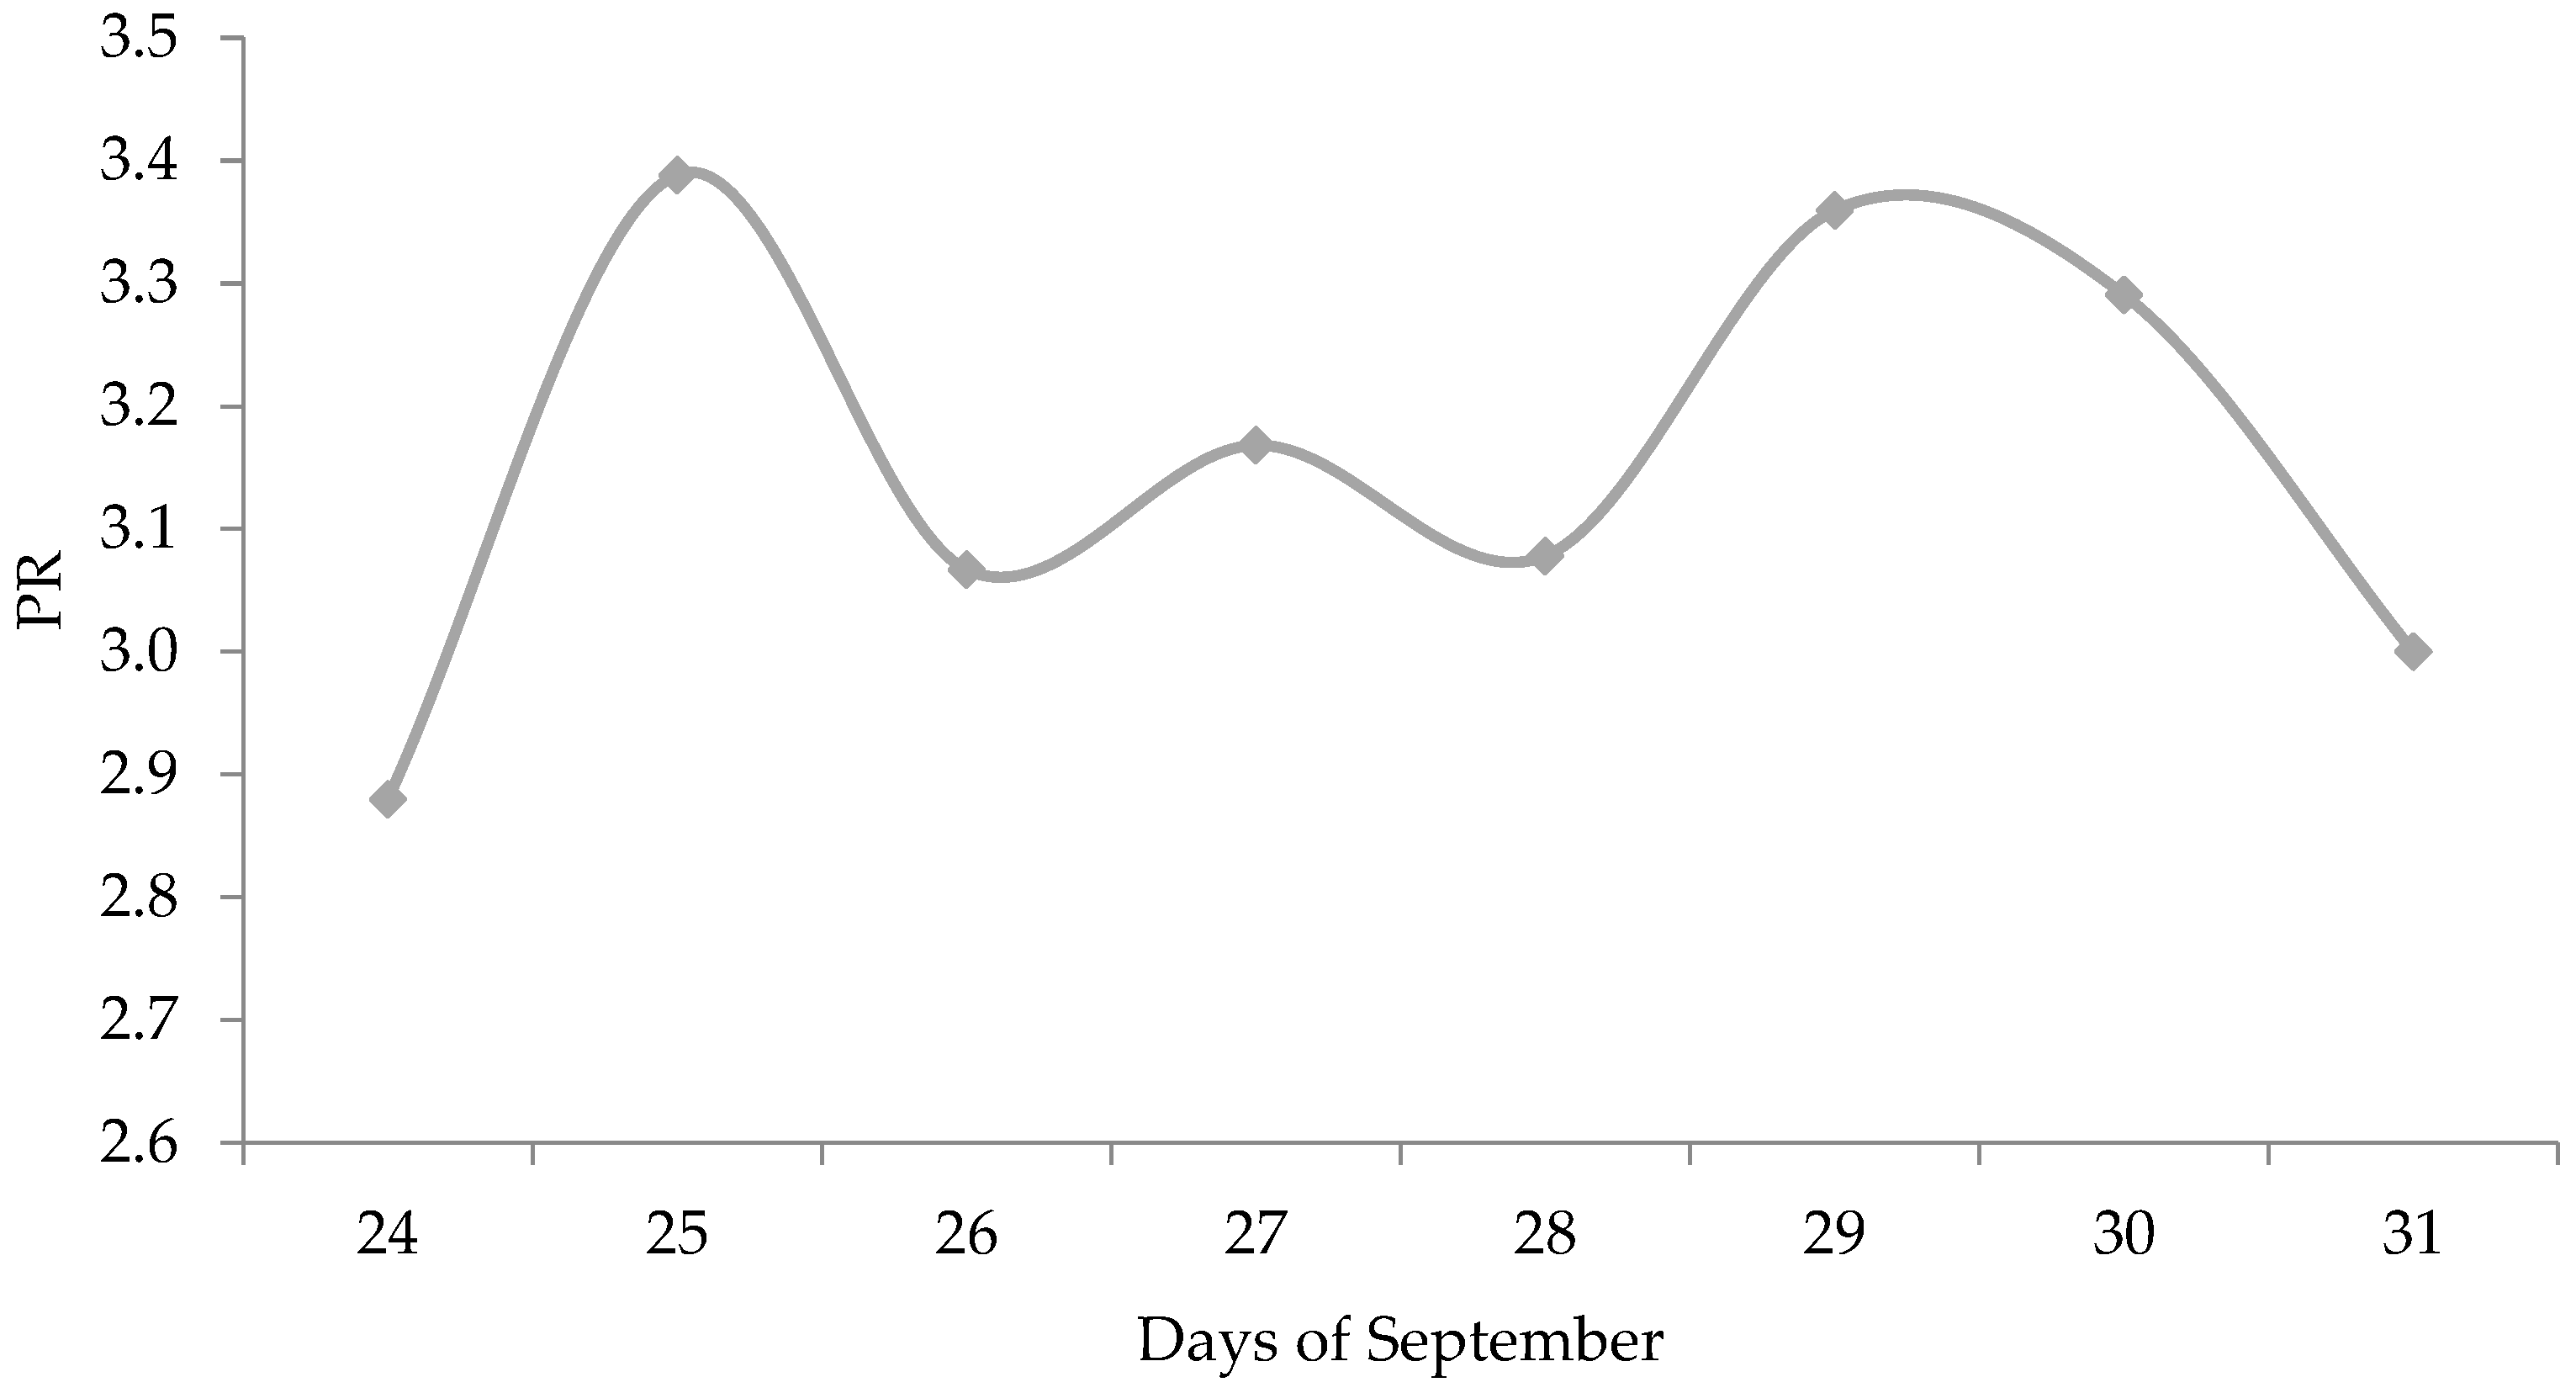
Figure 10 shows the daily PR for the experiment. Its range was found to be 2.9 to 3.4, with an average of 3.2. The performance ratio is sensitive to the TBT, the number of stages, and the total collector area.
The Specific Energy Consumption (SEC)
The overall efficiency of the system can be measured based on the energy required for producing distillate. This value is known as specific energy consumption (SEC), which is the total useful heat energy divided by the quantity of produced distillate. Figure 11, below, illustrates the SEC for the MSF system over a period of a week. As shown in the Figure, its values range from 678 to 787 KJ/kg, with an average value of 717 KJ/kg. The SEC depends on the number of stages, the feedwater flow rate, and the total collector area. According to Leblanc, the average specific energy consumption for three stages is about 850 KJ/kg [20].
Economic analysis
Use of the solar MSF in desalination assists in the reduction of freshwater production costs. An economic analysis of the MSF cost is considered necessary to highlight both the payback period of the experiment and the value of the produced fresh water. Table 4, below, displays the individual costs that contribute to the required investment necessary for the MSF to operate successfully. The cost of construction and repair of the MSF unit significantly affects the payback period, with a value of $1970. It is assumed that the lifetime of the unit is approximately 20 years when run within its standard operating conditions. The average productivity of the unit was found to be 8.5 L/m2, giving a payback period of 4925 days [21].
Fuel saving
In the thermal desalination process, over 350,000 tons of oil are required to produce 13 million tons of freshwater daily [5]. Since the desalted water output is 38 kg/d, the fuel required for desalination is 0.001 tons. This ratio can be used to give a rough estimate for fuel costs saved by the design, which produces 18 kg of freshwater daily, to approximately (0.001 ton/day) (17 barrel/ton) (60 $/barrel) = $1/day, assuming the cost of crude oil to be $60/barrel.
Table 5 compares system performance and costs from other reported studies. It justifies the economic and technical viability of the system.
4. Discussion
In conventional desalination, steam temperature is one of the most important parameters impacting the MSF desalination process. The overall plant performance, distilled water production, and the TBT are strongly affected by the heating steam temperature. In this design, the thermal storage tank has the same function as the brine heater, so there is no separate heating steam or brine heater. Thus, the overall plant function depends on the temperature of the thermal storage tank, which represents the TBT. By increasing the thermal storage tank temperature, the distilled product rate increases due to the increased flashing rate. Consequently, more condensate will form, resulting in an increase in plant total production and overall plant performance.
Therefore, it is worth discussing the factors that affect the TBT of the solar desalination plant. These are many, including the day of the year, feed flow rate, tank size, collector surface area, and collector efficiency.
Day of the year
The system was set up to run on day 355, i.e., the 21st of December, the day with lowest average temperatures of the year, to ensure that the storage system provided the unit with the required heat throughout the whole year. The TBT is affected by seasonal variation and location. During daytime, the solar collectors supply the storage tank with solar energy to increase the feed water temperature to the desired TBT. Hence, the TBT is strongly affected by the absorbed solar radiation, which is function of day of the year. The highest value of the solar field outlet temperature occurs around 2 p.m. when solar radiation is at its highest value. Moreover, days in the summer are longer than those in winter, resulting in more efficient absorption of heat in summer.
Storage tank Temperature
The storage tank temperature is held above the required desalination input temperature value due to losses throughout the day. To ensure minimum loss, the storage tank is insulated. The thermal storage tanks have two modes: charging (store mode/standby mode) and discharging (feed mode/in-service mode). The tank’s mode is switched every 24 h. To avoid scale formation, the solar field outlet temperature and temperature inside the thermal storage tank must be limited to about 120 °C.
Tank Size
The size of thermal storage tank is based on the peak volume of feed water during the year. A greater feed flow rate increases the size of the storage tank. The size of thermal storage tanks is determined based on plant capacity. So, for a plant capacity of 75 kg per hour, the size of one tank should be 1.3 m3. The balance between storage tank size and the total production is critical for cost analysis. Consequently, an increase in the production capacity requires a larger tank size.
Solar field area
The TBT is affected by the total area of the collector and number of collectors. Increasing the number of collectors increases the total absorbing area, which in turn increases the amount of solar heat gained by the feed water and the outlet temperature.
Collector inlet temperature
The collector inlet temperature or storage tank temperature is equal to the average temperature of the water feed leaving the first stage during the night. This temperature will increase gradually during a period of daytime collection due to the absorption of heat from the collector.
Collector outlet temperature
Determining the collector outlet temperature depends on the initial storage tank temperature, the mass flow rate of the water, and the solar field area. The collector outlet average temperature is about 3 °C above the collector inlet temperature, as the temperature of the storage tank increases to the maximum value of 70 °C.
Start-up
The model is set to run preform desalination in normal operation mode. In other words, the model increases the thermal storage tank temperature to the TBT from the temperature of the water feed leaving the first stage at about 40 °C. On the other hand, during startup operation mode, the thermal storage tank temperature must be increased from the sea water temperature of about 30 °C to the TBT. The startup procedure needs a long time (or an auxiliary boiler) to raise the temperature to the required point.
Solar field efficiency
The solar field efficiency is defined as the ratio between the useful heat gain absorbed by the seawater and the beam solar energy incident on the aperture. The maximum value of the collection efficiency is about 72% when the solar radiation is the highest, and the maximum value of the solar field outlet temperature is around 70 °C.
5. Conclusions
Conventional desalination processes are fossil fuel-intensive, costly, and environmentally harmful. It is imperative to find alternative methods to produce fresh water. Solar energy is believed to be an effective solution to water scarcity. A new multistage flash desalination with an integrated solar system was built and tested in this work. An experiment prototype was used in this design. The system consisted of three components: a three stage MSF unit, thermal storage tanks, and solar collectors. Two storage tanks were used for solar charging and MSF feeding.
Of the two thermal storage tanks, one was in charging mode to store heat and the other was in discharging mode to provide the plant with thermal energy day and night, at full capacity. The roles of these tanks were switched on a daily basis. To get the target TBT, the mass flow rates were adjusted to track seasonal variations in solar power.
The experiment work was conducted for a specific location, Taif, Saudi Arabia, using a three stage MSF unit. The results indicated:
- Average distillate production was 19.7 kg/day with a solar collector area of 1.92 m2, which can be expressed as 10.3 kg/m2/day.
- The TBT was about 70 °C
- The average daily PR and SEC for the experiment were 3.2 and 717 kJ/kg, respectively.
- The cost analysis for the solar MSF plant indicates a per-unit production cost of $0.015/L
The present study focuses on experimental work. In the future, the results of the experimental work will be compared with a numerical model. A dynamic mathematical model will be developed and simulated with solar powered three-stage desalination. An optimization simulation should also be performed to determine the best performance, and an economic feasibility study should be performed to show the net benefit of the proposed project.
Funding
This work was financially supported by Taif University Researchers Supporting Project number (TURSP-2020/205).
Institutional Review Board Statement
Not applicable.
Informed Consent Statement
Not applicable.
Data Availability Statement
All the results shown in the manuscript can be requested from the author.
Acknowledgments
The author would like to gratefully acknowledge the financial support by Taif University Researchers Supporting Project number (TURSP-2020/205), Taif University, Taif, Saudi Arabia.
Conflicts of Interest
The author declares no conflict of interest.
Appendix A
MSF process modeling
Once-Through MSF (MSF-OT) Model
To model the MFS unit, it is easy to illustrate a single-stage flash evaporation. Each stage in the MSF is divided into four control volumes:
- The flashing brine pool.
- The distillate.
- The vapor space.
- The condenser tubes.
The mathematical model for the single flash is simple, and it includes total mass and salt balances, as well as energy balances for the chamber and the condenser. The distillate that condenses at each stage is given by Equation (A1)
where the parameter represents the average latent heat for the ith stage of the MSF, which is a function of the temperature.
The total distillate produced in a day, is therefore given by Equation (A2).
Solar Field Model
The model is defined by processing complete design specifications which include parameters of the sun’s angles and the geometric dimensions of collector. Parameters such as beam radiation, incident angles, heat losses, and dimensions are used to calculate absorbed solar radiation, and are then used in an energy balance equation to give the amount of energy gained in units of watts (Qu).
The governing equation is a widely used measure of collector heat gain. Generally known as the “Hottel Whillier-Bliss equation”, it is written as
where Useful energy gain W; Collector efficiency; Collector heat removal factor; I Intensity of solar radiation, W/m2; α Absorption coefficient of plate; τ Transmission coefficient of glazing.
Thermal Storage System Model
The thermal storage tank system consists of following units:
- Two thermal tanks, one in charging mode and the other in the discharging mode.
- Circulation pumps.
- Pipes.
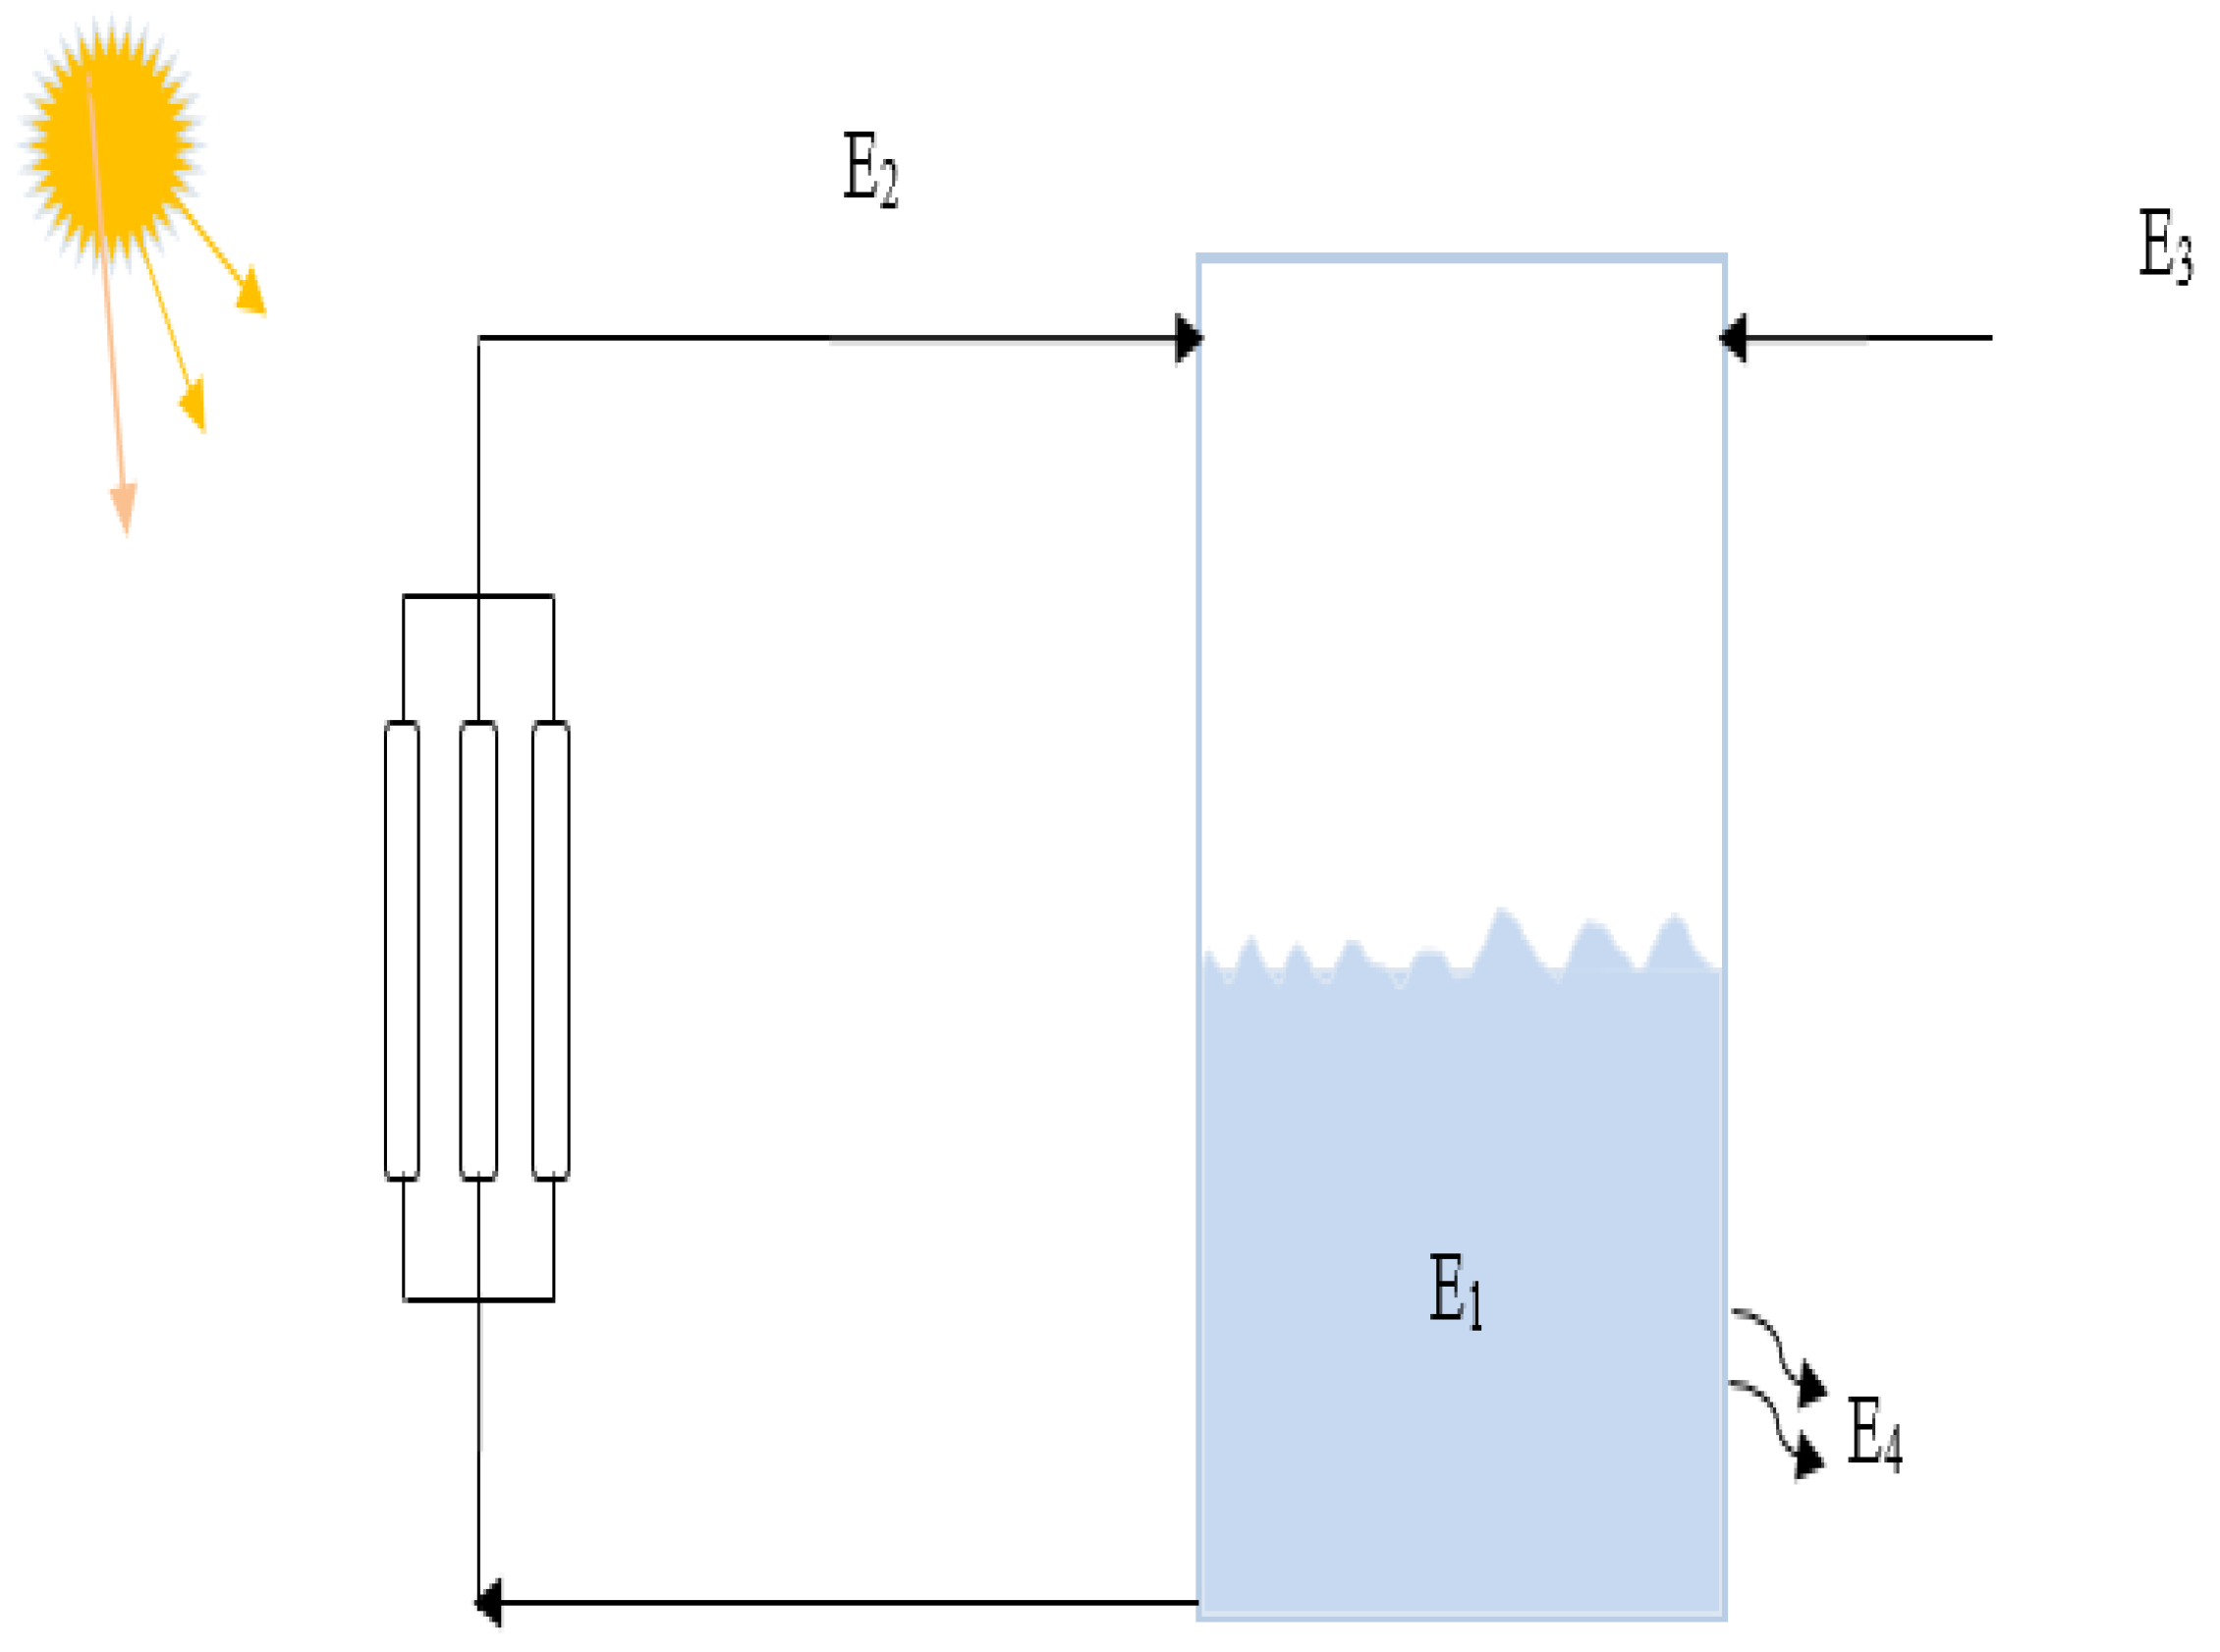
The present model was developed by taking a thermal storage tank as a single unit and then calculating both the mass and energy balances of that unit. This system was assumed to be a fully mixed tank. A single flow comes in from a hot source, and a single flow stream leaves to a load. The level of the fluid in the tank can vary because the entering and leaving flows are not equal. In this scenario, the temperature of the surplus flow stream is the temperature of the contents of the tank. Here, the thermal storage tanks are assumed to be perfectly insulated, and heat losses are considered. Figure A1 presents the tank energy balance.
Energy balance
Figure A1.
Energy balance of the storage tank.

Performance ratio
Recovery ratio
Nomenclature
| Variable | Units | Description |
| m2 | Collector Area | |
| d | Day | |
| h | h | Hour |
| kg/h | Distillate Produced at each Stage | |
| Heat Removal Factor | ||
| I | W/m2 | intensity of solar radiation |
| kg/day | Distillate feedwater production rate | |
| kg/day | Feedwater flow rate from MSF | |
| kg | Mass of Charming Tank | |
| Number of MSF Stages | ||
| W | Useful Heat Gain | |
| °C | Ambient Temperature | |
| °C | Top Brine Temperature | |
| °C | Charging Tank temperature | |
| °C | Stage Temperature | |
| Tth | m | Tank wall thickness |
| Zero Efficiency | ||
| UL | W/m2 °C | collector overall heat loss coefficient |
| J/(h °C) | Loss coefficient for Charging Tank | |
| Collector Efficiency | ||
| J | Energy | |
| J/kg | Latent Heat for the MSF | |
| kJ/kg·K | Specific heat for the brain | |
| α | Absorption coefficient of plate | |
| τ | Transmission coefficient of glazing | |
| Collector heat removal factor | ||
| °C | Brine Flow Decreases |
References
- Berenguel-Felices, F.; Lara-Galera, A.; Muñoz-Medina, M.B. Requirements for the Construction of New Desalination Plants into a Framework of Sustainability. Sustainability 2020, 12, 5124. [Google Scholar] [CrossRef]
- 1 in 3 People Globally Do Not Have Access to Safe Drinking Water—UNICEF, WHO. 2019. Available online: https://www.who.int/news/item/18-06-2019-1-in-3-people-globally-do-not-have-access-to-safe-drinking-water-unicef-who- (accessed on 15 April 2021).
- Bundschuh, J.; Kaczmarczyk, M.; Ghaffour, N.; Tomaszewska, B. State-of-the-art of renewable energy sources used in water desalination: Present and future prospects. Desalination 2021, 508, 115035. [Google Scholar] [CrossRef]
- Burn, S.; Hoang, M.; Zarzo, D.; Olewniak, F.; Campos, E.; Bolto, B.; Barron, O. Desalination techniques—A review of the opportunities for desalination in agriculture. Desalination 2015, 364, 2–16. [Google Scholar] [CrossRef]
- Eltawil, M.A.; Zhengming, Z.; Yuan, L. A review of renewable energy technologies integrated with desalination systems. Renew. Sustain. Energy Rev. 2009, 13, 2245–2262. [Google Scholar] [CrossRef]
- Sea Water Desalination System, McMurdo. 1993. Available online: https://nsf.gov/pubs/stis1993/opp93104/opp93104.txt#:~:text=Advantagesofamulti-stage,ahighgainoutputratio (accessed on 17 April 2021).
- Prajapati, M.; Shah, M.; Soni, B.; Parikh, S.; Sircar, A.; Balchandani, S.; Thakore, S.; Tala, M. Geothermal-solar integrated groundwater desalination system: Current status and future perspective. Groundw. Sustain. Dev. 2021, 12, 100506. [Google Scholar] [CrossRef]
- Sharon, H.; Reddy, K.S. A review of solar energy driven desalination technologies. Renew. Sustain. Energy Rev. 2015, 41, 1080–1118. [Google Scholar] [CrossRef]
- Darawsheh, I.; Islam, M.D.; Banat, F. Experimental characterization of a solar powered MSF desalination process performance. Therm. Sci. Eng. Prog. 2019, 10, 154–162. [Google Scholar] [CrossRef]
- Manjarrez, R.; Galván, M. Solar multistage flash evaporation (SMSF) as a solar energy application on desalination processes. Description of one demonstration project. Desalination 1979, 31, 545–554. [Google Scholar] [CrossRef]
- Ibarra-Herrera, X. Solar multistage flash evaporation (smsf) as a solar energy application on desalination processes. Desalination 1979, 30, 91. [Google Scholar] [CrossRef]
- Rajvanshi, A.K. A scheme for large scale desalination of sea water by solar energy. Sol. Energy 1980, 24, 551–560. [Google Scholar] [CrossRef]
- Moustafa, S.M.A.; Jarrar, D.I.; El-Mansy, H.I. Performance of a self-regulating solar multistage flash desalination system. Sol. Energy 1985, 35, 333–340. [Google Scholar] [CrossRef]
- Farwati, M.A. Theoretical study of multi-stage flash distillation using solar energy. Energy 1997, 22, 1–5. [Google Scholar] [CrossRef]
- Lu, H.C.; Walton, J.; HPSwift, A. Desalination coupled with salinity-gradient solar ponds. Desalination 2001, 136, 13–23. [Google Scholar] [CrossRef]
- Nafey, A.S.; Mohamad, M.A.; El-Helaby, S.O.; Sharaf, M.A. Theoretical and experimental study of a small unit for solar desalination using flashing process. Energy Convers. Manag. 2007, 48, 528–538. [Google Scholar] [CrossRef]
- Alsehli, M.; Choi, J.-K.; Aljuhan, M. A novel design for a solar powered multistage flash desalination. Sol. Energy 2017, 153, 348–359. [Google Scholar] [CrossRef]
- Al-Othman, A.; Tawalbeh, M.; El Haj Assad, M.; Alkayyali, T.; Eisa, A. Novel multi-stage flash (MSF) desalination plant driven by parabolic trough collectors and a solar pond: A simulation study in UAE. Desalination 2018, 443, 237–244. [Google Scholar] [CrossRef]
- Méndez, C.; Bicer, Y. Integration of solar chimney with desalination for sustainable water production: A thermodynamic assessment. Case Stud. Therm. Eng. 2020, 21, 100687. [Google Scholar] [CrossRef]
- Leblanc, J. Solar Thermal Desalination—A Modelling and Experimental Study; RMIT University: Melbourne, Australia, 2009. [Google Scholar]
- Zarzoum, K.; Zhani, K.; Ben Bacha, H.; Koschikowski, J. Experimental parametric study of membrane distillation unit using solar energy. Sol. Energy 2019, 188, 1274–1282. [Google Scholar] [CrossRef]
- Jiang, J.; Tian, H.; Cui, M.; Liu, L. Proof-of-concept study of an integrated solar desalination system. Renew. Energy 2009, 34, 2798–2802. [Google Scholar] [CrossRef]
- Abu-Jabal, M.S.; Kamiya, I.; Narasaki, Y. Proving test for a solar-powered desalination system in Gaza-Palestine. Desalination 2001, 137, 1–6. [Google Scholar] [CrossRef]
- Joseph, J.; Saravanan, R.; Renganarayanan, S. Studies on a single-stage solar desalination system for domestic applications. Desalination 2005, 173, 77–82. [Google Scholar] [CrossRef]
Figure 1.
Schematic of the design.

Figure 2.
A photograph of the experimental system.

Figure 3.
Hourly variations of solar radiation in September.

Figure 4.
(Left) Profiles of the useful heat transfers from the solar collector to the charging tank for the highest (red) and lowest (blue) solar radiation days. (Right) Charging tank brine temperature profiles for the highest (red) and lowest (blue) solar radiation days.
Figure 4.
(Left) Profiles of the useful heat transfers from the solar collector to the charging tank for the highest (red) and lowest (blue) solar radiation days. (Right) Charging tank brine temperature profiles for the highest (red) and lowest (blue) solar radiation days.

Figure 5.
Top brine temperature profiles and variations of feed water.

Figure 6.
Cumulative distillate production rate on 26 September 2020.

Figure 7.
(a) Measured solar radiation, (b) medium fluid supply temperature, and (c) daily distillate production.
Figure 7.
(a) Measured solar radiation, (b) medium fluid supply temperature, and (c) daily distillate production.


Figure 8.
Variations of total distillate production rate and feed water.

Figure 9.
Variations of total distillate production rate and recovery ratio (RR).

Figure 10.
Measured performance ratio for the solar MSF system between 21 and 31 September.

Figure 11.
Measured SEC for the solar MSF system between 24th and 31th September.


Table 1.
Technical specification of the flat plate collector.
| Aperture Area | m2 | 1.92 |
|---|---|---|
| Overall height | mm | 1730 |
| Overall width | mm | 1170–1215 |
| Depth | mm | 73 |
| Fluid capacity | L | 1.6 |
| Zero-loss efficiency η0 | 0.75 |
Table 2.
Specifications of the instruments used in the experiments.
| Instrument | Type | Range | Measurement Accuracy | Manufacturer |
|---|---|---|---|---|
| Water flow meter | 12E | 10–100 L/min | ±1% | WAYSEAR |
| Solar power meter | TM-207 | 2000 W/m2 | ±10 W/m2 | Tenmars |
| Air speed meter | GM8901 | 0–45 m/s | ±3.0% | Benetech |
| Thermocouple | OM-EL | −200 to 390 °C | ±1.0 °C | Omega |
Table 3.
System technical specifications and operation data used for the experiment.
| MSF Parameters | Unit | Values |
|---|---|---|
| Number of MSF stages, | 3 | |
| 1.3 | ||
| Solar Collector Parameters | Values | |
| Collector area | m2 | 1.92 |
| Overall height | mm | 1730 |
| Overall width | mm | 1170–1215 |
| Depth | mm | 73 |
| Fluid capacity | L | 1.6 |
| 0.75 | ||
| 0.02 | ||
| 0.05 |
Table 4.
Investment cost of components of the MSF.
| Components of MSF Unit | Cost ($) |
|---|---|
| MSF module | 300 |
| Solar collector | 850 |
| Storage tanks | 260 |
| Pumps & valves | 220 |
| Pipes | 40 |
| Structure | 300 |
Table 5.
Comparison of major parameters.
| Location | Model/Exp. | Collector Size (m2) | TBT (°C) | Capacity (m3/d) | # of Stages | Cost ($/m3) | Reference |
|---|---|---|---|---|---|---|---|
| Tianjin, China | Experiment | NA | 78 | 0.3 | 1 | 4.67 | [22] |
| Gaza | Experiment | 5.1 | NA | 0.145 | 3 | NA | [23] |
| Suez, Egypt | Model/Exp. | 2.39 | 40–67 | 0.002–0.017 | 1 | NA | [16] |
| Tamilnadu, India | Experiment | 2 | NA | 0.0085 | 1 | 9 | [24] |
| Taif, SA | Experiment | 1.92 | 70 | 0.0197 | 3 | 1.5 | This work |
Publisher’s Note: MDPI stays neutral with regard to jurisdictional claims in published maps and institutional affiliations. |
© 2021 by the author. Licensee MDPI, Basel, Switzerland. This article is an open access article distributed under the terms and conditions of the Creative Commons Attribution (CC BY) license (https://creativecommons.org/licenses/by/4.0/).
Share and Cite
MDPI and ACS Style
Alsehli, M. Experimental Validation of a Solar Powered Multistage Flash Desalination Unit with Alternate Storage Tanks. Water 2021, 13, 2143. https://doi.org/10.3390/w13162143
AMA Style
Alsehli M. Experimental Validation of a Solar Powered Multistage Flash Desalination Unit with Alternate Storage Tanks. Water. 2021; 13(16):2143. https://doi.org/10.3390/w13162143
Chicago/Turabian StyleAlsehli, Mishal. 2021. "Experimental Validation of a Solar Powered Multistage Flash Desalination Unit with Alternate Storage Tanks" Water 13, no. 16: 2143. https://doi.org/10.3390/w13162143
Note that from the first issue of 2016, this journal uses article numbers instead of page numbers. See further details here.