
Application of Multi-Criteria Decision-Making Tools for Assessing Biogas Plants: A Case Study in Reykjavik, Iceland


1
Green Engineering and Resources Group, Department of Chemistry and Process & Resources Engineering, University of Cantabria, Los Castros Avenue s/n, 39005 Santander, Spain
2
Energieinstitut an der Johannes Kepler Universität, Altenberger Strasse 69, A-4040 Linz, Austria
3
Sustainability Institute and Forum (SIF), School of Science and Engineering, Reykjavik University, Menntavegur 1, 101 Reykjavik, Iceland
*
Author to whom correspondence should be addressed.
Water 2021, 13(16), 2150; https://doi.org/10.3390/w13162150
Submission received: 30 June 2021
/
Revised: 29 July 2021
/
Accepted: 31 July 2021
/
Published: 5 August 2021
(This article belongs to the Special Issue Water and Circular Cities)
Abstract
:The European Union is planning a new program to achieve climate neutrality by 2050. In this context, the Icelandic government plans to ban new registrations of fossil fuel cars after 2030 as one of the strategies to make Iceland a carbon-neutral country by 2040. Upgraded biogas can be directly used in vehicles with CNG engines, reducing CO2 emissions by 80%. In this paper, several alternatives of biogas plants, simulated in previous research, were evaluated by considering techno-economic and environmental criteria through the application of multi-criteria decision-making tools. Twelve alternatives were analyzed using the Definite 3.1 software. A weighted summation algorithm, which transforms all criteria into the same scale by multiplying them by weights and then summing them to obtain the results, was used in the analysis. The multi-criteria analysis of the twelve proposed alternatives included eleven criteria (three technical, five economic, and three environmental) whose weights were changed in a total of eleven scenarios. From a global perspective, when all criteria were considered (9.1% weight) the best alternative with a score of 0.58 was the single-stage biogas plant working with municipal solid waste. Sensitivity and uncertainty analyses also demonstrated that the multi-criteria results obtained were robust and reliable.
1. Introduction
The EU has announced an ambitious plan to reduce GHG emissions to 80–95% below 1990 levels by 2050 [1]. In Europe, so far, much of the combined total GHG emissions reduction has come from the power and heating and cooling sectors, achieving a reduction of 23% from 1990–2014, while the transport sector emissions increased by 20.1% in the same period [2]. In the meantime, recent studies indicate that the energy demand will grow by up to 50% until 2050 and, therefore, the security of the energy supply is a crucial challenge [3].
There are several alternatives for reducing GHG emissions, among them, the EU strategy proposes intensifying the use of biomass. Processing biomass into bio-based and renewable products allows for a decrease in the consumption of non-renewable resources and boosts the circular economy [4,5]. Anaerobic digestion (AD) of organic compounds to produce biogas is a promising alternative for biomass utilization. AD is a biological process where organic matter is biodegraded under anaerobic conditions, leading to the production of biogas along with a digestate [6]. The digestate is a black-in-color by-product that can be divided into solid (SD) and liquid phases (LD). The SD can be transformed into energy through incineration, pyrolysis, gasification, or hydrothermal carbonization (HTC); composted, or used to fertilize agricultural crops. The LD contains high concentrations of nitrogen, phosphorous, and potassium and must be treated before its discharge into the environment [7,8,9]. Recent studies also used the SD in bioethanol production [10] or in construction materials such as medium density fiberboards and wood–plastic composites [11]. Biogas is made up mainly of CH4 (40–75% v/v) and CO2 (15–60% v/v) [3] together with other trace species: H2S, H2, N2, NH3, O2, and CO. Upgraded biogas can be used in various applications such as in the production of electricity, heat and steam generation in households and industry, injection into the natural gas grid, and as a vehicular fuel [12,13].
In the European Union, primary energy production from biogas has increased in the last decade from 167 PJ in 2005 to 654 PJ in 2015, with biogas volume increasing from 2.5 billion m3 in 2000 to 18 billion m3 methane equivalent in 2015, representing half of the global biogas production [14]. The gross inland energy consumption of biogas in Europe has tremendously increased since 1990 and has been multiplied by a factor of 25, reaching values of 14,079 ktoe (164 TWh) in 2019. Nevertheless, in 2019 biogas provided a marginal share of the total gross inland energy consumption of the EU27 (approx. only 1%). In addition, the total gross inland energy consumption of biogas was equivalent to around 4% of the natural gas consumed across Europe in 2019 [15]. Consequently, there is a lot of effort needed to promote biogas for a low-carbon energy transition.
The increasing interest in biogas production has been analyzed from European [16] and global perspectives [17]. In a previous work recently published by the co-authors, different AD biogas plants were simulated in Aspen Plus v10 by working with the three main feedstocks collected in the landfill of the Reykjavik capital area, operated by the waste company of SORPA, which also operates the waste management for the capital area [18]. Different AD biogas plant sizes were simulated, working with different configurations (one or two anaerobic digestion steps), feedstocks (municipal solid waste, MSW, food waste, FW, and lignocellulosic biomass (LCB)) and operation modes (co-digestion or conventional digestion). The complexity and heterogeneity of the formulated alternatives, and the significant number of parameters that resulted from the Aspen Plus model simulations, make it very difficult to establish the optimum solution considering all the stakeholders’ viewpoints. This issue can be solved by using a multi-criteria analysis (MCA) decision-making tool that can account for and evaluate multiple dimensions of impacts, based on an explicit set of criteria, in a way that facilitates the comparison of a range of alternatives in a simple manner [19,20].
The aim of this research was to decide which is the best alternative (AD biogas plant) from technical, environmental, and economic perspectives by implementing MCA in the capital area of Reykjavik. The MCA of the twelve proposed alternatives included three technical criteria (CH4:CO2 ratio, biogas yield, and methane yield); five economic criteria (capital costs, operation costs, utilities costs, equipment costs, and installed costs); and three environmental criteria (digestate generation, equivalent CO2, and amount of contaminants in the digestate). Such a study has never been completed before in Iceland, but it responds to the needs of the Climate Action Plan (CAP) for the years 2018–2030 for the Icelandic Government since methane from the biogas plants will be used as vehicular fuel. Currently, road transport is one of the biggest sources of emissions in Reykjavik [21]. On the one hand, this research contributes to the phasing out of fossil fuels in transport in Iceland. On the other hand, the digestate, which is the main byproduct generated by organic waste (after AD), serves as fertilizer, contributing to the second goal of the CAP, consisting of land restoration, revegetation, and afforestation.
2. Materials and Methods
2.1. Multi-Criteria Analysis and Weighted Summation Method
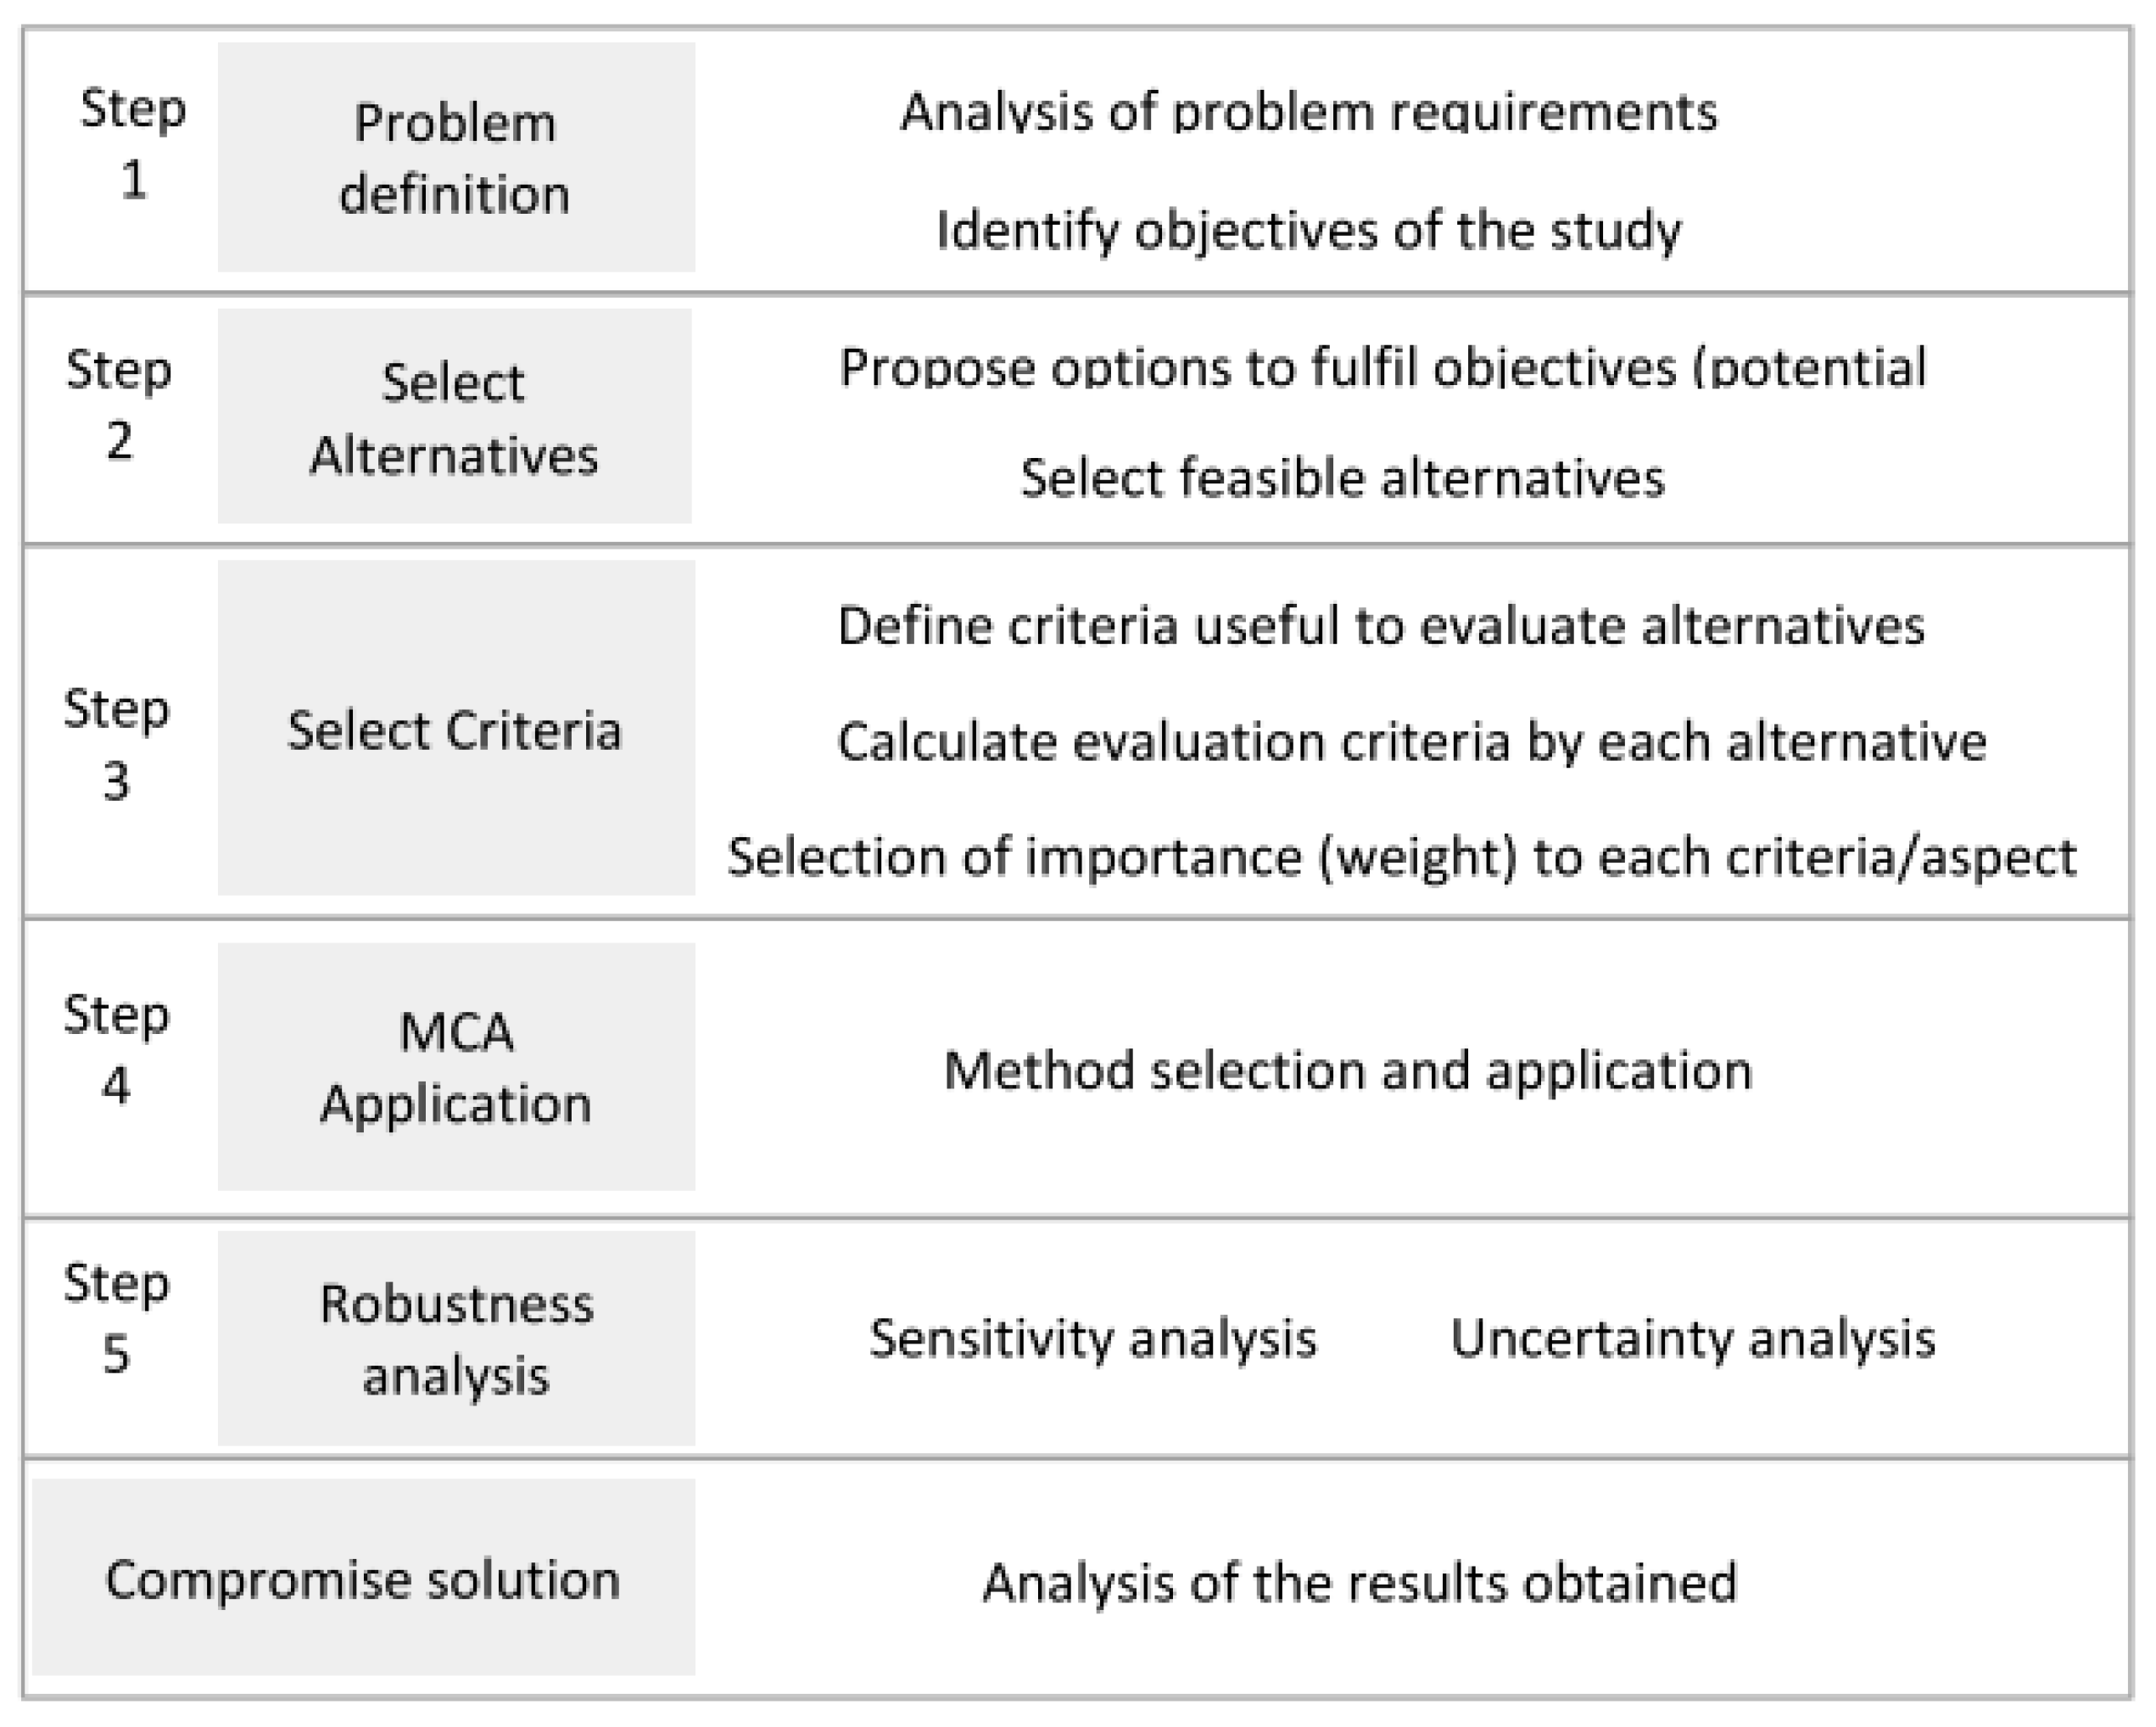
The MCA analysis was performed using the Definite 3.1 software, which included a weighted summation MCA algorithm to obtain the results [22,23]. The Definite v3.1 is a decision-making software for a finite set of alternatives developed by the SPINlab of the University of Amsterdam [24]. Weighted summation (WS) methodology, which transforms all criteria into the same scale by multiplying them by weights and then summing them to obtain the results, was used in the analysis. The main steps followed to implement the MCA methodology are summarized in Figure 1.
In this case, the method selected (step 4 of Figure 1) was weighted summation (WS). This method can be used to address problems that involve a finite and discrete set of alternatives that must be evaluated based on conflicting objectives [25]. For any given objective, one or more different attributes or criteria are used to measure the performance in relation to the objective. Impacts of all alternative options for all criteria are presented in the impact matrix. Such criteria are usually measured on different scales and therefore cannot be compared with each other directly.
The process to be followed to carry out WS can be further detailed as follows: (1) definition of the alternatives that will be compared against each other; (2) selection and definition of criteria identifying the most relevant indicators for the decision; (3) assessment of scores for each alternative by assigning values to each indicator for all the alternatives; (4) standardization of the scores to make the criteria comparable with each other; (5) weighting of criteria to assign priorities to them; (6) ranking of the alternatives. A total score for each alternative is calculated by multiplying the standardized scores with their appropriate weight, followed by summing the weighted scores of all criteria.
2.2. Anaerobic Digestion Plants
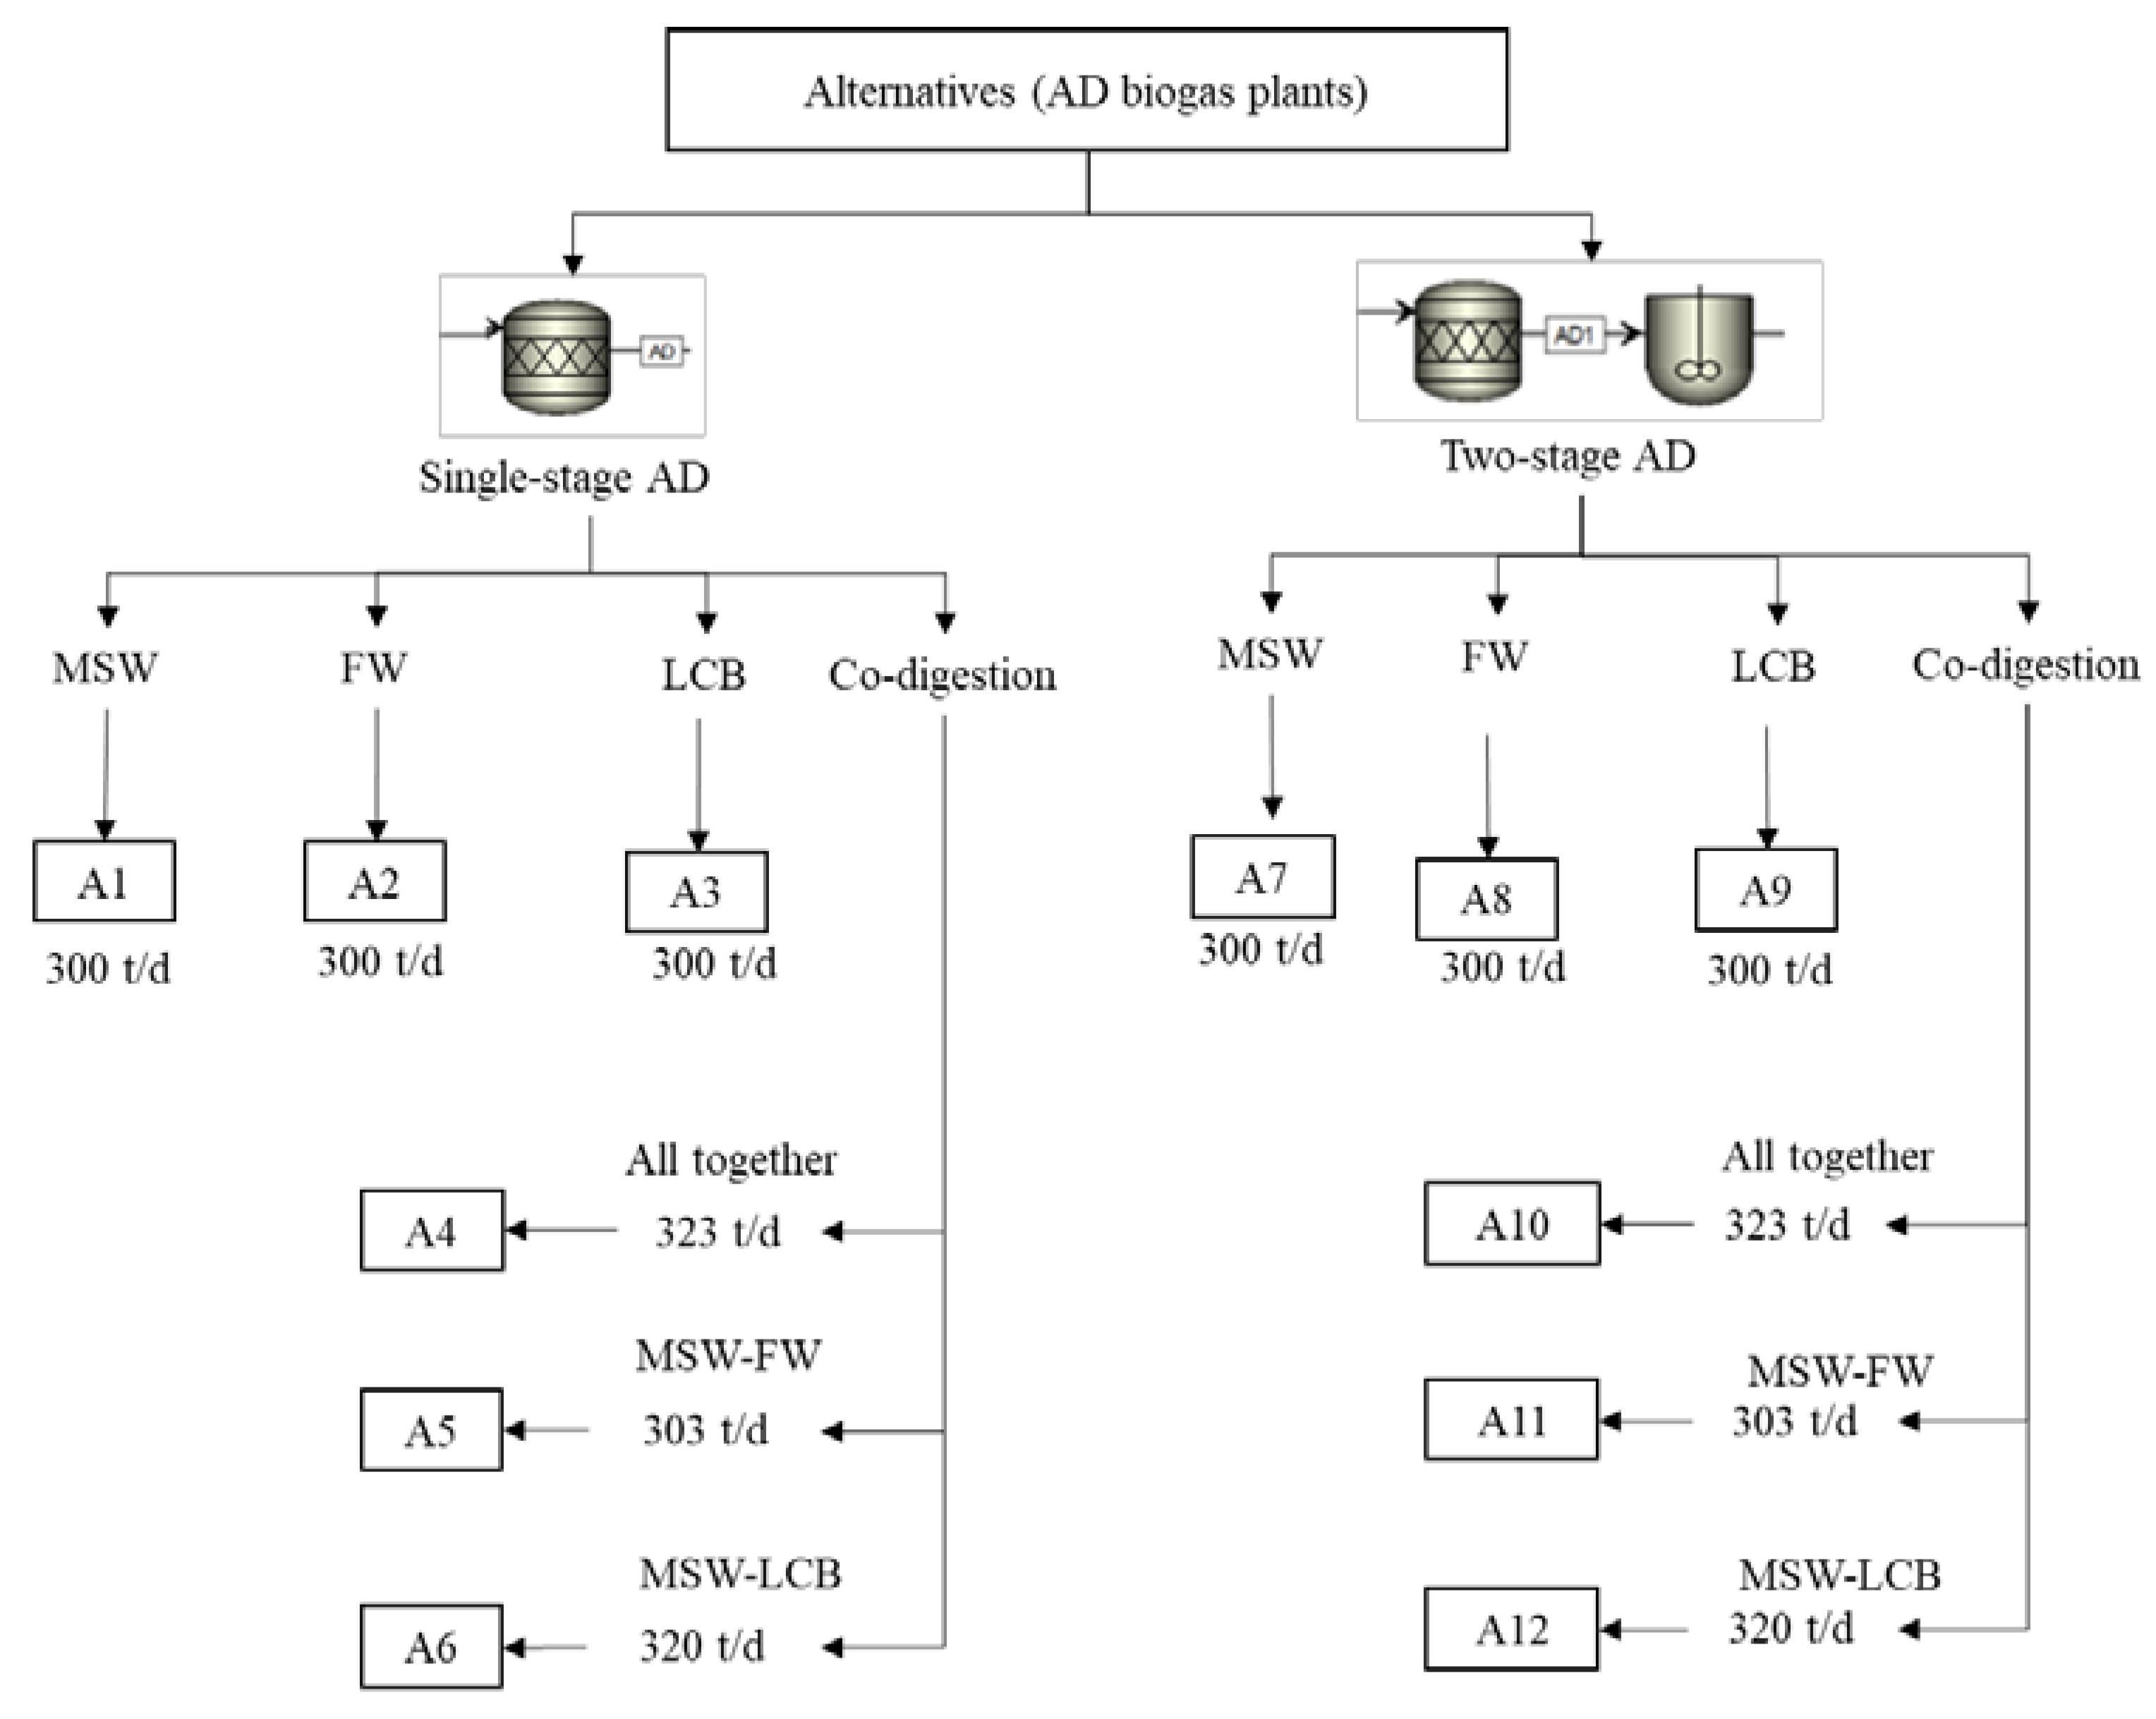
A total of twelve alternatives (biogas plants) were considered and evaluated in the MCA as shown in Figure 2. The biogas plants included three different inlet flows (300 t/d, 320 t/d, and 323 t/d) and three kinds of feedstocks (MSW, FW, and LCB), operating in single or in co-digestion. The chemical composition of the three materials was previously described and can be consulted in the literature [18].
Plant sizes and kinds of feedstocks were taken from the SORPA landfill. In a period of four years (from 2016 to 2019) the landfill collected on average 110,000 t/y of MSW, 8000 t/y of FW, and 1000 t/y of LCB. Consequently, the inlet flows of co-digestion alternatives were set at 323 t/d (all residues), 320 t/d (MSW and LCB), and 3 t/d (MSW and FW).
Two Aspen Plus model approaches (one or two anaerobic digestion steps in series) were evaluated. The AP model approaches work under thermophilic conditions of 55 °C. The single-stage AD model approach includes a total of 7 reactions based on the Nduse and Oladiran model [26]; the two-stage AD model approach considers 45 reactions and is based on the Rajendran model [27]. In this case, hydrolysis occurs in the stoichiometric reactor, whereas acidogenesis, acetogenesis, and methanogenesis occur in the continuously stirred tank reactor. All details of the AP developed models, assumptions, and considerations were fully described in a previous publication [18]. A block scheme of the alternatives (A1 to A12) is summarized in Figure 2.
2.3. Criteria Definition
To build a comprehensive evaluation dimension system, the bioenergy sector focuses on environmental, technical, economic, and social factors. Consequently, the evaluation dimensions of the present paper mainly consisted of eleven criteria divided into three categories, respectively, technical, economic, and environmental, as shown in Table 1.
The eleven criteria included in the impact matrix to perform the MCA were quantitative. The WS method requires criteria to be comparable amongst each other. Therefore, all criteria were standardized by dividing each one of them by the inlet mass flow of feedstock. Among the eleven criteria, the three technical ones were of the type “benefit”, which means that the higher the score of this effect is, the better are the alternative results. The rest of the criteria (five economic and three environmental) were of the type “cost” or in other words, the higher the score of this effect is the worse are the alternative results.
Regarding the technical criteria, the CH4:CO2 ratio gives an idea of the selectivity of the AD process and is calculated as shown in Equation (1). Biogas and methane yields are among the most important indicators of these kinds of plants. They were calculated as shown in Equations (2) and (3).
where and are the volumetric flow rate of methane and carbon dioxide in the biogas outlet stream, respectively.
where , , , and are yield of biogas, density of biogas, outlet mass flow of biogas, and inlet mass flow of feedstock, respectively.
where , , , and are yield of methane, density of methane, outlet mass flow of methane, and inlet mass flow of feedstock, respectively.
Regarding the environmental criteria, carbon emissions measured in kg of CO2 eq. per kg of inlet feedstock were determined through the Aspen Energy Analyzer (AEA). The digestate generated is the result of the bottom stream, named ‘sludge’ in the flowsheet previously published by the co-authors [18], and is obtained as an outlet stream of the flash unit, which is placed after the anaerobic digestion units. The criterion digestate contaminants (Equation (4)) considers the sum of the mass fractions of carbon dioxide, methane, ammonia, acetic acid, propionic acid, benzene, and the phenol forming part of the digestate matrix (‘sludge’ stream of the AP flowsheet). These components were selected based on their effects on atmospheric acidification, stratospheric ozone depletion, photochemical ozone (smog) formation, human health (carcinogenic) effects, aquatic oxygen demand, or ecotoxicity to aquatic life [28]. In addition, CO2 and CH4 were considered because they are GHG.
where , , , , , are the mass fractions of the previously aforementioned components considered in the digestate.
Regarding the economic criteria, all of them were determined through the Aspen Plus Economic Analyzer tool (APEA). A brief description of the fixed costs (capital, equipment, and installed costs) and variable costs (operating and utility costs) considered in the MCA is given [29]:
- Capital costs include all cost-based technical project details, including design, equipment, civil, structural, piping, mechanical, steel, instrumental, electrical, insulation, paint, labor, and management;
- Operating costs include the total raw materials costs, utility costs, operating labor costs, maintenance costs, operating charges, and plant overhead;
- Utility costs are the costs incurred by using electricity, water, heating, or waste disposal;
- Equipment costs include costs of vessels, pipelines and in general all the unit operations used in the plant;
- Installed costs are the total costs of labor and materials of the facility.
2.4. Formulated Scenarios
Once the criteria were selected, the next step in the MCA-WS methodology is to define the importance (weight) of each criterion and decide the scenarios that will be considered for evaluating the biogas plant alternatives. Such scenarios are represented in Table 2.
Table 2 summarizes the scenarios (SCE) contemplated, together with the weights assigned to each criterion and the purpose pursued in each scenario. The developed scenarios had the aim of analyzing the biogas plant alternatives not only from a global perspective, which corresponds to the SCE.11, but also from different perspectives depending on the stakeholders’ viewpoints. Thus, looking at Table 2, there is a total of four scenarios (SCE.1 to SCE.4) considering only technical criteria, three scenarios (SCE.5 to SCE.7) considering environmental criteria, three scenarios (SCE.8 to SCE.10) considering economic criteria, and the last scenario (SCE.11) combines all criteria with the same weight (9.1%).
2.5. Robustness Analysis
Weights of the criteria considered in the formulated scenarios of Section 2.4 together with the scoring values of the alternatives could contain some uncertainties. An important issue is to know how the final ranking of the alternatives is sensitive to the changes of some input parameters of the decision model. Therefore, uncertainty and sensitivity analyses were conducted. The uncertainty of input data was set to 10% and 25%. Sensitivity analysis of each criterion to determine how its weight affected the final ranking was also studied by varying weights from 0 to 100%. In addition, perspectives of the ranking alternatives at 20%, 40%, 60%, 80%, and 100% weights of three selected criteria (biogas yield, CO2 eq., and capital costs) were also checked.
3. Results and Discussion
3.1. Results of the Multi-Criteria Analysis by the Weighted Summation Method (MCA-WS)
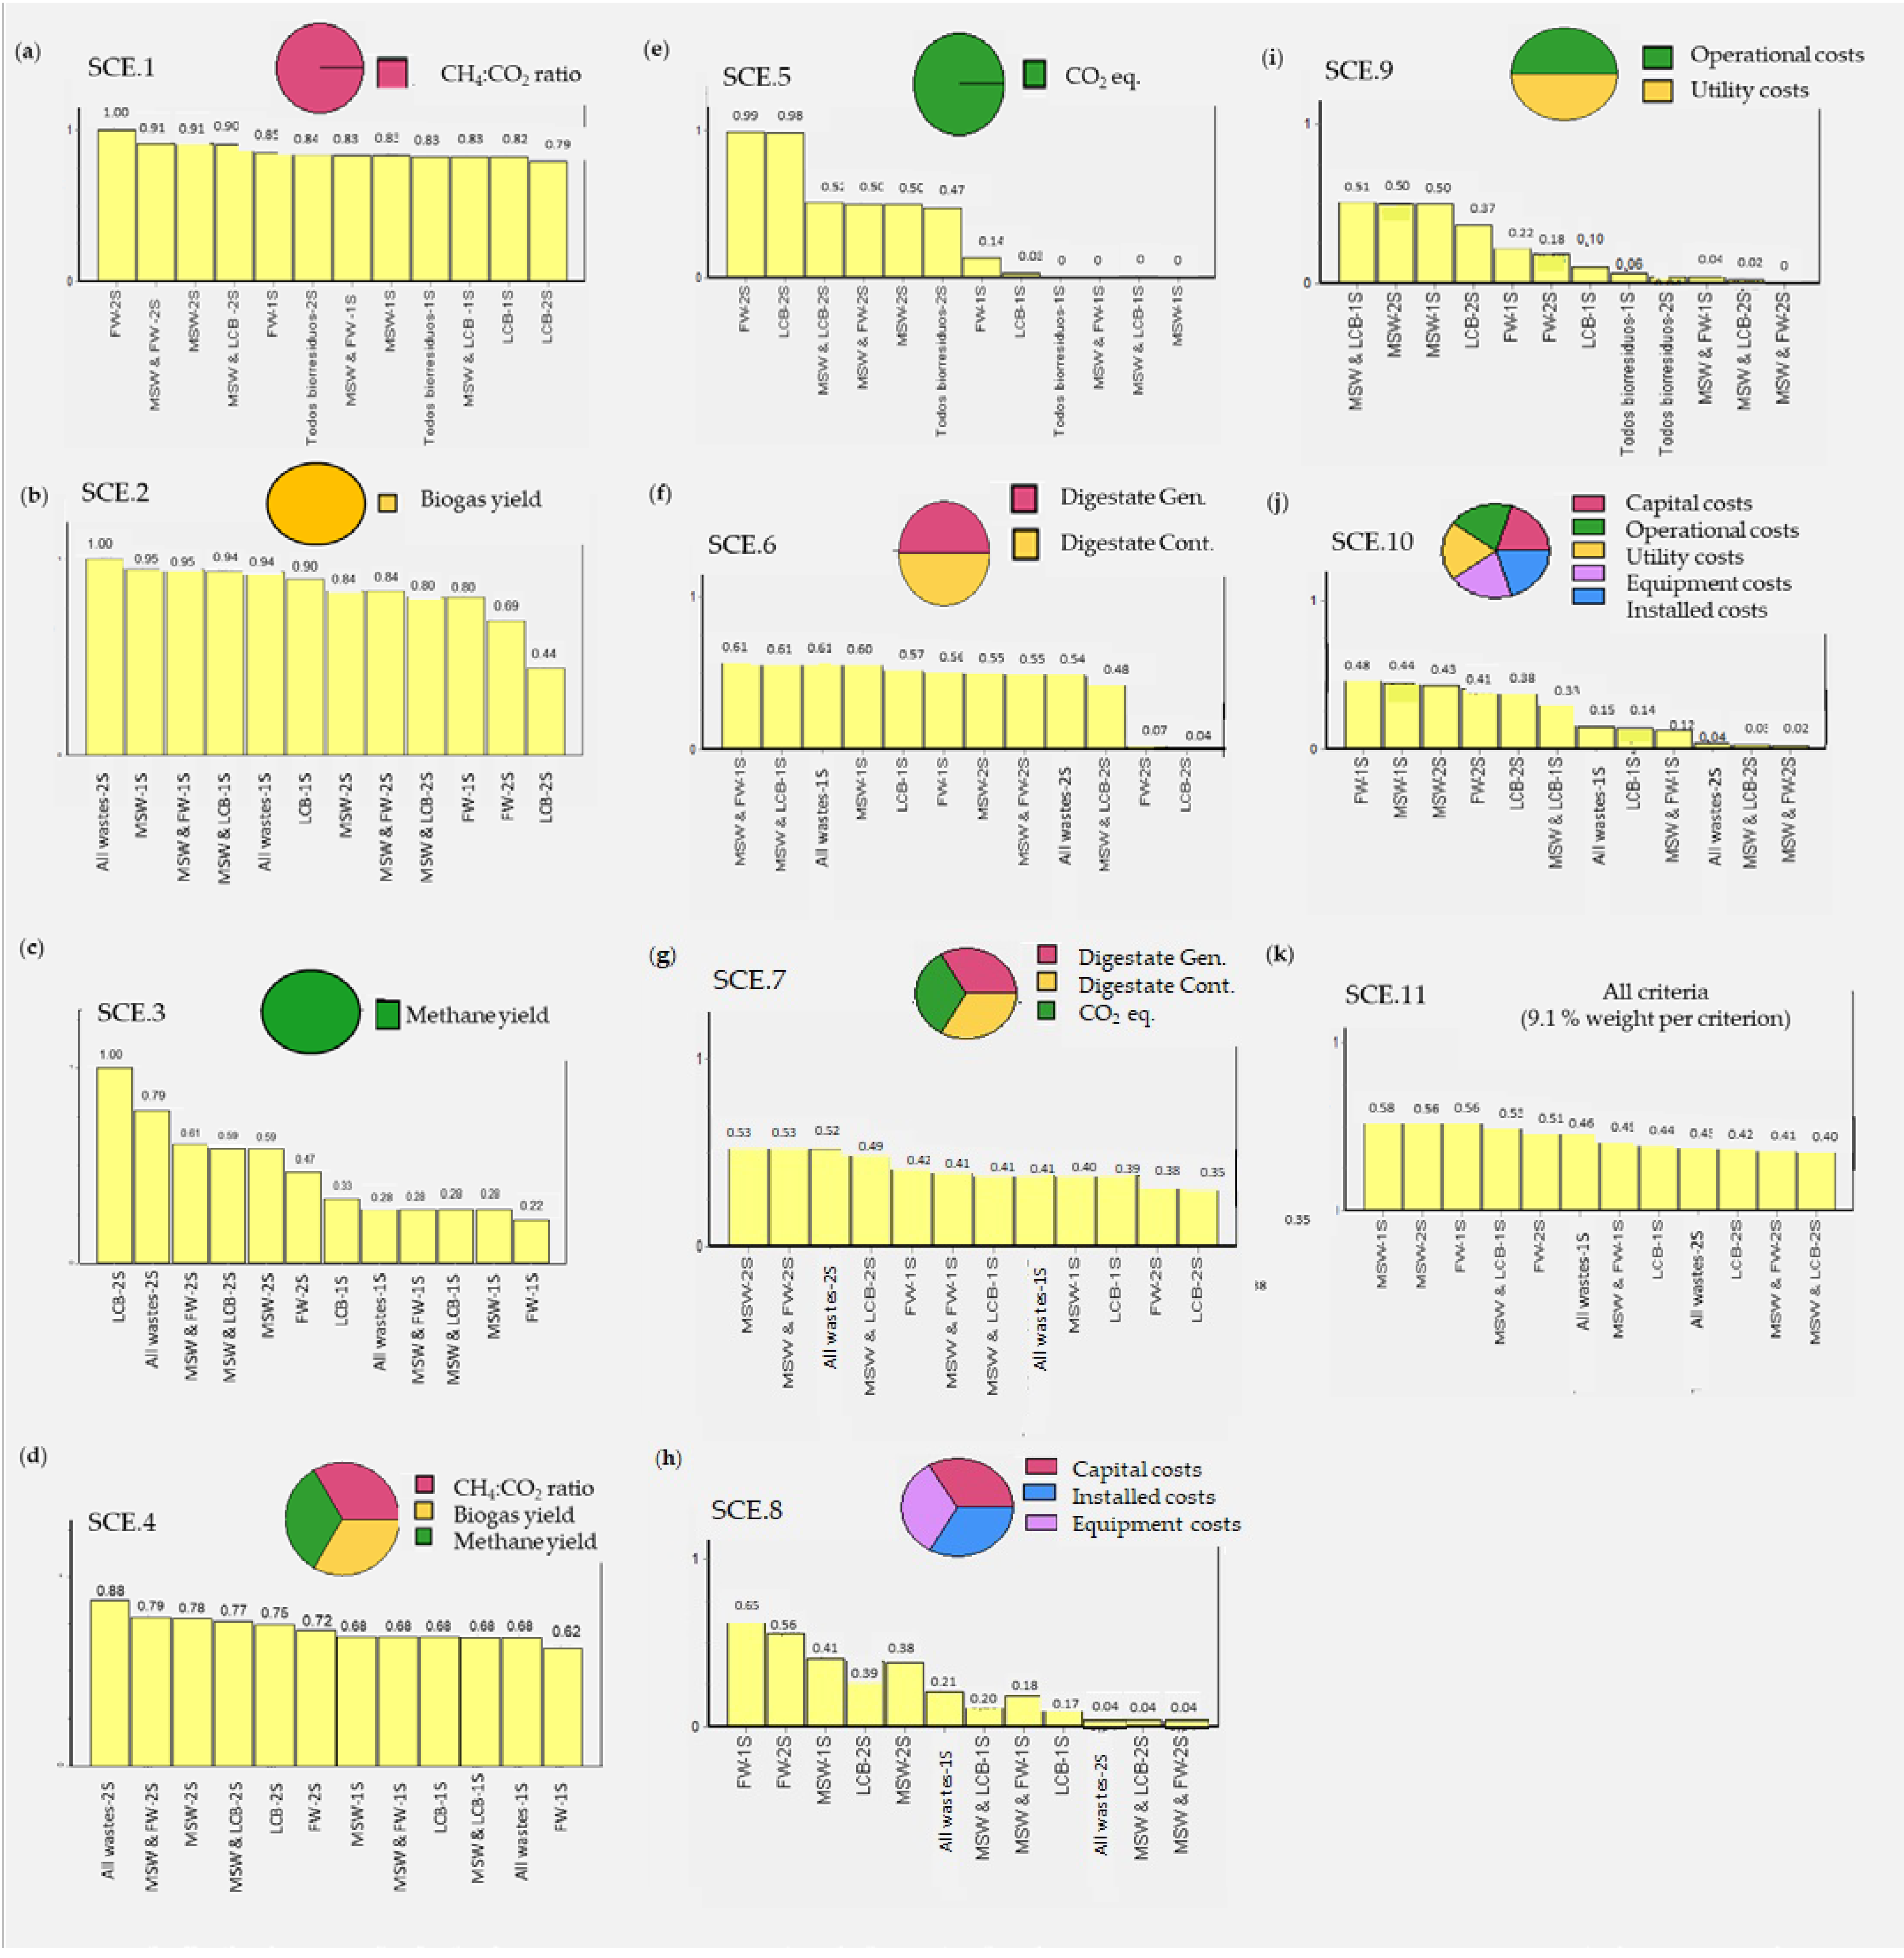
The first step to starting the MCA-WS is to build the impact matrix with all the quantitative effects. Table 3 includes each of the twelve biogas plant alternatives in the columns and the eleven quantitative criteria in the rows. The impact matrix values were introduced into the Definite software, and each of the formulated scenarios (SCE.1 to SCE.11) will be discussed. Figure 3 shows all the MCA-WS results for a given scenario. The scores are represented in bars graphs and all the alternatives are plotted in descending order. Weighting criteria distribution is represented in the circular graphs.
The technical scenarios (SCE.1 to SCE.4) plotted in Figure 3a–d show similar ranking scores. In general, two-stage AD plants showed better results except for SCE.2 (100% weight-to-criterion biogas yield). In this case the highest production of biogas occurred working in the co-digestion mode in a two-stage model, followed by in the biogas plant alternatives working in single-stage conditions. From the rest of the technical scenarios (SCE.1, SCE.3, and SCE.4) the two-stage models in mono-digestion and co-digestion modes become the best choices due to their higher CH4 presence in the biogas. The highest biogas amount under single-stage conditions was obtained by using MSW (score of 0.95) as can be seen in SCE.2 (Figure 3b) because the MSW used in the AP models contains higher amounts of carbohydrates than do FW and LCB feedstocks. In addition, the C/N ratio of MWS fits better with the 20–30 C/N ratio requirements than do those of LCB and FW [30,31]. Regarding the methane yield (SCE.3 in Figure 3c), LCB is the feedstock that obtained the highest score (1.00). Among all the feedstocks checked, LCB is the one with the most carbohydrates, and according to the bibliography, carbohydrate concentrations higher than 8.3% and proteins and lipids lower than 5.0% and 5.6%, respectively, could be an effective way for maintaining higher methane production and shorter digestion retention [32]. In line with this, the results of SCE.1, where the CH4:CO2 biogas ratio was considered, had the best score when the biogas plants worked with FW in a two-stage model, with a maximum score of 1.00 (SCE.1 in Figure 3a). The co-digestion alternatives also obtained good scores in all the formulated technical scenarios. Such behavior can be explained because co-digestion offers an improvement of the balance of nutrients and the C/N ratio, alleviation of inhibitory effects, and enhancement of methane production kinetics [33,34].
MCA results of the three environmental scenarios SCE.5, SCE.6, and SCE.7 are represented in Figure 3e,f,g, respectively. When the CO2.eq is considered with a weighing of 100% (SCE.5 in Figure 3e), all two-stage AD model approaches resulted in better scores than those of the single-stage AD model approaches. This behavior can be explained because the direct CO2 emissions in the biogas are lower in the two-stage models than they are in the single-stage models, which is in accordance with the CH4:CO2 ratios analyzed in the technical scenario SCE.1. When the two digestate criteria were evaluated with the same weight of 50% in SCE.6 (Figure 3f), the trend was the opposite of the trend observed in SCE.5. In this case, the single-stage AD model approaches achieved the best scores in the range of 0.61 and 0.56 due to all the side-reactions considered in the two-stage AD model approaches, which translated into higher mass fractions of toxic compounds in the digestate. Finally, when all the environmental criteria were evaluated with the same weights of 33.3% in SCE.7 (Figure 3g), the highest score of 0.53 was obtained in two biogas plant alternatives: MSW-2S and co-digestion of MSW and FW-2S.
MCA results of the economic scenarios SCE.8, SCE.9, and SCE.10 are plotted in Figure 3h–j. SCE.8 was formulated with the purpose of minimizing fixed costs and SCE.9 to minimize variable costs, while the last scenario, SCE.10, represented a compromise solution where all the economic criteria were considered with 20% weights. In all cases analyzed, the best scores were obtained with single-stage AD models. In the last scenario SCE.11 represented in Figure 3k, where all criteria were evaluated with 9.1% weights, the best biogas plant alternative was MSW-1S with a total score of 0.58.
3.2. Ranking MCA Results of Selected Criteria
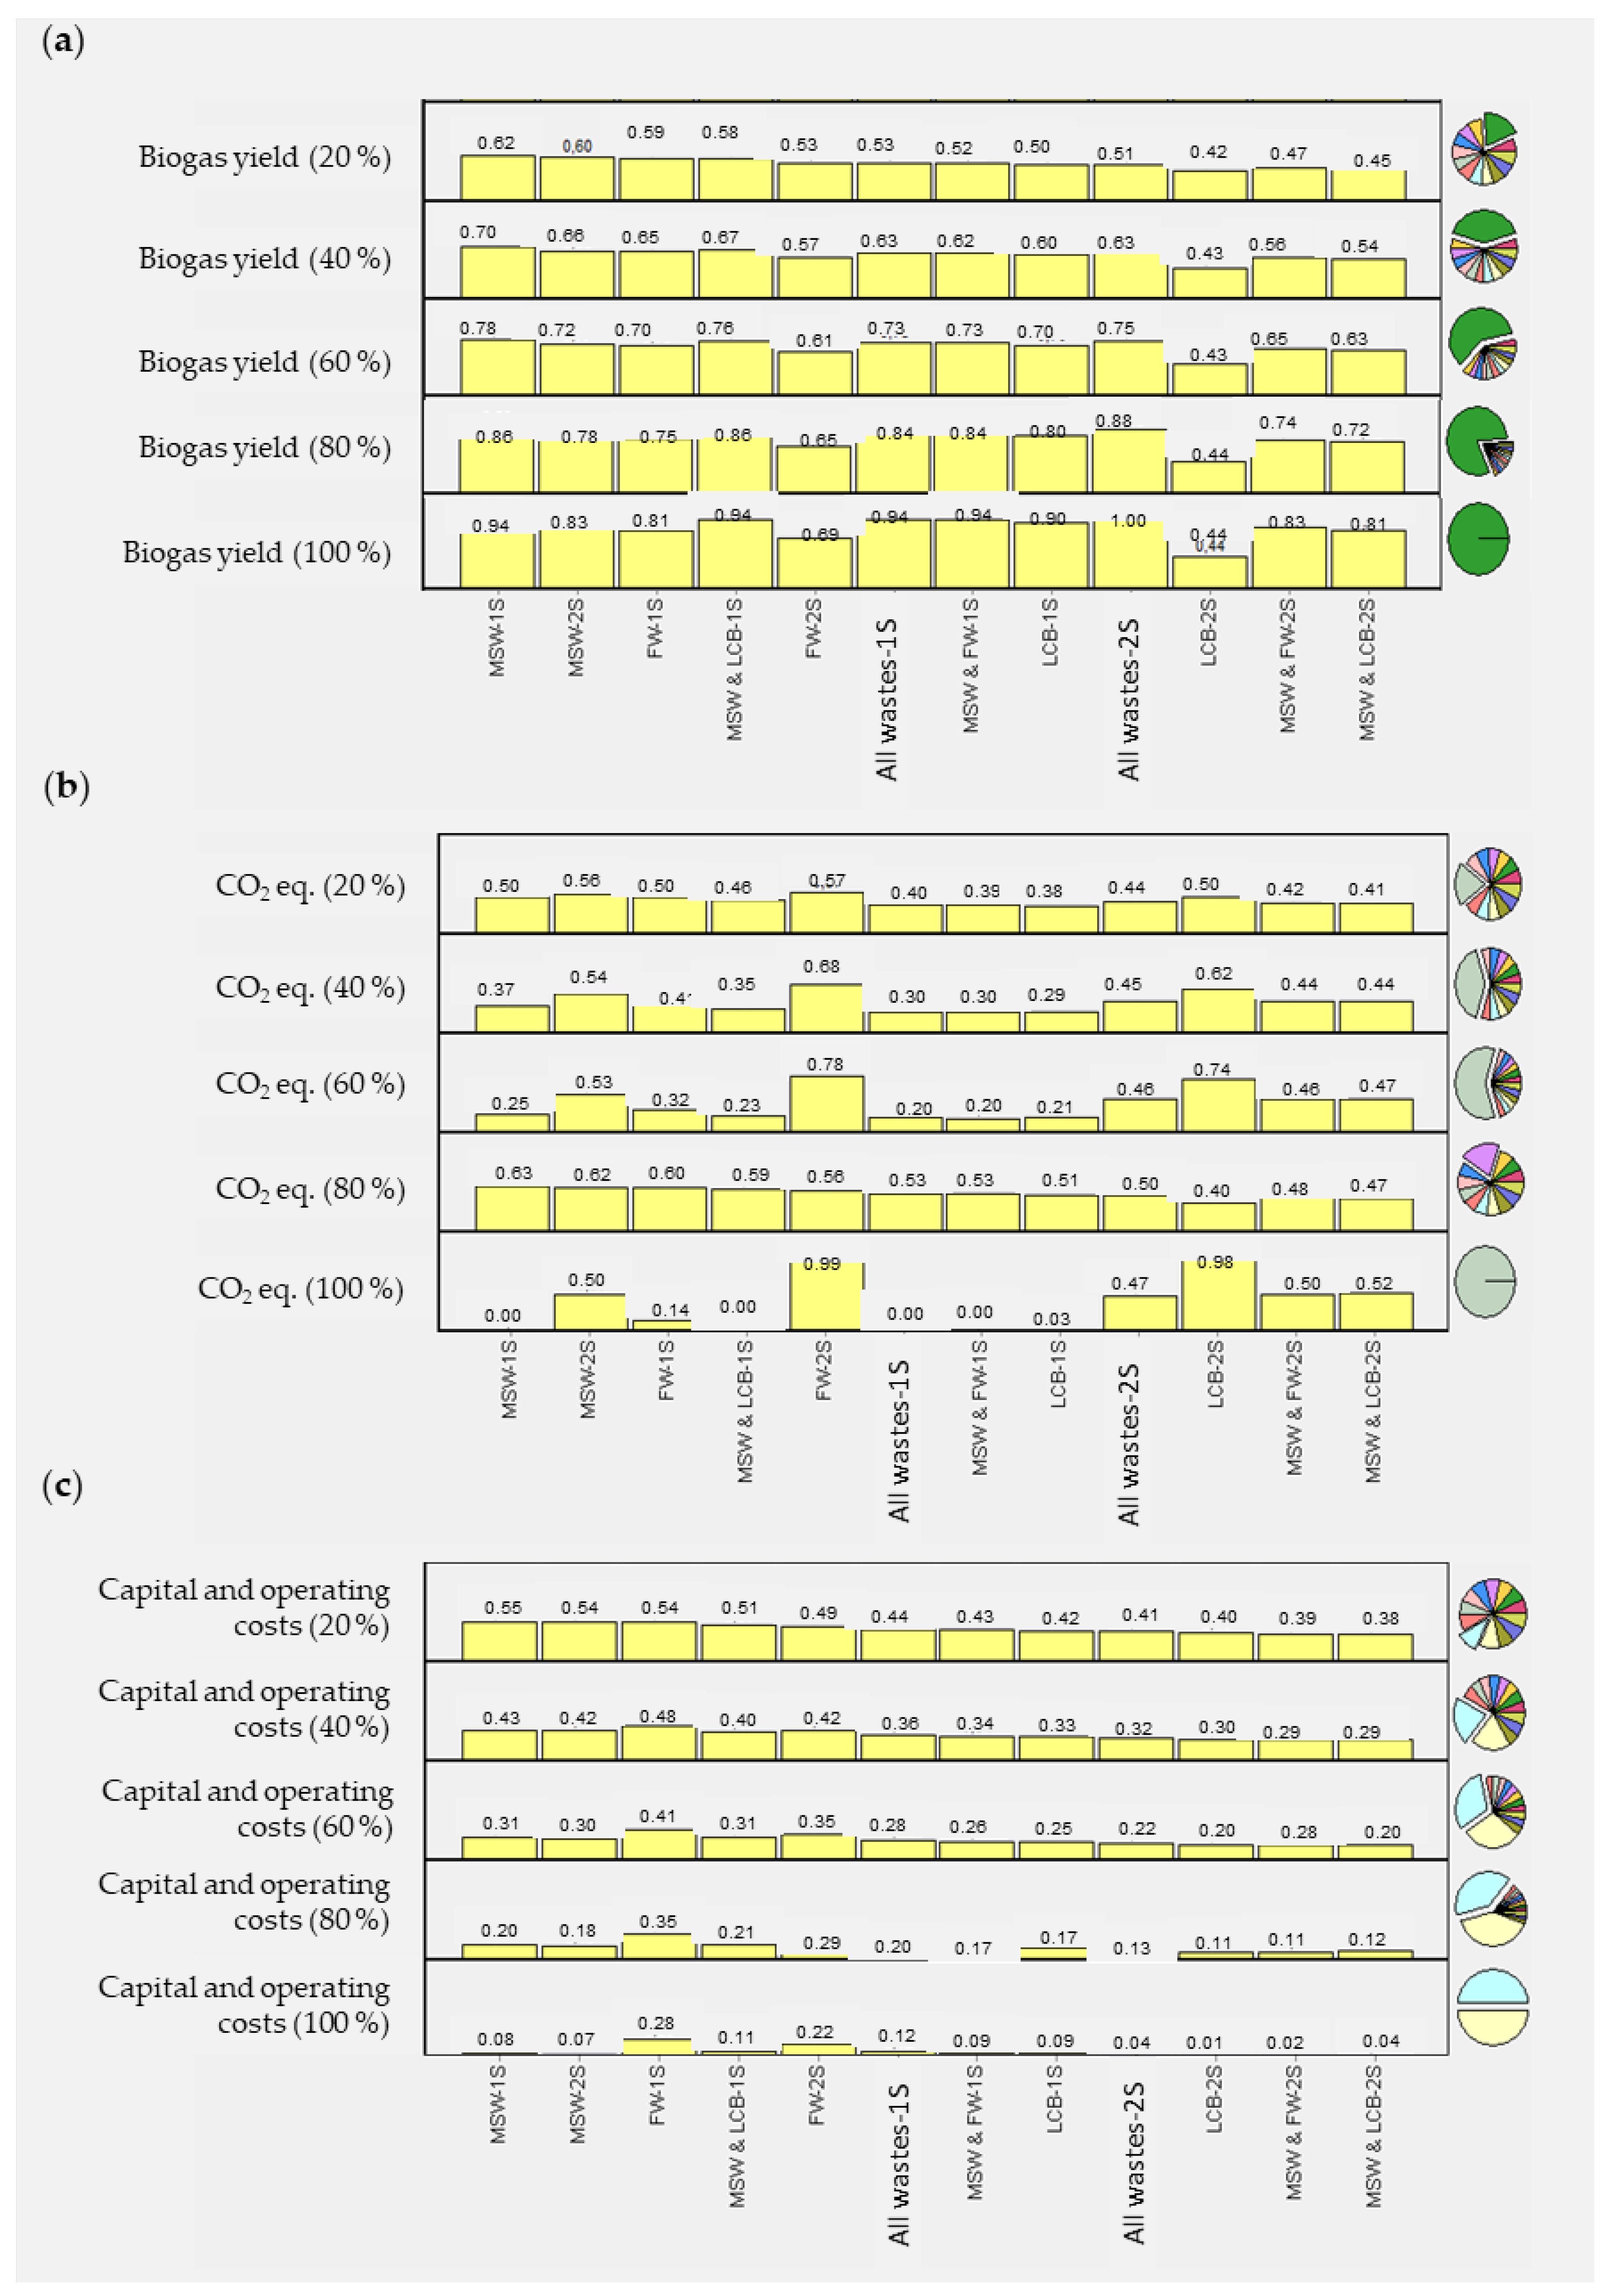
The next step was to show the perspectives of certain criteria. In this case, biogas yield (technical criterion), CO2 eq. (environmental criterion), and capital and operating costs (economic criteria) were selected.
Biogas yield was chosen because all the literature consulted agrees that it is a key parameter at any AD biogas plant [35,36,37,38].
CO2 eq. was chosen because a key point of this research was the reduction of GHG according to the Paris Agreement, and no other biogas plant alternative can fulfill this objective better.
Finally, fixed capital and variable operating costs were also studied in this section because they include the biggest expenses of the biogas plants.
Looking at the ranking scores of the biogas yield (Figure 4a), the single-stage AD plant operating with MSW seems the most adequate alternative. This trend becomes higher as the weight of this criterion increases. The scores at 20%, 40%, 60%, 80%, and 100% were 0.62, 0.70, 0.78, 0.86, and 0.94, respectively. Even though scores constantly increase, the co-digestion mode alternatives become the best choice, reaching a maximum score of 1.00 in the two-stage plant working with all wastes (MSW, FW, and LCB) at the same time. This behavior in co-digestion is in line with the literature that demonstrates how co-digestion is an effective way to enhance the digestion process for better biogas quantity and quality [30].
In the case of the ranking scores of the CO2 eq. represented in Figure 4b, two-stage mono-digestion biogas plants were shown to be the best alternative. The first choice was the FW-2S with scores of 0.57 (20% weight), 0.68 (40% weight), 0.78 (60% weight), 0.56 (80% weight), and 0.99 (100% weight). The second choice was the LCB-2S with very similar scores as those obtained by the first choice: 0.50 (20% weight), 0.62 (40% weight), 0.74 (60% weight), 0.40 (80% weight), and 0.98 (100% weight).
The best results in capital and operating costs (Figure 4c) were obtained in the single-stage AD model approaches either in mono-digestion or in co-digestion modes. In none of the scenarios did the two-stage alternatives have better results than those of the single-stage biogas plants.
3.3. Robustness Analysis
Sensitivity analysis (Figure 5 and Figure 6) assesses the influence of the weights assigned to each criterion, while uncertainty analysis (Figure 7) assesses the effect of uncertainties in the criteria scores.
A key method to determine the robustness of the findings of an MCA study is to determine how sensitive the results are to changes in the weighting factors [39]. In the previous sections, MCA-WS results from eleven scenarios, with different weights and combinations of the criteria, were discussed. Next, the effect of the weight of each criterion over the ranking score was analyzed. It is of great importance to know how the final ranking of the alternatives is sensitive to the changes of some input parameters of the decision model [22]. For this reason, the evolution of the ranking order (y-axis) with the weight distribution (x-axis) is represented in Figure 5 and Figure 6. The sensitivity analysis of the technical and environmental criteria is displayed in Figure 5; the sensitivity analysis of the economic criteria is shown in Figure 6.
In Figure 5 and Figure 6, the y-axis represents in ascending order the ranking position of the biogas plants (alternatives). The x-axis is the distribution of weights given to a specific criterion. Each line represents a biogas plant alternative. The best alternative is the one located in the highest position (i.e., in Figure 5a, the red line that corresponds to the MSW-1S alternative is the best solution when the weight of biogas yield reaches between 0 and 70%).
Looking at the technical criteria, in general, a single-stage biogas plant working with MSW (red line) seems to be the best alternative at all the weight ranges (from 0 to 100%) except for the methane yield (Figure 5c) and the CH4:CO2 ratio (Figure 5e). This trend is in line with the biogas yield ranking perspective studied in the previous section (Figure 4a). Regarding the methane yield, when this criterion weights more than 30%, the best alternative is the two-stage plant working with LCB, reaching the maximum score of 1.00 when the importance of the methane yield achieves 100%. In the case of the CH4:CO2 ratio at the beginning, when the weight of this criterion is in the range of 0 to 45%, the scores of MSW-1S, MSW-2S, and FW-1S are quite similar and these three are the best alternatives. However, when this indicator gains importance from 45 to 100% weight, FW-2S becomes the best alternative.
Regarding the environmental criteria, LCB-2S is the worst biogas plant alternative when analyzing the effect of the digestate generation (Figure 5e) and the digestate contamination (Figure 5f). This trend is the same in both criteria at all the range of weights tested in the two-stage biogas plant alternatives, due to the amount of degradation compounds and reactions considered in the two-stage model approach in comparison with those of the single-stage model. To make these alternatives more sustainable, valorization of the digestate is required. A different behavior was observed in the CO2 eq. sensitivity analysis (Figure 5f). In this case, the best choice was the FW-2S plant followed by LCB-2S. The same ranking was achieved when looking at the CO2 eq. weight given in Section 3.3 and represented in Figure 4b. Looking at the impact matrix values, the two-stage model approach has the lowest CO2 eq. emissions. This behavior is also explained by the CH4:CO2 ratio because the CO2 present in the biogas outlet streams at the two-stage biogas plants is significantly lower than that in single-stage biogas plants, whereas the CO2 present in the digestate is higher in the two-stage biogas plants. This can be explained again with the scheme of reactions considered in the two-stage plants.
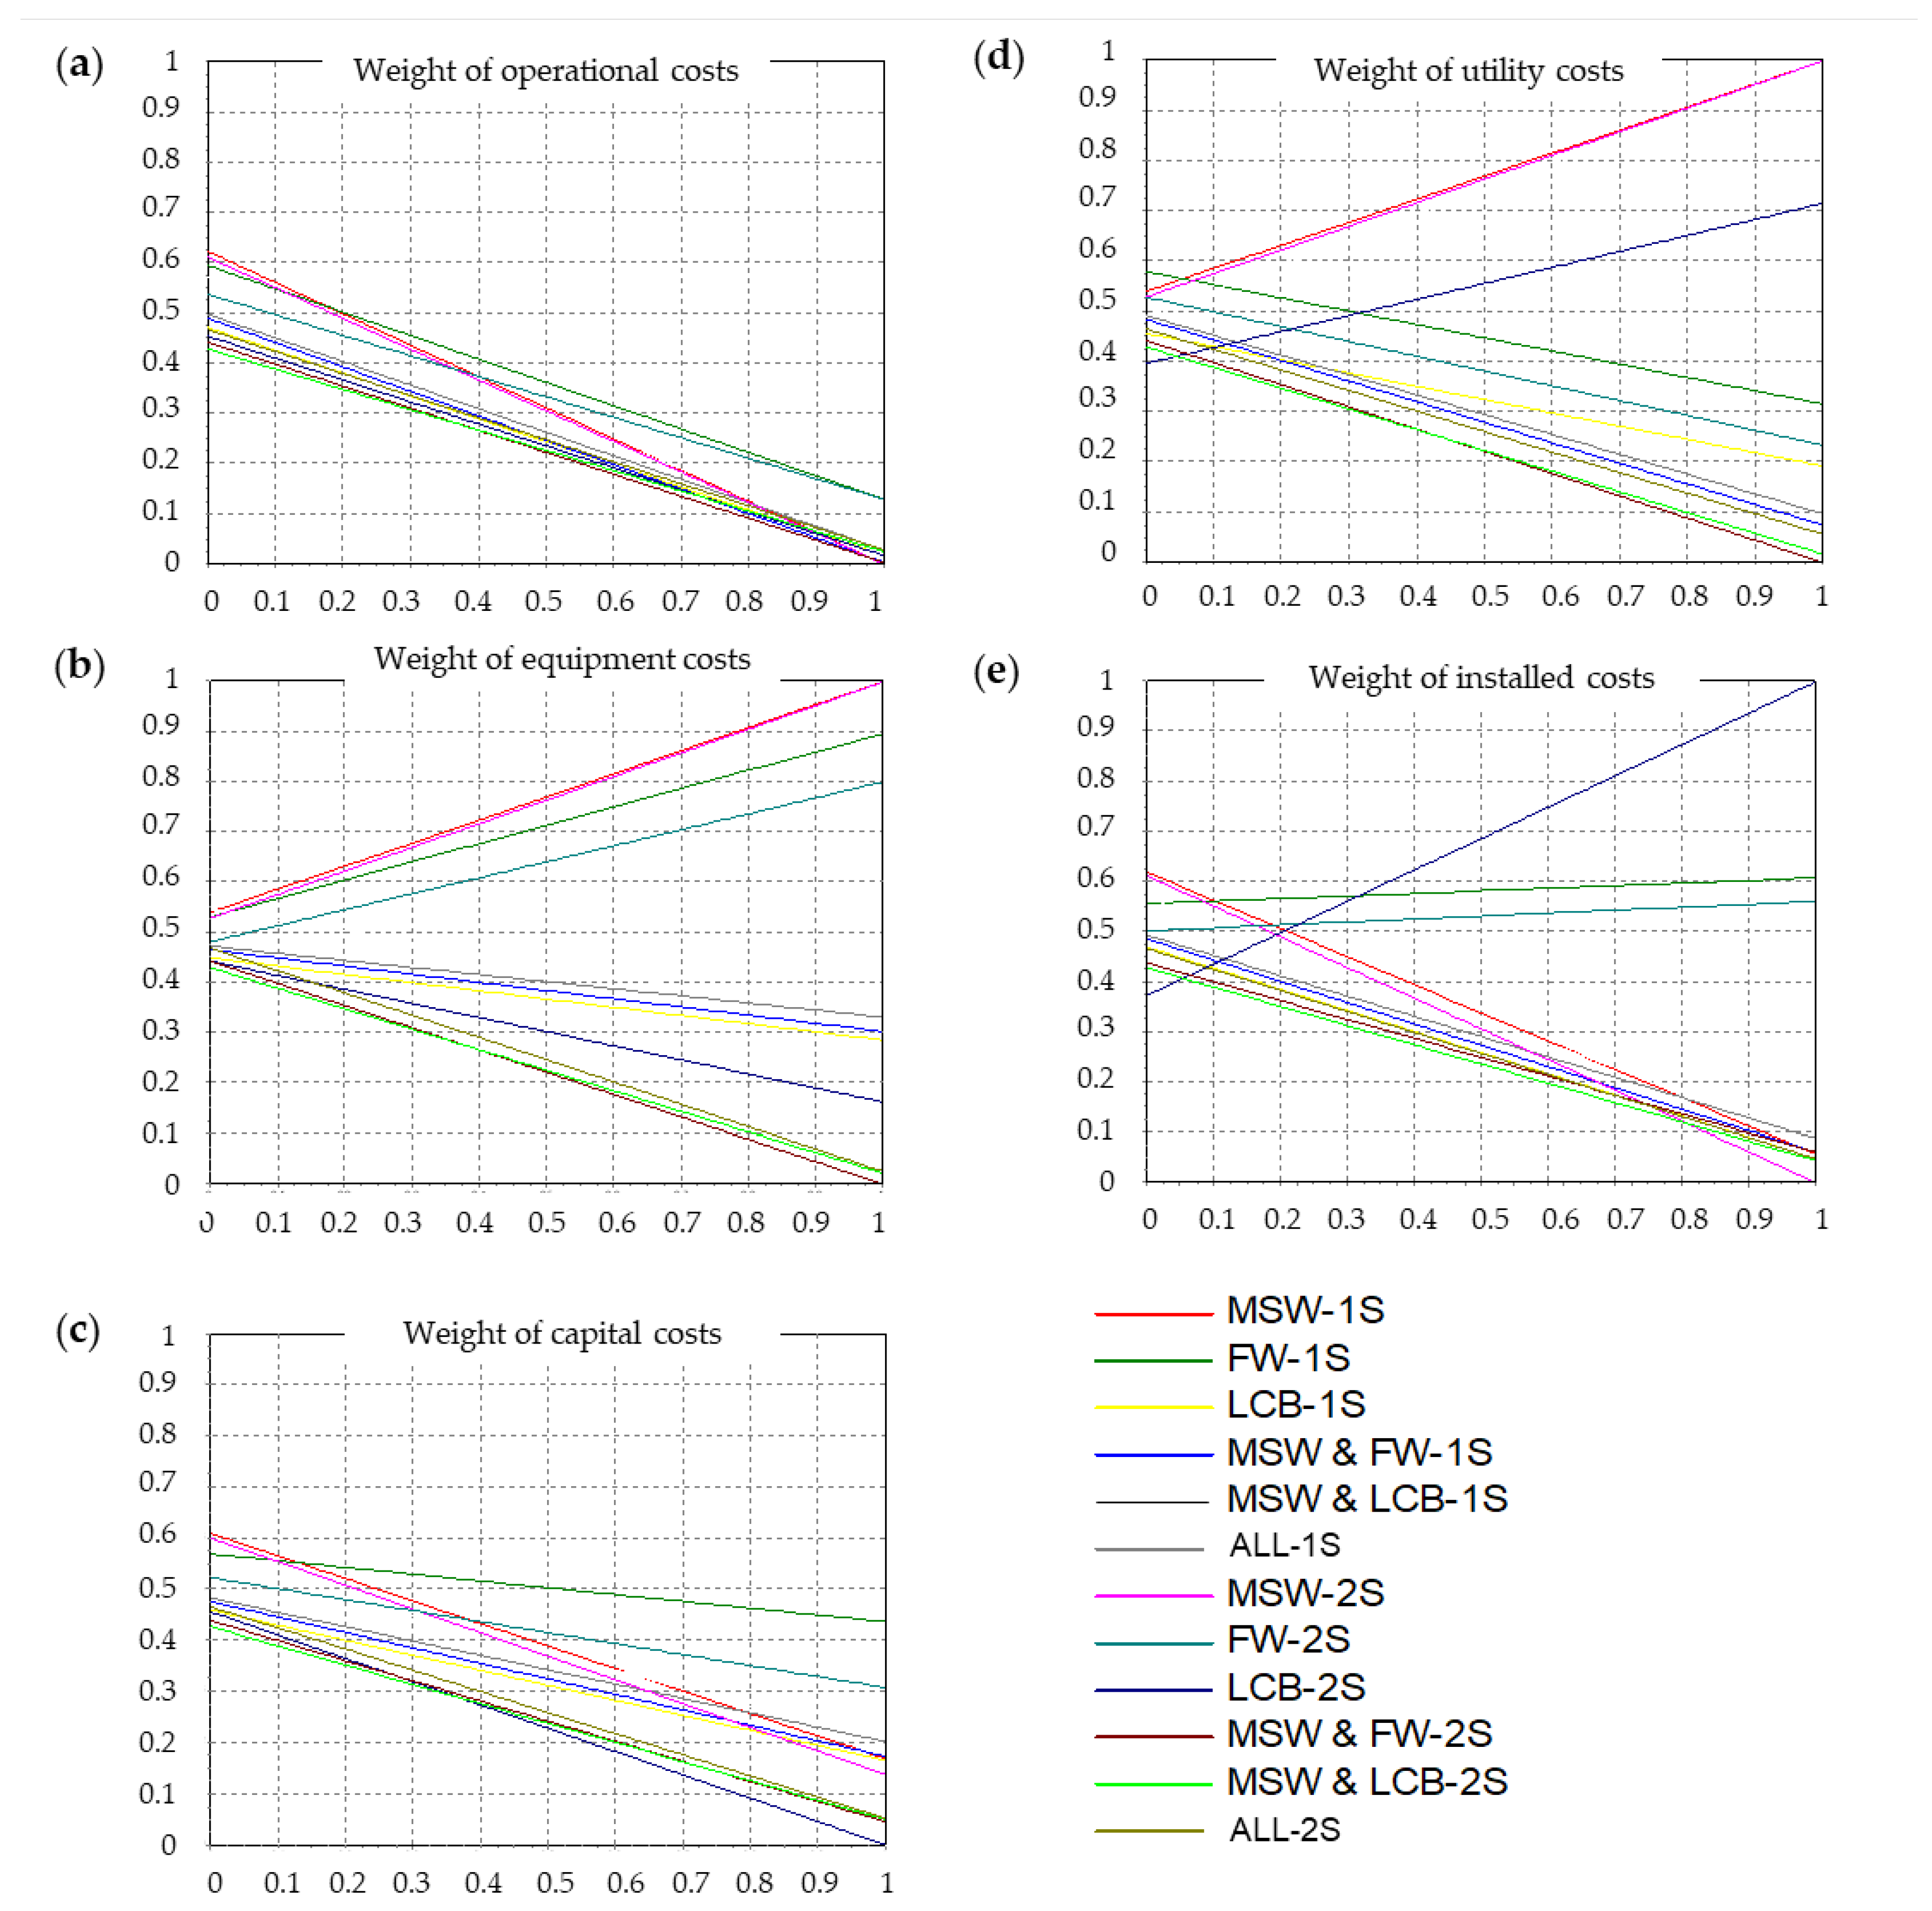
The last sensitivity analysis was carried out for the economic criteria. Looking at Figure 6, when analyzing equipment costs (Figure 6b) and utility costs (Figure 6d), the best scores at all weights were obtained by plants working with MSW. As was expected, the worst ranking positions when studying capital (Figure 6c) and operational (Figure 6a) costs were the two-stage plants due to the second reactor and all the costs derived from this issue.
In general, alternatives that use MSW in a single stage are the best biogas plants for most of the technical and economic criteria.
Results of the uncertainty analysis are plotted in Figure 7. The robustness of the MCA-WS ranking results was demonstrated by changing the impact matrix values to 10% (Figure 7a) and 25% (Figure 7b).
Biogas plants (alternatives) are represented on the y-axis, whereas the ranking position is represented on the x-axis. The size of the circles is proportional to the probability that each biogas plant alternative occupies a certain position in the rank order. The large-sized circles on the main diagonal indicate that, despite the scores deviating from the assigned values of up to 10%, the ranking hardly varied. This behavior changes in Figure 7b when the criteria values change by 25%. In this case, the biogas plant alternatives located in the second, third, eighth, ninth, and tenth ranking position might vary based on the smaller circle size in comparison with the circle size at 10% uncertainty (Figure 7a). The highest score in both analyses was the single-stage biogas plant working with MSW (first green circle) and the worst ranking position belonged to the two-stage biogas plant working in co-digestion mode with MSW and LCB (last red circle). Looking at the 25 % uncertainty analysis for all the criteria (Figure 7b), ranking positions 2, 3, 8, 9, and 10 corresponding to MSW-2S, FW-1S, LCB-1S, all wastes co-digestion 2-S, and LCB-2S, respectively, might vary. This behavior can be detected based on the smaller circle size in comparison with that of the 10% uncertainty analysis of Figure 7a. Nevertheless, the probability of changing the ranking position is still low since medium size circles prevail over small size circles.
4. Conclusions
The complexity, heterogeneity, and seasonality of the organic residues collected in the metropolitan area of Reykjavik and the significant amount of technical, economic, and environmental parameters resulting from the biogas plant simulated in Aspen Plus makes it very difficult to establish the optimum solution considering all the stakeholders’ viewpoints. Therefore, an adequate decision-making tool able to solve for these concerns was required. In this sense, MCA-WS methodology was applied to evaluate the twelve biogas plant alternatives within eleven different scenarios by using a total of eleven criteria (three technical, three environmental, and five economic criteria).
The best solution from a technical viewpoint was the anaerobic digestion biogas plant working at co-digestion in a two-stage model approach, reaching a maximum score of 0.88 when the three technical criteria were considered in SCE.4.
From an environmental perspective (SCE.5 to SCE.7) there was a dichotomy: (i) when the most important criterion was the CO2 eq., the two-stage model approaches obtained the best scores due to its lower amount of direct CO2 emissions in the biogas; (ii) when the two digestate criteria were evaluated, the three single-stage co-digestion plants alternatives obtained the best scores (three of them with the same score of 0.61) because the reaction schemes did not contemplate the by-products presented in the digestate.
From an economic perspective, all the evaluated scenarios (SCE.8 to SCE.10) presented the best results in the single-stage model approach. In general, best scores were obtained in the biogas plant using FW in a single stage, reaching scores of 0.65 (SCE.8) and 0.48 (SCE.10).
Finally, a compromise solution was obtained in the last scenario (SCE.11) where all criteria were analyzed under the same weights of 9.1%. In this case, as occurs in the technical scenarios, the best choice was the biogas plant fed with MSW in a single-stage model anaerobic digestion approach.
Author Contributions
Conceptualization, T.L. and E.D.; methodology, T.L.; software, E.D.; formal analysis, J.L.; investigation, T.L.; resources, T.L., D.C.F., and J.L.; data curation, E.D. and J.L.; writing—original draft preparation, T.L.; writing—review and editing, D.C.F.; visualization, J.L.; supervision, D.C.F.; project administration, D.C.F.; funding acquisition, T.L. All authors have read and agreed to the published version of the manuscript.
Funding
This publication is based upon work from COST Action CA17133 Circular City, supported by COST (European Cooperation in Science and Technology). www.cost.eu.
Institutional Review Board Statement
Not applicable.
Informed Consent Statement
Not applicable.
Data Availability Statement
Not applicable.
Acknowledgments
The authors acknowledge the support of the SORPA facility for providing the real data of waste management and for its interest. The authors especially appreciate the contribution of Thorleifur Thorbjornsson and Bjarni Hjardar. The authors would like to dedicate this publication to Nicolás Dacuba Llano and Natalie Elisabeth Finger, both born in July 2021.
Conflicts of Interest
The authors declare no conflict of interest.
References
- European Commission. The Roadmap for Transforming the EU into a Competitive, Low-Carbon Economy by 2050; European Commission: Brussels, Belgium, 2011. [Google Scholar]
- Hagos, D.A.; Ahlgren, E.O. Exploring cost-effective transitions to fossil independent transportation in the future energy system of Denmark. Appl. Energy 2020, 261, 114389. [Google Scholar] [CrossRef]
- Bharathiraja, B.; Sudharsana, T.; Jayamuthunagai, J.; Praveenkumar, R.; Chozhavendhan, S.; Iyyappan, J. Biogas production—A review on composition, fuel properties, feed stock and principles of anaerobic digestion. Renew. Sustain. Energy Rev. 2018, 90, 570–582. [Google Scholar] [CrossRef]
- Baena-Moreno, F.M.; Le Saché, E.; Hurd Price, C.A.; Reina, T.R.; Navarrete, B. From biogas upgrading to CO2utilization and waste recycling: A novel circular economy approach. J. CO2 Util. 2021, 47, 101496. [Google Scholar] [CrossRef]
- Kisser, J.; Wirth, M.; De Gusseme, B.; Van Eekert, M.; Zeeman, G.; Schoenborn, A.; Vinnerås, B.; Finger, D.C.; Kolbl Repinc, S.; Bulc, T.G.; et al. A review of nature-based solutions for resource recovery in cities. Blue-Green Syst. 2020, 2, 138–172. [Google Scholar] [CrossRef] [Green Version]
- Lanko, I.; Flores, L.; Garf, M.; Todt, V.; Posada, J.A.; Jenicek, P.; Ferrer, I. Life Cycle Assessment of the Mesophilic, Thermophilic, and Temperature-Phased Anaerobic Digestion of Sewage Sludge. Water 2020, 12, 3140. [Google Scholar] [CrossRef]
- Majtacz, J.; Grubba, D.; Czerwionka, K. Application of the anammox process for treatment of liquid phase digestate. Water 2020, 12, 2965. [Google Scholar] [CrossRef]
- Pawlak-Kruczek, H.; Niedzwiecki, L.; Sieradzka, M.; Mlonka-Mędrala, A.; Baranowski, M.; Serafin-Tkaczuk, M.; Magdziarz, A. Hydrothermal carbonization of agricultural and municipal solid waste digestates—Structure and energetic properties of the solid products. Fuel 2020, 275, 117837. [Google Scholar] [CrossRef]
- Aragón-Briceño, C.I.; Grasham, O.; Ross, A.B.; Dupont, V.; Camargo-Valero, M.A. Hydrothermal carbonization of sewage digestate at wastewater treatment works: Influence of solid loading on characteristics of hydrochar, process water and plant energetics. Renew. Energy 2020, 157, 959–973. [Google Scholar] [CrossRef]
- Cheng, F.; Brewer, C.E. Conversion of protein-rich lignocellulosic wastes to bio-energy: Review and recommendations for hydrolysis + fermentation and anaerobic digestion. Renew. Sustain. Energy Rev. 2021, 146, 111167. [Google Scholar] [CrossRef]
- Rigby, H.; Smith, S.R. New Markets for Digestate from Anaerobic Digestion; Imperial College of London: London, UK, 2011. [Google Scholar]
- Ullah Khan, I.; Hafiz Dzarfan Othman, M.; Hashim, H.; Matsuura, T.; Ismail, A.F.; Rezaei-DashtArzhandi, M.; Wan Azelee, I. Biogas as a renewable energy fuel—A review of biogas upgrading, utilisation and storage. Energy Convers. Manag. 2017, 150, 277–294. [Google Scholar] [CrossRef]
- Finger, D.C.; Saevarsdottir, G.; Svavarsson, H.G.; Björnsdóttir, B.; Arason, S.; Böhme, L. Improved Value Generation from Residual Resources in Iceland: The First Step Towards a Circular Economy. Circ. Econ. Sustain. 2021. [Google Scholar] [CrossRef]
- Scarlat, N.; Dallemand, J.F.; Fahl, F. Biogas: Developments and perspectives in Europe. Renew. Energy 2018, 129, 457–472. [Google Scholar] [CrossRef]
- Calderón, C.; Avagianos, I.; Jossart, J.-M. Bioenergy Europe Statistical Report-Biogas; Bioenergy Europe: Brussels, Belgium, 2021. [Google Scholar]
- Malinauskaite, J.; Jouhara, H.; Czajczyńska, D.; Stanchev, P.; Katsou, E.; Rostkowski, P.; Thorne, R.J.; Colón, J.; Ponsá, S.; Al-Mansour, F.; et al. Municipal solid waste management and waste-to-energy in the context of a circular economy and energy recycling in Europe. Energy 2017, 141, 2013–2044. [Google Scholar] [CrossRef]
- Vasco-Correa, J.; Khanal, S.; Manandhar, A.; Shah, A. Anaerobic digestion for bioenergy production: Global status, environmental and techno-economic implications, and government policies. Bioresour. Technol. 2018, 247, 1015–1026. [Google Scholar] [CrossRef] [PubMed]
- Llano, T.; Arce, C.; Finger, D.C. Optimization of biogas production through anaerobic digestion of municipal solid waste: A case study in the capital area of Reykjavik, Iceland. J. Chem. Technol. Biotechnol. 2021, 96, 1333–1344. [Google Scholar] [CrossRef]
- Iacovidou, E.; Voulvoulis, N. A multi-criteria sustainability assessment framework: Development and application in comparing two food waste management options using a UK region as a case study. Environ. Sci. Pollut. Res. 2018, 25, 35821–35834. [Google Scholar] [CrossRef] [PubMed] [Green Version]
- Billig, E.; Thraen, D. Renewable methane—A technology evaluation by multi-criteria decision making from a European perspective. Energy 2017, 139, 468–484. [Google Scholar] [CrossRef]
- Ministry for the Environment and Natural Resources. Iceland’s Climate Action Plan for 2018–2030; Ministry for the Environment and Natural Resources: Reykjavik, Iceland, 2018. [Google Scholar]
- Dosal, E.; Coronado, M.; Muñoz, I.; Viguri, J.R.; Andrés, A. Application of Multi-Criteria decision-making tool to locate construction and demolition waste (C&DW) recycling facilities in a northern Spanish region. Environ. Eng. Manag. J. 2012, 11, 545–556. [Google Scholar] [CrossRef]
- Dosal, E. Towards and Improved Framework for Construction and Demolition Waste Management (C&DW) Using Decision Support Tools. Ph.D. Thesis, University of Cantabria, Santander, Spain, 2015. [Google Scholar]
- Definite: Decision making software for a finite set of alternatives. VU Univeristy of Amsterdam. Spatial Information Laboratory (SPINLAB). Available online: https://spinlab.vu.nl/support/tools/definite-bosda/ (accessed on 14 June 2021).
- Beinat, E.; Nijkamp, P. (Eds.) Multicriteria Analysis for Land-Use Management, 1st ed.; Springer: Berlin/Heidelberg, Germany, 1998; ISBN 978-0792351986. [Google Scholar]
- Nduse, R.; Oladiran, T.M. Simulation of a co-digester plant using aspen plus. In Proceedings of the 5th IASTED International Conference on Power and Energy Systems, AfricaPES, Gaborone, Botswana, 5–7 September 2016; pp. 325–332. [Google Scholar] [CrossRef] [Green Version]
- Rajendran, K.; Kankanala, H.R.; Lundin, M.; Taherzadeh, M.J. A novel process simulation model (PSM) for anaerobic digestion using Aspen Plus. Bioresour. Technol. 2014, 168, 7–13. [Google Scholar] [CrossRef] [Green Version]
- Azapagic, A.; Howard, A.; Parfitt, A.; Tallis, B.; Duff, C.; Hadfield, C.; Pritchard, C.; Gillet, J.; Hackitt, J.; Seaman, M.; et al. The Sustainability Metrics: Sustainable Sevelopment Progress Metrics Recommended for Use in the Process Industries; Institution of Chemical Engineers: Warwickshire, UK, 2002. [Google Scholar]
- Al-Malah, K.I.M. ASPEN PLUS® Chemical Engineering Applications; John Wiley & Sons, Inc.: Hoboken, NJ, USA, 2017; Volume 1, ISBN 9788578110796. [Google Scholar]
- Ghaleb, A.A.S.; Kutty, S.R.M.; Salih, G.H.A.; Jagaba, A.H.; Noor, A.; Kumar, V.; Almahbashi, N.M.Y.; Saeed, A.A.H.; Saleh Al-dhawi, B.N. Sugarcane bagasse as a co-substrate with oil-refinery biological sludge for biogas production using batch mesophilic anaerobic co-digestion technology: Effect of carbon/nitrogen ratio. Water 2021, 13, 590. [Google Scholar] [CrossRef]
- Cerón-Vivas, A.; Cáceres, K.T.; Rincón, A.; Cajigas, A. Influence of pH and the C/N ratio on the biogas production of wastewater. Rev. Fac. Ing. 2019, 88–95. [Google Scholar] [CrossRef]
- Li, Y.; Jin, Y.; Borrion, A.; Li, H.; Li, J. Effects of organic composition on mesophilic anaerobic digestion of food waste. Bioresour. Technol. 2017, 244, 213–224. [Google Scholar] [CrossRef] [PubMed]
- Xie, S.; Hai, F.I.; Zhan, X.; Guo, W.; Ngo, H.H.; Price, W.E.; Nghiem, L.D. Anaerobic co-digestion: A critical review of mathematical modelling for performance optimization. Bioresour. Technol. 2016, 222, 498–512. [Google Scholar] [CrossRef] [PubMed]
- Fagbohungbe, M.O.; Herbert, B.M.J.; Hurst, L.; Ibeto, C.N.; Li, H.; Usmani, S.Q.; Semple, K.T. The challenges of anaerobic digestion and the role of biochar in optimizing anaerobic digestion. Waste Manag. 2017, 61, 236–249. [Google Scholar] [CrossRef] [PubMed] [Green Version]
- Spyridonidis, A.; Vasiliadou, I.A.; Akratos, C.S.; Stamatelatou, K. Performance of a full-scale biogas plant operation in greece and its impact on the circular economy. Water 2020, 12, 3074. [Google Scholar] [CrossRef]
- Nsair, A.; Cinar, S.O.; Alassali, A.; Qdais, H.A.; Kuchta, K. Operational Parameters of Biogas Plants: A Review and Evaluation Study. Energies 2020, 13, 3761. [Google Scholar] [CrossRef]
- Al-Zuahiri, F.; Pirozzi, D.; Ausiello, A.; Florio, C.; Turco, M.; Micoli, L.; Zuccaro, G.; Toscano, G. Biogas production from solid state anaerobic digestion for municipal solid waste. Chem. Eng. Trans. 2015, 43, 2407–2412. [Google Scholar] [CrossRef]
- Mohamed Ashik Ali, J.; Mohan, S.; Velayutham, T.; Sankaran, S. Comparative Study of Biogas Production from Municipal Solid Waste using Different Innoculum Concentration on Batch Anaerobic Digestion. Asian J. Eng. Technol. 2016, 4, 59–65. [Google Scholar]
- Hanan, D.; Burnley, S.; Cooke, D. A multi-criteria decision analysis assessment of waste paper management options. Waste Manag. 2013, 33, 566–573. [Google Scholar] [CrossRef]
Figure 1.
Typical steps included in MCA methodology [23]. Reproduced with permission from Elena Dosal, Doctoral thesis “Towards and improved framework for construction and demolition waste management (C&DW) using decision support tools”, 2015.
Figure 1.
Typical steps included in MCA methodology [23]. Reproduced with permission from Elena Dosal, Doctoral thesis “Towards and improved framework for construction and demolition waste management (C&DW) using decision support tools”, 2015.

Figure 2.
Biogas AD plants simulated in Aspen Plus: Alternatives evaluated through MCA.

Figure 3.
MCA-WS ranking results for the biogas plant alternatives under the formulated scenarios: (a) SCE.1; (b) SCE.2; (c) SCE.3; (d) SCE.4; (e) SCE.5; (f) SCE.6; (g) SCE.7; (h) SCE.8; (i) SCE.9; (j) SCE.10; (k) SCE.11.
Figure 3.
MCA-WS ranking results for the biogas plant alternatives under the formulated scenarios: (a) SCE.1; (b) SCE.2; (c) SCE.3; (d) SCE.4; (e) SCE.5; (f) SCE.6; (g) SCE.7; (h) SCE.8; (i) SCE.9; (j) SCE.10; (k) SCE.11.

Figure 4.
Ranking scores of the biogas plant alternatives from three main perspectives: (a) varying the biogas yield from 20% to 100%; (b) varying the CO2 eq. from 20 % to 100 %; (c) varying capital and operating costs from 20% to 100%.
Figure 4.
Ranking scores of the biogas plant alternatives from three main perspectives: (a) varying the biogas yield from 20% to 100%; (b) varying the CO2 eq. from 20 % to 100 %; (c) varying capital and operating costs from 20% to 100%.

Figure 5.
Sensitivity analysis of the ranking of the biogas plant alternatives to the weightings of the criteria: (a) biogas yield; (b) CH4:CO2 ratio; (c) methane yield; (d) CO2 eq.; (e); digestate generated; (f) digestate contaminants.
Figure 5.
Sensitivity analysis of the ranking of the biogas plant alternatives to the weightings of the criteria: (a) biogas yield; (b) CH4:CO2 ratio; (c) methane yield; (d) CO2 eq.; (e); digestate generated; (f) digestate contaminants.

Figure 6.
Sensitivity analysis of the ranking of the biogas plant alternatives to the weightings of the criteria: (a) operating costs; (b) equipment costs; (c) capital costs; (d) utility costs; (e) installed costs.
Figure 6.
Sensitivity analysis of the ranking of the biogas plant alternatives to the weightings of the criteria: (a) operating costs; (b) equipment costs; (c) capital costs; (d) utility costs; (e) installed costs.

Figure 7.
Influence of criteria scores in the ranking of the biogas plant alternatives: (a) with 10% uncertainty for all the criteria; (b) with 25% uncertainty for all the criteria.
Figure 7.
Influence of criteria scores in the ranking of the biogas plant alternatives: (a) with 10% uncertainty for all the criteria; (b) with 25% uncertainty for all the criteria.


Table 1.
Set of criteria considered in this case study.
| Criterion N | Criterion Name | Units | Indicator | Cost/Benefit | Category |
|---|---|---|---|---|---|
| C1 | CH4:CO2 ratio | v/v | quantitative | benefit | technical |
| C2 | Biogas yield | m3/kg | quantitative | benefit | technical |
| C3 | Methane yield | m3/kg | quantitative | benefit | technical |
| C4 | Digestate generated | t/t | quantitative | cost | environmental |
| C5 | CO2 eq. | kg/kg | quantitative | cost | environmental |
| C6 | Digestate contaminants | - | quantitative | cost | environmental |
| C7 | Capital costs | USD/t | quantitative | cost | economic |
| C8 | Operating costs | USD/y·t | quantitative | cost | economic |
| C9 | Utility costs | USD/y·t | quantitative | cost | economic |
| C10 | Equipment costs | USD/t | quantitative | cost | economic |
| C11 | Installed costs | USD/t | quantitative | cost | economic |
Table 2.
Proposed scenarios evaluated through MCA-WS.
| Scenarios | Criteria Weights Distribution | Purpose |
|---|---|---|
| SCE.1 | 100% CH4:CO2 ratio | Biogas quality |
| SCE.2 | 100% biogas yield | Biogas production |
| SCE.3 | 100% methane yield | Methane production |
| SCE.4 | 33.3% three technical criteria | Full technical compromise solution |
| SCE.5 | 100% CO2 eq. emissions | Minimization of GHG |
| SCE.6 | 50% digestate generation and toxicity | Load and quality of digestate |
| SCE.7 | 33.3% three environmental criteria | Full environmental compromise solution |
| SCE.8 | 33.3% capital, equipment, and installed costs | Fixed costs minimization |
| SCE.9 | 50% operating and utility costs | Variable costs minimization |
| SCE.10 | 20% five economic criteria | Full economic compromise solution |
| SCE.11 | 9.1% all criteria | Techno-economic and environmental solution |
Table 3.
Impact matrix for the MCA of the biogas plant alternatives introduced in the Definite software.
Table 3.
Impact matrix for the MCA of the biogas plant alternatives introduced in the Definite software.
| Criteria | Single-Stage Biogas Plant Alternatives | Two-Stage Biogas Plant Alternatives | ||||||||||
|---|---|---|---|---|---|---|---|---|---|---|---|---|
| MSW | FW | LCB | MSW and FW | MSW and LCB | All Wastes | MSW | FW | LCB | MSW and FW | MSW and LCB | All Wastes | |
| CH4:CO2 ratio | 1.35 | 1.41 | 1.34 | 1.35 | 1.35 | 1.35 | 1.63 | 2.02 | 1.25 | 1.63 | 1.60 | 1.40 |
| Biogas yield | 0.36 | 0.26 | 0.32 | 0.36 | 0.35 | 0.35 | 0.28 | 0.20 | 0.11 | 0.28 | 0.26 | 0.41 |
| Methane yield | 0.09 | 0.07 | 0.11 | 0.09 | 0.09 | 0.09 | 0.23 | 0.17 | 0.59 | 0.24 | 0.23 | 0.36 |
| Digestate generated | 0.530 | 0.651 | 0.635 | 0.531 | 0.536 | 0.537 | 0.670 | 0.658 | 0.916 | 0.670 | 0.689 | 0.700 |
| CO2 eq. | 1.1·10−1 | 8.0·10−2 | 1.0·10−1 | 1.1·10−1 | 1.1·10−1 | 1.1·10−1 | 3.5·10−2 | 3.4·10−4 | 1.0·10−3 | 3.5·10−2 | 3.3·10−2 | 3.7·10−2 |
| Digestate contaminants | 4.2·10−3 | 4.1·10−3 | 1.4·10−3 | 2.2·10−3 | 2.2·10−3 | 2.2·10−3 | 4.7·10−3 | 2.7·10−1 | 2.2·10−1 | 5.0·10−3 | 2.3·10−2 | 3.5·10−3 |
| Capital costs | 14,961 | 8146 | 15,085 | 14,813 | 14,026 | 13,897 | 16,049 | 10,997 | 22,234 | 19,874 | 19,665 | 19,550 |
| Operating costs | 6629 | 4874 | 6347 | 6568 | 6228 | 6175 | 6629 | 4874 | 6347 | 6568 | 6228 | 6175 |
| Utility costs | 1097 | 636 | 836 | 1091 | 1040 | 1035 | 1316 | 763 | 206 | 1309 | 1254 | 1139 |
| Equipment costs | 2864 | 302 | 2947 | 2835 | 2685 | 2661 | 5727 | 605 | 3873 | 5671 | 5369 | 5321 |
| Installed costs | 4565 | 1209 | 4664 | 4519 | 4279 | 4241 | 5249 | 1390 | 5130 | 4519 | 4707 | 4665 |
Publisher’s Note: MDPI stays neutral with regard to jurisdictional claims in published maps and institutional affiliations. |
© 2021 by the authors. Licensee MDPI, Basel, Switzerland. This article is an open access article distributed under the terms and conditions of the Creative Commons Attribution (CC BY) license (https://creativecommons.org/licenses/by/4.0/).
Share and Cite
MDPI and ACS Style
Llano, T.; Dosal, E.; Lindorfer, J.; Finger, D.C. Application of Multi-Criteria Decision-Making Tools for Assessing Biogas Plants: A Case Study in Reykjavik, Iceland. Water 2021, 13, 2150. https://doi.org/10.3390/w13162150
AMA Style
Llano T, Dosal E, Lindorfer J, Finger DC. Application of Multi-Criteria Decision-Making Tools for Assessing Biogas Plants: A Case Study in Reykjavik, Iceland. Water. 2021; 13(16):2150. https://doi.org/10.3390/w13162150
Chicago/Turabian StyleLlano, Tamara, Elena Dosal, Johannes Lindorfer, and David C. Finger. 2021. "Application of Multi-Criteria Decision-Making Tools for Assessing Biogas Plants: A Case Study in Reykjavik, Iceland" Water 13, no. 16: 2150. https://doi.org/10.3390/w13162150
Note that from the first issue of 2016, this journal uses article numbers instead of page numbers. See further details here.