
Evaluation of Humanitarian Supply Chain Resilience in Flood Disaster


1
Evergrande School of Management, Wuhan University of Science and Technology, Wuhan 430065, China
2
School of Information Engineering, Wuhan Huaxia University of Technology, Wuhan 430073, China
3
Faculty of Science and Engineering, University of Wolverhampton, Wolverhampton WV1 1NA, UK
*
Author to whom correspondence should be addressed.
Water 2021, 13(16), 2158; https://doi.org/10.3390/w13162158
Submission received: 6 June 2021
/
Revised: 30 July 2021
/
Accepted: 31 July 2021
/
Published: 6 August 2021
(This article belongs to the Special Issue Flood Risk Management and Resilience)
Abstract
:Frequent natural hazards such as flooding and the devastating consequences of severe events make the humanitarian supply chain particularly important in alleviating the suffering of those communities impacted by such events. However, the ambiguity of information and the different goals of stakeholders demand that the humanitarian supply chain must be resilient. This research adopts the use of literature review and expert opinions to identify the indicators that affect the resilience of the humanitarian supply chain using the flood event in Hechuan District, China in 2020 as an example. Based on the combination of fuzzy Decision-making Trial and Evaluation Laboratory and Analytic Network Process (fuzzy-DEMATEL-ANP), the interrelationships between the indicators and the weights of each indicator are calculated. The research results indicate that decision-makers in the humanitarian supply chain should vigorously coordinate the cooperation among stakeholders, ensure the effective transmission of information, and formulate forward-looking strategic plans. At the same time, these key decision makers should also be aware of the need to adjust their strategies at different stages of the flooding event in order to achieve a flexible humanitarian supply chain that responds to the varying demands over the course of a flooding event. The results of this study will help professionals involved in humanitarian supply chains to develop strategies and plans to become more resilient thus helping to reduce losses from natural hazards such as floods.
1. Introduction
Due to global warming and urbanization, torrential rains and floods events have become more frequent [1]. Among the recorded natural hazards globally, the frequency of flooding events accounts for nearly half of all major events [2]. In 2020, the continuous rainy season caused a significant increase in precipitation, leading to large-scale mountain torrents and urban waterlogging in China [3]. According to media reports, 433 rivers in China were flooded above the warning line, and nearly 38 million people in 27 provinces and cities were affected [4]. The devastating consequences of the flood disaster make the humanitarian supply chain, which provides timely relief especially important [5]. A successful humanitarian supply chain should reduce the losses and casualties caused by disasters as far as possible [6]. However, the characteristic of sudden disasters is that the time, place, and intensity are unpredictable [7]. This characteristic requires decision-making not only on time but also adjusted with the disaster situation [8]. In addition, it is difficult for the stakeholders involved in the humanitarian supply chain to achieve coordination and build the necessary trust due to their different expectations and goals [9]. Hence, it is essential for the humanitarian supply chain to be resilient to reduce the losses caused by disasters in an unstable environment. Simultaneously, it is necessary to determine the key factors and their interaction to maintain the resilience of the humanitarian supply chain.
In order to reduce the devastating consequences of disasters, research on the humanitarian supply chain has gradually increased in recent years [10]. Kittisak compared the humanitarian supply chain with the commercial supply chain and proposed that understanding the similarities and differences between the two is the basis for applying the commercial supply chain management concept to the humanitarian supply chain [11]. Singh argued that the fundamental chain of humanitarian supply chain and commercial supply chain are similar, and the research concept of the commercial supply chain can be used to improve the performance of the humanitarian supply chain [12]. Zarei argued that transportation capacity is critical to the sustainability of the humanitarian supply chain [13]. Iman cited regulatory uncertainty, inexperienced employees and high costs as key reasons why humanitarian supply chains are not sustainable [14]. Paula emphasized that human resources management is of great significance to disaster preparedness and rescue during disasters [15]. Hossein proposed that a flexible humanitarian supply chain can handle disasters more effectively. He also pointed out that the standardization of data and distribution is the most important for the flexibility of the humanitarian supply chain [16]. Kumar pointed out that for non-profit supply chains such as the humanitarian supply chain, Radio Frequency Identification (RFID) technology can effectively reduce costs and reduce the severity of errors [17].
Humanitarian supply chains must be resilient because of the instability of the environment and the complexity of the stakeholders [18,19]. Resilience is defined as the ability of the system to return to normal operations after a shock [20]. This study focuses on the development of humanitarian supply chain resilience during flood events and asks the following questions: (1) What factors influence the development of humanitarian supply chain resilience? (2) Is there a correlation between these factors? (3) What are the most important factors that affect resilience? In order to answer the above questions, we integrated the Delphi method and literature review findings to determine the main influencing factors. After the first round of the Delphi survey, this study identified 18 key factors found to resilience in the humanitarian supply chain and further classified these into 6 main criteria. Data from three rounds of Delphi surveys was obtained and the interrelationships between the various indicators were identified according to the fuzzy-DEMATEL method. The interrelationships between indicators were transformed into a network structure diagram. Finally, using the ANP method, the weights of each factor based on the network structure diagram were identified. Combining the fuzzy-DEMATEL method and the ANP method, the correlations between the 18 indicators and the weights of each indicator were calculated. Moreover, this research emphasizes that five of these indicators are the key directions for building the resilience of the humanitarian supply chain, which can be ranked as: capability and strategic planning (C1), coordination and cooperation (B2), transparency of information (B1), risk awareness (E2), and agility in processes (D1).
The structure of this paper is as follows: In the following section, we review the relevant literature and identify the criteria and indicators that affect the resilience of the humanitarian supply chain. Section 3 then explains the research design and methods in detail. Section 4 analyses the evaluation of humanitarian supply chain resilience based on real data from the study area. In Section 5, we discuss the research results and end with Section 6 which presents the conclusions and proposed recommendations for future research.
2. Literature Review
This section consists of two parts. The first part is mainly a review of the existing research on the humanitarian supply chain. The second part focuses on reviewing the research on the evaluation methods of the humanitarian supply chain.
2.1. Identification of Criteria and Indicators
Past research has explored various aspects involved towards building resilience in humanitarian supply chains. Humanitarian supply chain resilience in flood events is a complex issue. Its formation is the result of a combination of pre-assessment [21], diverse actors [22], strategic management [23], responsiveness [24], risk management [25], and material support [26].
Pre-assessment is the process of quickly determining the needs of the disaster-affected area and the capabilities of the humanitarian supply chain itself. It is critical to the humanitarian supply chain. In both commercial and humanitarian supply chains, determining demand is an essential prerequisite for providing supply [27]. However, the needs of humanitarian supply chains in a disaster are often uncertain and fluid. This issue requires humanitarian supply chain managers to pre-assess requirements using methods such as predictive models and information transmission [28]. The analysis of transportation links is also an important part of the humanitarian supply chain pre-assessment [29]. For example, using drones to collect data on transportation links has been found to be of great significance to shorten the rescue time [30]. In addition, the pre-assessment of resources has a positive impact on the resilience of the humanitarian supply chain [31]. Chen proposed that effective sharing of resources can improve the sustainability of the humanitarian supply chain [32].
Many stakeholders are involved in the humanitarian supply chain, including governments departments, enterprises, humanitarian agencies, and volunteers [27]. Dubey analyzed the case of British Telecom’s participation in disaster relief operations. The research results showed that the transparency of the humanitarian supply chain is conducive to enhancing the resilience of the supply chain. It was also pointed out that collaboration and the swift development of trust among stakeholders positively impact the resilience of the humanitarian supply chain [33]. In another study, it was emphasized that the challenges faced by the humanitarian supply chain are often caused by a lack of trust and poor collaboration [34]. John analyzed the coordination of the humanitarian supply chain in the Chennai flood disaster and concluded that information exchange is equivalent to achieving coordination [35].
The effectiveness of strategic management depends on the capability of the management team including their strategic planning, timely quality inspection, and logistics management [23]. Torabi pointed out that strategic planning is the basis for making correct decisions [36]. L’Hermitte believed that sustainable strategic management should include an overall strategy and updated decisions based on phased disasters [37]. John suggested that humanitarian supply chain managers should confirm the source of supplies and conduct timely inspections of donated materials [38]. Nayaka discussed the application of a comprehensive streamlining framework in the humanitarian supply chain. The research results emphasized that efficient humanitarian supply chain management is inseparable from the need to have precise logistics [39].
Responsiveness is an important feature of humanitarian supply chain resilience and consists of agility in processes, adaptive management strategy, and efficiency in processes [19]. Dubey’s research indicated that technology-driven humanitarian supply chains are often more agile. It was also noted that more efficient disaster relief actions are taken when the humanitarian supply chain is agile and responsive [40]. Due to the suddenness and uncertainty of flood events, adaptive management strategies are absolutely necessary [41]. Charles pointed out that reducing unnecessary pipeline time has a beneficial effect on improving the efficiency of the humanitarian supply chain. It was also proposed that pre-assessment is conducive to enabling faster decision making [42].
Due to the complexities and uncertainties involved in the humanitarian supply chain during flood events, effective risk management is key to improving resilience. Risk management is a combination of risk warning capability, risk awareness, and distributed power [43]. Risk warning capability is critical to the initial deployment of the humanitarian supply chain. This ability not only improves the responsiveness of the supply chain but also avoids waste of resources [44]. Patil argued that the lack of risk awareness is an important obstacle to the sustainable management of the humanitarian supply chain. The cultivation of risk awareness should involve two main bodies: (i) rescuers and first responders, and (ii) community members [45]. The frequent interruption of information exchange in flood events makes distributed power essential [31].
At the same time, the resilience of the humanitarian supply chain cannot be improved without material support, including big data analysis, competent manpower, and standardization [8,23,46]. Oscar’s research results show that artificial intelligence can greatly enhance humanitarian supply chain resilience [47]. Paula pointed out that a successful humanitarian supply chain is inseparable from effective human resource management [15]. Ismail’s research revealed that standardization could increase the substitutability of materials, and further enhance the resilience of the humanitarian supply chain [48].
Based on the preceding literature review, the criteria, indicators and their explanations are shown in Table 1.
2.2. Review of Existing Humanitarian Supply Chain Evaluation Methods
Many studies have provided evaluation methods for humanitarian supply chains. Kumar combined the fuzzy MICMAC method and the interpretation structure model to analyze 12 humanitarian supply chain resilience indicators. They emphasized that government support is the most important factor in building the resilience of the humanitarian supply chain [12]. Behl summarized 20 influencing factors and used the grey DEMATEL method to calculate the index importance [49]. Kumar analyzed the responses to a questionnaire survey involving 136 respondents using the interpretive structure model and the DEMATEL method. Based on the model results, they proposed that governance and supervision are the keys to achieving a sustainable humanitarian supply chain [50]. Mangla proposed 20 solutions to 29 obstacles faced by humanitarian supply chain management. These solutions include long-term strategic planning, coordination among actors, and logistics management [21]. Dubey used a structural equation model based on variance to conclude that information integration and collaboration positively impacted the agility of the humanitarian supply chain [40]. Hamid combined the partial least squares method and the fuzzy interpretation structure model to evaluate the challenges faced in the humanitarian supply chain [25]. Bag evaluated the importance of big data-driven humanitarian supply chain barriers through fuzzy total interpretive structural modeling [51].
According to the literature review, existing research on humanitarian supply chain resilience can be divided into three main directions: (1) focuses on the relationship between a certain attribute and the resilience of the humanitarian supply chain; (2) optimizes the resilience of humanitarian supply chain when combined with certain attributes; (3) attempts to provide a comprehensive evaluation of humanitarian supply chain resilience. Additionally, previous research seeking to evaluate the resilience of humanitarian supply chains generally failed to attempt to calculate weights based on identifying the interrelationships between indicators. This suggests there remains a need for further research in order to develop a comprehensive analysis of humanitarian supply chain resilience. Therefore, this study will construct an evaluation system based on the findings of the literature review. Combining the fuzzy-DEMATEL method and the ANP method, this research will calculate the weights of the indicators based on an understanding of their interrelationships.
3. Methods
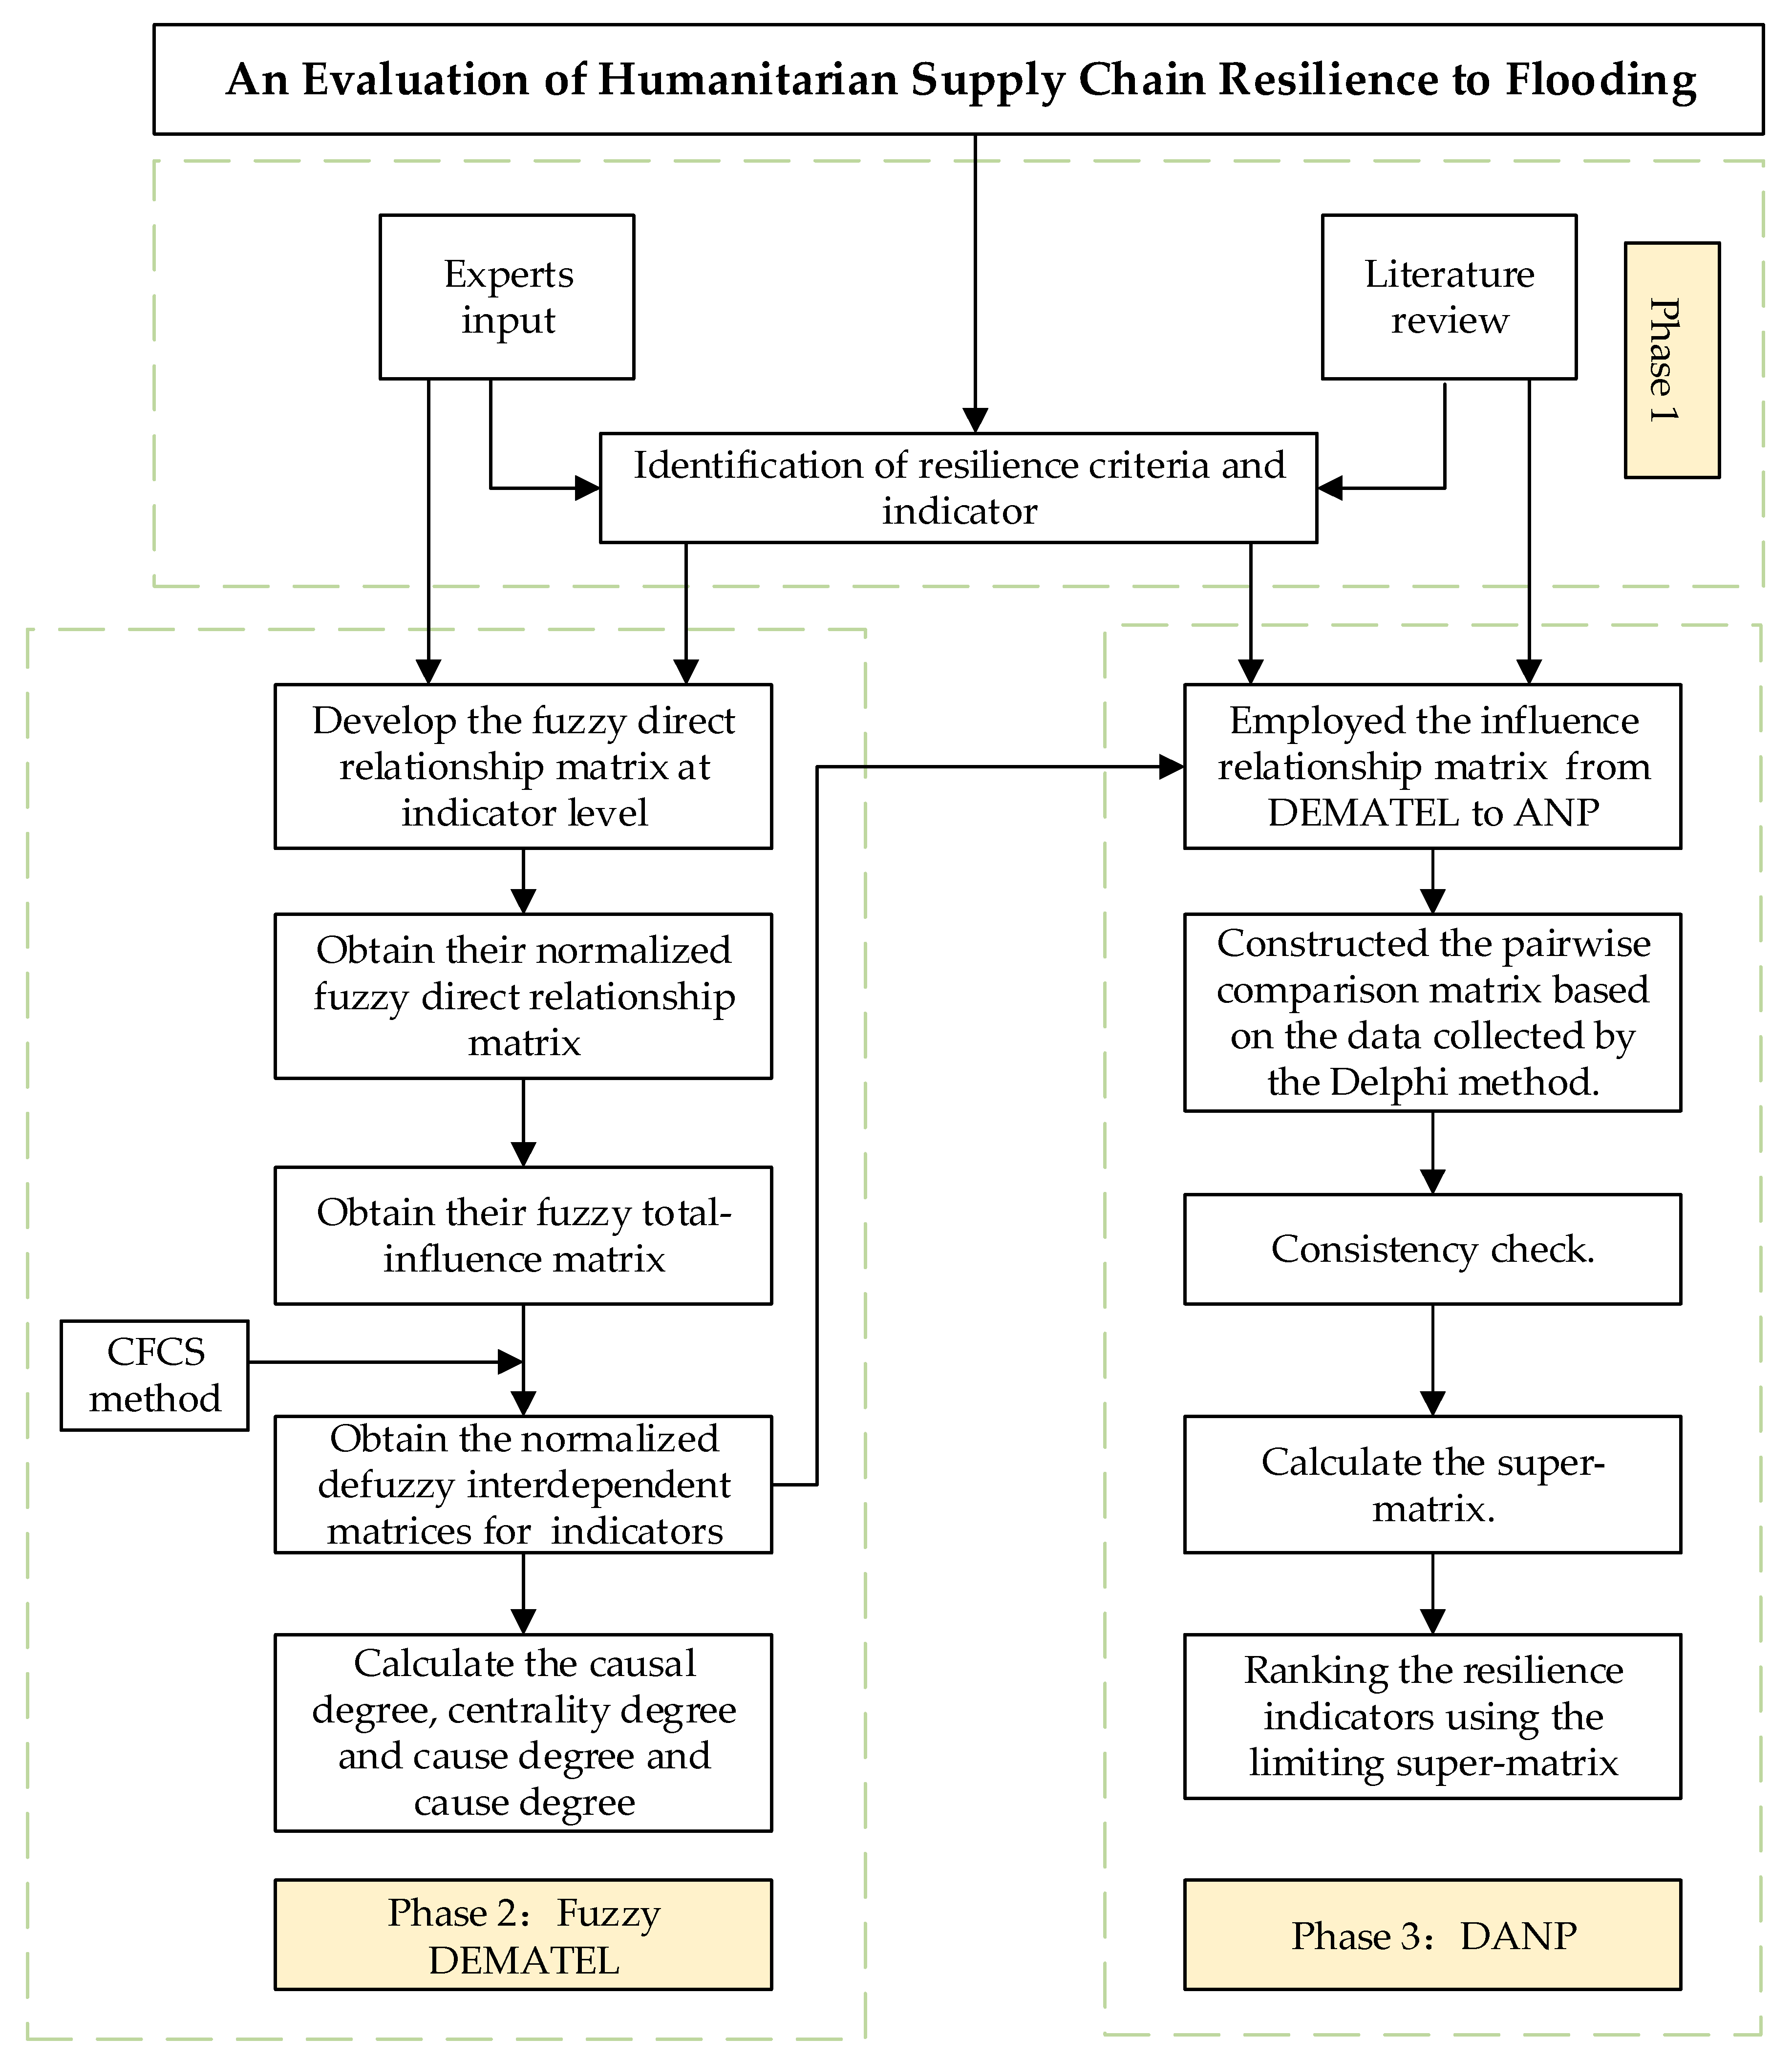
This research includes three stages to assess the resilience of the humanitarian supply chain, as shown in Figure 1. In the first phase, the Delphi survey and literature review were conducted to identify indicators that affect the resilience of humanitarian supply chains in flood events. In the second stage, the fuzzy-DEMATEL method is used to obtain the interrelationships between 18 influencing factors, and the influencing relationship matrix is obtained according to the interrelationship. In the final stage, the influence relationship matrix obtained in the second stage is transformed into the network relationship diagram in the ANP method, and the ANP method is used to calculate the weights of resilience criteria and indicators.
3.1. Fuzzy DEMATEL Method
3.1.1. The Basic of Triangular Fuzzy Numbers
There are many uncertainties in the complex decision-making process. Generally, decision-makers tend to use subjective language rather than crisp values to express their opinions [52]. In order to overcome the inconvenience caused by these factors in quantitative research, this research uses triangular fuzzy numbers to collect expert opinions.
The triangular fuzzy number A can be defined as a triplet state (l, m, r), and its membership function can be expressed as:
3.1.2. CFCS Method
Due to the expert opinions collected by the triangular fuzzy number cannot be directly applied to the DEMATEL method, the process of defuzzification is necessary. Defuzzification is a process of filtering fragmented information based on fuzzy sets, which means turning fuzzy numbers into crisp values [53]. This study uses the CFCS method to implement defuzzification [54]. Suppose that is the fuzzy evaluation value given by the expert, it represents the degree of influence of the ith indicator on the jth indicator. The defuzzification steps of the CFCS method are as follows.
Step 1: Normalization.
Step 2: Compute left and right normalized values.
Step 3: Compute total normalized crisp value.
Step 4: Compute crisp values.
3.1.3. Integrated CFCS and DEMATEL Method
The DEMATEL method is an important tool for analyzing the interrelationships of complex system elements. Combining the process proposed by many scholars, the fuzzy-DEMATEL method used in this study is as follows [55].
Step 1: The Delphi method is used to obtain the interrelationships between the indicators, and the linguistic terms evaluated by experts are transformed into numerical information with triangular fuzzy numbers. Language variables and corresponding scales and triangular fuzzy numbers are shown in Table 2.
Step 2: Construct a direct-relation fuzzy matrix. By determining the degree of direct influence among different factors in the above method, the direct-relation fuzzy matrix can be obtained, where represents the degree of influence of indicator i on indicator j. And , n is the number of evaluation indicators.
Step 3: Obtain normalized direct-relation fuzzy matrix. According to Equation (10), the normalized direct-relation fuzzy matrix can be calculated.
where .
Step 4: Calculate the fuzzy total-influence matrix. According to Equation (11), the fuzzy total-influence matrix can be obtained.
Through the CFCS method, the total-influence matrix T after defuzzification can be obtained.
Step 5: Obtain the causal degree through Equations (12) and (13):
Step 6: Calculate centrality and cause degree using Equations (14) and (15):
represents the centrality degree of indicator i, which reflects the position and function of the indicator. When , indicator i is the cause indicator, and its influence on other indicators is greater than that of other indicators. On the contrary, indicator i is the effect factor.
3.2. ANP Method
The ANP method is a multi-criteria measurement theory that can fully consider interdependence and influence relationships among various factors [56]. The calculation steps of the ANP method are as follows.
Step 1: The ANP network structure is constructed according to the influence relationship matrix obtained by the fuzzy-DEMATEL method and the threshold set by experts.
Step 2: The data collected by the Delphi method is converted into a matrix form to express the relative importance between indicators, as shown in Equation (16).
where .
Step 3: Consistency check. From the matrix operation rules, if there is a set of numbers and vector satisfying Equation (17), then is called the eigenvalue corresponding to the matrix, and the vector is the eigenvector corresponding to the matrix.
According to Equations (18) and (19), the consistency test of each paired comparison matrix is carried out. Where CI represents the consistency index, CR represents the consistency ratio, RI represents the random index, and represents the maximum eigenvalue. When CR ≤ 0.1, it means that the paired comparison matrix passes the consistency test.
Step 4: Calculate the super-matrices. The eigenvectors of each dimension are integrated into a matrix, which is an unweighted super-matrix. If the matrix is not column stochastic (the sum of the columns is 1), the decision-maker needs to provide weights to make it a column stochastic and obtain a weighted super-matrix W. Further, the limiting super-matrix can be obtained according to Equation (20), where k is the power of the matrix W transformed into the column stochastic matrix.
4. Case Study
4.1. Study Area
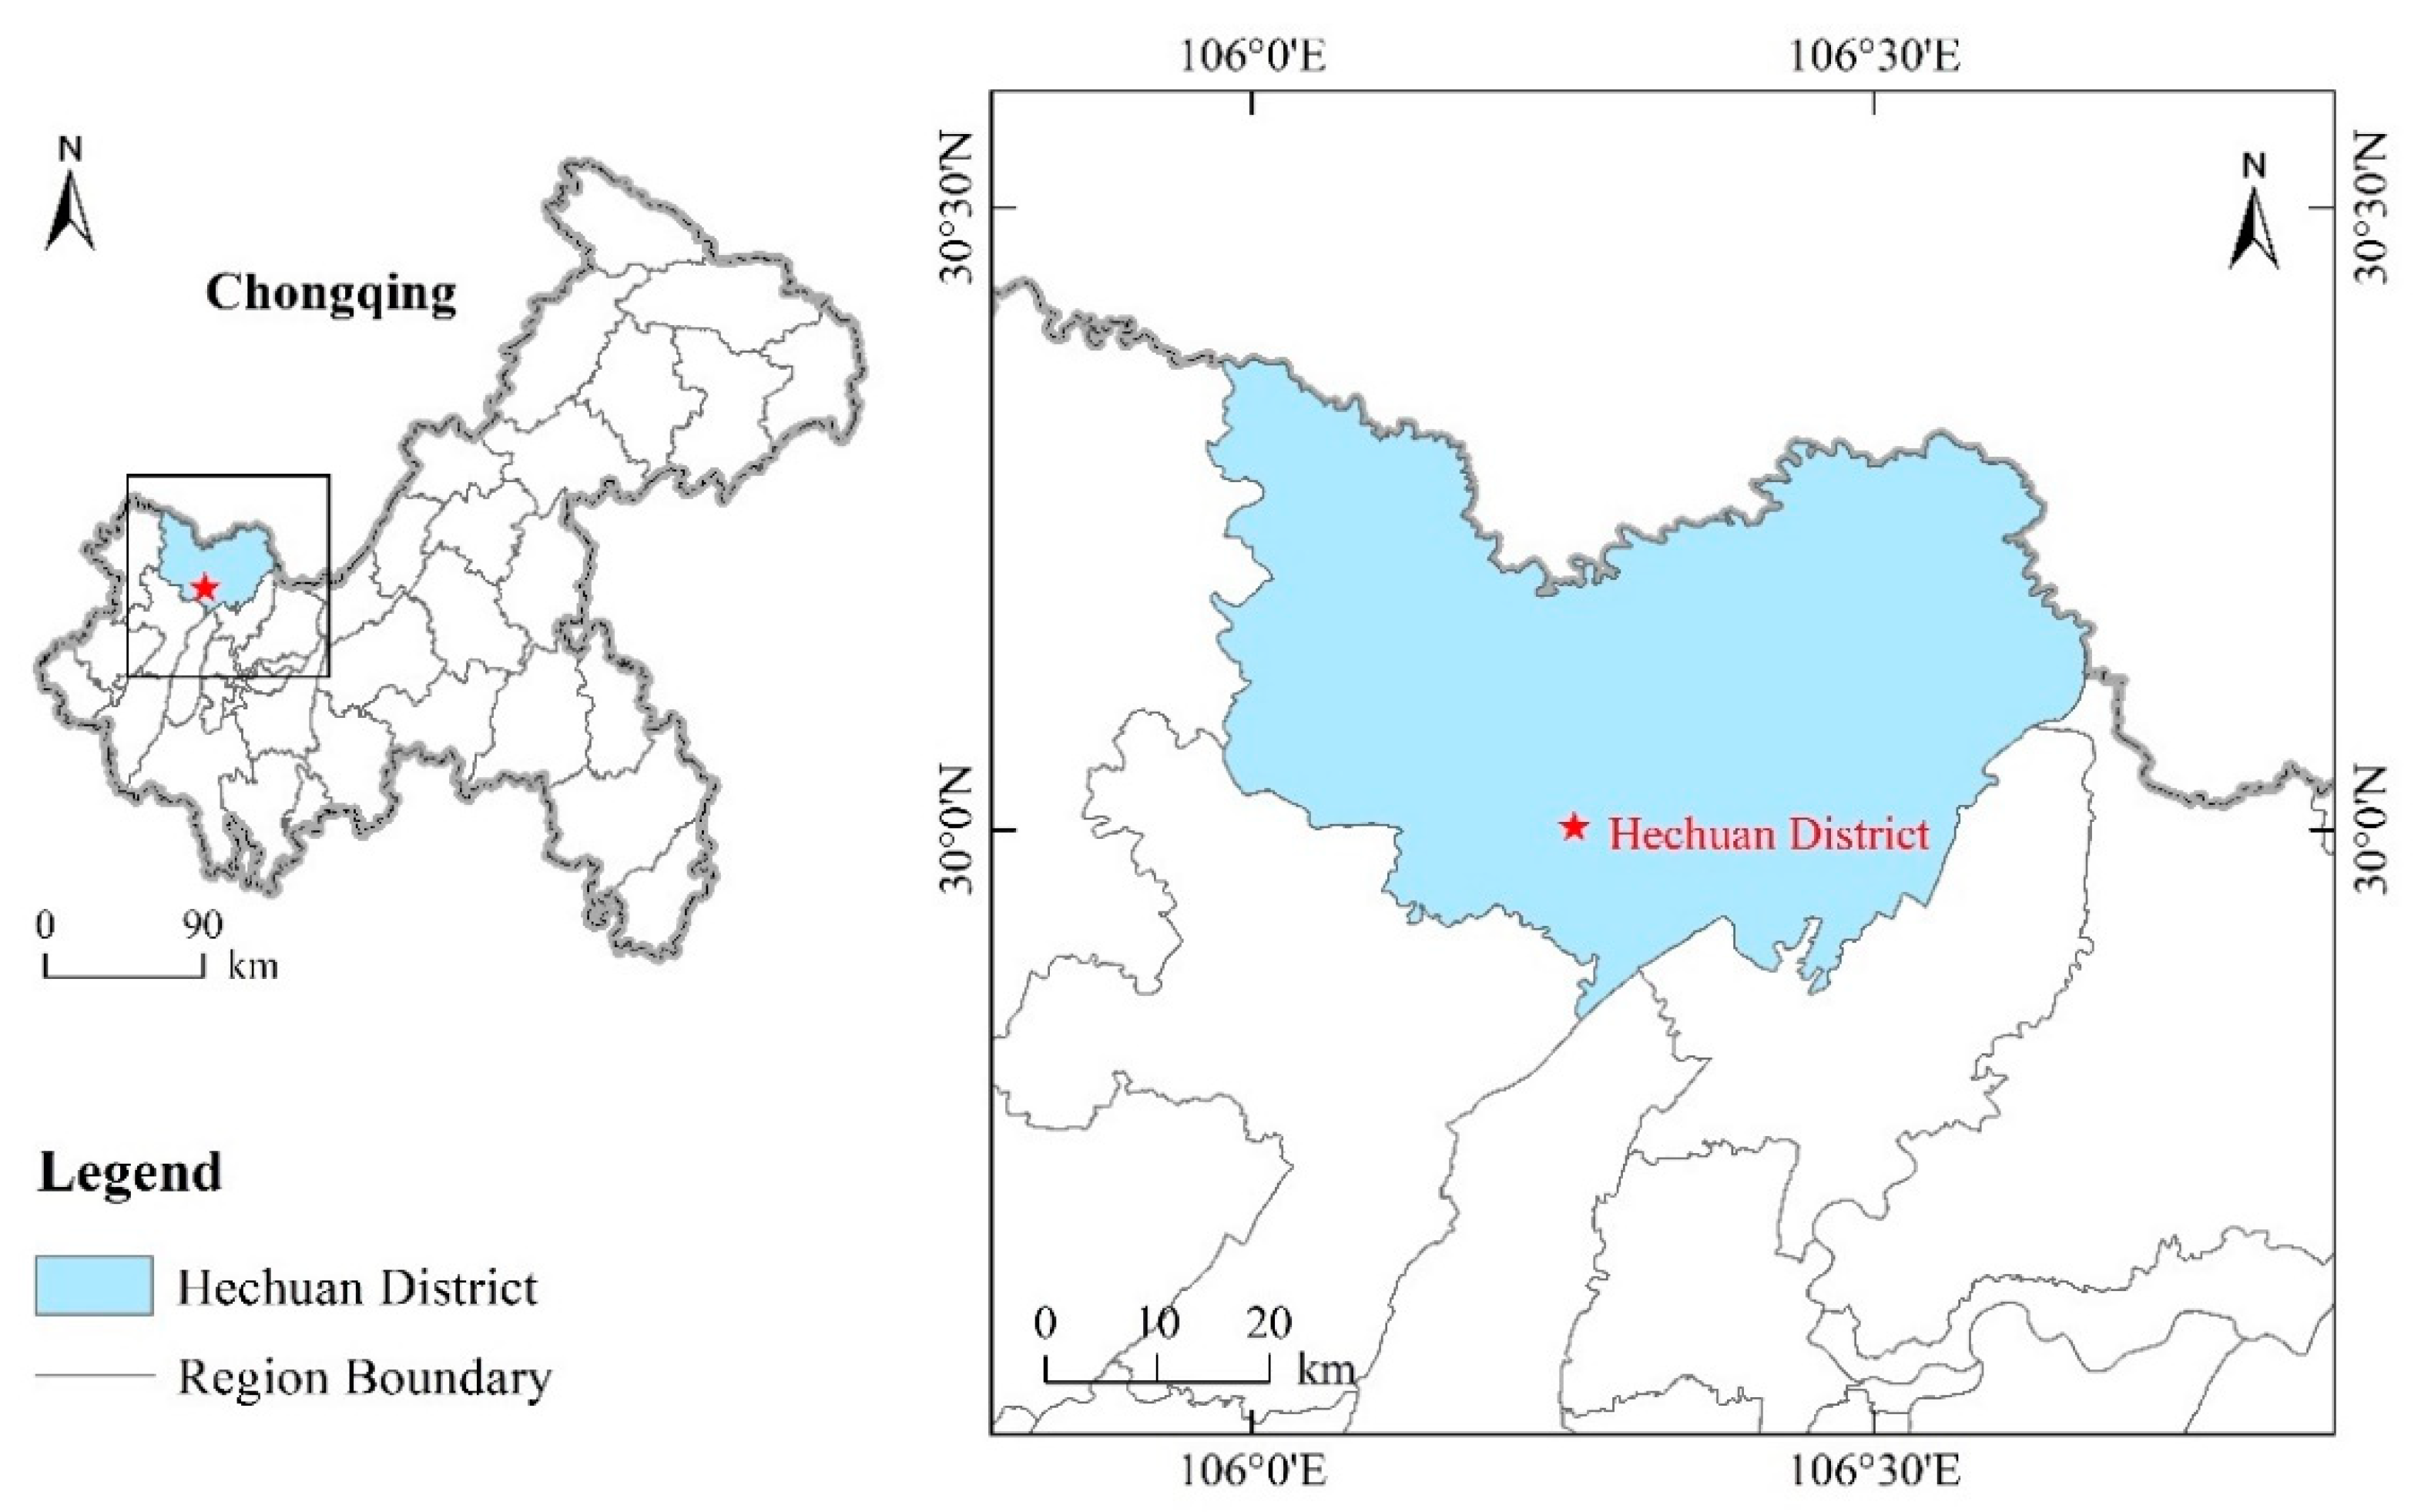
Hechuan District is a municipal district under the jurisdiction of Chongqing Municipality, located in the upper reaches of the Yangtze River, northwest of Chongqing, as shown in Figure 2. By 2020, it has 2344.07 square kilometers, jurisdiction over 7 sub-district offices and 23 towns, with a permanent population of 1.56 million. There are three rivers confluence of Fujiang, Jialing River, and Qujiang River in Hechuan District. On 11–17 August 2020, there were heavy rains in the Fujiang, Jialing River, and Qujiang river basins in Sichuan, and locally heavy rains. Affected by the heavy rainfall in the upper reaches of the Three Rivers, on the evening of the 18th, the urban area of Hechuan District ushered in the peak of transit. On the same day, Chongqing has launched a first-level emergency response for flood control for the first time in history. This flood is the biggest flood peak in 40 years. At 7 a.m. on August 19, the highest water level at Hechuan Yazui Station was 212.28 m, which was 5.35 m above the guaranteed water level. As of 15:00 on 26 August the district has organized and dispatched more than 220,000 professional rescue teams, party members and cadres at all levels, and volunteers. The flood caused a direct economic loss of about 652 million yuan in the entire region.
4.2. Data Collection
In this study, the Delphi method was used to collect feedback and modify expert opinions, finally obtaining a consensus. In the Delphi method, the invited experts do not know each other and are conducted anonymously to eliminate the mutual influence [57]. According to the research of Winkler and Moser, the effectiveness of the Delphi method depends on the composition of the expert panel. They proposed that there should be a high degree of heterogeneity within the expert panel to avoid grouping opinions [58]. Belton suggested that 5–20 experts can get a good survey result, and more experts can be invited if possible. At the same time, his research results revealed that three rounds of investigations can obtain stable opinions [59]. Therefore, 60 formal or alternate members of the expert panel were selected for this study. After the first round of the Delphi survey, a total of 45 recoveries were collected, with 75% of the experts answering the questionnaire. After the second and third rounds of the Delphi survey, only 32 participating experts remained. Simultaneously, 81% of expert opinions are concentrated in one category, which verifies that the experts have reached a consensus. The characteristics of the expert panel are shown in Table 3.
Through three rounds of Delphi surveys, the interactions and weights of the indicators were analyzed. The first round of Delphi surveys was implemented from December 2020 to January 2021, the second round was implemented from January to March 2021, and the third round was implemented from March to April 2021. The Likert scale and Satty’s 1–9 scale were used to collect expert opinions during the interview. In the first round of the Delphi survey, the questionnaire was sent to the panel members via email. In the second round of the survey, the statistical results of the first round and the revised questionnaire were sent to the experts (the statistical results include the probability distribution and the median). Finally, in the third round of the Delphi survey, the statistical results of the second round and the revised questionnaire were sent to the experts again, and the experts gave their opinions through evaluation. After three rounds, the Delphi survey was completed.
4.3. Construct the Network Structure Based on Fuzzy-DEMATEL
Step 1: Construct the initial fuzzy direct-relation matrix. The expert opinions collected by the Delphi method are sorted into an 18×18 initial fuzzy direct relationship matrix, as shown in Table 4.
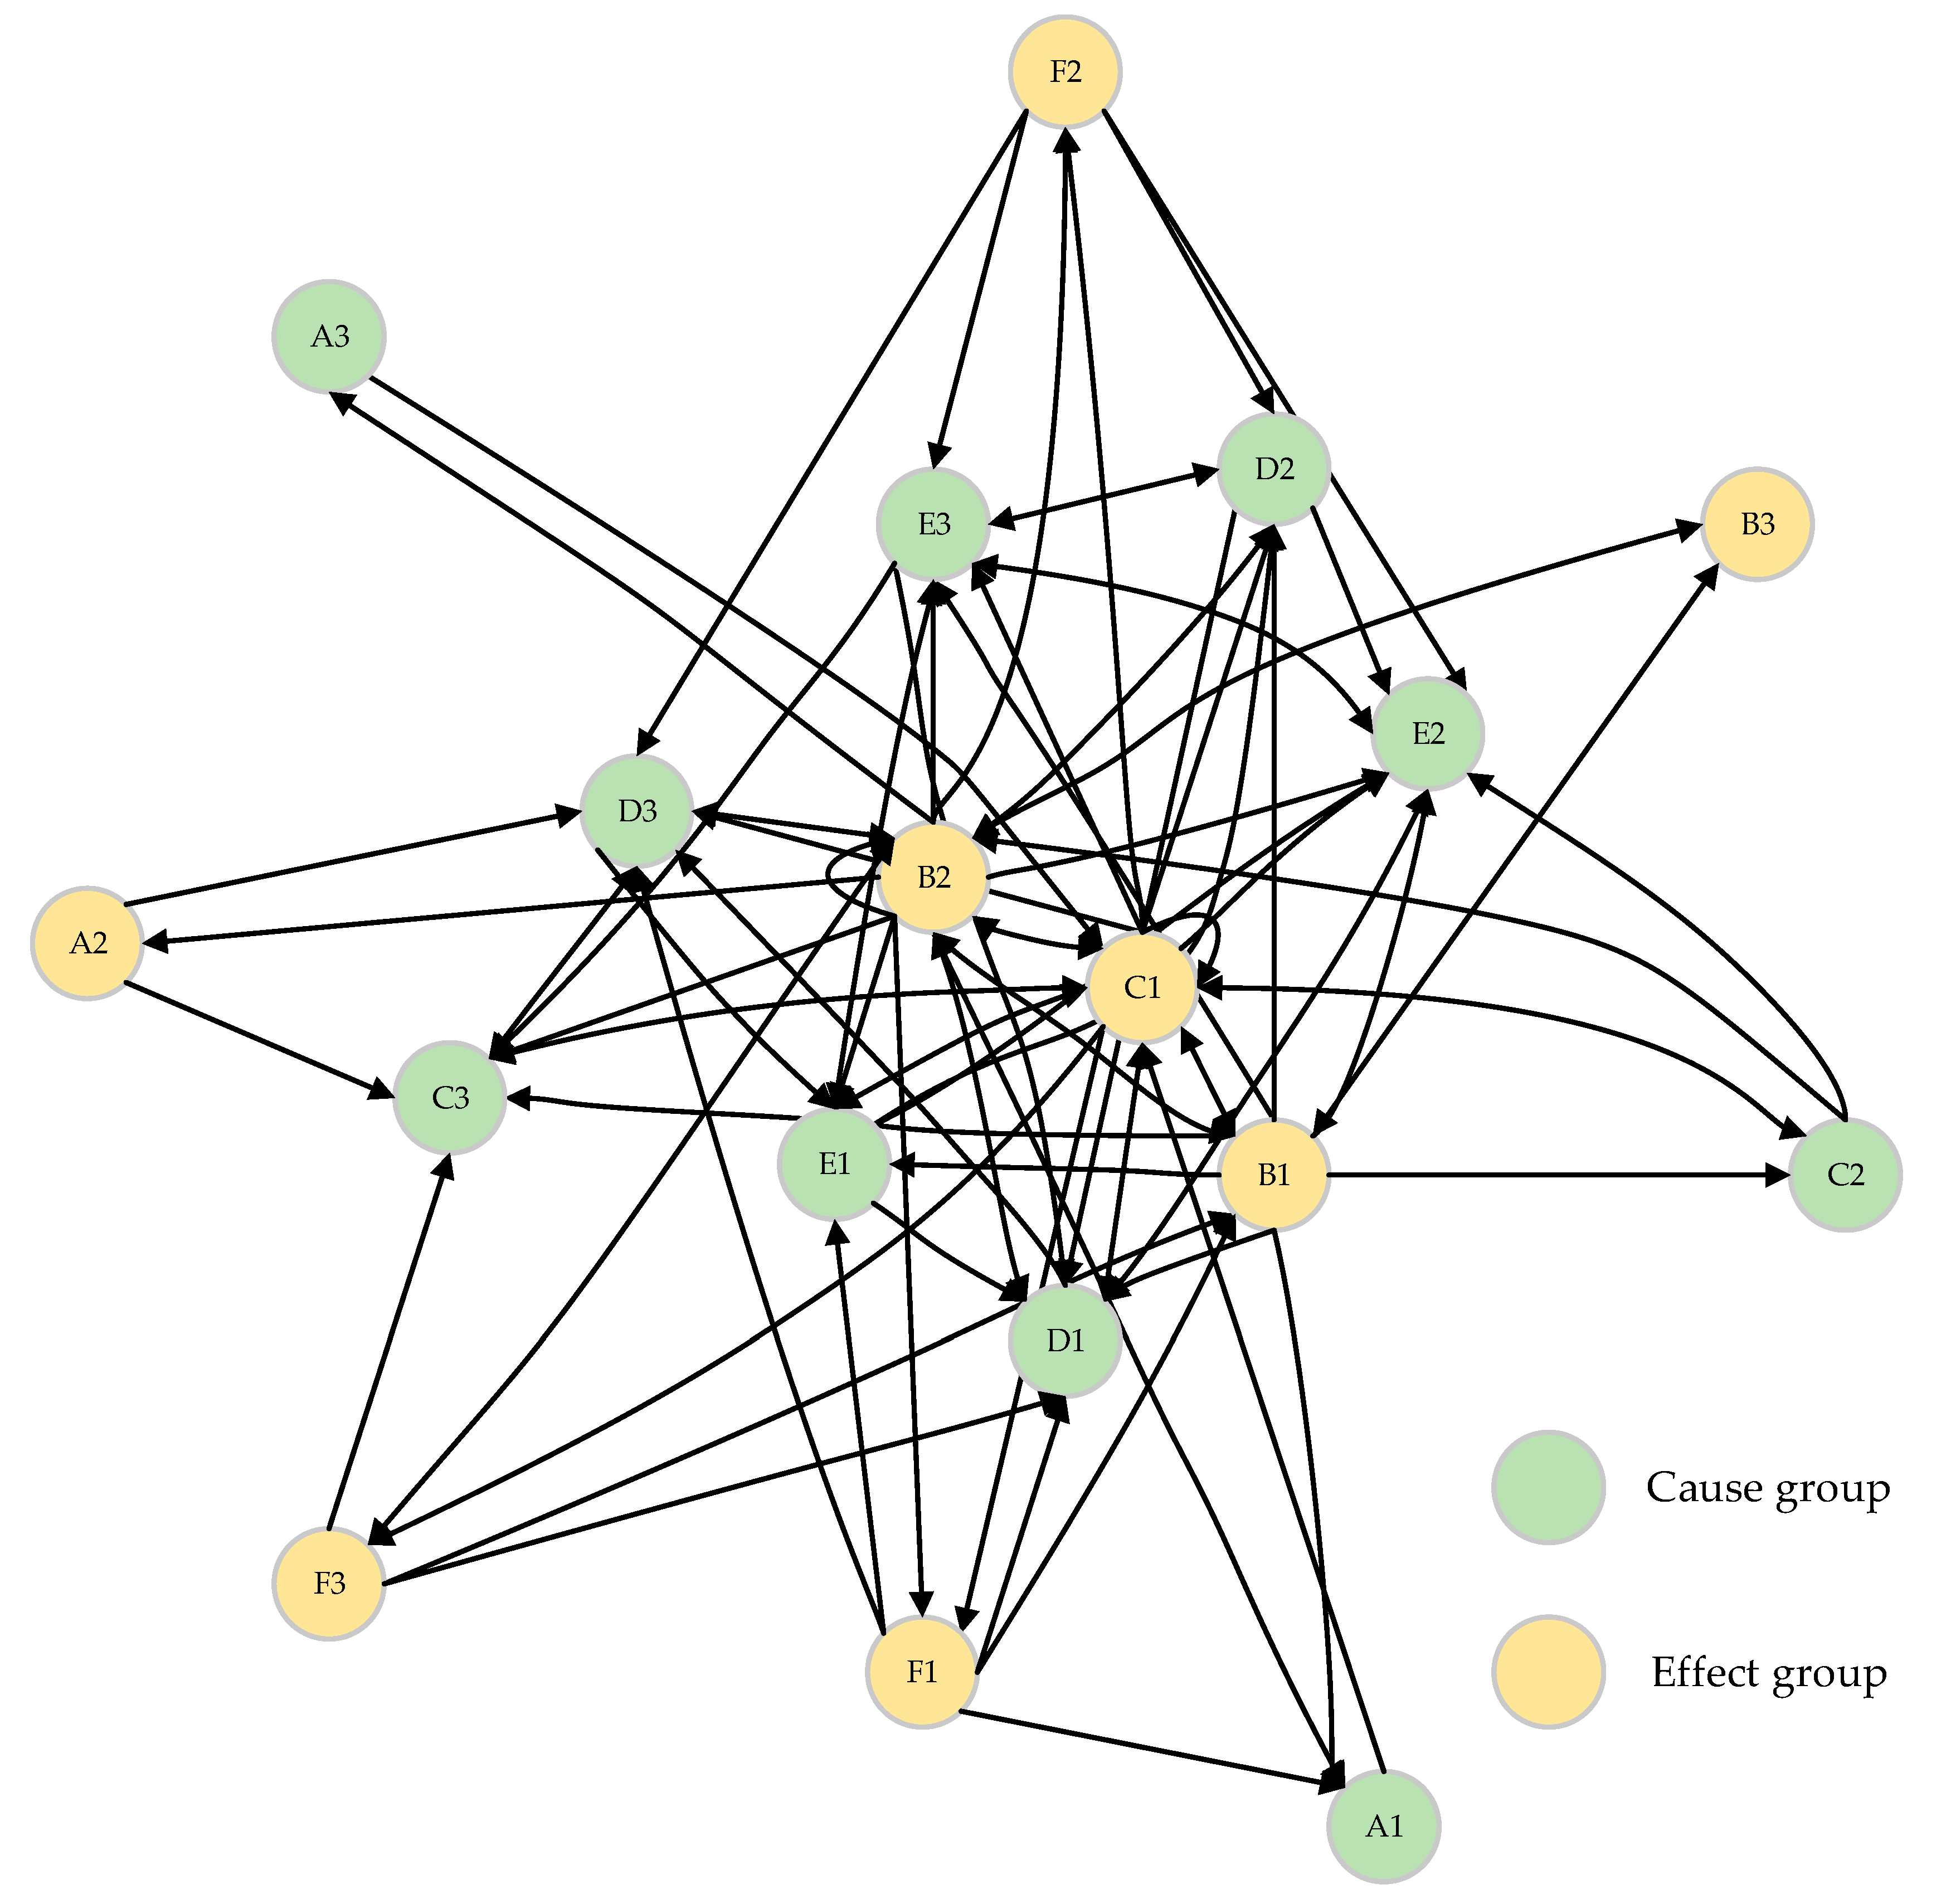
Step 2: Obtain the interdependence matrix. Combining the CFCS method and the DEMATEL method, the total relationship matrix after defuzzification is obtained. Further, based on expert opinions and literature review, the threshold is set to 0.032. After deleting the values less than 0.032 in the total relationship matrix, the normalized total influence matrix can be obtained, which will be used as the network structure diagram in the ANP method, as shown in Table A1 in Appendix A. Additionally, according to the normalized total influence matrix, the network structure diagram in the ANP method can be obtained, as shown in Figure 3.
4.4. Calculate Weights by ANP Method
Step 1: According to the network structure diagram obtained by the fuzzy-DEMATEL method, the impact-relation map in the ANP method can be obtained. On this basis, the pairwise comparison matrices were constructed to combine the data collected by the Delphi method. According to Equations (17)–(19), all pairwise comparison matrices are checked for consistency. If the consistency test fails, the paired comparison matrix will be fed back to the expert group until all the matrices pass the test.
Step 2: Calculate the super-matrices. The super-matrix in this research is calculated by super decision (SD) software, and the process is as follows. First, clusters and nodes were designed according to the evaluation index system. Secondly, the node connections were constructed according to the network structure diagram obtained by fuzzy-DEMATEL. Finally, the unweighted super-matrix, weighted super-matrix, and limiting super-matrix were calculated based on inputting the paired comparison matrices that pass the consistency test, as shown in Table A2, Table A3 and Table A4, respectively.
Step 3: According to the limiting super-matrix, the limited weight and global weight of each indicator can be obtained, as shown in Table 6.
5. Discussion
The humanitarian supply chain is of great significance to alleviating the loss and suffering of flood-affected people. However, due to the uncertainty of flood events and the unpredictability of demand, it is necessary to develop a resilient humanitarian supply chain. This study used the fuzzy-DEMATEL method combined with the ANP method for analyzing humanitarian supply chain resilience. The interrelations and weights among the indicators were determined as shown in Table 5 and Table 6, respectively. It can be seen from these two tables that capability and strategic planning (C1) is the key indicator. Agarwal discussed the main obstacles faced by the humanitarian supply chain and proposed corresponding solutions. Their research results showed that capabilities and strategic planning directly positively impact the humanitarian supply chain. This result is consistent with the results of this study [21]. In the humanitarian supply chain, long-term capability and strategic planning, including logistics deployment and resource allocation, are critical. Moreover, capacity and strategic planning should include different stages of work meetings and work update links to eliminate the uncertainty. It is vital to note that the lack of forward-looking strategic planning has a significant impact on the resilience of humanitarian supply chains. Therefore, the managers of the humanitarian supply chain should be careful in making plans.
Coordination and cooperation (B2) among stakeholders is the second most important resilience indicator. Ergun’s research emphasized that good coordination between stakeholders is beneficial to improving the resilience of the humanitarian supply chain, which is consistent with the results of this research [60]. The humanitarian supply chain involves many stakeholders. Hence, in the recovery process of flooding events, it is often seen that the rescue work is slow even with sufficient funds and materials. John’s research showed that many supplies were donated by the National Crisis Committee during the Chennai flood relief operation. Nevertheless, many poor communities did not receive the materials due to poor coordination [35]. In addition, it is indispensable to consider the expectations of different stakeholders when coordinating the response. For example, volunteers usually do not seek rewards for their rescue behavior, while companies and NGOs pay more attention to the reciprocal results brought about by cooperation [61]. Further, the expectations of companies and NGOs for cooperation are quite different. Companies expect their brand image to be promoted. The focus of NGOs is to ensure that the affected communities and individuals receive the donated materials. Generally speaking, when NGOs donate materials, they hope that cooperative organizations can deliver materials to the affected communities and individuals. It seems unreasonable for NGOs to cooperate with other organizations and expect something in return. However, given that NGOs face increasing scrutiny and fierce competition for donor funding, this expectation is understandable.
Transparency of information (B1) is the third-ranked resilience indicator. Dubey pointed out that information sharing and supply chain transparency are the keys to a resilient humanitarian supply chain [34]. Prasanna’s research results revealed that information sharing among stakeholders is the main factor in the success of the humanitarian supply chain [62]. Their views coincide with the results of this research. Due to the large number of stakeholders involved in the humanitarian supply chain and the lack of formal information-sharing agreements between agencies, information exchange in the humanitarian supply chain is often quite problematic. Thus, achieving timely and effective transmission of information is an inevitable prerequisite for realizing the coordination among the humanitarian supply chain. Dubey’s research suggested that blockchain technology in disaster relief operations can effectively guarantee the exchange of information [33]. Nagendra pointed out that a cloud computing platform based on satellite big data can also improve the collection of real-time information [5].
Risk awareness (E2) is the fourth most important indicator of resilience. Patil et al. emphasized that the lack of risk awareness is an obstacle to the operation of the humanitarian supply chain. They also proposed that the cultivation of risk awareness is a long-term process [45]. This view is consistent with this research. Risk awareness includes the training of rescuers and the understanding of flood-affected community members. The temporary and voluntary nature of disaster relief operations leads to uneven risk awareness among rescuers. Therefore, basic training and practical guidance should be provided for rescuers. In the meanwhile, flood-affected people often demonstrate wait-and-see behavior as they are often reluctant to evacuate their homes. Kensuke Takenouchi pointed out that disaster prediction models may lead to information dependence and wait-and-see behavior of the public [63]. Strahan argued that wait-and-see behavior is influenced by the level of warning and the psychology of protecting one’s property [64]. The appearance of wait-and-see behavior will bring great trouble to rescue operations. Hence, it is essential to cultivate risk awareness among people in disaster-prone areas. Agility in processes (D1) is the fifth-most weighted indicator. Richard discussed the importance of agility for emergency disaster relief activities. Moreover, they emphasized that the realization of agility is positive for the resilience of the humanitarian supply chain, which is consistent with the results of this research [65]. Changes in the needs of the affected people and the uncertainty of floods require an agile and flexible humanitarian supply chain that improves handling emergencies in the rescue period.
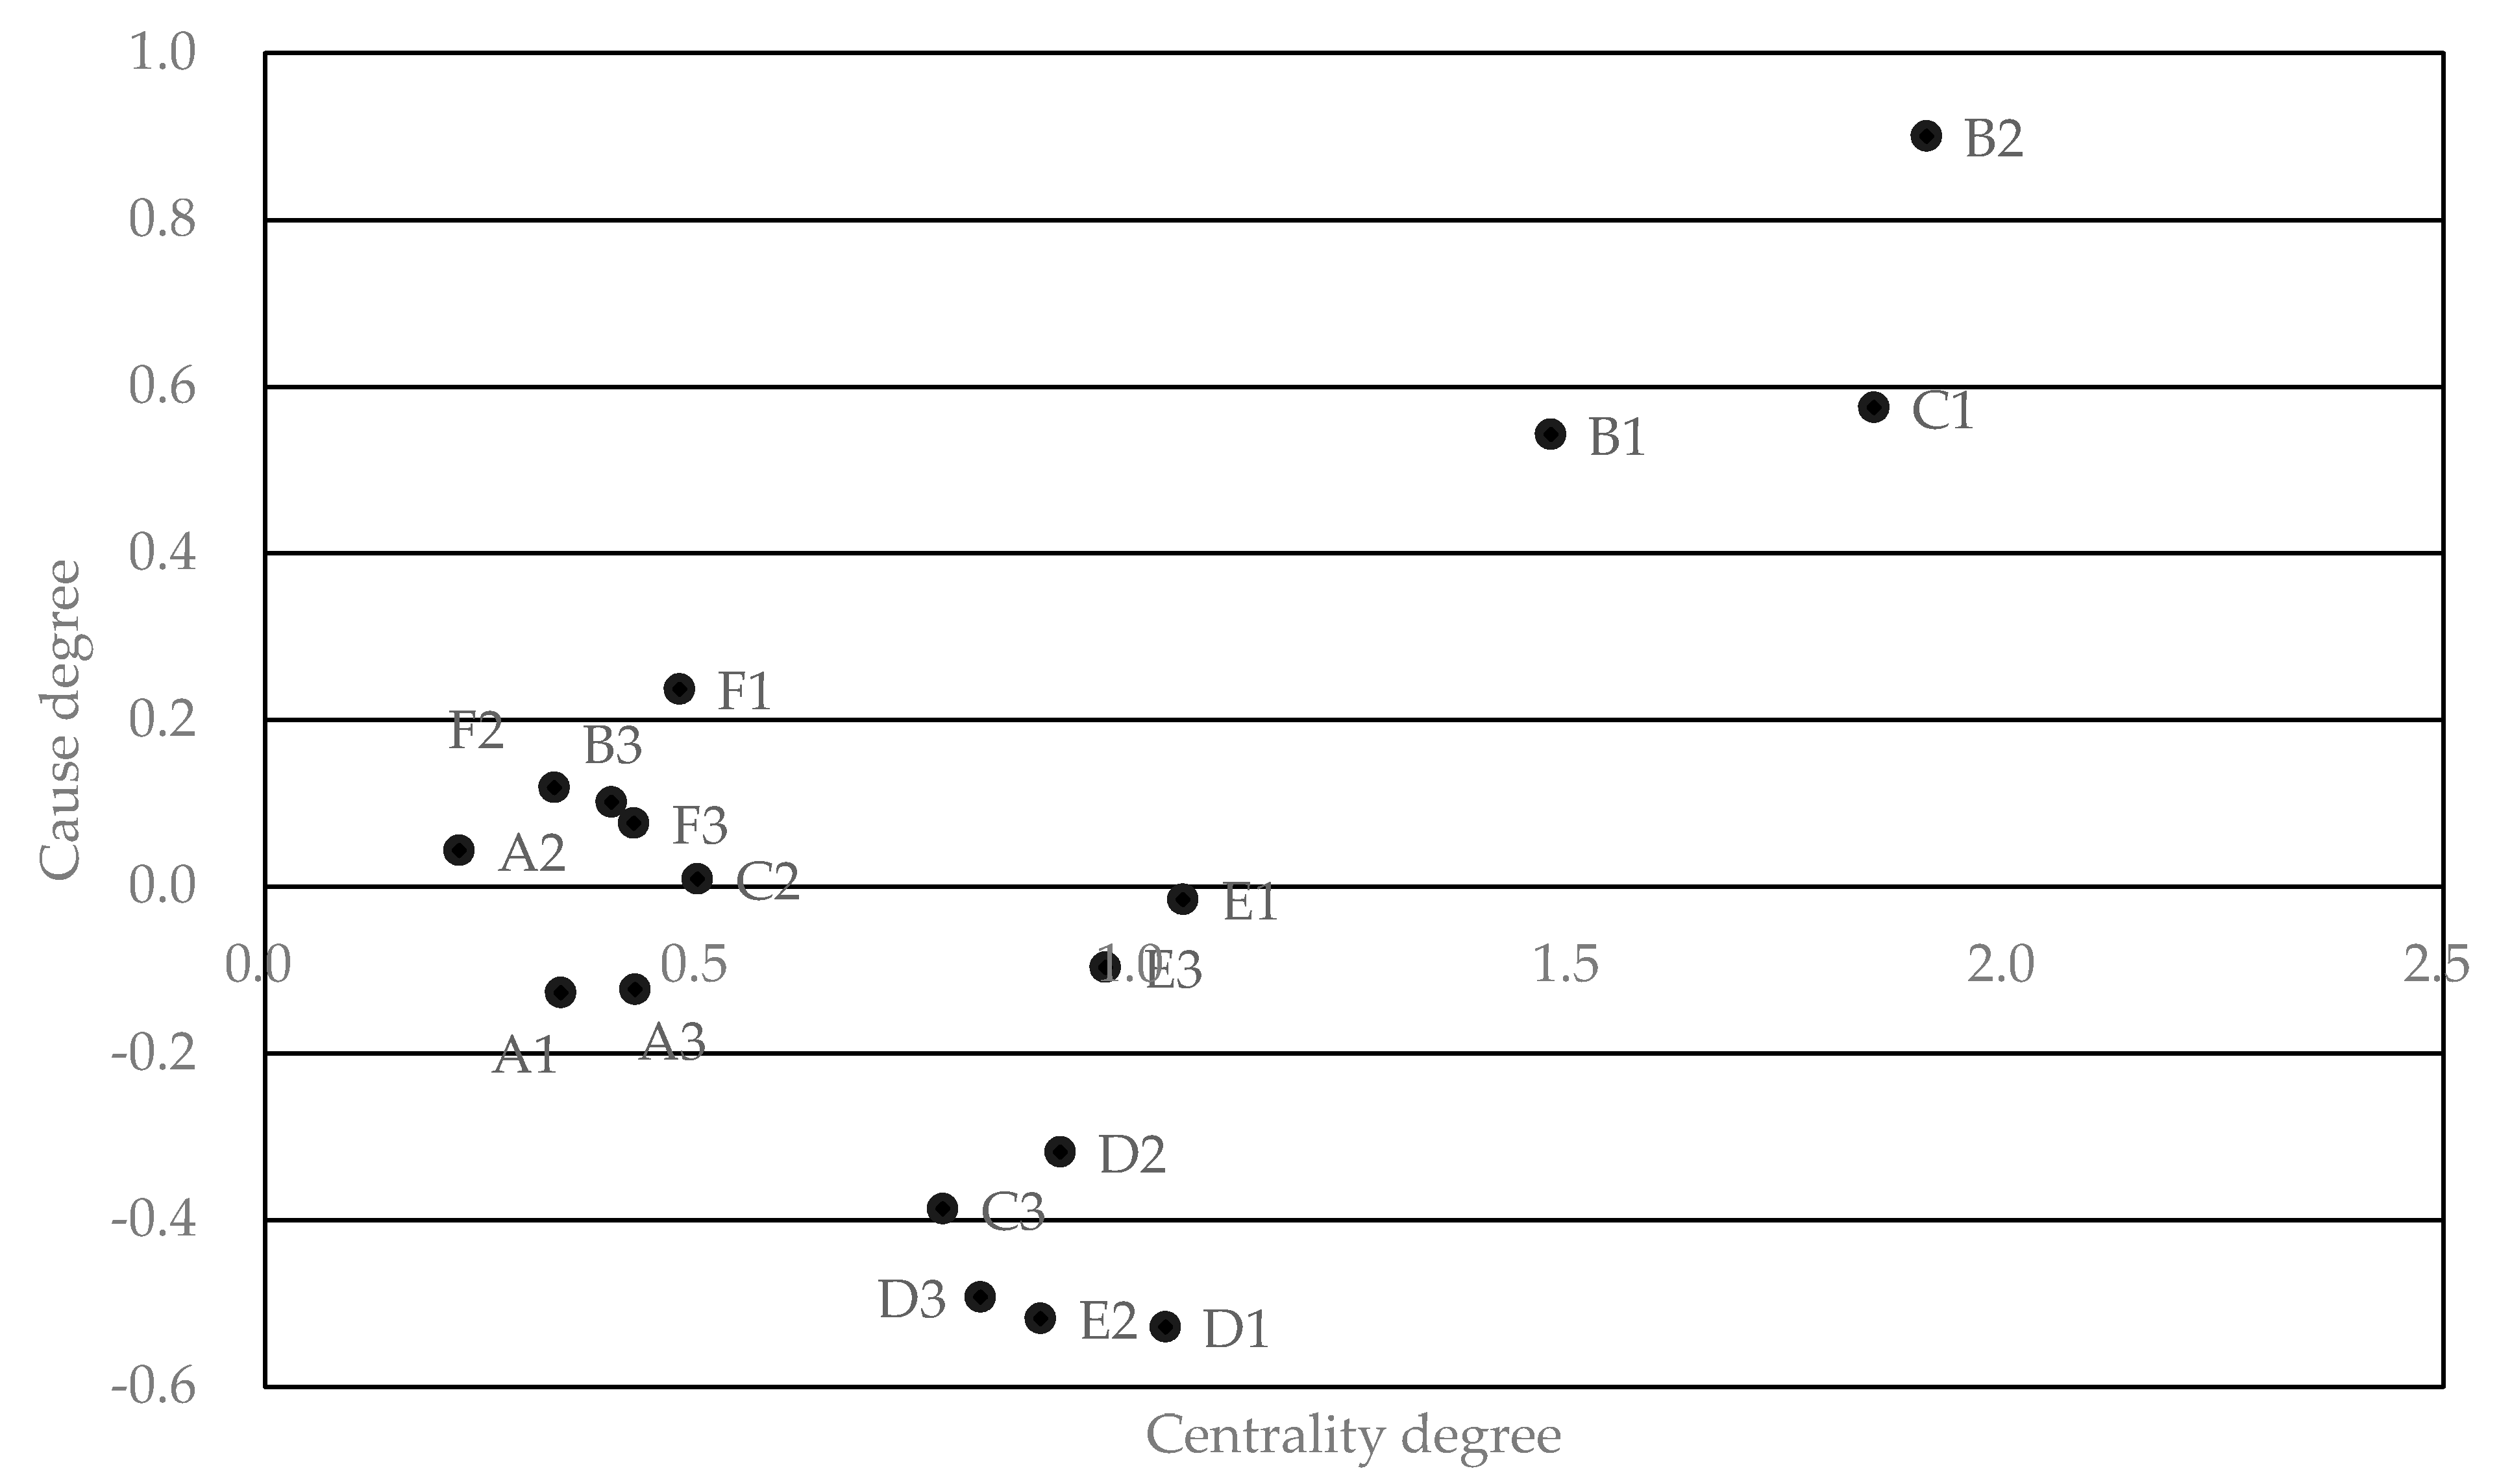
Among the top 5 indicators in terms of weight, three resilience indicators, transparency of information (B1), coordination and cooperation (B2), and capability and strategic planning (C1), are the cause indicators. This shows that the impact of these three indicators on other indicators in the evaluation system is greater than other indicators. On the other hand, agility in processes (D1) and risk awareness (E2) are effect indicators, which shows that these two indicators are easily affected by other indicators. When decision-makers implement optimization strategies for these two indicators, they should pay full attention to other indicators that impact these two indicators.
During the flood event in Hechuan District, Chongqing established an emergency command system, including two committees, eleven special offices, and four special commands. Nevertheless, the participation of multiple humanitarian agencies, companies, and more than 600 volunteers made coordination and information exchange difficult. Differences in the core interests of various organizations have rendered the relief efforts of many actors ineffective and marginalized. Many volunteers arrived with relief supplies but knew little about the situation. Furthermore, relief materials donated from all over the country flooded into Hechuan District due to the spread of the disaster on social media. However, the lack of coordination and information exchange resulted in the donated relief materials generally converging in one location, causing unnecessary waste. The Municipal Flood Control and Drought Relief Headquarters of Chongqing advocates the normalization of consultations on flood relief and conducts emergency consultations based on the trend of important periods and the important nodes. Such a model not only guarantees the combination of strategic planning and actual conditions but also realizes the agility of the process. This consultation model is very worthy of reference for humanitarian supply chain decision-makers when similar incidents occur. Risk awareness, especially the risk awareness training of disaster-affected people, needs to be improved. Due to the lack of accuracy of the early warning system, there was an early warning of the flood peak crossing in 2019, and many manufacturers chose to transfer their activities in anticipation of the flooding, which ultimately did not occur. When facing the flood peak transit early warning again in 2020, this has caused some people affected by the event to wait and see. This kind of wait-and-see behavior has caused serious losses to many small and medium-sized enterprises.
These research results are based on the flood relief operations in Hechuan District and can also be applied to any large-scale disaster relief activities. Although various disaster situations are different, this model can be followed to operate resilient humanitarian supply chains in different locations and for a range of hazards. This study proposes that transparency of information (B1), coordination and cooperation (B2), capability and strategic planning (C1), agility in processes (D1), and risk awareness (E2) are key indicators for building a resilient humanitarian supply chain. Decision-makers should take optimization measures based on a full understanding of the interrelationships between such indicators.
6. Conclusions and Future Research
Nowadays, frequent disasters have brought great trauma to the economy and people all over the world. However, the humanitarian supply chain, which is of great significance to post-disaster rescue, has to operate in a turbulent environment with uncertain demand. It is therefore apparent that any humanitarian supply chain must be resilient. The main contributions of this research are as follows. First, through literature review and the Delphi method, 18 indicators for building the resilience of the humanitarian supply chain are summarized. Secondly, according to the fuzzy-DEMATEL method, the interrelationships between these 18 indicators are determined, as shown in Figure 4. Finally, based on the ANP method, this research has derived the key indicators of these 18 indicators, including transparency of information (B1), coordination and cooperation (B2), capability and strategic planning (C1), agility in processes (D1), and risk awareness (E2). The finding of this research will help decision-makers involved in humanitarian supply chain management to visualize the interrelationships between the key indicators of resilience. These results will be of great significance for managers to have a deeper understanding of resilience indicators. Moreover, the approaches developed in this study can be applied not only to flood risk management but also to other disaster situations and in different locations.
There are some limitations to this study. First of all, sudden flood events can quite easily turn affected areas into “islands of information” [5]. For example, even if a hot air balloon with a mobile base station is launched as soon as possible, there will still be a period when information exchange becomes difficult, if not impossible. This brings a level of stochasticity to the planning of the humanitarian supply chain in emergencies. How to best plan for this stochasticity when seeking to improve the resilience of humanitarian supply chains in such emergencies should be explored in future research. Secondly, rescue workers often have to face different religious beliefs and regional cultures due to the different countries and regions where disasters occur. Humanitarian supply chain managers should also consider the differences in problem handling caused by these backgrounds. Thirdly, rescue workers come from very diverse backgrounds with, for example, different education levels and experiences. How these characteristics impact the resilience of the humanitarian supply chain is an area needing further inquiry and investigation. Finally, this research has focused on the development of the humanitarian supply chain resilience mainly during the response stage. Further research is also needed in different phases of the flood risk management cycle such as the recovery phase.
Author Contributions
All authors were involved in the production and writing of the manuscript. Conceptualization, W.X.; methodology, W.X. and S.X.; software, S.X.; validation, W.X., S.X., D.P. and Z.Z.; investigation, W.X. and S.X.; data curation, W.X. and S.X.; writing—original draft preparation, W.X. and S.X.; writing—review and editing, W.X., S.X., D.P. and Z.Z.; visualization, S.X.; supervision, D.P. and Z.Z. All authors have read and agreed to the published version of the manuscript.
Funding
This research was funded by the National Natural Science Foundation of China [grant no. 71503194], the Foundation of Education Department of Hubei Province [grant no. B2020312], and the Center for Service Science and Engineering Foundation of WUST [grant no. CSSE2017GA02].
Institutional Review Board Statement
Not applicable.
Informed Consent Statement
Informed consent was obtained from all subjects involved in the study.
Data Availability Statement
Some or all data, models, or code that support the findings of this study are available from the corresponding author upon reasonable request.
Conflicts of Interest
The authors declare no conflict of interest.
Appendix A

Table A1.
The normalized total influence.
| A1 | A2 | A3 | B1 | B2 | B3 | C1 | C2 | C3 | D1 | D2 | D3 | E1 | E2 | E3 | F1 | F2 | F3 | |
|---|---|---|---|---|---|---|---|---|---|---|---|---|---|---|---|---|---|---|
| A1 | 0.000 | 0.000 | 0.000 | 0.000 | 0.000 | 0.000 | 0.043 | 0.000 | 0.000 | 0.000 | 0.000 | 0.000 | 0.000 | 0.000 | 0.000 | 0.000 | 0.000 | 0.000 |
| A2 | 0.000 | 0.000 | 0.000 | 0.000 | 0.000 | 0.000 | 0.000 | 0.000 | 0.064 | 0.000 | 0.000 | 0.044 | 0.000 | 0.000 | 0.000 | 0.000 | 0.000 | 0.000 |
| A3 | 0.000 | 0.000 | 0.000 | 0.000 | 0.000 | 0.000 | 0.065 | 0.000 | 0.000 | 0.000 | 0.000 | 0.000 | 0.000 | 0.000 | 0.000 | 0.000 | 0.000 | 0.000 |
| B1 | 0.100 | 0.000 | 0.000 | 0.000 | 0.050 | 0.032 | 0.121 | 0.116 | 0.084 | 0.039 | 0.074 | 0.000 | 0.126 | 0.098 | 0.086 | 0.000 | 0.000 | 0.000 |
| B2 | 0.043 | 0.033 | 0.106 | 0.115 | 0.000 | 0.067 | 0.099 | 0.000 | 0.095 | 0.135 | 0.097 | 0.138 | 0.107 | 0.081 | 0.102 | 0.033 | 0.035 | 0.067 |
| B3 | 0.000 | 0.000 | 0.000 | 0.051 | 0.067 | 0.000 | 0.000 | 0.000 | 0.000 | 0.000 | 0.000 | 0.000 | 0.000 | 0.000 | 0.000 | 0.000 | 0.000 | 0.000 |
| C1 | 0.000 | 0.000 | 0.000 | 0.084 | 0.117 | 0.000 | 0.033 | 0.053 | 0.102 | 0.140 | 0.125 | 0.107 | 0.070 | 0.111 | 0.090 | 0.045 | 0.034 | 0.050 |
| C2 | 0.000 | 0.000 | 0.000 | 0.000 | 0.036 | 0.000 | 0.047 | 0.000 | 0.000 | 0.000 | 0.000 | 0.050 | 0.000 | 0.035 | 0.000 | 0.000 | 0.000 | 0.000 |
| C3 | 0.000 | 0.000 | 0.000 | 0.000 | 0.000 | 0.000 | 0.034 | 0.000 | 0.000 | 0.000 | 0.000 | 0.079 | 0.000 | 0.000 | 0.000 | 0.000 | 0.000 | 0.000 |
| D1 | 0.000 | 0.000 | 0.000 | 0.000 | 0.037 | 0.000 | 0.046 | 0.000 | 0.000 | 0.000 | 0.000 | 0.050 | 0.000 | 0.037 | 0.000 | 0.000 | 0.000 | 0.000 |
| D2 | 0.000 | 0.000 | 0.000 | 0.000 | 0.035 | 0.000 | 0.000 | 0.000 | 0.000 | 0.090 | 0.000 | 0.000 | 0.000 | 0.070 | 0.035 | 0.000 | 0.000 | 0.000 |
| D3 | 0.000 | 0.000 | 0.000 | 0.000 | 0.032 | 0.000 | 0.000 | 0.000 | 0.035 | 0.000 | 0.000 | 0.000 | 0.032 | 0.000 | 0.000 | 0.000 | 0.000 | 0.000 |
| E1 | 0.000 | 0.000 | 0.000 | 0.000 | 0.000 | 0.000 | 0.070 | 0.000 | 0.051 | 0.038 | 0.112 | 0.000 | 0.000 | 0.094 | 0.074 | 0.000 | 0.000 | 0.000 |
| E2 | 0.000 | 0.000 | 0.000 | 0.033 | 0.000 | 0.000 | 0.000 | 0.000 | 0.000 | 0.065 | 0.000 | 0.000 | 0.000 | 0.000 | 0.000 | 0.000 | 0.000 | 0.000 |
| E3 | 0.000 | 0.000 | 0.000 | 0.000 | 0.000 | 0.000 | 0.000 | 0.000 | 0.033 | 0.111 | 0.085 | 0.000 | 0.066 | 0.079 | 0.000 | 0.000 | 0.000 | 0.000 |
| F1 | 0.039 | 0.000 | 0.000 | 0.065 | 0.000 | 0.000 | 0.000 | 0.000 | 0.000 | 0.037 | 0.000 | 0.037 | 0.040 | 0.000 | 0.000 | 0.000 | 0.000 | 0.000 |
| F2 | 0.000 | 0.000 | 0.000 | 0.000 | 0.000 | 0.000 | 0.000 | 0.000 | 0.000 | 0.000 | 0.037 | 0.000 | 0.000 | 0.038 | 0.066 | 0.000 | 0.000 | 0.000 |
| F3 | 0.000 | 0.000 | 0.000 | 0.036 | 0.035 | 0.000 | 0.000 | 0.000 | 0.037 | 0.048 | 0.000 | 0.000 | 0.000 | 0.000 | 0.000 | 0.000 | 0.000 | 0.000 |
Table A2.
The unweighted super-matrix.
| A1 | A2 | A3 | B1 | B2 | B3 | C1 | C2 | C3 | D1 | D2 | D3 | E1 | E2 | E3 | F1 | F2 | F3 | |
|---|---|---|---|---|---|---|---|---|---|---|---|---|---|---|---|---|---|---|
| A1 | 0.000 | 0.000 | 0.000 | 1.000 | 0.196 | 0.000 | 0.000 | 0.000 | 0.000 | 0.000 | 0.000 | 0.000 | 0.000 | 0.000 | 0.000 | 1.000 | 0.000 | 0.000 |
| A2 | 0.000 | 0.000 | 0.000 | 0.000 | 0.311 | 0.000 | 0.000 | 0.000 | 0.000 | 0.000 | 0.000 | 0.000 | 0.000 | 0.000 | 0.000 | 0.000 | 0.000 | 0.000 |
| A3 | 0.000 | 0.000 | 0.000 | 0.000 | 0.493 | 0.000 | 0.000 | 0.000 | 0.000 | 0.000 | 0.000 | 0.000 | 0.000 | 0.000 | 0.000 | 0.000 | 0.000 | 0.000 |
| B1 | 0.000 | 0.000 | 0.000 | 0.000 | 0.750 | 0.667 | 0.333 | 0.000 | 0.000 | 0.000 | 0.000 | 0.000 | 0.000 | 1.000 | 0.000 | 1.000 | 0.000 | 0.500 |
| B2 | 0.000 | 0.000 | 0.000 | 0.750 | 0.000 | 0.333 | 0.667 | 1.000 | 0.000 | 1.000 | 1.000 | 1.000 | 0.000 | 0.000 | 0.000 | 0.000 | 0.000 | 0.500 |
| B3 | 0.000 | 0.000 | 0.000 | 0.250 | 0.250 | 0.000 | 0.000 | 0.000 | 0.000 | 0.000 | 0.000 | 0.000 | 0.000 | 0.000 | 0.000 | 0.000 | 0.000 | 0.000 |
| C1 | 1.000 | 0.000 | 1.000 | 0.540 | 0.540 | 0.000 | 0.540 | 1.000 | 1.000 | 1.000 | 0.000 | 0.000 | 0.667 | 0.000 | 0.000 | 0.000 | 0.000 | 0.000 |
| C2 | 0.000 | 0.000 | 0.000 | 0.297 | 0.297 | 0.000 | 0.297 | 0.000 | 0.000 | 0.000 | 0.000 | 0.000 | 0.000 | 0.000 | 0.000 | 0.000 | 0.000 | 0.000 |
| C3 | 0.000 | 1.000 | 0.000 | 0.163 | 0.163 | 0.000 | 0.163 | 0.000 | 0.000 | 0.000 | 0.000 | 1.000 | 0.333 | 0.000 | 1.000 | 0.000 | 0.000 | 1.000 |
| D1 | 0.000 | 0.000 | 0.000 | 0.500 | 0.400 | 0.000 | 0.400 | 0.000 | 0.000 | 0.000 | 1.000 | 0.000 | 0.500 | 1.000 | 0.500 | 0.667 | 0.000 | 1.000 |
| D2 | 0.000 | 0.000 | 0.000 | 0.500 | 0.400 | 0.000 | 0.400 | 0.000 | 0.000 | 0.000 | 0.000 | 0.000 | 0.500 | 0.000 | 0.500 | 0.000 | 1.000 | 0.000 |
| D3 | 0.000 | 1.000 | 0.000 | 0.000 | 0.200 | 0.000 | 0.200 | 1.000 | 1.000 | 1.000 | 0.000 | 0.000 | 0.000 | 0.000 | 0.000 | 0.333 | 0.000 | 0.000 |
| E1 | 0.000 | 0.000 | 0.000 | 0.400 | 0.400 | 0.000 | 0.400 | 0.000 | 0.000 | 0.000 | 0.000 | 1.000 | 0.000 | 0.000 | 0.333 | 1.000 | 0.000 | 0.000 |
| E2 | 0.000 | 0.000 | 0.000 | 0.400 | 0.400 | 0.000 | 0.400 | 1.000 | 0.000 | 1.000 | 0.667 | 0.000 | 0.667 | 0.000 | 0.667 | 0.000 | 0.667 | 0.000 |
| E3 | 0.000 | 0.000 | 0.000 | 0.200 | 0.200 | 0.000 | 0.200 | 0.000 | 0.000 | 0.000 | 0.333 | 0.000 | 0.333 | 0.000 | 0.000 | 0.000 | 0.333 | 0.000 |
| F1 | 0.000 | 0.000 | 0.000 | 0.000 | 0.493 | 0.000 | 0.400 | 0.000 | 0.000 | 0.000 | 0.000 | 0.000 | 0.000 | 0.000 | 0.000 | 0.000 | 0.000 | 0.000 |
| F2 | 0.000 | 0.000 | 0.000 | 0.000 | 0.311 | 0.000 | 0.400 | 0.000 | 0.000 | 0.000 | 0.000 | 0.000 | 0.000 | 0.000 | 0.000 | 0.000 | 0.000 | 0.000 |
| F3 | 0.000 | 0.000 | 0.000 | 0.000 | 0.196 | 0.000 | 0.200 | 0.000 | 0.000 | 0.000 | 0.000 | 0.000 | 0.000 | 0.000 | 0.000 | 0.000 | 0.000 | 0.000 |
Table A3.
The weighted super-matrix.
| A1 | A2 | A3 | B1 | B2 | B3 | C1 | C2 | C3 | D1 | D2 | D3 | E1 | E2 | E3 | F1 | F2 | F3 | |
|---|---|---|---|---|---|---|---|---|---|---|---|---|---|---|---|---|---|---|
| A1 | 0.000 | 0.000 | 0.000 | 0.088 | 0.016 | 0.000 | 0.000 | 0.000 | 0.000 | 0.000 | 0.000 | 0.000 | 0.000 | 0.000 | 0.000 | 0.123 | 0.000 | 0.000 |
| A2 | 0.000 | 0.000 | 0.000 | 0.000 | 0.026 | 0.000 | 0.000 | 0.000 | 0.000 | 0.000 | 0.000 | 0.000 | 0.000 | 0.000 | 0.000 | 0.000 | 0.000 | 0.000 |
| A3 | 0.000 | 0.000 | 0.000 | 0.000 | 0.041 | 0.000 | 0.000 | 0.000 | 0.000 | 0.000 | 0.000 | 0.000 | 0.000 | 0.000 | 0.000 | 0.000 | 0.000 | 0.000 |
| B1 | 0.000 | 0.000 | 0.000 | 0.000 | 0.267 | 0.667 | 0.113 | 0.000 | 0.000 | 0.000 | 0.000 | 0.000 | 0.000 | 0.701 | 0.000 | 0.509 | 0.000 | 0.256 |
| B2 | 0.000 | 0.000 | 0.000 | 0.285 | 0.000 | 0.333 | 0.227 | 0.367 | 0.000 | 0.460 | 0.589 | 0.522 | 0.000 | 0.000 | 0.000 | 0.000 | 0.000 | 0.256 |
| B3 | 0.000 | 0.000 | 0.000 | 0.095 | 0.089 | 0.000 | 0.000 | 0.000 | 0.000 | 0.000 | 0.000 | 0.000 | 0.000 | 0.000 | 0.000 | 0.000 | 0.000 | 0.000 |
| C1 | 1.000 | 0.000 | 1.000 | 0.143 | 0.134 | 0.000 | 0.184 | 0.367 | 0.734 | 0.220 | 0.000 | 0.000 | 0.328 | 0.000 | 0.000 | 0.000 | 0.000 | 0.000 |
| C2 | 0.000 | 0.000 | 0.000 | 0.079 | 0.074 | 0.000 | 0.101 | 0.000 | 0.000 | 0.000 | 0.000 | 0.000 | 0.000 | 0.000 | 0.000 | 0.000 | 0.000 | 0.000 |
| C3 | 0.000 | 0.750 | 0.000 | 0.043 | 0.041 | 0.000 | 0.056 | 0.000 | 0.000 | 0.000 | 0.000 | 0.250 | 0.164 | 0.000 | 0.493 | 0.000 | 0.000 | 0.304 |
| D1 | 0.000 | 0.000 | 0.000 | 0.063 | 0.047 | 0.000 | 0.049 | 0.000 | 0.000 | 0.000 | 0.153 | 0.000 | 0.105 | 0.299 | 0.105 | 0.123 | 0.000 | 0.185 |
| D2 | 0.000 | 0.000 | 0.000 | 0.063 | 0.047 | 0.000 | 0.049 | 0.000 | 0.000 | 0.000 | 0.000 | 0.000 | 0.105 | 0.000 | 0.105 | 0.000 | 0.500 | 0.000 |
| D3 | 0.000 | 0.250 | 0.000 | 0.000 | 0.023 | 0.000 | 0.025 | 0.133 | 0.266 | 0.119 | 0.000 | 0.000 | 0.000 | 0.000 | 0.000 | 0.061 | 0.000 | 0.000 |
| E1 | 0.000 | 0.000 | 0.000 | 0.057 | 0.053 | 0.000 | 0.049 | 0.000 | 0.000 | 0.000 | 0.000 | 0.228 | 0.000 | 0.000 | 0.099 | 0.184 | 0.000 | 0.000 |
| E2 | 0.000 | 0.000 | 0.000 | 0.057 | 0.053 | 0.000 | 0.049 | 0.133 | 0.000 | 0.201 | 0.172 | 0.000 | 0.199 | 0.000 | 0.199 | 0.000 | 0.333 | 0.000 |
| E3 | 0.000 | 0.000 | 0.000 | 0.028 | 0.027 | 0.000 | 0.025 | 0.000 | 0.000 | 0.000 | 0.086 | 0.000 | 0.099 | 0.000 | 0.000 | 0.000 | 0.167 | 0.000 |
| F1 | 0.000 | 0.000 | 0.000 | 0.000 | 0.030 | 0.000 | 0.029 | 0.000 | 0.000 | 0.000 | 0.000 | 0.000 | 0.000 | 0.000 | 0.000 | 0.000 | 0.000 | 0.000 |
| F2 | 0.000 | 0.000 | 0.000 | 0.000 | 0.019 | 0.000 | 0.029 | 0.000 | 0.000 | 0.000 | 0.000 | 0.000 | 0.000 | 0.000 | 0.000 | 0.000 | 0.000 | 0.000 |
| F3 | 0.000 | 0.000 | 0.000 | 0.000 | 0.012 | 0.000 | 0.015 | 0.000 | 0.000 | 0.000 | 0.000 | 0.000 | 0.000 | 0.000 | 0.000 | 0.000 | 0.000 | 0.000 |
Table A4.
The limiting super-matrix.
| A1 | A2 | A3 | B1 | B2 | B3 | C1 | C2 | C3 | D1 | D2 | D3 | E1 | E2 | E3 | F1 | F2 | F3 | |
|---|---|---|---|---|---|---|---|---|---|---|---|---|---|---|---|---|---|---|
| A1 | 0.017 | 0.017 | 0.017 | 0.017 | 0.017 | 0.017 | 0.017 | 0.017 | 0.017 | 0.017 | 0.017 | 0.017 | 0.017 | 0.017 | 0.017 | 0.017 | 0.017 | 0.017 |
| A2 | 0.005 | 0.005 | 0.005 | 0.005 | 0.005 | 0.005 | 0.005 | 0.005 | 0.005 | 0.005 | 0.005 | 0.005 | 0.005 | 0.005 | 0.005 | 0.005 | 0.005 | 0.005 |
| A3 | 0.008 | 0.008 | 0.008 | 0.008 | 0.008 | 0.008 | 0.008 | 0.008 | 0.008 | 0.008 | 0.008 | 0.008 | 0.008 | 0.008 | 0.008 | 0.008 | 0.008 | 0.008 |
| B1 | 0.149 | 0.149 | 0.149 | 0.149 | 0.149 | 0.149 | 0.149 | 0.149 | 0.149 | 0.149 | 0.149 | 0.149 | 0.149 | 0.149 | 0.149 | 0.149 | 0.149 | 0.149 |
| B2 | 0.188 | 0.188 | 0.188 | 0.188 | 0.188 | 0.188 | 0.188 | 0.188 | 0.188 | 0.188 | 0.188 | 0.188 | 0.188 | 0.188 | 0.188 | 0.188 | 0.188 | 0.188 |
| B3 | 0.031 | 0.031 | 0.031 | 0.031 | 0.031 | 0.031 | 0.031 | 0.031 | 0.031 | 0.031 | 0.031 | 0.031 | 0.031 | 0.031 | 0.031 | 0.031 | 0.031 | 0.031 |
| C1 | 0.195 | 0.195 | 0.195 | 0.195 | 0.195 | 0.195 | 0.195 | 0.195 | 0.195 | 0.195 | 0.195 | 0.195 | 0.195 | 0.195 | 0.195 | 0.195 | 0.195 | 0.195 |
| C2 | 0.045 | 0.045 | 0.045 | 0.045 | 0.045 | 0.045 | 0.045 | 0.045 | 0.045 | 0.045 | 0.045 | 0.045 | 0.045 | 0.045 | 0.045 | 0.045 | 0.045 | 0.045 |
| C3 | 0.058 | 0.058 | 0.058 | 0.058 | 0.058 | 0.058 | 0.058 | 0.058 | 0.058 | 0.058 | 0.058 | 0.058 | 0.058 | 0.058 | 0.058 | 0.058 | 0.058 | 0.058 |
| D1 | 0.064 | 0.064 | 0.064 | 0.064 | 0.064 | 0.064 | 0.064 | 0.064 | 0.064 | 0.064 | 0.064 | 0.064 | 0.064 | 0.064 | 0.064 | 0.064 | 0.064 | 0.064 |
| D2 | 0.039 | 0.039 | 0.039 | 0.039 | 0.039 | 0.039 | 0.039 | 0.039 | 0.039 | 0.039 | 0.039 | 0.039 | 0.039 | 0.039 | 0.039 | 0.039 | 0.039 | 0.039 |
| D3 | 0.040 | 0.040 | 0.040 | 0.040 | 0.040 | 0.040 | 0.040 | 0.040 | 0.040 | 0.040 | 0.040 | 0.040 | 0.040 | 0.040 | 0.040 | 0.040 | 0.040 | 0.040 |
| E1 | 0.042 | 0.042 | 0.042 | 0.042 | 0.042 | 0.042 | 0.042 | 0.042 | 0.042 | 0.042 | 0.042 | 0.042 | 0.042 | 0.042 | 0.042 | 0.042 | 0.042 | 0.042 |
| E2 | 0.070 | 0.070 | 0.070 | 0.070 | 0.070 | 0.070 | 0.070 | 0.070 | 0.070 | 0.070 | 0.070 | 0.070 | 0.070 | 0.070 | 0.070 | 0.070 | 0.070 | 0.070 |
| E3 | 0.023 | 0.023 | 0.023 | 0.023 | 0.023 | 0.023 | 0.023 | 0.023 | 0.023 | 0.023 | 0.023 | 0.023 | 0.023 | 0.023 | 0.023 | 0.023 | 0.023 | 0.023 |
| F1 | 0.011 | 0.011 | 0.011 | 0.011 | 0.011 | 0.011 | 0.011 | 0.011 | 0.011 | 0.011 | 0.011 | 0.011 | 0.011 | 0.011 | 0.011 | 0.011 | 0.011 | 0.011 |
| F2 | 0.009 | 0.009 | 0.009 | 0.009 | 0.009 | 0.009 | 0.009 | 0.009 | 0.009 | 0.009 | 0.009 | 0.009 | 0.009 | 0.009 | 0.009 | 0.009 | 0.009 | 0.009 |
| F3 | 0.005 | 0.005 | 0.005 | 0.005 | 0.005 | 0.005 | 0.005 | 0.005 | 0.005 | 0.005 | 0.005 | 0.005 | 0.005 | 0.005 | 0.005 | 0.005 | 0.005 | 0.005 |
References
- Haltas, I.; Yildirim, E.; Oztas, F.; Demir, I. A Comprehensive Flood Event Specification and Inventory: 1930–2020 Turkey Case Study. Int. J. Disaster Risk Reduct. 2021, 56, 102086. [Google Scholar] [CrossRef]
- Zhang, H.; Yang, J.; Li, L.; Shen, D.; Wei, G.; Khan, H.U.R.; Dong, S. Measuring the Resilience to Floods: A Comparative Analysis of Key Flood Control Cities in China. Int. J. Disaster Risk Reduct. 2021, 59, 102248. [Google Scholar] [CrossRef]
- Kundzewicz, Z.W.; Huang, J.; Pinskwar, I.; Su, B.; Szwed, M.; Jiang, T. Climate Variability and Floods in China-A Review. Earth Sci. Rev. 2020, 211, 103434. [Google Scholar] [CrossRef]
- Wu, H.; Li, X.; Schumann, G.J.-P.; Alfieri, L.; Chen, Y.; Xu, H.; Wu, Z.; Lu, H.; Hu, Y.; Zhu, Q.; et al. From China’s Heavy Precipitation in 2020 to a “Glocal” Hydrometeorological Solution for Flood Risk Prediction. Adv. Atmos. Sci. 2021, 38, 1. [Google Scholar] [CrossRef]
- Nagendra, N.P.; Narayanamurthy, G.; Moser, R. Management of Humanitarian Relief Operations Using Satellite Big Data Analytics: The Case of Kerala Floods. Ann. Oper. Res. 2020, 1–26. [Google Scholar] [CrossRef]
- Alem, D.; Bonilla-Londono, H.F.; Barbosa-Povoa, A.P.; Relvas, S.; Ferreira, D.; Moreno, A. Building Disaster Preparedness and Response Capacity in Humanitarian Supply Chains Using the Social Vulnerability Index. Eur. J. Oper. Res. 2021, 292, 250–275. [Google Scholar] [CrossRef]
- Lin, A.; Wu, H.; Liang, G.; Cardenas-Tristan, A.; Wu, X.; Zhao, C.; Li, D. A Big Data-Driven Dynamic Estimation Model of Relief Supplies Demand in Urban Flood Disaster. Int. J. Disaster Risk Reduct. 2020, 49, 101682. [Google Scholar] [CrossRef]
- Papadopoulos, T.; Gunasekaran, A.; Dubey, R.; Altay, N.; Childe, S.J.; Fosso-Wamba, S. The Role of Big Data in Explaining Disaster Resilience in Supply Chains for Sustainability. J. Clean Prod. 2017, 142, 1108–1118. [Google Scholar] [CrossRef] [Green Version]
- Gutierrez, M.T.E.; Mutuc, J.E.S. A Model for Humanitarian Supply Chain: An Operation Research Approach. Procedia Eng. 2018, 212, 659–666. [Google Scholar] [CrossRef]
- Balcik, B.; Bozkir, C.D.C.; Kundakcioglu, O.E. A Literature Review on Inventory Management in Humanitarian Supply Chains. Surv. Oper. Res. Manag. Sci. 2016, 21, 101–116. [Google Scholar] [CrossRef]
- Jermsittiparsert, K.; Kampoomprasert, A. The Agility, Adaptability, and Alignment as the Determinants of the Sustainable Humanitarian Supply Chain Design. Humanit. Soc. Sci. Rev. 2019, 7, 539–547. [Google Scholar] [CrossRef] [Green Version]
- Singh, R.K.; Gupta, A.; Gunasekaran, A. Analysing the Interaction of Factors for Resilient Humanitarian Supply Chain. Int. J. Prod. Res. 2018, 56, 6809–6827. [Google Scholar] [CrossRef]
- Zarei, M.H.; Carrasco Gallego, R.; Ronchi, S. On the role of regional hubs in the environmental sustainability of humanitarian supply chains. Sustain. Dev. 2019, 27, 846–859. [Google Scholar] [CrossRef]
- Sahebi, I.G.; Masoomi, B.; Ghorbani, S. Expert Oriented Approach for Analyzing the Blockchain Adoption Barriers in Humanitarian Supply Chain. Technol. Soc. 2020, 63, 101427. [Google Scholar] [CrossRef]
- Fiorini, P.D.C.; Jabbour, C.J.C.; Jabbour, A.B.L.D.S.; Ramsden, G. The Human Side of Humanitarian Supply Chains: A Research Agenda and Systematization Framework. Ann. Oper. Res. 2021, 1–26. [Google Scholar]
- Baharmand, H.; Comes, T.; Lauras, M. Defining and Measuring the Network Flexibility of Humanitarian Supply Chains: Insights from the 2015 Nepal Earthquake. Ann. Oper. Res. 2019, 283, 961–1000. [Google Scholar] [CrossRef]
- Biswal, A.K.; Jenamani, M.; Kumar, S.K. Warehouse Efficiency Improvement Using RFID in a Humanitarian Supply Chain: Implications for Indian Food Security System. Transportn. Res. E-Log. 2018, 109, 205–224. [Google Scholar] [CrossRef]
- Özdamar, L.; Ertem, M.A. Models, Solutions and Enabling Technologies in Humanitarian Logistics. Eur. J. Oper. Res. 2015, 244, 55–65. [Google Scholar] [CrossRef]
- Stewart, M.; Ivanov, D. Design Redundancy in Agile and Resilient Humanitarian Supply Chains. Ann. Oper. Res. 2019, 1–27. [Google Scholar] [CrossRef]
- Rajesh, R. On sustainability, resilience, and the sustainable–resilient supply networks. Sustain. Prod. Consum. 2018, 15, 74–88. [Google Scholar] [CrossRef]
- Agarwal, S.; Kant, R.; Shankar, R. Evaluating Solutions to Overcome Humanitarian Supply Chain Management Barriers: A Hybrid Fuzzy SWARA—Fuzzy WASPAS Approach. Int. J. Disaster Risk Reduct. 2020, 51, 101838. [Google Scholar] [CrossRef]
- Venkatesh, V.G.; Zhang, A.; Deakins, E.; Luthra, S.; Mangla, S. A fuzzy AHP-TOPSIS approach to supply partner selection in continuous aid humanitarian supply chains. Ann. Oper. Res. 2019, 283, 1517–1550. [Google Scholar] [CrossRef]
- Behl, A.; Dutta, P. Humanitarian Supply Chain Management: A Thematic Literature Review and Future Directions of Research. Ann. Oper. Res. 2019, 283, 1001–1044. [Google Scholar] [CrossRef]
- Fathalikhani, S.; Hafezalkotob, A.; Soltani, R. Government intervention on cooperation, competition, and coopetition of humanitarian supply chains. Socio-Econ. Plan Sci. 2020, 69, 100715. [Google Scholar] [CrossRef]
- Hashemi Petrudi, S.H.; Tavana, M.; Abdi, M. A Comprehensive Framework for Analyzing Challenges in Humanitarian Supply Chain Management: A Case Study of the Iranian Red Crescent Society. Int. J. Disaster Risk Reduct. 2020, 42, 101340. [Google Scholar] [CrossRef]
- Zhang, J.; Wang, Z.; Ren, F. Optimization of Humanitarian Relief Supply Chain Reliability: A Case Study of the Ya’an Earthquake. Ann. Oper. Res. 2019, 283, 1551–1572. [Google Scholar] [CrossRef]
- Nagurney, A.; Qiang, Q. Quantifying Supply Chain Network Synergy for Humanitarian Organizations. Ibm J. Res. Dev. 2020, 64, 11–12. [Google Scholar] [CrossRef] [Green Version]
- Kunz, N.; Gold, S. Sustainable humanitarian supply chain management—exploring new theory. Int. J. Logist Res. App. 2015, 20, 85–104. [Google Scholar] [CrossRef]
- Munyaka, J.B.; Yadavalli, V.S.S. Using transportation problem in humanitarian supply chain to prepositioned facility locations: A case study in the Democratic Republic of the Congo. Int. J. Syst. Assur. Eng. Manag. 2021, 12, 199–216. [Google Scholar] [CrossRef]
- Azmat, M.; Kummer, S. Potential applications of unmanned ground and aerial vehicles to mitigate challenges of transport and logistics-related critical success factors in the humanitarian supply chain. Asian J. Sustain. Soc. Responsib. 2020, 5, 1–22. [Google Scholar] [CrossRef] [Green Version]
- Prasad, S.; Zakaria, R.; Altay, N. Big Data in Humanitarian Supply Chain Networks: A Resource Dependence Perspective. Ann. Oper. Res. 2018, 270, 383–413. [Google Scholar] [CrossRef] [Green Version]
- Chen, F.; Liu, S.; Appolloni, A. Horizontal Coordination of I-LNGOs in the Humanitarian Supply Chain: An Evolutionary Game Approach. Sustainability 2020, 12, 5953. [Google Scholar] [CrossRef]
- Dubey, R.; Gunasekaran, A.; Bryde, D.J.; Dwivedi, Y.K.; Papadopoulos, T. Blockchain Technology for Enhancing Swift-Trust, Collaboration and Resilience within a Humanitarian Supply Chain Setting. Int. J. Prod. Res. 2020, 58, 3381–3398. [Google Scholar] [CrossRef]
- Dubey, R.; Bryde, D.J.; Foropon, C.; Graham, G.; Giannakis, M.; Mishra, D.B. Agility in humanitarian supply chain: An organizational information processing perspective and relational view. Ann. Oper. Res. 2020, 1–21. [Google Scholar] [CrossRef]
- John, L.; Gurumurthy, A.; Soni, G.; Jain, V. Modelling the Inter-Relationship between Factors Affecting Coordination in a Humanitarian Supply Chain: A Case of Chennai Flood Relief. Ann. Oper. Res. 2019, 283, 1227–1258. [Google Scholar] [CrossRef]
- Ali Torabi, S.; Shokr, I.; Tofighi, S.; Heydari, J. Integrated relief pre-positioning and procurement planning in humanitarian supply chains. Transport. Res. E-Log. 2018, 113, 123–146. [Google Scholar] [CrossRef]
- L’Hermitte, C.; Brooks, B.; Bowles, M.; Tatham, P.H. Investigating the strategic antecedents of agility in humanitarian logistics. Disasters 2017, 41, 672–695. [Google Scholar] [CrossRef]
- John, L.; Ramesh, A. Humanitarian supply chain management in India: A SAP-LAP framework. J. Adv. Manag. Res. 2012, 9, 217–235. [Google Scholar] [CrossRef]
- Nayak, R.; Choudhary, S. Operational excellence in humanitarian logistics and supply chain management through leagile framework: A case study from a non-mature economy. Prod. Plan. Control 2020, 1–16. [Google Scholar] [CrossRef]
- Dubey, R.; Bryde, D.J.; Foropon, C.; Tiwari, M.; Dwivedi, Y.; Schiffling, S. An investigation of information alignment and collaboration as complements to supply chain agility in humanitarian supply chain. Int. J. Prod. Res. 2021, 59, 1586–1605. [Google Scholar] [CrossRef]
- Schiffling, S.; Hannibal, C.; Tickle, M.; Fan, Y. The implications of complexity for humanitarian logistics: A complex adaptive systems perspective. Ann. Oper. Res. 2020, 1–32. [Google Scholar] [CrossRef]
- Charles, A.; Lauras, M.; Van Wassenhove, L.N.; Dupont, L. Designing an efficient humanitarian supply network. J. Oper. Manag. 2016, 47–48, 58–70. [Google Scholar] [CrossRef] [Green Version]
- Jahre, M. Humanitarian Supply Chain Strategies—A Review of How Actors Mitigate Supply Chain Risks. J. Humanit. Logist Supply Chain Manag. 2017, 7, 82–101. [Google Scholar] [CrossRef]
- Stauffer, J.M.; Kumar, S. Impact of Incorporating Returns into Pre-Disaster Deployments for Rapid-Onset Predictable Disasters. Prod. Oper. Manag. 2021, 30, 451–474. [Google Scholar] [CrossRef]
- Patil, A.; Shardeo, V.; Dwivedi, A.; Madaan, J.; Varma, N. Barriers to sustainability in humanitarian medical supply chains. Sustain. Prod. Consum. 2021, 27, 1794–1807. [Google Scholar] [CrossRef]
- Wamba, S.F. Humanitarian Supply Chain: A Bibliometric Analysis and Future Research Directions. Ann. Oper. Res. 2020, 1–27. [Google Scholar] [CrossRef]
- Rodríguez-Espíndola, O.; Chowdhury, S.; Beltagui, A.; Albores, P. The potential of emergent disruptive technologies for humanitarian supply chains: The integration of blockchain, Artificial Intelligence and 3D printing. Int. J. Prod. Res. 2020, 58, 4610–4630. [Google Scholar] [CrossRef]
- Ismail, I. A possibilistic mathematical programming model to control the flow of relief commodities in humanitarian supply chains. Comput. Ind. Eng. 2021, 157, 107305. [Google Scholar] [CrossRef]
- Behl, A.; Dutta, P.; Gupta, S. Critical Success Factors for Humanitarian Supply Chain Management: A Grey DEMATEL Approach. IFAC-PapersOnLine 2019, 52, 159–164. [Google Scholar] [CrossRef]
- Mangla, S.K.; Luthra, S. When challenges need an evaluation: For operational excellence and sustainability orientation in humanitarian supply and logistics management. Prod. Plan. Control 2020, 1–19. [Google Scholar] [CrossRef]
- Bag, S.; Gupta, S.; Wood, L. Big data analytics in sustainable humanitarian supply chain: Barriers and their interactions. Ann. Oper. Res. 2020, 1–40. [Google Scholar] [CrossRef]
- Zhang, X.; Ma, W.; Chen, L. New Similarity of Triangular Fuzzy Number and Its Application. Sci. World J. 2014, 2014, 1–7. [Google Scholar] [CrossRef]
- Chakraborty, A.; Mondal, S.P.; Alam, S.; Ahmadian, A.; Senu, N.; De, D.; Salahshour, S. The Pentagonal Fuzzy Number: Its Different Representations, Properties, Ranking, Defuzzification and Application in Game Problems. Symmetry 2019, 11, 248. [Google Scholar] [CrossRef] [Green Version]
- Mavi, R.K.; Standing, C. Critical success factors of sustainable project management in construction: A fuzzy DEMATEL-ANP approach. J. Clean Prod. 2018, 194, 751–765. [Google Scholar] [CrossRef]
- Feng, C.; Ma, R. Identification of the Factors That Influence Service Innovation in Manufacturing Enterprises by Using the Fuzzy DEMATEL Method. J. Clean Prod. 2020, 253, 120002. [Google Scholar] [CrossRef]
- Quezada, L.E.; López-Ospina, H.A.; Palominos, P.I.; Oddershede, A.M. Identifying Causal Relationships in Strategy Maps Using ANP and DEMATEL. Comput. Ind. Eng. 2018, 118, 170–179. [Google Scholar] [CrossRef]
- McMillan, S.S.; King, M.; Tully, M.P. How to Use the Nominal Group and Delphi Techniques. Int. J. Clin. Pharm Net. 2016, 38, 655–662. [Google Scholar] [CrossRef] [PubMed]
- Winkler, J.; Moser, R. Biases in Future-Oriented Delphi Studies: A Cognitive Perspective. Technol. Forecast. Soc. 2016, 105, 63–76. [Google Scholar] [CrossRef]
- Belton, I.; MacDonald, A.; Wright, G.; Hamlin, I. Improving the Practical Application of the Delphi Method in Group-Based Judgment: A Six-Step Prescription for a Well-Founded and Defensible Process. Technol. Forecast. Soc. 2019, 147, 72–82. [Google Scholar] [CrossRef]
- Ergun, Ö.; Gui, L.; Heier Stamm, J.L.; Keskinocak, P.; Swann, J. Improving Humanitarian Operations through Technology-Enabled Collaboration. Prod. Oper. Manag. 2014, 23, 1002–1014. [Google Scholar] [CrossRef]
- Shaheen, I.; Azadegan, A. Friends or Colleagues? Communal and Exchange Relationships During stages of Humanitarian Relief. Prod. Oper. Manag. 2020, 29, 2828–2850. [Google Scholar] [CrossRef]
- Prasanna, S.R.; Haavisto, I. Collaboration in humanitarian supply chains: An organisational culture framework. Int. J. Prod. Res. 2018, 56, 5611–5625. [Google Scholar] [CrossRef]
- Takenouchi, K.; Yamori, K. Synergistic Integration of Detailed Meteorological and Community Information for Evacuation from Weather-Related Disasters: Proposal of a “Disaster Response Switch”. Int. J. Disaster Risk Sci. 2020, 11, 762–775. [Google Scholar] [CrossRef]
- Strahan, K.; Gilbert, J. The Wait and See Literature: A Rapid Systematic Review. Fire 2021, 4, 4. [Google Scholar] [CrossRef]
- Oloruntoba, R.; Kovács, G. A Commentary on Agility in Humanitarian Aid Supply Chains. Supply Chain Manag. 2015, 20, 708–716. [Google Scholar] [CrossRef]
Figure 1.
Humanitarian supply chain resilience evaluation framework in flood events.

Figure 2.
Map of the study area.

Figure 3.
The network structure diagram.

Figure 4.
The cause-effect diagram for indicators.

Table 1.
Evaluation system of humanitarian supply chain resilience in flood events.
| Criterion | Indicator | Descriptions |
|---|---|---|
| Pre-assessment (A) | Problem assessment (A1) | Problem assessment is conducive to quickly derive the needs of the disaster-affected area and facilitate the formulation of further plans. |
| Transport link assessment (A2) | Transportation link assessment is to add new links based on determining the transportation links available in flood disasters to reduce the vulnerability of the road network. | |
| Resource assessment (A3) | Resource assessment can improve the rationality of resource allocation and reduce unnecessary redundancy. | |
| Diverse Actors (B) | Transparency of information (B1) | The transparency of information can ensure the exchange of information among stakeholders in the humanitarian supply chain and improve efficiency. |
| Coordination and cooperation (B2) | Coordination and cooperation among stakeholders in the humanitarian supply chain are essential to alleviate the suffering of the people affected by the disaster. | |
| Swift trust (B3) | Swift trust helps minimize friction and achieve cooperation. | |
| Strategic management (C) | Capability and strategic planning (C1) | Capability and strategic planning include overall strategies and update decisions based on the development of periodic flood disasters. |
| Timely quality inspection (C2) | Many disaster relief materials come from donations, and it is not easy to guarantee quality. | |
| Logistics management (C3) | Logistics management enables the appropriate personnel and rescue items to help the disaster-stricken area at the appropriate time and place. | |
| Responsiveness (D) | Agility in processes (D1) | Agility allows the humanitarian supply chain to meet the needs of disaster-stricken areas in an uncertain environment. |
| Adaptive management strategy (D2) | The ability to transform management strategies to respond to different risks. | |
| Velocity in processes (D3) | Reduce unnecessary pipeline time in response to environmental changes. | |
| Risk Management (E) | Risk warning capability (E1) | The ability to enable the humanitarian supply chain to identify potential crises and develop recovery plans. |
| Risk awareness (E2) | Risk awareness includes the awareness of rescuers and people affected by disasters. | |
| Distributed power (E3) | In the event of an emergency, each department can independently take response measures. | |
| Material Support (F) | Intelligence and digitization (F1) | Intelligence and digitization can improve information sharing capabilities and reduce time loss. |
| Skilled and competent manpower (F2) | The humanitarian supply chain should have sufficient knowledge to manage operations in a highly unstable environment. | |
| Standardization (F3) | Standardization can improve the substitutability of supplies and processes in the humanitarian supply chain. |
Table 2.
Linguistic Variables and Corresponding Triangular Fuzzy Numbers.
| Linguistic Variable | Triangular Fuzzy Number |
|---|---|
| No influence | (0, 0, 0.25) |
| Very low influence | (0, 0.25, 0.25) |
| Low influence | (0.25, 0.5, 0.75) |
| High influence | (0.5, 0.75, 1.0) |
| Very high influence | (0.75, 1.0, 1.0) |
Table 3.
Expert panel characteristics.
| Characteristics | Number | |
|---|---|---|
| Job Experience | ≥10 | 12 |
| 5~10 | 20 | |
| Job position | Academic | 9 |
| Municipal manager | 12 | |
| Non-governmental organization (NGO) | 5 | |
| Volunteer | 6 | |
| Expertise or research field | Humanitarian Supply Chain | 2 |
| Supply chain resilience | 4 | |
| Risk management | 3 | |
| Flood management | 11 | |
| Emergency assistance | 12 | |
Table 4.
The initial fuzzy direct relationship matrix.
| A1 | A2 | A3 | B1 | B2 | B3 | C1 | C2 | C3 | D1 | D2 | D3 | E1 | E2 | E3 | F1 | F2 | F3 | |
|---|---|---|---|---|---|---|---|---|---|---|---|---|---|---|---|---|---|---|
| A1 | 0 | 0 | 0 | 0 | 0 | 0 | 1 | 0 | 0 | 0 | 0 | 0 | 0 | 0 | 0 | 0 | 0 | 0 |
| A2 | 0 | 0 | 0 | 0 | 0 | 0 | 0 | 0 | 2 | 0 | 0 | 2 | 0 | 0 | 0 | 0 | 0 | 0 |
| A3 | 0 | 0 | 0 | 0 | 0 | 0 | 2 | 0 | 0 | 0 | 0 | 0 | 0 | 0 | 0 | 0 | 0 | 0 |
| B1 | 3 | 0 | 0 | 0 | 1 | 0 | 3 | 4 | 2 | 0 | 1 | 0 | 3 | 2 | 2 | 0 | 0 | 0 |
| B2 | 1 | 1 | 3 | 3 | 0 | 1 | 1 | 0 | 2 | 3 | 2 | 3 | 2 | 1 | 2 | 1 | 1 | 2 |
| B3 | 0 | 0 | 0 | 1 | 2 | 0 | 0 | 0 | 0 | 0 | 0 | 0 | 0 | 0 | 0 | 0 | 0 | 0 |
| C1 | 0 | 0 | 0 | 2 | 3 | 0 | 0 | 1 | 2 | 2 | 3 | 2 | 1 | 2 | 2 | 1 | 1 | 1 |
| C2 | 0 | 0 | 0 | 0 | 1 | 0 | 1 | 0 | 0 | 0 | 0 | 1 | 0 | 1 | 0 | 0 | 0 | 0 |
| C3 | 0 | 0 | 1 | 0 | 0 | 0 | 1 | 0 | 0 | 0 | 0 | 2 | 0 | 0 | 0 | 0 | 0 | 0 |
| D1 | 0 | 0 | 0 | 0 | 1 | 0 | 1 | 0 | 0 | 0 | 0 | 1 | 0 | 1 | 0 | 0 | 0 | 0 |
| D2 | 0 | 0 | 0 | 0 | 1 | 0 | 0 | 0 | 0 | 2 | 0 | 0 | 0 | 2 | 1 | 0 | 0 | 0 |
| D3 | 0 | 0 | 0 | 0 | 1 | 0 | 0 | 0 | 1 | 0 | 0 | 0 | 1 | 0 | 0 | 0 | 0 | 0 |
| E1 | 0 | 0 | 0 | 0 | 0 | 0 | 2 | 0 | 1 | 0 | 3 | 0 | 0 | 2 | 1 | 0 | 0 | 0 |
| E2 | 0 | 0 | 1 | 1 | 0 | 0 | 0 | 0 | 0 | 2 | 0 | 0 | 0 | 0 | 0 | 0 | 0 | 0 |
| E3 | 0 | 0 | 0 | 0 | 0 | 0 | 0 | 0 | 1 | 3 | 2 | 0 | 2 | 2 | 0 | 0 | 0 | 0 |
| F1 | 1 | 1 | 0 | 2 | 0 | 0 | 0 | 0 | 0 | 1 | 0 | 1 | 1 | 0 | 0 | 0 | 0 | 0 |
| F2 | 0 | 0 | 0 | 0 | 0 | 0 | 0 | 0 | 0 | 0 | 1 | 1 | 0 | 1 | 2 | 0 | 0 | 0 |
| F3 | 0 | 0 | 0 | 1 | 1 | 0 | 0 | 0 | 1 | 2 | 0 | 0 | 0 | 0 | 0 | 0 | 0 | 0 |
Table 5.
Centrality degree and cause degree for indicators.
| Tr | Tc | Di | Rank | Ri | Rank | |
|---|---|---|---|---|---|---|
| A1 | 0.106 | 0.233 | 0.339 | 16 | −0.127 | 13 |
| A2 | 0.133 | 0.090 | 0.223 | 18 | 0.043 | 8 |
| A3 | 0.151 | 0.274 | 0.425 | 13 | −0.123 | 12 |
| B1 | 1.009 | 0.466 | 1.475 | 3 | 0.543 | 3 |
| B2 | 1.404 | 0.503 | 1.907 | 1 | 0.901 | 1 |
| B3 | 0.250 | 0.148 | 0.398 | 15 | 0.102 | 6 |
| C1 | 1.211 | 0.636 | 1.846 | 2 | 0.575 | 2 |
| C2 | 0.253 | 0.243 | 0.496 | 11 | 0.009 | 9 |
| C3 | 0.196 | 0.582 | 0.778 | 10 | −0.387 | 15 |
| D1 | 0.253 | 0.781 | 1.033 | 5 | −0.528 | 18 |
| D2 | 0.297 | 0.615 | 0.913 | 7 | −0.318 | 14 |
| D3 | 0.164 | 0.657 | 0.821 | 9 | −0.492 | 16 |
| E1 | 0.519 | 0.534 | 1.053 | 4 | −0.015 | 10 |
| E2 | 0.186 | 0.704 | 0.890 | 8 | −0.518 | 17 |
| E3 | 0.434 | 0.531 | 0.964 | 6 | −0.097 | 11 |
| F1 | 0.356 | 0.119 | 0.476 | 12 | 0.237 | 4 |
| F2 | 0.226 | 0.106 | 0.332 | 17 | 0.119 | 5 |
| F3 | 0.250 | 0.174 | 0.423 | 14 | 0.076 | 7 |
Table 6.
The limited weight and global weight for indicators.
| Indicator | Limited Weight | Local Rank | Global Weight | Global Rank |
|---|---|---|---|---|
| A1 | 0.584 | 1 | 0.017 | 13 |
| A2 | 0.161 | 3 | 0.005 | 18 |
| A3 | 0.255 | 2 | 0.008 | 16 |
| B1 | 0.405 | 2 | 0.149 | 3 |
| B2 | 0.511 | 1 | 0.188 | 2 |
| B3 | 0.084 | 3 | 0.031 | 11 |
| C1 | 0.652 | 1 | 0.195 | 1 |
| C2 | 0.152 | 3 | 0.045 | 7 |
| C3 | 0.196 | 2 | 0.058 | 6 |
| D1 | 0.445 | 1 | 0.064 | 5 |
| D2 | 0.274 | 3 | 0.039 | 10 |
| D3 | 0.281 | 2 | 0.040 | 9 |
| E1 | 0.310 | 2 | 0.042 | 8 |
| E2 | 0.518 | 1 | 0.070 | 4 |
| E3 | 0.172 | 3 | 0.023 | 12 |
| F1 | 0.442 | 1 | 0.011 | 14 |
| F2 | 0.360 | 2 | 0.009 | 15 |
| F3 | 0.198 | 3 | 0.005 | 17 |
Publisher’s Note: MDPI stays neutral with regard to jurisdictional claims in published maps and institutional affiliations. |
© 2021 by the authors. Licensee MDPI, Basel, Switzerland. This article is an open access article distributed under the terms and conditions of the Creative Commons Attribution (CC BY) license (https://creativecommons.org/licenses/by/4.0/).
Share and Cite
MDPI and ACS Style
Xu, W.; Xiong, S.; Proverbs, D.; Zhong, Z. Evaluation of Humanitarian Supply Chain Resilience in Flood Disaster. Water 2021, 13, 2158. https://doi.org/10.3390/w13162158
AMA Style
Xu W, Xiong S, Proverbs D, Zhong Z. Evaluation of Humanitarian Supply Chain Resilience in Flood Disaster. Water. 2021; 13(16):2158. https://doi.org/10.3390/w13162158
Chicago/Turabian StyleXu, Wenping, Shu Xiong, David Proverbs, and Zhi Zhong. 2021. "Evaluation of Humanitarian Supply Chain Resilience in Flood Disaster" Water 13, no. 16: 2158. https://doi.org/10.3390/w13162158
Note that from the first issue of 2016, this journal uses article numbers instead of page numbers. See further details here.