Article

Hydrochemical Characterisation of High-Fluoride Groundwater and Development of a Conceptual Groundwater Flow Model Using a Combined Hydrogeological and Hydrochemical Approach on an Active Volcano: Mount Meru, Northern Tanzania

1
Laboratory for Applied Geology and Hydrogeology, Department of Geology, Ghent University, 9000 Gent, Belgium
2
Department of Mining and Mineral Processing Engineering, University of Dodoma, Dodoma P.O. Box 259, Tanzania
3
Department of Geology, University of Dodoma, Dodoma P.O. Box 259, Tanzania
4
Physical Geography (FARD), Department of Geography, Vrije Universiteit Brussel, 1050 Brussels, Belgium
5
Analytical, Environmental and Geochemistry (AMGC), Department of Chemistry, Vrije Universiteit Brussel, 1050 Brussels, Belgium
6
Laboratoire Magmas et Volcans, CNRS, IRD, OPGC, Université Clermont Auvergne, 63000 Clermont-Ferrand, France
7
Institute of Genetic Reproduction and Development, CNRS UMR 6293, INSERM U1103, Université Clermont Auvergne, 63000 Clermont-Ferrand, France
8
Laboratoire G-Time, Department of Geosciences, Environment and Society, Université libre de Bruxelles, 1050 Brussels, Belgium
*
Author to whom correspondence should be addressed.
Water 2021, 13(16), 2159; https://doi.org/10.3390/w13162159
Submission received: 14 July 2021 / Revised: 31 July 2021 / Accepted: 2 August 2021 / Published: 6 August 2021

Abstract

:
This study characterises high-fluoride groundwater in the aquifer system on the flanks of Mount Meru, focusing on parts of the flanks that were only partially or not at all covered by previous research. Additionally, we analyse the impact of rainwater recharge on groundwater chemistry by monitoring spring discharges during water sampling. The results show that the main groundwater type in the study area is NaHCO3 alkaline groundwater (average pH = 7.8). High F values were recorded: in 175 groundwater samples, the concentrations range from 0.15 to 301 mg/L (mean: 21.89 mg/L, median: 9.67 mg/L), with 91% of the samples containing F values above the WHO health-based guideline for drinking water (1.5 mg/L), whereas 39% of the samples have Na+ concentrations above the WHO taste-based guideline of 200 mg/L. The temporal variability in F concentrations between different seasons is due to the impact of the local groundwater recharge. We recommend that a detailed ecohydrological study should be carried out for the low-fluoride springs from the high-altitude recharge areas on the eastern and northwestern flanks of Mount Meru inside Arusha National Park. These springs are extracted for drinking purposes. An ecohydrological study is required for the management of these springs and their potential enhanced exploitation to ensure the sustainability of this water extraction practice. Another strategy for obtaining safe drinking water could be to use a large-scale filtering system to remove F from the groundwater.

1. Introduction

In Tanzania, the availability of water is constricted by the increasing water needs due to a rapid population growth and ongoing climate change that is responsible for repeated drought episodes and the drying up of surface water bodies [1]. Groundwater is the main source of domestic water supply for both urban and rural areas in Tanzania, which consumes about 60% of total groundwater use whereas irrigation, mining and industrial use, livestock, and dry land fishing consume 40% [1]. The main challenges for groundwater quantity are depletion of shallow aquifers due to over-pumping, climate change, conflicting land uses, and uncontrolled urban development [1,2,3]. The main challenges for groundwater quality are high F concentration [3,4,5,6,7], contamination from domestic sewage from on-site sanitation, industrial effluents, leachates from solid waste dumpsites, leaking fuel filling and waste oils [2], and saltwater intrusion (saltwater pollution) in coastal areas due to over-pumping of the aquifer [2,8].
The East African Rift System contains some of the regions with the highest F concentrations in the world: Kenya, Tanzania, and Ethiopia [9]. High F concentrations exceeding the WHO health-based guideline for drinking water (1.5 mg/L) [10] have been reported in both the surface and groundwater in Tanzania [2,3,4,5,6,7,11], Ethiopia [12,13], and Kenya [14,15,16]. The regions are rich in highly weathered Na-K-rich volcanic rocks with low Ca-Mg content. The weathering and dissolution of these rocks in combination with other processes such as calcite precipitation produce NaHCO3 waters and alkaline groundwaters with pH > 7. These alkaline groundwaters with very low or absent Ca-Mg contents favor the dissolution of fluorite (CaF2) or fluorapatite (Ca5(PO4)3F); hence, high F concentrations are observed [5,15]. However, this problematic is not only constrained to the East African Rift System: other African countries affected by the problem include Algeria, Ghana, Malawi, Nigeria, South Africa, Sudan, and Uganda [9,17].
In the Arusha volcanic region in northern Tanzania, within the eastern branch of the East African Rift System, several studies have been conducted on the water quality and hydrogeochemical characteristics of surface and groundwater around Mount Meru, with a focus on F concentration. The study by Kilham and Hecky [18] which covered the Ngarenanyuki river and the closed basin lakes (Momella lakes, Lake Tulusia and Lake Rishateni) on the slopes of Mount Meru identified that the chemical weathering of crystalline rocks is the primary hydrogeochemical process controlling water chemistry and F concentration in surface waters in the area. The study also identified that in the closed basin lakes, the evaporative concentration and carbonate precipitation are other processes playing a role. The study by Nanyaro et al. [11] on the eastern and southeastern flanks of Mount Meru identified that natural waters in some rivers, springs, alkaline ponds, and lakes are characterised by exceptionally high F values due to the weathering of F-rich nephelinitic and carbonatitic rocks and soil, whereas in the rivers draining the Mount Meru crater, gaseous emanations through mineral springs may also contribute to the high concentrations. Additionally, the study identified that the flushing of F-rich NaHCO3 evaporitic salt (locally called “magadi”) from the surface and top soil at the onset of the rainy season affects the F concentrations in shallow groundwater and in surface water bodies, due to the preceding continuous evaporative enrichment during the dry season. Furthermore, the study by Ghiglieri et al. [5] on the eastern and northern flanks of Mount Meru found that samples collected from springs, one borehole, and surface water showed that mineral dissolution, exchange processes, and precipitation of Ca2+ from supersaturated solutions, joined with local permeability and hydraulic gradients, control the distribution of F concentration in the area. Kitalika et al. [19] reported the variations of F concentrations in the four rivers (Temi, Nduruma, Tengeru, and Maji ya Chai) on the southern flank of Mount Meru. The study found that the F containing rocks exposed to pH above 7.6 display high leaching of F in solution, which gradually increased with the increase in pH, indicating that the dissolution of F in water is a function of pH. The study by Chacha et al. [6] on the southern flank of Mount Meru found that high F concentration and general groundwater chemistry (NaHCO3 water type) are more controlled by aquifer lithology than by anthropogenic activities. This study identified two potential aquifers in the area, both containing significant concentration of F. Additionally, the study by Makoba and Muzuka [7] on the northern and southeastern flanks of Mount Meru found that surface and groundwater chemistry are controlled by geology, water–rock interaction time, and climatic conditions. This study found that the aquifer composed of fractured mafic volcanics, breccia, and tuffs shows low total dissolved solids (TDS) and F values compared to the aquifer composed of lahars, which are susceptible to weathering and hence lead to high TDS and F values. These lahars have been re-interpreted as debris avalanche for a main part by Delcamp et al. [20]. The study also recognised the contribution of anthropogenic pollution in few cases.
The present research investigates the hydrochemistry of high-fluoride groundwater on the eastern, northern, western, and southwestern flanks of Mount Meru. Parts of the western and southwestern flanks were partially covered by previous studies, whereas the far east of the eastern flank (i.e., on the northern flank of Ngurdoto crater) was not investigated before. The hydrochemical characterisation is presented in this paper. The detailed study of hydrochemical processes, resulting in the observed groundwater compositions, and the origin of fluoride in the groundwater, is the subject of a parallel paper (Bennett et al., in preparation). Moreover, the study analyses the impact of rainwater recharge on the groundwater chemistry by monitoring spring discharges during water sampling, which has not been previously characterised in the area.

2. Materials and Methods
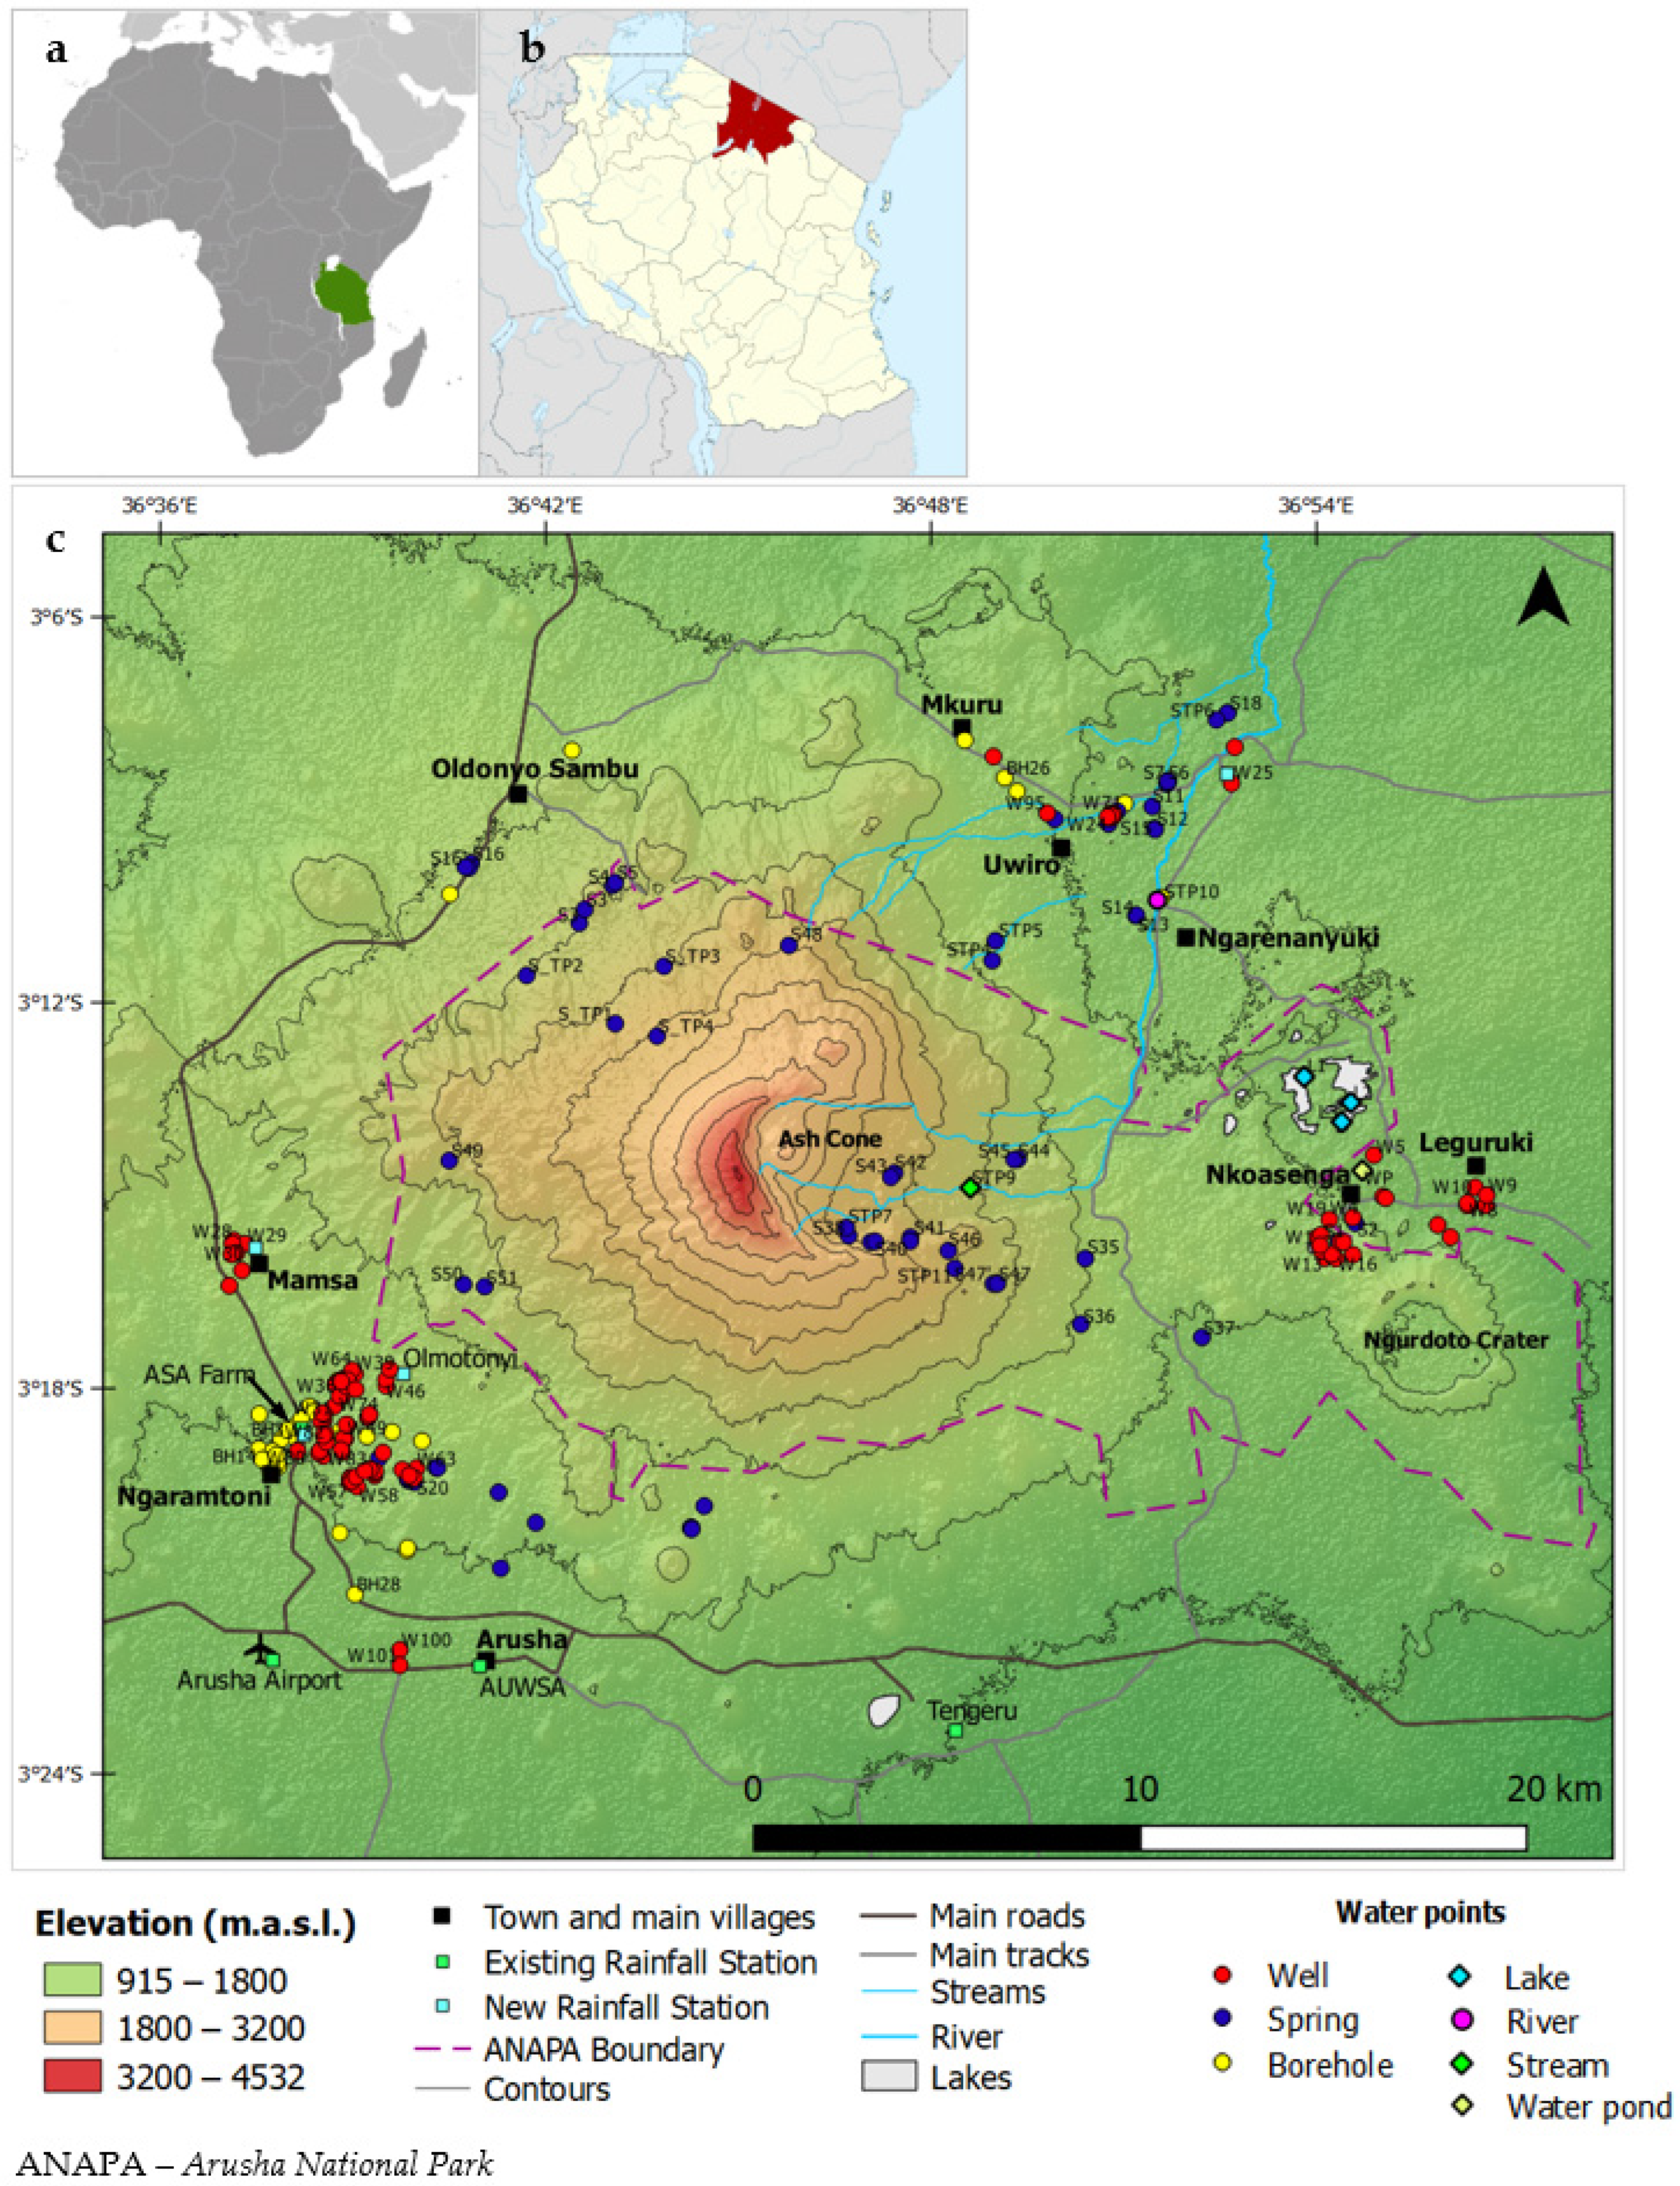
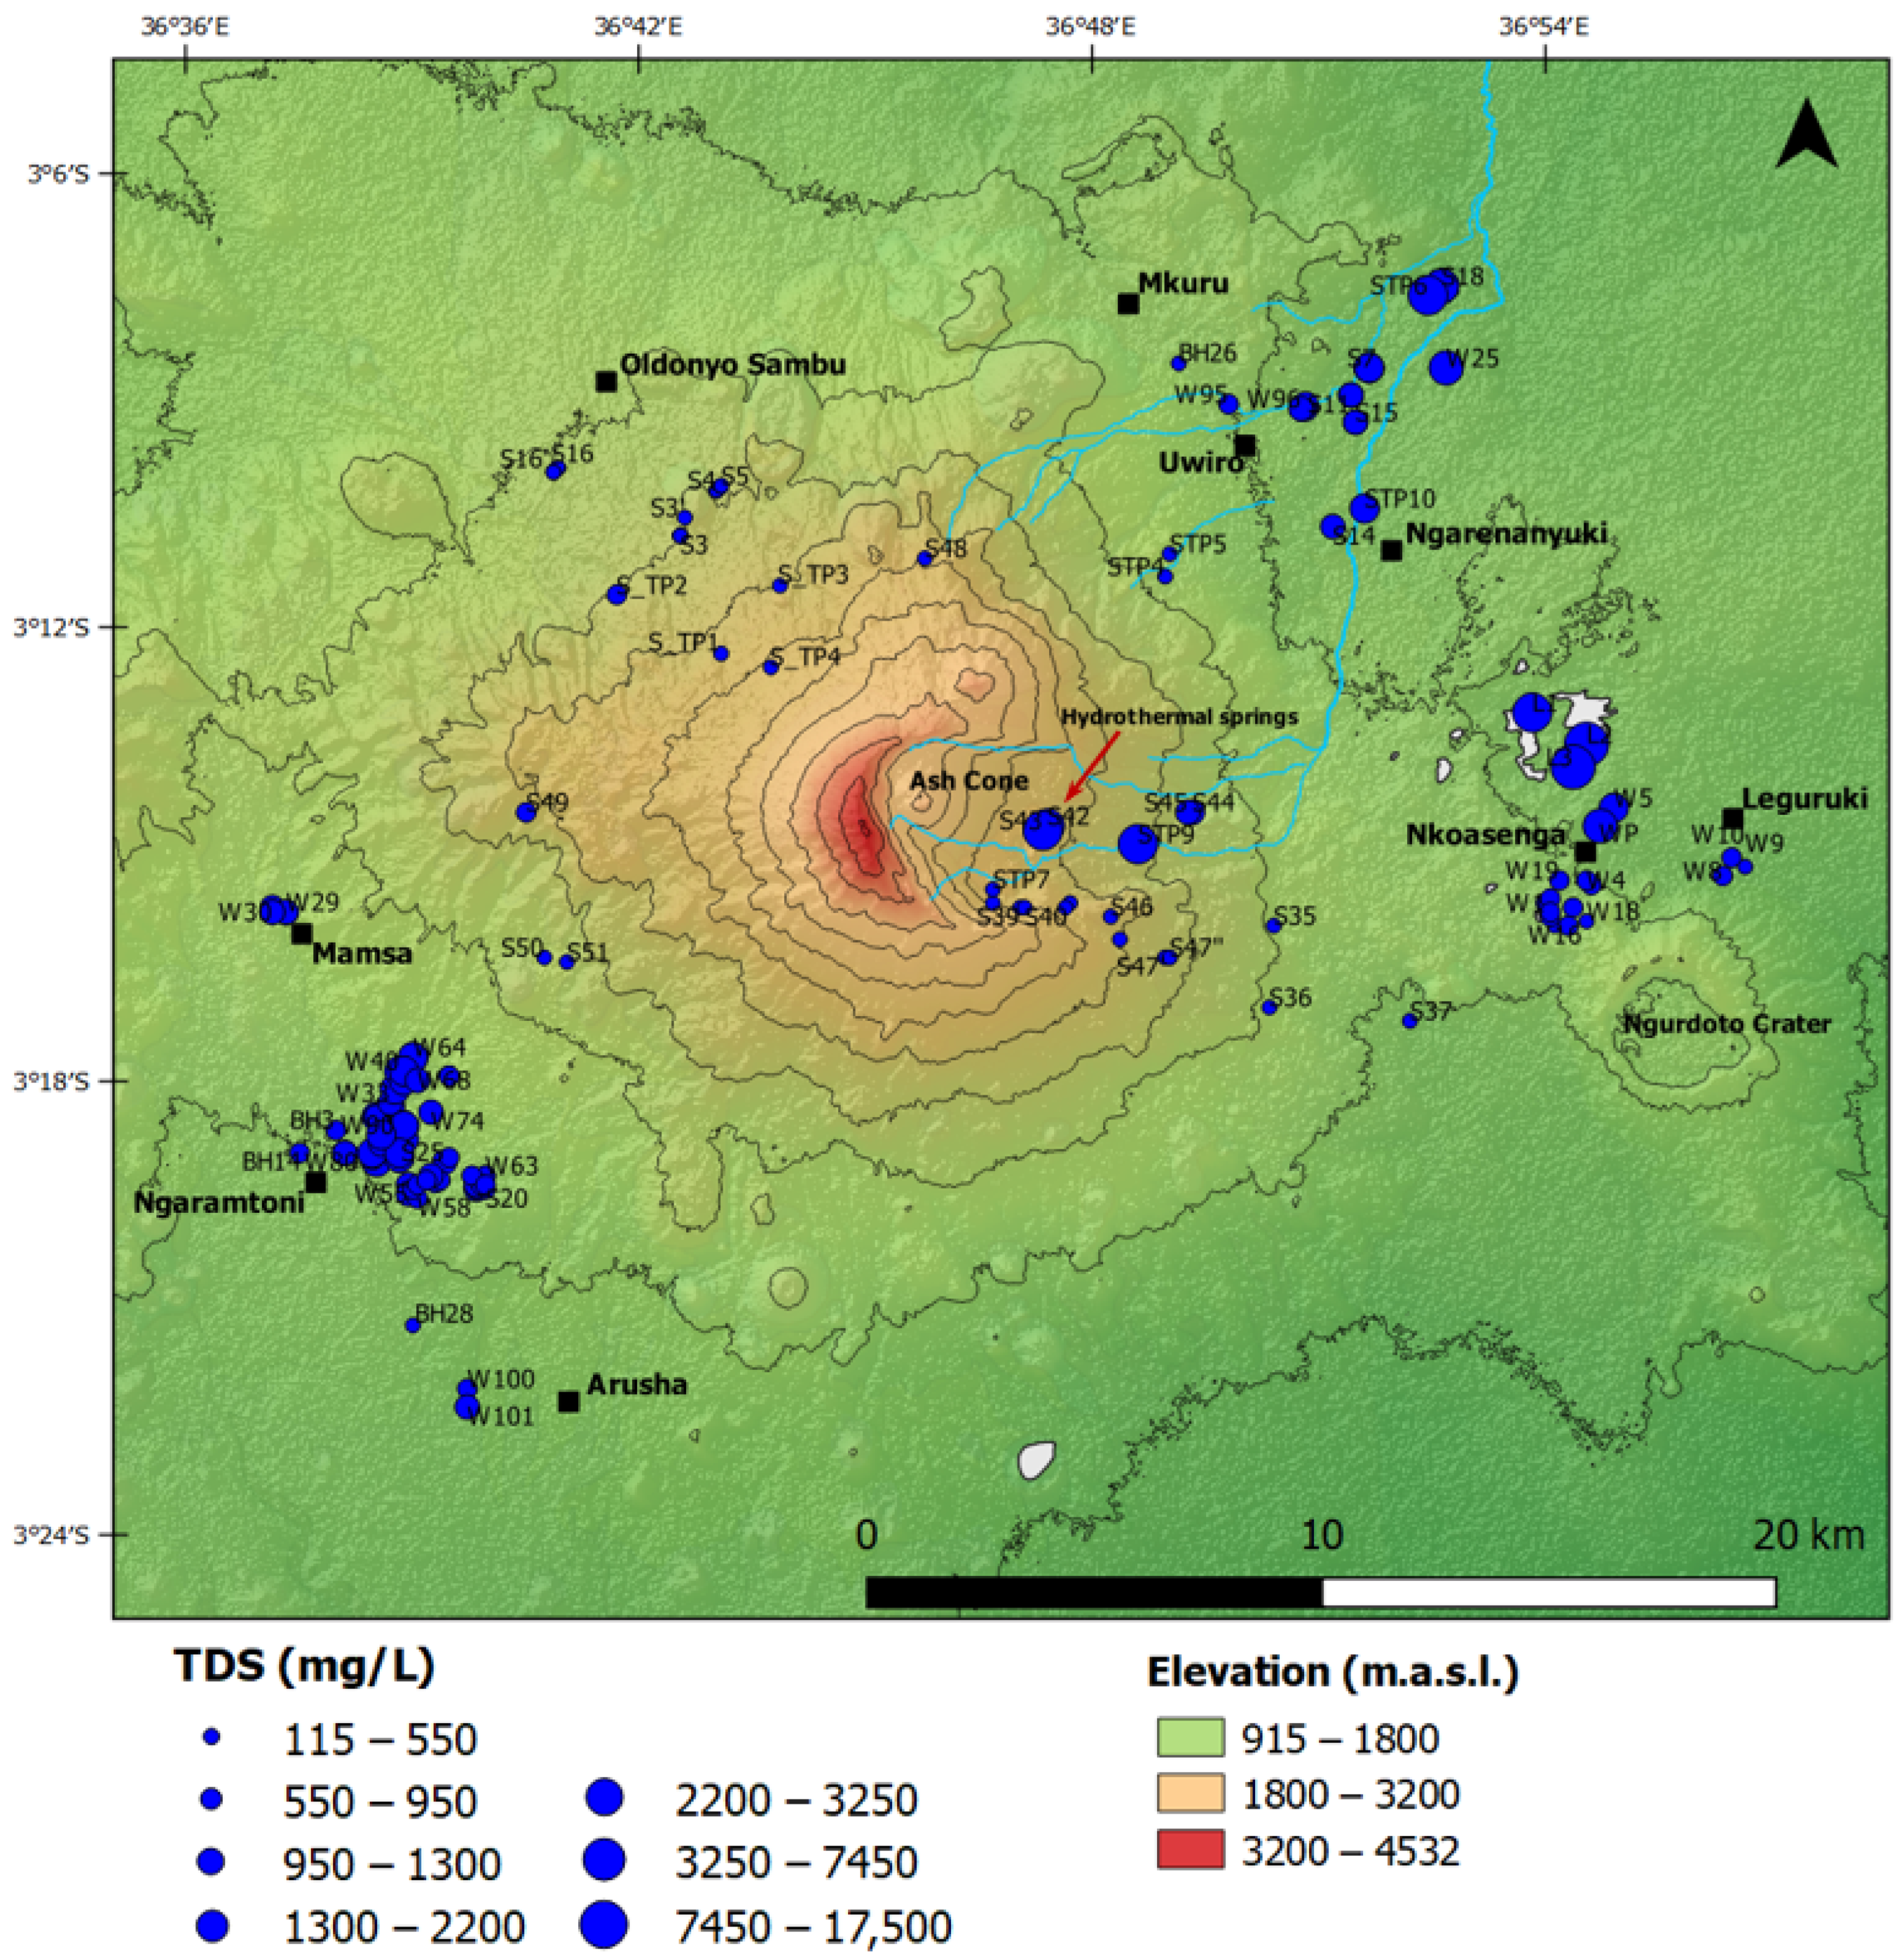
2.1. Study Area

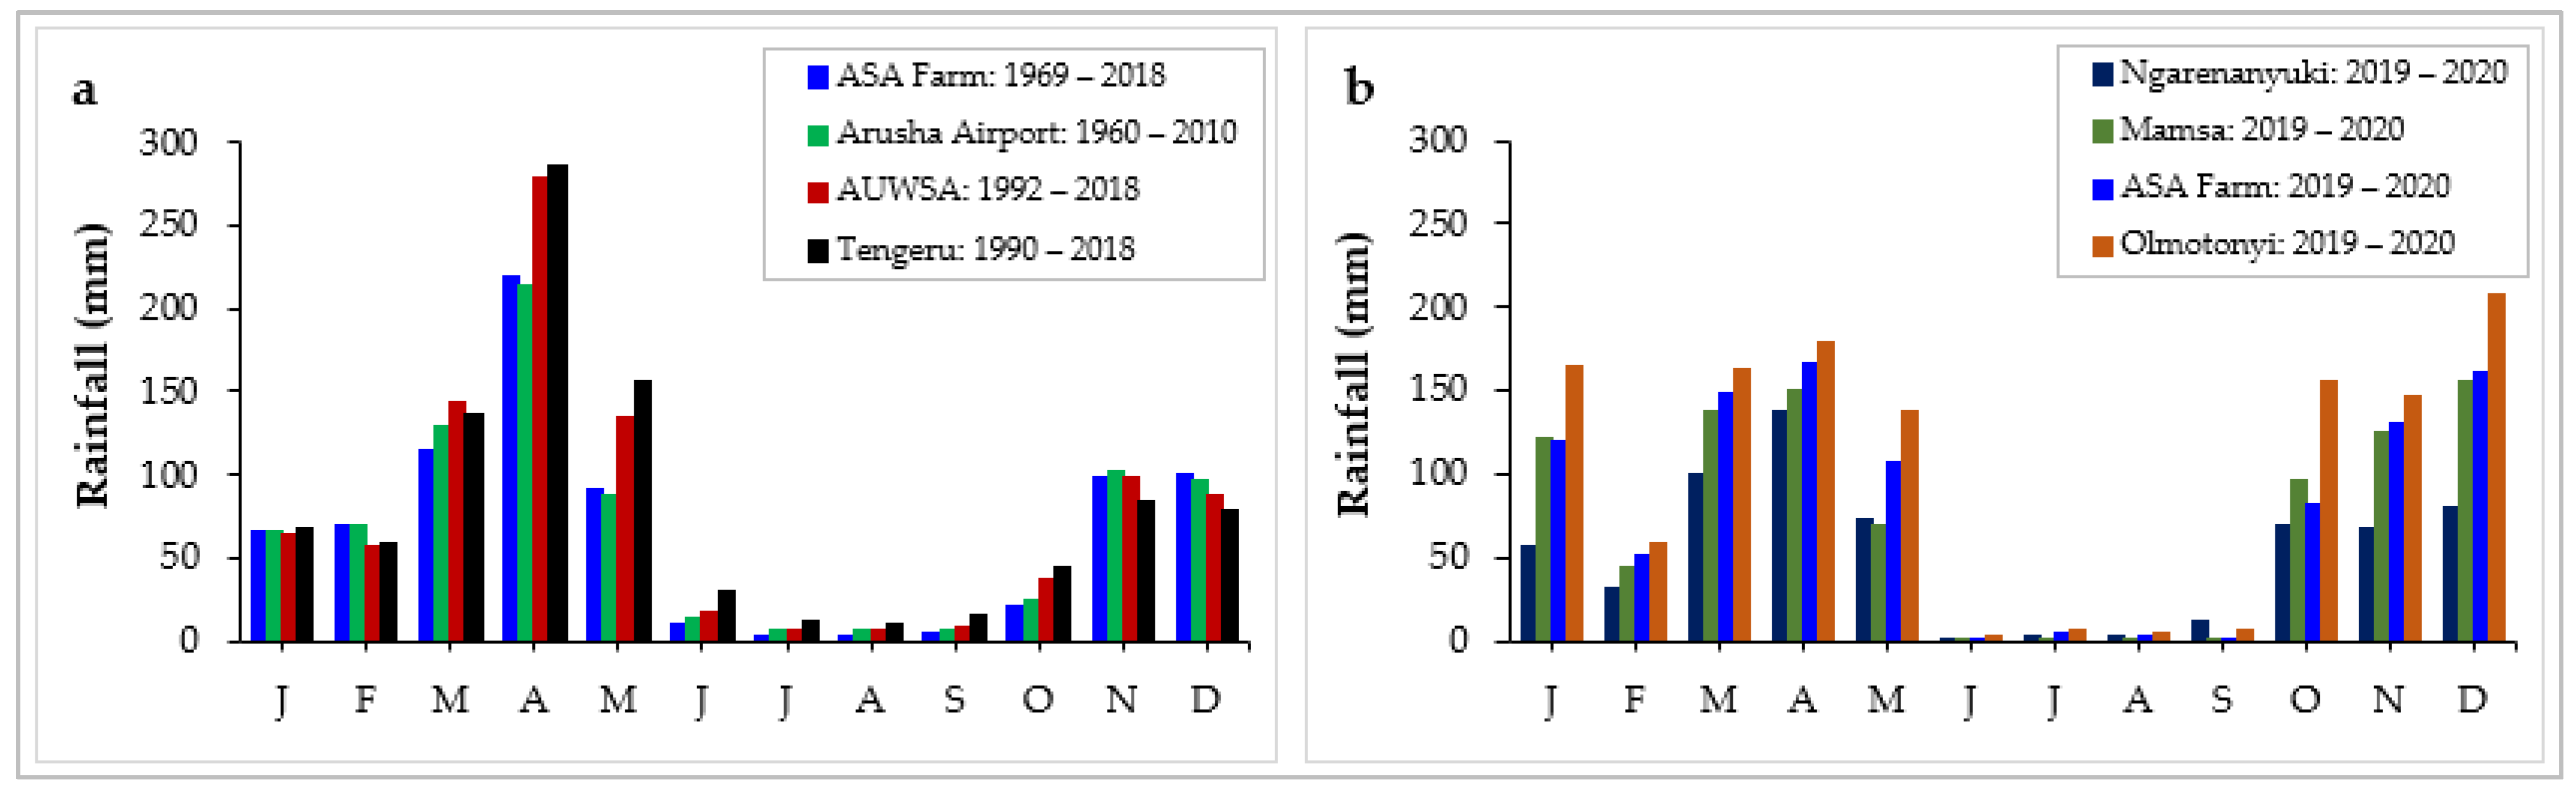
2.1.1. Location, Topography, and Climate

The study area covers the eastern, western, and northern flanks of Mount Meru volcano, and it occupies about 1000 km2 in the Arusha region, northern Tanzania (Figure 1). The relief map of Mount Meru in Figure 1 was derived from the Advanced Spaceborne Thermal Emission and Reflection Radiometer Global Digital Elevation Model Version 2 (ASTER GDEM 2), with 30-meter spatial resolution [21]. Mount Meru is situated in the Arusha National Park (ANAPA) just north of the city of Arusha. It is located 70 km west of Mount Kilimanjaro. The city of Arusha has a population of 416,442 inhabitants, while the Arusha district and Meru district have populations of 323,198 and 268,144 inhabitants, respectively [22] (p. 26). The study covers most parts of the Meru and Arusha districts.
The topography of the study area is dominated by Mount Meru, which is a steep stratovolcano with a summit culminating at 4565 m summit [23], but the highest elevation in the relief map in Figure 1 is 4532; this is due to the limitation of the ASTER GDEM 2 dataset. Our study area covers most of its slopes. The eastern flank of Mount Meru is incised by a deep valley formed by a catastrophic sector collapse that left a horseshoe-shaped valley now occupied by an ash cone that last erupted in 1910 [20]. Multiple parasitic cones are notable features in the vicinity [20,23,24].
Rainfall data from four existing rainfall stations—Agricultural Seed Agency (ASA) Farm at Ngaramtoni with 50 years data trend (1969–2018), Arusha Airport with 51 years data trend (1960–2010), Arusha Urban Water Supply and Sanitation Authority (AUWSA) with 27 years data trend (1992–2018), and Tengeru Livestock Institute with 29 years data trend (1990–2018)—were used to analyse long-term trends and the amount of rainfall in the study area. The stations cover the southern and southwestern flanks. The average monthly rainfall data show that the area experiences a bimodal rainfall pattern (Figure 2a). The long “masika” rains extend from late February to late May, and the short “vuli” rains extend from early November to early January. The dry “kiangazi” season is from June to October.
The average annual rainfall at the two stations on the southwestern flank of Mount Meru; ASA Farm and Arusha Airport, is 800 mm and 822 mm, respectively. On the southern flank, the average annual rainfall at the two stations, AUWSA and Tengeru, is 942 mm and 981 mm, respectively. Four newly installed rainfall stations, each with 2 years of data trend (2019 and 2020), were used to analyse and compare the amount of rainfall on different flanks. Two stations are at Ngaramtoni (ASA Farm and Olmotonyi), one at Mamsa and one at Ngarenanyuki. The stations cover the southwestern, western, and northeastern flanks. Figure 2b shows the average monthly rainfall for the stations. The average annual rainfall at the two stations on the southwestern flank, ASA Farm and Olmotonyi, is 977 mm and 1232 mm, respectively, whereas on the western flank (at Mamsa), it is 905 mm and on the northeastern flank (at Ngarenanyuki), it is 638 mm. The southern and eastern flanks of Mount Meru (windward sides) receive more rainfall than the western and northern flanks. The areas in the windward sides (eastern and southern flanks) experience a subtropical highland climate, while areas in the leeward sides (northern flank) experience a semi-arid climate (steppe climate). The temperature typically ranges from 13 to 30 °C with an average annual temperature of about 25 °C [6].

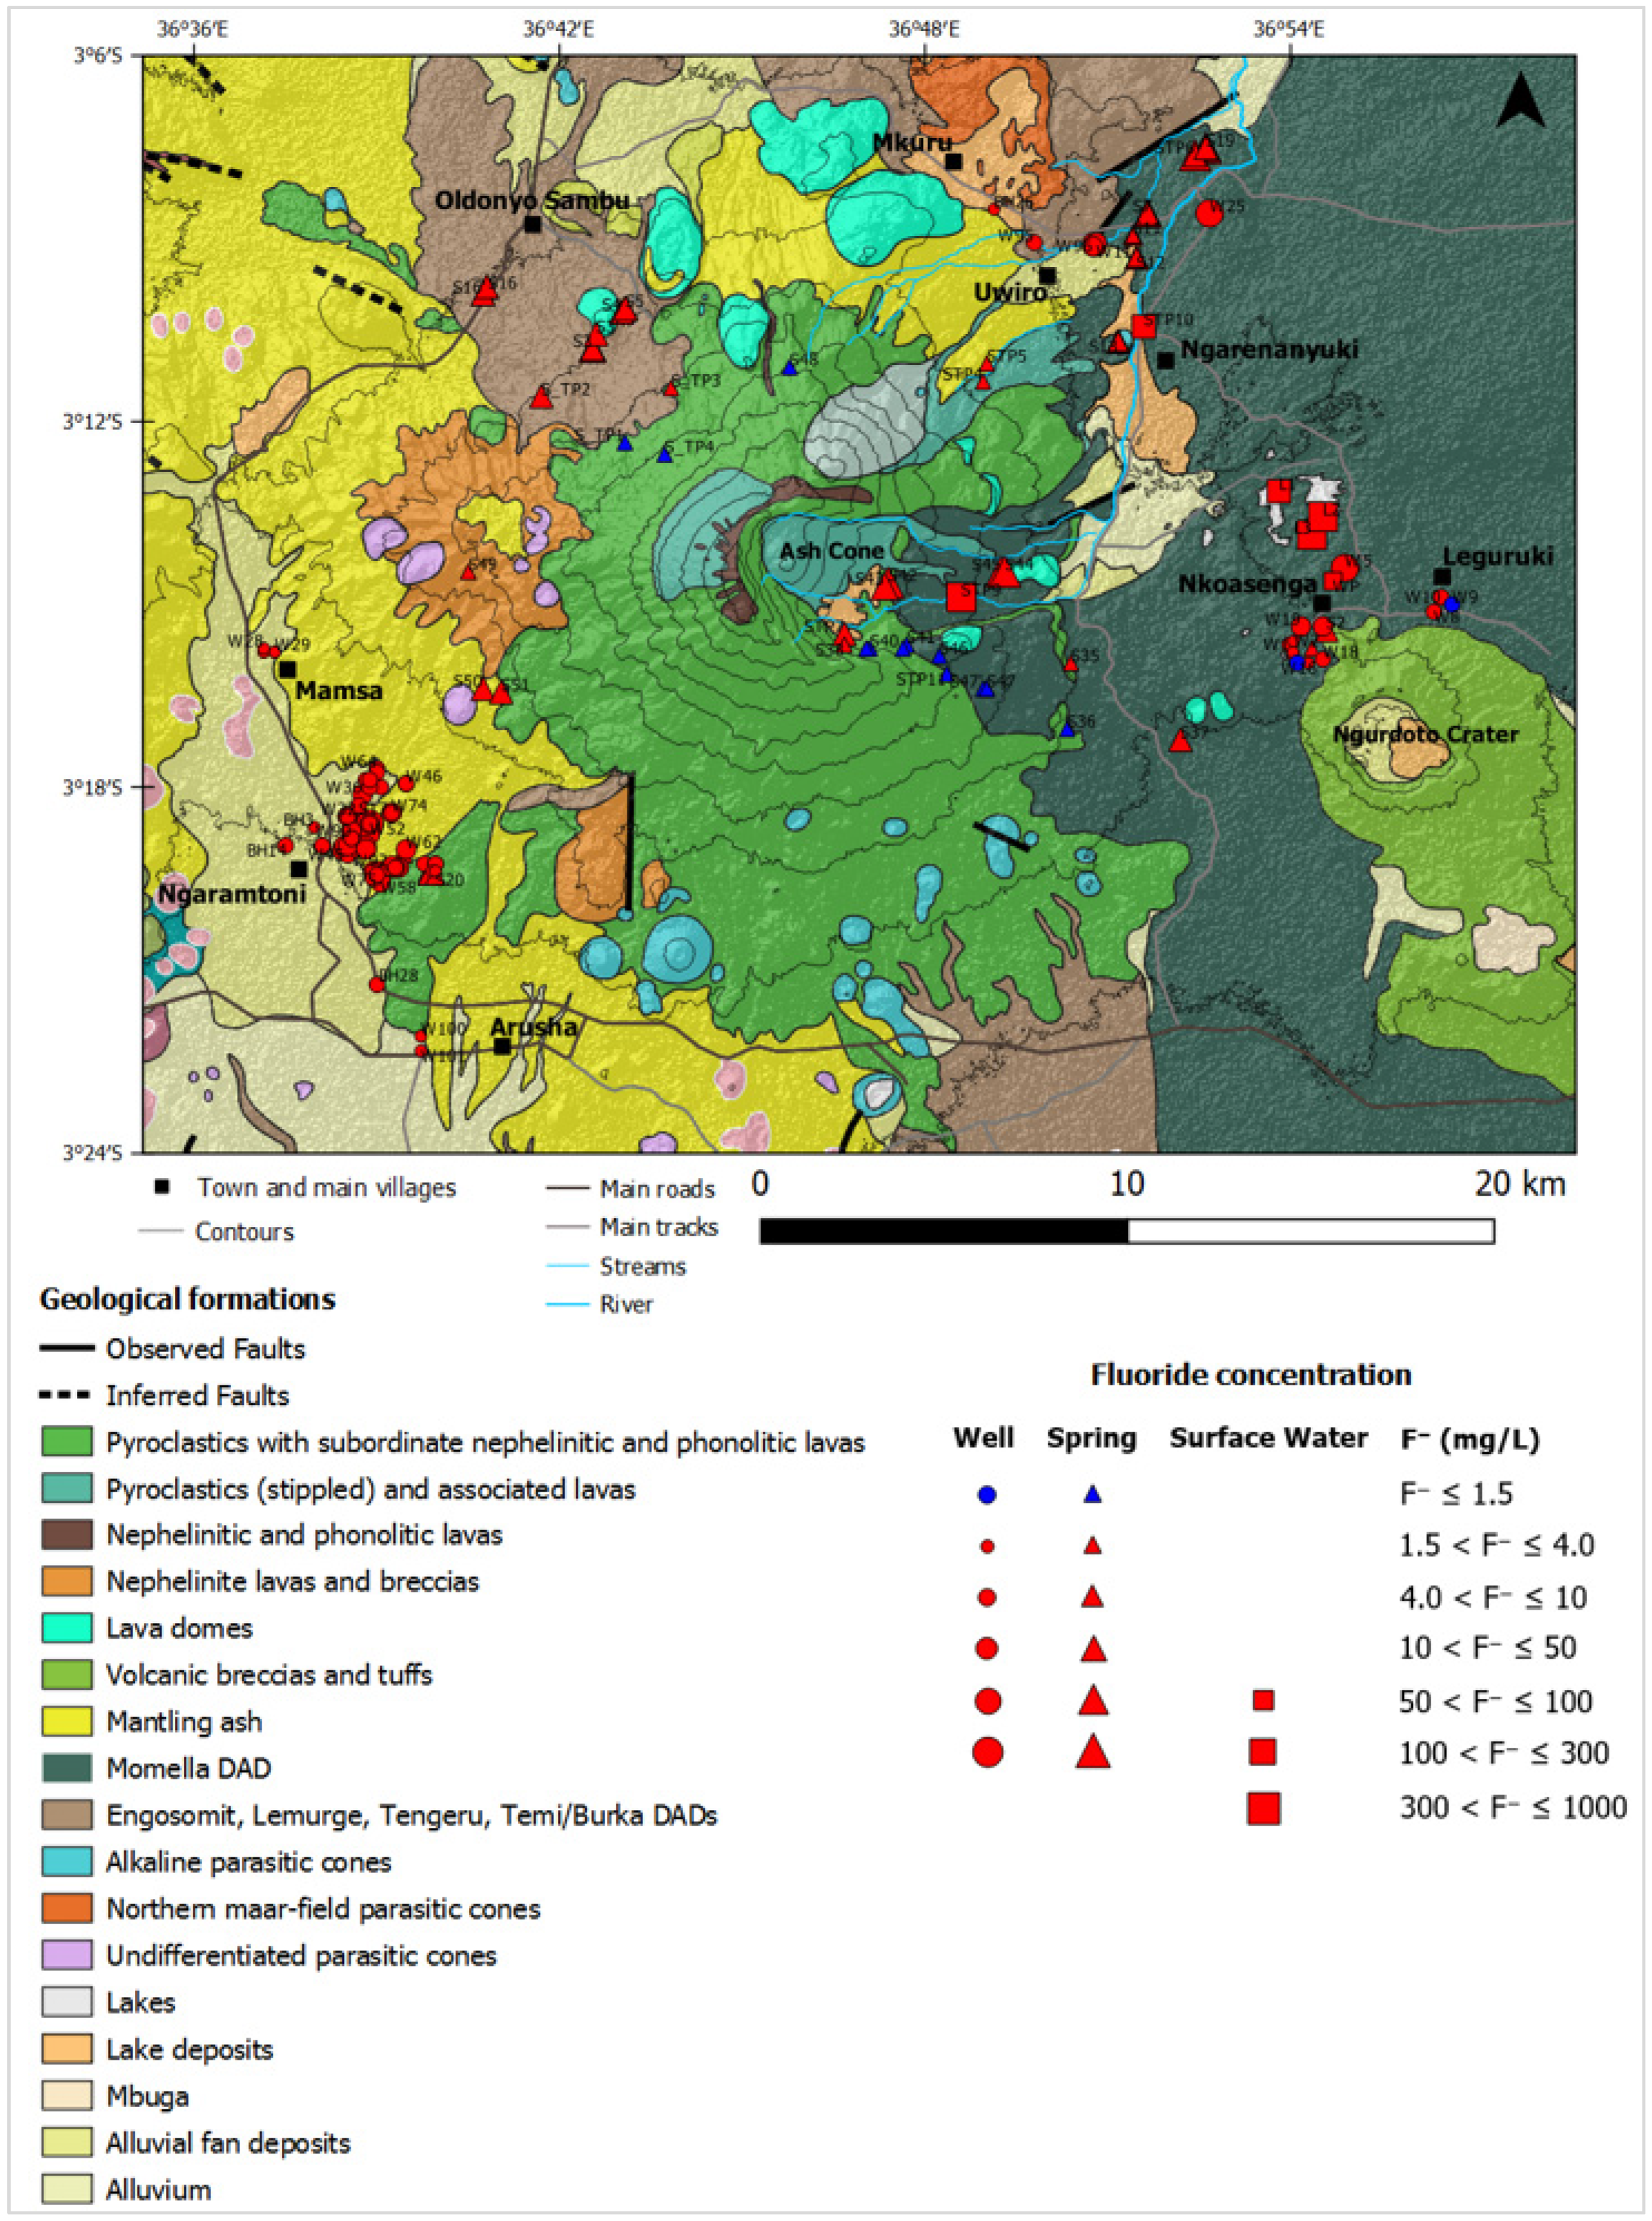
2.1.2. Geological and Hydrogeological Setting

Mount Meru is considered as an active stratovolcano located within the Northern Tanzanian Divergence Zone of the eastern branch of the East African Rift. It is characterised by alkaline magmatic activity, which is typical within the East African Rift System [4,20,23]. A large sector of its east flank was lost in the early Holocene due to a major collapse associated with the formation of large-scale debris avalanche deposits (DADs) between the base of Mount Meru and Kilimanjaro [20]. Meru last erupted in 1910 AD when a small amount of ash was ejected for a few days from the ash cone located within the large valley formed by the collapse. Significant fumarolic activity was recorded at the ash cone area until 1954 [23].
Most rocks within the area are Pleistocene volcanic-sedimentary sequences, but older sequences date back to the Miocene-Pliocene [4,23,24,27]. The lithology in the study area is dominated by volcanic rocks lava flows, pyroclastic, and debris avalanche deposits from the Mount Meru, with some alluvium, alluvial fan, and lake deposits found around the volcano base (Figure 3). Lava flows are found mainly at higher elevations on the main Mount Meru cone and on the southern flank, while the DADs, ash deposits, alluvium, alluvial fan deposits, and lake deposits are found at lower elevations at the base of Mount Meru. Pyroclastic deposits are mainly found on the western flank, whereas DADs are dominant on eastern and northern flanks. No crystalline basement rocks are exposed in the area, but Wilkinson et al. [23] reported that pegmatite and gneiss were recorded in a water borehole log west of Ngarenanyuki (northeastern part of the study area) at a depth of about 15 m, implying that metamorphic rocks underlie the northern part of the study area at shallow depth.
Existing borehole completion reports and field stratigraphic descriptions of sub-surface sediments during the digging of new hand-dug wells were used to characterise the geology of the aquifers. On the northeastern flank, data from one borehole at Mkuru (depth of around 65 m) described by Ghiglieri et al. [4] and three hand-dug wells—one at Mkuru (depth of 23 m) and two at Uwiro (depth of 4 m and 10 m)—were used to characterise the geology of the aquifer, whereas on the northern flank of Ngurdoto crater, data from two hand-dug wells were used: one at Nkoasenga (depth of 8 m) and one at Leguruki (depth of 5 m). On the western flank, data from two hand-dug wells at Mamsa (depth of 39 m and 42 m) were used, whereas on the southwestern flank data from two boreholes (depth of 115 m and 150 m) and eight hand-dug wells (depth range: 12–39 m) at Ngaramtoni were used. On the northeastern and southwestern flanks, there are two aquifers: a shallow and a deep aquifer. On the northeastern flank, the shallow aquifer in some area is unconfined and composed of debris avalanche deposits, while in another area, it is semi-confined and composed of weathered fractured lava with thickness more than 3 m, whereas the deep aquifer is confined and composed of weathered fractured lava with thickness more than 30 m. On the southwestern flank, the shallow aquifer is unconfined and composed of pyroclastic deposits with thickness more than 8 m, whereas the deep aquifer is semi-confined and composed of weathered fractured lava and weathered pyroclastic deposits with thickness varying from 65 to 100 m. On the western flank, the shallow aquifer is unconfined and composed of weathered fractured lava with thickness more than 3 m, whereas on the northern flank of Ngurdoto crater, the shallow aquifer is unconfined, and it is composed of debris avalanche deposits with thickness more than 7 m. The geomorphology of the landscape in the study area plays a great role in controlling the groundwater flow paths. The general groundwater flow system on each flank is involving a multidirectional flow from the higher elevation areas, including the parasitic cones, towards the lower areas.

2.2. Inventory of Water Points

Four field campaigns were conducted during July–September 2017, March–September 2018, February–August 2019, and April–December 2020. A total of 211 water points (205 groundwater and 6 surface water) were mapped and inventoried with the aim to quantify and characterise the groundwater resources on the flanks of Mount Meru (Figure 1). The 205 groundwater points consist of 104 hand-dug wells (depth range from 0.7 to 50 m), 68 springs, and 33 boreholes (depth range from 48 to 170 m). In this study, a well with depth greater than 50 m is considered as deep well; therefore, all hand-dug wells are classified as shallow wells, whereas one borehole is classified as a shallow well, and the rest are classified as deep wells. Shallow wells characterise the shallow aquifer, while deep wells characterise the deep aquifer. The 6 surface water points consist of 1 water pond, 1 stream (Njekukumia stream), 1 river (Ngarenanyuki river), and 3 lakes (Big Momella lake, Small Momella lake, and Lake Rishateni). For each water point, the following information was recorded: elevation, geographical coordinates (GPS), lithology, year of well/borehole construction, well/borehole depth and groundwater level (for the well/borehole), spring setting and spring discharge (for the spring), and uses of water. Each water point was identified by an alphanumeric code.
The distribution of water points is in six clusters located at Ngaramtoni and near Arusha town (southwestern flank), Mamsa (western flank), Oldonyo Sambu (northwestern flank), Mkuru, Uwiro, and Ngarenanyuki (north and northeastern flanks), eastern part of the Arusha National Park (eastern flank), and Nkoasenga and Leguruki (far east of the eastern flank). In Ngaramtoni and near Arusha town, the area is dry with scarce vegetation; there are many shallow hand-dug wells and boreholes but with few springs. In Mamsa, the area is dry with scarce vegetation, there are a few shallow hand-dug wells and only one spring on the slope of Mount Meru inside the Arusha National Park. In Oldonyo Sambu, the area is very dry with scarce vegetation, two boreholes with depths of 55 m and 150 m respectively are found, but both did not reach groundwater, nor was any shallow hand-dug well found; this is probably due to the presence of very thick porous pyroclastic deposits, which led to deeper groundwater flow, and there is only one spring at the base of the Mount Meru with other springs located on the slope of the Mount Meru inside the Arusha National Park. In Mkuru, Uwiro, and Ngarenanyuki, the areas are very dry with few vegetation, there are few shallow hand-dug wells, boreholes, and springs with only one perennial river called “Ngarenanyuki River”. On the eastern part of Arusha National Park, the area is very densely vegetated and green; there are numerous springs with two hydrothermal springs (S42—Small Njekukumia and S43—Big Njekukumia) located just at the foot of the ash cone on the collapsed eastern flank of Mount Meru. In this study, the names ‘Small’ and ‘Big’ specified to the Njekukumia springs were ascribed to their discharge. Their discharges were qualitatively assessed; the Big Njekukumia has high flow discharge compared to the Small Njekukumia. The springs have been characterised as hydrothermal springs by Ghiglieri et al. [5] and Nanyaro et al. [11]; they join to form the Njekukumia stream, which discharges its water to the Ngarenanyuki river. At lower elevations, in the discharge area, three lakes are found (L1—Small Momella Lake, L2—Big Momella Lake, and L3—Lake Rishateni). In Nkoasenga and Leguruki, the areas are very densely vegetated and green; there are several shallow hand-dug wells and only two springs. The hydrogeology of these areas is mainly influenced by the Ngurdoto crater due to its proximity and not the main Mount Meru.

2.3. Sampling

Water samples were collected in high-density polyethylene bottles with a capacity of 250 ml and thoroughly pre-washed with water to be sampled. During sampling, an icebox cooler was used in the field to keep and transport samples before being stored under refrigeration. The samples were transported to Belgium and analysed for their chemical properties at the Laboratory for Applied Geology and Hydrogeology, Ghent University. A total of 181 water samples (175 groundwater and 6 surface water) from 128 water points were collected for chemical analysis from the four field campaigns. All 6 inventoried surface water points were sampled. It should be mentioned that the six surface water samples are not representative of all surface water in the study area, since they were sampled because of their known high F concentrations. Table 1 summarises the distribution of groundwater samples that were collected from the inventoried groundwater points. From the 205 inventoried groundwater points, 60% (n = 122) of the points were sampled. The sampling of the water points ensured a representative coverage of the whole study area. Few of the inventoried boreholes were sampled, because most of them are cased, as they are not in use, and others are connected into storage tanks that are inaccessible. Some of the hand-dug wells and springs were sampled more than once; this was done in order to study the variations with time in the F concentrations in the groundwater. The selection of water points to be studied more in detail was based on the sampling of water points so as to have a representative coverage of the whole study area. The springs found in the Arusha National Park were not easily accessed due to their remoteness; thus, they were sampled once. All sampled hand-dug wells (shallow wells) were characterised as shallow aquifers, whereas one sampled borehole is a shallow well was characterised as a shallow aquifer, and the other three sampled boreholes are deep wells are characterised as deep aquifers.

2.4. Field Measurements

During the four field campaigns conducted in the framework of this study, a portable Aquaread AP-700 device was employed in the field to measure in situ physicochemical properties of water samples including temperature, pH, oxidation-reduction potential (ORP), dissolved oxygen (DO), and electrical conductivity (EC). The device also records geographical coordinates (GPS), elevation, date, and time of measurement. Additionally, the device gives the calculated readings of resistivity (RES), total dissolved solids (TDS), salinity (SAL), and seawater specific gravity (SSG) based on the EC and temperature measurements. A total of 174 in situ measurements from 126 water points were recorded from the four field campaigns.

2.5. Laboratory Analysis

Chemical analyses were performed in the Laboratory for Applied Geology and Hydrogeology at Ghent University. Different analytical methods were applied to determine the concentration of various hydrochemical parameters. The pH was measured using a pH meter while the electrical conductivity was measured using an electronic EC meter. The samples that were used for cation analysis after filtration (0.45 µm) were brought to a pH of around 2 prior to analysis by adding ultra-pure nitric acid. The following cations were measured: sodium (Na+), potassium (K+), magnesium (Mg²+), iron (Fe²+/Fe³+), manganese (Mn²+), ammonium (NH4+), and silicon (Si4+). Concentration of Na+, K+, Ca²+, Fe²+/Fe³+, Mg²+, Mn²+, and Si4+ were determined in a diluted solution using flame atomic absorption spectroscopy (AAS) using a Varian Zeeman Spectra AA 400. The concentration of NH4+ was measured using the molecular absorption spectrophotometer UV-VIS Shimadzu UV mini 1240. Anions (chloride (Cl), sulphate (SO42−), nitrate (NO3), and nitrite (NO2) were measured using the molecular absorption spectrophotometer UV-VIS Shimadzu UV mini 1240. Carbonate (CO32−) and bicarbonate (HCO3) contents were obtained by titration with dilute HCl acid, but during the analysis, the tipping point between them at pH = 8.2 was not determined analytically with sufficient accuracy, suggesting that the distribution of HCO3 and CO32− in the samples is strongly variable with pH; hence, it was impossible to measure it accurately using pH as the criterion. Therefore, in this study, the total alkalinity (TA), which is the sum of HCO3 and CO32−, is expressed as mg/L HCO3. The fluoride (F) was measured using an ion selective electrode (ISE). Detailed descriptions of the different analytical methods are extensively explained in the laboratory manual and in standard methods for examination of water and wastewater [28].

2.6. Data Processing and Analysis

The hydrochemical characterisation of groundwater in the study area has been investigated based on the analysis of a Schoeller diagram, Piper diagram, bivariate diagrams, and statistical analyses.
The concentrations of F determined in water samples were compared to the maximum permissible limits for drinking water set by the WHO (1.5 mg/L) and Tanzanian standards (4.0 mg/L).
Major physicochemical parameters were tested for normality using IBM SPSS Statistics 27 software. Considering that all were not normally distributed, the Spearman’s correlation was used for analysis. Since the IBM SPSS Statistics 27 reported all the significant p-values for this test as 0.000 (only in three decimal places), the calculation of p-values in more decimal places was done using Microsoft Excel 2019. A Mann–Whitney U Test was carried out to assess whether the F concentrations in September 2017 and September 2018 (two different dry seasons) are significantly different.

3. Results and Discussion

Table 2 summarises descriptive statistics: minimum, maximum, mean, median, standard deviation, and coefficient of variation for the physicochemical parameters of the water samples analysed in this study. On average, the springs show low concentrations of the different hydrogeochemical parameters followed by the deep wells, shallow wells, and lastly the surface waters (river, water pond, stream, lakes) except for NH4+, NO3, and NO2, which are depleted in surface waters due to their uptake by aquatic organisms. All the physicochemical parameters show high variability as revealed by very high coefficients of variation; this may be due to the complexity of groundwater flow passing through different geological formations of variable weatherability [29] and variable residence times. Overall, the water samples contain concentrations in the order of Na+ > K+ > Ca2+ > Mg2+ > Fe²+/Fe³+ > Mn²+ > NH4+ for cations and HCO3 + CO32− > SO42− > Cl > NO3 > F > NO2 for anions. Figure 4 shows the concentrations of major ions for all analysed water samples in this study. Na+ is the dominant cation in 99% (n = 180) of the analysed water samples (n = 181), whereas HCO3 + CO32− is the dominant anion in all samples; therefore, the main water type for both surface water and groundwater in the area is NaHCO3 (Figure 5) [30].

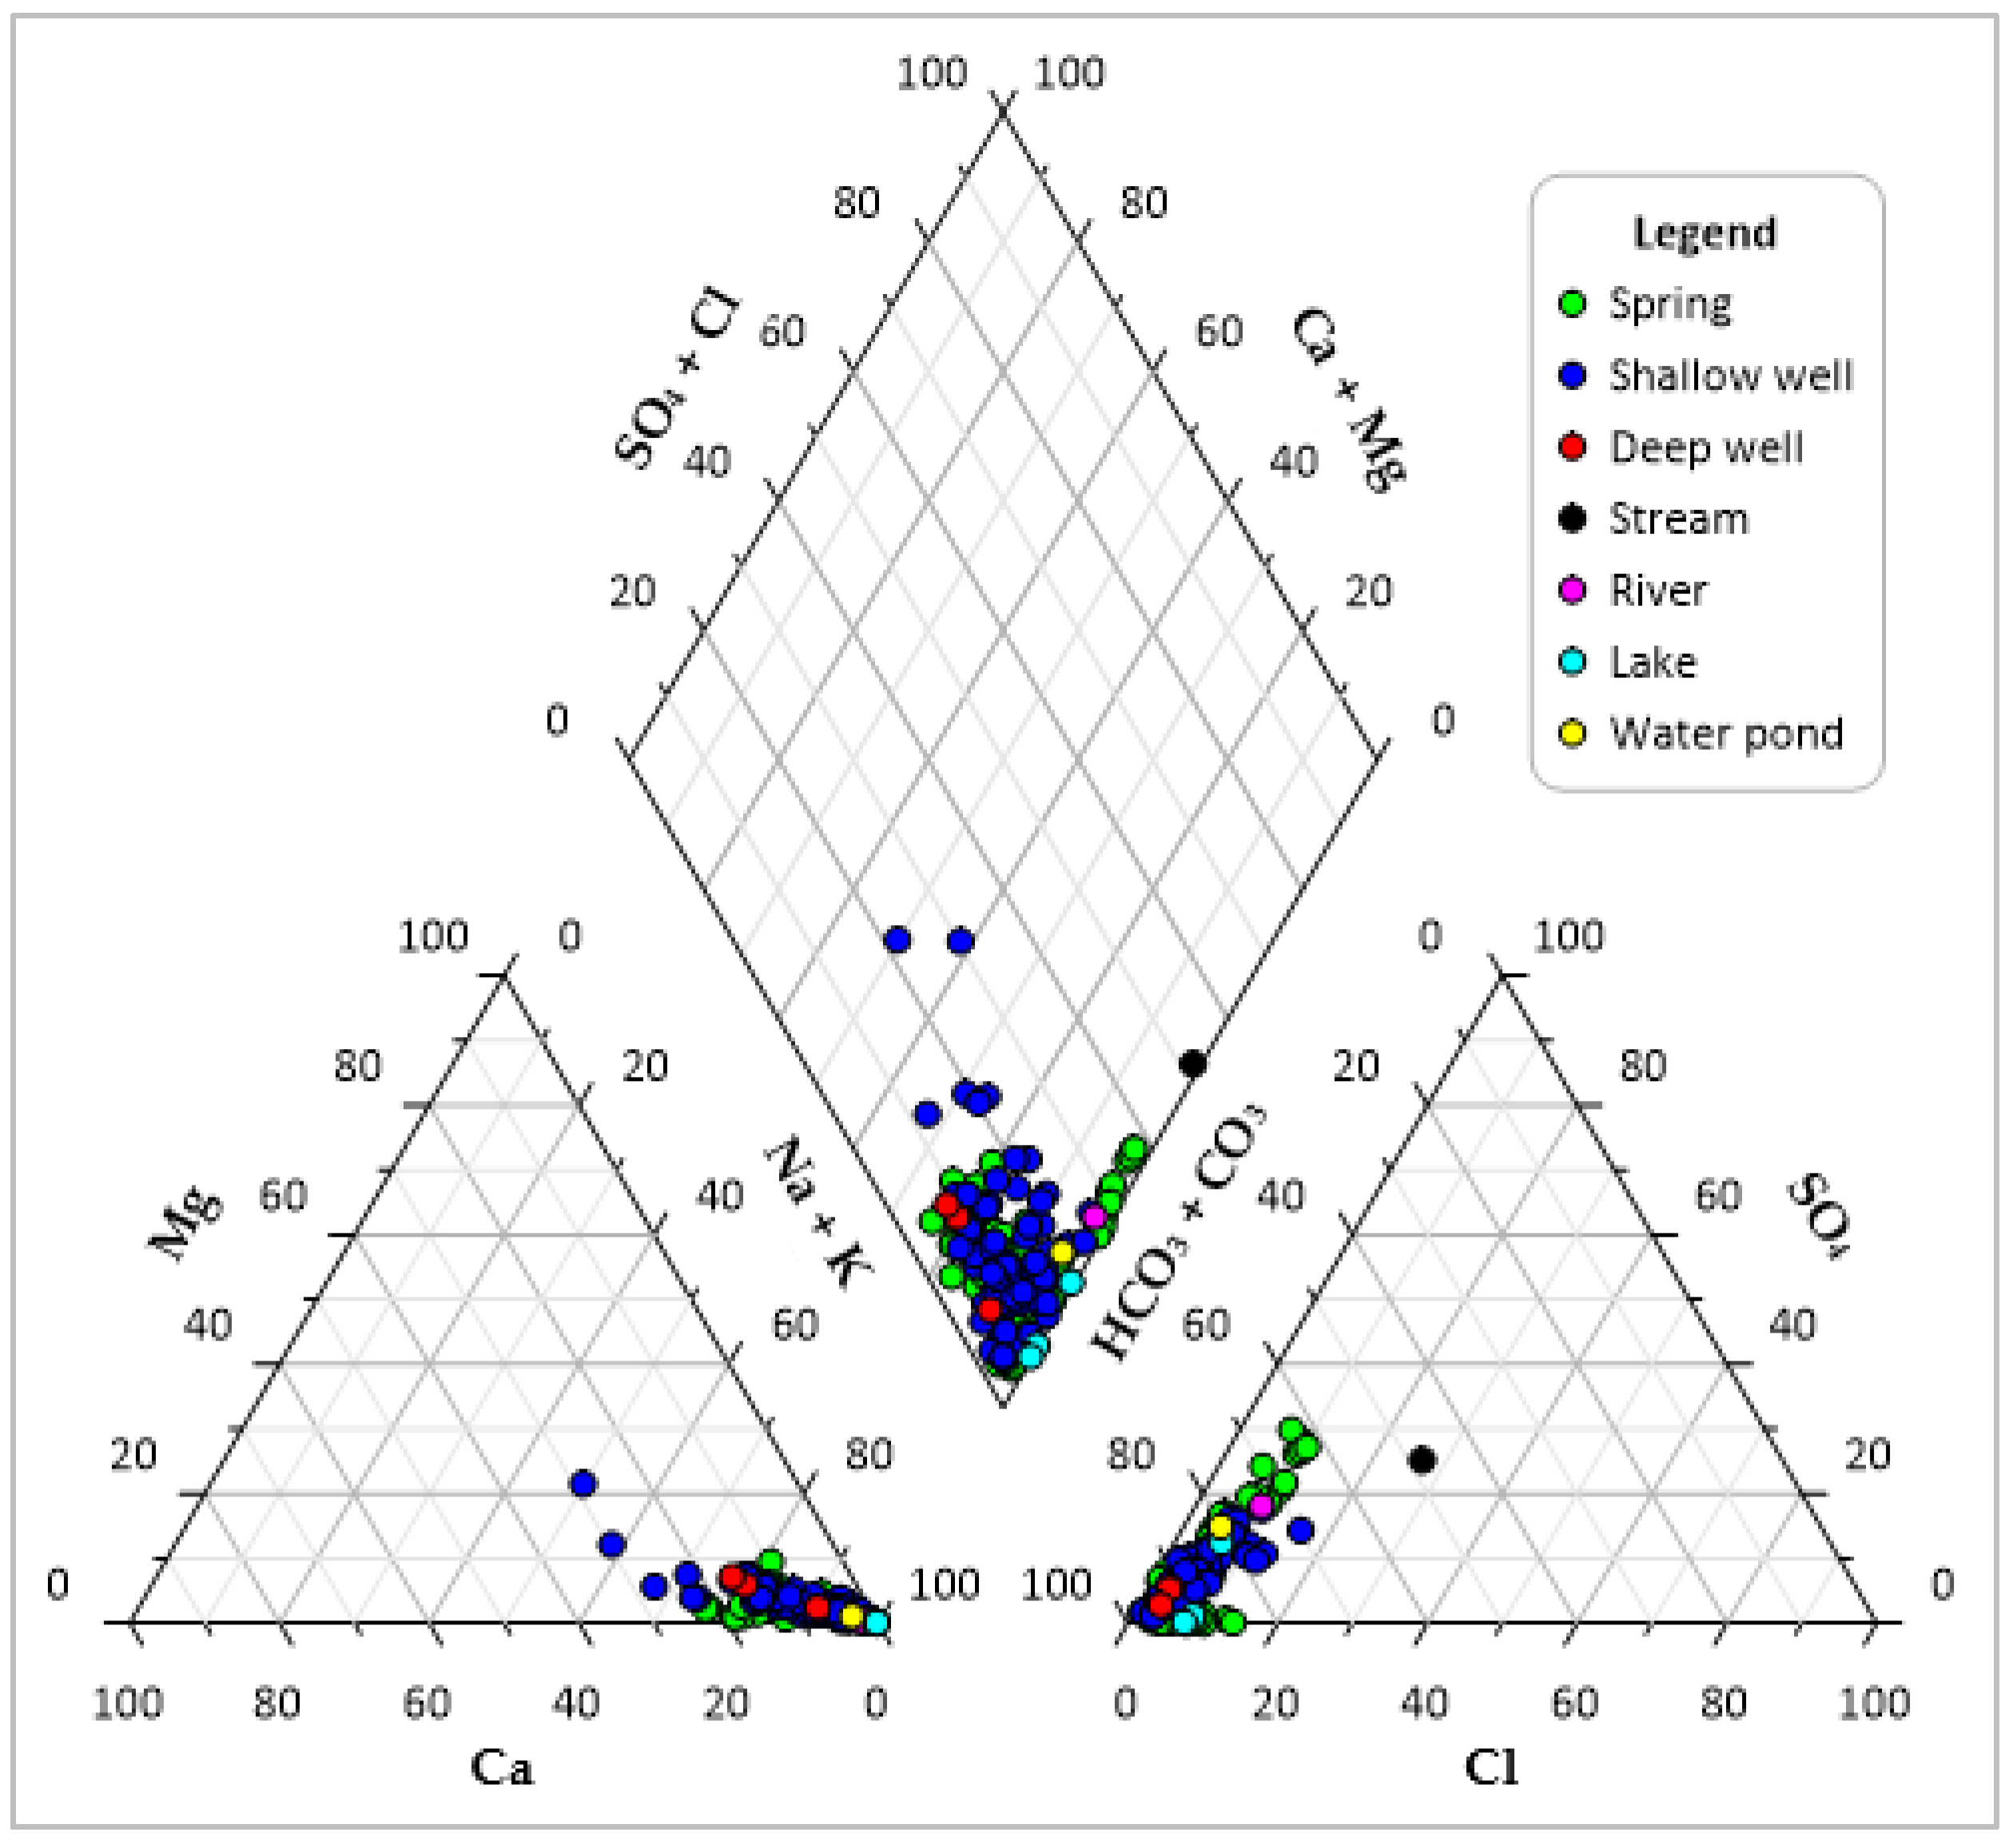
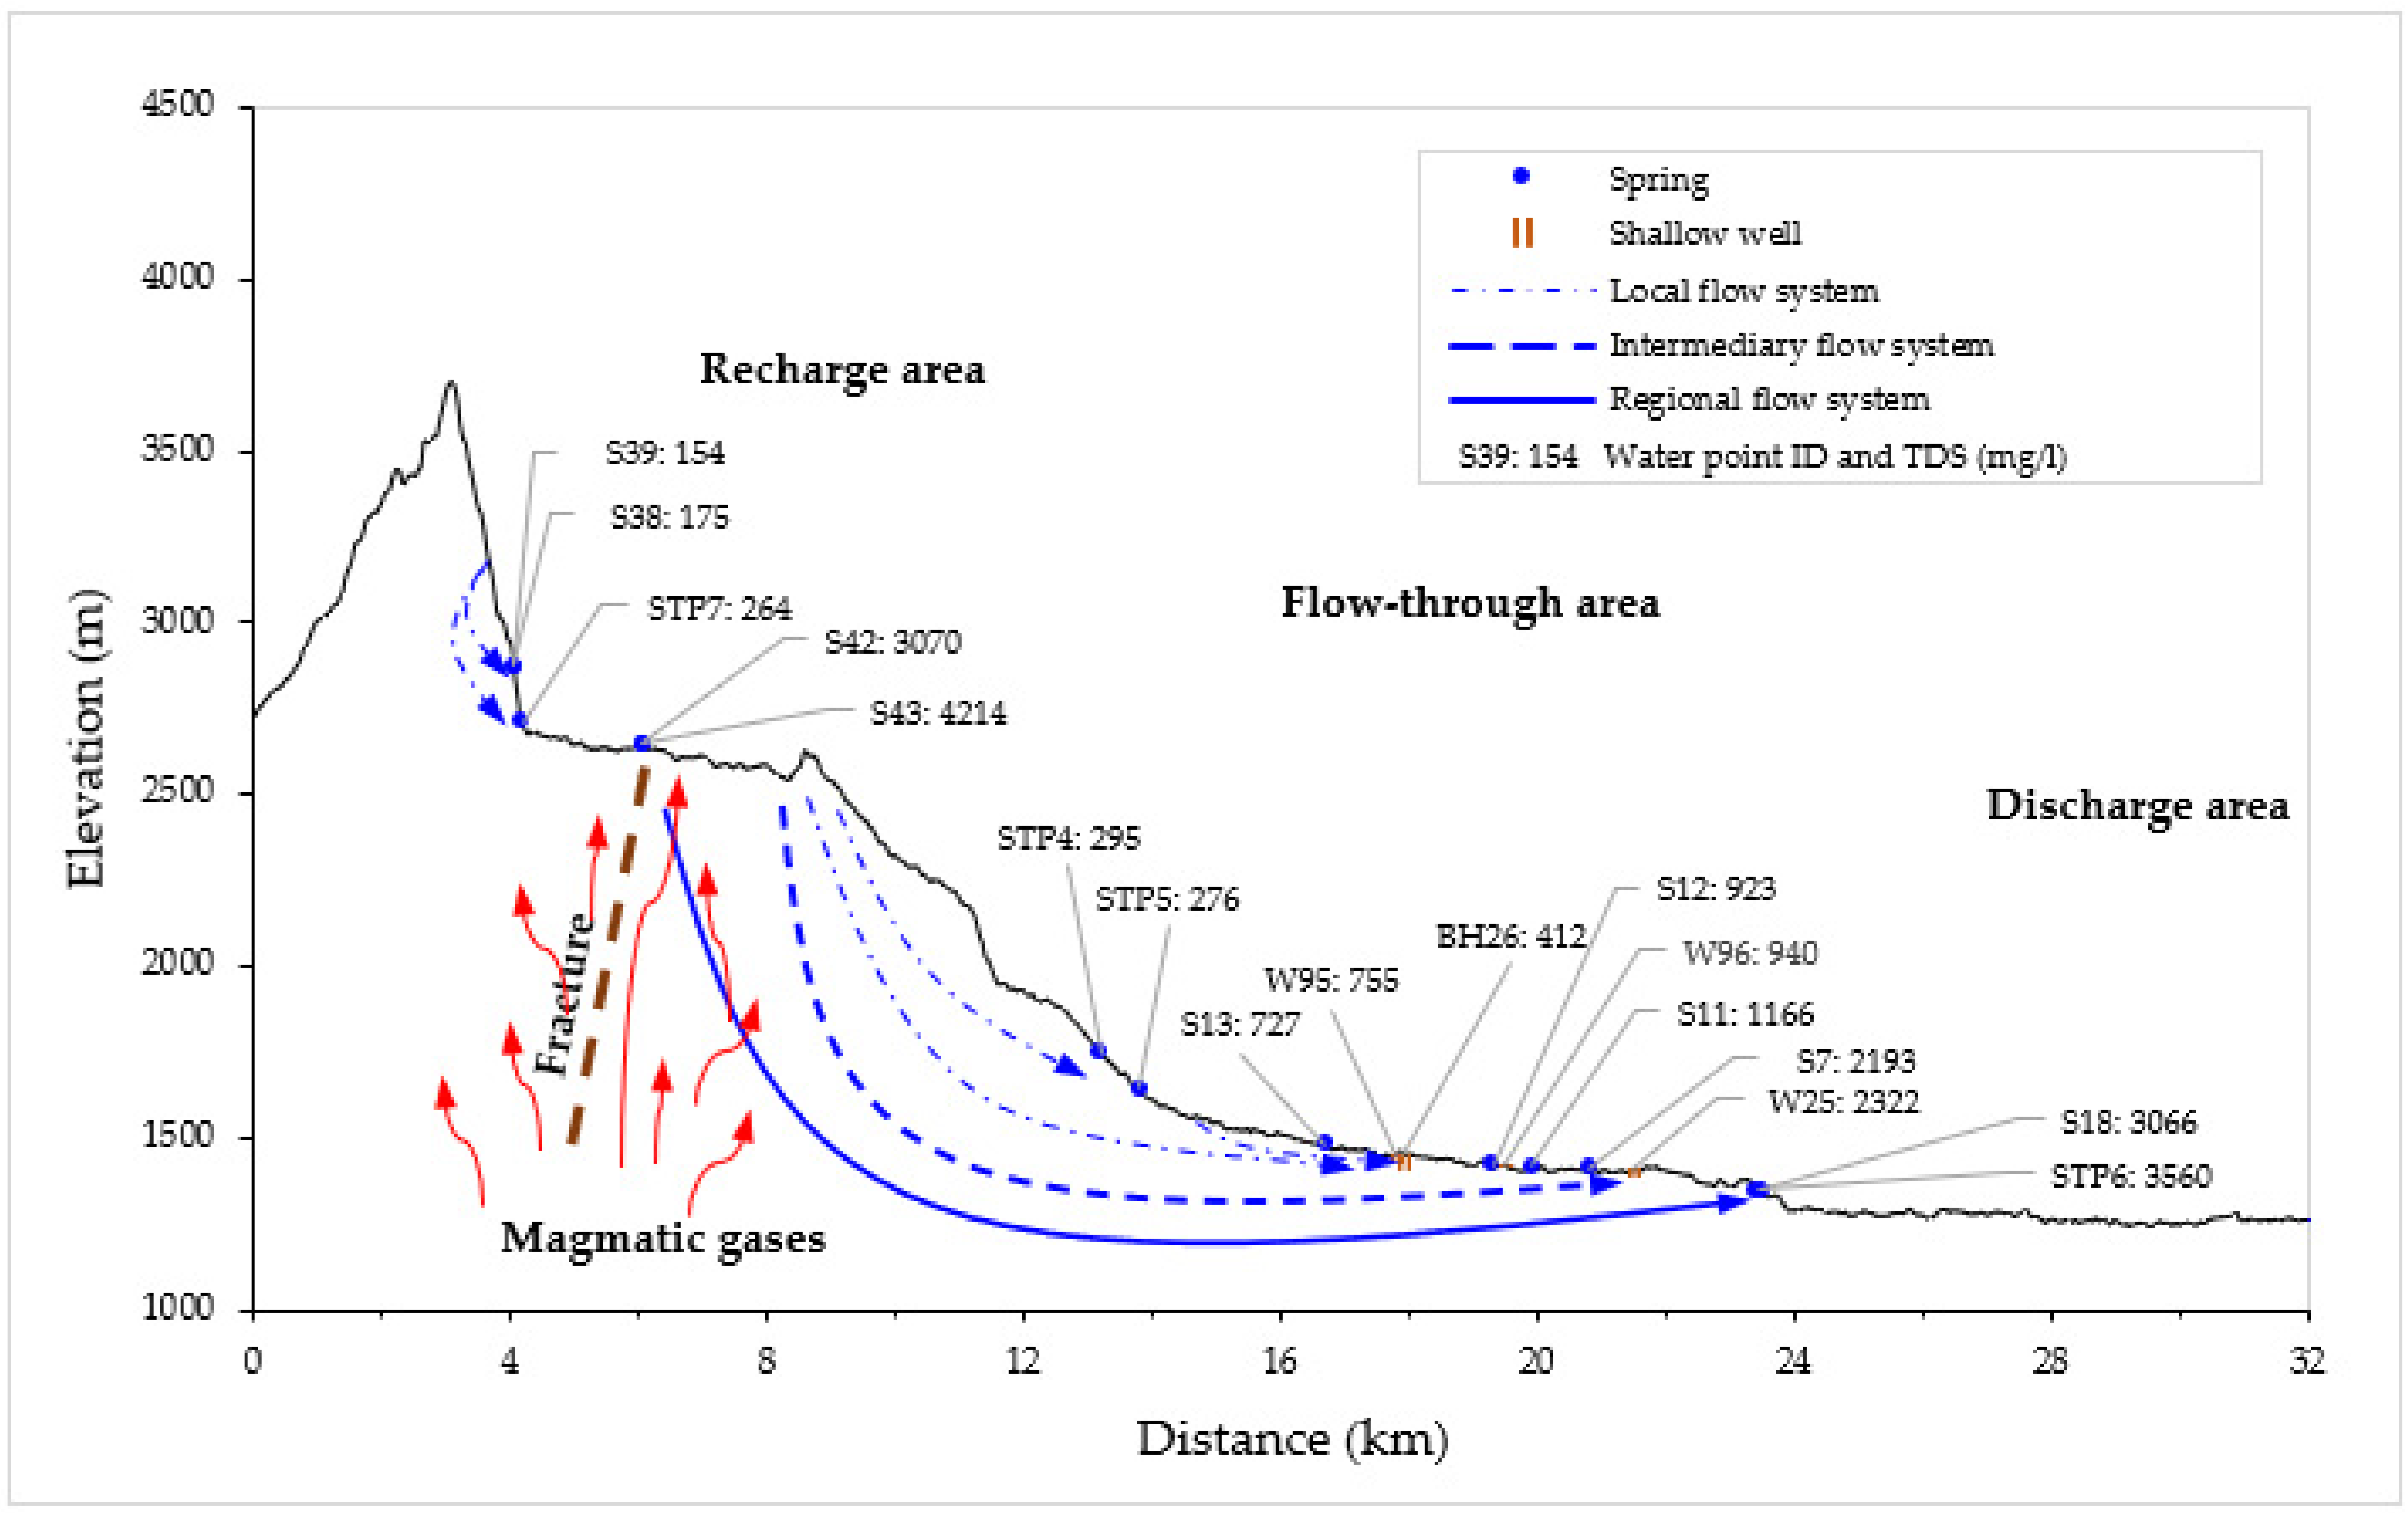
3.1. Physicochemical Characteristics and Conceptual Groundwater Flow Model

In 175 groundwater samples, pH values range from 6.7 to 8.6 with an average of 7.8 and a median of 7.8, indicating alkaline groundwater. In the six surface water samples, pH values range from 8.8 to 10.1 with an average of 9.4 and a median of 9.3, also, indicating alkaline water. Figure 6 shows the spatial distribution of TDS in the study area with a clear increasing trend from the higher elevations towards the lower elevations. On the eastern flank, below the ash cone, water samples from the springs show pH values between 7.1 and 8.6 with an average of 7.8 and a median of 7.8. Their EC values range from 105 μS/cm (at reference temperature of 25 °C) to 4590 μS/cm (hydrothermal spring) with an average of 759 μS/cm and a median of 239 μS/cm, while their TDS values range from 117 to 4214 mg/L with an average of 703 mg/L and a median of 238 mg/L. Despite being at higher elevations in the recharge area, water samples from the two hydrothermal springs (S42—Small Njekukumia and S43—Big Njekukumia) near the ash cone are highly mineralised (average: 3642 mg/L) compared to the surrounding springs, which show low mineralisation (average: 203 mg/L; they are warmer (average temperature: 20.0 °C) compared to the surrounding springs (average temperature: 13.3 °C)), which indicates they are originating from a deep source. In addition, the water sample from the Njekukumia stream (at point STP9), which receives its water from the hydrothermal springs, shows high mineralisation and pH (pH = 9.1, EC = 4390 μS/cm, TDS = 3540 mg/L). The two springs (S44—Small Tululusia and S45—Big Tululusia) that lie on the same line below the hydrothermal springs show significant mineralisation (average: 1174 mg/L). This suggests that their mineralisation might be influenced by the infiltrated water from the hydrothermal springs or derived from the same source.
At lower elevations, in the discharge area, surface water samples from the three lakes (L1—Small Momella lake, L2—Big Momella lake, and L3—Lake Rishateni) show pH values ranging from 9.5 to 10.1 with an average of 9.8 and a median of 9.9, while their EC values range from 8630 to 19,820 μS/cm with an average of 15340 μS/cm and a median of 17,570 μS/cm, and their TDS values range from 7438 to 17,495 mg/L with an average of 13,541 mg/L and a median of 15,691 mg/L. The lakes are highly mineralised compared to other water samples. These lakes are closed basin lakes (no water in, no water out); therefore, a longer water residence time and evapoconcentration lead to high mineralisation of these waters.
Figure 7 shows a simplified groundwater flow conceptual model for the northeastern flank of Mount Meru showing different flow systems: local, intermediary, and regional [31,32]. The model was developed based on hydrogeochemical processes, groundwater mineralisation, spring settings, and groundwater level in the shallow wells. The model suggests the influence of the volcanic gases in the groundwater chemistry of the two hydrothermal springs (S42 and S43) and the two springs from the discharge area (S18 and STP6), which are flowing from the deepest flow line [33,34,35]. The model shows the increase of groundwater mineralisation with water residence times. The longer the flow path, the longer the residence time, hence high mineralisation.
On the far east of the eastern flank, on the northern flank of Ngurdoto crater, at Nkoasenga, water samples from the two springs found in the area show that spring S1 at elevation of 1560 m is less mineralised (pH = 7.2, EC = 632 μS/cm, TDS = 573 mg/L) compared to S2 at lower elevation of 1483 m (pH = 7.6, EC = 919 μS/cm, TDS = 789 mg/L), indicating that the groundwater mineral content progressively increases along the flow path with increasing residence time, long residence times favouring prolonged water–rock interaction. The trend is also observed in shallow wells where wells at high elevations (average: 1586 m) show low mineralisation (average values: pH = 7.7, EC = 621 μS/cm, TDS = 605 mg/L) compared to wells at low elevations (average: 1491 m), which show significant mineralisation (average values: pH = 8.2, EC = 1221 μS/cm, TDS = 1118 mg/L). The only surface water sample WP from a water pond which is at lower elevation of 1429 m is highly mineralised (pH = 9.2, EC = 4310 μS/cm, TDS = 3237 mg/L) compared to other samples; this is attributed to longer water residence time and evapoconcentration. In Leguruki, shallow wells at lower elevation of 1354 m show low mineralisation (average values: pH = 7.7, EC = 743 μS/cm, TDS = 666 mg/L), similar mineralisation as water samples from high elevations in Nkoasenga. The low mineralisation of these wells, despite being at lower elevations, suggests shorter water residence times. These shorter residence times suggest that there are different local flow systems in the area.
Table 3 shows the average values of pH, EC, and TDS in the water samples from different elevations and different well depths on the northeastern, northwestern, western, and southwestern flank of Mount Meru. On the northeastern flank, at Ngarenanyuki, Uwiro, and Mkuru, both springs and wells also show a similar trend of progressive mineralisation of the groundwater along the flow paths. On average, on the northwestern flank, at Oldonyo Sambu, there is progressive mineralisation of the groundwater from elevation of 2567 m (average TDS: 242 mg/L) to 2084 m (average TDS: 410 mg/L); then, the mineralisation remains comparable towards the lower elevations (average TDS: 446 mg/L at 1838 m elevation). This suggests that the groundwater is flowing through fractures between 2084 and 1838 m elevations or is due to a local flow system in the area. On the western flank, at Mamsa, there is also clear progressive mineralisation of the groundwater along the flow path as the spring at higher elevation of 2240 m shows low mineralisation (TDS: 590 mg/L) compared to shallow wells at lower elevation of 1649 m (average TDS: 1017 mg/L). On the southwestern flank, at Ngaramtoni and near Arusha town, also the similar trend of progressive mineralisation of the groundwater from the upstream to the downstream is observed in both springs and wells but with some exceptions in some wells. Despite being at lower elevation of 1379 m, two shallow wells (W100 and W101) show low mineralisation (average TDS: 893 mg/L) compared to shallow wells at intermediate elevation of 1548 m (average TDS: 1188 mg/L), also, this suggests shorter water residence times, due to different local flow systems in the area. In addition, despite being at lower elevations, deep wells show low mineralisation (average TDS: 653 mg/L) compared to all shallow wells (range of average TDS: 744–1188 mg/L); this suggests that these are deep circulating waters that have undergone deep infiltration in the recharge area at higher elevations, possibly through fractures and faults. The low mineralisation in the deep circulating groundwater compared to the shallow one can be attributed to slow weathering and dissolution of aluminosilicate minerals in the weathered fractured lava composing the deep aquifer compared to the pyroclastic deposits that form the composition of the shallow aquifer.

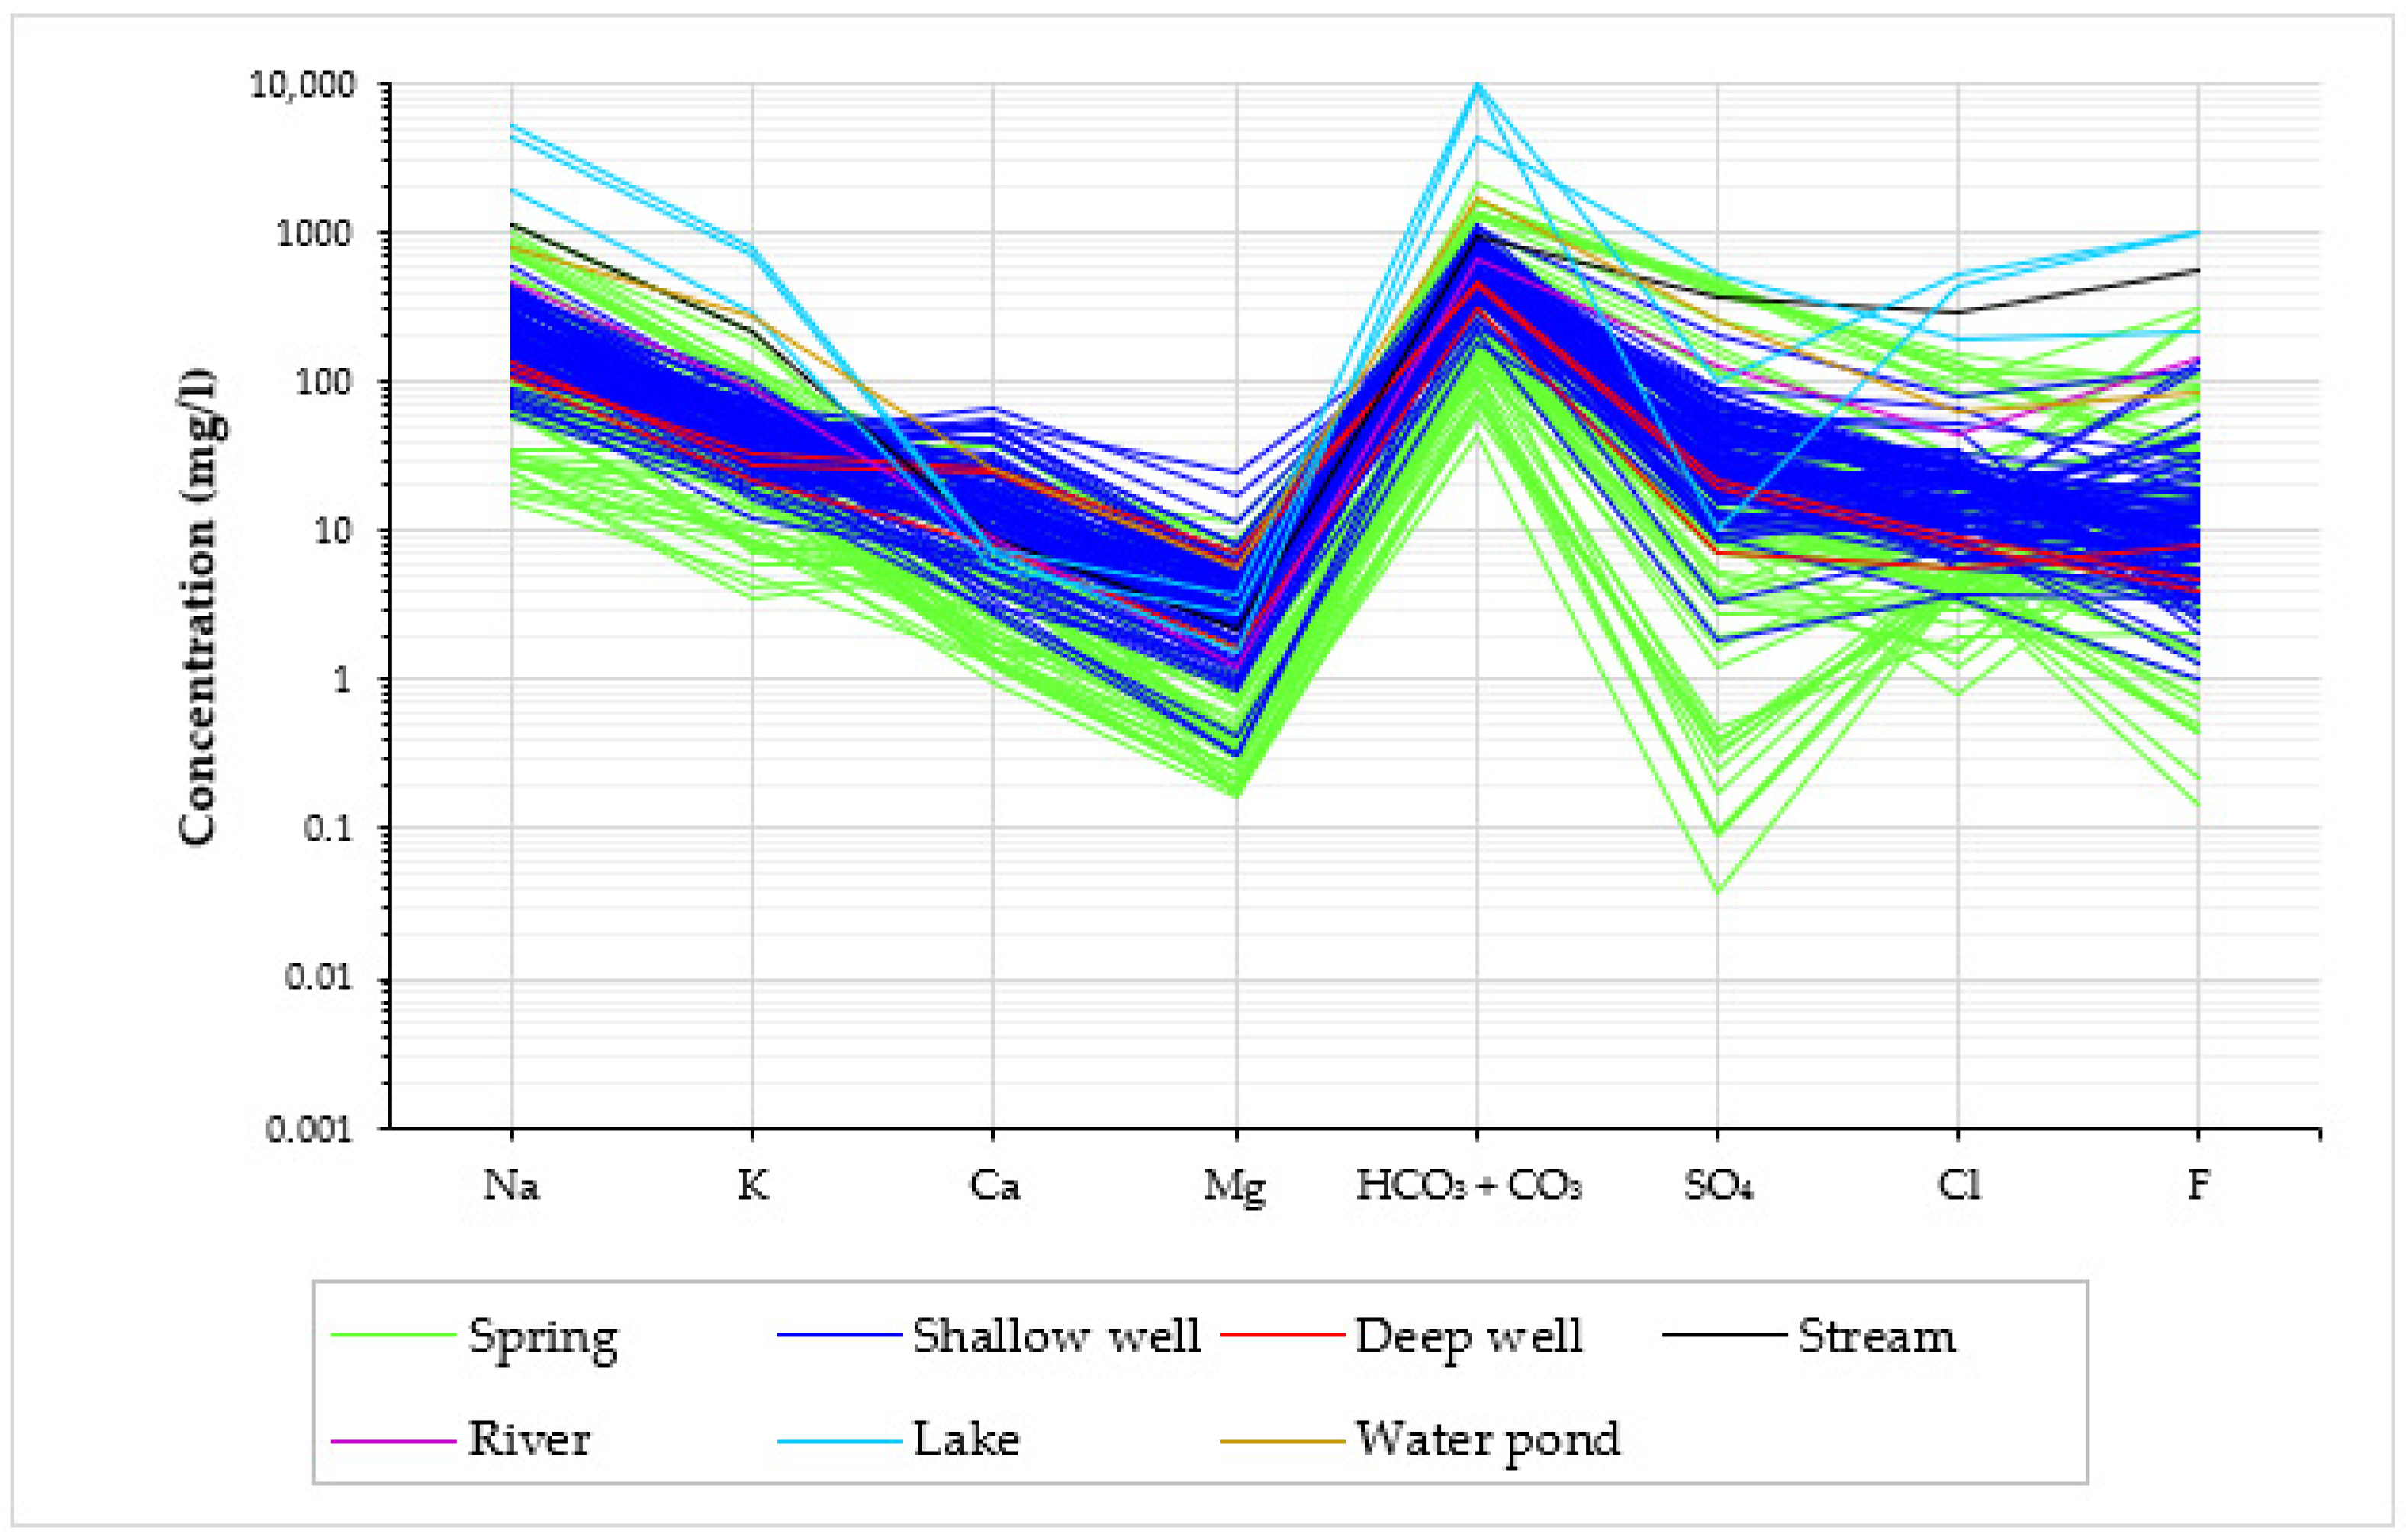
3.2. Major and Minor Ions Origin

Table 4 shows the correlation matrix between the main hydrogeochemical parameters. The significant strong positive correlations are highlighted in green colour. The significant strong positive correlation between total alkalinity (HCO3 + CO32−), alkaline elements (Na+ and K+), SO42−, and Cl suggests that they are released in groundwater by simultaneously occurring hydrogeochemical processes. The strong positive correlation of TDS with Na+, K+, HCO3 + CO32−, SO42−, and Cl indicates that the concentration of these elements progressively increases together with the mineralisation of the groundwater along the groundwater flow path in response to the main hydrogeochemical processes [29]. The strong positive correlation of Cl with Na+, K+, HCO3 + CO32−, and SO42− suggests the evapoconcentration along the flow path, the localised dissolution of evaporitic salts such as halite (NaCl), sylvite (KCl), gypsum (CaSO4.2H2O), anhydrite (CaSO4), thenardite (Na2SO4), and mirabilite (Na2SO4.10H2O) [29,36], and the admixture of volcanic gases (which are containing lots of CO2, SO2, HCl, HF) as Mount Meru is an active volcano [33,34,35]. The significant moderate positive correlations of F with Na+ and K+ indicate that the progressive increase of F goes parallel with the increase in alkaline elements (suggesting progressive rock–water interaction), whereas the significant weak negative correlations of F with Ca2+ and Mg2+ indicate that the progressive increase of F goes parallel with the decrease in alkaline earth elements along the groundwater flow paths, through precipitation of carbonate minerals: aragonite, calcite, and dolomite. The high concentrations of HCO3 + CO32−, SO42−, Cl, and F in the two hydrothermal springs suggest that the volcanic emissions are responsible for their composition.

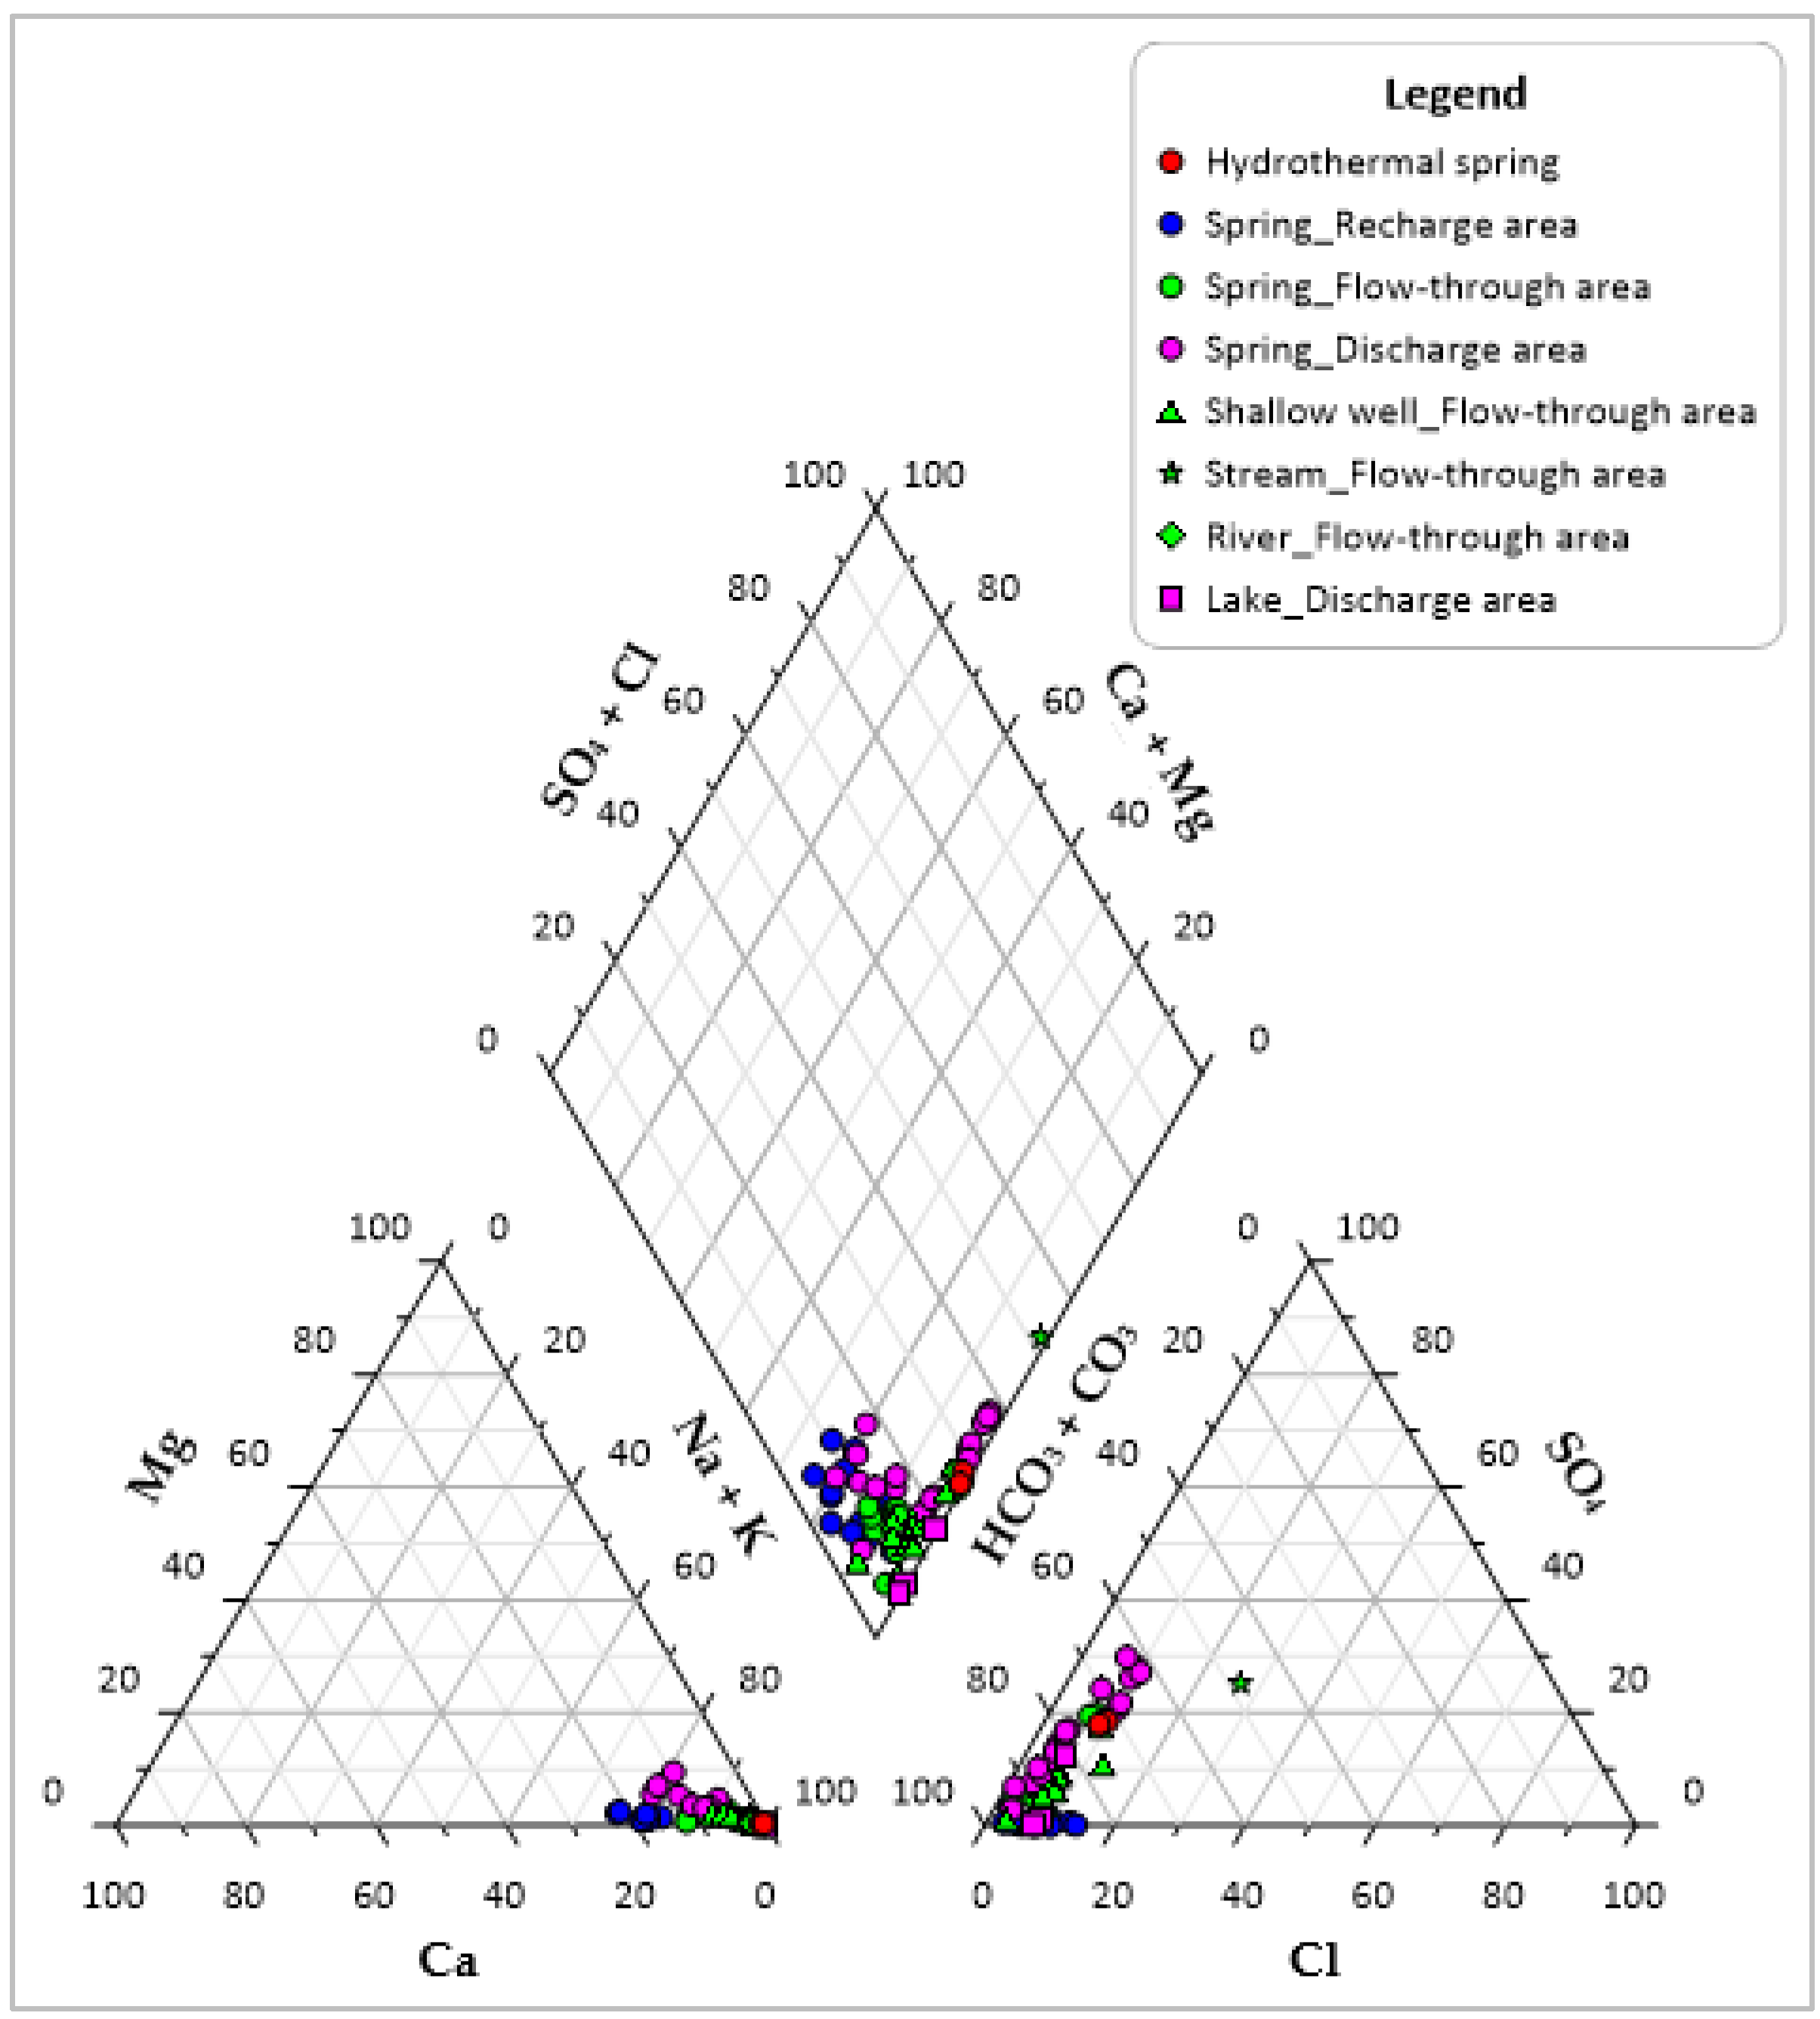
3.2.1. Eastern and Northeastern Flanks

The concentration of Na+ in groundwater varies between 15.1 mg/L (spring water from the recharge area) and 1123 mg/L (hydrothermal spring water). The spatial distribution of Na+ shows an increasing trend from the higher elevations where the springs from the recharge areas show lower concentrations (average: 29.7 mg/L) towards the lower elevations (flow-through and discharge areas), where water samples show higher concentrations (springs: average 393 mg/L; wells: average 230 mg/L), indicating a progressive increase along groundwater flow paths. The two hydrothermal springs show higher Na+ concentrations (average: 1011 mg/L); they may contribute high Na+ concentrations in the shallow aquifer on these flanks. In all 57 groundwater samples from these flanks, the average concentrations of Na+, K+, Ca2+, and Mg2+ in mg/L are 293, 46.4, 9.7, and 2.5 respectively, suggesting that the contribution of Na-K-bearing minerals in releasing cations in the groundwater is more important than that of Ca-Mg-bearing minerals.
The concentration of total alkalinity (HCO3 + CO32−) in groundwater varies between 44.5 mg/L HCO3 (spring water from the recharge area) and 2170 mg/L HCO3 (hydrothermal spring water). The total alkalinity increases from the recharge area where springs show lower concentrations (average: 103 mg/L HCO3) towards the discharge areas where water samples show higher concentrations (springs: average 820 mg/L HCO3; wells: average 507 mg/L HCO3). This indicates that the concentration of the total alkalinity progressively increases along the groundwater flow path with increasing residence time as the result of the dissolution of CO2(g) in groundwater that forms H2CO3 that causes extensive aluminosilicate dissolution, raising HCO3 in the groundwater; at high pH, the HCO3 transforms to CO32−. The CO2(g) comes from the admixture of volcanic gases [33,34,35], the atmosphere, the respiration of microorganisms in the soil zone, and the aerobic and anaerobic decomposition of organic matter in infiltrating water [29]. The two hydrothermal springs show the highest HCO3 + CO32− concentrations (average: 1728 mg/L HCO3); this indicates that volcanic emissions are here contributing high CO2(g) in the groundwater; also, they may contribute high HCO3 + CO32− concentrations in the shallow aquifer on these flanks.
SO42− concentration in groundwater varies between 0.0 mg/L (spring water from the recharge area) and 499 mg/L (spring water from the discharge area). In addition, the SO42− shows a similar increasing trend from the recharge area where springs show lower concentrations (average: 0.6 mg/L) towards the discharge areas where there are higher concentrations (springs: average 159 mg/L; wells: average 42.8 mg/L). The two hydrothermal springs show higher SO42− concentrations (average: 339 mg/L), again pointing to volcanic emissions, which may also contribute to high SO42− concentrations in the shallow aquifer on these flanks, resulting from the reaction between SO2 and H2O in the volcanic gases [33,34,35].
The concentration of Cl in groundwater varies between 1.7 mg/L (spring water from the recharge area) and 148 mg/L (hydrothermal spring water). In general, chloride behaves as a conservative element, but the spatial distribution of Cl shows a similar increasing trend from the higher elevations where springs from the recharge area show lower concentrations (average 4.7 mg/L) towards the lower elevations where there are higher concentrations (springs: average 41.7 mg/L; wells: average 27.7 mg/L). The hydrothermal springs show the highest Cl concentrations (average: 124 mg/L); this again points to volcanic emissions containing HCl [33,34] at depth, which may also contribute to elevated Cl concentrations in the shallow aquifer on these flanks.
F concentration in groundwater varies between 0.15 mg/L (spring water from the recharge area) and 301 mg/L (hydrothermal spring water). Similarly to the major parameters, the spatial distribution of F shows an increasing trend from the higher elevations where the springs from the recharge areas show lower concentrations (average: 2.7 mg/L) towards the lower elevations where there are higher concentrations (springs: average: 45.1 mg/L; wells: average 24.6 mg/L). The hydrothermal springs have higher F concentrations (average: 198 mg/L), providing another indication of volcanic emissions at depth [33], which may also contribute high F concentrations in the shallow aquifer on these flanks. The Njekukumia stream, which receives its water from the two hydrothermal springs is known for contributing high F water to the Ngarenanyuki river [11]. The water sample collected at the Njekukumia stream at point STP9 (2.5 km away from the hydrothermal springs) shows an extremely high Fvalue of 553 mg/L, whereas the water sample collected at the Ngarenanyuki river at point STP10 (10 km away from STP9) shows a high F value of 144 mg/L.
NO3 concentration in groundwater varies between 0.0 mg/L (one spring water sample from recharge area and one well water sample from the flow-through area) and 59.1 mg/L (spring water from the discharge area). The springs from the recharge areas show lower NO3 concentrations (average: 2.4 mg/L) than water samples from the lower elevations (springs: average: 14.5 mg/L; wells: average: 8.2 mg/L). The hydrothermal springs have lower NO3 concentrations (average: 1.7 mg/L), showing that the hydrothermal springs are characterised by the volcanic gases, which are not containing NO3, while the parameters that are high in the hydrothermal springs (total alkalinity, SO42−, Cl, F) are derived from the volcanic emissions.
Overall, the concentration of NO2 is characterised by relatively low concentrations in all water samples. NO2 concentration in groundwater varies between 0.0 mg/L (spring and well waters) and 3.7 mg/L (spring water from the flow-through area). The springs from the recharge areas show lower NO2 concentrations (average: 0.001 mg/L) than water samples from the lower elevations (springs: average 0.25 mg/L; wells: average 0.06 mg/L). The two hydrothermal springs have lower NO2 concentrations (average: 0.002 mg/L).
At Ngarenanyuki, locally occurring evaporitic salt (trona (Na2CO3·NaHCO3·2H2O)), an evaporite mineral locally called “magadi”, is observed as an efflorescent crust during the dry season (Figure 8). The primary source of the “magadi” in this area is the NaHCO3–type groundwater: during the dry season, the NaHCO3-type groundwater is concentrated at/near the surface by capillary rise and evapoconcentration, and it may precipitate to form the salt. As a result of the local presence of this salt, its dissolution during the rainy season will only have a local effect on groundwater chemistry [29]. Figure 9 shows the projection of the different water samples from these flanks in the Piper diagram.

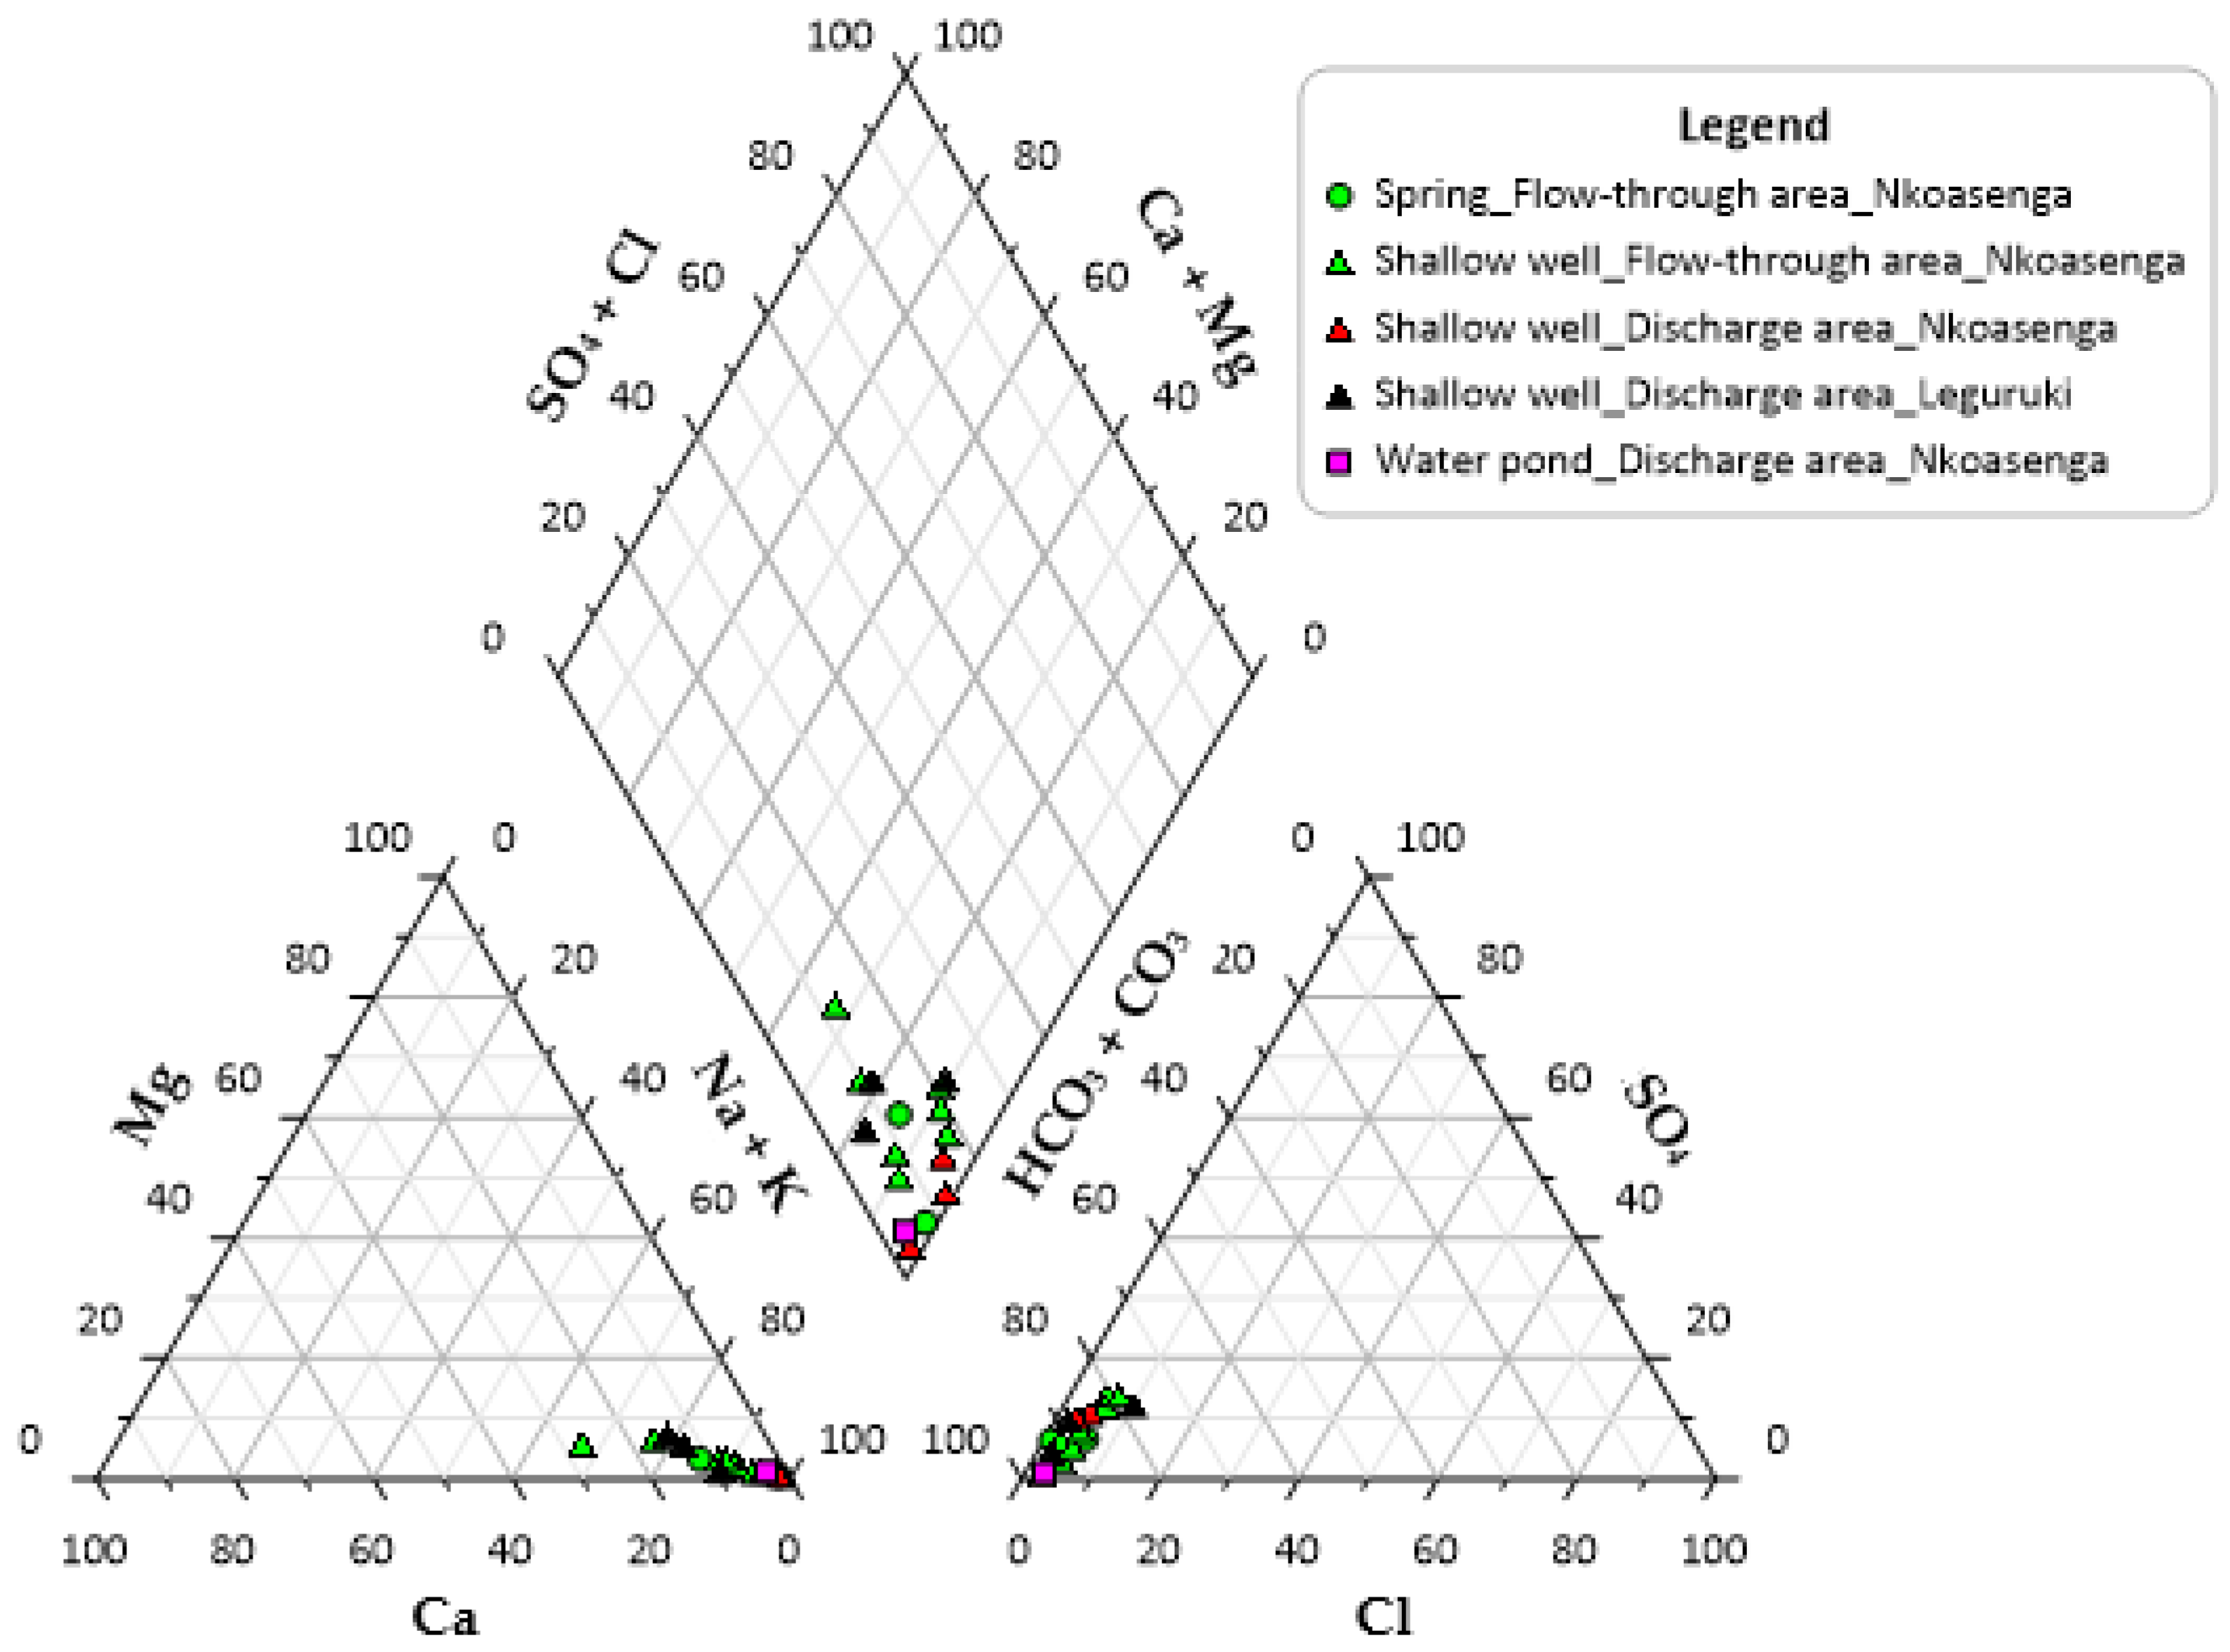
3.2.2. Far East of the Eastern Flank (Northern Flank of Ngurdoto Crater)

The concentration of Na+ in groundwater ranges from 58 to 443 mg/L (both from well waters), whereas the concentration of HCO3 + CO32− ranges from 186 to 756 mg/L HCO3 (both from well waters). The concentration of F ranges from 1.0 to 134 mg/L (both from well waters). In all 15 groundwater samples from this flank, the average concentrations of Na+, K+, Ca2+, and Mg2+ in mg/L are 135, 34.3, 11.0, and 2.3, respectively, again showing that the Na-K-bearing minerals are dominant in releasing cations in the groundwater. Table 5 shows that, on average, water samples from both springs and wells at Nkoasenga show a progressive increase of Na+, K+, HCO3 + CO32−, SO42−, F, and NO3 from the upstream to the downstream, whereas Ca2+, Mg2+, and Cl decrease along the flow path. In Leguruki, all three water samples are from lower elevations, their low values are attributed to the local flow system in the area (see Section 3.1). Figure 10 shows the projection of the different water samples from this flank in the Piper diagram.

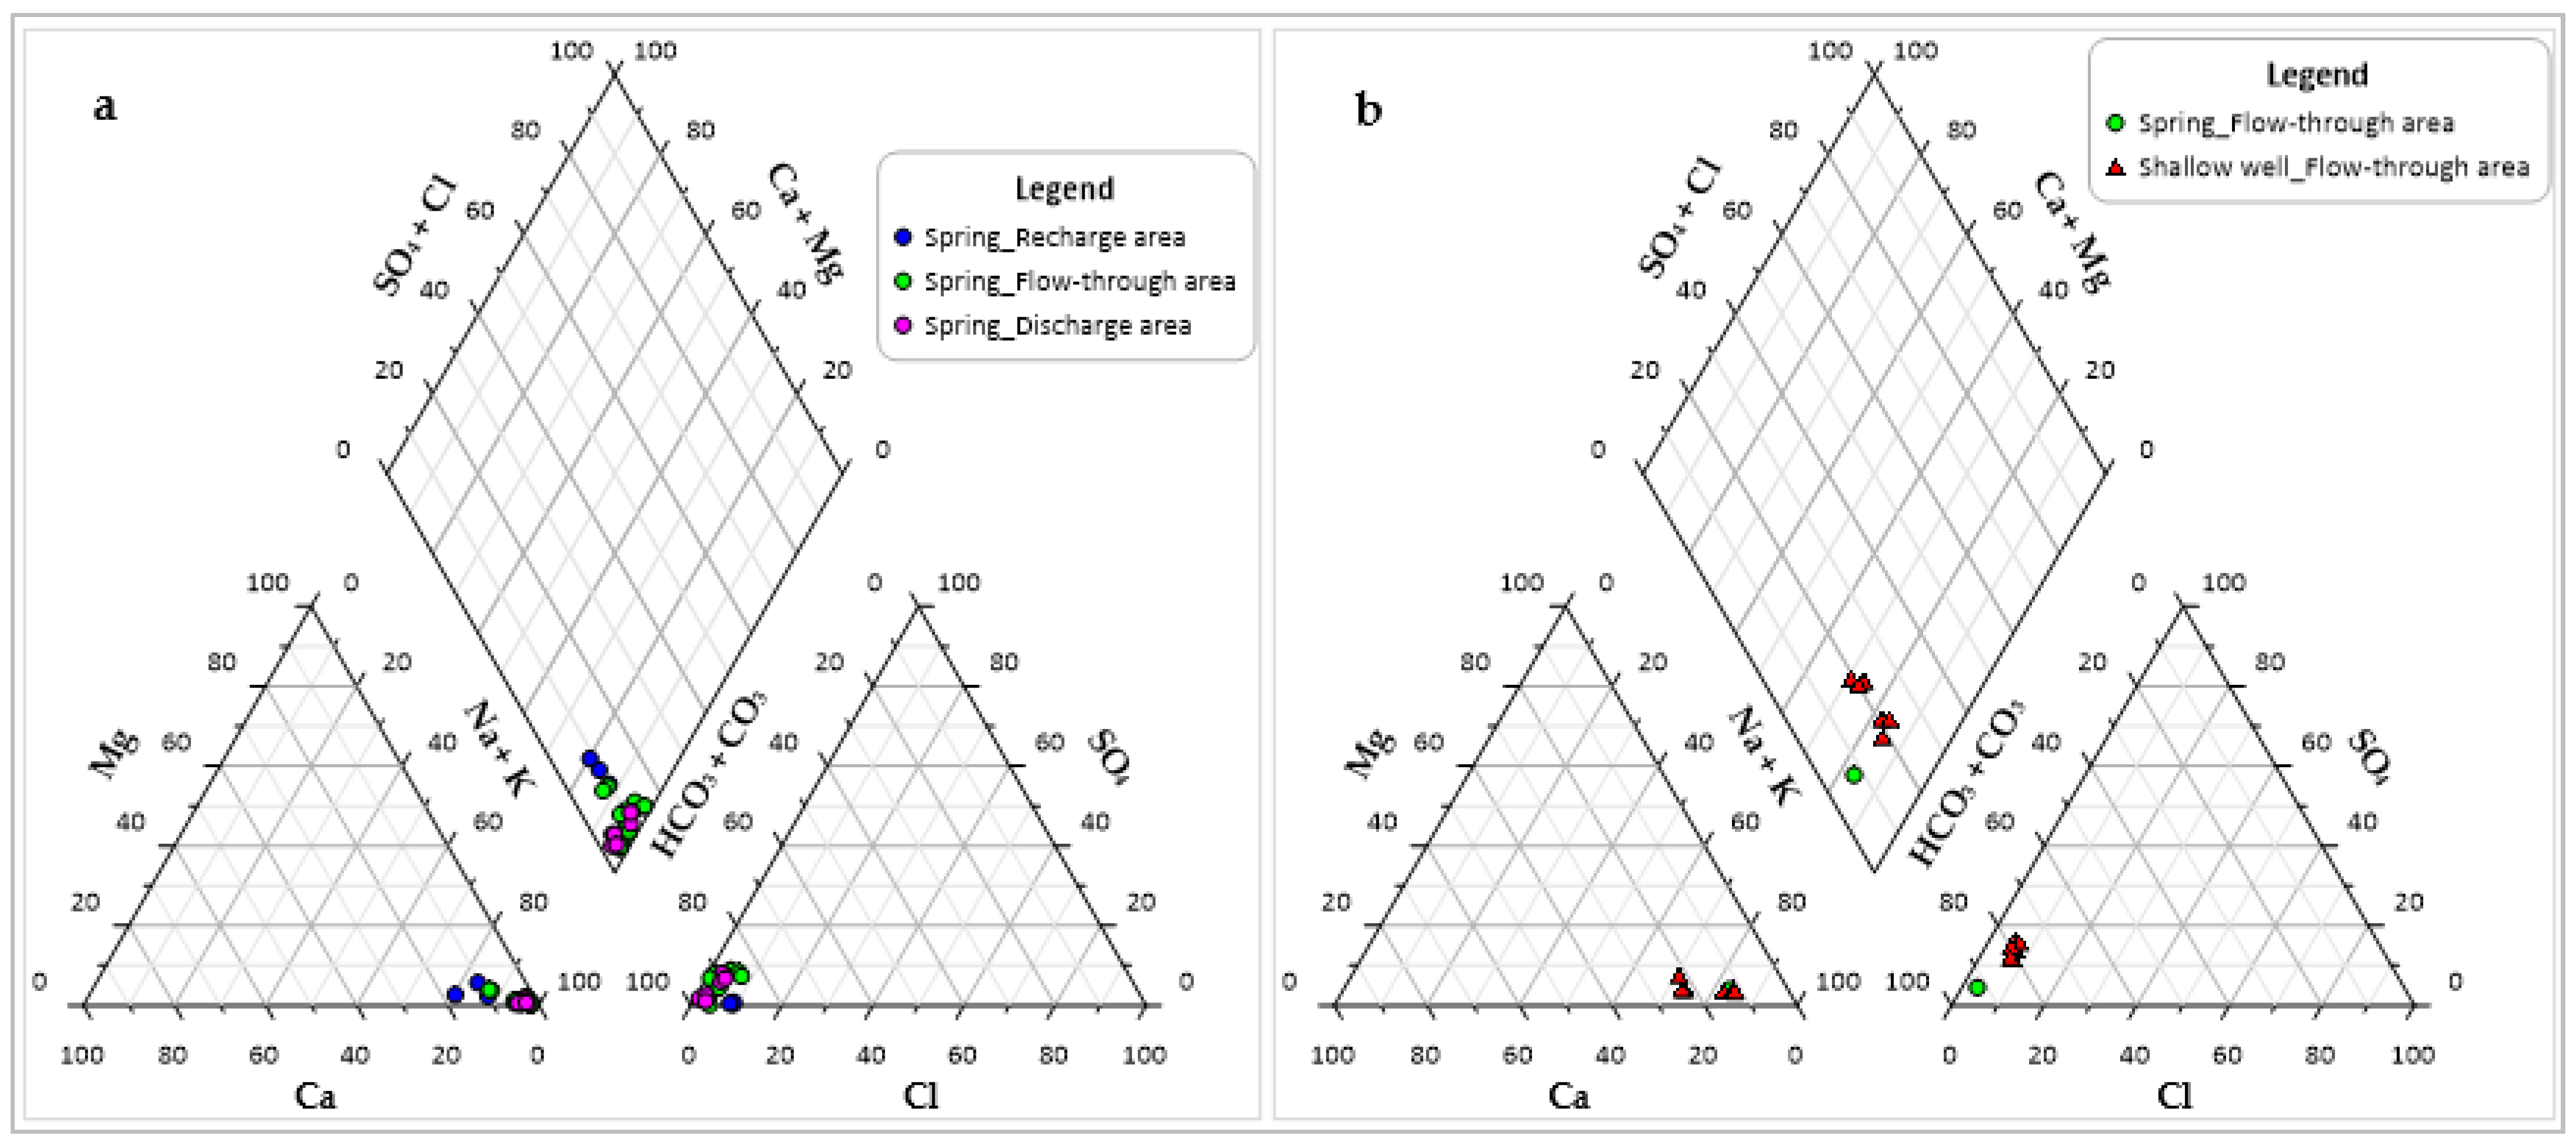
3.2.3. Northwestern and Western Flanks

On the northwestern flank, all water samples are from springs, the concentration of Na+ in groundwater ranges from 17.0 to 135 mg/L, whereas the concentration of HCO3 + CO32− ranges from 59.0 to 292 mg/L HCO3. The concentration of F ranges from 0.4 to 61.7 mg/L. In all 25 groundwater samples from this flank, the average concentrations of Na+, K+, Ca2+, and Mg2+ in mg/L are 83.9, 19.4, 3.0, and 0.6, respectively. Again, this shows that the Na-K-bearing minerals are dominant in releasing cations in the groundwater. On the western flank, the concentration of Na+ ranges from 111 mg/L (spring water) to 187 mg/L (well water), whereas the concentration of HCO3 + CO32− ranges from 365 mg/L HCO3 (spring water) to 567 mg/L HCO3 (well water). The concentration of F ranges from 3.4 mg/L (spring water) to 4.0 mg/L (well water). In all seven groundwater samples from this flank, the average concentrations of Na+, K+, Ca2+, and Mg2+ in mg/L are 170, 37.6, 36.4, and 5.7, respectively, showing once more that the Na-K-bearing minerals are dominant in releasing cations; however, in this case, there is also an important contribution from Ca-bearing minerals. Table 6 shows that on average, water samples from the northwestern flank show a progressive increase of Na+, K+, HCO3 + CO32−, SO42−, F, and NO3 from elevation of 2567 m to 2084 m, while Ca2+, Mg2+, and Cl remain constant; descending further, most ions remain comparable towards the lower elevations (average: 1838 m); this is attributed to shorter residence time as groundwater flows through fractures between 2084 and 1838 m elevations (see Section 3.1). On the western flank, on average, all ions except F (which remains constant) increase from the upstream to the downstream. Figure 11 shows the projection of the different water samples from the northwestern and western flanks in the Piper diagram.

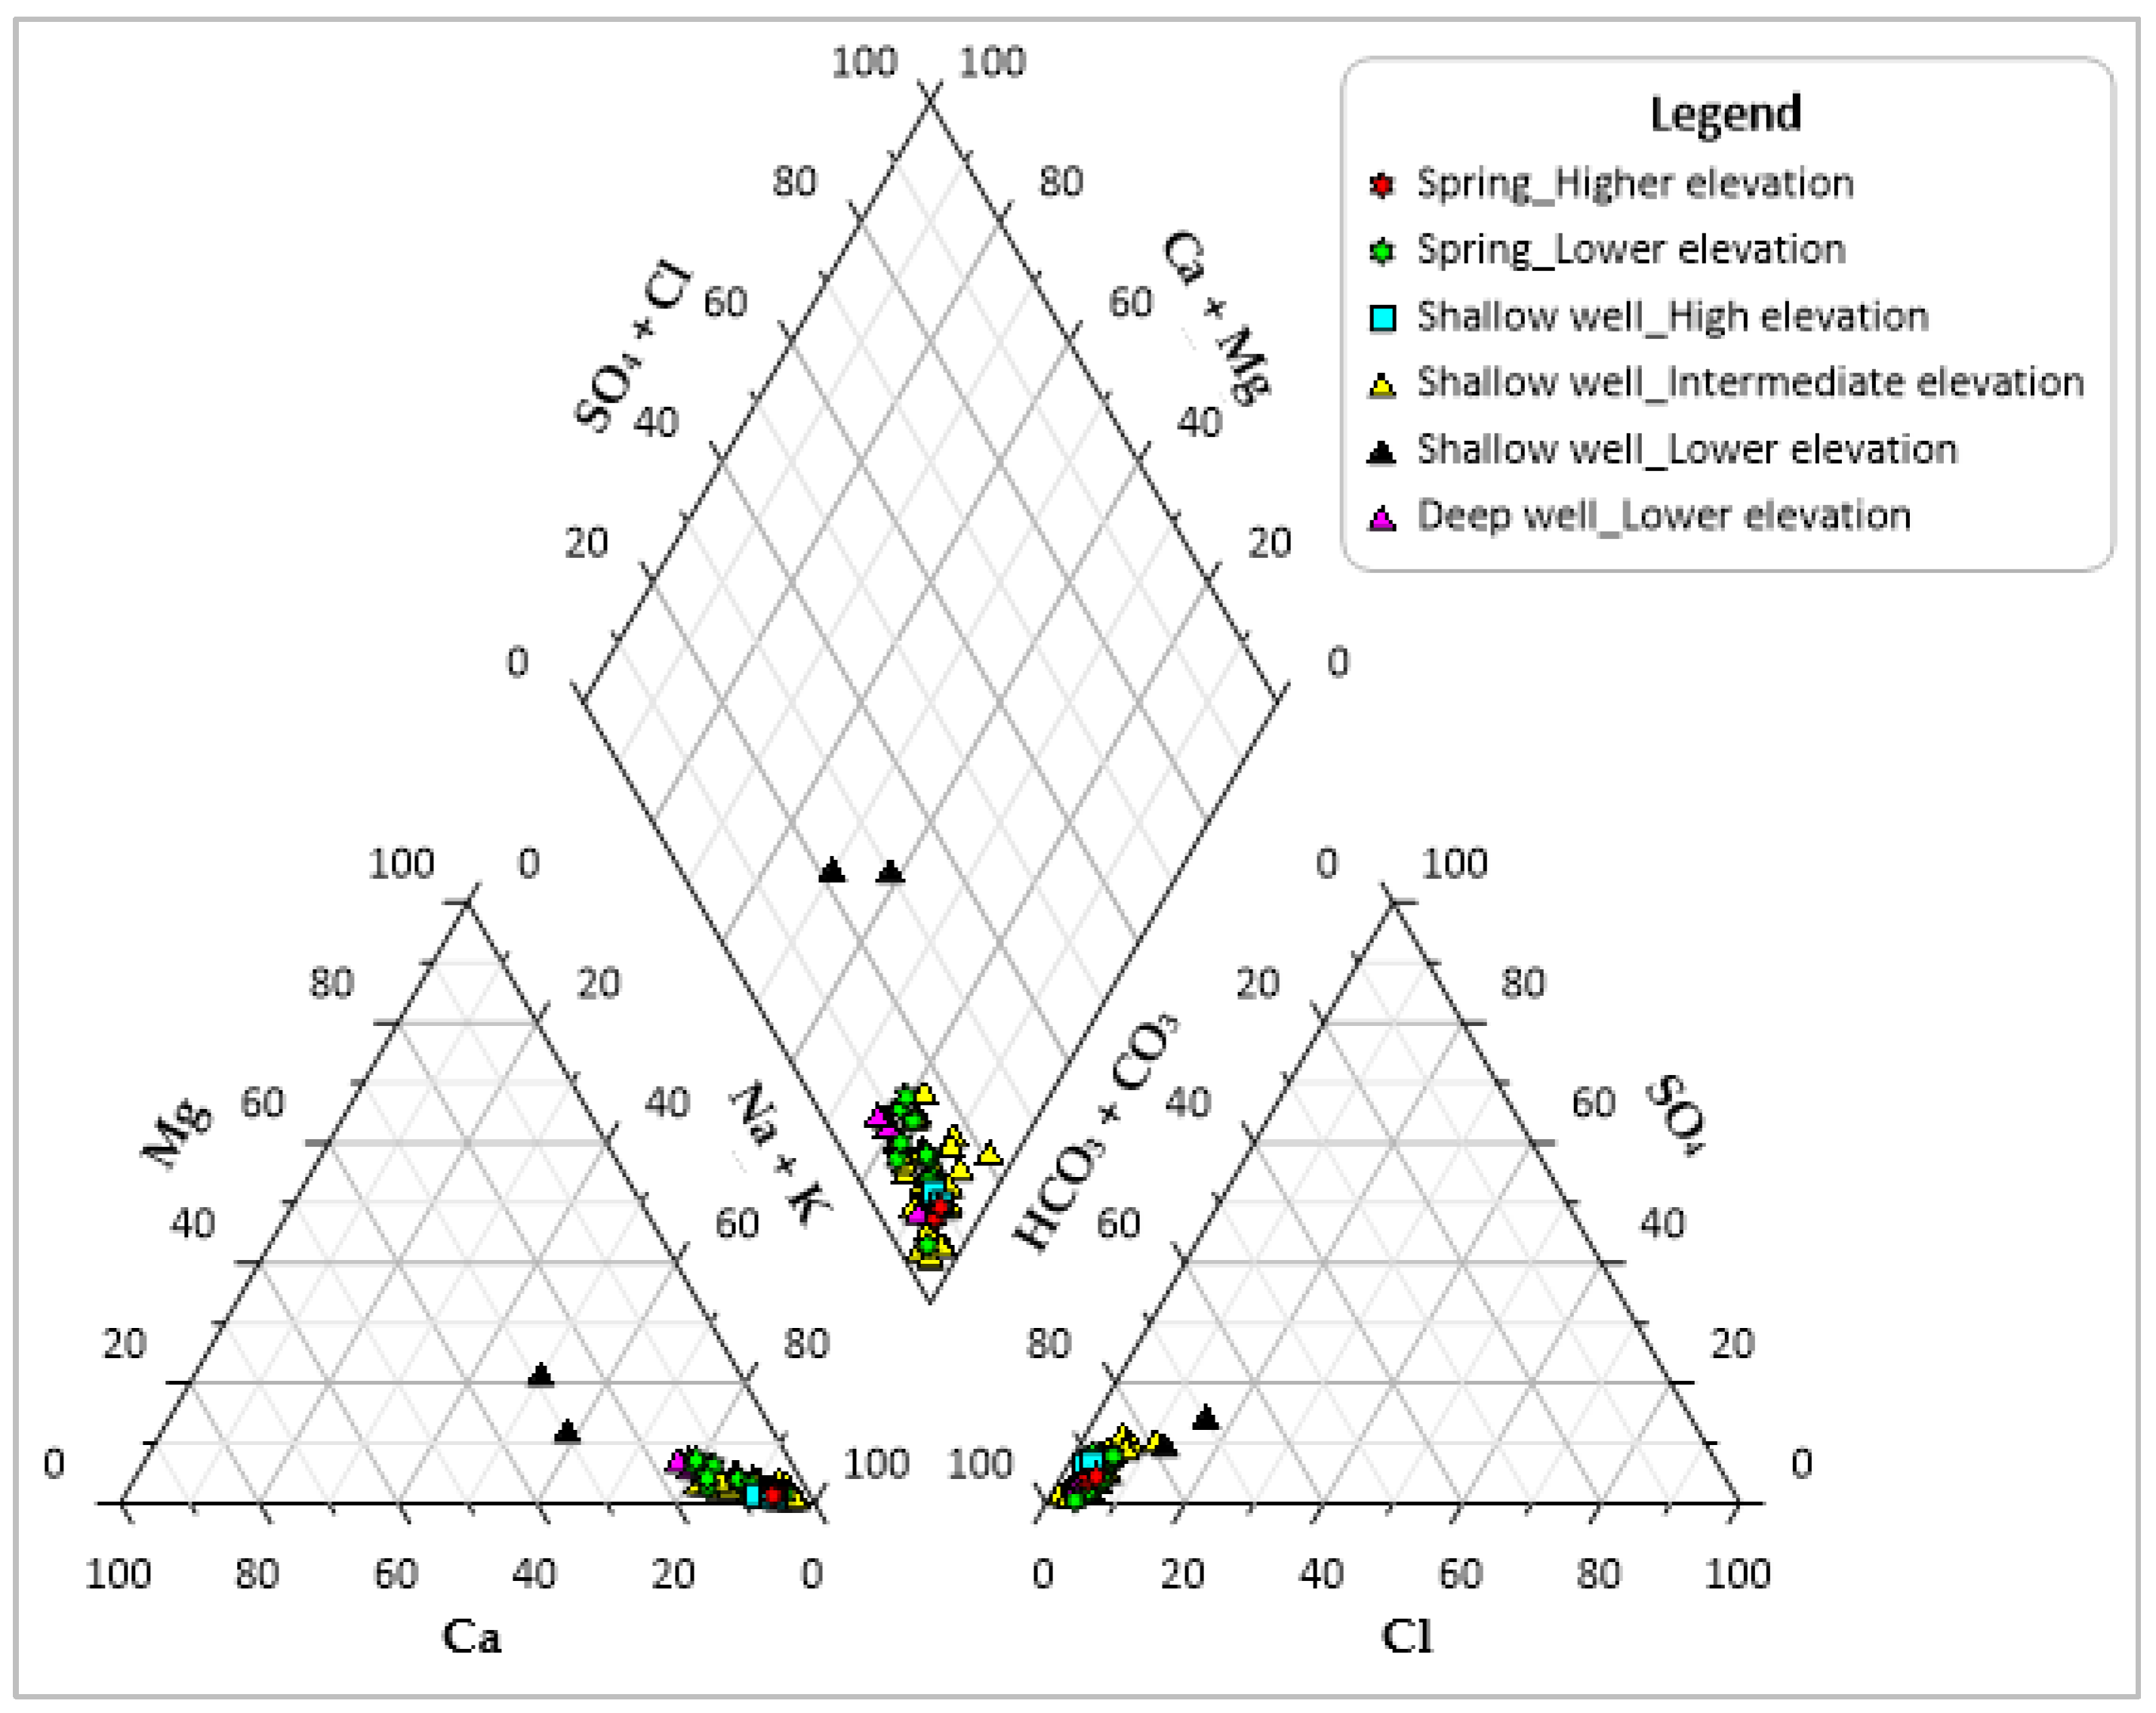
3.2.4. Southwestern Flank

The concentration of Na+ in groundwater ranges from 75.8 mg/L (spring water) to 425 mg/L (shallow well water), whereas the concentration of HCO3 + CO32− ranges from 209 mg/L HCO3 (spring water) to 1114 mg/L HCO3 (shallow well water). The concentration of F ranges from 2.0 to 122 mg/L (both from shallow well waters). In all 71 groundwater samples from this flank, the average concentrations of Na+, K+, Ca2+, and Mg2+ in mg/L are 221, 52.7, 19.4, and 4.4 respectively, indicating that the Na-K-bearing minerals are dominant in releasing cations in the groundwater. Table 7 shows that on average, water samples from springs show a progressive increase of all ions except F (which decreases) from upstream to downstream, whereas water samples from shallow wells show a progressive increase of all ions from elevation of 1631 to 1548 m; the two shallowest wells (average well depth: 6 m) at lower elevations (average: 1379 m) show decreases in Na+, K+, HCO3 + CO32−, and F but increases in Ca2+, Mg2+, SO42−, Cl, and NO3, this is attributed to the local flow system in the area (see Section 3.1). In addition, deep wells at the downstream show lower concentrations for in all ions except Ca2+ and Mg2+ (which remain constant) compared to shallow wells at intermediate elevations (average: 1548 m); these are low mineralised deep circulating waters that have undergone deep infiltration in the recharge area at higher elevations through fractures and faults (see Section 3.1). Table 8 shows water samples containing unusually high concentration of NO3. Two shallow wells W36 and W69 at intermediate elevations (1561 m and 1513 m, respectively) show unusually high concentrations of NO3 (129 mg/L and 258 mg/L, respectively), which largely exceed the average concentration of this anion (37.3 mg/L) at intermediate elevations (average: 1548 m), as indicated in Table 7. In addition, two shallow wells W100 and W101 at lower elevations (1385 m and 1373 m respectively) show unusually high concentrations of NO3 (134 mg/L and 167 mg/L respectively) despite the fact that shorter water residence times are attributed to these wells. The unusually high NO3 values in these four wells are accompanied by high SO42− and Cl values, which all together are indicative of local anthropogenic pollution [29], especially from domestic sewage. Figure 12 shows the projection of the different water samples from this flank in the Piper diagram.
In all the analysed water samples (n = 181) for this study, 39% (n = 71) of the samples have Na+ concentrations above the WHO taste-based guideline of 200 mg/L [10] (p. 227); 51 samples are from wells, 24 are from springs and all of the six surface waters, whereas 7% (n = 13) of samples have SO42 concentrations above the WHO taste-based guideline of 250 mg/L [10] (p. 227); eight samples are from springs from the discharge area, two are from the hydrothermal springs, and three are from surface waters (one lake, one stream, one water pond). In addition, 2% (n = 3) of samples have Cl concentrations above the WHO taste-based guideline of 250 mg/L [10] (p. 223); two samples are from lakes and one is from a stream, whereas 10% (n = 19) of samples have NO3 concentrations above the WHO health-based guideline of 50 mg/L [10] (p. 196); 14 samples are from wells and five are from springs from the discharge areas. In 175 groundwater samples, 91% (n =160) of the samples have F concentrations higher than the WHO limit (1.5 mg/L) recommended for drinking water [10] (p. 42). The 9% (n = 15) of the samples with F concentrations lower than the WHO limit are mainly from springs (n = 13) from the recharge areas on the eastern and northwestern flanks of Mount Meru inside the Arusha National Park. Based on the Tanzanian limit (4.0 mg/L) [37] (p. 26), 79% (n = 138) of the samples are above the limit. All of the six surface waters have F concentrations higher than both WHO and Tanzanian limits. Table 9 summarises the overview of the usable groundwater sources from the sampled inventoried groundwater points in reference to their F concentrations. From the 122 sampled inventoried groundwater points, 93% (n = 114) of the points provide usable groundwater sources for different purposes; drinking, other domestic use, irrigation, and livestock. From the 114 usable groundwater points, 59% (n = 67) of the points are used to provide drinking water to the local community despite their high F values, which exceed both WHO and Tanzanian limits, as most local people do not have any alternative for drinking water. Only 11% (n =13) of the usable points are not used for drinking purpose due to their high F values, which exceed the limits of the two standards. It appears that the only way of accessing safe drinking water in the study area is to tap groundwater from the springs from the recharge areas at higher elevations on the eastern and northwestern flanks of the Mount Meru, inside the Arusha National Park, in which F concentrations are lower due to lower rock weatherability and short water residence times. This has been the current practice on the ground.

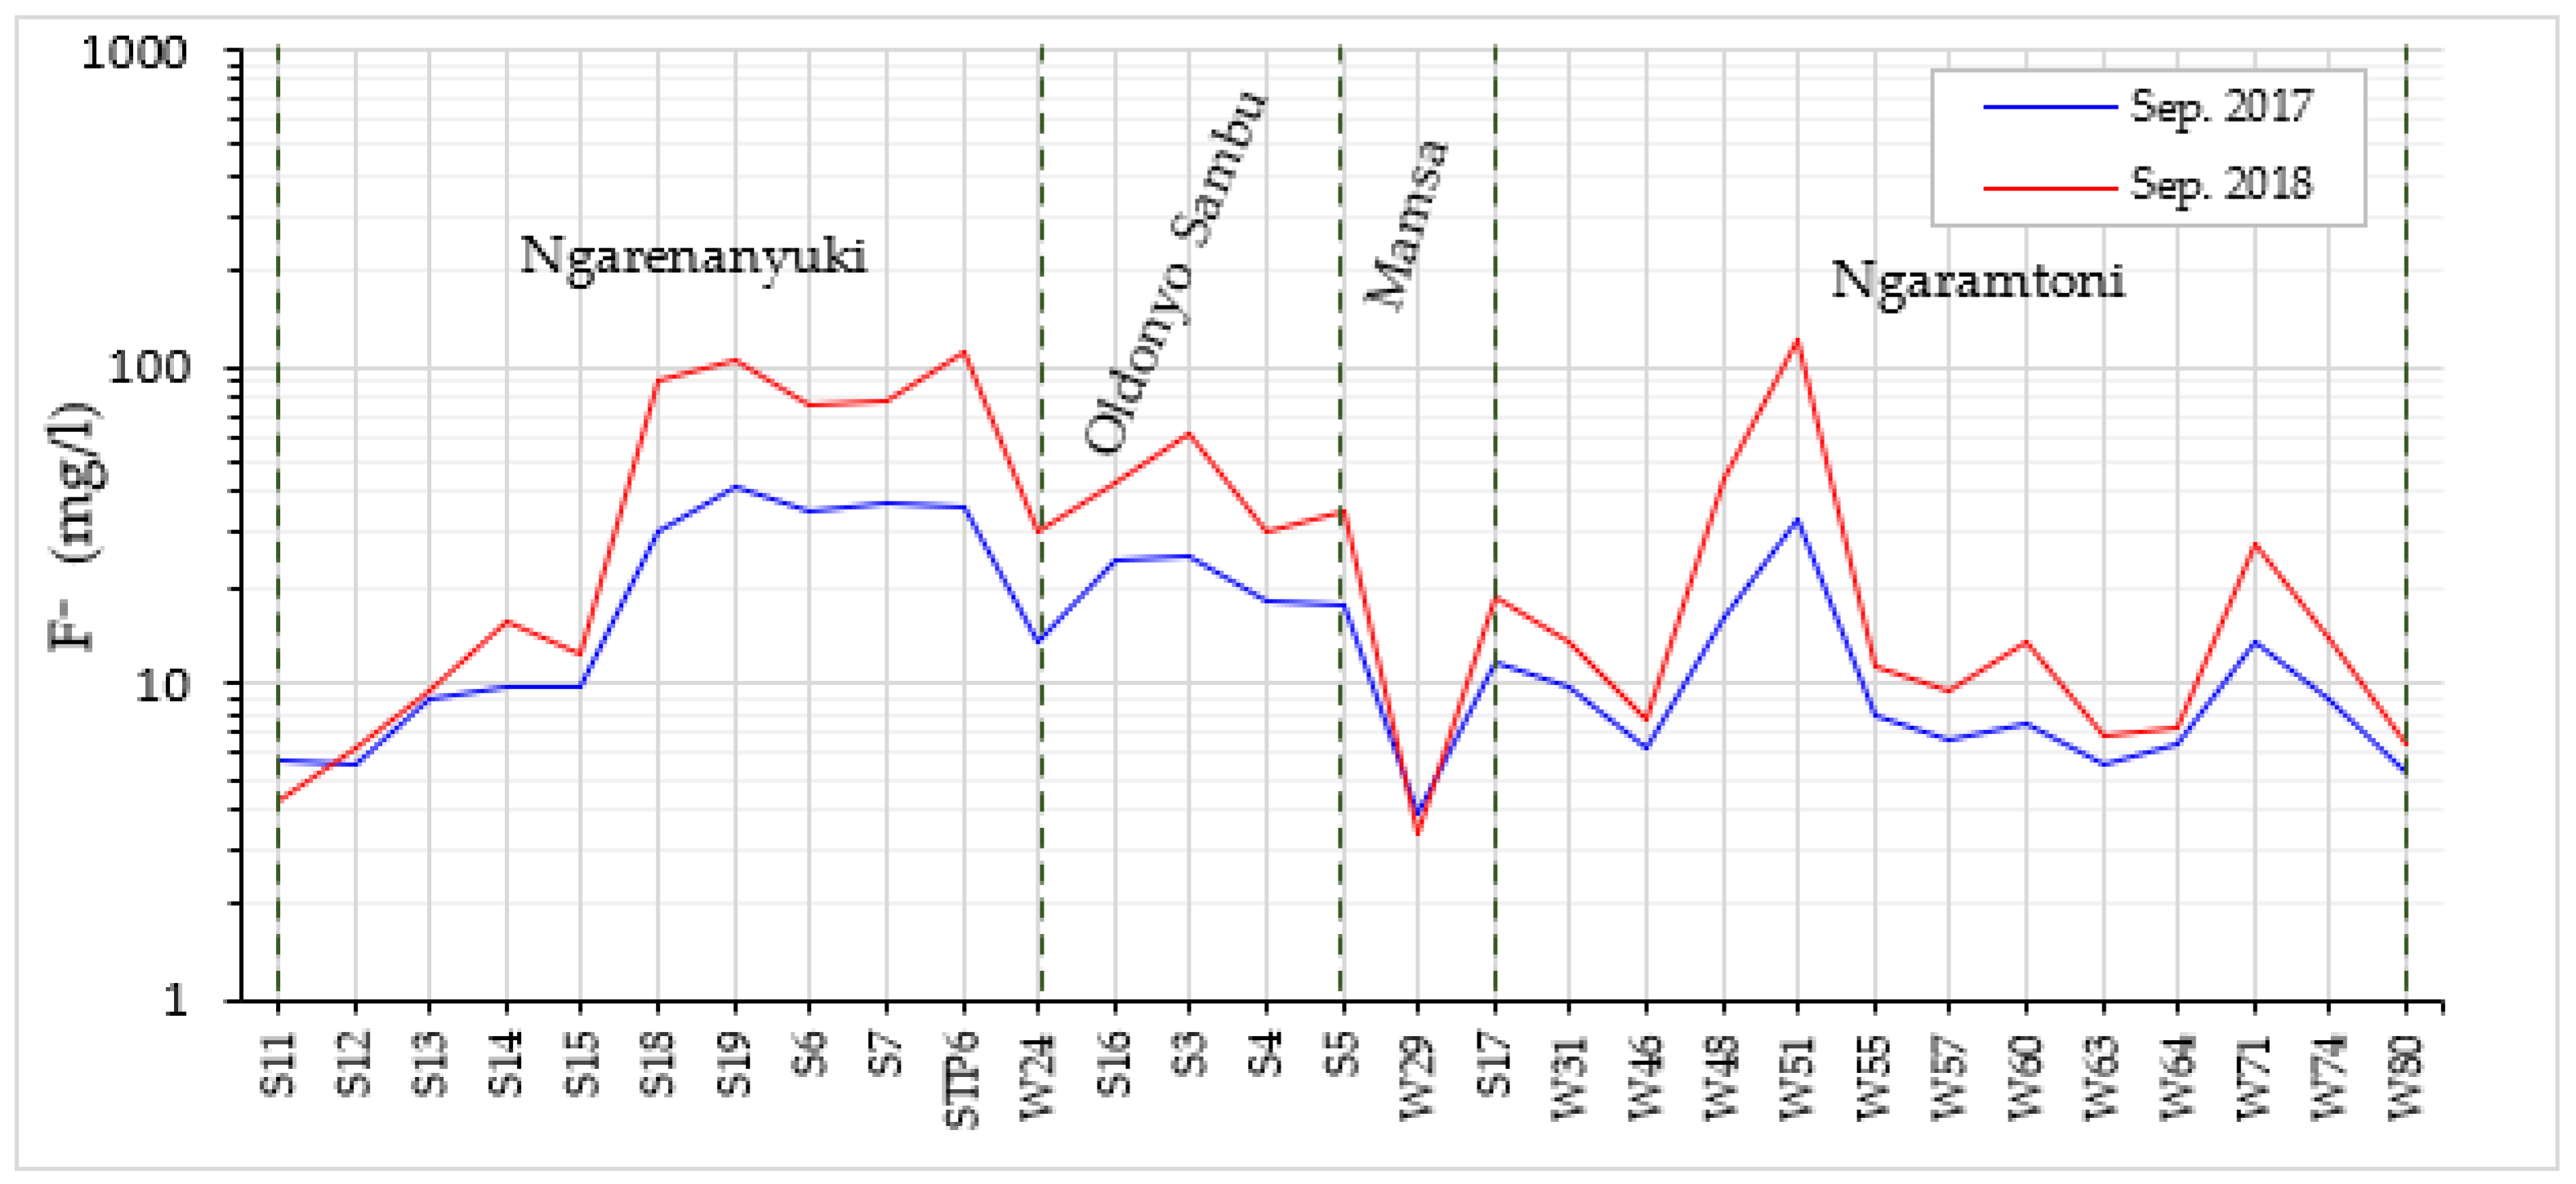
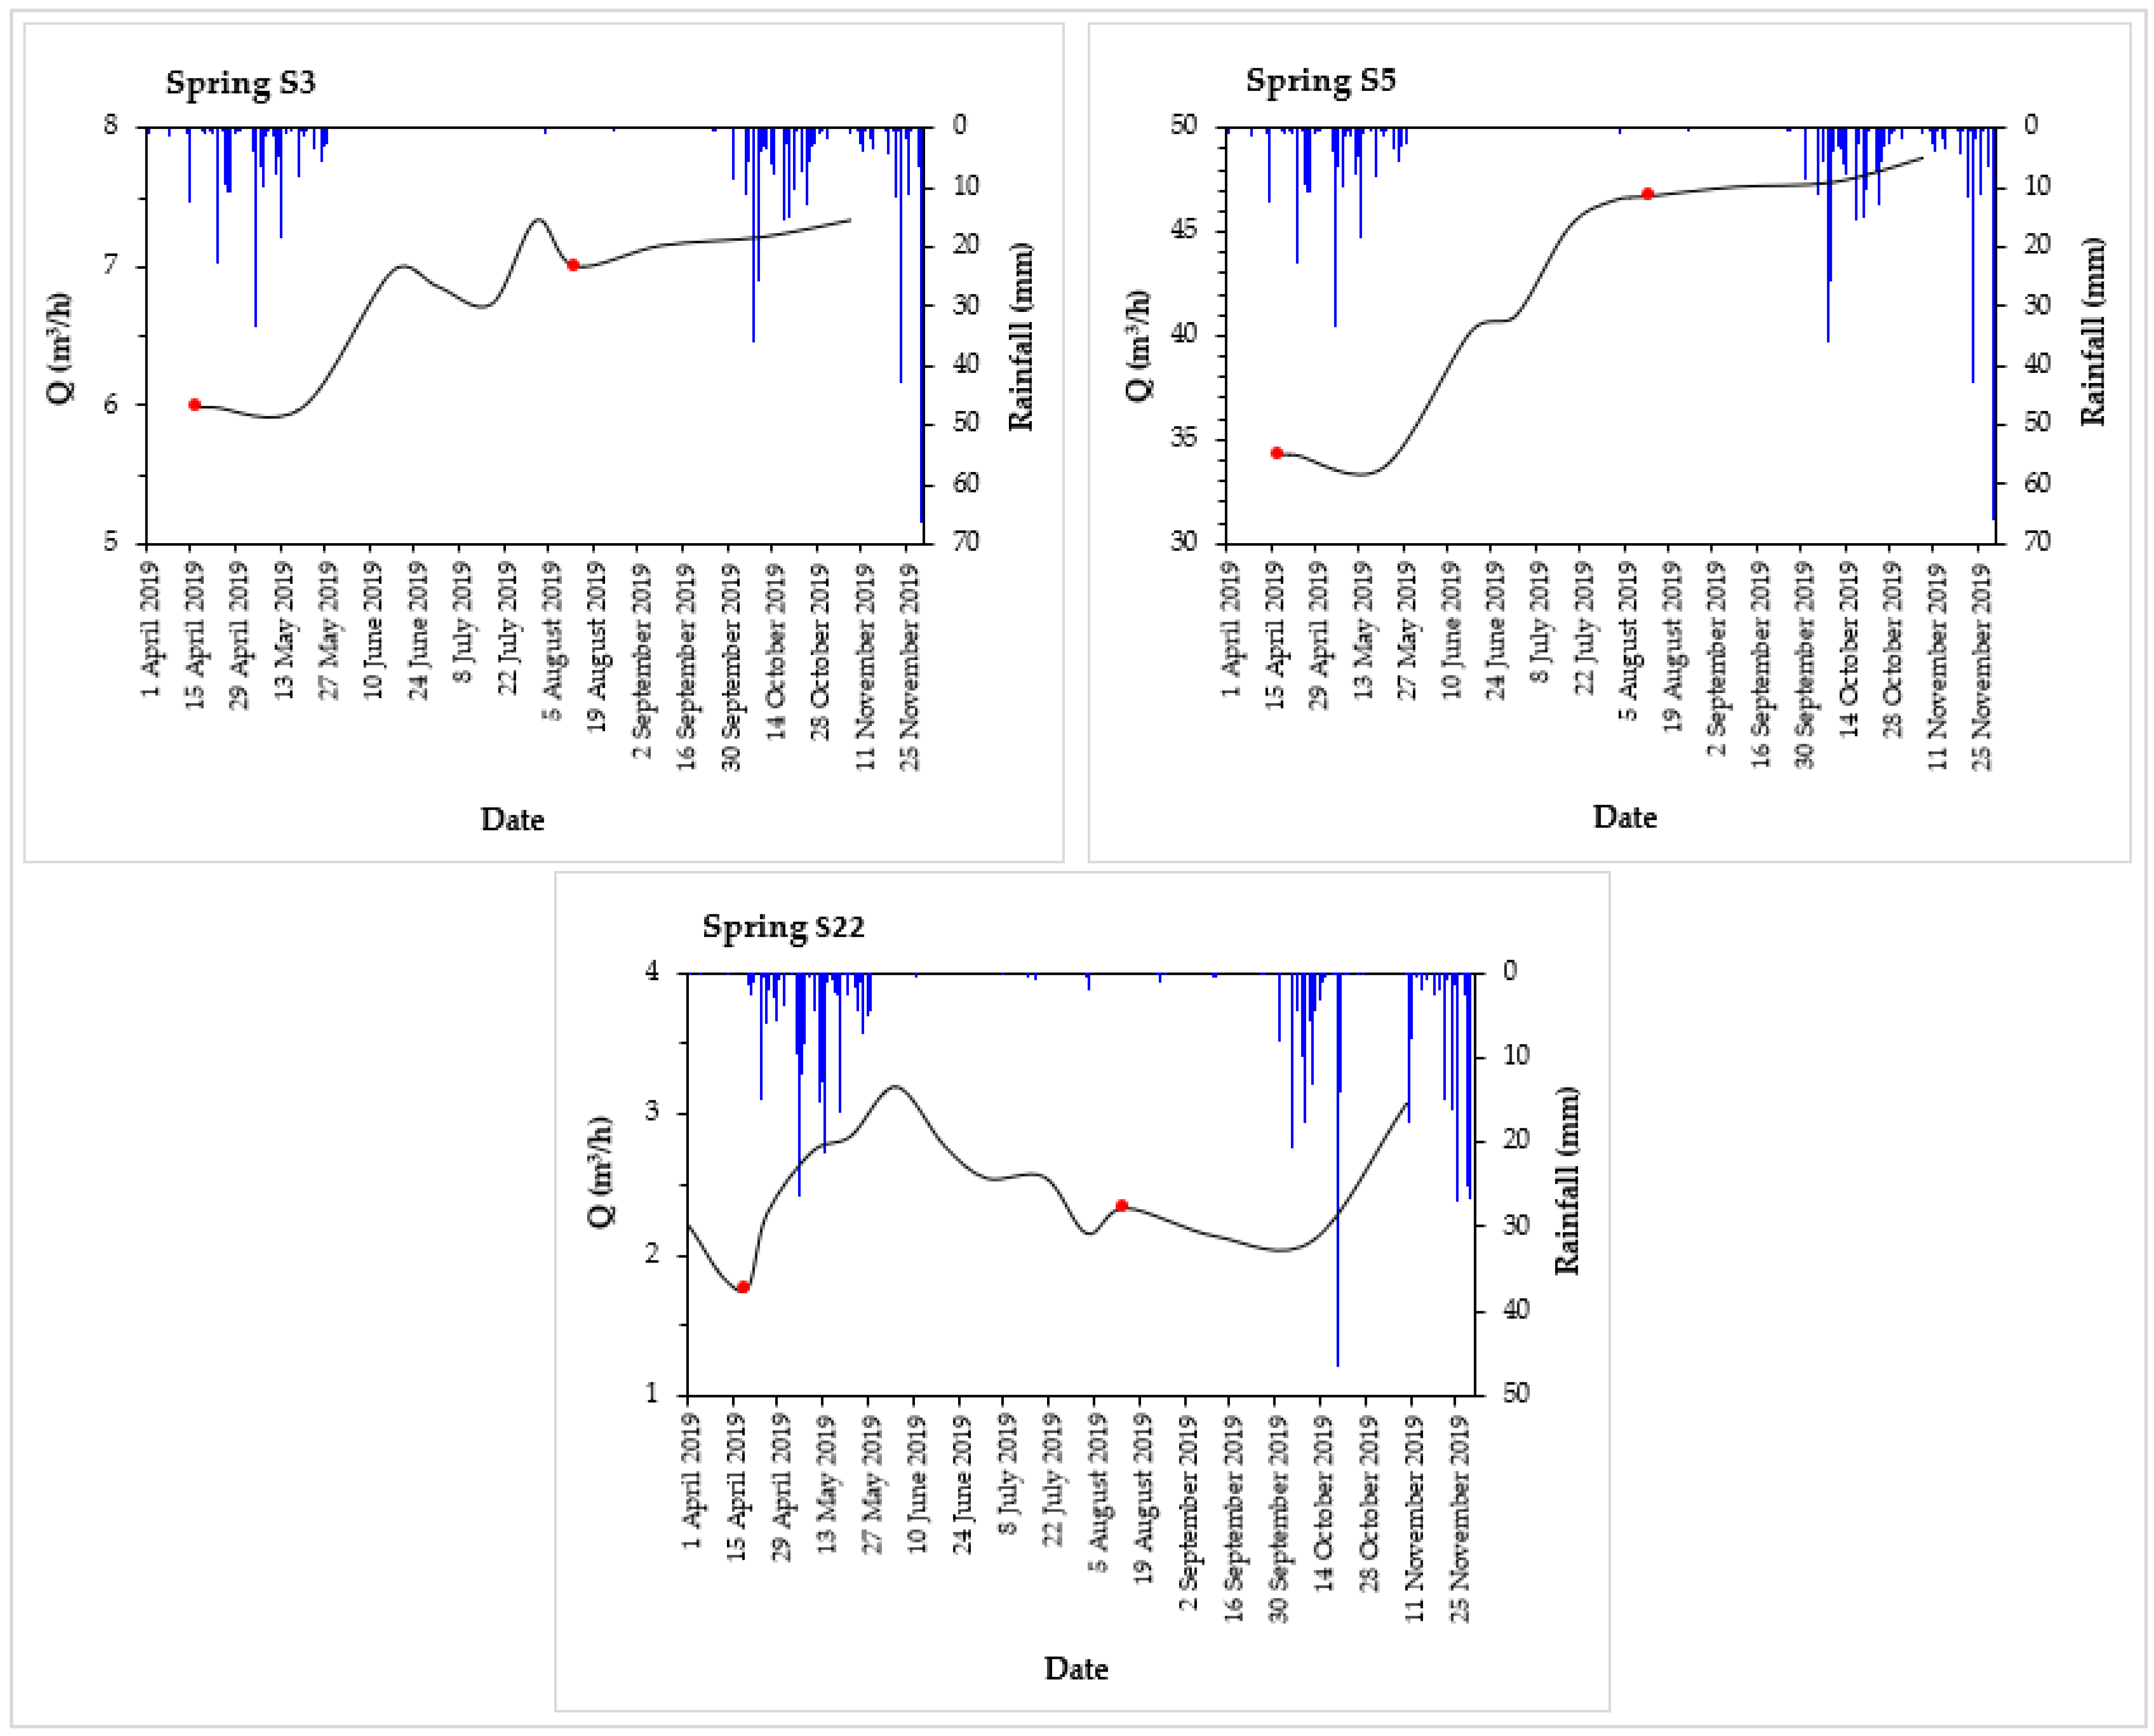
4. Temporal Variability of Fluoride Concentrations and Precipitation/Recharge Values

Figure 13 shows the temporal variability of F concentrations in the groundwater samples taken in September 2017 and September 2018. The time variability in F concentrations (sampled in two different dry seasons) is more pronounced in Ngarenanyuki and Oldonyo Sambu (the driest areas) than in Ngaramtoni and Mamsa. In 29 investigated groundwater points, 93% (n = 27) showed higher F concentrations in September 2018 than in September 2017. The F concentrations in September 2018 range from a minimum of 3.4 mg/L to a maximum of 122.4 mg/L with an average of 35.0 mg/L and a median of 15.8 mg/L, while in September 2017, the values range from a minimum of 3.9 mg/L to a maximum of 41.2 mg/L with an average of 15.9 mg/L and a median of 9.8 mg/L. The Mann–Whitney U test showed that at the significance level (α) of 0.05, the F concentrations are not statistically significantly different. This is probably due to a small sample size (n = 29), the chosen level of significance, and the variability in the samples. Since this small sample size fails to detect the difference at α = 0.05, therefore, the significance level for this test was increased to 0.1. At the significance level of 0.1, the F concentrations in September 2018 (mean rank = 33.64) are statistically significantly higher than in September 2017 (mean rank = 25.36) (U = 540.500, p = 0.062). The pronounced elevated F concentrations in Ngarenanyuki and Oldonyo Sambu can be attributed to low groundwater recharge as the year 2018 was drier (annual rainfall: 680 mm) than 2017 (annual rainfall: 797 mm) as recorded at ASA Farm station in Ngaramtoni. Table 10 shows that the spring discharges (Q) during water sampling in April 2019 (at the end of an exceptionally dry rainy season) were slightly lower than in August 2019 (dry season), while their F values were slightly higher; this indicates that the low spring discharge resulting from slow groundwater flow favors long water–rock interactions and hence high mineralisation of the groundwater (high EC values) with high F concentrations.
Figure 14 shows that the spring discharges at Oldonyo Sambu (S3 and S5) start to rise after approximately a month time lag (mid-May) after the start of heavy rains at mid-April and continue to rise through the dry season until the next rainy season, indicating that the recharge area is situated at relatively large distance. The spring discharge at Ngaramtoni (S22) starts to rise immediately after the start of rainfall and declines immediately after the end of the rainy season, indicating that the spring receives local recharge. Thus, the lower F concentration for S22, both during the dry and the rainy season, is due to shorter water–rock interactions, as is clearly demonstrated by S22’s much faster response to rainfall, compared to S3 and S5. However, the high EC values of S22 compared to S3 and S5 are attributed to the influence of the mantling ash deposits. The S22 is located in the pyroclastics with subordinate nephelinitic and phonolitic lavas covered with mantling ash. Here, the area is surrounded by mantling ash deposits. Ash deposits are very loose and fine-grained; these characteristics make them highly weatherable and readily dissolve in water. The S3 and S5 are located in the Lemurge DAD, and their recharge area is located in pyroclastics with subordinate nephelinitic and phonolitic lavas. There are no ash deposits in these areas. Therefore, the lower EC values of S3 and S5 compared to S22 are attributed to the slow weathering of lavas. The lavas deposits are more compact and less weatherable as compared to the DADs and mantling ash deposits.

5. Conclusions and Recommendations

The groundwater chemistry in the study area shows that the main groundwater type in the study area is NaHCO3 alkaline groundwater with an average pH = 7.8. The groundwater shows high variability in most of the physicochemical parameters, indicating complex hydrochemical conditions, due to the complexity of groundwater flow lines with different residence times, and passing through different geological formations of variable weatherability. Mineralisation generally increases with increasing residence times. In general, the higher springs show lower concentrations of the different hydrogeochemical parameters compared to lower springs, followed by the deep wells and lastly the shallow wells, indicating different groundwater flow systems. The two hydrothermal springs near the ash cone are highly mineralised compared to the surrounding springs; this indicates that they are originating from a deep source, suggesting the influence of volcanic emissions at depth.
Most groundwater sources analysed in this study are not suitable for human consumption due to their high F concentrations exceeding the WHO recommended limit for drinking water (1.5 mg/L). This represents a challenge, as most people do not have any alternative for drinking water. The range of F concentrations in springs, deep wells, and shallow wells in mg/L are 0.15–301, 3.8–7.8, and 1.0–134, respectively. One of the hydrothermal springs shows the highest F value of 301 mg/L. The temporal variability in F concentrations between different seasons is due to the impact of local groundwater recharge.
As a result of the superior quality of the low-fluoride spring water from the high-altitude recharge areas on the eastern and northwestern flanks of Mount Meru inside Arusha National Park, the current practice is to extract their water for drinking purposes and pipe it to taps for the rural communities in the lower parts of the flanks. We recommend that a detailed ecohydrological study should be carried out to ensure the sustainability of this water extraction practice. Since the low-fluoride springs are in the upstream within the Arusha National Park, their extraction possibly affects the ecology of wildlife in the downstream inside the national park. Therefore, a long-term spring discharge monitoring together with biodiversity monitoring will help to establish a sustainable water management plan for these springs. Another strategy for obtaining safe drinking water could be to use a large-scale filtering system to remove F from the groundwater.

Author Contributions

Conceptualisation, G.B., C.S., M.K. (Matthieu Kervyn) and K.W.; Data curation, G.B.; Formal analysis, G.B.; Funding acquisition, C.S. and M.K. (Matthieu Kervyn); Investigation, G.B., J.V.R., C.S., I.T., K.F. and K.W.; Methodology, G.B., C.S. and K.W.; Project administration, C.S. and M.K. (Matthieu Kervyn); Resources, G.B., C.S., I.T., K.F., M.K. (Matthieu Kervyn) and K.W.; Software, G.B.; Supervision, C.S., M.K. (Matthieu Kervyn) and K.W.; Validation, G.B. and K.W.; Visualisation, G.B. and K.W.; Writing—original draft, G.B.; Writing—review and editing, G.B., C.S., M.K. (Mary Kisaka), I.T., K.F., M.K. (Matthieu Kervyn) and K.W. All authors have read and agreed to the published version of the manuscript.

Funding

This research was funded by the Flemish Interuniversity Council-University Development Cooperation (VLIR-UOS) in the framework of project TZ2017TEA450A105 ‘Optimizing the valorization of water and rock resources for improved livelihoods in the Arusha volcanic region’.

Institutional Review Board Statement

Not applicable.

Informed Consent Statement

Not applicable.

Data Availability Statement

The data presented in this study are available on request from the corresponding author.

Acknowledgments

The authors thank the Tanzania Commission for Science and Technology (COSTECH) and Tanzania National Parks Authority (TANAPA) for providing research permits. In addition, the authors thank Laura Segers and Stefanie Rombaut for their assistance during fieldworks. Thanks to Martine Leermakers and Natacha Brion (AMGC, Vrije Universiteit Brussel) for their help with chemical analysis of some water samples. Ines Tomašek acknowledges the support received from the VUB Strategic Research Program (SRP) and the Agence Nationale de la Recherche of the French government through the program “Investissements d’Avenir” (16-IDEX-0001 CAP 20–25). Karen Fontijn acknowledges support from F.R.S.-FNRS MIS grant F.4515.20. The findings and conclusions in this paper are those of the authors and do not necessarily represent the official position of VLIR-UOS.

Conflicts of Interest

The authors declare no conflict of interest.

References

  1. Pavelic, P.; Giordano, M.; Bernard, N. Groundwater Availability and Use in Sub-Saharan Africa: A Review of 15 Countries; International Water Management Institute: Colombo, Sri Lanka, 2012. [Google Scholar] [CrossRef] [Green Version]
  2. Mato, R.R.A.M. Groundwater Pollution in urban Dar es Salaam, Tanzania: Assessing Vulnerability and Protection Priorities. Ph.D. Thesis, Eindhoven University of Technology, Eindhoven, The Netherlands, 19 June 2002. [Google Scholar] [CrossRef]
  3. McKenzie, M.; Mark, B.G.; Thompson, L.G.; Schotterer, U.; Lin, P.N. A hydrogeochemical survey of Kilimanjaro (Tanzania): Implications for water sources and ages. Hydrogeol. J. 2010, 18, 985–995. [Google Scholar] [CrossRef]
  4. Ghiglieri, G.; Balia, R.; Oggiano, G.; Pittalis, D. Prospecting for safe (low fluoride) groundwater in the Eastern African Rift: The Arumeru District (Northern Tanzania). Hydrol. Earth Syst. Sci. 2010, 14, 1081–1091. [Google Scholar] [CrossRef] [Green Version]
  5. Ghiglieri, G.; Pittalis, D.; Cerri, G.; Oggiano, G. Hydrogeology and hydrogeochemistry of an alkaline volcanic area: The NE Mt. Meru slope (East African Rift—Northern Tanzania). Hydrol. Earth Syst. Sci. 2012, 16, 529–541. [Google Scholar] [CrossRef] [Green Version]
  6. Chacha, N.; Njau, K.N.; Lugomela, G.V.; Muzuka, A.N.N. Hydrogeochemical characteristics and spatial distribution of groundwater quality in Arusha well fields, Northern Tanzania. Appl. Water Sci. 2018, 8, 118. [Google Scholar] [CrossRef] [Green Version]
  7. Makoba, E.; Muzuka, A.N.N. Water quality and hydrogeochemical characteristics of groundwater around Mt. Meru, Northern Tanzania. Appl. Water Sci. 2019, 9, 120. [Google Scholar] [CrossRef] [Green Version]
  8. Mtoni, Y.; Mjemah, I.C.; Bakundukize, C.; Van Camp, M.; Martens, K.; Walraevens, K. Saltwater intrusion and nitrate pollution in the coastal aquifer of Dar es Salaam, Tanzania. Environ. Earth Sci. 2013, 70, 1091–1111. [Google Scholar] [CrossRef]
  9. Malago, J.; Makoba, E.; Muzuka, A.N.N. Fluoride levels in surface and groundwater in Africa: A review. Am. J. Water Sci. Eng. 2017, 3, 1–17. [Google Scholar] [CrossRef] [Green Version]
  10. World Health Organization (WHO). Guidelines for Drinking-Water Quality: Fourth Edition Incorporating the First Addendum; World Health Organization: Geneva, Switzerland, 2017; Available online: https://apps.who.int/iris/bitstream/handle/10665/254637/9789241549950-eng.pdf?sequence=1 (accessed on 12 February 2020).
  11. Nanyaro, J.T.; Aswathanarayana, U.; Mungure, J.S.; Lahermo, P.W. A geochemical model for the abnormal fluoride concentrations in waters in parts of northern Tanzania. J. Afr. Earth Sci. 1984, 2, 129–140. [Google Scholar] [CrossRef]
  12. Rango, T.; Bianchini, G.; Beccaluva, L.; Tassinari, R. Geochemistry and water quality assessment of central Main Ethiopian Rift natural waters with emphasis on source and occurrence of fluoride and arsenic. J. Afr. Earth Sci. 2010, 57, 479–491. [Google Scholar] [CrossRef]
  13. Haji, M.; Wang, D.; Li, L.; Qin, D.; Guo, Y. Geochemical evolution of fluoride and implication for F enrichment in groundwater: Example from the Bilate River Basin of Southern Main Ethiopian Rift. Water 2018, 10, 1799. [Google Scholar] [CrossRef] [Green Version]
  14. Gaciri, S.; Davies, T. The occurrence and geochemistry of fluoride in some natural waters of Kenya. J. Hydrol. 1993, 143, 395–412. [Google Scholar] [CrossRef]
  15. Coetsiers, M.; Kilonzo, F.; Walraevens, K. Hydrochemistry and source of high fluoride in groundwater of the Nairobi area, Kenya / Hydrochimie et origine des fortes concentrations en fluorure dans l’eau souterraine de la région de Nairobi, au Kenya. Hydrol. Sci. J. 2008, 53, 1230–1240. [Google Scholar] [CrossRef]
  16. Gevera, P.; Mouri, H. Natural occurrence of potentially harmful fluoride contamination in groundwater: An example from Nakuru County, the Kenyan Rift Valley. Environ. Earth Sci. 2018, 77, 365. [Google Scholar] [CrossRef]
  17. Dibal, H.U.; Schoeneich, K.; Garba, I.; Lar, U.A.; Bala, E.A. Occurrence of fluoride in the drinking waters of Langtang area, north central Nigeria. Health 2012, 4, 1116–1126. [Google Scholar] [CrossRef] [Green Version]
  18. Kilham, P.; Hecky, R.E. Fluoride: Geochemical and ecological significance in East African waters and sediments. Limnol. Oceanogr. 1973, 18, 932–956. [Google Scholar] [CrossRef]
  19. Kitalika, A.J.; Machunda, R.L.; Komakech, H.C.; Njau, K.N. Fluoride variations in rivers on the slopes of Mount Meru in Tanzania. J. Chem. 2018, 2018, 7140902. [Google Scholar] [CrossRef] [Green Version]
  20. Delcamp, A.; Kervyn, M.; Benbakkar, M.; Kwelwa, S.; Peter, D. Large volcanic landslide and debris avalanche deposit at Meru, Tanzania. Landslides 2017, 14, 833–847. [Google Scholar] [CrossRef]
  21. NASA/METI/AIST/Japan Spacesystems, and U.S./Japan ASTER Science Team, 2011. ASTER Global Digital Elevation Model Version 2. NASA EOSDIS Land Processes DAAC. Available online: https://doi.org/10.5067/ASTER/ASTGTM.002 (accessed on 10 December 2017).
  22. Tanzania National Bureau of Statistics. 2012 Population and Housing Census: Population Distribution by Administrative Areas; Tanzania National Bureau of Statistics: Dar es Salaam, Tanzania, 2013; Available online: https://www.nbs.go.tz/nbs/takwimu/census2012/Census_General_Report.zip (accessed on 26 November 2020).
  23. Wilkinson, P.; Downie, C.; Cattermole, P.J.; Mitchell, J.G. Arusha, Geological Survey of Tanzania, Quarter Degree Sheet 55. 1983. Available online: https://library.wur.nl/WebQuery/file/isric/fulltext/isricu_i33425_001.pdf (accessed on 15 June 2017).
  24. Scoon, R.N. Arusha national park (Mount Meru). In Geology of National Parks of Central/Southern Kenya and Northern Tanzania; Springer: Cham, Switzerland, 2018; pp. 141–154. [Google Scholar] [CrossRef]
  25. Central Intelligence Agency (CIA). The World Factbook Book. Africa: Tanzania. Available online: https://www.cia.gov/the-world-factbook/countries/tanzania/locator-map (accessed on 15 June 2018).
  26. Wikipedia. Arusha Region. Available online: https://en.wikipedia.org/wiki/Arusha_Region (accessed on 15 June 2018).
  27. Kisaka, M.; Fontijn, K.; Shemsanga, C.; Tomašek, I.; Gaduputi, S.; Debaille, V.; Delcamp, A.; Kervyn, M. The late Quaternary eruptive history of Meru Volcano, Northern Tanzania. J. Volcanol. Geotherm. Res. 2021, 417, 107314. [Google Scholar] [CrossRef]
  28. American Public Health Association; American Water Works Association; Water Environment Federation. Standard Methods for the Examination of Water and Wastewater, 23rd ed.; American Public Health Association: Washington, DC, USA, 2017. [Google Scholar]
  29. Walraevens, K.; Bakundukize, C.; Mtoni, Y.E.; Van Camp, M. Understanding the hydrogeochemical evolution of groundwater in Precambrian basement aquifers: A case study of Bugesera region in Burundi. J. Geochem. Explor. 2018, 188, 24–42. [Google Scholar] [CrossRef]
  30. Piper, A.M. A graphical interpretation of water analysis. Trans. Am. Geophys. Union. 1944, 25, 914–928. [Google Scholar] [CrossRef]
  31. Tóth, J. A theoretical analysis of groundwater flow in small drainage basins. J. Geophys. Res. 1963, 68, 4795–4812. [Google Scholar] [CrossRef]
  32. Tóth, J. Groundwater as a geologic agent: An overview of the causes, processes, and manifestations. Hydrogeol. J. 1999, 7, 1–14. [Google Scholar] [CrossRef]
  33. Sawyer, G.M.; Carn, S.A.; Tsanev, V.I.; Oppenheimer, C.; Burton, M. Investigation into magma degassing at Nyiragongo volcano, Democratic Republic of the Congo. Geochem. Geophys. Geosyst. 2008, 9, Q02017. [Google Scholar] [CrossRef] [Green Version]
  34. Jasim, A.; Hemmings, B.; Mayer, K.; Scheu, B. Groundwater flow and volcanic unrest. In Volcanic Unrest. Advances in Volcanology; Gottsmann, J., Neuberg, J., Scheu, B., Eds.; Springer: Cham, Switzerland, 2018; pp. 83–99. [Google Scholar] [CrossRef] [Green Version]
  35. Fischer, T.P.; Arellano, S.; Carn, S.; Aiuppa, A.; Galle, B.; Allard, P.; Lopez, T.; Shinohara, H.; Kelly, P.; Werner, C.; et al. The emissions of CO2 and other volatiles from the world’s subaerial volcanoes. Sci. Rep. 2019, 9, 18716. [Google Scholar] [CrossRef] [PubMed] [Green Version]
  36. Bakundukize, C.; Mtoni, Y.E.; Van Camp, M.; Walraevens, K. Occurrences of evaporitic salts in Bugesera region (Burundi) and relation to hydrogeochemical evolution of groundwater. Environ. Earth Sci. 2018, 77, 223. [Google Scholar] [CrossRef]
  37. Tanzania Bureau of Standards (TBS). TZS 789:2008: Drinking (Potable) Water—Specification; Tanzania Bureau of Standards: Dar es Salaam, Tanzania, 2008. [Google Scholar]
Figure 1. (a) Map of Africa showing the location of Tanzania (Source: CIA [25], the image is copyright free), (b) map of Tanzania showing the Arusha region (Source: Wikipedia [26], the image is under an open access Creative Commons CC BY 4.0 license; credit line: Sémhur/Wikimedia Commons/CC-BY-SA-3.0) and (c) map showing the spatial distribution of inventoried water points in the study area (water points with label were sampled for chemical analysis).
Water 13 02159 g001
Figure 2. (a) Average monthly rainfall for the four existing rainfall stations and (b) average monthly rainfall for the four new installed rainfall stations.
Water 13 02159 g002
Figure 3. Geological map of the study area (modified after Wilkinson et al. [23] and Delcamp et al. [20]), indicating different geological formations and spatial distribution of F concentrations of sampled water points. The geological descriptions are based on Wilkinson et al. [23] with updates from Delcamp et al. [20], who re-interpreted the deposits that had originally been mapped as lahar, as debris avalanche deposits (DADs). The deposits that had originally been mapped as tholoids by Wilkinson et al. [23] are now re-interpreted as lava domes in this study.
Water 13 02159 g003
Figure 4. Schoeller diagram showing the concentrations of major ions.
Water 13 02159 g004
Figure 5. Piper diagram showing different water samples taken from springs, shallow wells, deep wells, stream, river, lakes, and water ponds.
Water 13 02159 g005
Figure 6. Spatial distribution of TDS in the study area with a clear increasing trend from the higher elevations towards the lower elevations (Labels: S, S_TP and STP—Spring (except STP9—Stream and STP10—River), W—Well, BH—Borehole, WP—Water pond, L—Lake).
Water 13 02159 g006
Figure 7. Simplified groundwater flow conceptual model for the northeastern flank of Mount Meru, suggesting the influence of the volcanic gases in the groundwater chemistry and also showing the increase of groundwater mineralisation with water residence times.
Water 13 02159 g007
Figure 8. Pictures showing evaporitic salt “magadi” on the soil surface at Ngarenanyuki on the northeastern flank.
Water 13 02159 g008
Figure 9. Piper diagram showing different water samples taken from springs, shallow wells, stream, river, and lakes on the eastern and northeastern flanks.
Water 13 02159 g009
Figure 10. Piper diagram showing different water samples taken from springs, shallow wells, and water pond on the northern flank of Ngurdoto crater.
Water 13 02159 g010
Figure 11. Piper diagrams showing different water samples taken from: (a) springs on the northwestern flank and (b) the spring and shallow wells on the western flank.
Water 13 02159 g011
Figure 12. Piper diagram showing different water samples taken from springs, shallow wells, and deep wells on the southwestern flank.
Water 13 02159 g012
Figure 13. Temporal variability of F concentrations in the groundwater samples taken in September 2017 and September 2018.
Water 13 02159 g013
Figure 14. Spring discharge fluctuation at Oldonyo Sambu (S3 and S5) and at Ngarenanyuki (S22), and rainfall (Mamsa rain station for S3 and S5, and ASA Farm rain station for S22). Red dots indicate discharge values during water sampling.
Water 13 02159 g014
Table 1. Distribution of groundwater samples that were collected from the inventoried groundwater points.
Type of Water PointsNumber of Inventoried PointsNumber of Sampled Points% of Sampled PointsNumber of SamplesNumber of Samples per Water PointCharacteristic of Sampled Wells/Boreholes
Hand-dug wells1046663863 points were sampled three timesShallow wells
14 points were sampled twice
49 points were sampled once
Springs685268852 points were sampled five times
10 points were sampled three times
5 points were sampled twice
35 points were sampled once
Boreholes334121Samples once Shallow well
3Each point sampled onceDeep wells
Table 2. Summary of descriptive statistics for major and minor physicochemical parameters of water samples (units are in mg/L for the ions, except for Mn2+, NH4+, and NO2 which are in µg/L, the pH is unitless and EC is in µS/cm at 25°C. n: number of samples; SD: standard deviation; CV: coefficient of variation; * as mg/L HCO3).
Water TypepHECNa+K+Ca2+Mg2+Fe2+/Fe3+Mn2+NH4+FClSO42−NO3NO2(HCO3 + CO32−) *PO43SiO2TDS
Eastern flank
Springs (n = 16)Min7.110515.13.51.00.20.030.00.00.11.70.00.00.044.50.0027.2117
Max8.611834255811.90.90.147.01027419685.4113300.7961.11184
Mean7.73398019.65.80.40.062.02.036.16.69.22.31.01370.3238.8336
Median7.723128.413.45.80.40.050.00.01.45.00.42.20.01140.1537.5221
SD.0.432713116.63.60.20.033.03.0894.8231.33.0820.337.6333
CV (%)596163846253521451552477324858202601022099
Hydrothermal springs (n = 2)8.236508991798.41.60.070.00.03011002602.54.012870.0031.43070
8.5459011232163.82.30.046.01695.21484180.90.021700.9636.34214
Stream (n = 1)9.1439011402209.12.20.060.00.05532953771.10.09140.7927.63540
Lakes (n = 3)Min9.5863019282835.71.50.121.00.021719210.45.13.042852.00.37438
Max10.11982051908017.63.80.185.00.010045125177.15198636.52.217495
Mean9.81534037865996.82.70.152.00.07363792096.03278113.51.113541
Median9.91757042407147.32.70.161.00.09884341026.04192852.00.915691
SD.0.3591916782771.01.10.032.00.04501672701.02530672.61.05362
CV (%)339444615422299 6144129167939758840
Far east of the eastern flank (Northern flank of Ngurdoto crater)
Springs (n = 2)7.263210626.214.02.40.028.0752.613.419.810.02.03340.0544.5573
7.691917142.82.40.40.02123810.73.325.723.5784780.6030.8789
Shallow wells (n = 13)Min7.14875817.73.00.40.000.00.01.03.63.40.00.0186.00.0038.4506
Max8.4193244360.128.97.136.430067133.726.368.7101.112927561.171951644
Mean7.878813434.311.52.47.26821618.810.427.322.5188355.90.48112737
Median8.174011730.49.41.80.06600.04.59.121.95.30.0342.50.49147640
SD.0.5381100.014.07.81.811.9962336.75.718.131.64571430.3964.7294
CV (%)64874416872164118150195556614124440815840
Water pond (n = 1)9.24310789268.525.75.70.20194585.962.12545.912617308.191.93237
North-eastern flank
Springs (n = 27)Min6.929258.78.11.30.40.000.00.03.02.34.92.10.01510.0015.6276
Max8.63510101212436.011.20.5040034511313649959.1373116431.682103560
Mean7.8180939358.813.84.10.08376730.044.716915.92808200.4465.61616
Median7.8120522449.412.23.50.063.01112.518.458.311.32.07160.2148.21105
SD.0.5116228633.77.02.40.12929533.246.918114.97654530.5156.21002
CV (%)7647357515814224614211110510794274551178662
Shallow wells (n = 12)Min7.642480.412.42.70.30.020.00.03.63.81.90.00.02200.0024.2412
Max8.5268057980.911.76.430.824808012178.320436.563310801.361602322
Mean8.0103423029.36.31.75.275432824.627.742.88.2605070.2885.9970
Median8.189020526.35.71.11.61592814.721.827.14.34.04850.1865.5869
SD.0.455112117.52.71.69.688772631.119.352.910.21812020.3954.1465
CV (%)453536044991841629312670124124301401386348
River (n = 1)8.8173646487.29.31.20.080.00.014445.11261.12.06450.5520.81544
North-western flank
Springs (n = 25)Min6.715217.07.21.20.20.000.00.00.40.80.20.00.059.00.0034.3185
Max8.3547135296.21.78.0350921627161924382920.53154617
Mean7.54208419.43.00.60.654.05320.74.27.46.42021850.1960.2392
Median7.54418620.72.20.40.061.01.017.84.29.02.52.01960.1243.0400
SD.0.5101306.11.70.51.710182151.74.96.4589550.193696
CV (%)624363157792632613427339669929229976124
Western flank
Spring (n = 1)8.471911123.416.43.10.030.0153.47.714.06.04.03650.1740.1590
Shallow wells (n = 6)Min7.4102216129.725.94.70.000.00.03.421.460.031.20.05220.0043.6952
Max8.5120418753.555.411.52.96901034.027.991.744.3164605670.141711106
Mean7.8115218039.939.76.10.5316603.725.775.136.727435390.0767.31017
Median7.7117318538.139.85.20.061.0803.626.974.434.90.05290.0647.11011
SD.0.465.610.08.813.62.61.1936480.32.611.75.1671820.20.0550.651.0
CV (%)566223443222227807101614245474755
South-western flank
Springs (n = 12)Min7.146475.820.44.20.70.000.00.04.75.53.90.00.02090.0033.0383
Max8.3146431012138.68.60.69131015718.925.353.464.216248730.252001381
Mean7.892216453.818.84.20.13132508.714.920.731.31394850.11105907
Median7.982114651.119.04.00.044.0407.513.420.133.61.04090.1051.7919
SD.0.534570.425.09.72.40.23374534.35.713.522.94672130.0875.8325
CV (%)637434752581712841074938657333544767236
Shallow wells (n = 56)Min7.17158826.55.31.10.000.00.02.06.38.73.10.03470.002.4610
Max8.5232042599.068.024.66.88220130912267.088.7258612411141.662091817
Mean7.8127623953.819.64.40.22267914.818.633.940.56116490.2678.91153
Median7.8128622151.514.33.80.035.0119.416.130.026.84.06300.1346.81141
SD.0.43709017.212.73.60.935423518.610.618.044.313602030.3661.7319
CV (%)629383265824202082971265753109223311407828
Deep wells (n = 3)Min7.560610521.97.91.60.030.00.03.85.77.30.01.03100.5340.4508
Max8.076913333.425.56.90.056.0717.88.821.89.1544570.6551.9742
Mean7.770012027.719.34.80.044.0245.47.516.25.4204000.5846.8653
Median7.672612127.724.56.00.055.02.04.67.919.57.24.04330.5448.1710
SD.0.384.514.05.89.92.80.013.0402.11.67.84.83078.90.065.9127
CV (%)4121221515835881683921488815320111319
Table 3. Average values of pH, EC, and TDS in the water samples from different elevations and different well depths on the northeastern, northwestern, western, and southwestern flank of Mount Meru.
RegionWater SourceNumber of SamplesAverage Elevation (m)Average Well Depth (m)Average pHAverage EC (µS/cm at 25°C)Average TDS (mg/L)
North-eastern flankSprings21705 6.9307286
131430 7.6998916
41402 8.119151819
81332 8.234492984
Shallow wells11551487.7424412
10145288.0930891
11399278.526802322
River11443 8.817361544
North-western flankSprings42567 7.9214242
152084 7.6444410
61838 7.1496446
Western flankSpring12240 8.4719590
Shallow wells61649447.811521017
South-western flankSprings21921 7.9465386
101566 7.810141012
Shallow wells31631167.3833744
511548197.913101188
2137968.21068893
Deep wells314671517.7700653
Table 4. Correlation matrix for all water samples (n = 181). Strong correlations are highlighted in green colour.
Na+K+Ca2+Mg2+HCO3 + CO32−SO42−ClFNO3SiO2TDS
Na+1
K+0.803 **1
Ca2+0.355 **0.464**1
Mg2+0.445 **0.593**0.855 **1
HCO3 + CO32−0.946 **0.831 **0.502 **0.574 **1
SO42−0.782 **0.707 **0.469 **0.594 **0.752 **1
Cl0.827 **0.737 **0.478 **0.551 **0.805 **0.823 **1
F0.611 **0.421 **−0.267 **−0.179 *0.467 **0.335 **0.336 **1
NO30.393 **0.479 **0.545 **0.550 **0.442 **0.463 **0.428 **0.0111
SiO2−0.0870.0160.229 **0.274 **−0.048−0.044−0.016−0.180 *0.269 **1
TDS0.969 **0.870 **0.472 **0.563 **0.964 **0.795 **0.853 **0.518 **0.473 **0.0241
** Correlation is significant at the 0.01 level (2-tailed). * Correlation is significant at the 0.05 level (2-tailed).
Table 5. Average values of major and minor ions in the water samples from different elevations on the northern flank of Ngurdoto crater (* as mg/L HCO3).
RegionWater SourceNumber of SamplesAverage Elevation (m)Average Concentrations (mg/L)
Na+K+Ca2+Mg2+(HCO3 + CO32−) *SO42−ClFNO3NO2
NkoasengaSprings1156010626.214.02.433419.813.42.610.00.002
1148317142.82.40.447825.73.310.723.50.078
Shallow wells715869427.512.42.429522.69.53.511.60.347
3149125150.84.51.250835.610.968.644.30.000
LegurukiShallow wells3135411133.516.23.734629.911.84.626.00.002
Table 6. Average values of major and minor ions in the water samples from different elevations on the northwestern and western flanks (* as mg/L HCO3).
RegionWater SourceNumber of SamplesAverage Elevation (m)Average Concentrations (mg/L)
Na+K+Ca2+Mg2+(HCO3 + CO32−) *SO42−ClFNO3NO2
North-western flank Springs4256732.211.03.30.61110.34.70.80.90.001
15208491.519.62.90.61858.84.124.48.40.328
6183899.124.63.20.52358.74.124.85.20.022
Western flank Spring1224011123.416.43.136514.07.73.46.00.004
Shallow wells6164918039.939.76.153975.125.73.736.72.743
Table 7. Average values of major and minor ions in the water samples from different elevations on the southwestern flank (* as mg/L HCO3).
Water SourceNumber of SamplesAverage Elevation (m)Average Well Depth (m)Average Concentrations (mg/L)
Na+K+Ca2+Mg2+(HCO3 + CO32−) *SO42−ClFNO3NO2
Springs21921 76.422.84.40.72127.56.112.03.00.02
101566 18260.021.74.953923.416.68.137.00.16
Shallow wells316311616030.810.21.443924.59.06.320.80.15
5115481924855.918.54.067234.018.315.837.30.64
21379610936.961.120.836747.340.92.31510.67
Deep wells3146715112027.719.34.840016.27.55.45.40.02
Table 8. Water samples containing an unusually high concentration of NO3 on the southwestern flank.
TownWater Point IDWater SourceElevation (m)Well Depth (m)SO42− (mg/L)Cl (mg/L)NO3 (mg/L)
NgaramtoniW36Shallow well15611959.228.7129
W69Shallow well15131988.767.0258
ArushaW100Shallow well1385937.034.6134
W101Shallow well1373257.647.2167
Table 9. Overview of the usable groundwater sources from the sampled inventoried groundwater points in reference to their F concentrations (F upper limits recommended for drinking water: WHO = 1.5 mg/L; Tanzanian = 4.0 mg/L).
RegionWater SourceNumber of Water PointsRange of F Values (mg/L)Within WHO or Tanzanian StandardDrinking Purpose
Eastern flank, inside the Arusha National ParkSprings100.1–1.5WHO standardYes
31.7–3.9Tanzanian standardYes
215–19Above the standardsYes
Far east of the eastern flank (Northern flank of Ngurdoto crater)Springs12.6Tanzanian standardNo, used for other domestic use and livestock
111Above the standardsYes
Wells21.0–1.3WHO standardYes
41.6–3.5Tanzanian standardYes
44.5–8.2Above the standardsYes
331–134Above the standardsYes
North-eastern flankSprings24.2–4.3Above the standardsYes
14.3Above the standardsNo, used for irrigation and livestock
46–13Above the standardsYes
548–75Above the standardsNo, used for irrigation and livestock
Wells13.6Tanzanian standardNo, used for irrigation
112Above the standardsNo, used for other domestic use and livestock
214–19Above the standardsYes
220–22Above the standardsNo, used for other domestic use and livestock
1121Above the standardsYes
North-western flankSprings30.4–0.8WHO standardYes
11.7Tanzanian standardYes
518–27Above the standardsYes
128Above the standardsNo, used for irrigation
148Above the standardsYes
Western flankSpring13.4Tanzanian standardYes
Wells33.5–4.0Tanzanian standardYes
South-western flankSprings85.1–13.0Above the standardsYes
Wells52.0–3.8Tanzanian standardYes
54.6–6.1Above the standardsYes
16.3Above the standardsNo, used for irrigation
86.3–8.5Above the standardsYes
19.3Above the standardsNo, used for other domestic use and irrigation
159.6–17.0Above the standardsYes
622.4–60.4Above the standardsYes
177.9Above the standardsNo, used for other domestic use and irrigation
Table 10. Spring discharges (Q), F concentrations, and EC for springs S3 and S5 (at Oldonyo Sambu) and S22 (at Ngaramtoni).
Spring IDDateQ (m3/hr)F (mg/L)EC (μS/cm at 25 °C)
S3April 20195.9820.3443
Aug. 20197.1718.6415
S5April 201934.2315.0436
Aug. 201946.6213.7407
S22April 20191.975.5822
Aug. 20192.244.7781
Publisher’s Note: MDPI stays neutral with regard to jurisdictional claims in published maps and institutional affiliations.

