Article

Closing Water Cycles in the Built Environment through Nature-Based Solutions: The Contribution of Vertical Greening Systems and Green Roofs

by
David Pearlmutter
1,†,
Bernhard Pucher
2,†,
Cristina S. C. Calheiros
3,*,
Karin A. Hoffmann
4,
Andreas Aicher
5,
Pedro Pinho
6,
Alessandro Stracqualursi
7,
Alisa Korolova
8,
Alma Pobric
9,
Ana Galvão
10,
Ayça Tokuç
11,
Bilge Bas
12,
Dimitra Theochari
13,
Dragan Milosevic
14,
Emanuela Giancola
15,
Gaetano Bertino
16,
Joana A. C. Castellar
17,18,
Julia Flaszynska
19,
Makbulenur Onur
20,
Mari Carmen Garcia Mateo
21,
Maria Beatrice Andreucci
7,
Maria Milousi
22,
Mariana Fonseca
23,
Sara Di Lonardo
24,
Veronika Gezik
25,
Ulrike Pitha
26 and
Thomas Nehls
4
add Show full author list remove Hide full author list
1
Department of Geography and Environmental Development, Ben-Gurion University of the Negev, Sede Boqer Campus, Beer-Sheva 84990, Israel
2
Institute of Sanitary Engineering and Water Pollution Control, University of Natural Resources and Life Sciences (BOKU), Muthgasse 18, A-1190 Vienna, Austria
3
Interdisciplinary Centre of Marine and Environmental Research (CIIMAR/CIMAR), University of Porto, Novo Edifício do Terminal de Cruzeiros do Porto de Leixões, Avenida General Norton de Matos, S/N, 4450-208 Matosinhos, Portugal
4
Chair of Ecohydrology and Landscape Evaluation, Institute of Ecology, Technische Universität Berlin, Ernst-Reuter-Platz 1, 10587 Berlin, Germany
5
Bauhaus Institute for Infrastructure Solutions, Bauhaus-Universität Weimar, Goethe Platz 7/8, 99423 Weimar, Germany
6
cE3c-Centre for Ecology, Evolution and Environmental Changes FCUL, Edifício C2, Campo Grande, 1749-016 Lisboa, Portugal
7
Department of Planning, Design, Technology of Architecture, Sapienza University of Rome, Via Flaminia, 72, 00196 Rome, Italy
8
Faculty of Architecture, Riga Technical University Kipsalas, Str. 6, LV-1048 Riga, Latvia
9
Department of Geography, Faculty of Science, University of Sarajevo, Add. Zmaja od Bosne 33-35, 71000 Sarajevo, Bosnia and Herzegovina
10
CERIS, Instituto Superior Técnico, Av. Rovisco Pais, 1049-001 Lisbon, Portugal
11
Department of Architecture, Dokuz Eylul University, Campus of Tinaztepe, Buca İzmir 35160, Turkey
12
Department of Civil Engineering, Istanbul Bilgi University, Santralistanbul, Kazim Karabekir Cd. No: 13, Istanbul 34060, Turkey
13
MERA Landschaftsarchitekten mbB, Griegstraße 75, Haus 24b, 22763 Hamburg, Germany
14
Climatology and Hydrology Research Centre, Faculty of Sciences, University of Novi Sad, Trg Dositeja Obradovića 3, 21000 Novi Sad, Serbia
15
Department of Energy, Energy Efficiency in Buildings Unit, CIEMAT, 28040 Madrid, Spain
16
Alchemia-Nova GmbH, Institute for Innovative Phytochemistry & Closed Loop Processes, A-1140 Vienna, Austria
17
Catalan Institute for Water Research (ICRA), Carrer Emili Grahit 101, 17003 Girona, Spain
18
University of Girona, Plaça de Sant Domènec 3, 17004 Girona, Spain
19
Faculty for Architecture and Planning, Technical University of Vienna, Karlsplatz 13, 1040 Vienna, Austria
20
Department of Landscape Architecture, Karadeniz Technical University, Trabzon 61080, Turkey
21
MCG Research & Innovation Sustainability Architecture/Urban Planning, Zarandona, 30004 Murcia, Spain
22
Department of Chemical Engineering, University of Western Macedonia, Koila, 50100 Kozani, Greece
23
Associação CECOLAB, Collaborative Laboratory towards Circular Economy, R. Nossa Senhora da Conceição, 3405-155 Oliveira do Hospital, Portugal
24
Research Institute on Terrestrial Ecosystems-National Research Council (IRET-CNR), Via Madonna del Piano 10, 50019 Sesto Fiorentino, Italy
25
Faculty of Management, Comenius University in Bratislava, Odbojárov 10, P.O. Box 95, 82005 Bratislava 25, Slovakia
26
Department of Civil Engineering and Natural Hazards, Institute of Soil Bioengineering and Landscape Construction, University of Natural Resources and Life Sciences, Peter-Jordan-Strasse 82, A-1190 Vienna, Austria
*
Author to whom correspondence should be addressed.
These authors contributed equally to this work.
Water 2021, 13(16), 2165; https://doi.org/10.3390/w13162165
Submission received: 10 July 2021 / Revised: 27 July 2021 / Accepted: 28 July 2021 / Published: 6 August 2021
(This article belongs to the Special Issue Water and Circular Cities)

Abstract

:
Water in the city is typically exploited in a linear process, in which most of it is polluted, treated, and discharged; during this process, valuable nutrients are lost in the treatment process instead of being cycled back and used in urban agriculture or green space. The purpose of this paper is to advance a new paradigm to close water cycles in cities via the implementation of nature-based solutions units (NBS_u), with a particular focus on building greening elements, such as green roofs (GRs) and vertical greening systems (VGS). The hypothesis is that such “circular systems” can provide substantial ecosystem services and minimize environmental degradation. Our method is twofold: we first examine these systems from a life-cycle point of view, assessing not only the inputs of conventional and alternative materials, but the ongoing input of water that is required for irrigation. Secondly, the evapotranspiration performance of VGS in Copenhagen, Berlin, Lisbon, Rome, Istanbul, and Tel Aviv, cities with different climatic, architectural, and sociocultural contexts have been simulated using a verticalized ET0 approach, assessing rainwater runoff and greywater as irrigation resources. The water cycling performance of VGS in the mentioned cities would be sufficient at recycling 44% (Lisbon) to 100% (Berlin, Istanbul) of all accruing rainwater roof–runoff, if water shortages in dry months are bridged by greywater. Then, 27–53% of the greywater accruing in a building could be managed on its greened surface. In conclusion, we address the gaps in the current knowledge and policies identified in the different stages of analyses, such as the lack of comprehensive life cycle assessment studies that quantify the complete “water footprint” of building greening systems.

Graphical Abstract

1. Introduction

Natural water cycles are under increasing pressure from urban expansion, which is driven by incessant population growth. It is expected that the world’s urban population will grow from 3.4 billion people in 2009 to 6.3 billion in 2050. The demand for water will increase by 55%, which will lead to a rise in water pollution, aggravating problems associated with water scarcity [1], since water availability is compromised by its quality [2].
In fact, of all the fresh water entering the city, only a fraction is actually used for consumption; the remaining becomes polluted, treated, and discharged [3]. Within this linear process, valuable nutrients, such as nitrogen and phosphorus, are lost in the treatment process instead of being captured and cycled back (e.g., for agricultural usage or maintenance of green areas) [4]. Stormwater management is another example of this non-sustainable linear water process, as typically, its main goal is the fast discharge of stormwater to avoid flooding. With changes in climate, however, rainfall patterns can exceed the capacity of the sewer system and cause widespread flooding [5]. Under dry conditions, however, in which water would be needed to irrigate and sustain vegetation to maintain its necessary cooling function, water is once again used linearly, with fresh drinking water exploited, as no other source is stored or provided [6].
In this sense, Nature-Based Solutions units (NBS_u) as green technologies that can be implemented in combination with existing infrastructure or as stand-alone systems [7] can support the transition towards a new water reuse paradigm, by integrating circular economy (CE) principles into urban water management.
When implementing urban NBS_u to create “circular cities”, the following urban circularity challenges (UCC) [8,9] can be addressed: (i) restoring and maintaining the water cycle (by rainwater management); (ii) water and waste treatment, recovery, and reuse; (iii) nutrient recovery and reuse; (iv) material recovery and reuse; (v) food and biomass production; (vi) energy efficiency and recovery; and (vii) building system recovery. The built environment can be identified as a key facilitator to address, promote, and benefit from a change in the water use paradigm by using the UCC to shift towards a circular management of resources [8]. At the building systems level [10], water streams, including separated wastewater, precipitation, and runoff, can be reused on site using NBS_u and supporting units (e.g., non NBS based on the COST Action CA17133 definition [11]). The same concept can be applied towards green building sites, and further support “reuse” practices in green building materials.
At the building scale, NBS_u, such as vertical greening systems (VGS) (ground-based green facade, wall-based green facades, pot-based green facades, and vegetated pergola) and green roofs (GRs) (intensive, extensive and semi-intensive) can be integrated in the building envelope of new and existing buildings in order to address the listed UCC. The reuse of water and nutrients through source separation at the building level is supported by those NBS_u. Greywater (household wastewater without the toilet stream) has proven to be a viable resource for irrigation, and the necessary treatment can be done by judiciously employing on-site systems, such as pot-based green facades and GRs [12,13]. In addition, water via rainwater harvesting can be reused for irrigation [14].
Plant water consumption must be met throughout the year to allow for the full spectrum of multifunctionality, e.g., increasing biodiversity, contributing toward public health, decreasing air pollution, and cooling the surrounding area [6]. This “demand” is mainly met with fresh water or drinking water, further contributing to water depletion [14]. However, operational water demand is not the only important factor in water reuse practices. NBS_u require resources for their initial production, and the processes used to manufacture their constituent materials are often highly water dependent as well [15]. Moreover, the production chains of components for VGS and GRs not only consume water, but the “production” of this water requires energy for pumping and often for treatment—meaning that carbon emissions are associated with constructed systems such as these, which are conceived as NBS_u, and where the expressed intent is often to reduce a building’s environmental footprint.
Transformation of the water use and reuse paradigm is needed in order to reduce fresh water depletion. Therefore, the hypothesis of this work is: “The illustration of the needed water demand for the production of building materials for NBS_u, as well as their operational water needs, will help to foster rethinking towards the implementation of water reuse practices.”
In this paper we consider two categories of NBS_u as vehicles for applying CE principles (especially fostering water reuse), surveying the existing knowledge, barriers, and gaps that are crucial for their wider implementation, and for fostering a transition from the existing linear water use paradigm within the built environment. A schematic depiction of this existing linear paradigm is presented in Figure 1.
To support CE principles in the water sector, we first examine the “wicked problem” of urban water management. We then review the relevant literature on selected NBS_u functions, performance, and impact. To provide more detail on their actual water needs, we scrutinized the published studies, which quantified both the materials and irrigation requirements in the context of a life-cycle assessment (LCA).
As the actual water demand of plants is highly dependent on various geographical, climatic, and physiological factors, a case study was used as a methodological approach to simulate the potential for meeting water demand with rainwater and greywater availability in model buildings located in a cross-section of European cities. Finally, we discuss the knowledge gaps and policy barriers that must be overcome to achieve widespread implementation of building greening systems, and offer recommendations to accelerate the use of NBS_u in the built environment, ultimately creating more circular cities.
This is the first large collaborative European study that (a) conducted a comprehensive, in-depth review of LCA studies that focused particularly on GRs and VGS, with an emphasis on water as an input to the material inventory; and (b) quantitatively compared the water balance of these systems in a range of European cities, with different climatic and cultural attributes.

2. Materials and Methods

2.1. Wicked Problem of Water

Water use, particularly reuse at the city scale, is a complex procedure. Therefore, the term “wicked problem of water” is introduced and described, using several important fields in urban water management. The needed information was gathered based on available literature of the following topics:
  • Closing the water cycle at the building scale;
  • Embodied energy in the provision of water;
  • Technical facilities for greywater treatment at the building scale;
  • NBS_u for greywater treatment at the building scale;
  • Policies and regulation to support water reuse.

2.2. Green Roofs and Vertical Greenery System Water Use Based on LCA Studies

The impacts embodied by GRs and VGS could be considered in a LCA, which provides a quantitative evaluation of a product or system’s environmental impact based on the inventory of materials required to build it. In contrast to typical building components, VGS and GRs are living systems, which rely not only on the materials originally employed in their construction, but on “materials” that must be continuously supplied throughout the building’s life, such as water. Hence, a more detailed investigation on the actual water use over the lifespan of a NBS_u can support change toward a more circular water loop. Water usages by GRs and VGS are addressed, based on literature reviews related to LCA studies.

2.3. Simulation Case Study

The aim of this simulation case study was to assess the potential contribution of VGS to the management and recirculation of water—preferably rainwater run-off, but also greywater at the building scale (in an urban context). Therefore, (i) the amount of otherwise drained or wasted water accruing in densely populated city center quarters, with different urban morphologies, was estimated; and (ii) this water “supply” was compared to the water “demand” or water loss, due to evapotranspiration of VGS located in different climatic zones. It is assumed that no storage capacity is provided to use as surplus run-off, or greywater, in subsequent months of a water deficit.
The potential water demand of a generic VGS model system was estimated. Driven by pragmatic curiosity—we calculated the balances between the available water and water demand for typical buildings, in six home cities of the authors, (Table 1).

2.3.1. Calculating Rainwater Run-Off Availability

The building-related rainwater run-off (RO) discussed here was harvested from the roofs. The harvested water was a high proportion of precipitation (P) and the collected water was clean compared to street RO. There are several types of contaminants typical to roofs, such as depositions from the urban atmosphere and substances released from roofing and gutter materials [16]. Most of these contaminants can be discarded using a first flush diverter. Several technical guides for rainwater harvesting suggest a first flush diversion of 0.1 to 1 mm [17,18]. Following these guidelines, a first-flush diversion of 1 mm was considered here in RO calculations on a daily base. RO was calculated by applying the static run-off coefficient (RC) of 0.9 and the ground area of the chosen buildings, assuming that it approximated the roof area well. For P, long-term averages (2000–2019) were taken from the database Meteonorm 8 (Meteotest, Bern, Switzerland) using interpolated data sets for all cities (Table 1).

2.3.2. Estimating Greywater Availability

The greywater availability was calculated based on published greywater production rates for the corresponding countries or cities (Table 1) and the occupancy of the buildings (inh/m2) related to the ground area of the building. Occupancy (O) was calculated using the average population density per district divided by the fraction of buildings to total area analyzed, using figure ground diagrams for the different cities (source: schwarzplan.eu). Thus, a typical average occupancy (not the actual) was applied. The ground area reference allows one to directly compare rainwater RO and greywater production.

2.3.3. Simulating Evapotranspiration of VGS

The potential evapotranspiration demand of VGS, denoted ET0vert (L/m2), was calculated based on verticalization of the well-established, adapted, Penman–Monteith approach, used by the FAO to calculate ET0 [19]. ET0vert simplifies the great variety of VGS described in Section 3 to virtually grass overgrown facades. However, the physically-based model approach describes the influence of site-specific meteorological parameters correctly. Meteorological input data (hourly values) originate from the Meteonorm 8 data base. Compared to the verticalization approach [20], the following simplifications were made: temperature, water vapor pressure deficit, and wind speed were not adapted. Solar radiation data were calculated for the 90° inclined surface for eastern, southern, western, and northern orientations [21], assuming non-shaded facades for comparability reasons. The ground heat flux (G), which gets the wall heat flux in the vertical case, was negligible on a daily basis, at least compared to net radiation (Rn) and for the vegetation period [22], though it might become relevant during the heating period. Hourly values were aggregated to daily and monthly evapotranspiration sums (L/m2) for the four orientations (Figure 2). All calculations were performed using MS Excel. For the comparison of the different cities, and with water availability, the average for all expositions was used.

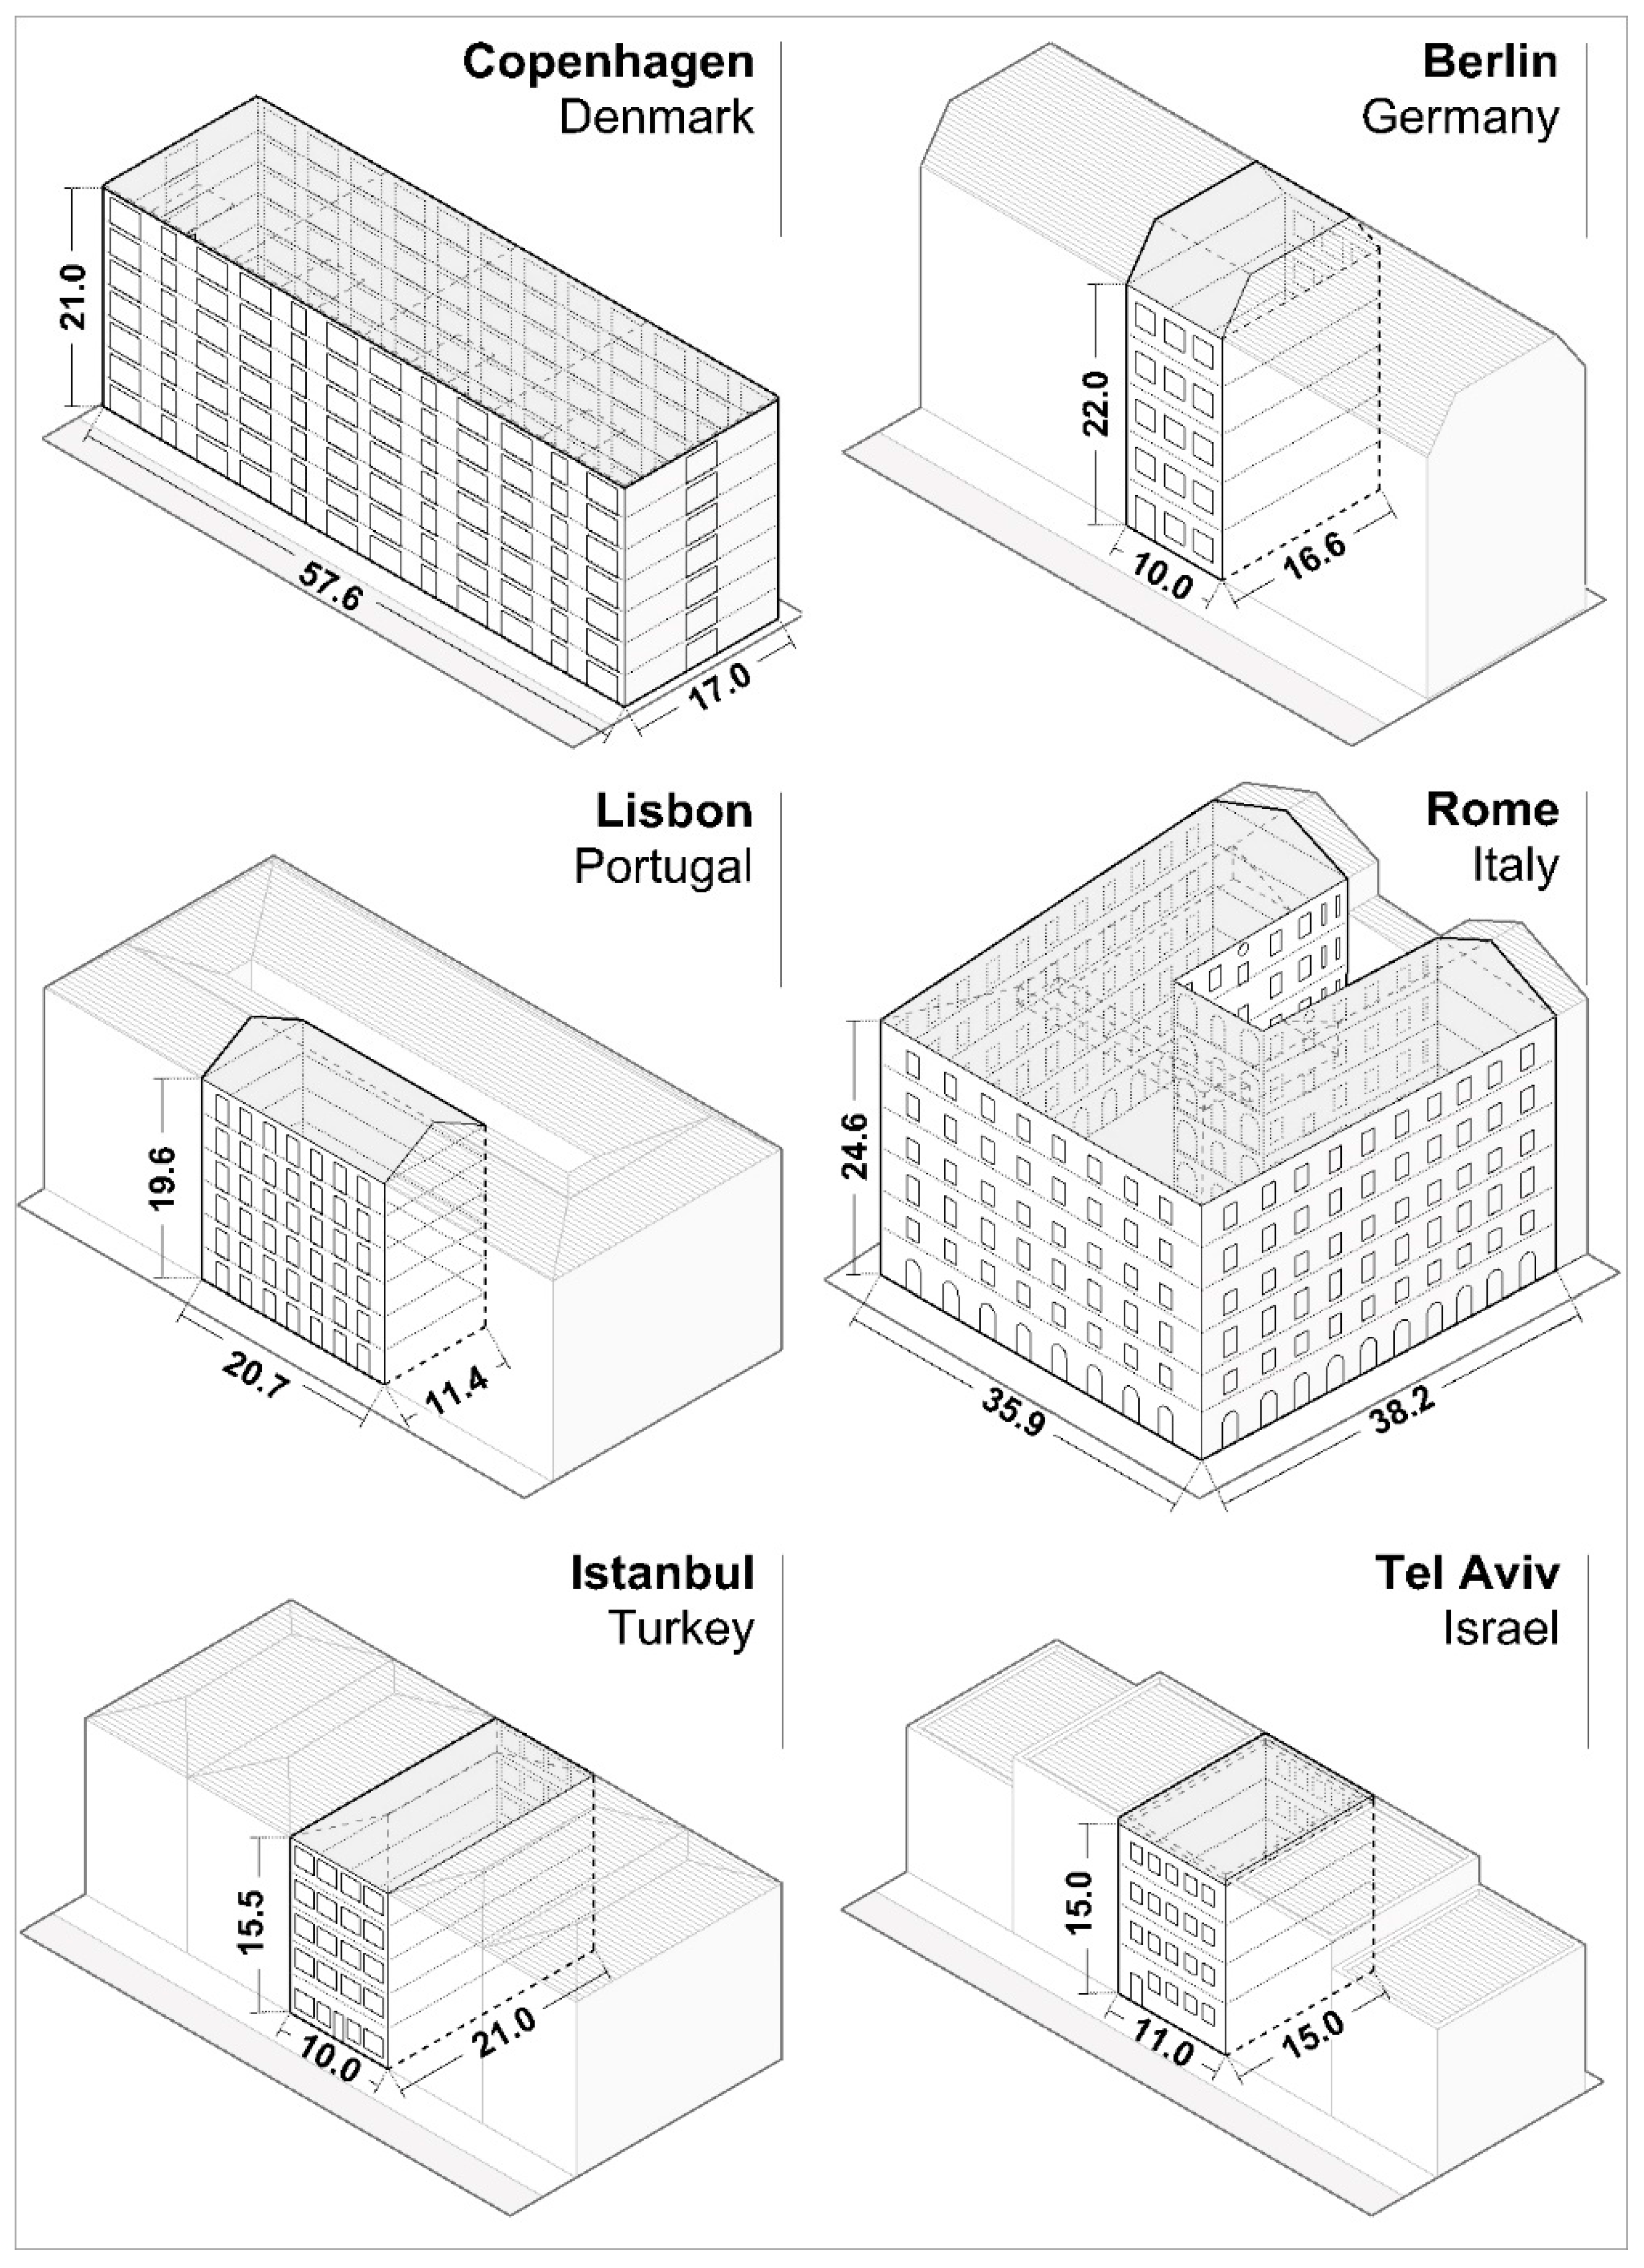
2.3.4. Case Study Buildings from Copenhagen, Berlin, Lisbon, Rome, Istanbul, and Tel Aviv

Figure 2 presents the buildings identified as “typical” or “representative” in different cities, in quarters that are most affected by urban heat islands. The buildings, their architecture, uses, social structures, communities in the houses, as well as their lifestyles, are simplified in this study, and characterized with the following parameters: ratio of facade area to ground area (v/h), occupancy (O) as number of inhabitants per ground area, and greywater (GW) production rate per capita.
In Copenhagen, Denmark, the selected building is in the district of Vesterbro. Although heat stress is not expected to be a major problem in the near future, Vesterbro is among the districts where a UHI can be detected [23]. Stormwater management is of higher relevance for the city and has been focused on in the masterplan for Copenhagen, after the flood of 2011. The case building named “almene” represents the typical Danish social housing type built in the 1960s and 1970s. It accounts for around 20% of the building stock in Denmark. The “almene” buildings are typically linear, with six to seven stories, and contain many apartments [24,25].
The building from Berlin, Germany, was typical for the Wilhelmine period between 1880 and 1918. Dugord et al. [26] identified this building type stock as having the highest risk for heat stress in Berlin. These buildings represent approximately 10% of Berlin’s residential building stock and are inhabited by 25% of Berlin’s population. The Wilhelmine buildings typically have four to six floors with closed or partially open courtyards [27], and represent typical dense block developments [28].
The model building in Lisbon, Portugal, was selected from areas in the city with the highest population density and urban heat index [29]. The location is in the historical center of the city, the former districts of Madalena and São Nicolau, with a total area of 0.2 km2 and 1875 inhabitants (2011 population Census, [30]). It represents a Pombalino style building, a design that followed in the reconstruction plan of the lower part of the city, called “Baixa Pombalina”, after a major earthquake and tsunami in 1755. Pombalino buildings have four floors and a dormer. The building’s floor area was calculated from the average of 651 buildings in “Baixa Pombalina”, located in 81 homogeneous blocks. A typical window size and floor height were calculated by Miranda [31] and Morais [30], respectively.
The building in Rome, Italy, is located in the central Esquilino district. With a population density of 10,813 inh/km2, it is one of the most densely populated districts in the city [32]. Esquilino suffers from severe urban heating effects [33]. The building (a traditional, rigorous residential type) was constructed in 1873; it has a linear geometry, commonly found in the Esquilino. Impervious terraces and clay tile sloping rooftops are present in almost all buildings in the historical center of Rome [34].
The typical building in Istanbul, Turkey, is situated in the central and historical district of Kadıköy. This is the most densely populated, urbanized area on the Anatolian side of Istanbul, affected by the UHI effect [35]. A typical building in Kadıköy has five to seven stories. Information on a typical building involves the average values from a building block of row houses, forming an open courtyard, from the General Directorate of Land Registry and Cadastre [36].
The model building in Tel Aviv, Israel, is situated in the Florentine quarter, which is one of the most susceptible to surface UHI effects. Early urban planning was shaped by the Geddes Plan from 1925, characterized by a hierarchical grid of streets that form blocks, central open spaces incorporated in blocks and dwellings, and a standard small-scale residential building type [37]. The selected building is located at the crossing of Herzl Street and Wolfson Street, in an area of compact mid-rise buildings, with 3–5 stories, and very few trees on the street. The population density in the area is 12,236 inh/km2.

3. Results

3.1. The “Wicked Problem” of Water

The urban heat island (UHI) effect is a well-known characteristic of the urban climate [38,39]; it is amplified by ongoing urbanization and the sealing of surfaces, and can result in serious health hazards [40,41]. Heat-mitigation strategies implemented at the level of individual buildings, using VGS or GRs, are well known, and can be traced back to ancient times—in some cases providing privacy and food provision [42].
The current emphasis on NBS_u integrated in the building envelope is heavily attributed to reducing the energy consumption of the building itself, functioning as thermal insulation, wind protection, and passive shading. In addition, they can moderate the microclimate of the immediate surroundings, through the cooling effect from plant transpiration. This process highly depends on the available water supply [43,44]. The most common source for this is tap water from the existing water supply system—but with the ongoing transition to a CE and the implementation of NBS_u, it is clear that the predicted increase in fresh water withdrawal is not sustainable, and calls for a change in this practice.
The nature of water, as a resource, makes it inherently scarce, with unprecedented demands on water supply for both consumptive and non-consumptive use. These stresses are unequally distributed in time and space, and create an ever-changing landscape of consumption patterns due to industrialization and urban migration, while each sector is simultaneously seeking to maximize the stream of social and economic benefits from a limited resource [45]. A relatively under-represented source of water stress can be attributed to NBS_u for the mitigation of UHI effects. For example, NBS_u for stormwater management need artificial irrigation during the dry season, when plants contribute to cooling. Here, the “wicked problem” for urban water management is identified. On the one hand, more service provisions require higher water use, which is commonly solved by importing water from outside of the city. On the other hand, fresh water enters the city, becomes polluted, is discharged (whether treated or not), and leaves the city. One key to ensuring sustainable water supply for urban irrigation and cooling through plant transpiration is, thus, implementing water reuse.
At the building scale, one often-discussed approach is the local use of rainwater, especially for GRs. For VGS, some literature demonstrates the potential of rainwater use [46,47], but detailed experimental investigation is scarce [48]. Rainwater harvesting systems have proven to be effective as partial substitutes for domestic water demand in oceanic zones [49], as well as in semi-arid climatic zones [50], but limiting factors include the unpredictability of precipitation patterns and the size of water storage systems, which may be prohibitive [14]. On the other hand, wastewater, particularly greywater, is produced daily and, hence, can provide a continuous stream of irrigation water once treated.

3.1.1. Closing the Water Cycle at the Building Scale

In addition to rainwater harvesting, source separation and on-site treatment of wastewater is a key element for CE in the water sector. However, using these sources, changes must be made at the scale of the building and its service systems. In addition to these changes, there are important implications for the surrounding wastewater discharge infrastructures.
Firstly, the building needs sufficient collection facilities. Secondly, since irrigation requirements are time-shifted, relative to the actual precipitation or the production of greywater, the system must provide a buffer reservoir during dry periods and a distinct pipe system to collect and distribute the water. Lastly, if greywater is used, the system must locally treat the wastewater part of the stream. Additional installations for collection and storage are necessary for both the purification of greywater (e.g., in GRs) and the use of locally purified greywater for irrigation. Whereas the first needs pre-treatment (i.e., settling tanks or filter units), the latter needs biological treatment as well [51,52,53].
Either way, in existing buildings this is usually not possible without intervention in the building structure or envelope; moreover, it is correspondingly cost-intensive [54]. The system components require additional space, as services detract from the usable area. For a new building, however, the additional costs, efforts, and impacts are estimated to be very low [54,55]. For such installations, operating costs (e.g., monitoring, energy for pumping, and aeration of the biological stage), as well as the time and cost for services and part replacements must be considered.

3.1.2. Embodied Energy in the Provision of Water

In this paper, water is considered a limited resource—and using rainwater or reusing greywater in NBS_u is considered as “closing” the local water cycle. Therefore, the implications of the provision of water for irrigation in the framework of LCA or life-cycle costs (LCC) is most likely considered an operational cost [56]. Some LCAs integrate the water footprints of the materials that are implemented in the research [57], and in some cases, the energy use or heat production can be transformed into a water footprint [58]. However, the real costs and energy consumption required to obtain, treat, and provide tap water to the user are rarely included in the calculation.
Energy costs represent, on average, some 30–40% of the operational costs of water services [59]. In the case of water supply, this percentage can be as high as 80% [60], and as such, reducing the required fresh water supply by reusing greywater for non-potable uses has the potential to provide significant savings in energy consumption in water supply systems.
The embodied energy in the water supply represents the catchment and treatment, on the one hand, and the distribution (pumping), on the other hand [61]. The latter depends highly on the topography of the serviced area, and can triple the amount if located in a hilly region. The amount of energy for pumping can be calculated for a customary device and pipes, resulting in approximately 0.02 kW h/m3 100 km without raising the altitude level. Lifting the water by 500 m in altitude doubles the energy consumption to approximately 0.04 kW h/m3 100 km [62]. For the catchment and treatment of water, Table 2 provides specific embodied energy values from different sources.
Table 3 presents embodied energy values for water in five different countries and cities. The values in Table 3 are often calculated as gross figures (input into the distribution system) by the provider. The losses within the network are not included. Therefore, the actual water withdrawal at the tap does not represent the actual energy footprint per inhabitant. For example, in Italy, the daily water demand of 220 L/inh d in the year 2015 was accompanied by water losses of 47%, equaling a net volume of 428 L/inh d [64].

3.1.3. Technical Facilities for Greywater Treatment at the Building Scale

Irrigation of NBS_u with treated greywater reduces the amount of fresh water required, on the one hand, and on the other hand, closes the water cycle on-site for some portion of the wastewater [53]. The needed treatment of greywater can either be carried by the NBS_u itself [13] or by using established intensified onsite treatment systems, as listed in Table 4.
Results for irrigating seasonal plants with raw or treated greywater vary among species. However, it should be noted that using greywater for irrigation purposes could have positive effects on the growth of plant biomass when compared to nutrient-free tap water [73]. Furthermore, only a minor uptake of micropollutants (e.g., heavy metals) in the plants, and no presence of pathogens on the plant surface, were found [74].
In Table 4, a number of ready-to-use small-scale treatment plant technologies that fit the requirements are listed. The energy consumptions of medium-sized treatment plants are used here due to the lack of reliable comparative values.
The energy consumption figures presented in Table 4 are for decentralized treatment plants. Energy demand for smaller treatment facilities will consume more energy per cubic meter of water due to the lower energy efficiency of small-scale systems. The impact of other energy consuming activities that are indirectly related to the process are not included. The energy use of treatment trains that produce service water for non-potable purposes range between 0.48 and 2 kW h/m3 [75].

3.1.4. Nature-Based Solutions for Greywater Treatment at the Building Scale

The multifunctionality of NBS_u, such as GRs and VGS, includes their capabilities of acting as greywater treatment units. Here, design recommendations and processes occurring in treatment wetlands (e.g., biological degradation of pollutants due to bacteria metabolism in the pore space of the substrate) are transferred to develop GRs and VGS for greywater treatment [13,76,77,78]. Advances in this research are not only made at the lab-scale—full-scale applications are also available [79,80,81,82]. Besides the sufficient treatment functions of specific GRs and VGS, the daily available greywater also acts as irrigation water, providing and underlining the multifunctional purposes of NBS_u [82]. As, here, water supply is not limited in the dry season, cooling by transpiration (and therefore UHI mitigation) is an important effect of NBS_u treating greywater. The treated greywater can further be reused for the irrigation of other NBS_u.

3.1.5. Policies and Regulations to Support Water Reuse

Policies and regulations reflect the regional, national, or international perspectives and priorities on agreed objectives. They provide a framework, defining rights and obligations of the affected stakeholders, and are shaped according to their needs. In particular, with the needed shift towards CE and closing loops in the water sector, policies and regulations need to be adapted to “not act” as barriers [15].
In 1973, the World Health Organization (WHO) published their first guidelines on safe use of wastewater, excreta, and greywater, with revisions in 1989 and 2006 [83]. According to the WHO, their use increased in both industrialized and developing countries due to higher water stress and scarcity, growing populations, environmental pollution, and a mind shift on wastewater, excreta, and greywater as resources [83]. However, the presented case study locations (see Section 2.3.4) do not face equal pressure on their water management systems. The Food and Agriculture Organization (FAO) [84] estimated freshwater withdrawal as a percentage of total renewable water resources, for the case study countries in 2017, as follows: Israel (67.3%), Turkey (28.4%), Italy (17.8%), Germany (15.9%), Denmark (12.4%), and Portugal (11.8%), reflecting the pressure on national water resources.
Among member states of the European Cooperation in Science and Technology (COST), several countries have obligatory standards or proposed guidelines on water reuse [13,85,86]. In Portugal, one recent regulation acknowledged water reuse as an alternative water source, in line with the principles of the CE [87]. Concerning the European Union (EU), water reuse is advised to be used “whenever appropriate” in the EU Urban Wastewater Treatment Council Directive [88], and addressed it as one of the possible supplementary measures to be optionally implemented in member state policies in the Water Framework Directive in 2000 [89]. Regulation 2020/741 [90] provides minimum requirements for treated wastewater reused for agricultural irrigation. Reuse for irrigation of NBS_u in cities is therefore not addressed.
The implementation of decentralized systems using non-conventional water resources is hindered by the lack of a regulatory framework, institutional support, and financing schemes for small and rural communities [91]. Regarding a regulatory scheme, regional policies can provide a basis for national or international policymaking. In Germany, there is no ordinance regulating rainwater management [92]. However, regional regulations, such as requirements for managing rainwater in the Berlin water act [93], might serve as a blueprint for national policy. Additionally, non-binding recommendations by professional associations are available in regard to handling rainwater and treating and using greywater [94,95].

3.2. NBS Units Considered: Focus on “Building Greening” Systems

Within the framework of the COST Action “Circular City”, an extensive list of NBS_u was formulated to promote the transition to CEs in urban areas [7,9]. In this paper, building-integrated NBS_u, namely GRs and VGS, are discussed and analyzed for their constituent materials and water requirements. According to Pearlmutter et al. [10], green building systems comprise of the greening of building envelopes with living vegetation. In surveying the existing literature, we adopt the perspective of a LCA, in which material quantities are inventoried and assessed in terms of their environmental impacts. The following sub-categories of GRs and VGS are included in this survey, namely intensive and extensive GRs, as well as a ground-based green facade, a wall-based green facade, a pot-based green façade, and vegetated pergola.

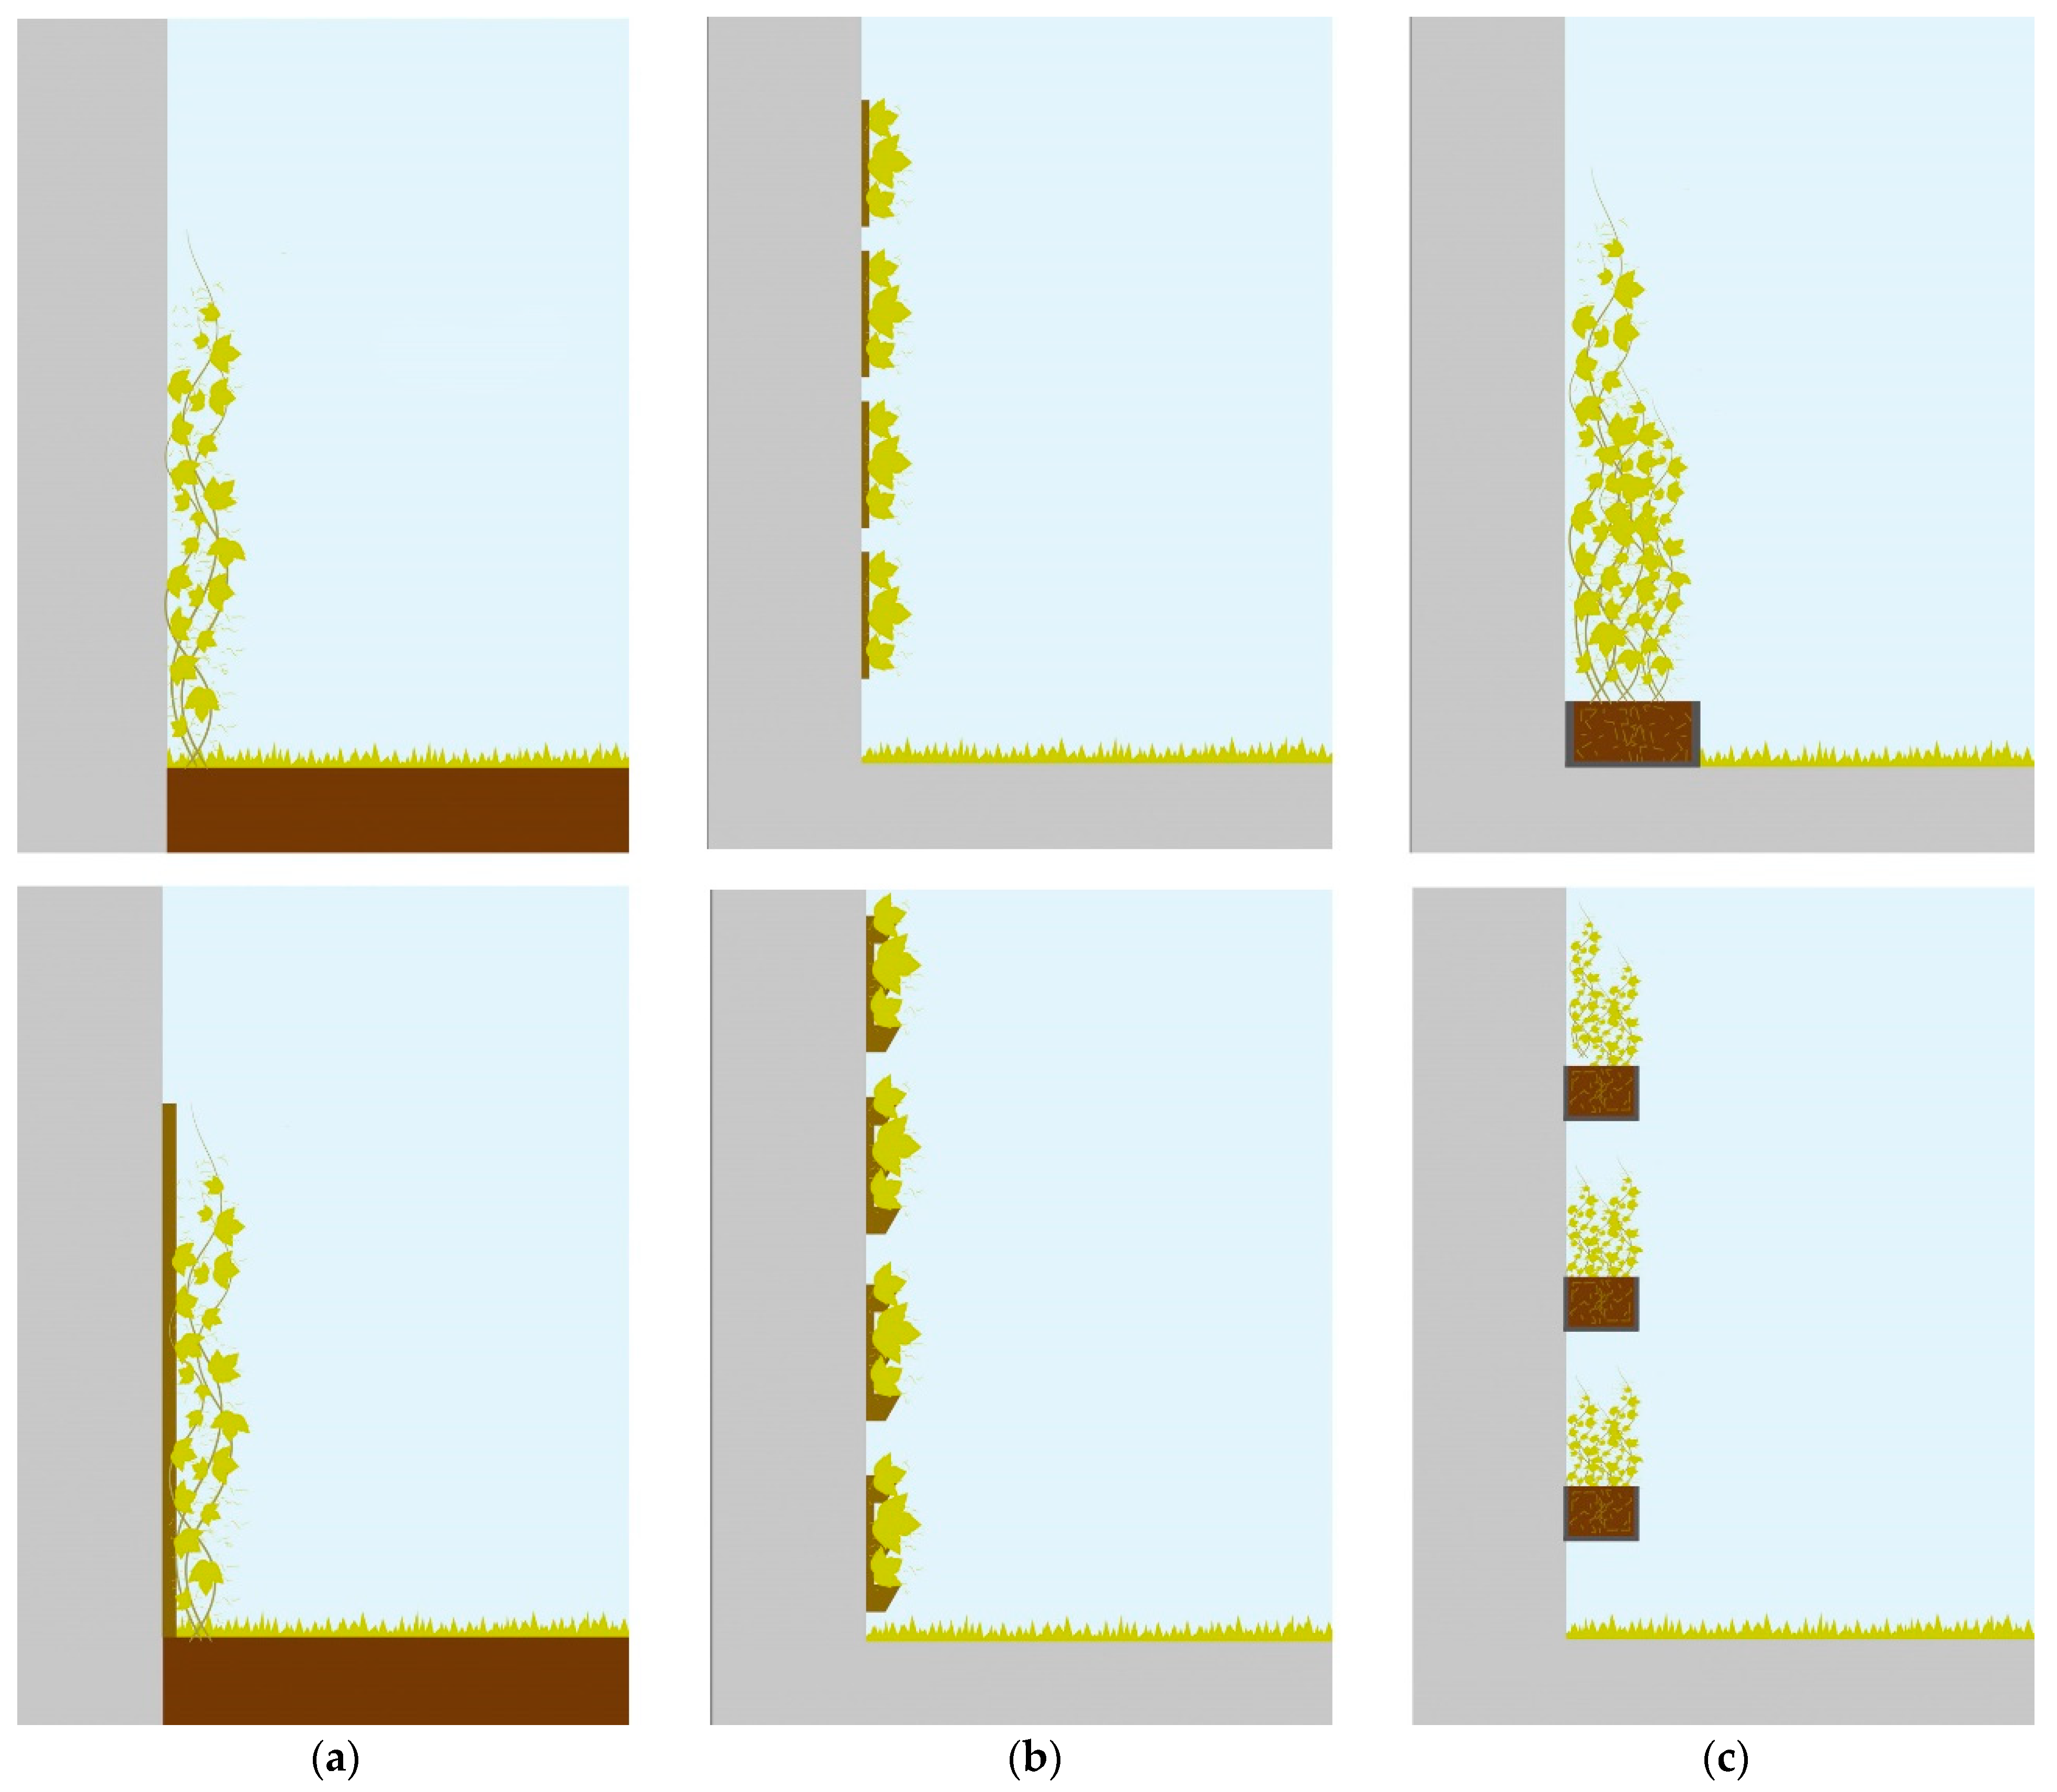
3.2.1. Vertical Greening Systems (VGS)

Vertical greening refers to vegetated surfaces on the building envelope, which include the spread of plants that may or may not be attached to the façade, and can either be rooted into the ground or in pots (see Figure 3). Thus, based on the characteristics of the vegetation, support structures used, and root system, the type of green facades can be divided into a: soil/ground-based green facade, wall-based green facade, or pot-based green facade [7,96,97,98]. The typology of plants and associated thickness of the foliage, water needs, material characteristics, and layers, are relevant aspects when selecting these systems [56].
A ground-based green facade is a wall completely or partially covered with greenery (Figure 3a). The climber plants (evergreen or deciduous) are planted in the ground (soil, technical or recycling substrates) or in containers (filled with soil), and grow directly on the wall, or climb using climbing-aids (e.g., on a frame) that are connected to the wall [7]. These NBS_u can also be implemented along highly frequented roads to reduce noise emissions; they usually require less intensive maintenance and protection than pot-based green facades or wall-based green facades [7,56].
A wall-based green facade comprises panels and technical structures (3D-frames filled with technical substrate) that are seeded or planted (Figure 3b). These panels and structures are fixed onto facades or walls or can be designed as stand-alone systems and allow the placement of plants and substrate on the entire surface. Some systems allow for the removal of panels during winter. Compared to soil/ground-based green facades, a wider plant range can be applied, though compared to the other types of VGS they require more maintenance due to the nutrients and watering system. Their durability varies depending on the chosen panel system [99].
A pot-based green facade involves the use of containers, such as pots or planters, which are placed on the ground in front of the building’s facade or directly on the building or balconies [7] (Figure 3c). The containers of these NBS_u vertical greening types are filled with (technical) soilless substrates, soil, or a mixture, and some of them are also constructed like a GR with different functional layers (e.g., substrate, filter, and drainage layer). A broad variety of plant species (e.g., climbing plants, trees, shrubs, perennials) can be planted in the containers. Geared to the specific demands of plant species (e.g., climbing plants), supporting elements, such as cables, meshes, trellises, or nets have to be provided.

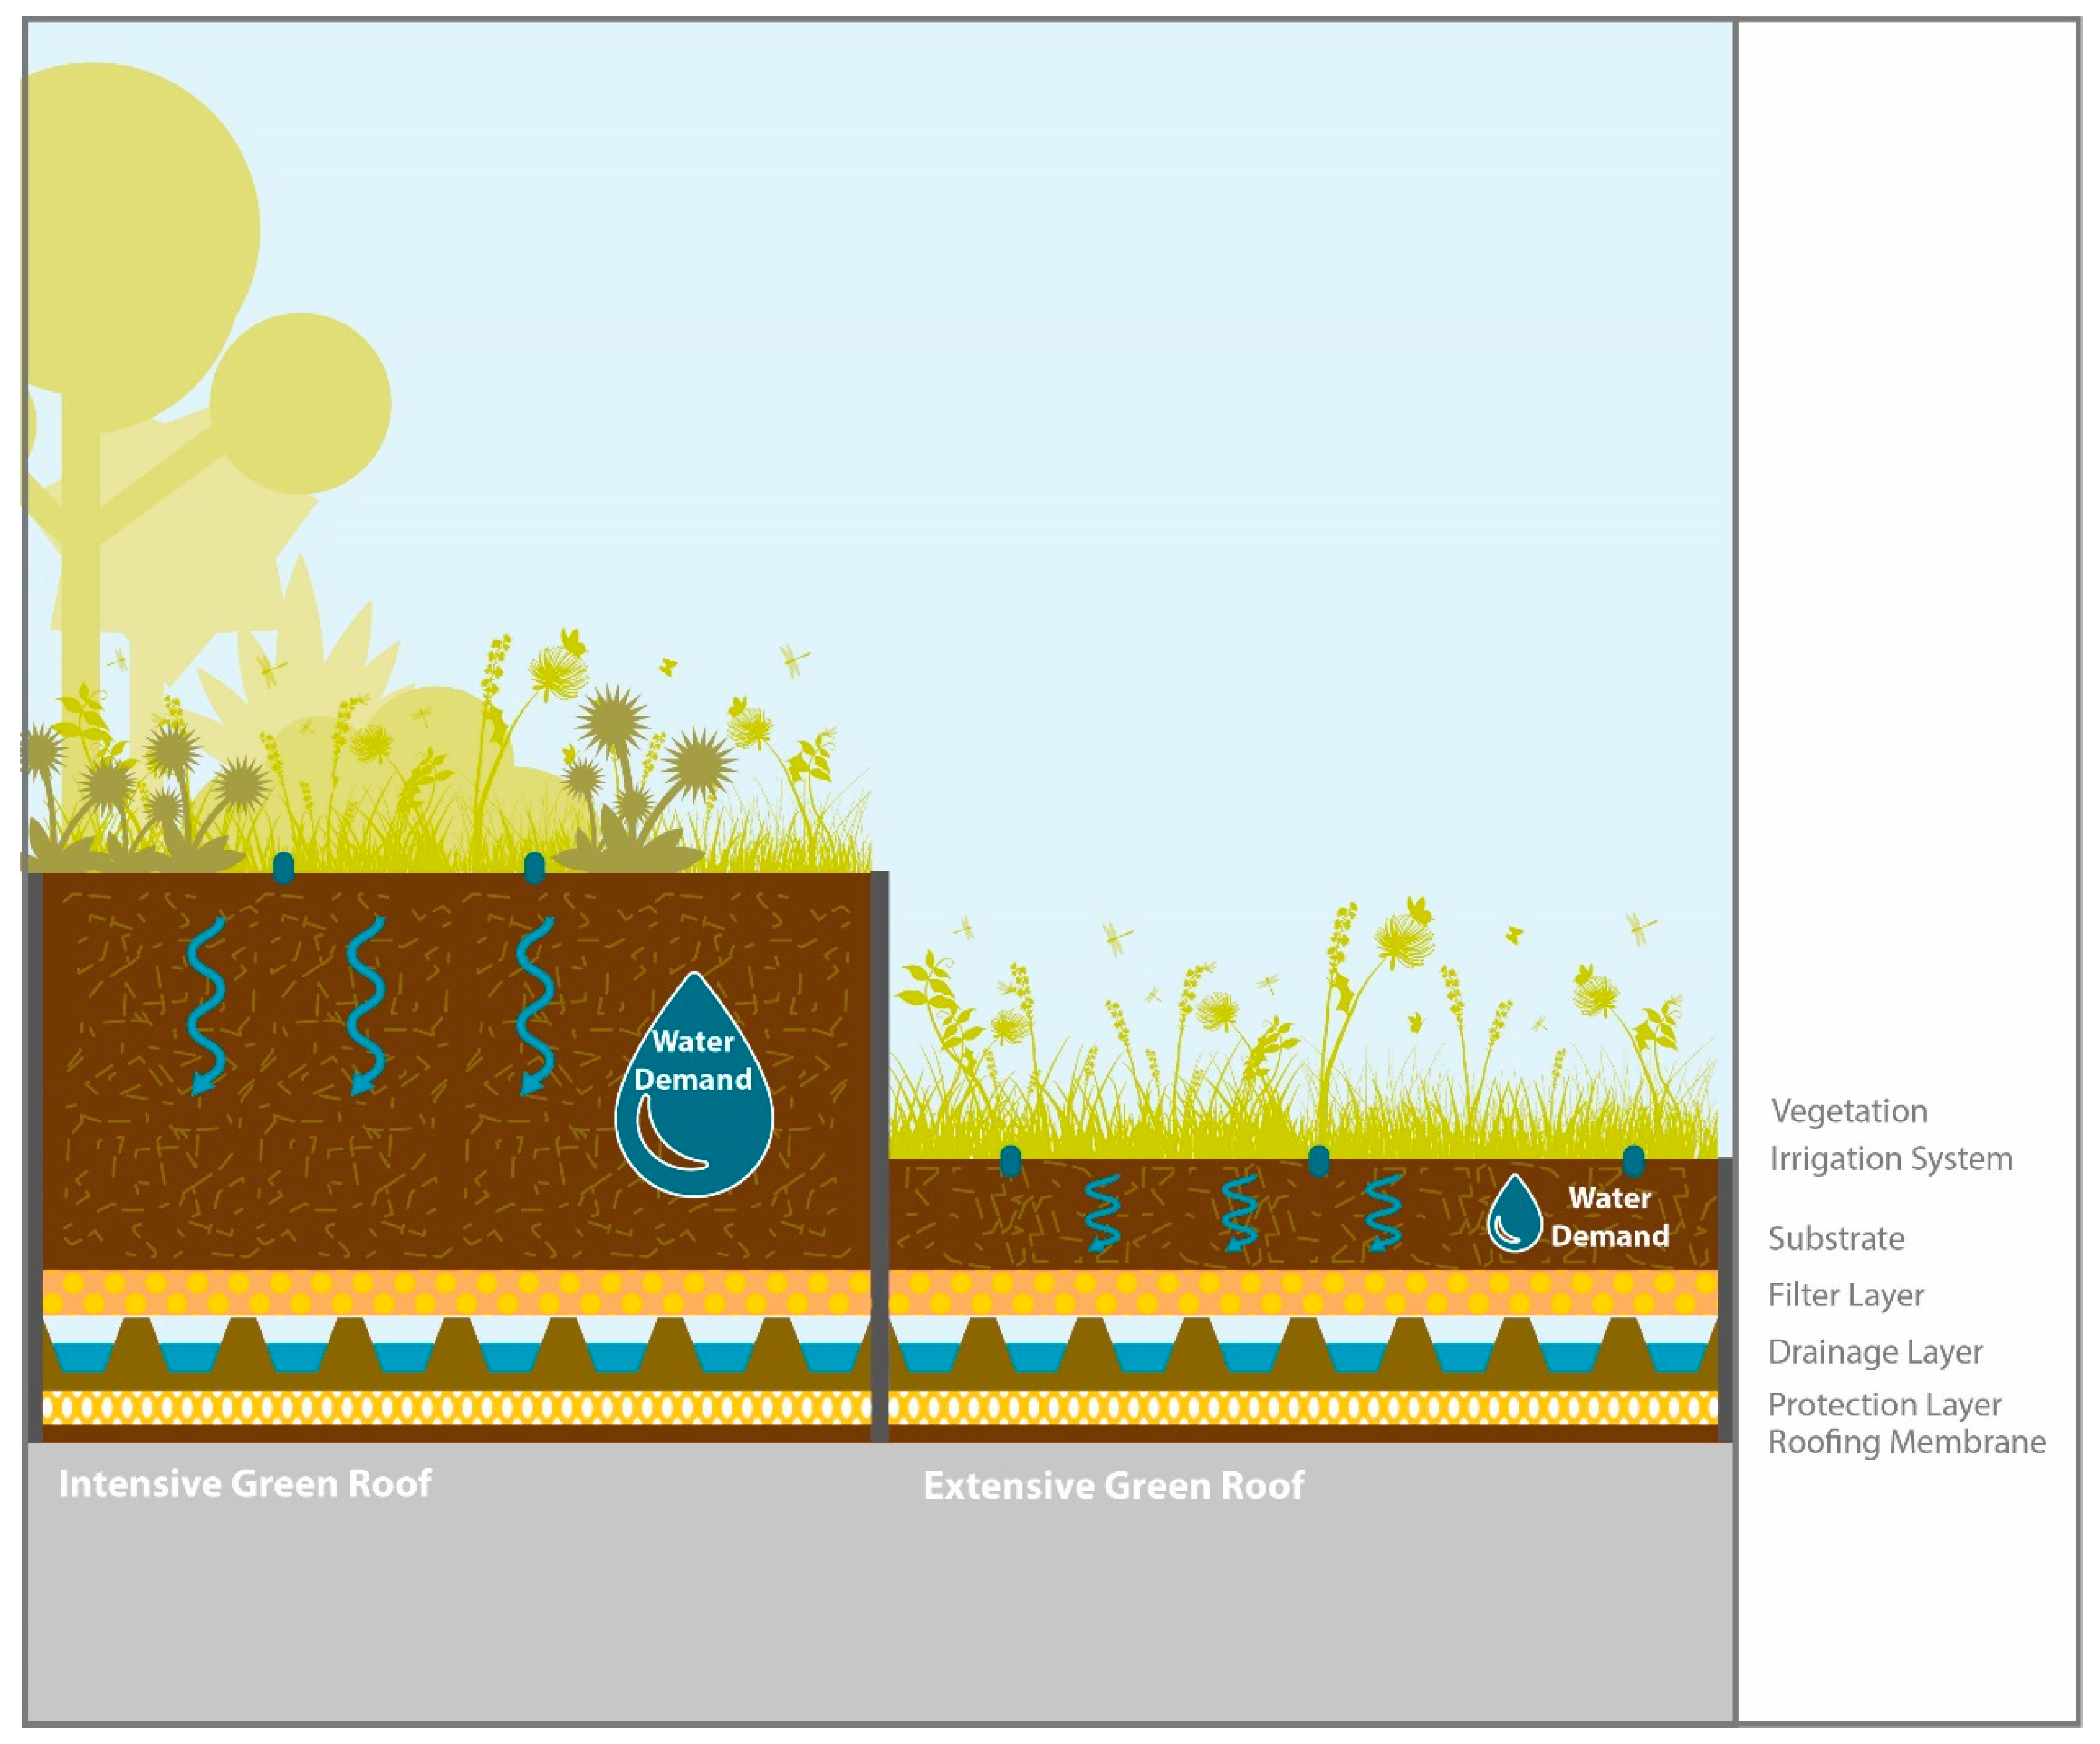
3.2.2. Green Roofs (GRs)

Modern GRs are engineered systems whose designs are informed by a broad knowledge base, supported in technical guidelines, standards, and scientific backgrounds. They comprise vegetation planted in a technical substrate, followed by several materials, arranged in layers, and installed on a constructed structure. They can be implemented at the ground level or on the top of buildings, respecting the physical integrity of the built structure.
In urban areas, GRs offer potential benefits in terms of aesthetic value, restoration of biodiversity, reduction of noise and air pollution, and mitigation of heat-island effects [40,100,101,102,103]. GRs are efficient solutions for stormwater attenuation, delaying the peak flow, and releasing water more gradually; thus, avoiding overloading the urban drainage system. The stormwater infiltrates and is retained in the GRs substrates, and is subsequently released during dry periods through evapotranspiration [100,102,104,105,106]. In both rural and urban areas, this solution can improve thermal comfort and yield economic advantages due to the reduction of heating and cooling requirements [40,100].
Two general types of GRs can be considered (Figure 4), based on the type of plants selected, the associated substrate depth, and the amount of maintenance expected [7]: (i) extensive GR; and (ii) intensive GR.
For the purpose of the present review, these two categories may be defined as follows.
(i) Extensive green roofs. The most common plants used are sedum, herbs, mosses, and grasses. The substrate is relatively thin (typically 0.1–0.15 m) and lightweight. They are usually not accessible to the public. The installation and maintenance are less expensive than that of intensive systems. Irrigation is kept to a minimum, depending on the climatic conditions [7,96,97,98,107]. To achieve this, vegetation is composed of self-sustaining and native species of plants that are chosen by taking into account their adaptations to local climate conditions [108].
(ii) Intensive green roofs. A wide variety of plants can be considered, from grasses to small shrubs and trees. Depending on the nature of the GR usages, the configuration, in terms of layers and substrate thickness (usually more than 0.2 m), may vary greatly. Intensive GRs are usually accessible for public recreation, gardening, relaxation, and socialization purposes [7]. Eventually, they can even become spaces for urban agriculture [40]. In general, this type provides more biotopes and higher biodiversity than an extensive system. On the other hand, higher costs for implementation and maintenance must be envisaged when compared to extensive systems, due to the increased loading on the structure [109]. In terms of maintenance, intensive GRs are similar to a garden, requiring regular irrigation and fertilization [10,110,111].
Either type of GR is typically composed of a number of consecutive layers, including the plants themselves, a growth substrate, an irrigation system, a filter layer, a drainage layer, a protection layer and roofing membranes, and an insulated structure, which is reliably waterproofed (Figure 4). Depending on the particular system, these layers may be built up in different sequences, or some even omitted, as in the case of “classical” GRs. These main layers have been described according to their typical functions and materials in recent publications [111,112].

3.2.3. Vegetated Pergolas

The history of vertical planting goes back to the hanging gardens of Babylon (c. 600 B.C.), considered one of the Seven Wonders of the World, and from ancient Egyptian gardens, we also find the origin of pergolas, which were further introduced in Italy. A pergola is typically a linear structure containing pillars and crossbeams, as well as an overhead latticework, commonly in combination with climbing plants to shade a walkway. Vegetated pergolas have traditionally been created with attention to the local climatic conditions, design purpose, and similar factors. In the 17th century, for example, different usages of ivy, climbing plants, roses, and grapes, were observed on the walls, hedges, or entries of castles, manors, and gardens, often using pergolas or similar support structures. Vertical planting design became easier by using steel cables to reach higher elevations and cover wider surfaces.
Design considerations for natural elements include physiological characteristics of trees or plants, their height, density of foliage, crown shape and volume, and whether they are deciduous or evergreen. In addition, maintenance considerations, such as growth rate, leaf, flower and fruit shedding, pruning, volume of root structure, and irrigation requirements should be considered, as well as environmental conditions, such as soil type, slope, and aspect, solar exposure requirements, and resistance to winds and pollution.
In some regions, particularly in Mediterranean climates, combining overhead vegetated pergolas with GRs are recognized as a way to create more enjoyable environments by mitigating urban heat [113]. While such traditional techniques of cooling and creating a more comfortable living environment are not new, they are attracting renewed interests in different parts of Europe, as it becomes clearer that greenery systems and plants provide a wide range of benefits to urban areas and their inhabitants. Ecologically-oriented architectural projects have been undertaken in historic areas in many European cities, demonstrating how the use of pergolas, as a mobile architectural form made of natural materials, can enrich urban landscapes [100]. In both Mediterranean and temperate regions, plants, such as vines and ivy, have been re-introduced to protect buildings against sunlight—just as they did in years past, when they were an integral part of the construction of vernacular architecture.

3.3. Materials for Green Roofs and Vertical Greening Systems: A LCA Approach

LCA studies on GRs evaluate the particular materials used for the various GR layers in terms of their environmental impact. The outcome of a LCA can be used as a decision factor in the design process and for comparison of the environmental performance of different GR types. The following phases are primarily included: material extraction, transportation, construction, operation, and end-of-life (EoL) [114]. Approximately 90% of the studies further discussed the inclusion of material and energy inputs for the operation and maintenance phase. This is crucial as, here, water is also respected.
Similarly, LCA studies exist, comparing various VGS in order to evaluate their environmental profiles [56,115,116], environmental benefits, and loads [117]. Cortes et al. [118] conducted a comparative LCA and, based on the findings, developed an eco-friendly module to build pot-based green facade systems. In order to achieve a sustainable profile, VGS need to include (in their designs) recycled materials and substrates, including natural alternatives with low environmental impacts.

3.3.1. Life-Cycle Inventory: Materials

Different types of GRs and VGS have wide ranges of material type requirements for their construction, operation, and maintenance. The choice of materials with minimized environmental implications plays a dominant role in their sustainable profile. Sustainable and local material choices are needed in order to have more environmentally friendly GRs and VGS [103,115,118,119,120,121,122,123,124].
Recent studies evaluated the replacement of conventional GR materials with natural alternatives [123] or with recycled material and industrial waste [122]. It was emphasized that GRs need to be developed using recycled materials as ‘green’ substitutions to conventional materials, and also the EoL phase requires further study because it is based on assumptions that are subject to great uncertainty given the nature of future applications at the end of the very long lifetime of GRs [114].
Table S1 (in Supplementary Material) presents the selected NBS_u and their typical constituent materials, broken down in basic types (organic, mineral, and synthetic), and highlighting their CE aspects (e.g., impacts and benefits). Tables S2 and S3 (in Supplementary Material) present lists of GRs and VGS materials whose inputs have been previously calculated, with information on their unit quantities and life cycle phases. These values are taken from previously published LCA studies, dealing respectively with GRs [57,103,119,120,121,125,126] and VGS [56,115,116,117,118,122,127].

3.3.2. Life-Cycle Inventory: Water

Freshwater withdrawal for a product may be generated by direct and indirect consumption. The water footprint (WF) concept expresses the amount, type of water resource, and pollution generated as a new metric that can be applied to a product, process, or service. It is expressed in terms of water volume per product unit (in terms of mass, energy, volume, etc.). The total WF is the sum of blue, green, and grey WFs, where the blue WF is the amount of freshwater (surface water and groundwater), the green WF is the amount of rainwater, and the grey WF is the amount of freshwater required to dilute pollutants in order to provide a level of water quality compatible with relevant water quality standards. This complex analysis of the water needed during the production cycle adds to the needed direct water use during operation and maintenance, mostly irrigation.
Most LCA studies only focus on the operation and maintenance phase, whereas the water footprint (including indirect water embodied in the materials of these systems) is not defined clearly. Table 5 presents a summary of the water consumption for irrigation, including the type of water used and the calculation method.

3.3.3. LCA Studies: Sample Findings

A comparative LCA study [57] between traditional gravel ballasted roofs (TGBR) and extensive GR found that in both cases water consumption is mainly “embodied” in the reinforcing steel, concrete, thermal insulation, and waterproof membrane, while for GRs, the drainage layer is also a significant water “consumer”. Several LCA studies have examined the individual components of GRs. For example, Vacek et al. [129] evaluated the environmental impacts of four semi-intensive GR (either a combination or something in between green roof types presented here), differing in their substrate composition. The system, including a substrate layer with an additional extruded polystyrene layer, has the highest environmental impact.
Cortes et al. [118] recently executed a comparative cradle-to-gate LCA of five existing modular pot-based green facade systems in order to determine the features that should guide the design process of a new insulation cork board (ICB)-based system. Results indicated that a medium density modular system could be an eco-friendlier counterpart to current plastic and metal based VGS, and the new ICB module supports the vegetation by offering better environmental performance. In addition, it can be easily recycled, it ensures the adequacy of both water retention and the drainage of excess water, and it provides thermal and acoustic benefits for buildings when used in external cladding systems.
Ottelé et al. [56] conducted a cradle-to-grave LCA, comparing several VGS to a conventional brick facade. The VGS investigated include two ground-based green facades, one with a stainless steel frame creating a cavity between the foliage and facade, one filled pot-based system, and one pot-based felt system. The irrigation systems are not considered when the climbing plants are rooted in the ground, as the water demand is covered by groundwater, and the other systems consume tap water (between 1 and 3 L/m2 d as yearly mean).
The results indicate notable differences, especially for the supporting systems used for VGS. The materials for the frame structure based on stainless steel were found to have an environmental burden 10 times higher than for structures based on recycled plastic (HDPE), hard wood, and coated steel.
The felt-based system exhibited the highest values for global warming potential and fresh water aquatic ecotoxicity. This comes mainly from the waste generated by the need to replace the felt-based panels five times over the 50-year lifespan, rather than recycling the entire module with all of the material layers.

3.3.4. Building Greening Horizons: Areas for Improvement

In order to amplify the environmental benefits of GRs and VGS, and minimize their negative impacts, recycled or locally available materials play a crucial role—constituting an alternative to conventional materials by replacing them in key system layers. The so-called zero waste strategy represented by the six Rs (refuse, reduce, reuse, repair, recycle, and rot) is applicable to GRs and VGS, and is facilitated by organizations, such as BauKarusell [130], which acts as a social hub for urban mining, reusing, and recycling of construction materials. Essential information and know-how about CE, removal of buildings, re-used materials, and related concepts are provided by the BauKarusell [130] team for interested stakeholders in the building sector, including construction companies, building owners, architects, and landscape architects. For example, a specific case related to GRs is described by which the valuable extensive GR substrate from an existing building was carefully removed and reused in the GR construction of a new house.
Romm and Kasper [131] emphasize the potential of eco-efficient construction by using local resources available on building sites. During earthworks, carefully removed cohesive soil and nutrient-rich topsoil can act as a base for technical substrates, optimized with recycled materials, such as crushed brick and lightweight water-retaining materials (expanded clay or aerated concrete). This strategy allows the on-site reuse of valuable soil resources and the application of recycled building materials in the design process of new technical substrates, e.g., for GRs or pot-based green facades with high water storage capacity. Within selected Viennese building projects, such as Wildgarten (ARE Austrian Real Estate Development GmbH, 2019) and Biotope City Wienerberg (Forschungskonsortium Biotope City, 2021), this strategy (Concept Circular Soil) was implemented to save resources in building construction processes.
Eksi et al. [132] evaluated the potential of four recycled materials (crushed concrete, crushed bricks, sawdust, and municipal waste compost), and five locally available materials in Istanbul (lava rock, pumice, zeolite, perlite, and sheep manure), finding that the pumice and municipal waste compost mixture show good prospects in relation to the physical and chemical properties and positively influence plant growth, performing similarly to a commercial substrate, and better in terms of reduced carbon emissions. Other materials have been tested as alternatives to heat-expanded shale, such as crushed porcelain and foamed glass, and were shown to be good candidates for extensive GR applications [133]. Monteiro et al. [134] proposed an alternative experimental substrate composed of 70% expanded clay, 15% organic matter (granulated cork supplemented with urban solid waste compost), and 15% crushed egg shell, and found good results regarding plant establishment and water runoff, with a quality compatible with storage and reuse for non-potable purposes.
Reused materials for the drainage layer, such as PET bottles and bamboo, as well as substrate components, were observed to function well for GR [112]. Specifically concerning the drainage layer, ICB produced from processed cork waste has been evaluated as a material for water drainage and storage, replacing the polyolefin reference product, and replacing the conventional insulation layer made of extruded polystyrene (XPS) and expanded polystyrene (EPS) [135]. Rincon et al. [124] used recycled rubber from used tires instead of pozzolana gravel for the drainage layer in extensive GR, showing a high potential to reduce the heating and cooling loads in buildings compared to traditional materials. Additionally, the replacement of conventional pozzolana gravel (CPG) with recycled rubber crumbs (RRC) led to a significant reduction in acidification, eutrophication, and land occupation.
Within the GRs product descriptions of leading suppliers (www.optigruen.co.uk, accessed 10 July 2021), recycled materials can also be found: for example, 100% recycled synthetic fibers of polypropylene (PP), polyester (PES), and acryl are used for protection, and storage fleeces or drainage elements are made of 100% reclaimed and recycled HDPE. Due to their design (e.g., meander water retention board, FKM 60), these elements of GR are able to store high amounts of water. Hence, they have a high potential to contribute in a positive way to the urban water cycle.
Concerning VGS, Cortes et al. [136] evaluated the performance of expanded cork agglomerate as an eco-friendly alternative to conventional solutions made essentially of plastic and metal components. Results suggested that this solution offers the possibility of optimizing the retention and drainage properties of the system through the selection of the manufactured density to suit local weather conditions, thus achieving water retention of up to 20 kg/m3 and providing rapid drainage of excess water. Furthermore, a better performance is expected in terms of thermal, acoustic, and environmental properties in comparison with conventional materials.
When considering recycled or alternative materials, however, it is important to ensure that they meet the guidelines established for GRs implementation in order to assure quality and security. Many of the reported studies have been carried out at a lab or pilot scale, such that further adjustments may be necessary for full scale implementation. A full LCA should be performed to substantiate the benefits of the alternative materials. Furthermore, when considering recycled and local products, availability should be taken into consideration to fulfill the demands of local industry.
These general considerations for improving the use of resources are becoming more important as it becomes ever clearer that the selection of suitable materials is crucial to reducing the energy and water use in different building stages and, in turn, the overall environmental impact of the building. Selecting raw materials from local sources, and those with low carbon emissions due to their potential to be recycled or reused, are thus part of a larger strategy of sustainability in the built environment.
Manso et al. [122] demonstrated how the integration of sustainability strategies (e.g., use of recycled materials, reduction of embodied energy, industrial waste reuse) into the design of GR and green walls can contribute to a lower environmental impact and therefore make them more competitive solutions. More specifically, this study evaluated the environmental impact of an innovative greening solution (Geogreen) in which the materials and processes of this system had a greater environmental burden and determined how these impacts can be minimized. It identified strategies for reducing by 74% the overall global warming potential (GWP) of the system, and minimizing the overall environmental burden compared to other construction systems.
In contrast to this broad approach, most studies have focused on particular components of building greening systems. Bianchini and Hewage [103] studied the production stage of different polymer applications (virgin and recycled) in the drainage layer of intensive and extensive GR and reported that recycled polymers were recognized as a beneficial alternative. This study determined that there were reduced amounts of nitrogen dioxide (NO2), sulfur dioxide (SO2), ozone (O3), and fine particulate matter (PM10).
Chenani et al. [119] analyzed the production and disposal stages of two extensive GR with comparisons in the (i) substrate layer (expanded clay and crushed brick with compost versus pumice and sand with compost); (ii) drainage layer (recycled polystyrene versus virgin polystyrene); and (iii) retention layer (recycled textile fibers versus Rockwool). Pumice and sand with compost, recycled polystyrene, and recycled textile fibers were recognized as environmentally beneficial alternatives according to the decreased abiotic depletion, acidification, eutrophication, and GWP impacts related to these layers. Vacek et al. [129] evaluated the three environmental impacts of abiotic depletion, acidification, and eutrophication in their study of the soil in the substrate layer and polystyrene in the water-retaining layer compared with artificial hydrophilic mineral wool in these two layers of a GR, and reported that, compared with soil and polystyrene, the use of artificial hydrophilic mineral wool was associated with an increase in environmental impact during the production stage and a decrease in the maintenance stage.
Pushkar [123] conducted an LCA on four types of extensive GRs, replacing natural perlite with the byproducts coal bottom ash and fly ash-based aggregates in both the substrate and drainage layers of GRs, finding that the result depended highly on the byproduct evaluation approach: with the mass allocation approach, this replacement was evaluated as harmful, with increased environmental impacts of approximately 5–20%, but with the system expansion approach, it was evaluated as beneficial, with decreased environmental impacts of approximately 20–40%.
Rincón et al. [124] conducted a comprehensive LCA in which the materials of two extensive GRs were compared with two conventional gravel ballasted flat roofs, with and without polyurethane as a thermal insulation layer, considering the production, construction, operational, and disposal phases—including experimental data on heating and cooling demands. Results showed the large contribution of energy consumption in the operational phase (over 85%) in comparison to the whole life-cycle impact for the existing roofing systems, and the authors concluded that recycled materials, in this case rubber crumbs from out-of-use tires, can be implemented in extensive GRs to improve both the insulation capacity and the environmental properties in Mediterranean continental climate conditions.

3.4. Simulation Case Study

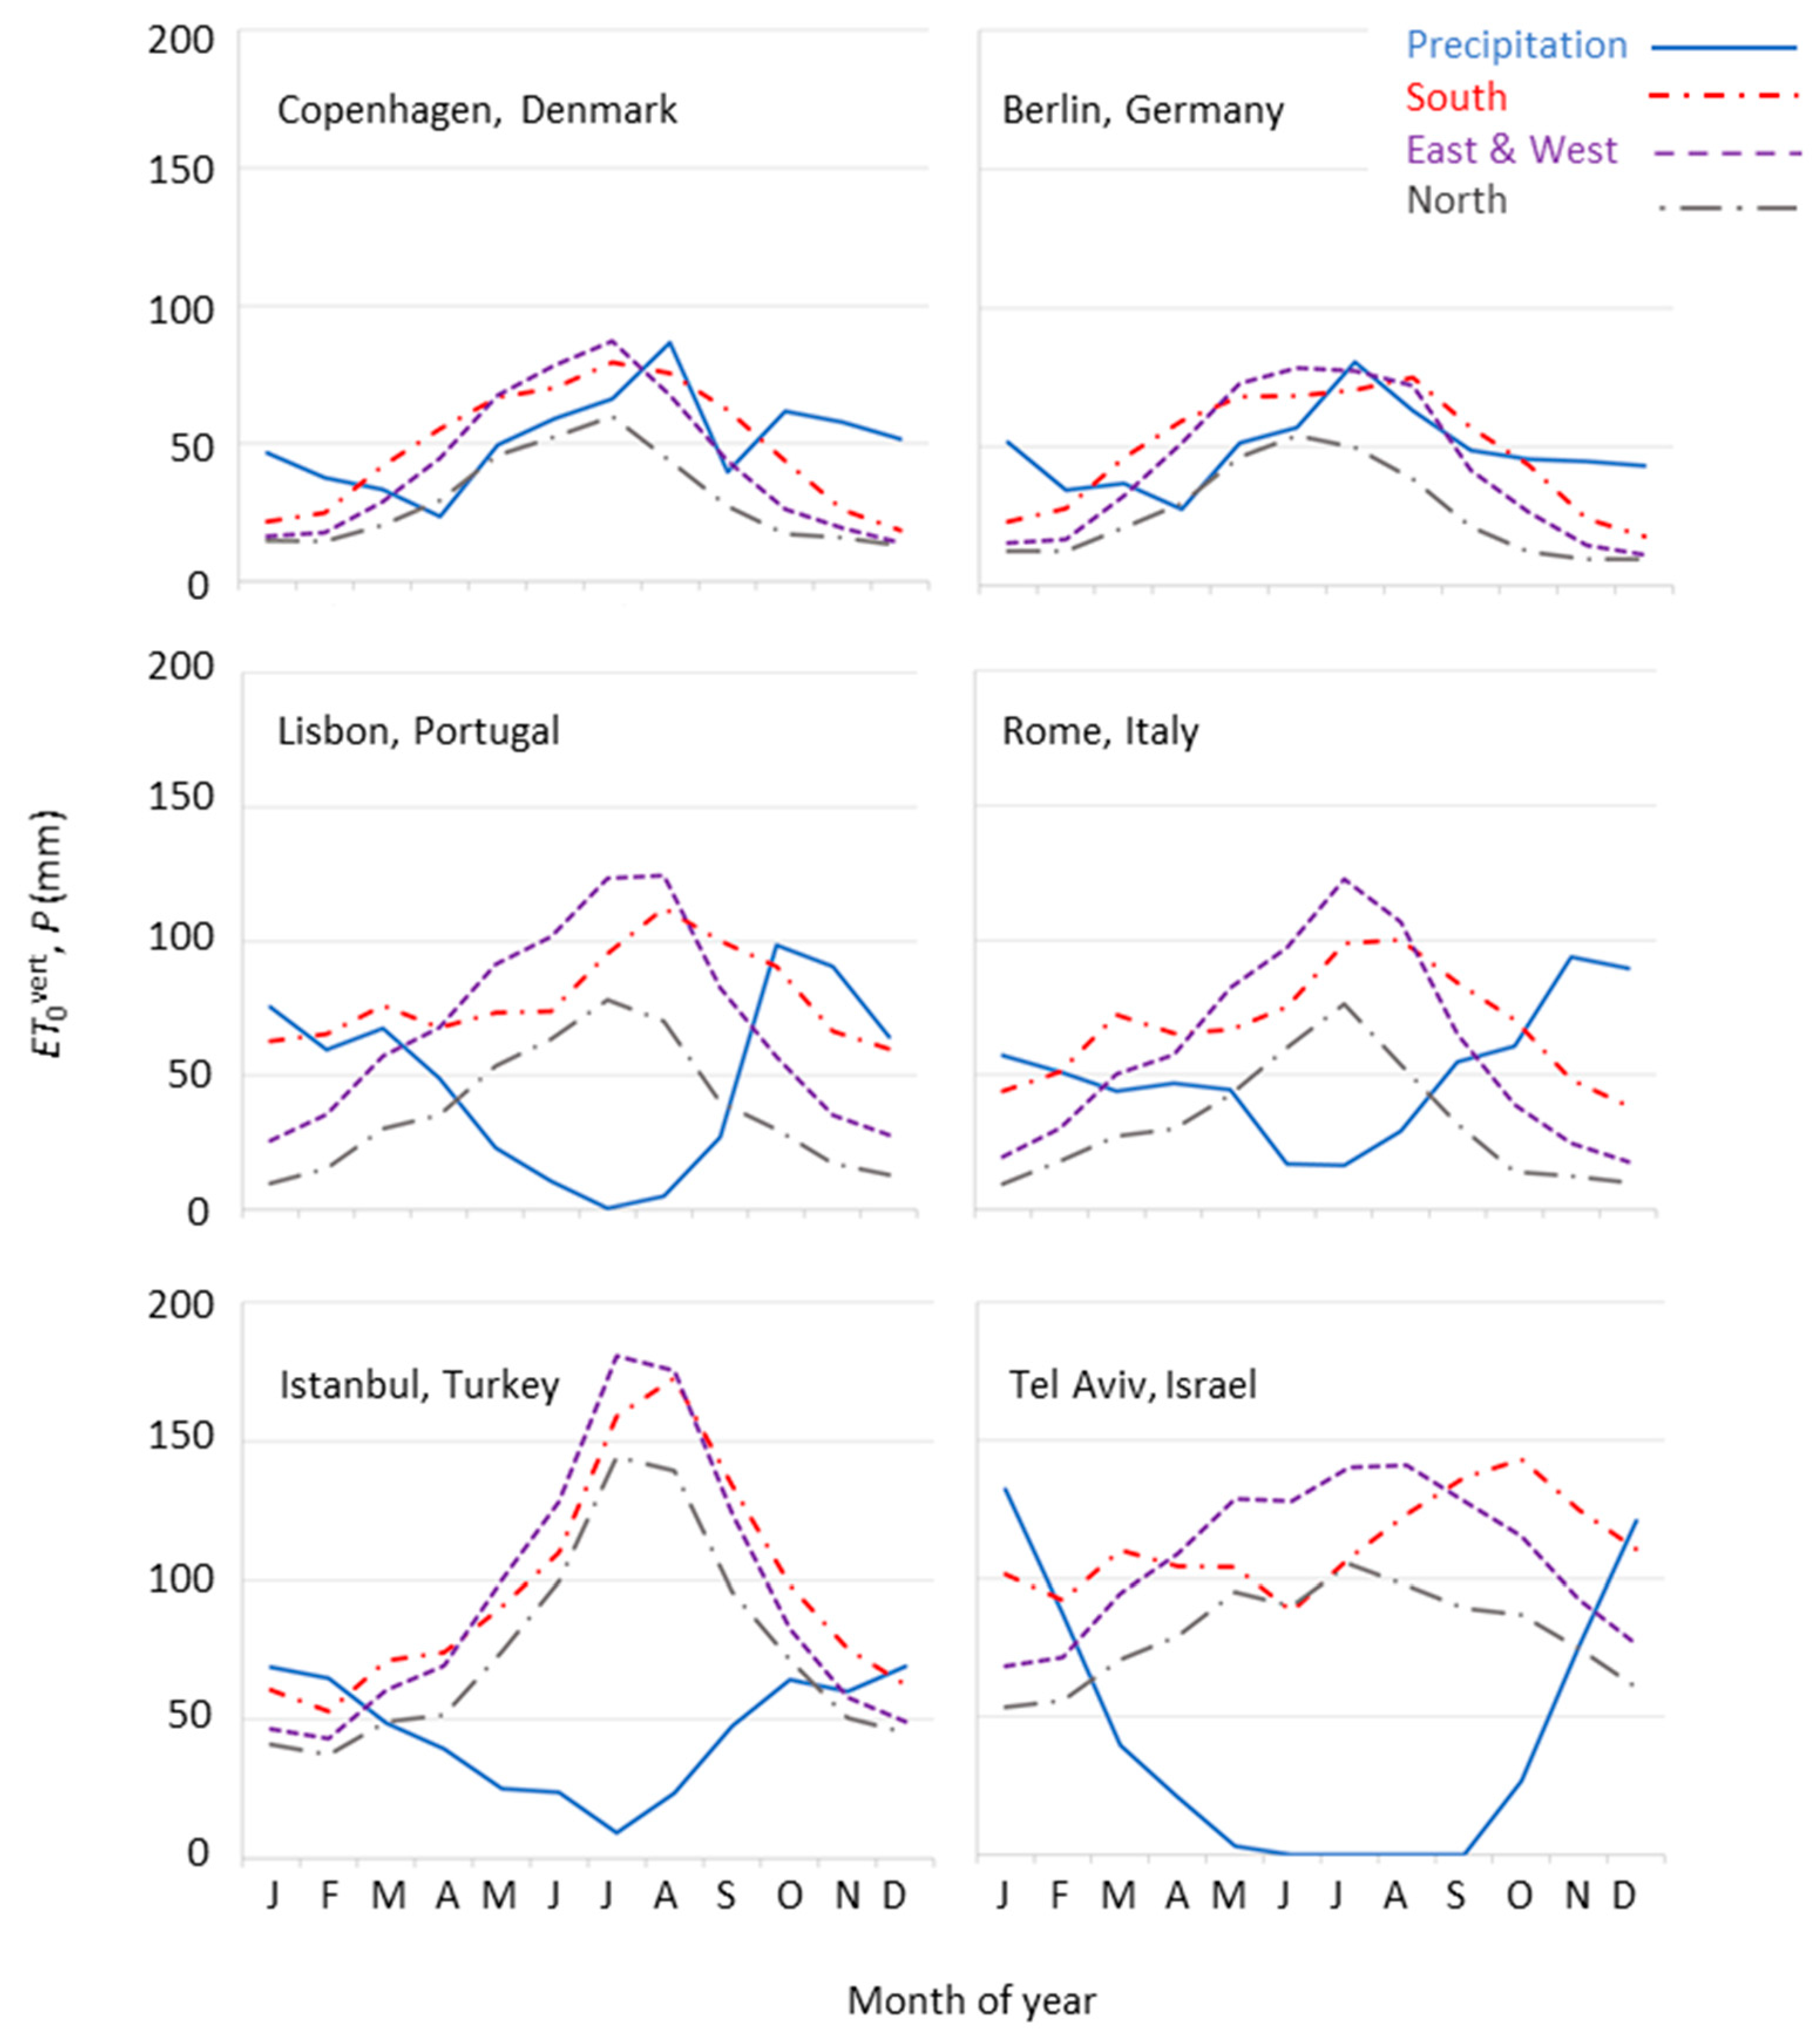
3.4.1. ET0vert and Precipitation

The potential to evaporate water in the different case study cities depends on the climatic drivers and generally increases from north to south. Figure 5 shows the potential evapotranspiration ET0vert for the different locations differentiated by wall orientation and the provided precipitation over the typical year.
In Berlin and Copenhagen, precipitation is provided throughout the year and is in the same order of magnitude as the ET0vert during summer, while providing surplus water during winter. In the other cities, ET0vert is much higher than precipitation during summer for all wall orientations. In Tel Aviv and Lisbon, on average, no precipitation occurs in the summer for four and one month, respectively. In these two cases, but also in Rome and Istanbul, there is a highly negative climatic water balance in the summer months (Figure 5).
Regarding the different wall orientations, southern and eastern and western facades are most promising, in regard to evapotranspiration potential. Northern facades in the northern hemisphere have the lowest exposition to solar radiation and, thus, show the lowest ET0vert. Southern facades show the highest evapotranspiration potential during the winter months, while during the summer, eastern and western facades have the highest ET0vert among all orientations. The higher the elevation of the sun, the lower the amount of incoming solar radiation on the southern facade compared to east and west. This applies for the case study cities over a year, with the effect being more pronounced in the south than in the north.
ET0vert is the potential evapotranspiration, occurring when infinite water is available, considering climatic limitations. It should be noted that the real demand might be lower or higher due to the choice of plant species and maintenance status of selected plants. Furthermore, limitations for the overall greenable area might occur, such as window areas and legal restrictions in the construction e.g., for heritage buildings. Finally, in a realistic setting, radiation as the main driver is influenced by shading of neighboring obstacles. For further analyses, shading simulations can be included in established building simulation tools. In that case, 3D models of buildings are required.

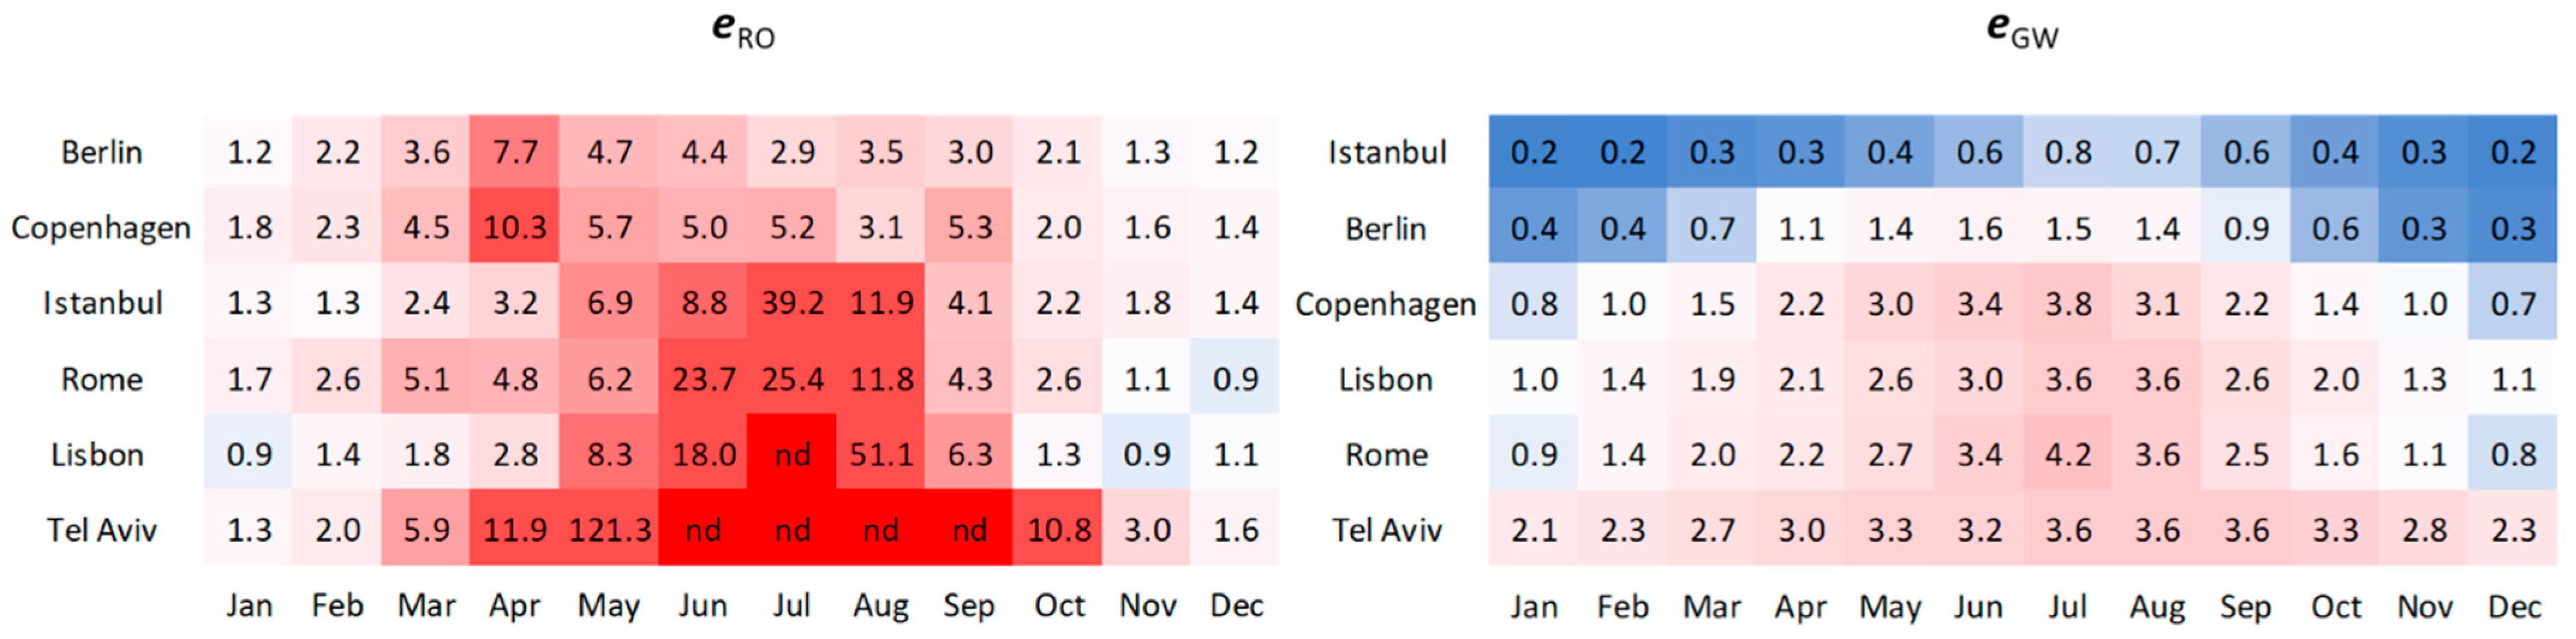
3.4.2. Run-Off Reduction Potentials

While the climate determines ET0vert and P, architecture determines RO from rainwater, its amount compared to the facade area and the amplitude of ET0vert. Thus, the different temporal dynamics of ET0vert and P depicted in Figure 6 are changed substantially when comparing ET0vert and RO. In short, the surplus of water in the winter is hardly detectable while the water shortage in the summer is clearly visible for all cities. The efficiency number eRO intuitively describes how much of the run-off RO can be recirculated to the atmosphere by evapotranspiration of VGS (Figure 6). It is calculated by:
e R O = E T 0 vert   1 P   R C   v h
in which v/h is the relation between the vertical facade area, v (m2) and the horizontal ground area, h (m2) of the case study buildings given in Table 1. The ratio v/h relates eRO to architectural features (i) of the building itself as it determines ground area to facade area, thus collecting to potentially evaporating area; and (ii) its arrangement in the city, which influences the available facade area. The arrangement in the city also determines the orientations of the facades and shading of facade parts (not considered). The different morphologies are represented by the examples from Rome and Copenhagen—three and four facades visible vs. Berlin and Lisbon, with only two facades visible (Figure 2). RC and thus RO depend on the roof typologies. Due to the flat vs. tilted roofs, RO of the case study buildings in Copenhagen and Tel Aviv is higher than that of the buildings in Istanbul and Lisbon, respectively. However, in this study, a constant RC of 0.9 has been applied for comparability reasons. Note, that the static RC concept used in this study has not been developed to analyze water availabilities, but for maximum runoff prediction, thus allowing possible overestimation. Otherwise, an improved rainfall run-off model, using single rainfall events would need to be applied [137].
Generally, eRO < 1 indicates that only a part of the RO can be evaporated by the VGS—a surplus of RO—regarding a fully greened facade and sufficient water supply of the plants. In this case study, even with precipitation being higher than ET0vert for all cities for at least two months, eRO < 1 occurs only for one month in Rome and two months in Lisbon. That demonstrates the strong impact of the architecture, especially v/h for the buildings in this case study.
In contrast, eRO > 1 indicates the potential of the VGS to evapotranspirate more water than available from the building’s own roof—regarding a fully greened facade. In this case, the plants might be exposed to water stress. For most months in the case study cities, there is a virtual deficit regarding RO with the factor being at least 2.8 in the summer. That means, that a greened facade can evaporate the RO from 2–3 similar buildings—or that the greenable fraction of the facade is smaller than 1. Greening only parts of the facade would ensure sufficient irrigation of VGS. The reciprocal of eRO gives the fraction of the facade area that could be greened using RO. Identifying the lowest of these values over the year gives the fraction of the facade, which can be sustainably irrigated (Table 6)—without considering the uncertainties regarding water availability caused by climate change.
In Istanbul, only 3% of the facade could be greened, which would be sufficient to evapotranspirate 9% of RO. In Rome, Copenhagen, and Berlin, 4%, 10%, and 13% of the facade can be greened, which would be sufficient to evaporate 17%, 35%, and 39% of RO. Thus, VGS can reduce the accruing RO and the sewer utilization substantially.
In Tel Aviv and Lisbon, it is not possible to sustainably evaporate RO using VGS due to no-rain in at least one month. The NBS_u intended to evaporate RO would die due to drought stress. In Tel Aviv and Istanbul, this dilemma can be solved by (i) decreasing the greened fraction of the facade and increasing the storage volume to export RO from one month to the other; or by (ii) adding water from other resources. Storage capacity is not in the scope of this article; here, we only assume that the water from one month can be stored to be used for irrigation in the same month. Regarding the use of other water resources for VGS irrigation, because of ethical scruples, scarcity, and the high embodied energy, irrigating with tap water should be the last option. Instead, greywater is a promising resource to be used. It will be discussed in the following.

3.4.3. Greywater Management Potentials

Equivalent to eRO, eGW describes how much of the accruing greywater GW can be recirculated to the atmosphere by evapotranspiration of VGS. It is calculated by:
e GW = E T 0 vert   1   G W i   O   m   v h
in which GWi is the individual greywater production rate per capita (L/inh d), O is the building occupancy per building ground area (inh/m2), and m is the number of days per month Figure 6).
Note that this study focuses on residential buildings and e.g., buildings of mixed use or office buildings have different GW production patterns.

3.4.4. Optimized RO-Irrigation Scenario

Using GW for irrigation during the drought season or for additional irrigation during the year enables VGS in Lisbon and Tel Aviv in the first place and increases the fraction of the facade that can be greened in the other cities. Adding GW also increases the evapotranspiration of RO if it is used with priority (optimized RO-irrigation scenario in Table 6). Doing so in Istanbul, Rome, Berlin, and Copenhagen, the fraction of facade which can be greened increases by the factor of 33, 6, 5, and 2.6, respectively. Applying GW just to fill up RO deficits in Istanbul allows to green already 100% of the facade and to evapotranspirate 100% of RO, while 30% of the accruing GW are used (see Table 6). Both Berlin and Copenhagen have suffered from cloudbursts in the last 10 years. Additional GW application allows to green 64% and 26% of the facades of the model buildings in the two cities which would increase the fraction of evaporation of RO to 95% and 79%, respectively. In terms of rainwater management and pluvial flooding prevention, which is an interesting aspect for decentralized actions in growing and densifying cities.
Compared to RO, GW is available in larger quantities for the case study cities, with less fluctuation over the year, which is expected to be of increasing relevance, keeping in mind climate change and the predicted increase in droughts. However, GW also fluctuates over time. Peaks in GW production is apparent in the morning and evening hours and variations in GW quantity can be detected in between seasons [138]. Additionally, it can be expected that fluctuations occur because of vacation seasons, different cool showering and warming bathtub using frequencies in summer and winter and special GW production patterns in flats used for touristic short-term housing. Furthermore, the accruing amounts depend on the actual occupancy of the buildings. In this study we employed average values for occupancy representative for the whole district and average individual grey water production rates. Thus, the variation of GW over the week, the month, and the year is underestimated here.

3.4.5. Full Greywater and Run-Off Irrigation Scenario

When the full GW amount is used to irrigate VGS, the fraction of the facade which can be greened sustainably increases again (except for Lisbon and Tel Aviv) and is limited by the month with the lowest sum of RO and GW. For Rome, the increase is marginal, which is due to the limiting water availability. For the other cities, applying the full amount of GW makes sense in terms of GW management but also for further RO evaporation (Table 6). In Istanbul and Berlin, thus, the full amount of RO can be evaporated.
In Istanbul, due to the high amount of available GW, which is a result of the high occupancy, more than the facade area (136%) can be greened. For the Berlin case, the greened fraction of the facade could be increased to 87%. In Copenhagen, the greened area could almost be doubled to 46 % of the facade. Thereby, the evaporated water equals 92% of the run-off. In Rome, the greened area could slightly be increased to 28% when compared to an irrigation regime where GW is only applied in times of drought season. In the cases of Lisbon and Tel-Aviv, the fraction of greened facade could not be raised further above 28% in the third irrigation scenario. As both cities have months with no precipitation, the amount of applicable GW is the limiting factor in both the second and third irrigation scenarios.

4. Discussion

The presented results from the literature and the simulation study indicate existing gaps in knowledge as well as applied policies.

4.1. Simulation Case Study

The chosen case study examples show that, based on the climate, architecture, and occupancy, it is generally suitable to include VGS in run-off and greywater management. The climatic conditions, in particular solar radiation as the basic driver, shapes the overall water management potential in each city. However, the examples showed that the architecture can overrule the climatic conditions as it determines the greenable area and v/h strongly influences RO/ET. What has further been presented is that greywater use for irrigation is advisable. It therefore should not be hindered by high investment costs for its collection and diversion system. When greywater is added to the irrigation regime that has prioritized run-off, the RO management rate can be raised as greywater outbalances deficits that would otherwise lead to water stress in the applied plants. A surplus in RO and greywater can either be drained or treated on-site and then recirculated to be used in the building, e.g., for toilet flushing.
There are three factors that limit sustainable rainwater management: (i) shortage of rainwater during the year, which limits NBS_u; (ii) shortage of greywater compared to rainwater in the rainy season; and (iii) shortage of space to be greened compared to occupancy and greywater production. They should motivate planners to seek quarter-oriented (instead of single building-oriented) solutions. VGS implementation can serve as a systemic solution integrated into the quarter management, as one facade has high potential to evaporate water from neighboring buildings. Exporting space or water resources from one building to the other or to horizontal green areas, such as GRs, could be an option to optimize the system, e.g., regarding pluvial flooding, mixed sewer overflows, and eutrophication in the quarter and watershed, respectively. With the simple, ground area, vertical area, and occupancy-based description of the buildings, we delivered an effective upscaling approach for neighborhoods, quarters, and districts.

4.2. Structural Issues

Several issues could arise from implementing GRs and VGS in existing buildings, such as structural issues, deficient performance, and EoL-time disposal [102]. Most buildings have load restrictions, especially older buildings with roofs that were not intentionally constructed to accommodate NBS_u. Accordingly, it is important to keep the weight of the GR (especially the substrates) as low as possible in order to avoid damaging the structure and its usability. It is important to note that GRs do not have to cause leakage problems, instead, protect the roof and its water-proof membrane from damage [102,139,140]. We highlight that the knowledge required to avoid these structural problems already exists, and should be implemented. This can be done, for example, by considering the roof slope [141], which can go up to 30° for the installation of the lightweight extensive GR [142], while ensuring a minimum slope of 2% in order to drain the excessive rainwater [143].

4.3. Ecosystem (Dis)Services

Although the provision of ecosystem services by NBS_u is substantial, knowledge gaps are still found in the quantification of the more intangible benefits of GRs and VGS, namely the gains in quality of life and well-being, for which interviews can be used [142]. There is especially a lack of research on the quantitative and qualitative benefits of ecosystem services in under-developed countries [144], an area where further research should be focused on.
Compared to the provision of ecosystem services, research on ecosystem disservices (ecosystem outputs that diminish human well-being, caused by NBS_u) is relatively scarce [145,146,147]. Open questions include fire-resistance in VGS [148], the quality of runoff water from GR [149,150,151], and air quality effects [152,153,154].
In humid weather, the adoption of GRs has the perceived disservice of attracting mosquitoes, though this risk is less than in gardens with open water bodies [155]. GRs can attract birds to the city, and while this could theoretically increase the chances for disease transfer to humans, such a risk has not been reported thus far [156]. Possible approaches to these issues may arise from existing strategies that have been adopted in parks and natural reserves [157,158].

4.4. Future-Proof NBS Units

An effort to adapt NBS_u to current and local climate conditions is being done by adapting the vegetation and substrate of GRs [102] and VGS [142]. Still, knowledge gaps can be identified regarding the impacts of seasonal climate variations on thermal performance of GRs and the evaluation of substrate vulnerability to wind erosion and heavy storm events. More critically, the long-term functioning of such NBS_u is seldom addressed. One way to do so is to quantify how each unit responds to stress, induced by water deficit, heat waves, and extreme weather phenomena. The resistance and resilience to stress of NBS_u can be evaluated by their capacity to resist change and their capacity to return to their functioning after the stress has induced a change. It can be assumed that those sufficiently irrigated are more resistant to water stress than non-irrigated NBS_u. When water stress is intense or long enough, plant selection, based on water need, is important. When not irrigated (or not regularly irrigated), units, such as extensive GRs or ground based green facades, are more likely to recover (e.g., roots in the soil can keep the plant alive, while species in extensive GRs can more easily recover from seed). However, there is very little empirical evidence of this, which limits generalizations, mostly because climate change is an ongoing process and there has been a limited exposure of NBS_u to it. Most knowledge on this topic is derived from natural and semi-natural ecosystems [159], with some general patterns emerging that can be applied to urban NBS_u, namely that NBS_u are more affected by extreme phenomena than by average values (e.g., longer heat waves, rather than increased average temperatures) and that multiple stresses are often associated to cause a change (e.g., a vertical wall can resist a heat-wave or a prolonged drought separately but not when they co-occur). One option for future research is to look for solutions that currently work in drier climates. This should include investigations on how xerophytic species perform under a Mediterranean climate type, to forecast the future response in other regions under climate change [160]. Further research on the resistance and resilience of GRs and VGS under climate change can provide guidelines on how to future-proof the functioning of those NBS_u in cities.

4.5. Policy Framework

Government regulations or incentives for implementing NBS_u in urban areas are diverse and differ between countries and between cities in the same country, and depend on the type of building ownership (private vs. public), age of building, and building area, among others. This dispersion can limit the application of GRs and VGS, which greatly depend on policy regulation for both financial and technical support [102,116,142,161].
To provide support to those interested in implementation, web-based solutions that aggregate information are of importance (e.g., https://www.greenroofs.pt/en/policy-map, accessed on 7 October 2021). Nevertheless, countries and municipalities can be limited in developing and applying appropriate legal rules and incentives due to their poor governance, low socioeconomic status, and less developed local market, as well as lack of clear guidelines in relation to project approval [162]. Moreover, unclear structural capability in case of renovation, collective ownership, and co-financing might become a legal limitation in case of GRs or VGS installation. Depending on the technology level used, costs of installation of GRs or VGS might become burdensome. In that case, investments by private owners are difficult to achieve. Accordingly, each country should select the most appropriate incentive policies and define them depending on their national and local conditions [161].
One way to overcome policy limitations when implementing NBS_u can be to reinforce the integration of NBS_u in building designs, which is already contemplated in the energy performance of building directives, to help improve the energy efficiency of buildings and reduce heating or cooling consumption. This could further help to achieve the circularity and decarbonized objectives, from a building perspective, by 2050. Technical solutions to integrate greywater and rainwater in the water management on a building scale are available and support a sustainable operation of GRs and VGS. Greywater and rainwater therefore need to be recognized and addressed in policies, as locally available resources, and distinguished from other often higher loaded streams of wastewater. In order to reduce pressure on freshwater systems, centralized energy, space-intensive water purification, and transport infrastructure, implementation of decentralized systems should be encouraged.
In order to enable circular urban processes in the built environment through NBS_u and by closing the local water cycles, moving forward to a more comprehensive evaluation of the climate change impact of buildings during their design, construction, and use will be key to performance in a carbon-neutral European (and worldwide) society and economy in the years leading up to 2050.
While the policy dimension to increase the use of NBS_u could benefit from further integration with ecosystem services [161], another future aim is to focus on the sustainable energy performance of buildings directive of the EU, which should be updated and contemplated in the new framework assessment and EU guidelines (various levels) as a method to enhance the circularity-related performance of buildings.

5. Conclusions

Water issues were dealt with extensively in this manuscript; moreover, water is identified as one of the major limitations in the implementation of the selected NBS_u. This leads to the introduction of the “wicked water problem”, which needs to be addressed by a shift in the water use paradigm. The total water footprint of a system is comprised of the virtual water embodied in each individual component during its production cycle, and the irrigation water demand. The total sum needs to be respected when discussing the need for water reuse practices, as the virtual water needed is often neglected in LCA studies of GRs and VGS.
In fact, water could represent a common ground to measure most of the issues found. More specifically, we propose that water consumption, measured in terms of its equivalent energy consumption (or carbon emissions, to account for energy sources across countries), can be accounted in the entire life-cycle of the NBS_u, and included in its LCA.
Our case study demonstrates that the net water consumption of an NBS_u can be a powerful indicator of its “circular” performance, and in turn, its ability to contribute to the wicked problem of urban water. In particular, we offer the following conclusions, which advance the current state of knowledge in this realm:
  • Based on the results obtained from a broad cross-section of cities in Europe, a vertical greening system could be a realistic option to manage on-site greywater and utilize rainwater captured on the roof of a typical residential building.
  • The effectiveness of VGS for these purposes can only be understood based on the particular climate conditions of the urban site, most notably as a function of solar exposure that heavily impacts the water loss due to evapotranspiration.
  • The potential of VGS must be evaluated with respect to the architectural design of a building, which can limit the vertical area that can absorb and evaporate water, as well as the horizontal area available for rainwater capture.
  • The use of greywater for irrigation was shown to have clear benefits, as it can fill in deficits in available rainwater runoff, which would otherwise induce stress in the plants and potentially make VGS untenable. Therefore, policies should encourage and incentivize the on-site collection and distribution of greywater.
  • The sustainability of water management, using circular systems, depends on the scale, and our findings reveal limitations in implementation within the scope of a single building, due to the available quantities of both runoff and greywater, and the relative area of VGS. Therefore, it is essential to consider this type of nature-based solution at the larger urban scale of a residential quarter, for instance, where mutual benefits can be made by sharing space or water from one building to other buildings, as well as outdoor green spaces in the vicinity.
  • Considering the different possibilities of implementation, our case study results represent new approaches to more integrative urban settings, when compared to traditional building-based solutions.

Supplementary Materials

The following are available online at https://www.mdpi.com/article/10.3390/w13162165/s1, Tables S1–S3.

Author Contributions

Conceptualization, A.G., B.P., C.S.C.C., D.P., D.M., J.A.C.C., K.A.H., M.C.G.M., M.B.A., P.P., T.N. and V.G.; methodology, A.G., C.S.C.C., K.A.H. and T.N.; software, K.A.H. and T.N.; validation, T.N.; formal analysis, B.B., D.M., E.G., J.A.C.C. and T.N.; investigation, A.G., B.B., D.M., J.A.C.C., K.A.H., M.C.G.M., M.O., S.D.L. and T.N.; resources, D.T., K.A.H., M.B.A., M.O. and T.N.; data curation, A.G., A.S., B.B., K.A.H. and T.N.; writing—original draft preparation, A.K., A.P., A.G., A.A., A.T., B.P., B.B., C.S.C.C., D.P., D.T., D.M., E.G., J.A.C.C., J.F., K.A.H., M.C.G.M., M.B.A., M.F., M.M., P.P., S.D.L., T.N. and U.P.; writing—review and editing, A.G., A.S., A.A., A.T., B.P., C.S.C.C., D.P., D.T., D.M., E.G., G.B., J.A.C.C., K.A.H., M.C.G.M., M.B.A., M.F., P.P., S.D.L., T.N. and V.G.; visualization, A.S., D.T., J.A.C.C., K.A.H. and T.N.; project administration, K.A.H. and T.N.; funding acquisition, T.N. All authors have read and agreed to the published version of the manuscript.

Funding

The APC was funded by the COST Action CA17133.

Institutional Review Board Statement

Not applicable.

Informed Consent Statement

Not applicable.

Data Availability Statement

Data are contained within the article.

Acknowledgments

The work was carried out within the COST Action CA17133 Circular City (“Implementing nature-based solutions for creating a resourceful circular city”, http://www.circular-city.eu, duration 22 October 2018–21 October 2022). COST Action is funded within EU Horizon Programmes. The authors are grateful for the support. Pucher B. is part of the Doctoral School HR21 (BOKU University, Vienna, Austria) and their support is appreciated. Fonseca M. thanks her research contract funded by Fundação para a Ciência e Tecnologia (FCT) and project CENTRO-04-3559-FSE-000095-Centro Portugal Regional Operational Programme (Centro2020), under the PORTUGAL 2020 Partnership Agreement, through the European Regional Development Fund (ERDF). Calheiros C. is thankful to FCT within the scope of UIDB/04423/2020 and UIDP/04423/2020. Pinho P. is thankful to FCT within the scope of UIDB/00329/2020 and 2020.03415.CEECIND. Hoffmann K, Pitha U, and Pucher B acknowledge the support of the project “Urban Vertical Greening 2.0: Vertical greening for livable cities—co-create innovation for the breakthrough of an old concept” under the SUGI-FWE Nexus JPI Urban Europe, grant number 16485002. The part of Hoffmann K is financially supported by the German Federal Ministry of Education and Research BMBF (FKZ: 01LF1803A).

Conflicts of Interest

The authors declare no conflict of interest.

References

  1. UNESCO. Managing water under uncertaintly and risk. In The United Nations Worls Water Development Report 4; UNESCO: Paris, France, 2012; Volume 1, ISBN 978-92-3-104235-5. [Google Scholar]
  2. UNESCO. The United Nations World Water Development Report 2018: Nature-Based Solutions for Water; UNESCO: Paris, France, 2018; ISBN 9789231002649. [Google Scholar]
  3. Pradhan, S.; Al-Ghamdi, S.G.; Mackey, H.R. Greywater recycling in buildings using living walls and green roofs: A review of the applicability and challenges. Sci. Total Environ. 2019, 652, 330–344. [Google Scholar] [CrossRef] [PubMed]
  4. Kisser, J.; Wirth, M.; De Gusseme, B.; Van Eekert, M.; Zeeman, G.; Schoenborn, A.; Vinnerås, B.; Finger, D.C.; Kolbl Repinc, S.; Bulc, T.G.; et al. A review of nature-based solutions for resource recovery in cities. Blue-Green Syst. 2020, 2, 138–172. [Google Scholar] [CrossRef] [Green Version]
  5. Oral, H.V.; Carvalho, P.; Gajewska, M.; Ursino, N.; Masi, F.; van Hullebusch, E.D.; Kazak, J.K.; Exposito, A.; Cipolletta, G.; Andersen, T.R.; et al. A review of nature-based solutions for urban water management in European circular cities: A critical assessment based on case studies and literature. Blue-Green Syst. 2020, 2, 112–136. [Google Scholar] [CrossRef] [Green Version]
  6. Gräf, M.; Immitzer, M.; Hietz, P.; Stangl, R. Water-stressed plants do not cool: Leaf surface temperature of living wall plants under drought stress. Sustainability 2021, 13, 3910. [Google Scholar] [CrossRef]
  7. Castellar, J.A.C.; Popartan, L.A.; Pueyo-Ros, J.; Atanasova, N.; Langergraber, G.; Säumel, I.; Corominas, L.; Comas, J.; Acuña, V. Nature-based solutions in the urban context: Terminology, classification and scoring for urban challenges and ecosystem services. Sci. Total Environ. 2021, 779, 146237. [Google Scholar] [CrossRef]
  8. Atanasova, N.; Castellar, J.A.C.; Pineda-Martos, R.; Nika, C.E.; Katsou, E.; Istenič, D.; Pucher, B.; Andreucci, M.B.; Langergraber, G. Nature-based solutions and circularity in cities. Circ. Econ. Sustain. 2021, 1, 319–332. [Google Scholar] [CrossRef]
  9. Langergraber, G.; Castellar, J.A.C.; Pucher, B.; Baganz, G.; Milosevic, D.; Andreucci, M.B.; Kearny, K.; Pineda-Martos, R.; Atanasova, N. A framework for addressing circularity challenges in cities with nature-based solutions. Water 2021, submitted. [Google Scholar]
  10. Pearlmutter, D.; Theochari, D.; Nehls, T.; Pinho, P.; Piro, P.; Korolova, A.; Papaefthimiou, S.; Mateo, M.C.G.; Calheiros, C.; Zluwa, I.; et al. Enhancing the circular economy with nature-based solutions in the built urban environment: Green building materials, systems and sites. Blue-Green Syst. 2020, 2, 46–72. [Google Scholar] [CrossRef] [Green Version]
  11. Langergraber, G.; Pucher, B.; Simperler, L.; Kisser, J.; Katsou, E.; Buehler, D.; Mateo, M.C.G.; Atanasova, N. Implementing nature-based solutions for creating a resourceful circular city. Blue-Green Syst. 2020, 2, 173–185. [Google Scholar] [CrossRef]
  12. Castellar Da Cunha, J.A.; Arias, C.A.; Carvalho, P.; Rysulova, M.; Canals, J.M.; Perez, G.; Gonzalez, M.B.; Morató, J.F. “Wetwall”-an innovative design concept for the treatment of wastewater at an urban scale. Desalin. Water Treat. 2018, 109, 205–220. [Google Scholar] [CrossRef] [Green Version]
  13. Boano, F.; Caruso, A.; Costamagna, E.; Ridolfi, L.; Fiore, S.; Demichelis, F.; Galvão, A.; Pisoeiro, J.; Rizzo, A.; Masi, F. A review of nature-based solutions for greywater treatment: Applications, hydraulic design, and environmental benefits. Sci. Total Environ. 2020, 711, 134731. [Google Scholar] [CrossRef] [PubMed]
  14. Prenner, F.; Pucher, B.; Zluwa, I.; Pitha, U.; Langergraber, G. Rainwater Use for Vertical Greenery Systems: Development of a Conceptual Model for a Better Understanding of Processes and Influencing Factors. Water 2021, 13, 1860. [Google Scholar] [CrossRef]
  15. Nika, C.E.; Gusmaroli, L.; Ghafourian, M.; Atanasova, N.; Buttiglieri, G.; Katsou, E. Nature-based solutions as enablers of circularity in water systems: A review on assessment methodologies, tools and indicators. Water Res. 2020, 183, 115988. [Google Scholar] [CrossRef] [PubMed]
  16. Mendez, C.B.; Afshar, B.R.; Kinney, K. Effect of Roof Material on Water Quality for Rainwater Harvesting Systems; Texas Water Development Board: Austin, TX, USA, 2010. [Google Scholar]
  17. Gikas, G.D.; Tsihrintzis, V.A. Assessment of water quality of first-flush roof runoff and harvested rainwater. J. Hydrol. 2012, 466–467, 115–126. [Google Scholar] [CrossRef]
  18. Amin, M.T.; Kim, T.; Amin, M.N.; Han, M.Y. Effects of catchment, first-flush, storage conditions, and time on microbial quality in rainwater harvesting systems. Water Environ. Res. 2013, 85, 2317–2329. [Google Scholar] [CrossRef]
  19. Allen, R.; Pereira, L.; Raes, D.; Smith, M. FAO Irrigation and Drainage Paper No. 56: Crop Evapotranspiration; FAO: Rome, Italy, 1998. [Google Scholar]
  20. Saad, R. Modelling the Water Demand of Urban Vertical Green Based on Remote Climate Station Data. Master’s Thesis, Technical University, Berlin, Germany, 2020. [Google Scholar]
  21. Perez, R.; Stewart, R.; Arbogast, C.; Seals, R.; Scott, J. An anisotropic hourly diffuse radiation model for sloping surfaces: Description, performance validation, site dependency evaluation. Sol. Energy 1986, 36, 481–497. [Google Scholar] [CrossRef]
  22. Hoffmann, K.A.; Šuklje, T.; Kozamernik, J.; Nehls, T. Modelling the cooling energy saving potential of facade greening in summer for a set of building typologies in mid-latitudes. Energy Build. 2021, 238, 110816. [Google Scholar] [CrossRef]
  23. CAP. Copenhagen Climate Adaptation Plan. Available online: https://en.klimatilpasning.dk/media/568851/copenhagen_adaption_plan.pdf (accessed on 26 May 2021).
  24. Bİcan, N.B. A New methodology for analysis of spatial interventions towards sustainability in social housing regeneration–the case of gyldenrisparken in Copenhagen. Metu J. Fac. Archit. 2020, 37, 35–58. [Google Scholar]
  25. Foteinaki, K.; Li, R.; Heller, A.; Rode, C. Heating system energy flexibility of low-energy residential buildings. Energy Build. 2018, 180, 95–108. [Google Scholar] [CrossRef]
  26. Dugord, P.A.; Lauf, S.; Schuster, C.; Kleinschmit, B. Land use patterns, temperature distribution, and potential heat stress risk-The case study Berlin, Germany. Comput. Environ. Urban. Syst. 2014, 48, 86–98. [Google Scholar] [CrossRef]
  27. SDUD Senate Department of Urban Development (SDUD): Flächennutzung und Stadtstruktur, Dokumentation der Kartiereinheiten und Aktualisierung des Datenbestandes, Edition 2015. Available online: http://www.stadtentwicklung.berlin.de (accessed on 26 May 2021).
  28. Buchin, O.; Jänicke, B.; Meier, F.; Scherer, D.; Ziegler, F. The role of building models in the evaluation of heat-related risks. Nat. Hazards Earth Syst. Sci. 2016, 16, 963–976. [Google Scholar] [CrossRef] [Green Version]
  29. Lopes, A.; Oliveira, A.; Marias, M.; Correia, E. Identificação das Ilhas de Calor Urbano e Simulação Para as Áreas Críticas da Cidade de Lisboa; Câmara Municipal De Lisboa: Lisboa, Portugal, 2020. (In Portuguese) [Google Scholar]
  30. Morais, L.F.L. Revitalização da Baixa Pombalina: Proposta de Humanização. Master’s Thesis, Instituto Superior Técnico, Universidade de Lisboa, Lisboa, Portugal, 2015. (In Portuguese). [Google Scholar]
  31. Miranda, F. Caracterisação dos Edifícios Pombalinos. Master’s Thesis, Faculdade de Ciências e Tecnologia, Almada, Portugal, 2011. (In Portuguese). [Google Scholar]
  32. Rome Municipality Struttura, Natalità, Mortalità, Incremento-2019. Città Metropolitana di Roma Capitale-Dipartimento Programmazione e Attuazione Urbanistica. Available online: https://www.comune.roma.it/web-resources/cms/documents/01_Municipio_pop_2019.pdf (accessed on 26 May 2021).
  33. Marando, F.; Salvatori, E.; Sebastiani, A.; Fusaro, L.; Manes, F. Regulating ecosystem services and green infrastructure: Assessment of urban heat island effect mitigation in the municipality of Rome, Italy. Ecol. Modell. 2019, 392, 92–102. [Google Scholar] [CrossRef]
  34. Rome Municipality PRG Adottato—G2 Guida per la Qualità Degli Interventi. Città Metropolitana di Roma Capitale-Dipartimento Programmazione e Attuazione Urbanistica. Available online: http://www.urbanistica.comune.roma.it/prg-adottato/prg-adottato-elaborati-gestionali/prg-adottato-g2.html (accessed on 26 May 2021).
  35. Ünal, Y.S.; Sonuç, C.Y.; Incecik, S.; Topcu, H.S.; Diren-Üstün, D.H.; Temizöz, H.P. Investigating urban heat island intensity in Istanbul. Theor. Appl. Climatol. 2020, 139, 175–190. [Google Scholar] [CrossRef]
  36. TKGM. General Directorate of Land Registry and Cadastre of Turkey Parcel Details (Tapu ve Kadastro Genel Müdürlüğü Parsel Sorgulama). Available online: https://parselsorgu.tkgm.gov.tr (accessed on 11 March 2021).
  37. Welter, V.M. The 1925 master plan for Tel-aviv by patrick geddes. Isr. Stud. 2009, 14, 94–119. [Google Scholar] [CrossRef]
  38. Arnfield, A.J. Two decades of urban climate research: A review of turbulence, exchanges of energy and water, and the urban heat island. Int. J. Climatol. 2003, 23, 1–26. [Google Scholar] [CrossRef]
  39. Stewart, I.D. A systematic review and scientific critique of methodology in modern urban heat island literature. Int. J. Climatol. 2011, 31, 200–217. [Google Scholar] [CrossRef]
  40. Cristiano, E.; Deidda, R.; Viola, F. The role of green roofs in urban Water-Energy-Food-Ecosystem nexus: A review. Sci. Total Environ. 2021, 756, 143876. [Google Scholar] [CrossRef]
  41. Gabriel, K.M.A.; Endlicher, W.R. Urban and rural mortality rates during heat waves in Berlin and Brandenburg, Germany. Environ. Pollut. 2011, 159, 2044–2050. [Google Scholar] [CrossRef]
  42. Martins, A.M.T.; de Campos, I.D. From the horizontal garden to the vertical garden: An architectural and environmental perspective of the “Green” element. IOP Conf. Ser. Mater. Sci. Eng. 2019, 471, 072022. [Google Scholar] [CrossRef]
  43. Pérez, G.; Coma, J.; Martorell, I.; Cabeza, L.F. Vertical Greenery Systems (VGS) for energy saving in buildings: A review. Renew. Sustain. Energy Rev. 2014, 39, 139–165. [Google Scholar] [CrossRef] [Green Version]
  44. Santamouris, M.; Ding, L.; Fiorito, F.; Oldfield, P.; Osmond, P.; Paolini, R.; Prasad, D.; Synnefa, A. Passive and active cooling for the outdoor built environment–Analysis and assessment of the cooling potential of mitigation tecnologies using performance data from 220 large scale projects. Sol. Energy 2017, 154, 14–33. [Google Scholar] [CrossRef]
  45. Water as a Key Resource in Sustainable Development. Available online: http://www.un-documents.net/harare-1.htm (accessed on 26 May 2021).
  46. Radić, M.; Dodig, M.B.; Auer, T. Green facades and living walls-A review establishing the classification of construction types and mapping the benefits. Sustainability 2019, 11, 4579. [Google Scholar] [CrossRef] [Green Version]
  47. Sheweka, S.; Magdy, N. The living walls as an approach for a healthy urban environment. Energy Procedia 2011, 6, 592–599. [Google Scholar] [CrossRef] [Green Version]
  48. Sánchez-Reséndiz, J.A.; Ruiz-García, L.; Olivieri, F.; Ventura-Ramos, E. Experimental assessment of the thermal behavior of a living wall system in semi-arid environments of central Mexico. Energy Build. 2018, 174, 31–43. [Google Scholar] [CrossRef]
  49. Quinn, R.; Melville-Shreeve, P.; Butler, D.; Stovin, V. A Critical evaluation of the water supply and stormwater management performance of retrofittable domestic rainwater harvesting systems. Water 2020, 12, 1184. [Google Scholar] [CrossRef] [Green Version]
  50. Molaei, O.; Kouchakzadeh, M.; Fashi, F.H. Evaluation of rainwater harvesting performance for water supply in cities with cold and semi-arid climate. Water Supply 2019, 19, 1322–1329. [Google Scholar] [CrossRef] [Green Version]
  51. Gross, A.; Azulai, N.; Oron, G.; Arnold, M.; Nejidat, A.; Ronen, Z. Environmental impact and health risks associated with greywater irrigation: A case study. Water Sci. Technol. 2005, 52, 161–169. [Google Scholar] [CrossRef]
  52. Boyjoo, Y.; Pareek, V.K.; Ang, M. A review of greywater characteristics and treatment processes. Water Sci. Technol. 2013, 67, 1403–1424. [Google Scholar] [CrossRef]
  53. Oteng-Peprah, M.; Acheampong, M.A.; DeVries, N.K. Greywater characteristics, treatment systems, reuse strategies and user perception—A review. Water Air Soil Pollut. 2018, 229, 255. [Google Scholar] [CrossRef] [Green Version]
  54. Oviedo-Ocaña, E.R.; Dominguez, I.; Ward, S.; Rivera-Sanchez, M.L.; Zaraza-Peña, J.M. Financial feasibility of end-user designed rainwater harvesting and greywater reuse systems for high water use households. Environ. Sci. Pollut. Res. 2018, 25, 19200–19216. [Google Scholar] [CrossRef] [Green Version]
  55. Oldenburg, M.; Peter-Fröhlich, A.; Dlabacs, C.; Pawlowski, L.; Bonhomme, A. EU demonstration project for separate discharge and treatment of urine, faeces and greywater-Part II: Cost comparison of different sanitation systems. Water Sci. Technol. 2007, 56, 251–257. [Google Scholar] [CrossRef]
  56. Ottelé, M.; Perini, K.; Fraaij, A.L.A.; Haas, E.M.; Raiteri, R. Comparative life cycle analysis for green façades and living wall systems. Energy Build. 2011, 43, 3419–3429. [Google Scholar] [CrossRef]
  57. Koura, J.; Manneh, R.; Belarbi, R.; El Khoury, V.; El Bachawati, M. Comparative cradle to grave environmental life cycle assessment of traditional and extensive vegetative roofs: An application for the Lebanese context. Int. J. Life Cycle Assess. 2020, 25, 423–442. [Google Scholar] [CrossRef]
  58. Mekonnen, M.M.; Gerbens-Leenes, P.W.; Hoekstra, A.Y. The consumptive water footprint of electricity and heat: A global assessment. Environ. Sci. Water Res. Technol. 2015, 1, 285–297. [Google Scholar] [CrossRef]
  59. WWAP (United Nations World Water Assessment Programme). The United Nations World Water Development Report 2014: Water and Energy; United Nations Educational, Scientific and Cultural Organization: Paris, France, 2014. [Google Scholar]
  60. NYSERDA. Statewide Assessment of Energy Use by the Municipal Water and Wastewater Sector; 2008. Available online: https://www.nyserda.ny.gov/-/media/Files/Publications/Research/Environmental/Statewide-Assessment-Energy-Use.pdf (accessed on 26 May 2021).
  61. Sharif, M.N.; Haider, H.; Farahat, A.; Hewage, K.; Sadiq, R. Water–energy nexus for water distribution systems: A literature review. Environ. Rev. 2019, 27, 519–544. [Google Scholar] [CrossRef]
  62. Yüce, S.; Kazner, C.; Hochstrat, R.; Wintgens, T.; Melin, T. Water reuse versus seawater desalination–evaluation of the economic and environmental viability. In Water-Energy Interactions in Water Reuse; Lazarova, V., Choo, K.-H., Cornel, P., Eds.; IWA: London, UK, 2012. [Google Scholar]
  63. Schaum, C.; Lensch, D.; Cornel, P. Water reuse and reclamation: A contribution to energy efficiency in the water cycle. J. Water Reuse Desalin. 2015, 5, 83–94. [Google Scholar] [CrossRef] [Green Version]
  64. ISTAT (Italian National Institute of Statistics). ISTAT Water Statistics|Years 2015–2018. Available online: https://www.istat.it/it/files/2019/03/Water-report.pdf (accessed on 26 May 2021).
  65. Magagna, D.; Hidalgo González, I.; Bidoglio, G.; Peteves, S.; Adamovic, M.; Bisselink, B.; De Felice, M.; De Roo, A.; Dorati, C.; Ganora, D.; et al. Water—Energy Nexus in Europe; Publications Office of the European Union: Luxembourg, 2019; ISBN 9789276033851. [Google Scholar]
  66. DNAVA (Danish Water and Wasterwater Association). Water in Figures-2019 DANVA Statistics & Benchmarking. Available online: https://www.danva.dk/media/6355/2019_water-in-figures_web.pdf (accessed on 26 May 2021).
  67. Tal, A. Addressing desalination’s carbon footprint: The israeli experience. Water 2018, 10, 197. [Google Scholar] [CrossRef] [Green Version]
  68. Bertanza, G.; Sorlini, S.; Vaccari, M. Energy Balance in the Water Cycle in Italy: State of the Art and Perspectives. In Frontiers in Water-Energy-Nexus—Nature-Based Solutions, Advanced Technologies and Best Practices for Environmental Sustainability; Naddeo, V., Balakrishnan, M., Choo, K.A.H., Eds.; Advances in Science, Technology & Innovation (IEREK Interdisciplinary Series for Sustainable Development); Springer: Cham, Switzerland, 2019. [Google Scholar]
  69. BDEW. (German Association of Energy and Water Industries) Kennzahlenvergleich Wasserversorgung und Abwasserbeseitigung Brandenburg. Available online: https://www.bdew.de/media/documents/190430_Brandenburg-Benchmarking-Bericht-Betrachtungsjahr-2017.pdf (accessed on 26 May 2021).
  70. ERSAR. Relatório Anual dos Serviços de Águas e Resíduos em Portugal-2020 Entidade Reguladora dos Serviços de Águas e Resíduos; ERSAR: Lisbon, Portugal, 2020; ISBN 978-989-8360-39-7. (In Portuguese) [Google Scholar]
  71. ERSAR. Guia Técnico 24-Uso Eficiente de Energia nos Serviços de Água (Technical Guide 24-Efficient Use of Energy in Water Services). Available online: http://www.ersar.pt/pt/publicacoes/publicacoes-tecnicas/guias (accessed on 26 May 2021).
  72. ISIK. Su Ve Kanalizasyon Idaresi (Water and Sewage Administration Turkey) Faaliyet Raporu (Activity Report (2019)). Available online: https://www.iski.gov.tr/web/assets/SayfalarDocs/faaliyetraporlari/faaliyetraporu/pdf/2019-FAALİYET-RAPORU.pdf (accessed on 26 May 2021).
  73. Gorgich, M.; Mata, T.M.; Martins, A.; Caetano, N.S.; Formigo, N. Application of domestic greywater for irrigating agricultural products: A brief study. Energy Rep. 2020, 6, 811–817. [Google Scholar] [CrossRef]
  74. Eregno, F.E.; Moges, M.E.; Heistad, A. Treated greywater reuse for hydroponic lettuce production in a Green Wall system: Quantitative health risk assessment. Water 2017, 9, 454. [Google Scholar] [CrossRef] [Green Version]
  75. Paul, R.; Kenway, S.; Mukheibir, P. How scale and technology influence the energy intensity of water recycling systems-An analytical review. J. Clean. Prod. 2019, 215, 1457–1480. [Google Scholar] [CrossRef] [Green Version]
  76. Masi, F.; Rizzo, A.; Regelsberger, M. The role of constructed wetlands in a new circular economy, resource oriented, and ecosystem services paradigm. J. Environ. Manag. 2018, 216, 275–284. [Google Scholar] [CrossRef] [PubMed]
  77. Prodanovic, V.; Hatt, B.; McCarthy, D.; Zhang, K.; Deletic, A. Green walls for greywater reuse: Understanding the role of media on pollutant removal. Ecol. Eng. 2017, 102, 625–635. [Google Scholar] [CrossRef]
  78. Chowdhury, R.K.; Abaya, J.S. An experimental study of greywater irrigated green roof systems in an arid climate. J. Water Manag. Model. 2018, 2018, 1–10. [Google Scholar] [CrossRef] [Green Version]
  79. Masi, F.; Bresciani, R.; Rizzo, A.; Edathoot, A.; Patwardhan, N.; Panse, D.; Langergraber, G. Green walls for greywater treatment and recycling in dense urban areas: A case-study in Pune. J. Water, Sanit. Hyg. Dev. 2016, 6, 342–347. [Google Scholar] [CrossRef]
  80. Zraunig, A.; Estelrich, M.; Gattringer, H.; Kisser, J.; Langergraber, G.; Radtke, M.; Rodriguez-Roda, I.; Buttiglieri, G. Long term decentralized greywater treatment for water reuse purposes in a tourist facility by vertical ecosystem. Ecol. Eng. 2019, 138, 138–147. [Google Scholar] [CrossRef]
  81. Gattringer, H.; Claret, A.; Radtke, M.; Kisser, J.; Zraunig, A.; Odriguez-Roda, I.; Buttiglieri, G. Novel vertical ecosystem for sustainable water treatment and reuse in tourist resorts. Int. J. Sustain. Dev. Plan. 2016, 11, 263–274. [Google Scholar] [CrossRef] [Green Version]
  82. Pucher, B.; Riberio, G.; Langergraber, G.; Zluwa, I.; Spörl, P.; Pitha, U. Entwicklung eines multifunktionalen Living-Wall-Systems zur Reinigung und Nutzung von Grauwasser. Wasser Abfall. 2020, 22, 37–40. [Google Scholar] [CrossRef]
  83. WHO. Safe use of wastewater, excreta and greywater guidelines. Wastewater use in agriculture. World Health 2006, 2, 204. [Google Scholar]
  84. FAO. Aquastat Core Database. Food and Agriculture Organization of the United Nations. Available online: http://www.fao.org/aquastat/en/databases/maindatabase (accessed on 26 May 2021).
  85. ENVE. (Commission fo Environment Climate change and Energy) Mariya Gancheva, Alicia McNeill, Melanie Muro. In Water Reuse–Legislative Framework in EU Regions. Available online: https://op.europa.eu/en/publication-detail/-/publication/c573861f-e712-11e8-b690-01aa75ed71a1/language-en (accessed on 26 May 2021).
  86. Monisteriale, D. Gazzetta Ufficiale della Repubblica Italiana-23 Luglio 2003, n. 169. Available online: http://extranet.regione.piemonte.it/ambiente/bga/archivio_documenti/2003_sem_02_30/30_atti_stato/dm_185_12_06_2003.pdf (accessed on 26 May 2021).
  87. Decreto-Lei n.º 119/2019. Estabelece o Regime jurídico de Produção de água para Reutilização, Obtida a Partir do Tratamento de águas Residuais, bem como da sua Utilização. Published: Diário da República n.º 159/2019, Série I de 2019-08-21. Available online: https://data.dre.pt/eli/dec-lei/119/2019/08/21/p/dre (accessed on 26 May 2021).
  88. EC Council Directive 91/271/EEC of 21 May 1991 Concerning Urban Waste-Water Treatment. Available online: http://eur-lex.europa.eu/LexUriServ/LexUriServ.do?uri=CELEX:31991L0271:EN:HTML (accessed on 26 May 2021).
  89. EC Directive 2000/60/EC of the European Parliament and of the Council of 23 October 2000 Establishing a Framework for Community Action in the Field of Water Policy. Annex VI, part B. Available online: http://data.europa.eu/eli/dir/2000/60/oj (accessed on 26 May 2021).
  90. EU Regulation (EU) 2020/741 of the European Parliament and of the Council of 25 May 2020 on Minimum Requirements for Water Reuse. Available online: https://eur-lex.europa.eu/legal-content/EN/TXT/PDF/?uri=CELEX:32020R0741&from=EN (accessed on 26 May 2021).
  91. Cipolletta, G.; Ozbayram, E.G.; Eusebi, A.L.; Akyol, Ç.; Malamis, S.; Mino, E.; Fatone, F. Policy and legislative barriers to close water-related loops in innovative small water and wastewater systems in Europe: A critical analysis. J. Clean. Prod. 2021, 288, 125604. [Google Scholar] [CrossRef]
  92. Umweltbundesamt Untersuchung der Potentiale Für die Nutzung von Regenwasser zur Verdunstungskühlung in Städten–Abschlussbericht. Available online: https://www.umweltbundesamt.de/sites/default/files/medien/1410/publikationen/2019-09-16_texte_111-2019_verdunstungskuehlung.pdf (accessed on 26 May 2021). (In Germany).
  93. BWG. Berliner Wassergesetz. In der Fassung vom 17. Juni 2005. Zuletzt Geändert Durch Gesetz vom 6. Juni 2008. § 36a: Niederschlagswasserbewirtschaftung; 2008. (In Germany) [Google Scholar]
  94. DWA. Merkblatt DWA-M 153. Handlungsempfehlungen zum umgang mit regenwasser. In Deutsche Vereinigung für Wasserwirtschaft, Abwasser und Abfall e.V. Hennef; 2007. [Google Scholar]
  95. DAW. Merkblatt DWA-M 277. Hinweise zur auslegung von anlagen zur behandlung und nutzung von grauwasser und grauwasserteilströmen. In Deutsche Vereinigung für Wasserwirtschaft, Abwasser und Abfall e.V. Hennef.; 2017. [Google Scholar]
  96. Urbangreenup. NBS Catalogue; URBAN GreenUP Consortium Partners, 2018. [Google Scholar]
  97. Unalab. Nature Based Solutions–Technical Handbook (Part. II); Publisher: Unalab. 2019. Available online: https://unalab.eu/system/files/2020-02/unalab-technical-handbook-nature-based-solutions2020-02-17.pdf (accessed on 26 May 2021).
  98. Nature4cities. NBS Multi-Scalar and Multi-Thematic Typology and Associated Database. 2020. Available online: https://docs.wixstatic.com/ugd/55d29d_8813db2df690497e80740537b6a8a844.pdf (accessed on 26 May 2021).
  99. Perini, K.; Ottelé, M. Designing green façades and living wall systems for sustainable constructions. Int. J. Des. Nat. Ecodynamics 2014, 9, 31–46. [Google Scholar] [CrossRef] [Green Version]
  100. Hashemi, S.S.G.; Mahmud, H.B.; Ashraf, M.A. Performance of green roofs with respect to water quality and reduction of energy consumption in tropics: A review. Renew. Sustain. Energy Rev. 2015, 52, 669–679. [Google Scholar] [CrossRef]
  101. Poórová, Z.; Vranayová, Z. Green Roofs and Water Retention in Košice, Slovakia; Springer International Publishing: Cham, Switzerland, 2019; ISBN 9783030240394. [Google Scholar]
  102. Vijayaraghavan, K. Green roofs: A critical review on the role of components, benefits, limitations and trends. Renew. Sustain. Energy Rev. 2016, 57, 740–752. [Google Scholar] [CrossRef]
  103. Bianchini, F.; Hewage, K. How “green” are the green roofs? Lifecycle analysis of green roof materials. Build. Environ. 2012, 48, 57–65. [Google Scholar] [CrossRef]
  104. Stovin, V. The potential of green roofs to manage Urban Stormwater. Water Environ. J. 2010, 24, 192–199. [Google Scholar] [CrossRef]
  105. Poë, S.; Stovin, V.; Berretta, C. Parameters influencing the regeneration of a green roof’s retention capacity via evapotranspiration. J. Hydrol. 2015, 523, 356–367. [Google Scholar] [CrossRef]
  106. Mentens, J.; Raes, D.; Hermy, M. Green roofs as a tool for solving the rainwater runoff problem in the urbanized 21st century? Landsc. Urban. Plan. 2006, 77, 217–226. [Google Scholar] [CrossRef]
  107. Somarakis, G.; Stagakis, S.; Chrysoulakis, N. ThinkNature Nature Based Solutions Handbook. Available online: https://oppla.eu/product/19999 (accessed on 26 May 2021).
  108. Theodosiou, T. Green roofs in buildings: Thermal and environmental behaviour. Adv. Build. Energy Res. 2009, 3, 271–288. [Google Scholar] [CrossRef]
  109. Berardi, U.; GhaffarianHoseini, A.; GhaffarianHoseini, A. State-of-the-art analysis of the environmental benefits of green roofs. Appl. Energy. 2014, 115, 411–428. [Google Scholar] [CrossRef]
  110. Calheiros, C.S.C.; Stefanakis, A.I. Green roofs towards circular and resilient cities. Circ. Econ. Sustain. 2021, 1, 395–411. [Google Scholar] [CrossRef]
  111. ANCV. Coberturas Verdes: Guia Técnico para projeto, construção e manutenção. In ANCV-Associação Nacional de Coberturas Verdes; ANCV: Porto, Portugal, 2019; ISBN 9789893300298. [Google Scholar]
  112. Nagase, A. Novel application and reused materials for extensive green roof substrates and drainage layers in Japan–Plant growth and moisture uptake implementation. Ecol. Eng. 2020, 153, 105898. [Google Scholar] [CrossRef]
  113. Cascone, S.; Gagliano, A.; Poli, T.; Sciuto, G. Thermal performance assessment of extensive green roofs investigating realistic vegetation-substrate configurations. Build. Simul. 2019, 12, 379–393. [Google Scholar] [CrossRef]
  114. Shafique, M.; Azam, A.; Rafiq, M.; Ateeq, M.; Luo, X. An overview of life cycle assessment of green roofs. J. Clean. Prod. 2020, 250, 119471. [Google Scholar] [CrossRef]
  115. Oquendo-Di Cosola, V.; Olivieri, F.; Ruiz-García, L.; Bacenetti, J. An environmental life cycle assessment of living wall systems. J. Environ. Manag. 2020, 254, 109743. [Google Scholar] [CrossRef]
  116. Chen, C.-F. Performance evaluation and development strategies for green roofs in Taiwan: A review. Ecol. Eng. 2013, 52, 51–58. [Google Scholar] [CrossRef]
  117. Natarajan, M.; Rahimi, M.; Sen, S.; Mackenzie, N.; Imanbayev, Y. Living wall systems: Evaluating life-cycle energy, water and carbon impacts. Urban. Ecosyst. 2015, 18, 1–11. [Google Scholar] [CrossRef]
  118. Cortês, A.; Tadeu, A.; Santos, M.I.; de Brito, J.; Almeida, J. Innovative module of expanded cork agglomerate for green vertical systems. Build. Environ. 2021, 188, 107461. [Google Scholar] [CrossRef]
  119. Bozorg Chenani, S.; Lehvävirta, S.; Häkkinen, T. Life cycle assessment of layers of green roofs. J. Clean. Prod. 2015, 90, 153–162. [Google Scholar] [CrossRef]
  120. Morau, D.; Rabarison, T.; Rakotondramiarana, H. Life cycle analysis of green roof implemented in a global south low-income country. Br. J. Environ. Clim. Chang. 2017, 7, 43–55. [Google Scholar] [CrossRef] [Green Version]
  121. El Bachawati, M.; Manneh, R.; Belarbi, R.; Dandres, T.; Nassab, C.; El Zakhem, H. Cradle-to-gate Life Cycle Assessment of traditional gravel ballasted, white reflective, and vegetative roofs: A Lebanese case study. J. Clean. Prod. 2016, 137, 833–842. [Google Scholar] [CrossRef]
  122. Manso, M.; Castro-Gomes, J.; Paulo, B.; Bentes, I.; Teixeira, C.A. Life cycle analysis of a new modular greening system. Sci. Total Environ. 2018, 627, 1146–1153. [Google Scholar] [CrossRef]
  123. Pushkar, S. Modeling the substitution of natural materials with industrial byproducts in green roofs using life cycle assessments. J. Clean. Prod. 2019, 227, 652–661. [Google Scholar] [CrossRef]
  124. Rincón, L.; Coma, J.; Pérez, G.; Castell, A.; Boer, D.; Cabeza, L.F. Environmental performance of recycled rubber as drainage layer in extensive green roofs. A comparative life cycle assessment. Build. Environ. 2014, 74, 22–30. [Google Scholar] [CrossRef]
  125. Kotsiris, G.; Androutsopoulos, A.; Polychroni, E.; Souliotis, M.; Kavga, A. Carbon footprint of green roof installation on school buildings in Greek Mediterranean climatic region. Int. J. Sustain. Energy 2019, 38, 866–883. [Google Scholar] [CrossRef]
  126. Rasul, M.G.; Arutla, L.K.R. Environmental impact assessment of green roofs using life cycle assessment. Energy Rep. 2020, 6, 503–508. [Google Scholar] [CrossRef]
  127. Pan, L.; Chu, L.M. Energy saving potential and life cycle environmental impacts of a vertical greenery system in Hong Kong: A case study. Build. Environ. 2016, 96, 293–300. [Google Scholar] [CrossRef]
  128. Pirouz, B.; Palermo, S.A.; Maiolo, M.; Arcuri, N.; Piro, P. Decreasing water footprint of electricity and heat by extensive green roofs: Case of southern Italy. Sustainability 2020, 12, 10178. [Google Scholar] [CrossRef]
  129. Vacek, P.; Struhala, K.; Matějka, L. Life-cycle study on semi intensive green roofs. J. Clean. Prod. 2017, 154, 203–213. [Google Scholar] [CrossRef]
  130. BauKarussell No Title. Available online: https://www.baukarussell.at/ (accessed on 26 May 2021).
  131. Romm, T.M.; Kasper, T. Eco-Efficient Construction Using Local Resources. In Manual of Recycling, Buildings as Sources of Materials; Hillebrandt, A., Riegler-Floors, P., Rosen, A., Seggewies, J.-K., Eds.; Business Information GmbH: Munich, Germany, 2019. [Google Scholar]
  132. Eksi, M.; Sevgi, O.; Akburak, S.; Yurtseven, H.; Esin, İ. Assessment of recycled or locally available materials as green roof substrates. Ecol. Eng. 2020, 156, 105966. [Google Scholar] [CrossRef]
  133. Matlock, J.M.; Rowe, D.B. The suitability of crushed porcelain and foamed glass as alternatives to heat-expanded shale in green roof substrates: An assessment of plant growth, substrate moisture, and thermal regulation. Ecol. Eng. 2016, 94, 244–254. [Google Scholar] [CrossRef]
  134. Monteiro, C.M.; Calheiros, C.S.C.; Martins, J.P.; Costa, F.M.; Palha, P.; de Freitas, S.; Ramos, N.M.M.; Castro, P.M.L. Substrate influence on aromatic plant growth in extensive green roofs in a Mediterranean climate. Urban. Ecosyst. 2017, 20, 1347–1357. [Google Scholar] [CrossRef]
  135. Tadeu, A.; Simões, N.; Almeida, R.; Manuel, C. Drainage and water storage capacity of insulation cork board applied as a layer on green roofs. Constr. Build. Mater. 2019, 209, 52–65. [Google Scholar] [CrossRef]
  136. Cortês, A.; Almeida, J.; de Brito, J.; Tadeu, A. Water retention and drainage capability of expanded cork agglomerate boards intended for application in green vertical systems. Constr. Build. Mater. 2019, 224, 439–446. [Google Scholar] [CrossRef]
  137. Nehls, T.; Peters, A.; Kraus, F.; Rim, Y.N. Water dynamics at the urban soil-atmosphere interface—Rainwater storage in paved surfaces and its dependence on rain event characteristics. J. Soils Sediments 2021, 21, 2025–2034. [Google Scholar] [CrossRef]
  138. Kim, J.; Song, I.; Oh, H.; Jong, J.; Park, J.; Choung, Y. A laboratory-scale graywater treatment system based on a membrane filtration and oxidation process-characteristics of graywater from a residential complex. Desalination 2009, 238, 347–357. [Google Scholar] [CrossRef]
  139. Oberndorfer, E.; Lundholm, J.; Bass, B.; Coffman, R.R.; Doshi, H.; Dunnett, N.; Gaffin, S.; Köhler, M.; Liu, K.K.Y.; Rowe, B. Green roofs as urban ecosystems: Ecological structures, functions, and services. Bioscience 2007, 57, 823–833. [Google Scholar] [CrossRef]
  140. Claus, K.; Rousseau, S. Public versus private incentives to invest in green roofs: A cost benefit analysis for Flanders. Urban. For. Urban. Green. 2012, 11, 417–425. [Google Scholar] [CrossRef]
  141. Peng, L.L.H.; Jim, C.Y. Economic evaluation of green-roof environmental benefits in the context of climate change: The case of Hong Kong. Urban. For. Urban. Green. 2015, 14, 554–561. [Google Scholar] [CrossRef]
  142. Manso, M.; Teotónio, I.; Silva, C.M.; Cruz, C.O. Green roof and green wall benefits and costs: A review of the quantitative evidence. Renew. Sustain. Energy Rev. 2021, 135, 110111. [Google Scholar] [CrossRef]
  143. FLL. Fassadenbegrünungsrichtlinien: Richtlinien Für Die Planung, Ausführung und Pflege von Wand- und Fassadenbegrünungen; FLL: Bonn, Germany, 2018. [Google Scholar]
  144. Lapointe, M.; Cumming, G.S.; Gurney, G.G. Comparing ecosystem service preferences between urban and rural dwellers. Bioscience 2019, 69, 108–116. [Google Scholar] [CrossRef] [Green Version]
  145. Dobbs, C.; Kendal, D.; Nitschke, C.R. Multiple ecosystem services and disservices of the urban forest establishing their connections with landscape structure and sociodemographics. Ecol. Indic. 2014, 43, 44–55. [Google Scholar] [CrossRef]
  146. Lyytimäki, J.; Sipilä, M. Hopping on one leg–The challenge of ecosystem disservices for urban green management. Urban. For. Urban. Green. 2009, 8, 309–315. [Google Scholar] [CrossRef]
  147. Von Döhren, P.; Haase, D. Risk assessment concerning urban ecosystem disservices: The example of street trees in Berlin, Germany. Ecosyst. Serv. 2019, 40, 101031. [Google Scholar] [CrossRef]
  148. Ascione, F.; De Masi, R.F.; Mastellone, M.; Ruggiero, S.; Vanoli, G.P. Green walls, a critical review: Knowledge gaps, design parameters, thermal performances and multi-criteria design approaches. Energies 2020, 13, 2296. [Google Scholar] [CrossRef]
  149. Berndtsson, J.A.C.C.; Bengtsson, L.; Jinno, K. Runoff water quality from intensive and extensive vegetated roofs. Ecol. Eng. 2009, 35, 369–380. [Google Scholar] [CrossRef]
  150. Grard, B.J.-P.; Chenu, C.; Manouchehri, N.; Houot, S.; Frascaria-Lacoste, N.; Aubry, C. Rooftop farming on urban waste provides many ecosystem services. Agron. Sustain. Dev. 2018, 38, 2. [Google Scholar] [CrossRef] [Green Version]
  151. Pardela, Ł.; Kowalczyk, T.; Bogacz, A.; Kasowska, D. Sustainable green roof ecosystems: 100 years of functioning on fortifications-A case study. Sustainability 2020, 12, 4721. [Google Scholar] [CrossRef]
  152. Rafael, S.; Vicente, B.; Rodrigues, V.; Miranda, A.I.; Borrego, C.; Lopes, M. Impacts of green infrastructures on aerodynamic flow and air quality in Porto’s urban area. Atmos. Environ. 2018, 190, 317–330. [Google Scholar] [CrossRef]
  153. Townsend, A.R.; Howarth, R.W.; Bazzaz, F.A.; Booth, M.S.; Cleveland, C.S.C.C.; Collinge, S.K.; Dobson, A.P.; Epstein, P.R.; Holland, E.A.; Keeney, D.R.; et al. Human health effects of a changing global nitrogen cycle. Front. Ecol. Environ. 2003, 1, 240–246. [Google Scholar] [CrossRef]
  154. Moro, P.A.; Assisi, F.; Cassetti, F.; Bissoli, M.; Borghini, R.; Davanzo, F.; Della Puppa, T.; Dimasi, V.; Ferruzzi, M.; Giarratana, T.; et al. Toxicological hazards of natural environments: Clinical reports from poison Control Centre of Milan. Urban. For. Urban. Green. 2009, 8, 179–186. [Google Scholar] [CrossRef]
  155. Wong, G.K.L.; Jim, C.Y. Urban-microclimate effect on vector mosquito abundance of tropical green roofs. Build. Environ. 2017, 112, 63–76. [Google Scholar] [CrossRef]
  156. Fernandez-, R.; Gonzalez-R, P. Green roofs as a habitat for birds: A review. J. Anim. Vet. Adv. 2010, 9, 2041–2052. [Google Scholar] [CrossRef] [Green Version]
  157. Wilson, M.W.; Ridlon, A.D.; Gaynor, K.M.; Gaines, S.D.; Stier, A.C.; Halpern, B.S. Ecological impacts of human-induced animal behaviour change. Ecol. Lett. 2020, 23, 1522–1536. [Google Scholar] [CrossRef]
  158. Wong, B.B.M.; Candolin, U. Behavioral responses to changing environments. Behav. Ecol. 2015, 26, 665–673. [Google Scholar] [CrossRef] [Green Version]
  159. Malhi, Y.; Franklin, J.; Seddon, N.; Solan, M.; Turner, M.G.; Field, C.B.; Knowlton, N. Climate change and ecosystems: Threats, opportunities and solutions. Philos. Trans. R. Soc. B Biol. Sci. 2020, 375, 20190104. [Google Scholar] [CrossRef] [PubMed] [Green Version]
  160. Rocha, B.; Paço, T.A.; Luz, A.C.; Palha, P.; Milliken, S.; Kotzen, B.; Branquinho, C.; Pinho, P.; de Carvalho, R.C. Are biocrusts and xerophytic vegetation a viable green roof typology in a Mediterranean climate? A comparison between differently vegetated green roofs in water runoff and water quality. Water 2021, 13, 94. [Google Scholar] [CrossRef]
  161. Liberalesso, T.; Oliveira Cruz, C.; Matos Silva, C.; Manso, M. Green infrastructure and public policies: An international review of green roofs and green walls incentives. Land Use Policy 2020, 96, 104693. [Google Scholar] [CrossRef]
  162. Zhang, G.; He, B.-J. Towards green roof implementation: Drivers, motivations, barriers and recommendations. Urban. For. Urban. Green. 2021, 58, 126992. [Google Scholar] [CrossRef]
Figure 1. Schematic representation of the mean annual water balance in an agricultural landscape west of Berlin (left) and a densely overbuilt quarter with >85% soil sealing in the city of Berlin, Germany (right). Drawing based on data available from the state of Brandenburg (www.lfu.brandenburg.de, accessed on 7 October 2021) for the years 1991–2015 (given in mm/a). Illustration: Dimitra Theochari and Thomas Nehls (unauthorized use is not permitted).
Water 13 02165 g001
Figure 2. Selection of buildings representing typical architecture in quarters that are severely affected by urban heat islands (UHIs) in individual cities. The drawings are isometric. Illustration: Alessandro Stracqualursi.
Water 13 02165 g002
Figure 3. Types of vertical greening systems: (a) ground-based green facades, either self-climbing (top) or with support structure (bottom); (b) wall-based green facades, either with panels attached to the wall (top) or as stand-alone systems (bottom); and (c) pot-based green facades, with pots on the ground (top) or attached to the wall. Illustration: Dimitra Theochari (unauthorized use is not permitted).
Water 13 02165 g003
Figure 4. Green roofs of two general types: intensive (left), and extensive (right), showing typical layers common to both types. Illustration: Dimitra Theochari and Cristina Calheiros (unauthorized use is not permitted).
Water 13 02165 g004
Figure 5. Long-time average standard evapotranspiration for vertical greening systems (VGS), ET0vert (L/m2 = mm) for the different expositions in the different cities together with precipitation P (mm) (Meteonorm, 2021; for the years 2005–2019).
Water 13 02165 g005
Figure 6. Monthly values of eRO and eGW, with e being the efficiency number describing how much of the accruing respective water can be evapotranspirated by VGS, calculated here as the ratio of monthly sums of ET0vert and the respective water resource (left: available rainwater runoff from the roof RO, right: greywater accruing in the building GW) for the different cities (applying long-term averages for meteorological parameters 2005–2019; Meteonorm 8, Meteotest Bern, Switzerland). Note that the cities are ordered differently in the two figures.
Water 13 02165 g006
Table 1. Parameters describing the climatic, architectural, and hydrological characteristics of the case studies. The presented data included precipitation (P), temperature (T), evapotranspiration (ET), greywater (GW) production per inhabitant, occupancy (O) and run-off (RO) generation.
CityClimate (2)Typical BuildingWater Availability
Class (1)PTP-ET
Oct-Mar Apr-Sep
GroundFacadeWindowv/hOGW CapitaGW FacadeRO Facade
mm/a°Cmm---------------m2-------------(-)inh/m2L/inh d---L/m2 d---
CopenhagenDfb6149.4151−206980320614083.270.044510.690.37
BerlinDfb58510.3118−2381664401322.650.065631.540.43
RomeCsa60517.8135−644130239968133.070.029900.850.41
LisbonCsa57117.4126−7912374071421.720.021810.990.71
IstanbulCsa54616.0−18−8402313101321.340.170587.350.82
Tel-AvivCsa50621.5−171−1090165330662.000.040581.160.57
(1) acc. to Köppen-Geiger, (2) acc. to Meteonorm 8, Meteotest Bern, Switzerland 2000–2019.
Table 2. Embodied energy for water extraction, conveyance, and treatment (modified [63]).
Water SourcePrimary Energy DriversEnergy Consumption in kW h/m3
RangeAverage
Groundwater (distribution included)Pumping0.27–1.30≈0.5
Surface WaterPumping0.5–4.0
Brackish WaterReverse osmosis1.2–4.0≈1.5
SeawaterReverse osmosis2.5–10.0≈3.5
Table 3. Specific embodied energy values for water in kW h/m3. If citation is not provided, the value represents a summary of the given partial value from the literature.
Catchment, Conveyance, and TreatmentDistributionCombined Energy for Water Provision
Country--------------------------------------------kW h/m3-------------------------------------------
Germany 0.5–0.7 a
Brandenburg0.43 d0.11 d0.54
Denmark 0.2 a–0.6; 0.43 b
Copenhagen 0.3 b
Israel3.0–3.5 c0.4–1 c3.4–4.5
Istanbul 1.73 h
Portugal 0.33 f0.33–0.55 g
Italy0.184–0.45 e0.146–0.325 e0.330–0.775 e
Note: a [65], b [66], c [67], e [68], d [69], f [70], g [71], h [72].
Table 4. Feasible small-scale greywater treatment plants and their analogous specific energy consumptions from medium scale plants (adapted from [75]).
Feasible Small-Scale Treatment Technology for GreywaterAnalogous Average Energy Consumption [kW h/m3]
(From Medium Scale Treatment Plants for Conventional Wastewater Treatment)
Biological stage
SMBR0.2–4
SBR0–0.29
BR0.66
Disinfection
UV Disinfection0.02–0.8
RO0.56–1.3
SMBR: submerged membrane bio reactor; SBR: sequencing batch reactor; UV: ultraviolet RO: reverse osmosis.
Table 5. Water consumption during operation and management phases included in a previous LCA and experimental studies on NBS_u): green roofs (GRs), and vertical greening systems (VGS).
NBS_u TypeLocation Plant TypeCalculation MethodWater ConsumptionReference
Extensive GRAntananarivo, MadagascarGrassCML Baseline96 L/m2 a [120]
Calabria, ItalyNative Mediterranean plant speciesprecipitation + irrigation − run off127 L/m2
149 L/m2
winter period
summer period
[128]
LebanonSunflowerIMPACT 2002+15 L/m2summer period[56]
Intensive GRAntananarivo, MadagascarGrassCML Baseline730 L/m2 a [120]
Puigverd de Lleida, SpainSedum, Lampranthus, DelospermaEI 994032 L/m2 aJune–August[124]
Pot-based VGSDelft, NetherlandsPteropsidaAveraged for whole year1 L/m2 dPlanter boxes[55]
3 L/m2 dFelt layers
Madrid, SpainHederahelix stems biomassILCD Midpoint8 L/m2 d [115]
Madrid, SpainLonicera n. stems biomassILCD Midpoint2 L/m2 d [115]
Los Angeles, USALiriope muscari-6 L/m2 d [117]
PortugalSedum albumCML 2001 Endpoint approach8.7 L/m2 d
340 L/m2 a
Spring and summer
Total
[122]
VGSHong KongPeperomiaclaviformisCML-2001100 L/m2 month [127]
Table 6. Water management potential for three different irrigation regimes: (a) solely run-off (RO) used; (b) RO irrigation prioritized, but drought months outbalanced with greywater (GW); (c) RO irrigation prioritized, but all months added with GW.
CityWater Management Potential
(a) Solely RO Irrigation(b) Optimized RO Irrigation(c) Full RO + GW Irrigation
Facade GreenedEvaporated
RO
Facade GreenedEvaporated ROEvaporated GWFacade GreenedEvaporated ROEvaporated GW
%%%
Copenhagen1035267911469241
Berlin13396495298710047
Rome417246421286727
Lisbon--284428284428
Istanbul391001003013610045
Tel-Aviv--286053286053
Publisher’s Note: MDPI stays neutral with regard to jurisdictional claims in published maps and institutional affiliations.

