
Assessment of the Coastal Vulnerability to the Ongoing Sea Level Rise for the Exquisite Rhodes Island (SE Aegean Sea, Greece)

 , , ,
, , ,  , ,
, ,
Abstract
:1. Introduction
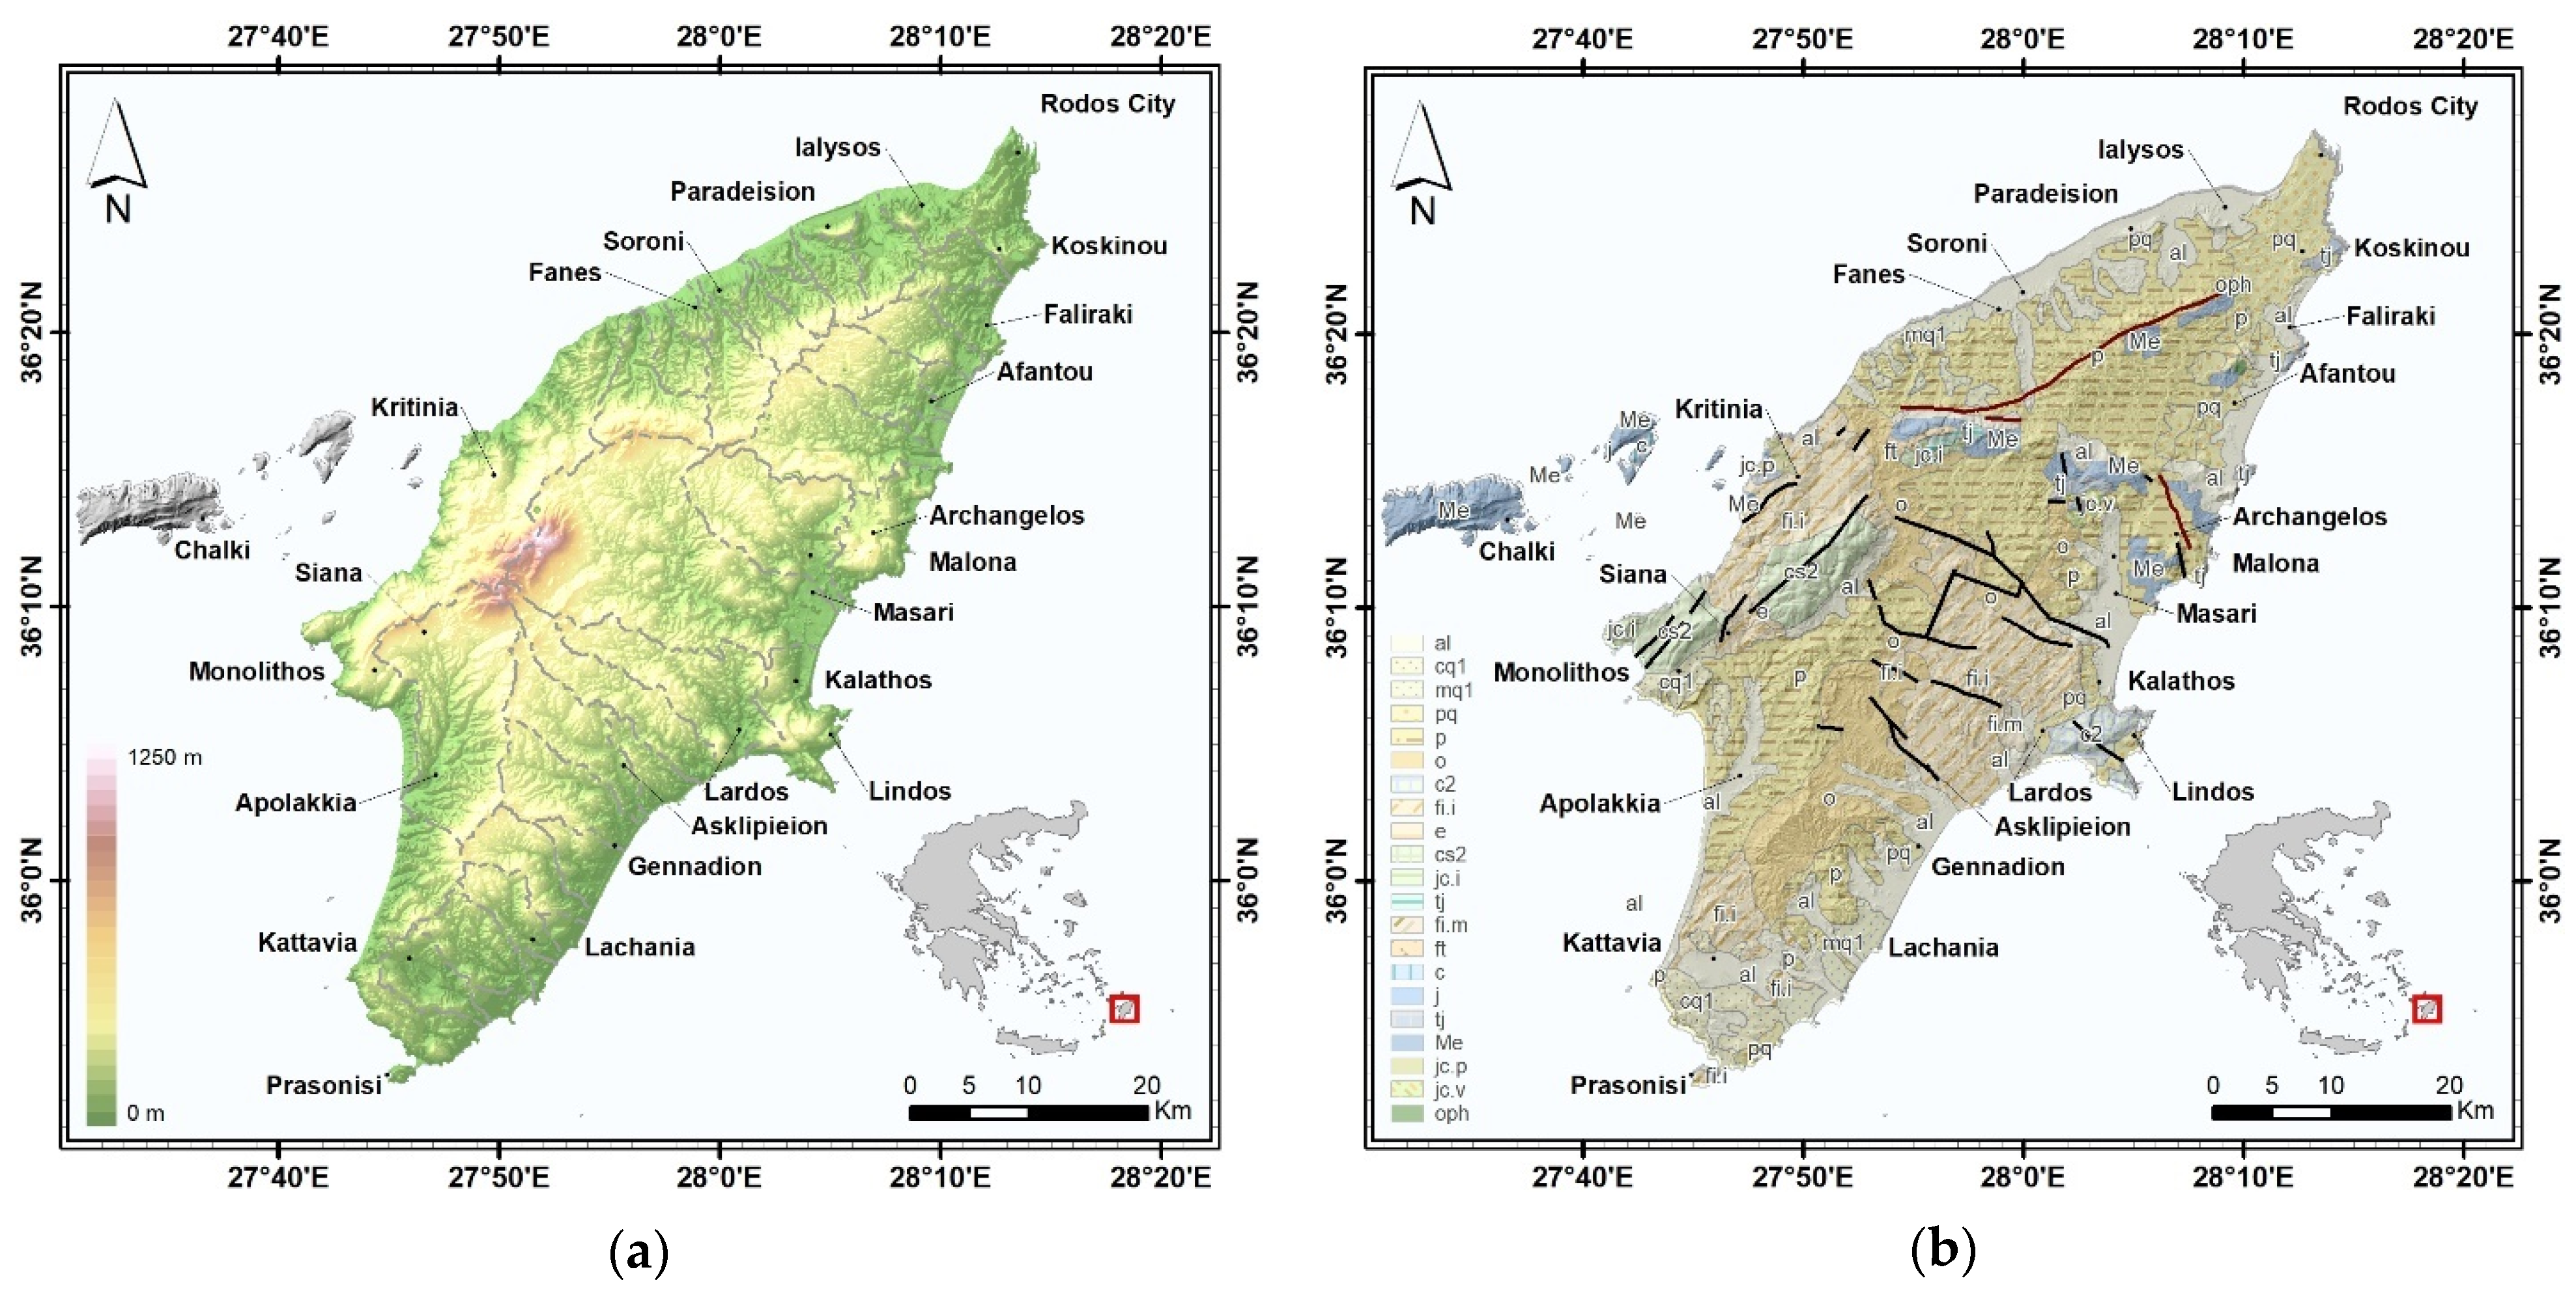
2. Area of Concern
3. Methodology

| CVI Variable | Relative Ranking Scheme for Each CVI Variable | ||||
|---|---|---|---|---|---|
| Very Low | Low | Moderate | High | Very High | |
| 1 | 2 | 3 | 4 | 5 | |
| (a) Mean absolute SLR (mm y−1) | <1.8 | [1.8–2.5) | [2.5–3) | [3–3.4] | >3.4 |
| (b) Mean significant wave height (m) | <0.55 | [0.55–0.85) | [0.85–1.05) | [1.05–1.25] | >1.25 |
| (c) Mean tidal range 1 (m) | >6 | (4–6] | (2–4] | [1,2] | <1 |
| (d) Lithology and geomorphology (including man-made structures) | Rocky cliff coasts, alpine and post-alpine substrate, beach rocks, concrete retaining walls, port facilities, rip raps | Medium cliffs, indented coasts | Low cliffs, alluvial plains, fluvial–alluvial beaches | Cobble beaches, lagoons | Sand beaches, deltas, sandy beaches under erosion |
| (e) Coastal slope (%) | >20 | (7–20] | (4–7] | [2.5–4] | <2.5 |
| (f) Mean shoreline change (±m y−1) | >+2 | (+1 to +2] | (–1 to +1] | [–2 to –1] | <–2 |
| (g) Mean coastal vertical velocity (mm y−1) | >5 | (4–5] | (2.5–4] | [1.1–2.5] | <1.1 |
4. Results
4.1. Current and Future CVI Variables
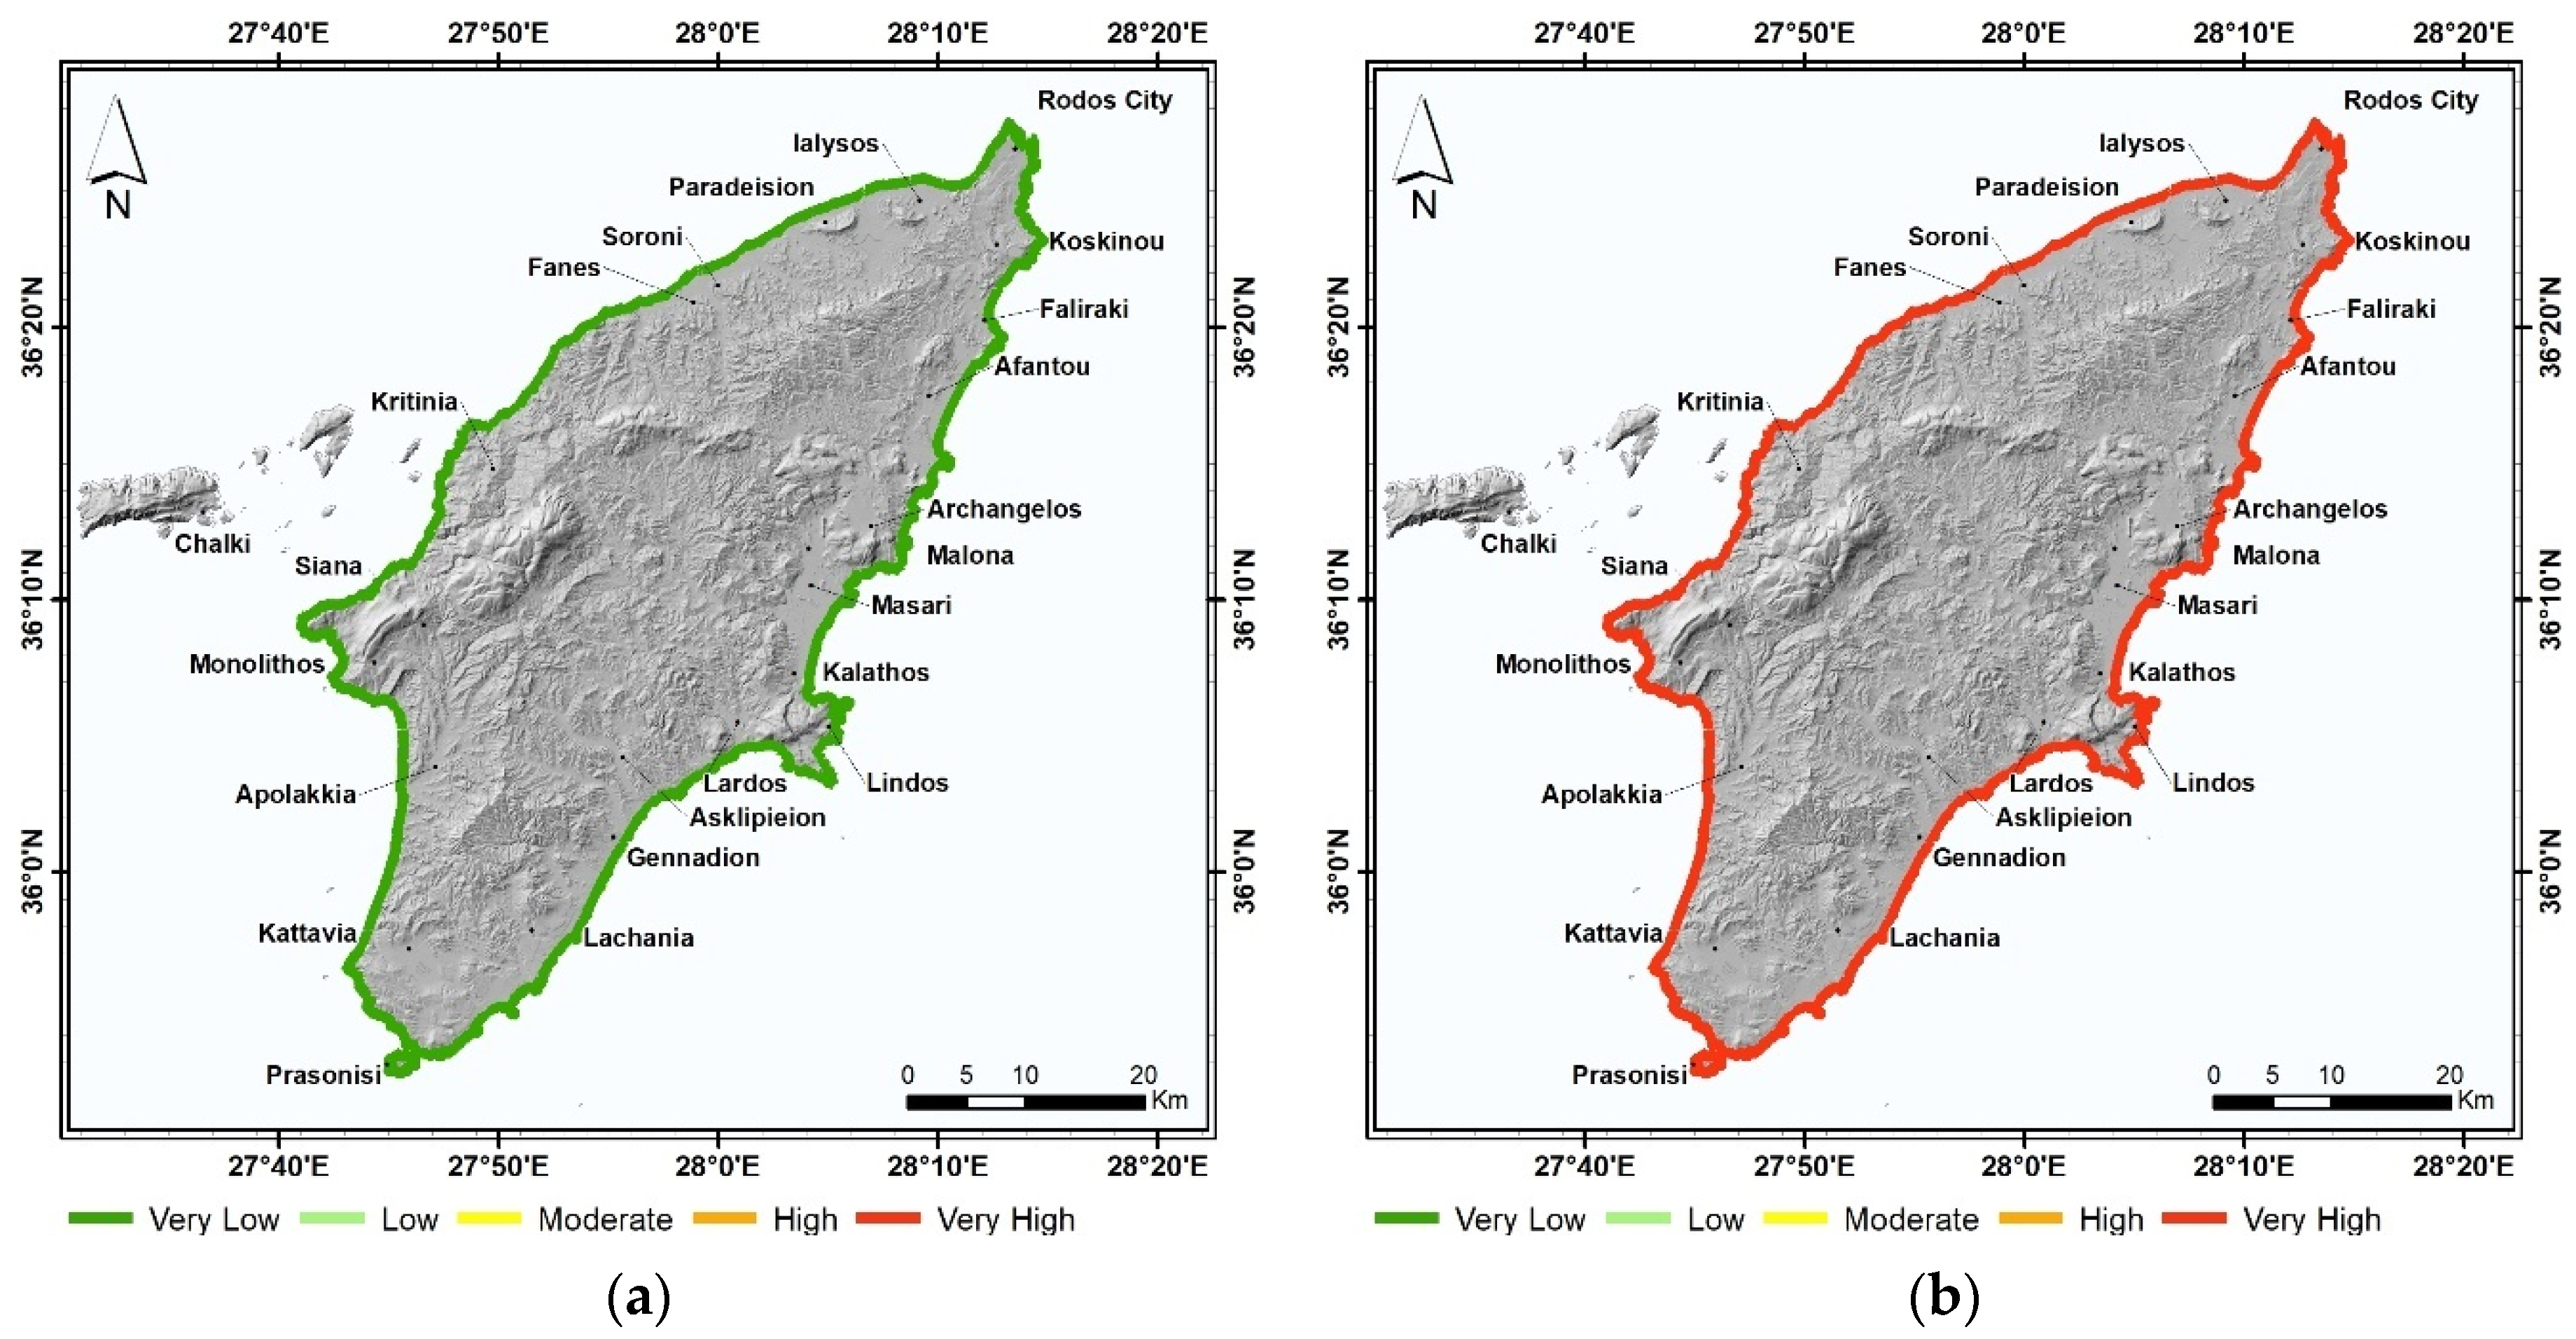
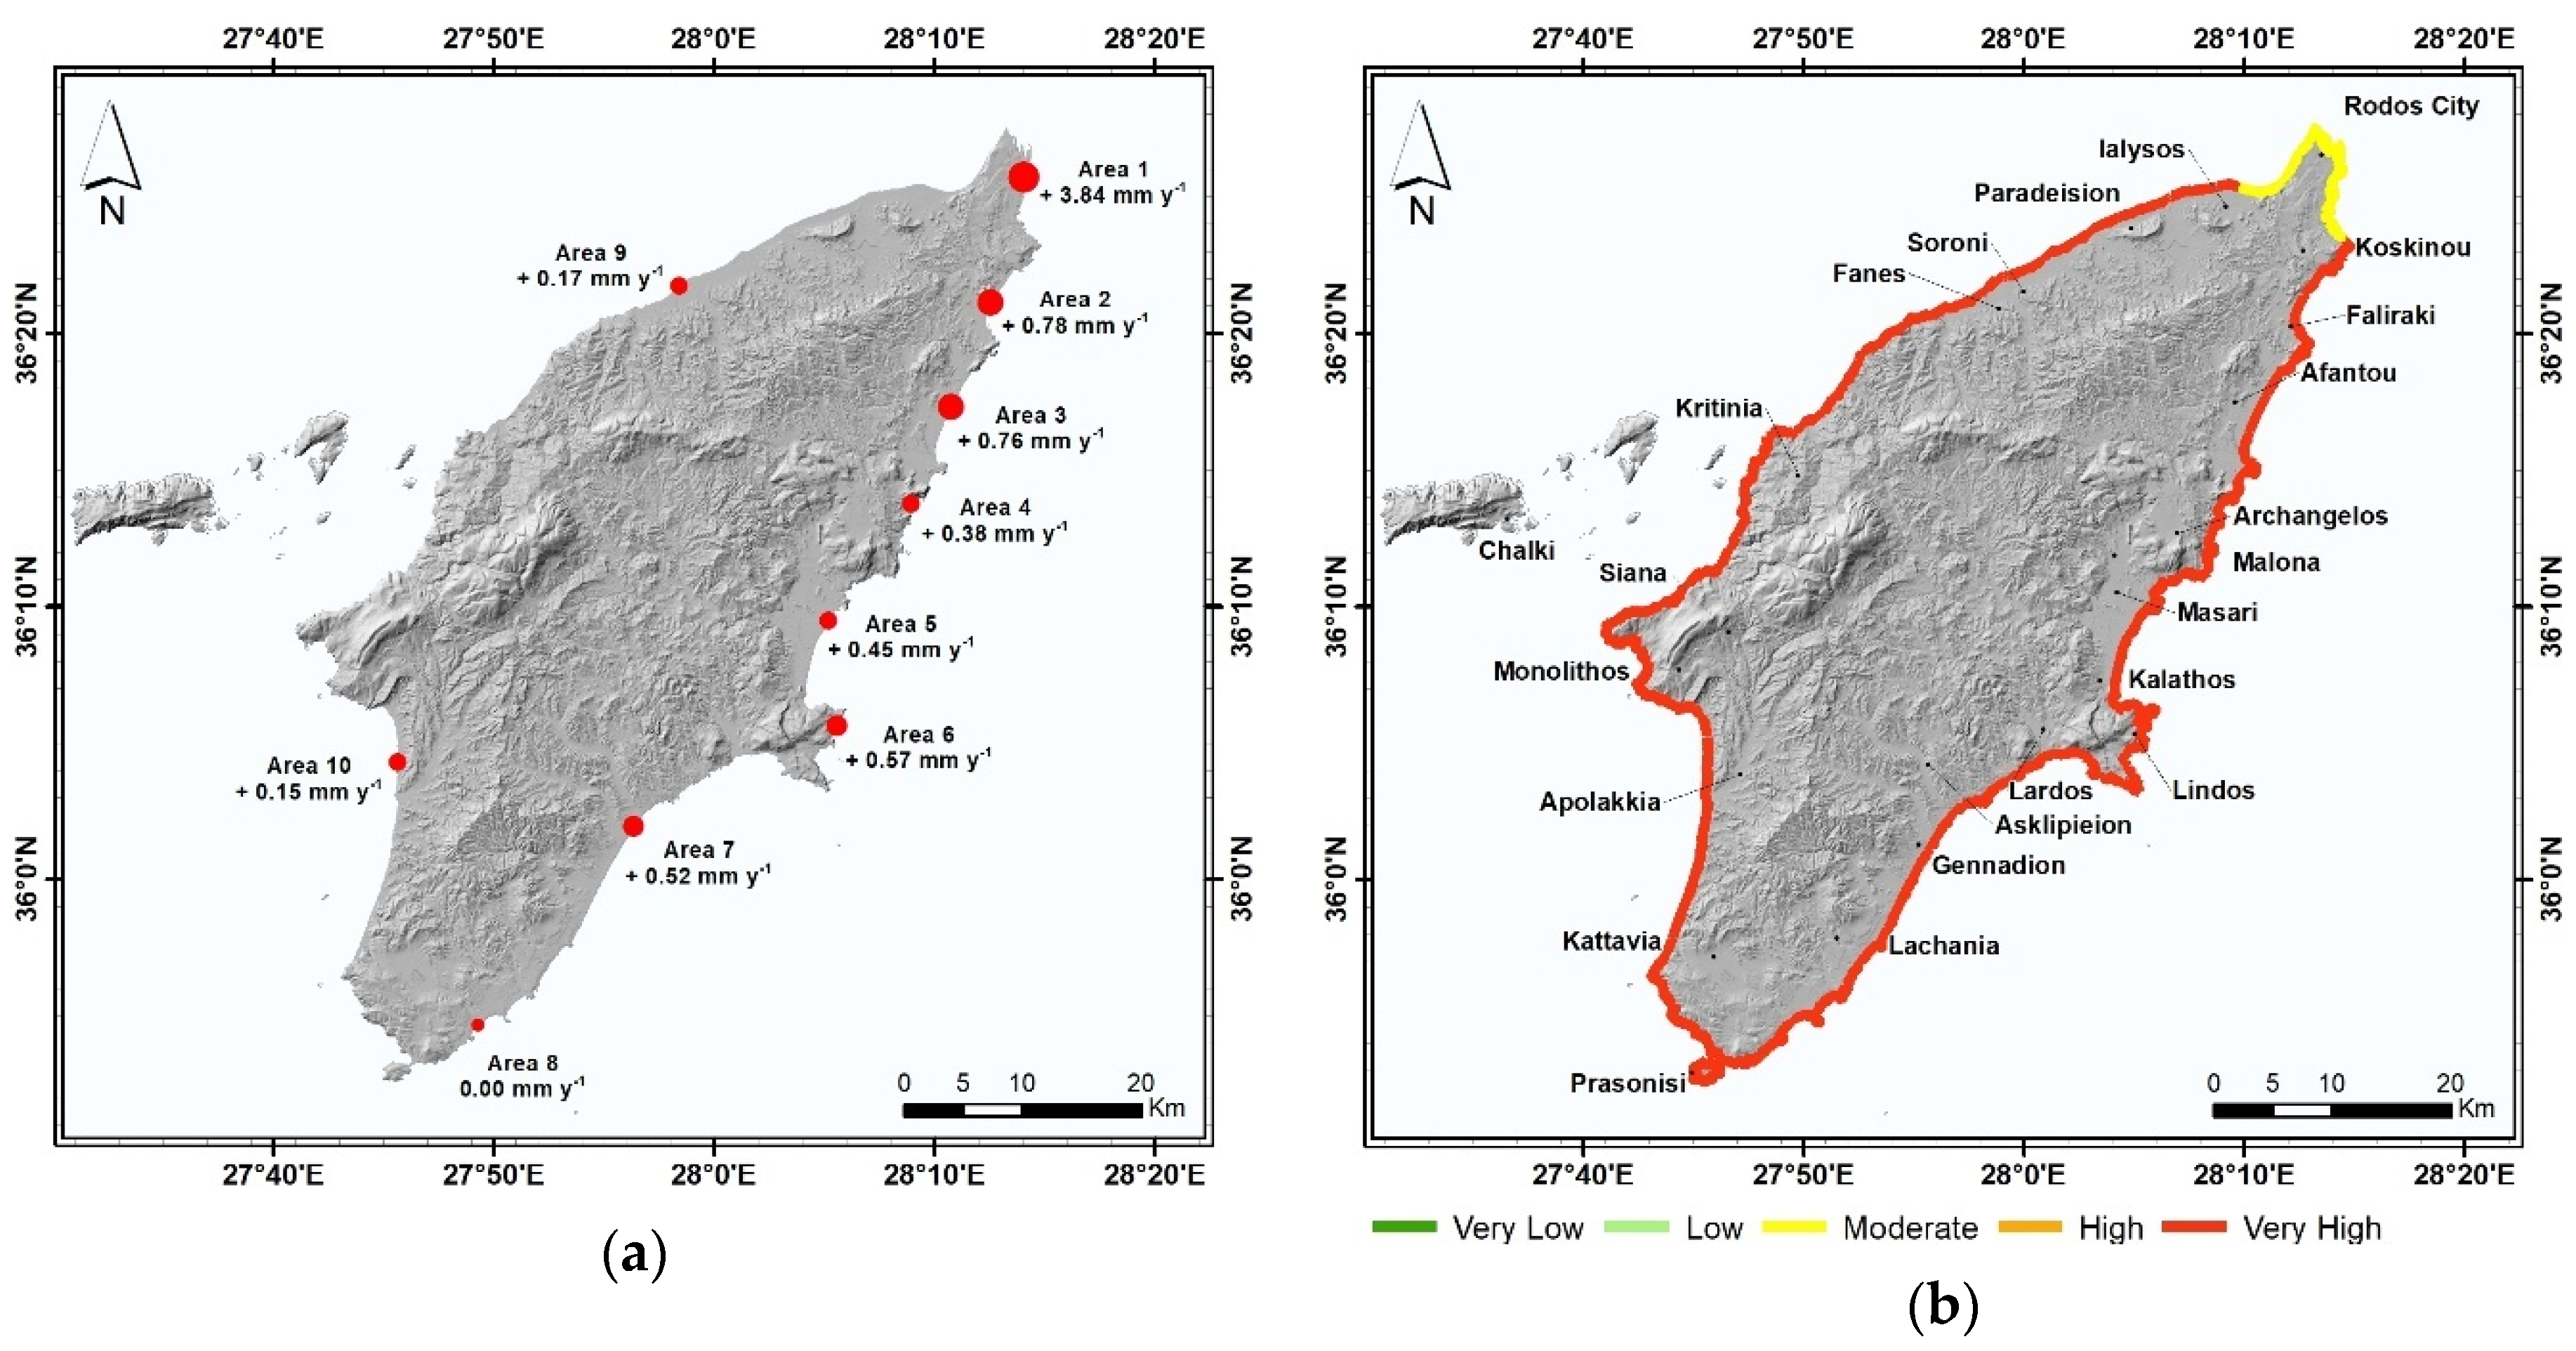
4.1.1. Mean Absolute Sea Level Rise
4.1.2. Mean Significant Wave Height
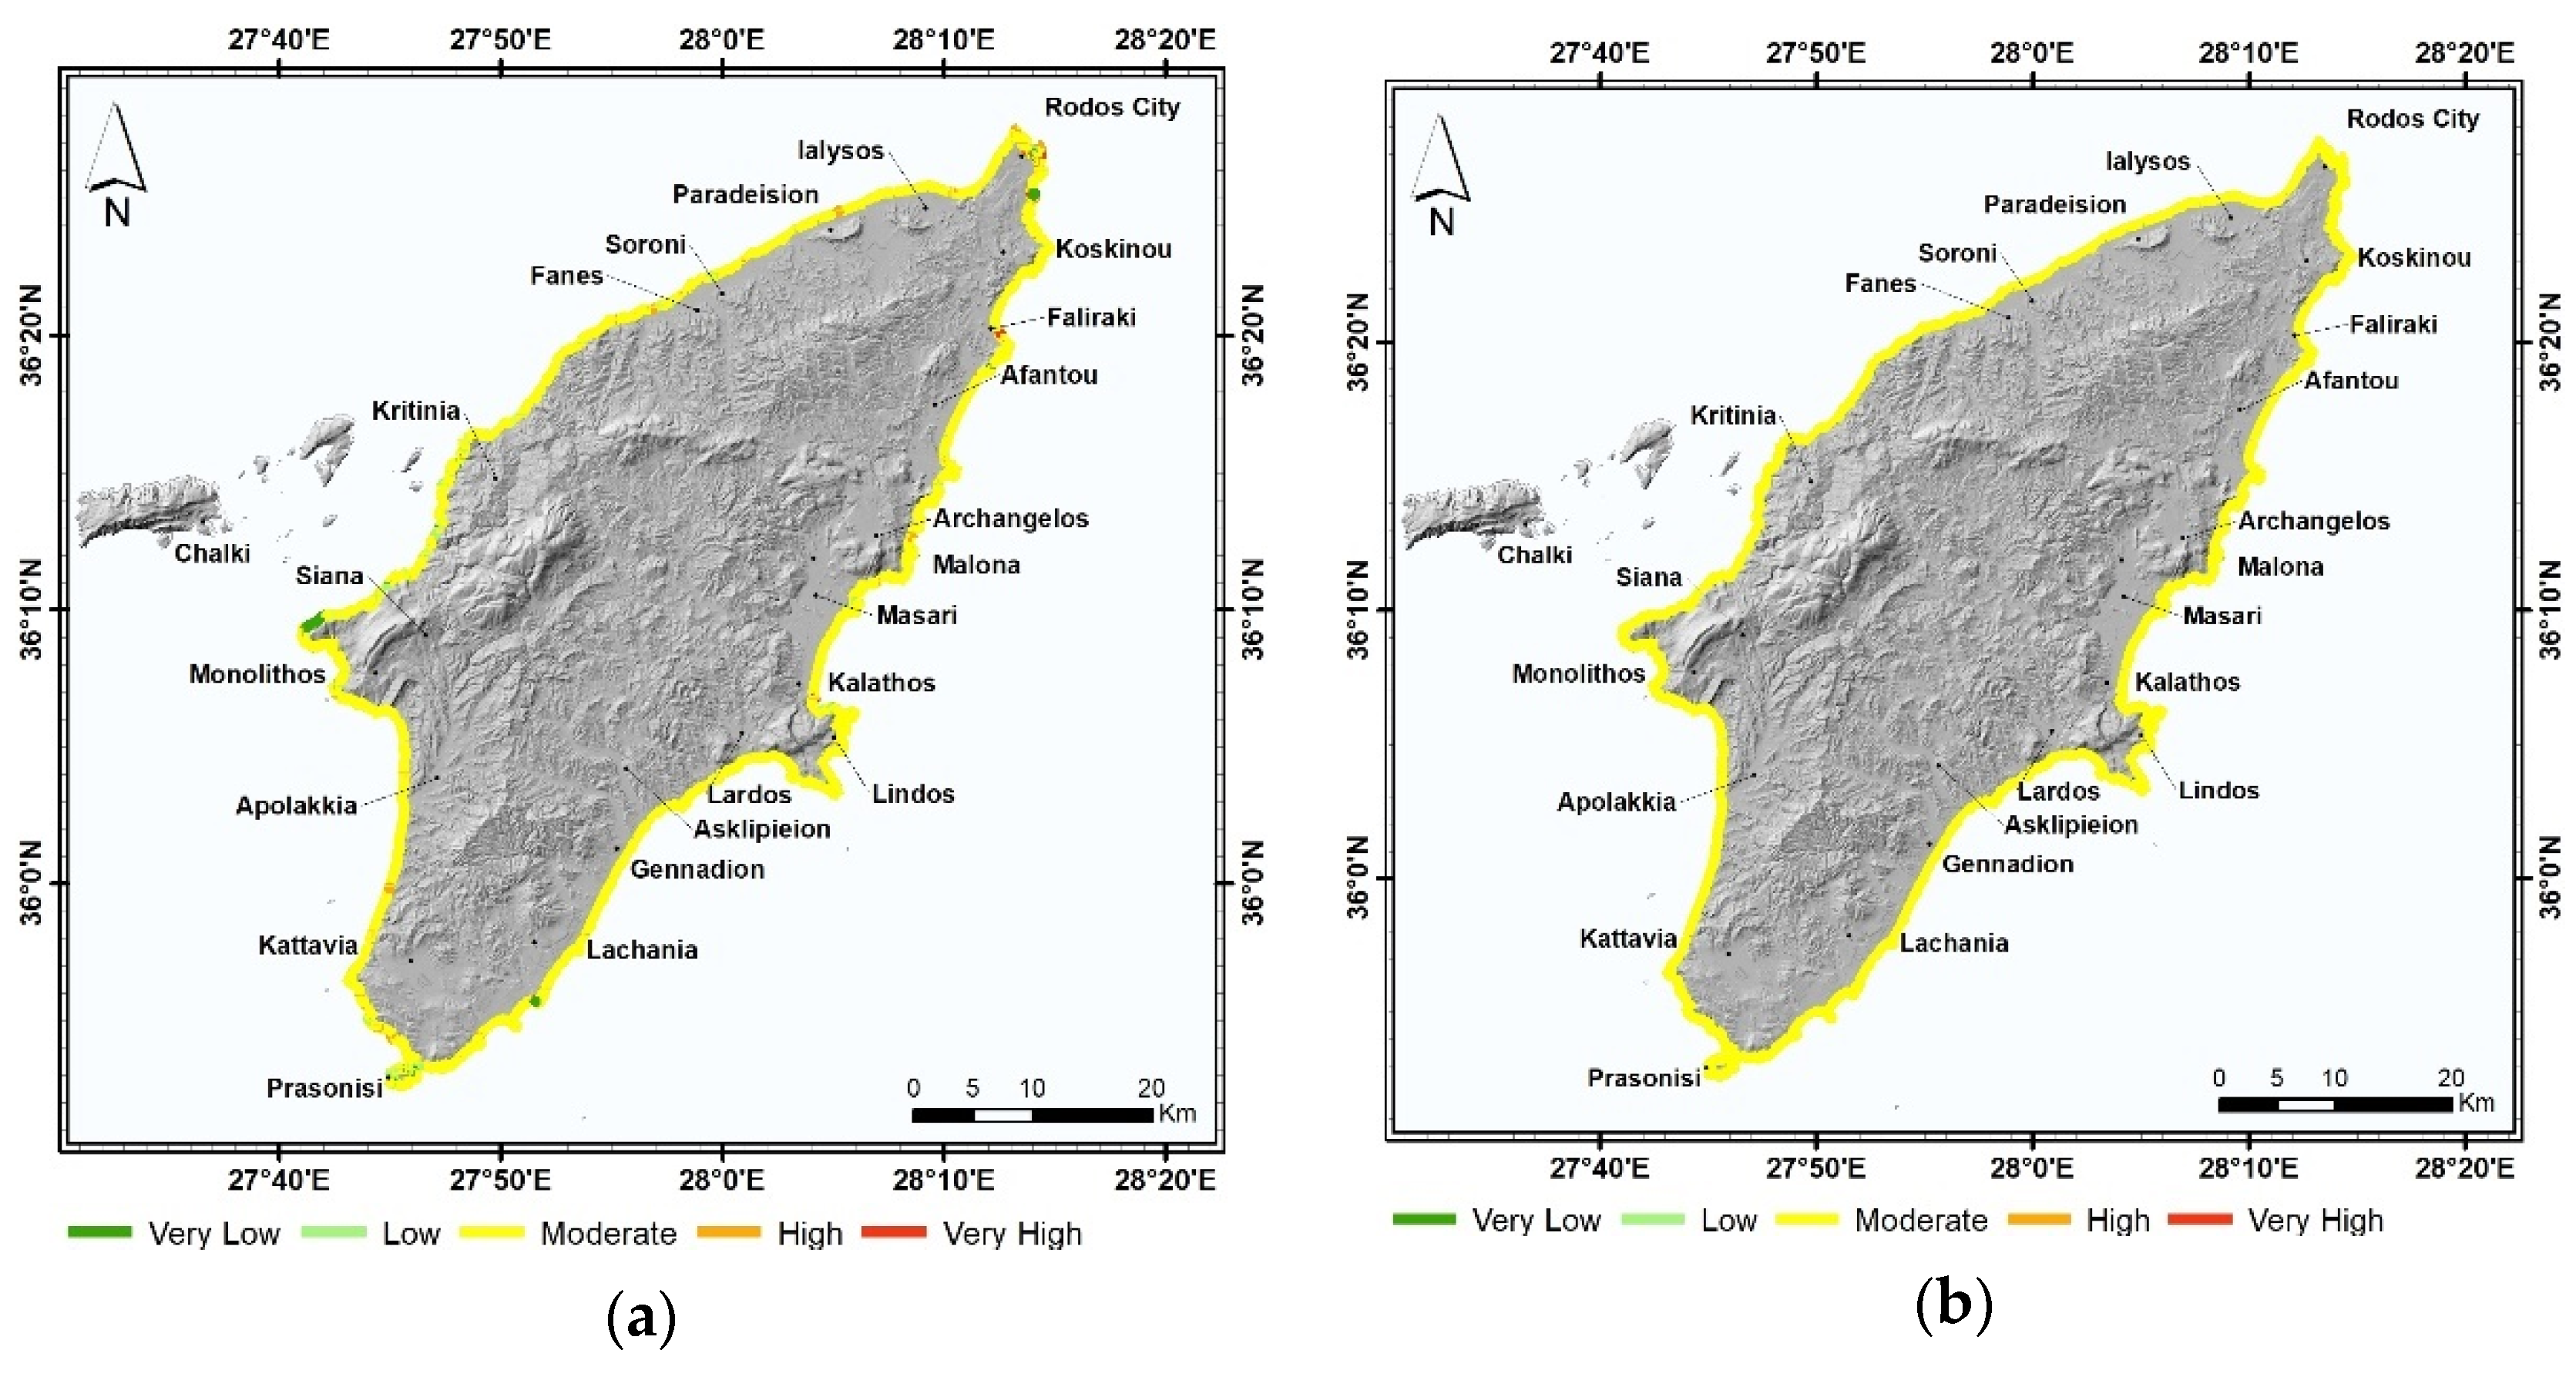
4.1.3. Mean Tidal Range
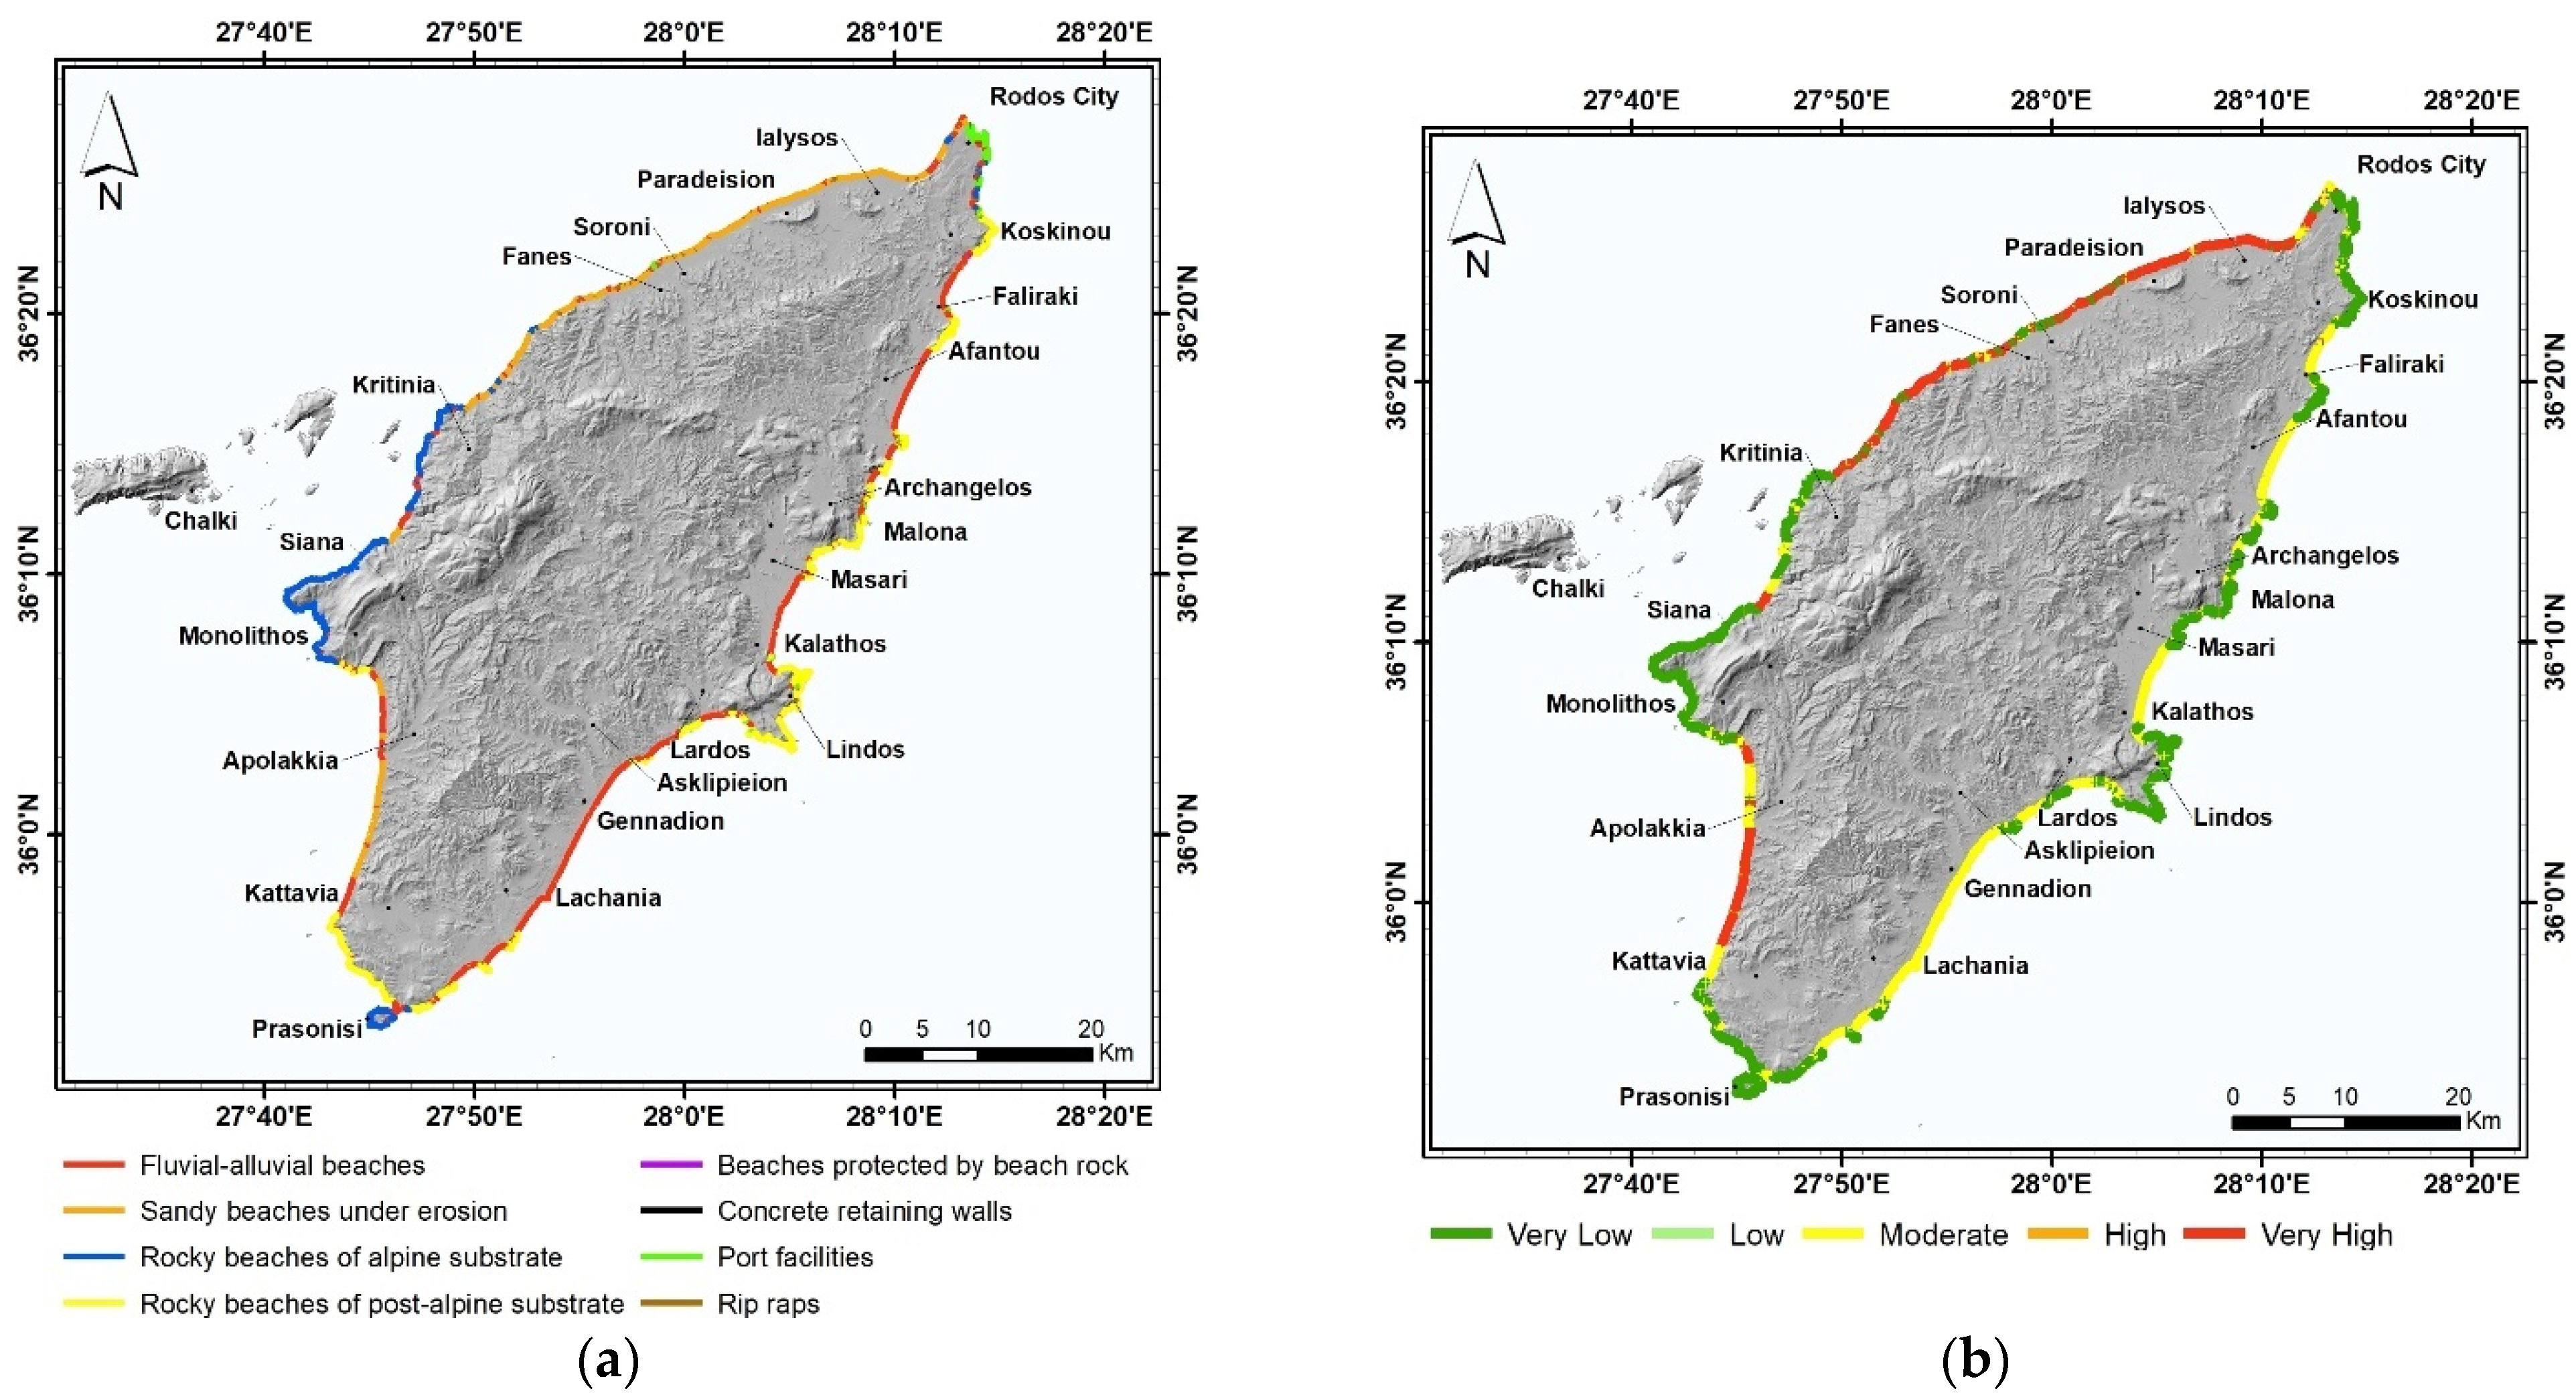
4.1.4. Lithology and Geomorphology
4.1.5. Coastal Slope
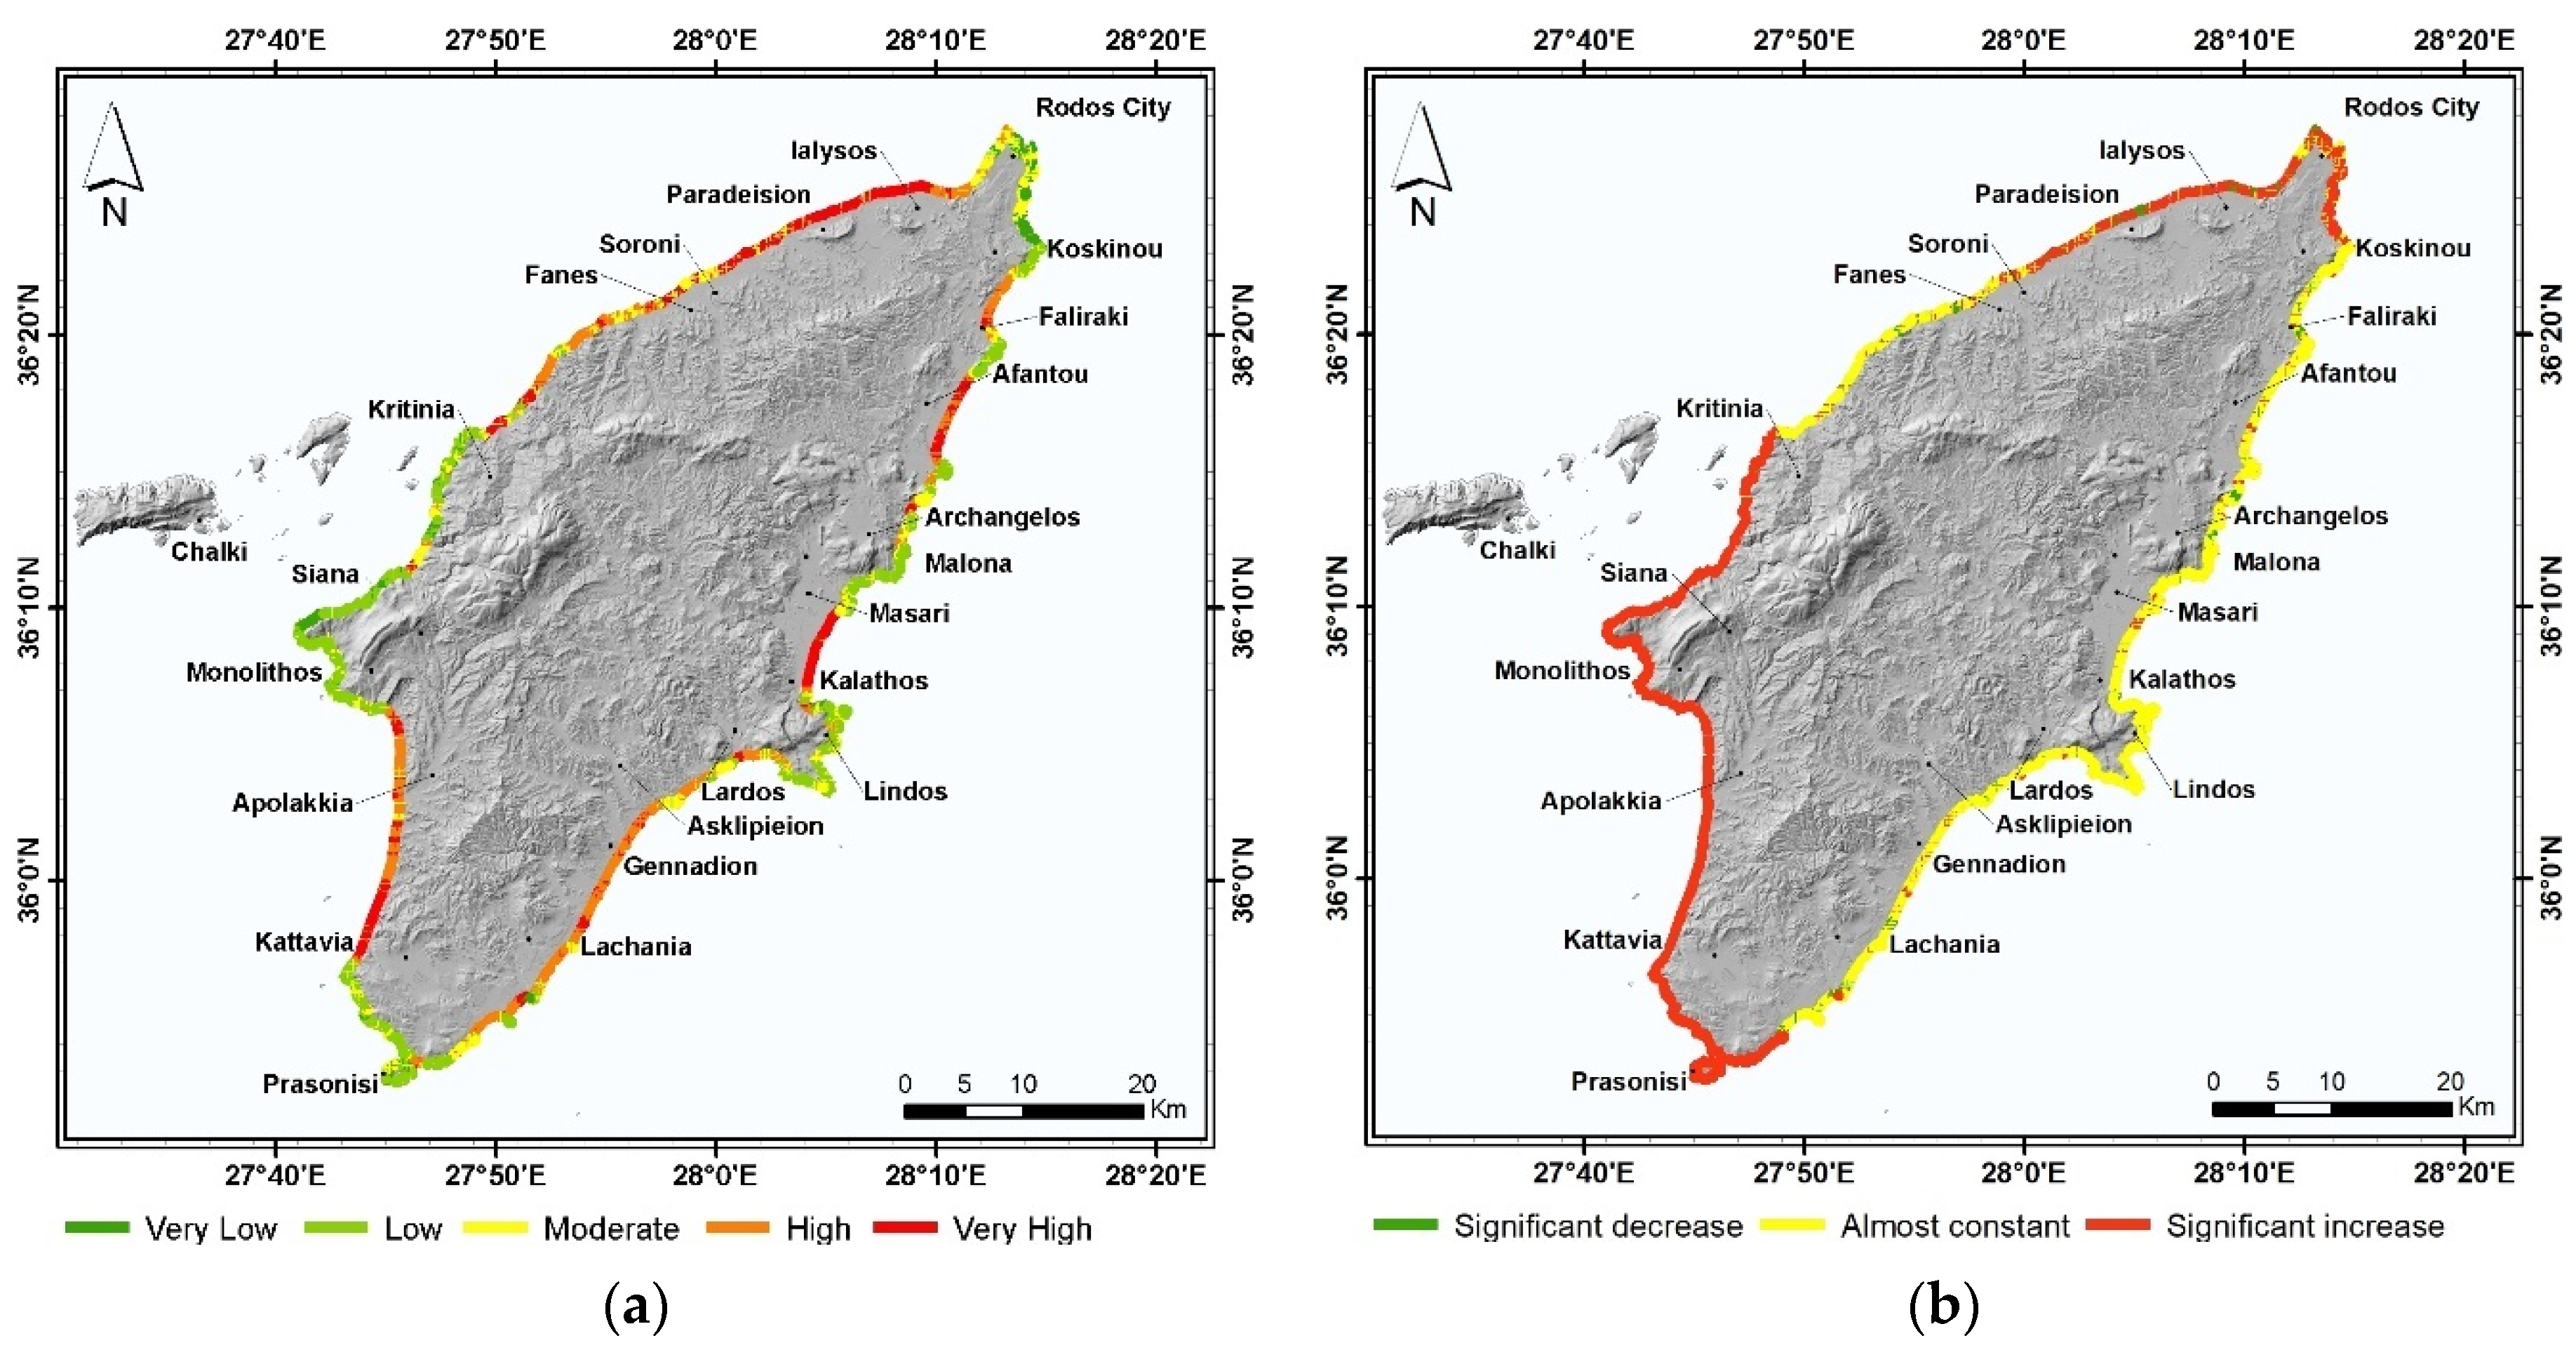
4.1.6. Mean Shoreline Change
4.1.7. Vertical Land Movements
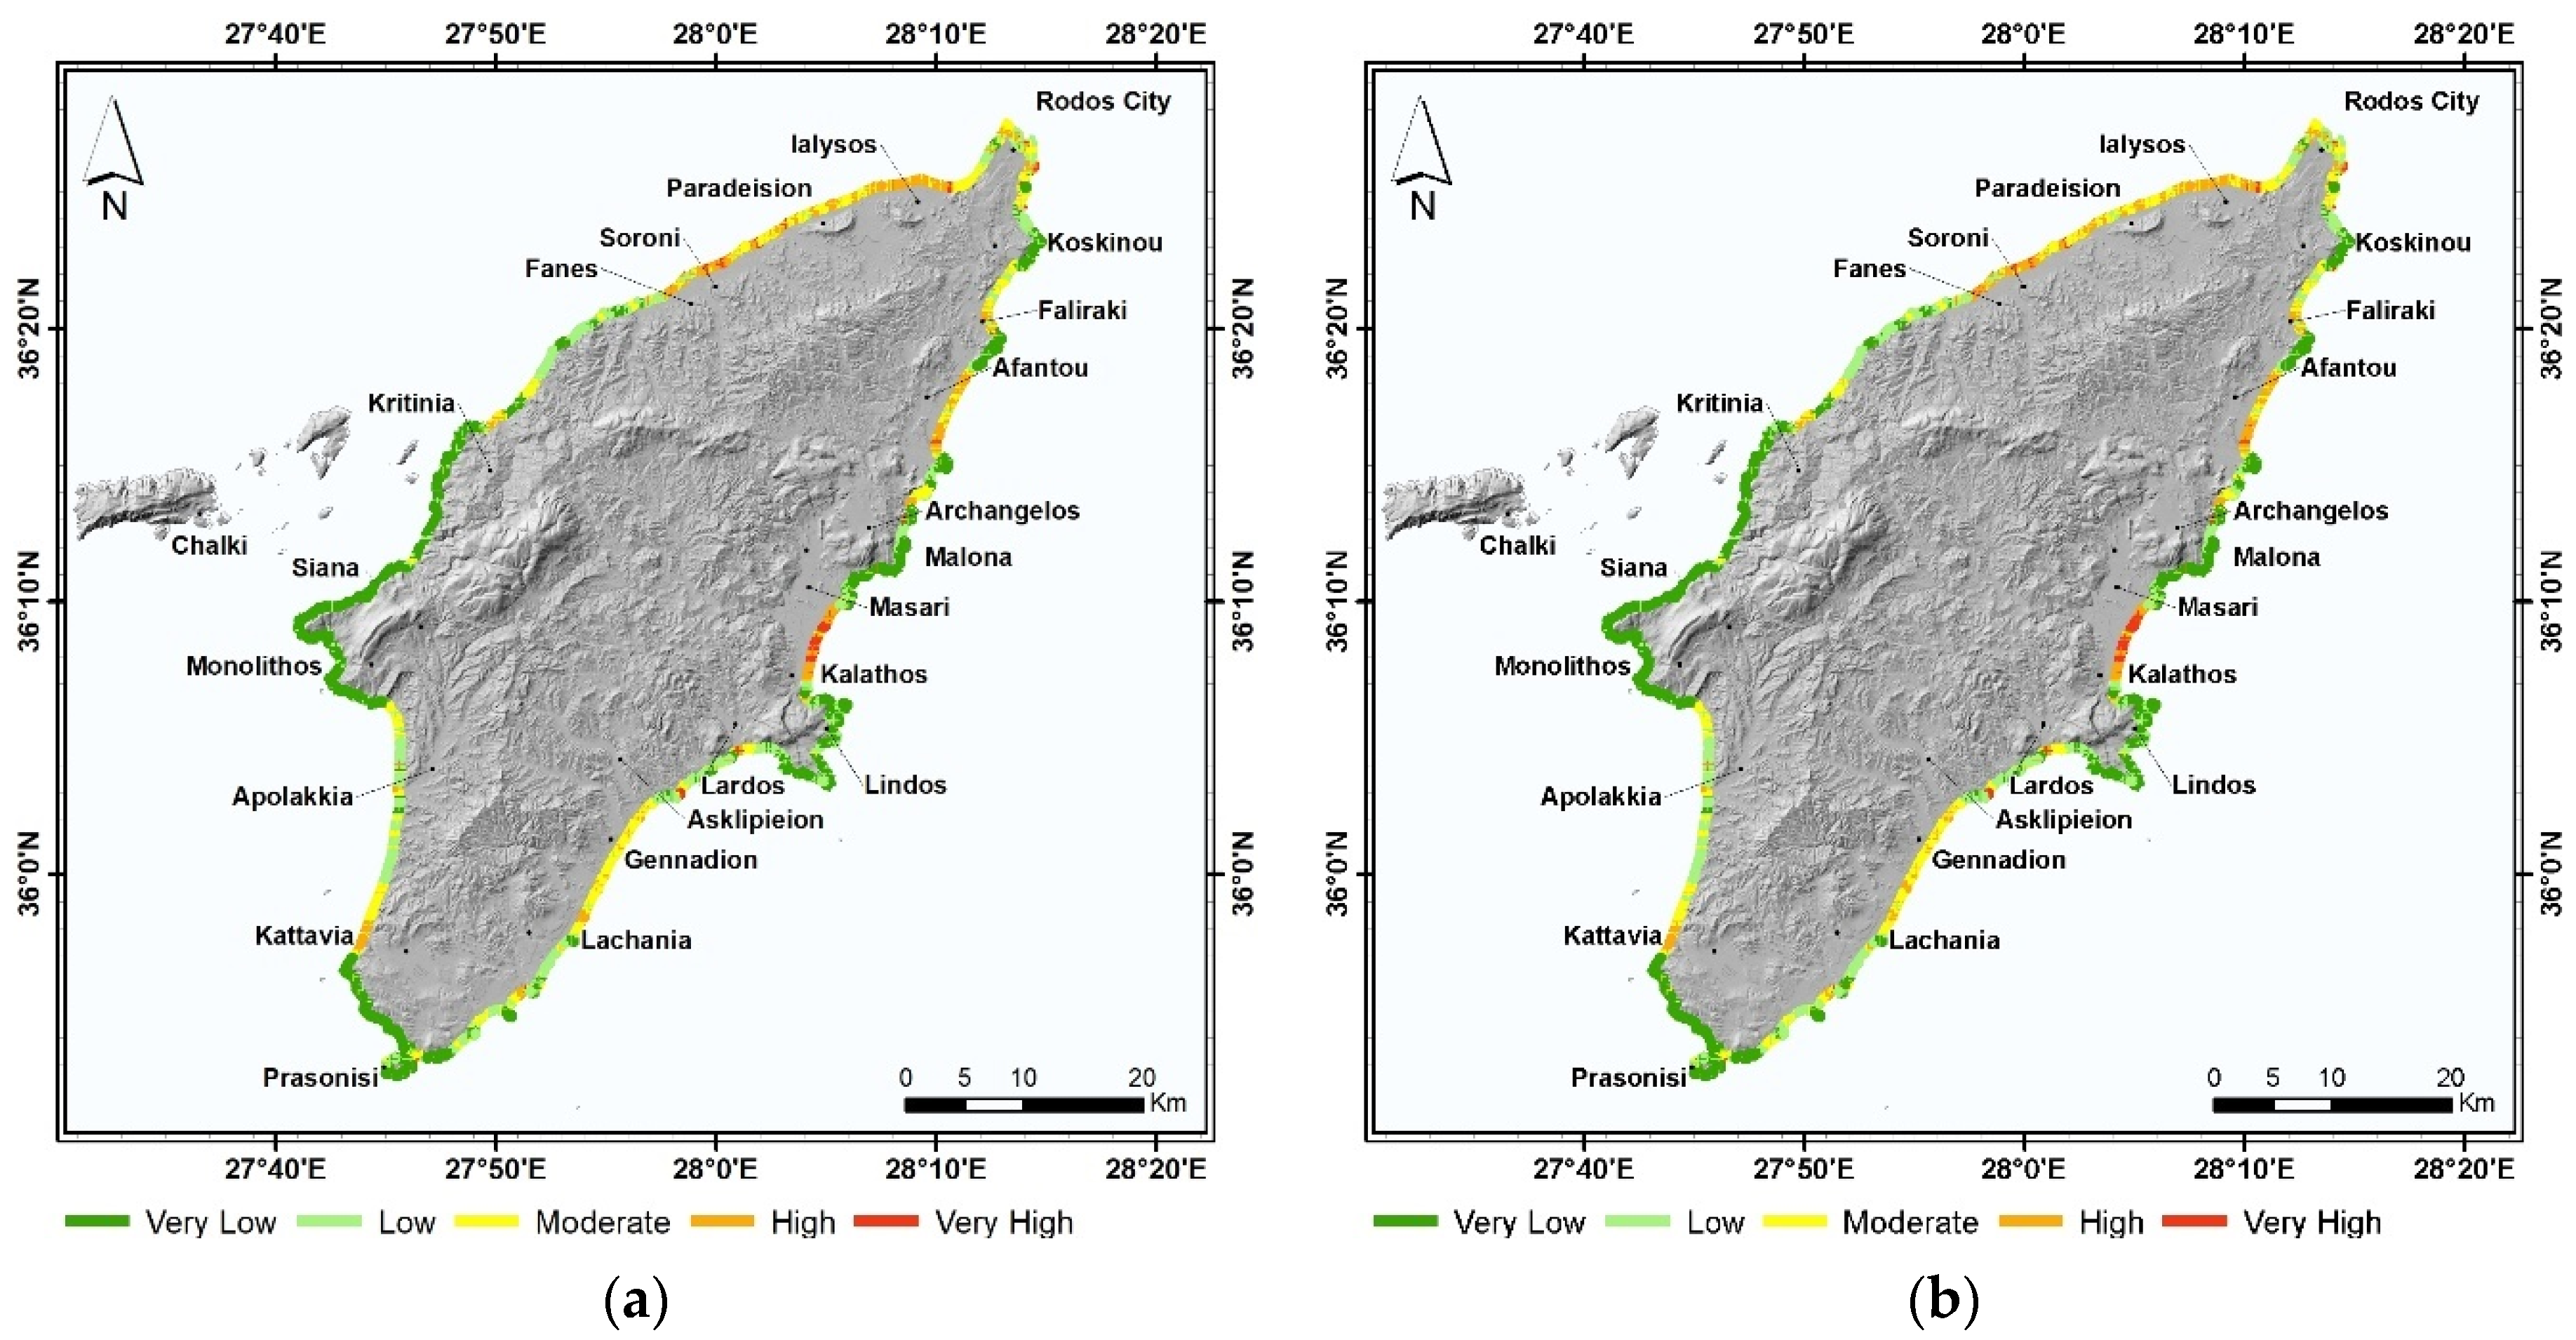
4.2. Asssessment of the Current CVI for Rhodes and the Projection to 2100
5. Discussion
6. Conclusions
Author Contributions
Funding
Institutional Review Board Statement
Informed Consent Statement
Data Availability Statement
Conflicts of Interest
References
- Monioudi, I.N.; Karditsa, A.; Chatzipavlis, A.; Alexandrakis, G.; Andreadis, O.P.; Velegrakis, A.F.; Poulos, S.E.; Ghionis, G.; Petrakis, S.; Sifnioti, D.; et al. Assessment of vulnerability of the eastern Cretan beaches (Greece) to sea level rise. Reg. Environ. Chang. 2016, 16, 1951–1962. [Google Scholar] [CrossRef]
- Alexandrakis, G.; Manasakis, C.; Kampanis, N.A. Valuating the effects of beach erosion to tourism revenue. A management perspective. Ocean Coast. Manag. 2015, 111, 1–11. [Google Scholar] [CrossRef]
- Kyriakou, K.; Hatiris, G.-A.; Kapsimalis, V.; Sourianos, E.; Vandarakis, D. The application of GIS in tourism carrying capacity assessment for the Island of Rhodes, Greece. In Proceedings of the 15th International Conference on Environmental Science and Technology (CEST), Rhodes Island, Greece, 31 August–2 September 2017. [Google Scholar]
- Toubes, D.; Gossling, S.; Hall, C.; Scott, D. Vulnerability of coastal beach tourism to flooding: A case study of Galicia, Spain. Environments 2017, 4, 83. [Google Scholar] [CrossRef] [Green Version]
- Di Luccio, D.; Benassai, G.; Di Paola, G.; Rosskopf, C.; Mucerino, L.; Montella, R.; Contestabile, P. Monitoring and modelling coastal vulnerability and mitigation proposal for an archaeological site (Kaulonia, Southern Italy). Sustainability 2018, 10, 2017. [Google Scholar] [CrossRef] [Green Version]
- Garcia-Artola, A.; Stephan, P.; Cearreta, A.; Kopp, R.E.; Khan, N.S.; Horton, B.P. Holocene sea–level database from the Atlantic coast of Europe. Quat. Sci. Rev. 2018, 196, 177–192. [Google Scholar] [CrossRef] [Green Version]
- Atkinson, A.L.; Baldock, T.E.; Birrien, F.; Callaghan, D.P.; Nielsen, P.; Beuzen, T.; Turner, I.L.; Blenkinsopp, C.E.; Ranasinghe, R. Laboratory investigation of the bruun rule and beach response to sea level rise. Coast. Eng. 2018, 136, 183–202. [Google Scholar] [CrossRef]
- Bigalbal, A.; Rezaie, A.; Garzon, J.; Ferreira, C. Potential impacts of sea level rise and coarse scale marsh migration on storm surge hydrodynamics and waves on coastal protected areas in the chesapeake Bay. J. Mar. Sci. Eng. 2018, 6, 86. [Google Scholar] [CrossRef] [Green Version]
- Vandarakis, D.; Kyriakou, K.; Gad, F.-K.; Kapsimalis, V.; Panagiotopoulos, I.; Loukaidi, V.; Hatiris, G.-A.; Sioulas, A. The carrying capacity and environmental friendly plans for future tourism development in Rhodes Island, Greece. Eur. J. Geogr. 2019, 10, 149–159. [Google Scholar]
- Sheik Mujabar, P.; Chandrasekar, N. Coastal erosion hazard and vulnerability assessment for southern coastal Tamil Nadu of India by using remote sensing and GIS. Nat. Hazards 2013, 69, 1295–1314. [Google Scholar] [CrossRef]
- Bosom, E.; Jimenez, J.A. Storm-induced coastal hazard assessment at regional scale: Application to Catalonia (NW Mediterranean). Adv. Geosci. 2010, 26, 83–87. [Google Scholar] [CrossRef] [Green Version]
- Butler, R.W. Sustainable tourism: A state–of–the–art review. Tour. Geogr. 1999, 1, 7–25. [Google Scholar] [CrossRef] [Green Version]
- Neto, F. A new approach to sustainable tourism development: Moving beyond environmental protection. Nat. Resour. Forum. 2003, 27, 212–222. [Google Scholar] [CrossRef]
- Jimenez, J.A.; Ciavola, P.; Balouin, Y.; Armaroli, C.; Bosom, E.; Gervais, M. Geomorphic coastal vulnerability to storms in microtidal fetch-limited environments: Application to NW Mediterranean and N Adriatic Seas. J. Coast. Res. 2009, 56, 1641–1645. [Google Scholar]
- Bosom, E.; Jimenez, J.A. Probabilistic coastal vulnerability assessment to storms at regional scale–application to Catalan beaches (NW Mediterranean). Nat. Hazards Earth Syst. Sci. 2011, 11, 475–484. [Google Scholar] [CrossRef] [Green Version]
- Widlansky, M.J.; Long, X.; Schloesser, F. Increase in sea level variability with ocean warming associated with the nonlinear thermal expansion of seawater. Commun. Earth Environ. 2020, 1, 9. [Google Scholar] [CrossRef]
- Lenton, T.M.; Rockström, J.; Gaffney, O.; Rahmstorf, S.; Richardson, K.; Steffen, W.; Schellnhuber, H.J. Climate tipping points—Too risky to bet against. Nature 2019, 575, 592–595. [Google Scholar] [CrossRef]
- Intergovernmental Panel on Climate Change (IPCC). Climate Change 2007–The Physical Science Basis: Working Group I Contribution to the Fourth Assessment Report of the IPCC, 1st ed.; Cambridge University Press: Cambridge, UK, 2007. [Google Scholar]
- Intergovernmental Panel on Climate Change (IPCC). Climate Change 2014–Impacts, Adaptation and Vulnerability: Working Group II Contribution to the Fifth Assessment Report of the IPCC, 1st ed.; Cambridge University Press: Cambridge, UK, 2014. [Google Scholar]
- Mani Murali, R.; Ankita, M.; Amrita, S.; Vethamony, P. Coastal vulnerability assessment of Puducherry coast, India, using the analytical hierarchical process. Nat. Hazards Earth Syst. Sci. 2013, 13, 3291–3311. [Google Scholar] [CrossRef] [Green Version]
- Koroglu, A.; Ranasinghe, R.; Jimenez, J.A.; Dastgheib, A. Comparison of Coastal vulnerability index applications for Barcelona province. Ocean Coast. Manag. 2019, 178, 104799. [Google Scholar] [CrossRef]
- Vagiona, D.; Kyriakou, K.; Sourianos, E. Perspectives for sustainable development on the Island of Rhodes (Greece): Public participation and stakeholder involvement. Fresenius Environ. Bull. 2013, 22, 2182–2190. [Google Scholar]
- Gornitz, V.M. Global coastal hazards from future sea level rise. Palaeogeogr. Palaeoclimatol. Palaeoecol. 1991, 89, 379–398. [Google Scholar] [CrossRef]
- Manning, R.E.; Lawson, S.R. Carrying capacity as ‘informed judgment’: The values of science and the science of values. Environ. Manag. 2002, 30, 157–168. [Google Scholar] [CrossRef] [PubMed]
- Snoussi, M.; Ouchani, T.; Niazi, S. Vulnerability assessment of the impact of sea–level rise and flooding on the Moroccan coast: The case of the Mediterranean eastern zone. Estuar. Coast. Shelf Sci. 2008, 77, 206–213. [Google Scholar] [CrossRef]
- Jolivet, L.; Faccenna, C. Mediterranean extension and the Africa–Eurasia collision. Tectonics 2000, 19, 1095–1106. [Google Scholar] [CrossRef]
- Cornee, J.-J.; Moissette, P.; Joannin, S.; Suc, J.-P.; Quillevere, F.; Krijgsman, W.; Hilgen, F.; Koskeridou, E.; Munch, P.; Lecuyer, C.; et al. Tectonic and climatic controls on coastal sedimentation: The late pliocene–middle pleistocene of northeastern Rhodes, Greece. Sediment. Geol. 2006, 187, 159–181. [Google Scholar] [CrossRef]
- Anzidei, M.; Lambeck, K.; Antonioli, F.; Furlani, S.; Mastronuzzi, G.; Serpelloni, E.; Vannucci, G. Coastal structure, sea–level changes and vertical motion of the land in the Mediterranean. Geol. Soc. London Spec. Publ. 2014, 388, 453–479. [Google Scholar] [CrossRef]
- Milker, Y.; Jorissen, F.J.; Riller, U.; Reicherter, K.; Titschack, J.; Weinkauf, M.F.G.; Theodor, M.; Schmiedl, G. Paleo-ecologic and neotectonic evolution of a marine depositional environment in SE Rhodes (Greece) during the early Pleistocene. Quat. Sci. Rev. 2019, 213, 120–132. [Google Scholar] [CrossRef]
- Pirazzoli, P.A.; Montaggioni, L.F.; Saliege, J.F.; Segonzac, G.; Thommeret, Y.; Vergnaud–Grazzini, C. Crustal block movements from Holocene shorelines: Rhodes island (Greece). Tectonophysics 1989, 170, 89–114. [Google Scholar] [CrossRef]
- Kontogianni, V.A.; Tsoulos, N.; Stiros, S.C. Coastal uplift, earthquakes and active faulting of Rhodes Island (Aegean Arc): Modeling based on geodetic inversion. Mar. Geol. 2002, 186, 299–317. [Google Scholar] [CrossRef]
- Howell, A.; Jackson, J.; England, P.; Higham, T.; Synolakis, C. Late holocene uplift of Rhodes, Greece: Evidence for a large tsunamigenic earthquake and the implications for the tectonics of the eastern hellenic trench system. Geophys. J. Int. 2015, 203, 459–474. [Google Scholar] [CrossRef] [Green Version]
- Gaillard, P.; Ravazzola, P.; Kontolios, C.; Arrivet, L.; Athanassoulis, G.A.; Stefanakos, C.N.; Gerostathis, P.; Cavaleri, L.; Bertotti, L.; Sclavo, M.; et al. Wind and Wave Atlas of the Mediterranean Sea, (software version) Western European Armaments Organisation Research Cell; NTUA: Athens, Greece, 2004; Available online: http://users.ntua.gr/mathan/pdf/Pages_from%20_WIND_WAVE_ATLAS_MEDITERRANEAN_SEA_2004.pdf (accessed on 26 July 2021).
- Soukissian, T.; Prospathopoulos, A.; Korres, G.; Papadopoulos, A.; Hatzinaki, M.; Kambouridou, M. A new wind and wave atlas of the Hellenic Seas. In Proceedings of the 27th International Conference on Offshore Mechanics and Arctic Engineering, Estoril, Portugal, 15–20 June 2008. [Google Scholar]
- Soukissian, T.H. The wave climate of the Aegean Sea: Wind waves. In State of the Hellenic Marine Environment, 1st ed.; Papathanassiou, E., Zenetos, A., Eds.; Hellenic Centre for Marine Research: Athens, Greece, 2005; pp. 65–73. [Google Scholar]
- Gad, F.-K.; Chatzinaki, M.; Vandarakis, D.; Kyriakidou, C.; Kapsimalis, V. Assessment of wave storm–induced flood vulnerability in Rhodes Island, Greece. Water 2020, 12, 2978. [Google Scholar] [CrossRef]
- Mutti, E.; Orombelli, G.; Pozzi, R. Geological studies on the Dodecanese Islands (Aegean Sea) IX. Geological map of the island of Rhodes (Greece). Explanatory notes. Ann. Geol. Des. Pays Hell. 1970, 22, 79–226. [Google Scholar]
- Lekkas, E.; Papanikolaou, D.; Sakellariou, D. Neotectonic Map of Greece, Rhodes Sheet 1:100,000; National and Kapodistrian University of Athens: Athens, Greece, 2000. [Google Scholar]
- Hanken, N.M.; Bromley, R.G.; Miller, J. Plio-Pleistocene sedimentation in coastal grabens, north–east Rhodes, Greece. Geol. J. 1996, 31, 393–418. [Google Scholar] [CrossRef]
- Titschack, J.; Nelson, C.S.; Beck, T.; Freiwald, A.; Radtke, U. Sedimentary evolution of a late pleistocene temperate red algal reef (Coralligène) on Rhodes, Greece: Correlation with global sea–level fluctuations. Sedimentology 2008, 55, 1747–1776. [Google Scholar] [CrossRef]
- Quillevere, F.; Cornée, J.-J.; Moissette, P.; López-Otálvaro, G.E.; van Baak, C.; Münch, P.; Melinte-Dobrinescu, M.C.; Krijgsman, W. Chronostratigraphy of uplifted quaternary hemipelagic deposits from the dodecanese island of Rhodes (Greece). Quat. Res. 2016, 86, 79–94. [Google Scholar] [CrossRef]
- Cornee, J.-J.; Quillevere, F.; Moissette, P.; Fietzke, J.; Lopez-Otalvaro, G.E.; Melinte-Dobrinescu, M.C.; Philippon, M.; van Hinsbergen, D.J.J.; Agiadi, K.; Koskeridou, E.; et al. Tectonic motion in oblique subduction forearcs: Insights from the revisited middle and upper pleistocene deposits of Rhodes, Greece. J. Geol. Soc. Lond. 2019, 176, 78–96. [Google Scholar] [CrossRef]
- Pyokari, M. The provenance of beach sediments on Rhodes, southeastern Greece, indicated by sediment texture, composition and roundness. Geomorphology 1997, 18, 315–332. [Google Scholar] [CrossRef]
- Verykiou-Papaspyridakou, E.; Bathrellos, G.; Skylodimou, C. Physico–geographical observations of the coastal zone of the northeastern part of Island Rhodes. Bull. Geol. Soc. Greece 2004, 36, 958–967. [Google Scholar] [CrossRef] [Green Version]
- Anagnostou, C.; Sioulas, A.; Hatiris, G.; Karageorgis, A.; Chronis, G. Erosion: A human induced threat for the NW coasts of Rhodes Island (SE Greece). In Proceedings of the 10th International Conference on the Mediterranean Coastal Environment, Rhodes Island, Greece, 25–29 October 2011; pp. 781–786. [Google Scholar]
- Faour, G.; Fayad, A.; Mhawej, M. GIS–based approach to the assessment of coastal vulnerability to sea level rise: Case study on the Eastern Mediterranean. J. Surv. Mapp. Eng. 2013, 1, 41–48. [Google Scholar]
- Loinenak, F.A.; Hartoko, A.; Muskananfola, M.R. Mapping of coastal vulnerability using the coastal vulnerability index and geographic information system. Int. J. Technol. 2015, 6, 5. [Google Scholar] [CrossRef]
- Gornitz, V.M.; Daniels, R.C.; White, T.W.; Birdwell, K.R. The development of a coastal vulnerability assessment database: Vulnerability to sea-level rise in the US southeast. J. Coast. Res. 1994, 327–338. Available online: http://www.jstor.org/stable/25735608 (accessed on 7 August 2021).
- Thieler, E.R.; Hammar-Klose, E.S. National Assessment of Coastal Vulnerability to Sea-Level Rise: Preliminary Results for the US Gulf of Mexico Coast; Open–File Report 2000–179; US Geological Survey: Woods Hole, MA, USA, 2000.
- Cogswell, A.; Greenan, B.J.W.; Greyson, P. Evaluation of two common vulnerability index calculation methods. Ocean Coast. Manag. 2018, 160, 46–51. [Google Scholar] [CrossRef]
- European Topic Centre on Climate Change Impacts, Vulnerability and Adaptation. Methods for Assessing Coastal Vulnerability to Climate Change; Technical Paper 1; European Environment Agency/ETC–CCA: Bologna, Italy, 2011. [Google Scholar]
- Pendleton, E.A.; Thieler, E.R.; Williams, S.J.; Beavers, R.S. Coastal Vulnerability Assessment of Padre Island National Seashore (PAIS) to Sea–Level Rise; Open–File Report 2004–1090; US Geological Survey: Woods Hole, MA, USA, 2004.
- Pendleton, E.A.; Barras, J.A.; Williams, S.J.; Twichell, D.D. Coastal Vulnerability Assessment of the Northern Gulf of Mexico to Sea Level Rise and Coastal Change; Open–File Report 2010–1146; US Geological Survey: Woods Hole, MA, USA, 2010.
- Kaliraj, S.; Chandrasekar, N. Geo-processing model on coastal vulnerability index to explore vulnerability zone along the south west coast of Tamilnadu, India. Int. J. Earth Sci. Eng. 2012, 5, 1138–1147. [Google Scholar]
- Karymbalis, E.; Chalkias, C.; Chalkias, G.; Grigoropoulou, E.; Manthos, G.; Ferentinou, M. Assessment of the sensitivity of the southern coast of the Gulf of Corinth (Peloponnese, Greece) to sea-level rise. Open Geosci. 2012, 4, 561–577. [Google Scholar] [CrossRef]
- Dimou, A.; Vassilakis, E.; Antoniou, V.; Evelpidou, N. An assessment of the coastal erosion at marathon east Attica, Greece. In Proceedings of the 10th International Congress of the Hellenic Geographical Society, Thessaloniki, Greece, 22–24 October 2014; pp. 1579–1587. [Google Scholar]
- Tragaki, A.; Gallousi, C.; Karymbalis, E. Coastal hazard vulnerability assessment based on geomorphic, oceanographic and demographic parameters: The case of the Peloponnese (Southern Greece). Land 2018, 7, 56. [Google Scholar] [CrossRef] [Green Version]
- Kantamaneni, K.; Sudha Rani, N.N.V.; Rice, L.; Sur, K.; Thayaparan, M.; Kulatunga, U.; Rege, R.; Yenneti, K.; Campos, L. A systematic review of coastal vulnerability assessment studies along Andhra Pradesh, India: A critical evaluation of data gathering, risk levels and mitigation strategies. Water 2019, 11, 393. [Google Scholar] [CrossRef] [Green Version]
- Lambeck, K. Sea–level change and shore–line evolution in Aegean Greece since upper palaeolithic time. Antiquity 1996, 70, 588–611. [Google Scholar] [CrossRef] [Green Version]
- Lambeck, K.; Purcell, A. Sea–level change in the Mediterranean Sea since the LGM: Model predictions for tectonically stable areas. Quat. Sci. Rev. 2005, 24, 1969–1988. [Google Scholar] [CrossRef]
- Cazenave, A.; Bonnefond, P.; Mercier, F.; Dominh, K.; Toumazou, V. Sea level variations in the Mediterranean Sea and Black Sea from satellite altimetry and tide gauges. Glob. Planet. Change 2002, 34, 59–86. [Google Scholar] [CrossRef]
- Tsimplis, M.N.; Rixen, M. Sea level in the Mediterranean Sea: The contribution of temperature and salinity changes. Geophys. Res. Lett. 2002, 29, 2136. [Google Scholar] [CrossRef] [Green Version]
- Calafat, F.M.; Gomis, D. Reconstruction of Mediterranean sea level fields for the period 1945–2000. Glob. Planet. Change 2009, 66, 225–234. [Google Scholar] [CrossRef] [Green Version]
- Tsimplis, M.; Spada, G.; Marcos, M.; Flemming, N. Multi–decadal sea level trends and land movements in the Mediterranean Sea with estimates of factors perturbing tide gauge data and cumulative uncertainties. Glob. Planet. Change 2011, 76, 63–76. [Google Scholar] [CrossRef]
- Landerer, F.W.; Volkov, D.L. The anatomy of recent large sea level fluctuations in the Mediterranean Sea. Geophys. Res. Lett. 2013, 40, 553–557. [Google Scholar] [CrossRef]
- Woppelmann, G.; Marcos, M. Coastal sea level rise in southern Europe and the nonclimate contribution of vertical land motion. J. Geophys. Res. Ocean 2012, 117, C01007. [Google Scholar] [CrossRef] [Green Version]
- Bonaduce, A.; Pinardi, N.; Oddo, P.; Spada, G.; Larnicol, G. Sea–level variability in the Mediterranean Sea from altimetry and tide gauges. Clim. Dyn. 2016, 47, 2851–2866. [Google Scholar] [CrossRef] [Green Version]
- Permanent Service for Mean Sea Level (PSMSL). Available online: http://www.psmsl.org/ (accessed on 29 May 2021).
- Copernicus Marine Environment Monitoring Service (CMEMS). Available online: http://marine.copernicus.eu/services-portfolio/access-to-products/?option=com_csw&view=details&product_id=MEDSEA_REANALYSIS_PHYS_006_004 (accessed on 26 July 2021).
- Jevrejeva, S.; Jackson, L.P.; Riva, R.E.M.; Grinsted, A.; Moore, J.C. Coastal sea level rise with warming above 2 °C. Proc. Natl. Acad. Sci. USA 2016, 113, 13342–13347. [Google Scholar] [CrossRef] [PubMed] [Green Version]
- Jackson, L.P.; Jevrejeva, S. A probabilistic approach to 21st century regional sea–level projections using RCP and High–End scenarios. Glob. Planet. Change 2016, 146, 179–1896. [Google Scholar] [CrossRef] [Green Version]
- Open Telemac–Mascaret. Available online: http://www.opentelemac.org/index.php/presentation?id=20 (accessed on 26 July 2021).
- Copernicus Marine Environment Monitoring Service (CMEMS). Available online: https://resources.marine.copernicus.eu/?option=com_csw&view=details&product_id=MEDSEA_MULTIYEAR_WAV_006_012 (accessed on 26 July 2021).
- Soclimpact. Available online: https://soclimpact.net/wp-content/uploads/2020/02/12-D4.2-High-resolution-wave-and-sea-level-climatology-atlas.-1.pdf (accessed on 26 July 2021).
- Tsimplis, M.N. Tidal oscillations in the Aegean and Ionian Seas. Estuar. Coast. Shelf Sci. 1994, 39, 201–208. [Google Scholar] [CrossRef]
- Vousdoukas, M.I.; Mentaschi, L.; Voukouvalas, E.; Verlaan, M.; Feyen, L. Extreme sea levels on the rise along Europe’s coasts. Earths Future 2017, 5, 304–323. [Google Scholar] [CrossRef]
- COAST (2007–2013). Available online: https://www.keep.eu/project/15060/configuration-and-pilot-implementation-plans-integrated-coastal-zone-management-in-rhodes-and-cyprus (accessed on 26 July 2021).
- Hellenic Cadastre. Available online: https://www.ktimatologio.gr/en (accessed on 26 July 2021).
- Doran, K.S.; Long, J.W.; Overbeck, J.R. A Method for Determining Average Beach Slope and Beach Slope Variability for US Sandy Coastlines; Open–File Report 2015–1053; US Geological Survey: Reston, VA, USA, 2015.
- US Geological Survey. Available online: https://www.usgs.gov (accessed on 29 May 2021).
- Pardo-Pascual, J.E.; Almonacid-Caballer, J.; Ruiz, L.A.; Palomar-Vázquez, J. Automatic extraction of shorelines from Landsat TM and ETM+ multi–temporal images with subpixel precision. Remote Sens. Environ. 2012, 123, 1–11. [Google Scholar] [CrossRef] [Green Version]
- Bruun, P. Sea–level rise as a cause of shore erosion. J. Waterw. Harb. Div. 1962, 88, 117–130. [Google Scholar] [CrossRef]
- Dean, R.G.; Dalrymple, R.A. Water Wave Mechanics for Engineers and Scientists. In Advanced Series on Ocean Engineering; World Scientific: Hackensack, NJ, USA, 1991; Volume 2. [Google Scholar]
- Kriebel, D.L.; Dean, R.G. Convolution method for time-dependent beach–profile response. J. Waterw. Port. Coastal Ocean Eng. 1993, 119, 204–226. [Google Scholar] [CrossRef]
- Le Cozannet, G.; Bulteau, T.; Castelle, B.; Ranasinghe, R.; Woppelmann, G.; Rohmer, J.; Bernon, N.; Idier, D.; Louisor, J.; Salas-y-Mélia, D. Quantifying uncertainties of sandy shoreline change projections as sea level rises. Sci. Rep. 2019, 9, 1–11. [Google Scholar] [CrossRef] [Green Version]
- Thieblemont, R.; Le Cozannet, G.; Toimil, A.; Meyssignac, B.; Losada, I.J. Likely and high–end impacts of regional sea–level rise on the shoreline change of European sandy coasts under a high greenhouse gas emissions scenario. Water 2019, 11, 2607. [Google Scholar] [CrossRef] [Green Version]
- Vousdoukas, M.I.; Ranasinghe, R.; Mentaschi, L.; Plomaritis, T.A.; Athanasiou, P.; Luijendijk, A.; Feyen, L. Sandy coastlines under threat of erosion. Nat. Clim. Chang. 2020, 10, 260–263. [Google Scholar] [CrossRef]
- Flemming, N. Holocene eustatic changes and coastal tectonics in the Northeast Mediterranena: Implications for models of crustal consumption (plus Appendix). Phil. Trans. R. Soc. Lond. Ser. A 1978, 289, 405–458. [Google Scholar]
- Pirazzoli, P.A.; Montaggioni, L.; Thommeret, J.; Thommeret, Y.; Laborel, J. Sur les lignes de rivage et la neotectonique a Rhodes (Grece) à l’Holocene. Ann. Inst. Oceanogr. 1982, 58, 89–102. [Google Scholar]
- Pirazzoli, P.A. Sea–Level Changes and crustal movements in the hellenic arc (Greece). The contribution of archaeological and historical data. In Archaeology of Coastal Changes, Proceedings of the 1st International Symposium “Cities on the Sea—Past and Present”, Haifa, Israel, 22–29 September 1986; Raban, A., Ed.; BAR International Series: Oxford, UK, 1988; Volume 404, pp. 157–184. [Google Scholar]
- Stiros, S.C.; Blackman, D.J. Seismic coastal uplift and subsidence in Rhodes Island, Aegean Arc: Evidence from an uplifted ancient harbour. Tectonophysics 2014, 611, 114–120. [Google Scholar] [CrossRef]
- Woessner, J.; Laurentiu, D.; Giardini, D.; Crowley, H.; Cotton, F.; Grünthal, G.; Valensise, G.; Arvidsson, R.; Basili, R.; Demircioglu, M.B.; et al. The share consortium. The 2013 European seismic hazard model: Key components and results. Bull. Earthq. Eng. 2015, 13, 3553–3596. [Google Scholar] [CrossRef] [Green Version]
- WCRP Global Sea Level Budget Group. Global sea-level budget 1993–present. Earth Syst. Sci. Data 2018, 10, 1551–1590. [CrossRef] [Green Version]
- Taibi, H.; Haddad, M. Estimating trends of the Mediterranean Sea level changes from tide gauge and satellite altimetry data (1993–2015). J. Oceanol. Limnol. 2019, 37, 1176–1185. [Google Scholar] [CrossRef]
- Ganas, A.; Parsons, T. Three-dimensional model of Hellenic Arc deformation and origin of the Cretan uplift. J. Geophys. Res. 2009, 114, B06404. [Google Scholar] [CrossRef] [Green Version]
- Adebisi, N.; Balogun, A.-L.; Min, T.H.; Tella, A. Advances in estimating sea level rise: A review of tide gauge, satellite altimetry and spatial data science approaches. Ocean. Coast. Manag. 2021, 208, 105632. [Google Scholar] [CrossRef]
- Zacharioudaki, A.; Korres, G.; Perivoliotis, L. Wave climate of the Hellenic Seas obtained from a wave hindcast for the period 1960–2001. Ocean Dyn. 2015, 65, 795–816. [Google Scholar] [CrossRef]
- Jadidoleslam, N.; Özger, M.; Ağıralioğlu, N. Wave power potential assessment of Aegean Sea with an integrated 15–year data. Renew Energy 2016, 86, 1045–1059. [Google Scholar] [CrossRef]
- Lionello, P.; Cogo, S.; Galati, M.B.; Sanna, A. The Mediterranean surface wave climate inferred from future scenario simulations. Glob. Planet. Change 2008, 63, 152–162. [Google Scholar] [CrossRef]
- Casas-Prat, M.; Sierra, J.P. Projected future wave climate in the NW Mediterranean Sea. J. Geophys. Res. Ocean 2013, 118, 3548–3568. [Google Scholar] [CrossRef]
- Shaw, J.; Taylor, R.B.; Forbes, D.L.; Ruz, M.-H.; Solomon, S. Sensitivity of the Canadian Coast to Sea–Level Rise; Geological Survey of Canada: Ottawa, ON, Canada, 1998.
- Dwarakish, G.S.; Vinay, S.A.; Natesan, U.; Asano, T.; Kakinuma, T.; Venkataramana, K.; Pai, B.J.; Babita, M.K. Coastal vulnerability assessment of the future sea level rise in Udupi coastal zone of Karnataka state, west coast of India. Ocean Coast. Manag. 2009, 52, 467–478. [Google Scholar] [CrossRef]
- Parthasarathy, A.; Natesan, U. Coastal vulnerability assessment: A case study on erosion and coastal change along Tuticorin, Gulf of Mannar. Nat. Hazards 2015, 75, 1713–1729. [Google Scholar] [CrossRef]
- Hereher, M.E. Coastal vulnerability assessment for Egypt’s Mediterranean coast. Geomat. Nat. Hazards Risk 2015, 6, 342–355. [Google Scholar] [CrossRef] [Green Version]
- Pantusa, D.; D’Alessandro, F.; Riefolo, L.; Principato, F.; Tomasicchio, G. Application of a coastal vulnerability index. A case study along the apulian coastline, Italy. Water 2018, 10, 1218. [Google Scholar] [CrossRef] [Green Version]
- Musa, Z.N.; Popescu, I.; Mynett, A. The Niger Delta’s vulnerability to river floods due to sea level rise. Nat. Hazards Earth Syst. Sci. 2014, 14, 3317–3329. [Google Scholar] [CrossRef] [Green Version]
- Tano, R.A.; Aman, A.; Kouadio, K.Y.; Toualy, E.; Ali, K.E.; Assamoi, P. Assessment of the Ivorian Coastal vulnerability. J. Coast. Res. 2016, 32, 1495. [Google Scholar]
- Benassai, G.; Di Paola, G.; Aucelli, P.P.C. Coastal vulnerability assessment of a micro-tidal littoral plain in response to sea level rise. Ocean Coast. Manag. 2015, 104, 22–35. [Google Scholar] [CrossRef]
- Cahoon, D.; Guntenspergen, G. Climate change, sea–level rise, and coastal wetlands. Natl. Wetl. Newsl. 2010, 32, 8–12. [Google Scholar]
- Anagnostou, C.; Antoniou, P.F.; Hatiris, G.-A. Erosion of a depositional coast in NE Rhodes Island (SE Greece) and assessment of the best available measures for coast protection. J. Coast. Res. 2011, 1316–1319. [Google Scholar]
- Bromley, R.G.; Milàn, J.; Uchman, A.; Hansen, K.S. Rheotactic macaronichnus, and human and cattle trackways in holocene beachrock, Greece: Reconstruction of paleoshoreline orientation. Ichnos 2009, 16, 103–117. [Google Scholar] [CrossRef]
- Gad, F.-K.; Hatiris, G.-A.; Loukaidi, V.; Dimitriadou, S.; Drakopoulou, P.; Sioulas, A.; Kapsimalis, V. Long–Term shoreline displacements and coastal morphodynamic pattern of North Rhodes Island, Greece. Water 2018, 10, 849. [Google Scholar] [CrossRef] [Green Version]
- Pavlopoulos, K.; Kapsimalis, V.; Theodorakopoulou, K.; Panagiotopoulos, I.P. Vertical displacement trends in the Aegean coastal zone (NE Mediterranean) during the Holocene assessed by geo–archaeological data. Holocene 2012, 22, 717–728. [Google Scholar] [CrossRef]
- Gallen, S.F.; Wegmann, K.W.; Bohnenstiehl, D.R.; Pazzaglia, F.J.; Brandon, M.T.; Fassoulas, C. Active simultaneous uplift and margin-normal extension in a forearc high, Crete, Greece. Earth Planet. Sci. Lett. 2014, 398, 11–24. [Google Scholar] [CrossRef]
- Robertson, J.; Meschis, M.; Roberts, G.P.; Ganas, A.; Gheorghiu, D.M. Temporally constant quaternary uplift rates and their relationship with extensional upper-plate faults in South Crete (Greece), constrained With 36Cl cosmogenic exposure dating. Tectonics 2019, 38, 1189–1222. [Google Scholar] [CrossRef] [Green Version]
- Le Pichon, X.; Celal Sengor, A.M.; Imren, C. A new approach to the opening of the eastern Mediterranean sea and the origin of the Hellenic subduction zone. Part 2: The hellenic subduction zone. Can. J. Earth Sci. 2019, 56, 1144–1162. [Google Scholar] [CrossRef]
- Ballu, V.; Bouin, M.-N.; Siméoni, P.; Crawford, W.C.; Calmant, S.; Boré, J.-M.; Kanas, T.; Pelletier, B. Comparing the role of absolute sea–level rise and vertical tectonic motions in coastal flooding, Torres Islands (Vanuatu). Proc. Natl. Acad. Sci. USA 2011, 108, 13019–13022. [Google Scholar] [CrossRef] [Green Version]
- Ostanciaux, E.; Husson, L.; Choblet, G.; Robin, C.; Pedoja, K. Present–day trends of vertical ground motion along the coast lines. Earth–Sci. Rev. 2012, 110, 74–92. [Google Scholar] [CrossRef] [Green Version]
- Martinez-Asensio, A.; Woppelmann, G.; Ballu, V.; Becker, M.; Testut, L.; Magnan, A.K.; Duvat, V.K.E. Relative sea–level rise and the influence of vertical land motion at Tropical Pacific Islands. Glob. Planet. Change 2019, 176, 132–143. [Google Scholar] [CrossRef]
- Rajasree, B.R.; Deo, M.C. Assessment of coastal vulnerability considering the future climate: A case study along the central west coast of India. J. Waterw. Port. Coast. Ocean Eng. 2020, 146, 05019005. [Google Scholar] [CrossRef]
- Benetazzo, A.; Fedele, F.; Carniel, S.; Ricchi, A.; Bucchignani, E.; Sclavo, M. Wave climate of the Adriatic sea: A future scenario simulation. Nat. Hazards Earth Syst. Sci. 2012, 12, 2065–2076. [Google Scholar] [CrossRef] [Green Version]
- Makris, C.; Galiatsatou, P.; Tolika, K.; Anagnostopoulou, C.; Kombiadou, K.; Prinos, P.; Velikou, K.; Kapelonis, Z.; Tragou, E.; Androulidakis, Y.; et al. Climate change effects on the marine characteristics of the Aegean and Ionian seas. Ocean Dyn. 2016, 66, 1603–1635. [Google Scholar] [CrossRef]
- Le Cozannet, G.; Oliveros, C.; Castelle, B.; Garcin, M.; Idier, D.; Pedreros, R.; Rohmer, J. Uncertainties in sandy shorelines evolution under the bruun rule assumption. Front. Mar. Sci. 2016, 3, 49. [Google Scholar] [CrossRef] [Green Version]
- Lekkas, E.; Sakellarιou, D.; Bertakis, G.; Lozios, S. Location of geohazards at Rhodes island, SE Greece. In Proceedings of the 8th International Congress of the International Association for Engineering Geology and the Environment, Vancouver, BC, Canada, 21–25 September 1998; pp. 953–958. [Google Scholar]
- Okada, Y. Surface deformation due to shear and tensile faults in a half space. Bull. Seism. Soc. Am. 1985, 75, 1135–1154. [Google Scholar] [CrossRef]
- Caputo, R.; Catalano, S.; Monaco, C.; Romagnoli, G.; Tortorici, G.; Tortorici, L. Active faulting on the island of Crete (Greece). Geophys. J. Int. 2010, 183, 111–126. [Google Scholar] [CrossRef]
- Alexandrakis, G.; Poulos, S.; Petrakis, S.; Collins, M. The development of a beach vulnerability index (BVI) for the assessment of erosion in the case of the North Cretan Coast (Aegean Sea). Hell. J. Geosci. 2010, 45, 11–22. [Google Scholar]
- Antoniou, P.; Kyriakidou, H.; Anagnostou, C. Cement filled geotextile groynes as a mean of beach protection against erosion: A critique of application in Greece. J. Coast. Res. 2009, 56, 463–466. [Google Scholar]
- Torresan, S.; Critto, A.; Rizzi, J.; Marcomini, A. Assessment of coastal vulnerability to climate change hazards at the regional scale: The case study of the North Adriatic Sea. Nat. Hazards Earth Syst. Sci. 2012, 12, 2347–2368. [Google Scholar] [CrossRef]
- Birkmann, J. Measuring vulnerability to promote disaster-resilient societies: Conceptual frameworks and definitions. In Measuring Vulnerability to Natural Hazards: Towards Disaster–Resilient Societies; Birkmann, J., Ed.; United Nations University Press: Tokyo, Japan, 2003; pp. 9–54. [Google Scholar]
- Addo, K.A. Coastal vulnerability index to sea level rise in Ghana. Coast. Mar. Res. 2004, 2, 1–7. [Google Scholar]
- Rocha, C.; Antunes, C.; Catita, C. Coastal vulnerability assessment due to sea level rise: The case study of the Atlantic coast of mainland Portugal. Water 2020, 12, 360. [Google Scholar] [CrossRef] [Green Version]
- Gatsios, T.; Cigna, F.; Tapete, D.; Sakkas, V.; Pavlou, K.; Parcharidis, I. Copernicus sentinel-1 MT-InSAR, GNSS and seismic monitoring of deformation patterns and trends at the Methana Volcano, Greece. Appl. Sci. 2020, 10, 6445. [Google Scholar] [CrossRef]
- Hall, C.M.; Prayag, G.; Amore, A. Tourism and Resilience: Individual, Organisational and Destination Perspectives; Channel View Publications: Bristol, UK, 2018. [Google Scholar]
- Orchiston, C. Tourism business preparedness, resilience and disaster planning in a region of high seismic risk: The case of the Southern Alps, New Zealand. Curr. Issues Tour. 2013, 16, 477–494. [Google Scholar] [CrossRef]
- Jopp, R.; DeLacy, T.; Mair, J. Developing a framework for regional destination adaptation to climate change. Curr. Issues Tour. 2010, 13, 591–605. [Google Scholar] [CrossRef]
- Koutrakis, E.T.; Sapounidis, A.; Marzetti, S.; Giuliani, V.; Martino, S.; Fabiano, M.; Marin, V.; Paoli, C.; Roccatagliata, E.; Salmona, P.; et al. Public stakeholders’ perception of ICZM and coastal erosion in the Mediterranean. Coast. Manag. 2010, 38, 354–377. [Google Scholar] [CrossRef]
- Cooper, J.A.G.; Pilkey, O.H. Pitfalls of Shoreline Stabilization: Selected Case Studies; Springer: London, UK, 2012. [Google Scholar]


Publisher’s Note: MDPI stays neutral with regard to jurisdictional claims in published maps and institutional affiliations. |
© 2021 by the authors. Licensee MDPI, Basel, Switzerland. This article is an open access article distributed under the terms and conditions of the Creative Commons Attribution (CC BY) license (https://creativecommons.org/licenses/by/4.0/).
Share and Cite
Vandarakis, D.; Panagiotopoulos, I.P.; Loukaidi, V.; Hatiris, G.-A.; Drakopoulou, P.; Kikaki, A.; Gad, F.-K.; Petrakis, S.; Malliouri, D.I.; Chatzinaki, M.; et al. Assessment of the Coastal Vulnerability to the Ongoing Sea Level Rise for the Exquisite Rhodes Island (SE Aegean Sea, Greece). Water 2021, 13, 2169. https://doi.org/10.3390/w13162169
Vandarakis D, Panagiotopoulos IP, Loukaidi V, Hatiris G-A, Drakopoulou P, Kikaki A, Gad F-K, Petrakis S, Malliouri DI, Chatzinaki M, et al. Assessment of the Coastal Vulnerability to the Ongoing Sea Level Rise for the Exquisite Rhodes Island (SE Aegean Sea, Greece). Water. 2021; 13(16):2169. https://doi.org/10.3390/w13162169
Chicago/Turabian StyleVandarakis, Dimitrios, Ioannis P. Panagiotopoulos, Vassiliki Loukaidi, Georgios-Angelos Hatiris, Paraskevi Drakopoulou, Aikaterini Kikaki, Fragkiska-Karmela Gad, Stelios Petrakis, Dimitra I. Malliouri, Maria Chatzinaki, and et al. 2021. "Assessment of the Coastal Vulnerability to the Ongoing Sea Level Rise for the Exquisite Rhodes Island (SE Aegean Sea, Greece)" Water 13, no. 16: 2169. https://doi.org/10.3390/w13162169