
Variations and Drivers of Methane Fluxes from Double-Cropping Paddy Fields in Southern China at Diurnal, Seasonal and Inter-Seasonal Timescales

1
State Key Laboratory of Water Resources and Hydropower Engineering Science, Wuhan University, Wuhan 430072, China
2
College of Hydraulic Science and Engineering, Yangzhou University, Yangzhou 225009, China
3
State Key Laboratory of Hydrology-Water Resources and Hydraulic Engineering, Nanjing Hydraulic Research Institute, Nanjing 210029, China
*
Author to whom correspondence should be addressed.
Water 2021, 13(16), 2171; https://doi.org/10.3390/w13162171
Submission received: 13 June 2021
/
Revised: 3 August 2021
/
Accepted: 4 August 2021
/
Published: 8 August 2021
(This article belongs to the Special Issue Greenhouse Gas Emissions from Water Systems)
Abstract
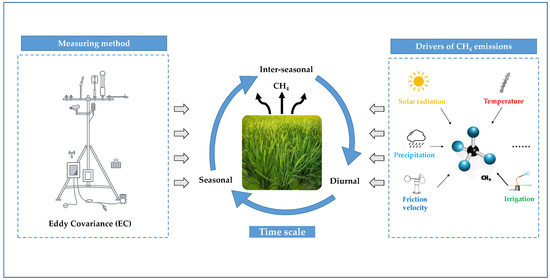
:Methane (CH4) is the second most important anthropogenic greenhouse gas (GHG) after carbon dioxide (CO2), and paddy fields are among the largest sources of CH4 emissions. Owing to the scarcity of observational data, the characteristics and influencing factors of CH4 fluxes in paddy fields at different timescales need to be further investigated. Observations of CH4 fluxes via eddy covariance (EC) data were performed over four seasons in two paddy fields in Nanchang, Jiangxi Province, China. The pattern, magnitude and biophysical controls of CH4 emissions were explored by wavelet analysis and stepwise multiplicative modelling. The results revealed a distinct, single-peak diurnal pattern in CH4 fluxes during the vegetative stage in all four rice growing seasons and the reproductive stage of early rice. Large seasonal variations in daily CH4 emissions were observed in the two double-cropping paddy fields, and the soil temperature at a depth of 5 cm (Ts5) explained most of the seasonality of the CH4 fluxes. At the inter-seasonal scale, under local farms’ traditional field management method, reducing the amount and frequency of irrigation during the vegetative stage could decrease CH4 emissions in southern China. This study improves the understanding of CH4 emissions and helps in developing GHG management strategies for paddy fields.
1. Introduction
Methane (CH4) is one of the most critical greenhouse gases emitted from terrestrial ecosystems to the atmosphere and has a global warming potential (GWP) 25–34 times that of CO2 on a centennial scale [1,2]. The IPCC Fifth Assessment Report stated that human activities have contributed to 50–65% of total CH4 emissions since the Industrial Revolution [3]. As ecosystems that are intensely managed by humans, paddy field ecosystems emit 8% of anthropogenic CH4 emissions [4]. China accounts for 18.6% of the world’s rice cultivation area [5]; therefore, research on CH4 emissions in Chinese rice ecosystems offers an essential reference for global climate research.
CH4 fluxes from paddy fields have been widely measured using chamber-based methods [6,7,8]. While these methods have the advantages of high sensitivity to low fluxes, easy manipulation, and low cost [9,10], they are also criticized due to their discontinuous measurements, poor spatial representation, high labour intensity and uncertainties due to temperature effects [11,12]. Alternatively, by providing near-continuous measurements at the ecosystem scale without interfering with the processes of gas exchange between the terrestrial ecosystem and the atmosphere, the eddy covariance (EC) method has emerged as a means of measuring trace gas exchange. In addition, concurrent measurements of CO2, water vapour and ancillary physical variables (e.g., temperature (T) and soil water content (SWC)) at half-hour intervals provide appropriate conditions for research on the dominant controlling factors of CH4 fluxes across multiple timescales. The EC technique has been widely used for measuring H2O [13,14,15,16], CO2 [17,18] and energy [19,20,21] fluxes. The effectiveness of EC for measuring CH4 emission fluxes in different ecosystems [22,23,24,25,26,27,28] has also been confirmed.
The emission of CH4 from paddy fields results from the simultaneous processes of production, oxidation and transportation and highly depends on environmental and biophysical factors. Globally, meteorological factors, such as precipitation, temperature, ambient pressure, soil type and friction velocity (U*) have been reported to affect CH4 emissions in marshes [12], fens [29], wetlands [23] and paddy fields [30,31]. Compared with those in other ecosystems, the process of CH4 emissions in paddy fields is more complex due to the involvement of rice plants and field management. Plant-mediated transport is the primary transport mechanism of CH4 from the soil to the atmosphere, and diffusion is the dominant mechanism of gas exchange in the paddy fields [32,33,34]. Additionally, photosynthesis products are the primary source of carbon substrates for methanogenic metabolism [35,36]; thus, the plant status can also regulate CH4 emissions. Moreover, the variation in CH4 flux is also regulated by field water management [27] and fertilizer applications [37,38,39,40]. These factors act in different processes and interact strongly with each other; thus, the main controlling factors of CH4 fluxes vary over diverse timescales. For example, carbon assimilation was demonstrated to regulate diurnal CH4 production with a time lag of 1–1.5 h in rice [32]; the temperature was reported to explain most of the seasonality in CH4 fluxes [41]; the response of CH4 emissions to water table fluctuation can be nonlinear, and water table fluctuation lagged the CH4 flux by up to 10 days [42]. Therefore, exploring the main controlling factors in paddy fields at multiple timescales is necessary. However, due to the limitations of the observation conditions, studies applying the EC method to observe CH4 fluxes in paddy fields are rare, with only a few studies concentrated on the US [43,44,45], Italy [46,47], Philippines [48], Indonesia, Japan [41], Korea [1,31] and China [2,34,49,50]. These studies reported that the pattern and magnitude of CH4 fluxes were site dependent and varied with time. Additionally, Knox et al. [44] conducted a 6.5-year observation in California, which represents the only study at an inter-seasonal timescale. Hence, more studies are urgently needed.
The paddy fields in the middle and lower reaches of the Yangtze River are cultivated in a double-cropping pattern that benefits from suitable water and thermal conditions. Currently, with the development of the economy and urbanization, job opportunities in the industry and service sectors are increasing rapidly [51], and wages are much greater in cities than in rural areas. These conditions have resulted in a substantial labour shortage in traditional paddy fields. Hence, rice cultivation is shifting from transplanting to direct seeding. Alternate wetting and drying (AWD) irrigation is also currently practiced in southern China [50]. Compared with traditional irrigation patterns, AWD has advantages for reducing water use [52,53] because paddy fields are dried out for approximately 3–5 days after the standing water depth falls to zero. Studies have reported that CH4 emissions in paddy fields are regulated by SWC [27,39]; therefore, changes in irrigation patterns will consequently influence CH4 exchange in this region. The changes in planting and irrigation patterns provide a challenge for estimating regional CH4 emissions, and studies on the variations in CH4 emissions and their biophysical controls are urgently needed.
Therefore, a four-season observational study of CH4 fluxes was conducted in two double-cropping paddy fields in southern China. This paper reports the variations and drivers of CH4 fluxes at diurnal, seasonal and inter-seasonal timescales. The main objectives of this study are to (1) explore the variations in CH4 fluxes at diurnal and seasonal timescales; (2) investigate the dominant drivers at diurnal and seasonal timescales; and (3) measure and compare CH4 fluxes at inter-seasonal timescales. This study contributes to the understanding of CH4 emissions and provides a strategy for reducing regional GHG emissions.
2. Materials and Methods
2.1. Study Site and Crop Management
The experiment was conducted from 2018 to 2020 on the Ganfu Plain, Jiangxi Province, China (Figure 1). The climate in the study region is characterized as subtropical, humid and monsoonal. The mean annual temperature is 18.1 °C, and the mean annual precipitation is 1634 mm. The soil is a paddy soil with a clay loam texture.
The experiment was conducted at ST1 in 2018 under transplanted and mild AWD irrigation. The detail of mild AWD has been reported by Liu [21]. To observe the variation in CH4 flux under direct-seeded and local farms’ traditional irrigation method, another experiment was conducted at ST2 in 2019–2020. Local farmers generally adopt the flooded irrigation method with mid-season drainage, which would avoid ineffective tillering. However, as reported by Chen et al. [54], in 2019, Jiangxi experienced continuous drought in summer and autumn, the influence of which was the widest and strongest since meteorological records. Frequent flooded and non-flooded alternates occurred at ST2 in 2019 owing to farmers’ lack of timely irrigation. Therefore, the irrigation methods for late rice in 2019 and 2020 were AWD and flooded with mid-season drainage respectively. Mid-season drainage in 2018 late rice and 2020 early rice were failed because of rainfall events during the period. Owing to frequent rainfall events and instrument malfunctions, the data from early rice in 2018 and 2019 were not qualified. As reported by Ge et al. [49], during the rainy periods the raindrops and dirt would accumulate on the mirrors. Continuous rainfall prevented the self-cleaning system from cleaning the mirror because the cleaning fluid stored in the washer was used up in a short time, thus the signal strength of the instruments was very low (10%) during the rainy periods. Therefore, the data from early rice in 2018 and 2019 were not included in the analysis. Both sites were located in the centre of homogeneous paddy fields. Since the 2 sites were only 1.45 km away, the climate pattern, soil type, wind direction and rice cultivar were the same. However, the field management among years was different to create variability between the influencing factors, and the timing of the crop rotation at the two sites is listed in Table 1. The seeds of the rice at ST2 were broadcast at a rate of 300 seeds m−2, and the late rice at ST1 was transplanted at a rate of 100 seeds m−2. The total N fertilizer applied was 162 kg N hm−2 for the late rice at ST1, and fertilizer was applied as basal fertilizer and at the tillering and panicle initiation stages at a ratio of 5:3:2. The total N fertilizer applied was 160 kg N hm−2 for both rice seasons at ST2 and was applied at a ratio of 5:5. Mid-season drainage was the only time of drainage during the whole growing season, the timing of which is listed in Table 1. Natural drying downs were allowed in the AWD treatments.
2.2. Eddy Covariance and Meteorological Measurements
The key instruments of the EC system at ST1 consisted of a fast-response 3D sonic anemometer (R3-50, Gill Instruments, Inc., Hampshire, UK), an open-path CH4 gas analyzer (LI-7700A, Li-COR Biosciences, Inc., Lincoln, NE 68504, USA), an open-path CO2/H2O gas analyzer (LI-7500A, Li-COR Biosciences, Inc., Lincoln, NE 68504, USA), and a data logger (LI-7500, Li-COR Biosciences, Inc., Lincoln, NE 68504, USA) to record raw data from the open-path EC system. For ST2, the CO2/H2O and CH4 gas analyzers and data logger were the same as those for ST1, and a WindMaster Pro (Gill Instruments Inc., Hampshire, UK) was used to measure the wind speed in all 3 dimensions. All the sensors at the 2 sites were installed at a height of 2.5 m above ground level.
The meteorological sensors at each site included a combined humidity and temperature sensor (HMP155, Vaisala, Inc., Helsinki, Finland), a net radiometer (NR Lite 2, Kipp & Zonen, Inc., Delft, Holland) and a photosynthetically active radiation (PAR) sensor (LI-190SB, Li-COR Biosciences, Inc., Lincoln, NE 68504, USA) installed at a height of 3 m; 3 soil heat flux plates (HFP01, Hukseflux, Inc., Delft, Holland) buried at a depth of 5 cm; 3 combined soil moisture and temperature sensors (ML2x, Delta-T Devices, Inc., Cambridge, UK); and a tipping bucket rain gauge (TR-525M, Texas Electronics, Inc., Dallas, TX 75237, USA).
2.3. Data Processing
Eddy Pro software (Version 6.0, LI-COR Bioscience, Inc., Lincoln, NE 68504, USA) was adopted to compute, perform quality control on and correct the half-hourly CO2 and CH4 fluxes. The correction practices included coordinate rotation via double rotation [55], correction for density fluctuations (WPL correction) [56], spectral correction [57], and spike detection. The following types of CH4 data were excluded from subsequent analyses: (1) those flagged as low quality by EddyPro (0-the best quality, 1-medium quality suitable for general analysis, 2-poor quality that should be discarded); (2) those obtained during periods of rainfall, instrument malfunction or human disturbance; (3) those obtained when the U* was lower than 0.15 m s−1; and (4) those with relative signal strength indicator (RSSI) values below 10% [34,49]. The filtering of CO2 data used criteria (1)–(3) above. After the data cleaning procedure, the 63.8%, 69.2%, 59.8% and 58.8% data were retained for 2018–2020 late rice and 2018 early rice respectively.
The mean diurnal variation (MDV) [58] method was adopted to fill the gaps in the micrometeorological and CH4 flux data. The daytime and nighttime net ecosystem exchange (NEE) were filled in separately on the basis of the assumption that at night, NEE equals the total ecosystem respiration (Reco) due to the absence of photosynthesis, while during the day, NEE is the difference between Reco and gross primary production (GPP) (Equation (1)):
where GPP is the sum of available daytime NEE and Reco (μmol CO2 m−2 s−1) and Reco is the respiration of the ecosystem (μmol CO2 m−2 s−1).
An empirical function estimating Reco was fitted according to Taylor [59] based on the assumption that respiration is controlled mainly by temperature.
where a and b are empirical constants, Ts is the soil temperature at 5 cm depth, and Tref is a reference temperature (25 °C). It was assumed that Equation (2) is applicable for the daytime and that GPP can be estimated by Equation (3) [60] based on the assumption that photosynthesis is controlled mainly by PAR in a short period of time.
where Pmax is the hypothetical maximum GPP, α is the initial slope of the function of ecosystem quantum yield, and PAR is the photosynthetically active radiation flux measured above the canopy.
2.4. Data Analysis
2.4.1. Spectral Analysis at the Diurnal Scale
The entire growing season was split into 3 stages to analyse the diurnal patterns of CH4 fluxes: the vegetative stage, reproductive stage and ripening stage.
Wavelet transforms are suitable for the spectral analysis of trace gas flux data measured by eddy covariance and were used to explore the correlation between CH4 flux and biophysical controls [32,44]. Continuous wavelet transform with the Morlet mother wavelet was used to examine the periodicity of the spectra of the CH4 fluxes, and the correlation between the CH4 fluxes and biophysical controls was tested with the wavelet coherence spectrum.
2.4.2. Semiempirical Multiplicative Model Construction at the Seasonal Scale
According to previous studies [34,38,60,61,62], the soil temperature (Ts), U*, SWC, vapour pressure deficit (VPD) and GPP are essential variables controlling daily CH4 fluxes. The semiempirical multiplicative model has been proven to be an effective tool to model daily CH4 fluxes with biophysical controls in paddy fields [49]. Therefore, a semiempirical multiplicative model was employed to rank the factors influencing daily CH4 emissions:
where Tsoiln, Un, VPDn, SWCn and GPPn are the normalized Ts, U*, VPD, SWC and GPP, respectively, following Equation (5):
where Xn is the normalized variable, X is the original variable, Xmax and Xmin are the maximum and minimum variables during the period.
First, all 5 variables were incorporated into the model, and then the p-values of the 5 factors were obtained and ranked. Then, stepwise multivariate regression models were constructed based on the rank according to Equation (5). The coefficient of determination (R2) was adopted as the indicator to evaluate the performance of each model.
The semiempirical models were constructed in 2 different ways. ‘Model-1’ was constructed using the data from the whole growing season. Considering that the main controlling factors might vary in different periods of rice growth, ‘Model-2’ was constructed according to the pattern of the seasonal CH4 flux. The whole growing season was split into 2 or 3 periods when different models were developed. Owing to the single-peak pattern of the seasonal CH4 fluxes, the whole growing seasons of late rice in 2018 and of early rice in 2020 were split into 2 periods by mid-season drainage. However, the whole growing seasons of late rice in 2019 and in 2020 were split into 3 periods by mid-season drainage, as well as the double-peak pattern of the seasonal CH4 fluxes. The periods of mid-season drainage were included in ‘Model-2’.
3. Results and Discussion
3.1. Diurnal Variations in CH4 Fluxes and Driving Factors
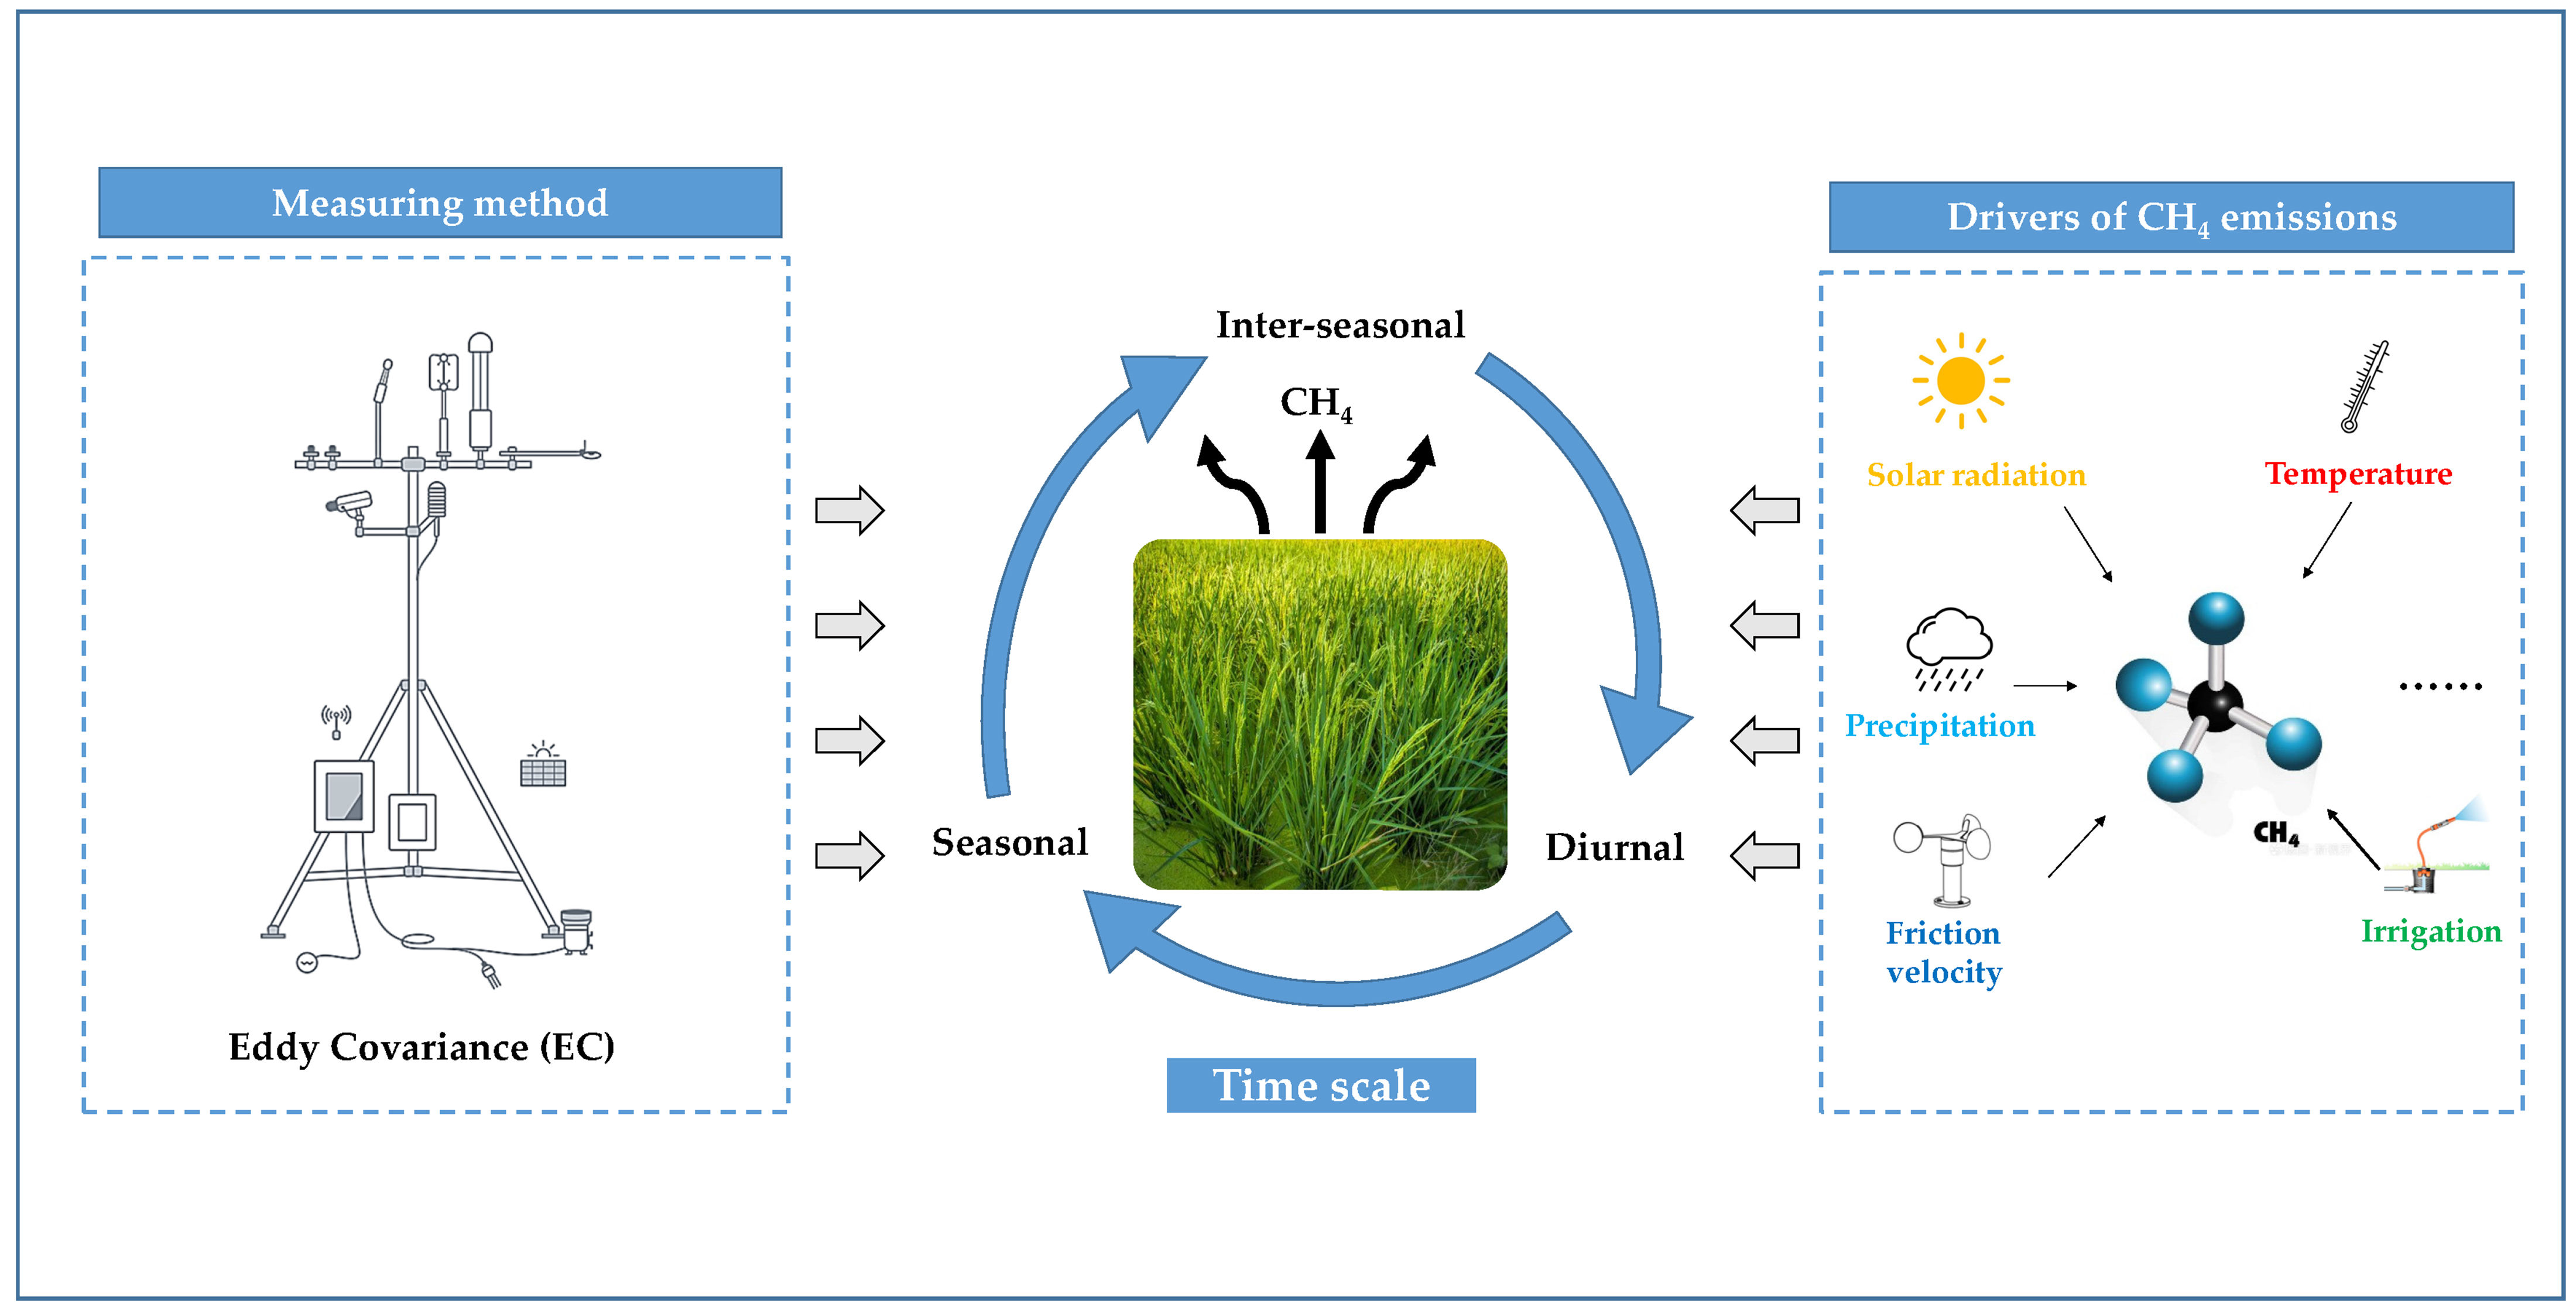
During the vegetative stage of all four rice growing seasons and the reproductive stage of early rice, the CH4 fluxes showed a distinct diurnal pattern: the CH4 fluxes started to increase at approximately 10:00, reached a peak at 14:00–16:00, decreased to low values after 20:00, and then maintained low values without significant fluctuations at night (Figure 2). The CH4 fluxes in the vegetative stage of late rice were much greater than those during the reproductive stage and ripening stage. They were the greatest in the reproductive stage of early rice, followed by the vegetative stage and the ripening stage.
Many previous studies have shown that in flooded ecosystems, CH4 fluxes fluctuate regularly at diurnal timescales; these fluctuations are related to cyclical changes in temperature, solar radiation and the physiological state of rice plants during the day [9,11,29]. Many scholars have reported that the CH4 fluxes in paddy fields worldwide exhibit a single-peak diurnal pattern, with the peak value occurring in the afternoon [2,9,12,41,63]. However, it has been reported by some scholars that CH4 fluxes in paddy fields do not change regularly [35,64]. Wang et al. [64] reported that two intraday peak CH4 fluxes occurred at 12:00 and 0:00 during the early growing season, while only one peak occurred at midnight later in the growing season. In this study, a single-peak diurnal pattern was observed during the reproductive stage of early rice but not during the three seasons of late rice, which may be the result of inadequate mid-season drainage of the early rice caused by rain.
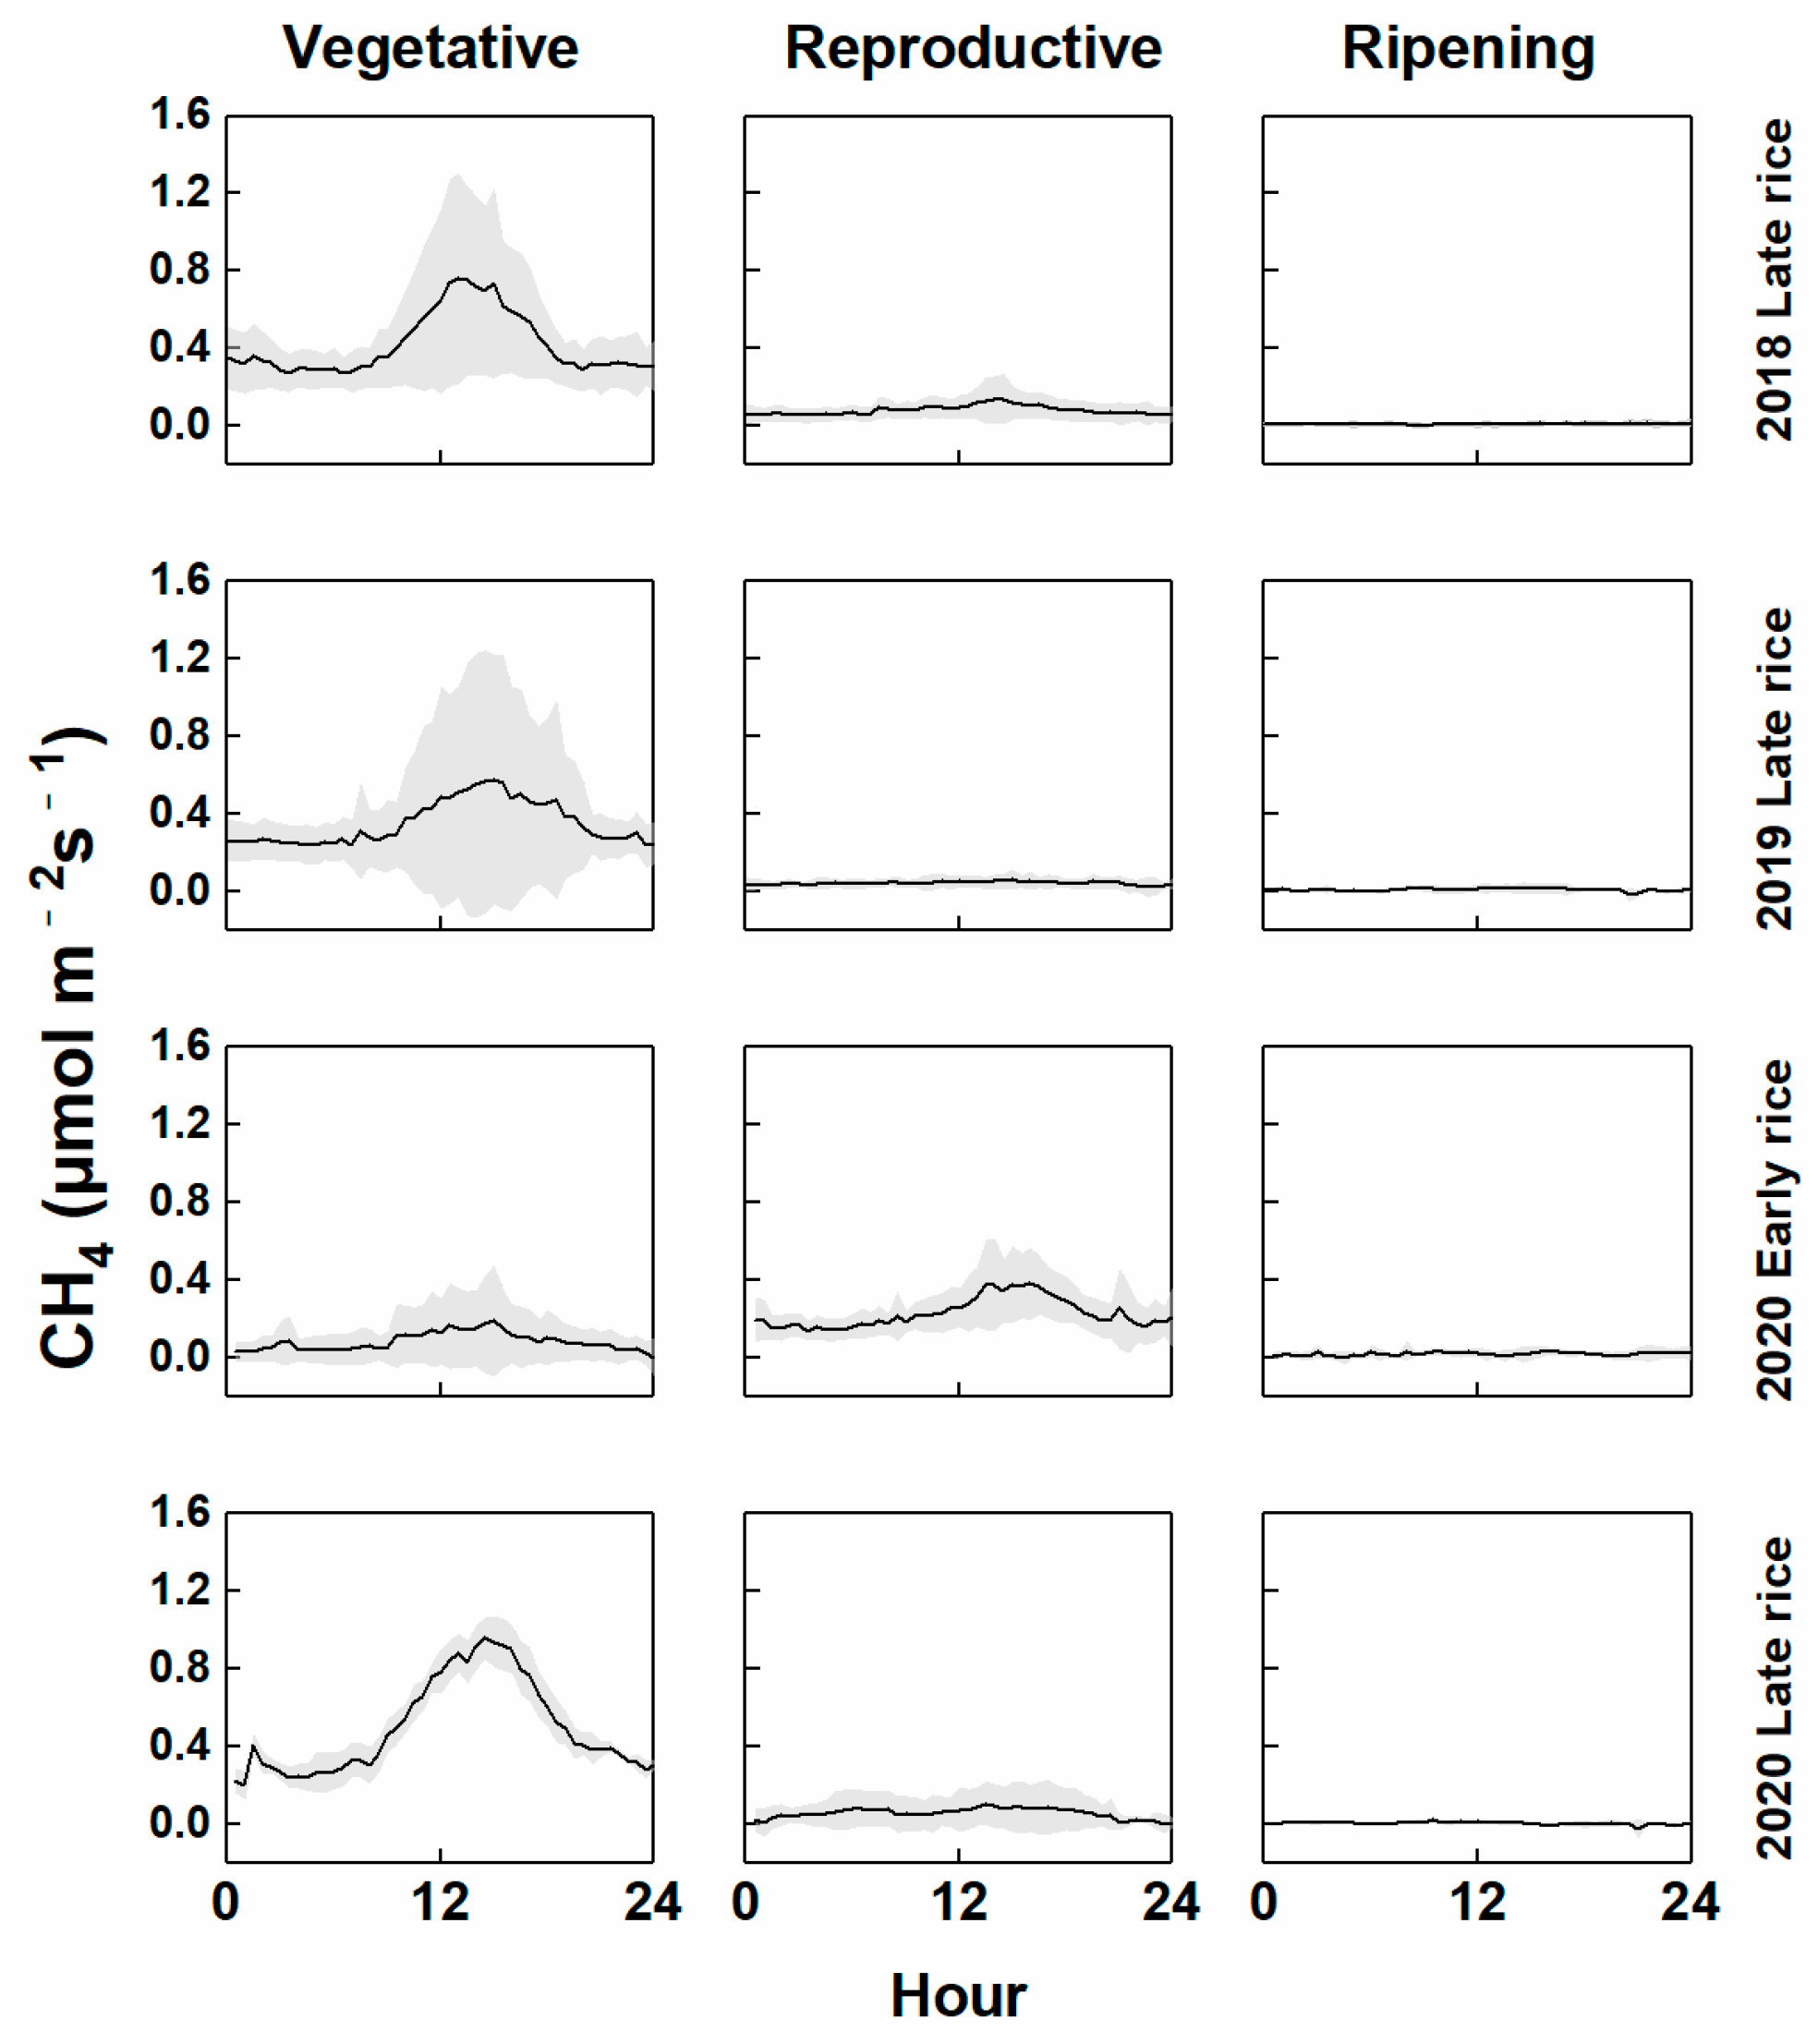
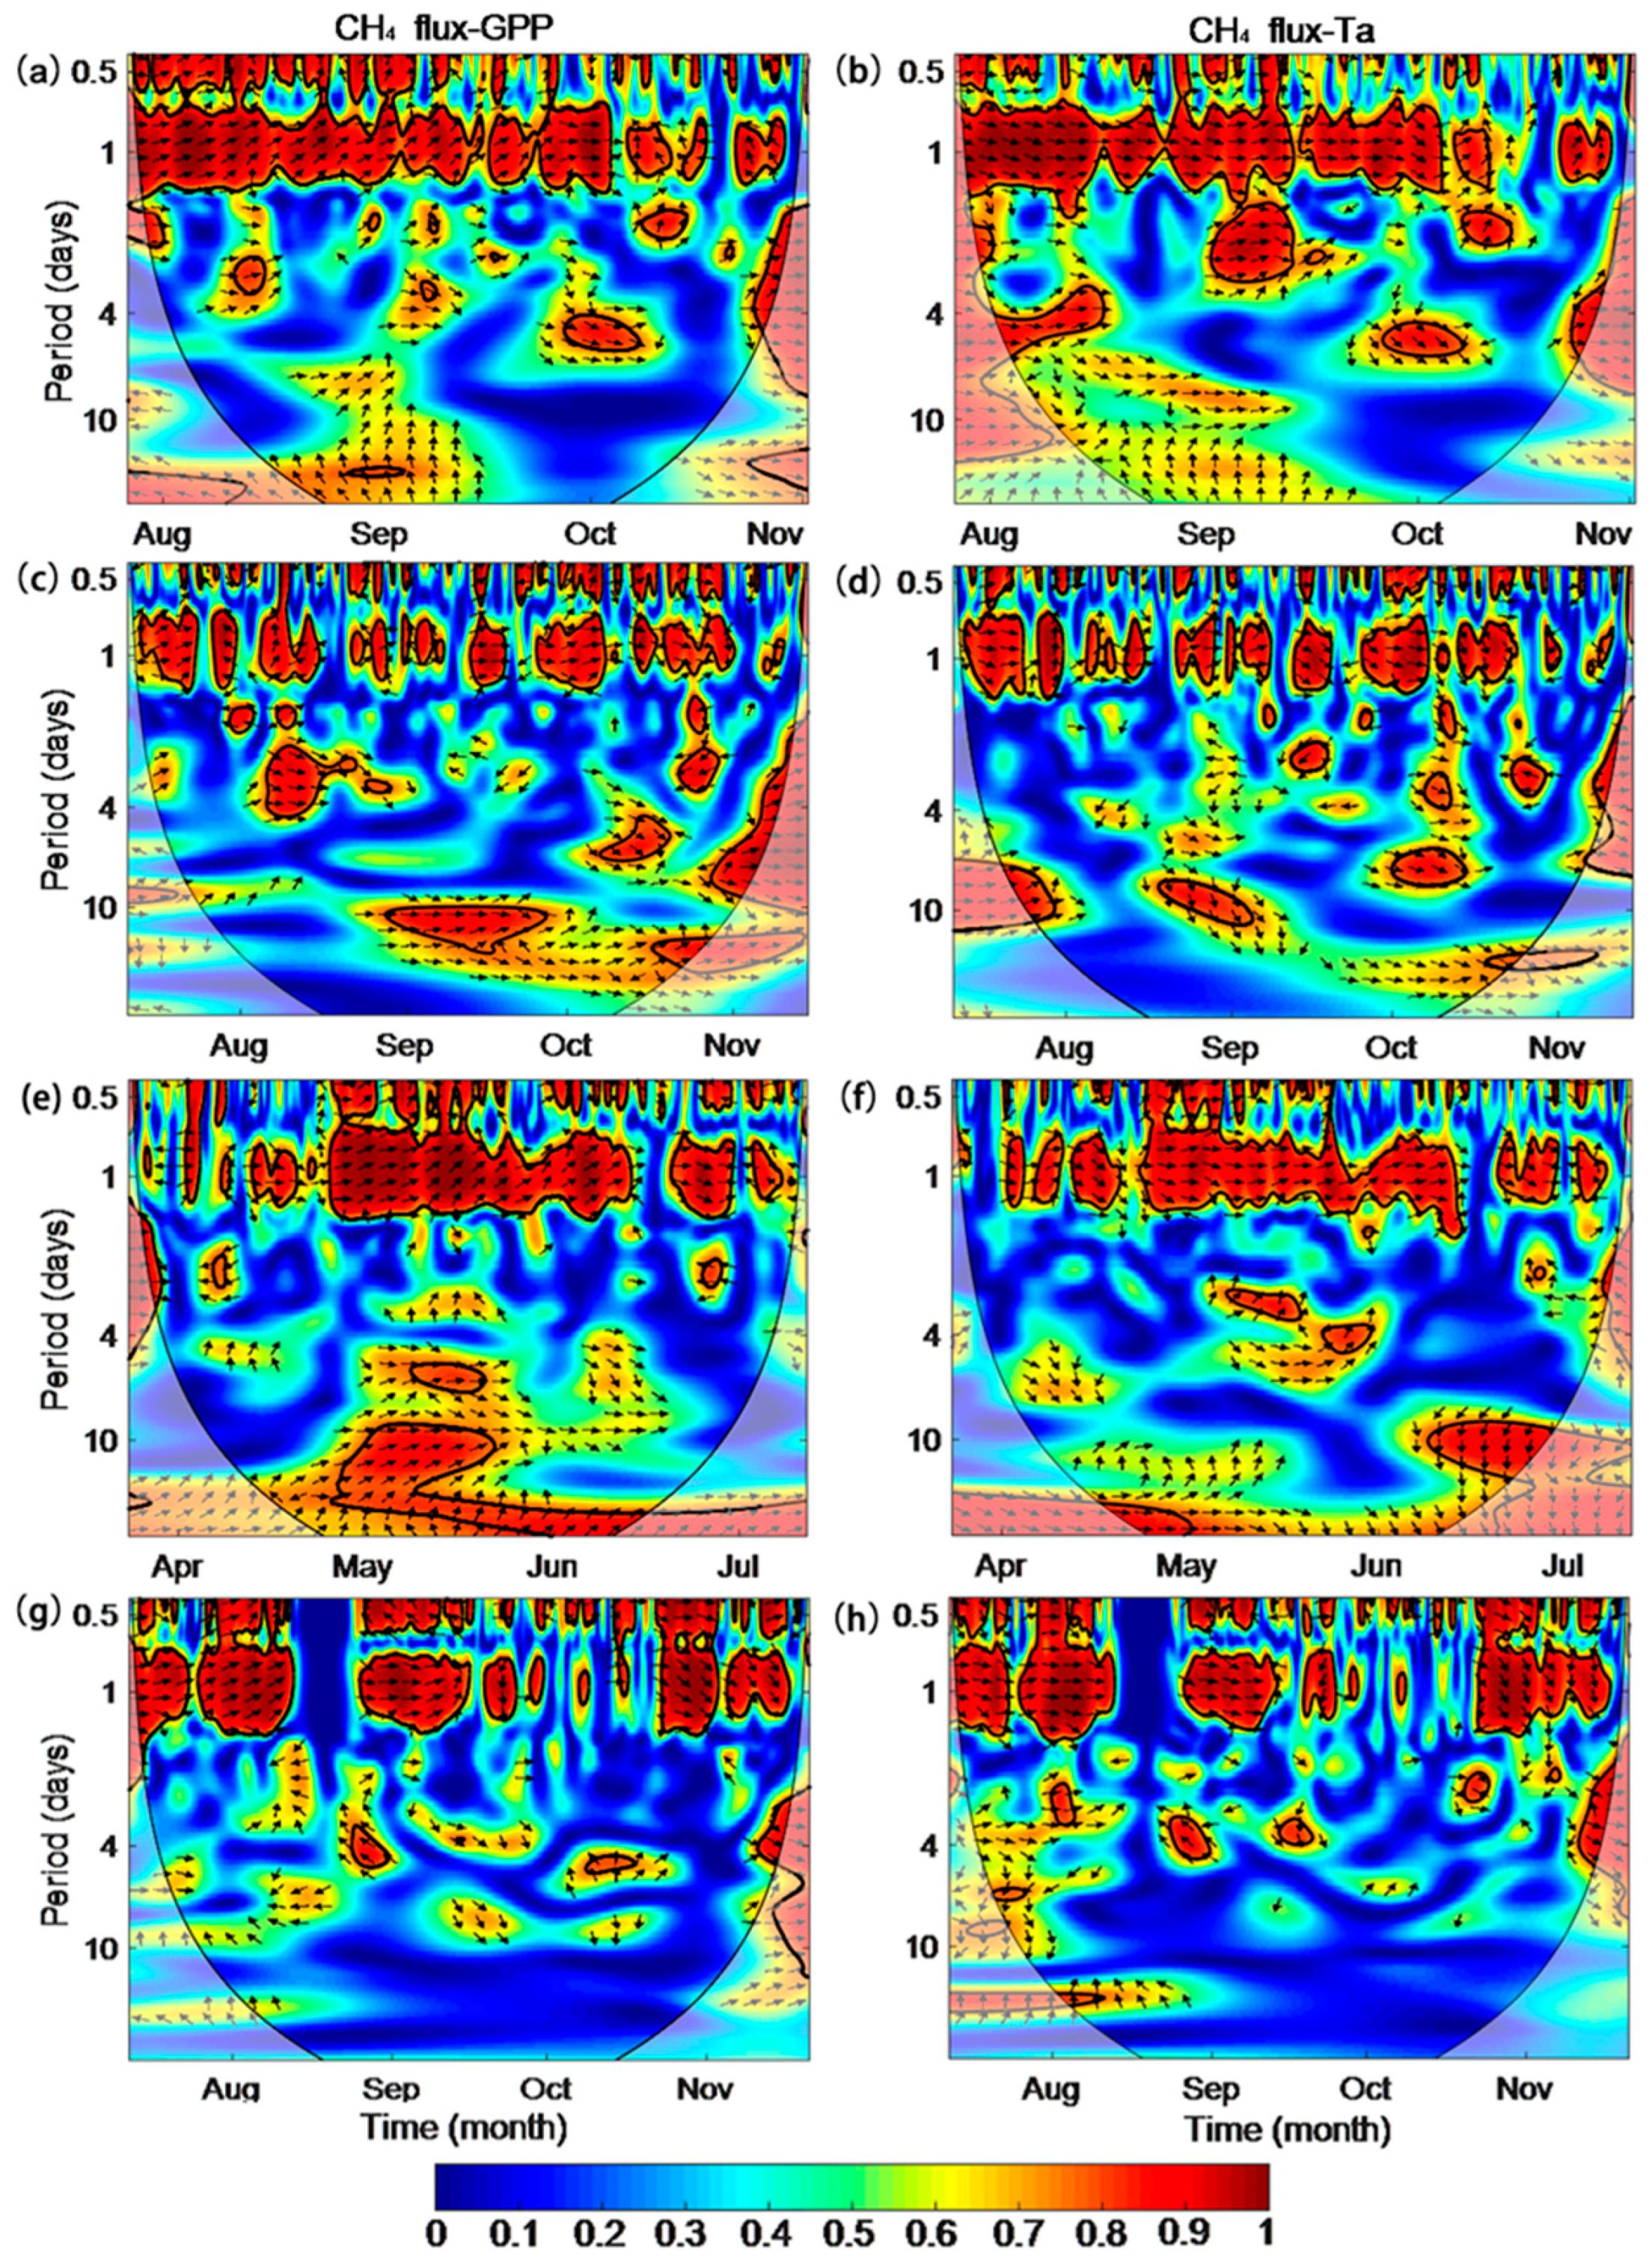
The net CH4 flux is the result of the simultaneous microbial production, oxidation and transport of CH4 and is thus controlled by meteorological and biophysical factors. Previous studies have shown that temperature strongly affects CH4 fluxes in paddy fields [65,66]. The activity of methanogens is enhanced at the optimum temperature [67], while the plant-mediated CH4 transport, molecular diffusion and ebullition of CH4 [65] also increase with increasing temperature. The GPP represents the CO2 assimilation capacity of a region and is an indicator of plant physiology. The air temperature (Ta) and GPP changed regularly in the span of one day and represent typical meteorological and biophysical factors driving diurnal CH4 fluxes. As shown in Figure 3, all wavelet coherence had high periodic coherence at the 24 h timescale, which was consistent with the cyclical and regular changes in CH4, Ta and GPP throughout the day. In Figure 3a,c,e,g, the arrows point to the right and have a very low positive inclination, while in Figure 3b,d,f,h, the arrows point to the right and have a very low negative inclination. The phase angles of GPP and Ta with CH4 fluxes were very small. The correlations between the two time series were strong and GPP, rather than Ta, was the driver of diurnal CH4 emissions. The phenomenon was also reported by Knox et al. [44], which could be explained by the fact that the main methanogenic substrates are obtained through photosynthesis; thus, it would take several hours to transport them from leaves to roots [32,68].
3.2. Seasonal Variations in Biophysical Factors and CH4 Fluxes
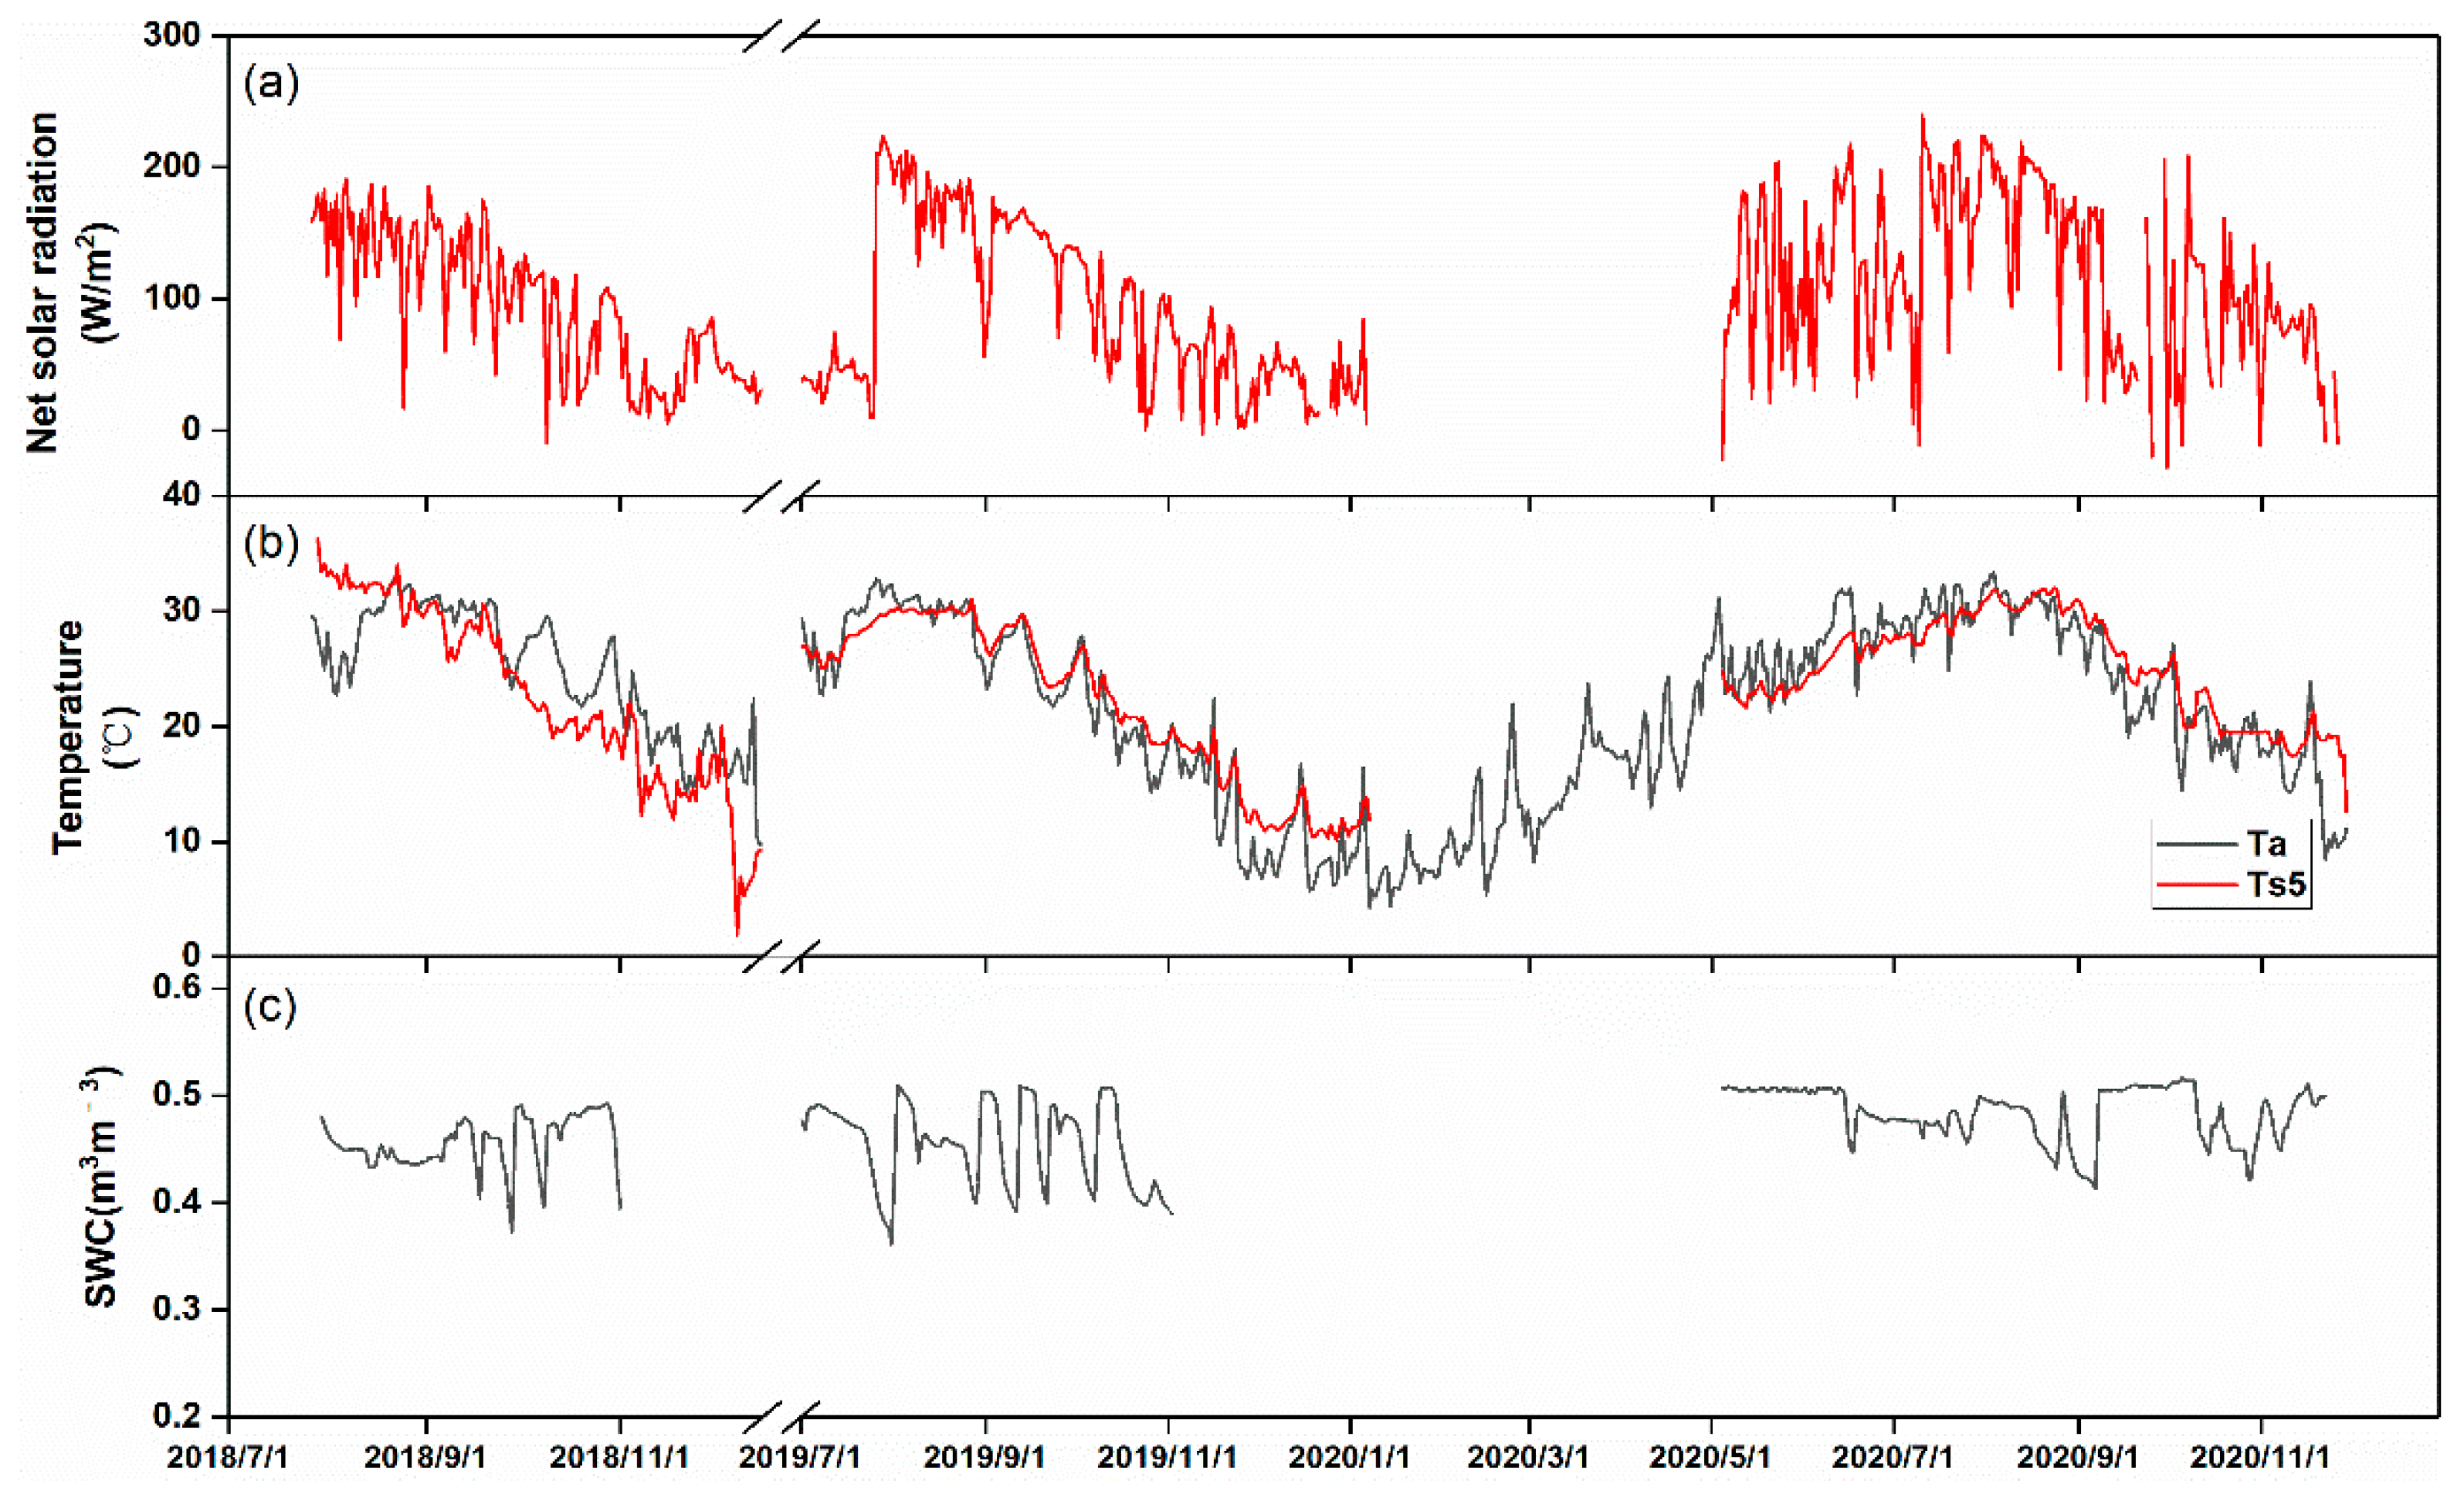
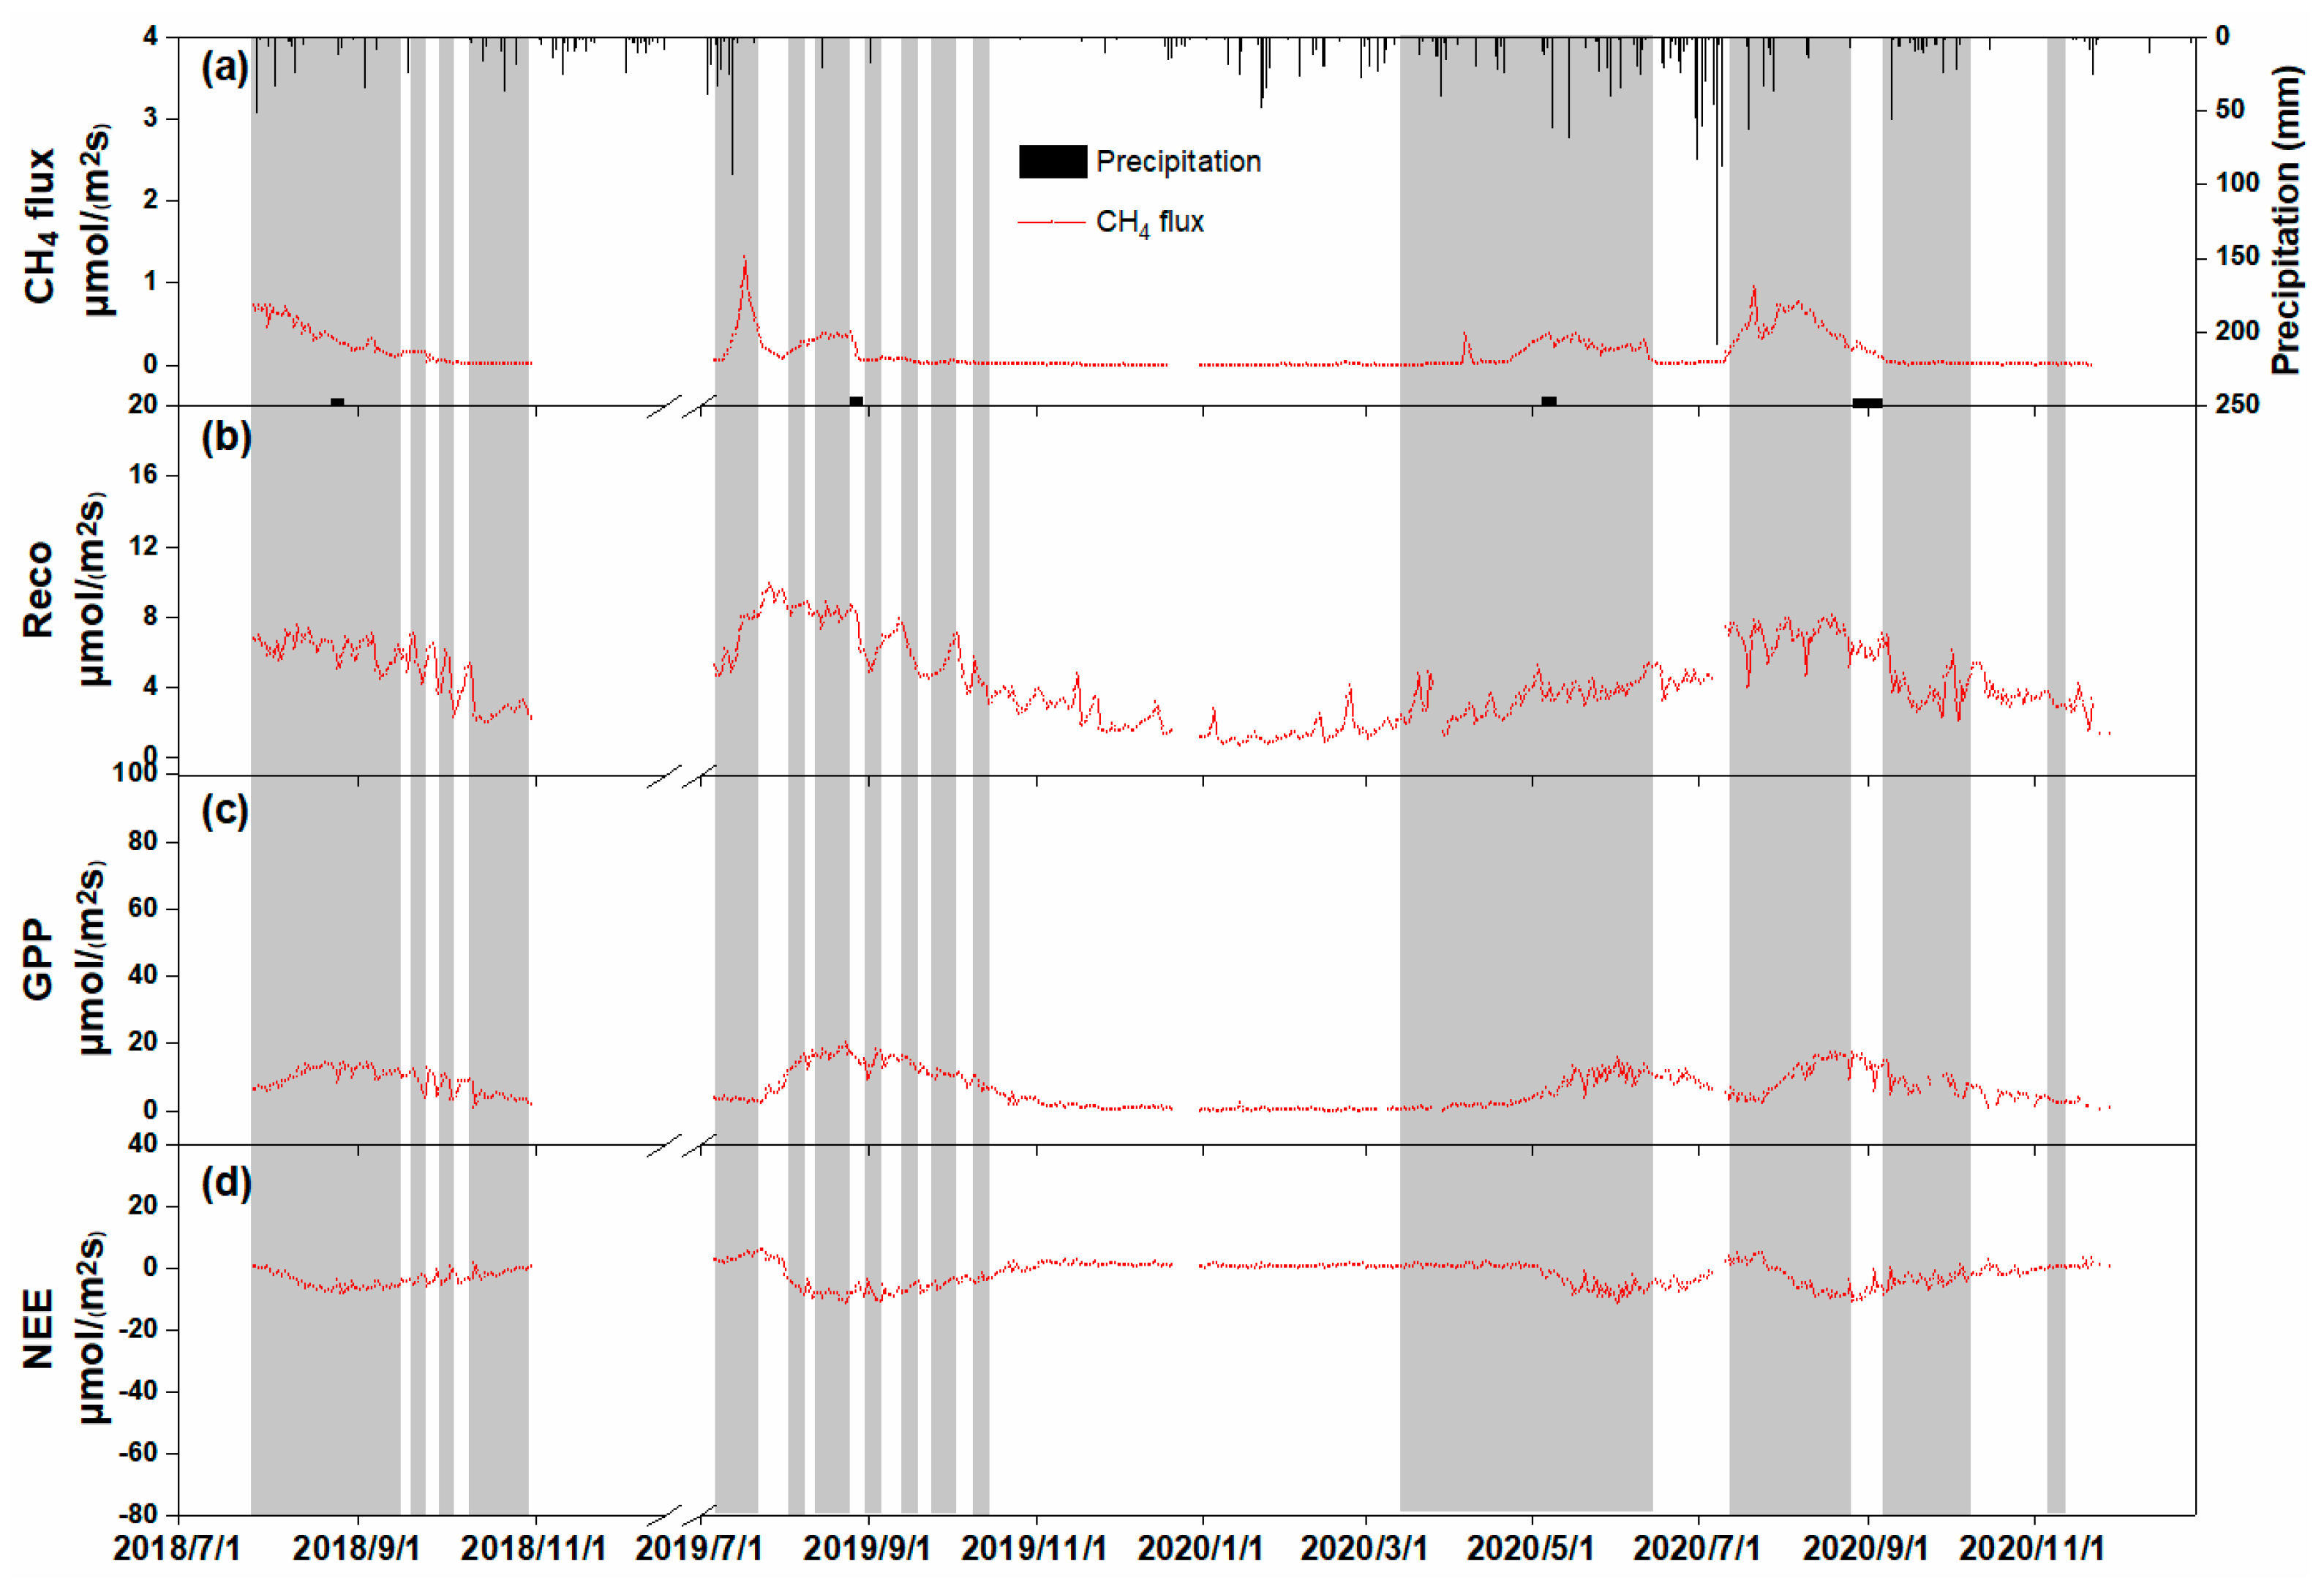
The seasonal variations in biophysical factors and CH4 fluxes are shown in Figure 4 and Figure 5. Owing to instrument failure, the data of net solar radiation (Rn) for early season 2020 was lost. The net solar radiation showed decreasing/increasing trends during the growing seasons of late/early rice that were similar to those of Ta. The soil temperature at 5 cm depth (Ts5) differed slightly from Ta and fluctuated less. Early rice in 2020 remained flooded until the middle of the reproductive stage. Late rice in 2018 was flooded except for some drying downs in the reproductive stage. Owing to severe drought, late rice in 2019 experienced several periods of dry and wet alternates. Late rice in 2020 was flooded except for mid-season drainage, as well as ripening stages. Reco varied similarly to Ta in both early and late rice. GPP and NEE increased in the vegetative stage, declined slightly in the reproductive stage and decreased slowly in the ripening stage. The GPP and NEE of early rice were slightly lower than those of late rice.
Large seasonal variations in daily CH4 were observed in the two double-cropping paddy fields (Figure 5a). In late rice in 2018, the paddy field was flooded six days before transplanting, and the daily CH4 fluxes decreased gradually after transplanting. The mean CH4 fluxes in the vegetative stage, reproductive stage and ripening stage were 0.42, 0.09, and 0.01 μmol m−2 s−1, respectively, and the largest daily CH4 flux was 0.71 μmol m−2 s−1 on the first day after transplantation. In late rice in 2019, the CH4 fluxes increased rapidly after basal fertilizer application, reached maximum daily emissions of 1.304 μmol m−2 s−1, and declined rapidly thereafter. Then, the CH4 fluxes increased from 2 August and reached a second peak before mid-season drainage. During this period, the temperature and SWC fluctuated slightly, while GPP increased significantly. Therefore, it is assumed that the increase in daily CH4 flux was related to the growth of rice plants (Figure 5d). The CH4 fluxes declined sharply during mid-season drainage and remained low after mid-season drainage. The average CH4 fluxes during the vegetative stage, reproductive stage, ripening stage and fallow season were 0.345, 0.046, 0.011 and 0.001 μmol m−2 s−1, respectively. In early rice in 2020, the CH4 fluxes increased gradually 30 days after seeding, declined slowly during the reproductive stage, and remained low at approximately 0.02 μmol m−2 s−1. The average CH4 fluxes during the vegetative stage, reproductive stage and ripening stage were 0.084, 0.232, and 0.022 μmol m−2 s−1, respectively. The first peak occurred in the vegetative stage, at 0.380 μmol m−2 s−1, while the second occurred in the reproductive stage, at 0.377 μmol m−2 s−1. In late rice in 2020, CH4 fluxes increased rapidly after seeding, reaching the first peak of 0.952 μmol m−2 s−1 at 11 days after seeding. The CH4 fluxes decreased gradually in the reproductive stage and remained low thereafter. The average CH4 fluxes during the vegetative stage, reproductive stage and ripening stage were 0.498, 0.058 and 0.006 μmol m−2 s−1, respectively.
Ge et al. [49], Dai et al. [50] and Song et al. [34] observed that the maximum daily CH4 flux was 0.355 μmol m−2 s−1 (from a single-season paddy field in Yancheng, China),1.15 μmol m−2 s−1 (from a rice-wheat rotation agroecosystem in Nanjing, China) and 0.69 μmol m−2 s−1 (from a double-cropping paddy field in Yiyang, China) by EC. Alberto et al. [66] observed that the maximum daily CH4 flux from a double-cropping paddy field in the Philippines during the growing period from 2013 to 2014 was 0.03 μmol m−2 s−1, 0.27 μmol m−2 s−1 and 0.46 μmol m−2 s−1. The maximum daily CH4 flux observed by Hwang et al. [1] in Korea was 0.27 μmol m−2 s−1. The maximum daily CH4 flux observed from late rice in Nanchang is higher than that of many places, while the maximum daily CH4 flux of early rice is comparable to that of other places. The reason is that high temperatures and sufficient water during the growing season of late rice were favourable for the production of CH4.
3.3. Driving Factors of Seasonal CH4 Fluxes
The determination coefficients (R2) of the semiempirical multiplicative model are listed in Table 2. Model-1 performed better than Model-2 for 2018 and 2020 late rice, and Model-2 performed better for 2019 late rice. Unlike in the other seasons, for early rice in 2020, Model-2 outperformed Model-1 at P1, and Model-1 outperformed Model-2 at P2. The different performances of the two models in different growing seasons may be because only one peak was observed during the whole late rice seasons in 2018 and 2020; thus, constructing the model with data from the whole growing season would be more effective than constructing the model with partial-season data.
As shown in Table 2, Ts5 was able to explain 92.1% and 82.6% of the seasonality in CH4 fluxes when Model-1 was adopted for 2018 and 2020 late rice, respectively. When all five factors were used to construct the multiplicative model, R2 were 0.942 and 0.881 for 2018 and 2020 late rice, respectively. The increase in R2 was only 0.021 and 0.055 when the other four factors were all taken into consideration, indicating that Ts5 was the dominant factor regulating seasonal CH4 fluxes in late rice in 2018 and 2020. Similarly, Ts5 was the main controlling factor for the whole growing season in late rice in 2019. SWC, GPP and Ts5 were the main drivers at P1, P2 and P3, respectively. Unlike in the other three growing seasons, SWC and Ts5 were the two most important controlling factors regulating daily CH4 fluxes in early rice in 2020. GPP and SWC were the factors controlling seasonal CH4 fluxes in P1 and P2, respectively.
In general, daily CH4 fluxes were strongly explained by Ts5 in the paddy fields from 2018 to 2020 in this study. The mechanism by which temperature affects CH4 has been described above in Section 3.1. Adding GPP or SWC to the model somewhat increased its R2, implying that photosynthesis and the soil water content also regulate daily CH4 emissions to a certain extent. The efficiency of CH4 flux transplanting will increase with the growth of rice plants, as plant-mediated CH4 transport is the main pathway conveying CH4 from the soil to the atmosphere [35,69]. Meanwhile, Knox et al. [44] reported that the increase in oxygen produced by photosynthesis and transferred to roots would result in an increase in methane emission fluxes. Therefore, GPP was able to explain the seasonal variability in the CH4 flux. Standing water above the soil provides an anaerobic environment that is favourable for methanogenic bacteria; this anaerobic environment has been reported to be an indispensable condition for CH4 production [41,50]. Many previous studies have indicated that the water table operates like a general ‘on-off switch’ for CH4 emissions. When the water layer disappeared, SWC regulated the balance between CH4 production and oxidation by influencing the depth of anaerobic and aerobic zones in the soil. Additionally, as explained in Section 3.4, the daily CH4 fluxes probably increased slightly and then declined sharply after drainage, and the longer drainage periods could strongly affect the subsequent daily CH4 fluxes. RH and U* played minor roles in regulating daily CH4 fluxes compared with Ts5, GPP and SWC over the course of the growing season. RH was reported to influence CH4 fluxes by the occurrence of convective throughflow caused by humidity-induced pressurization [70]. Similarly, Iwata et al. [41] observed the dependence of daily CH4 fluxes on relative humidity in the post-heading period. CH4 fluxes were enhanced by increased turbulent mixing [41,44]; therefore, U* mainly affected short-term CH4 fluxes and had less influence on daily CH4 fluxes.
The main controlling factors identified in this study are slightly different from those identified in previous studies. Knox et al. [44] analysed 6.5 years of eddy covariance measurements of fluxes of CH4 from a flooded rice paddy in northern California, USA, and reported that the seasonal variability in CH4 fluxes was strongly regulated by GPP, followed by Ts5. However, Iwata et al. [41] reported that before the heading stage of rice, CH4 emissions were largely controlled by wind speed and Ts5, while RH and water temperature had a greater effect on daily CH4 emissions after heading. Iwata et al. [41] explained that the shift in the environmental dependence of CH4 emissions between cultivation stages occurred due to the shift in transport pathways, as well as changes in the rate and quality of root exudates. It is reported by Dai et al. [50] that seasonal variations of soil temperature, air temperature, and GPP had strong effects on daily CH4 fluxes during pre-panicle initiation of the rice growing season, while the soil temperature and leaf area index had very strong effects on daily CH4 fluxes during the post-panicle initiation stage from a rice-wheat rotation agroecosystem in eastern China. The variability in the results of these studies and our study can be attributed to differences in the study areas. Because rice paddies are managed ecosystems and the production, oxidation and transport of CH4 are complex and nonlinear, the seasonal variability in daily CH4 emissions inevitably varies due to differences in biophysical factors, soil types, regional climates, crop species and field management practices.
3.4. Effect of Drainage on CH4 Fluxes
As shown in Figure 5a, daily CH4 fluxes declined sharply after mid-season drainage in 2019 late rice. This phenomenon seemed to occur because CH4 oxidizes when exposed to air. Meanwhile, electron acceptors in the aquifer become reduced, so the soil environment is not favourable for methanogenic bacteria even when the paddy field is reflooded [40]. This finding is consistent with that of Inubushi [70], who observed that if paddy fields were drained for more than two days, CH4 fluxes would not be restored to their emission level before mid-season drainage. Similarly, Wassmann et al. [71] reported that the pattern and magnitude of seasonal CH4 fluxes in the whole growing season varied with mid-season drainage and that up to 80% of CH4 fluxes would be reduced when soils experienced aerobic conditions for 6–10 days in paddy fields. Kim et al. [31] also reported that mid-season drainage decreased CH4 emissions from an irrigated rice paddy. However, Hwang et al. [1] showed that after 21, 12 and 15 days of mid-season drainage in paddy fields in Korea from 2016 to 2018, the peak daily CH4 fluxes were greater than those before mid-season drainage. The finding was different from those presented in this study and may be attributable to differences in the cropping system and regional climate. The paddy fields in Korea applied a single-season system in which the Ta increased continuously for a while after mid-season drainage, while the paddy fields in China applied a double-cropping rice system in which the Ta tended to decrease throughout the growing season. Combining our observations with those of others, we concluded that the changes in daily CH4 fluxes after mid-season drainage are controlled by multiple factors and are thus site dependent.
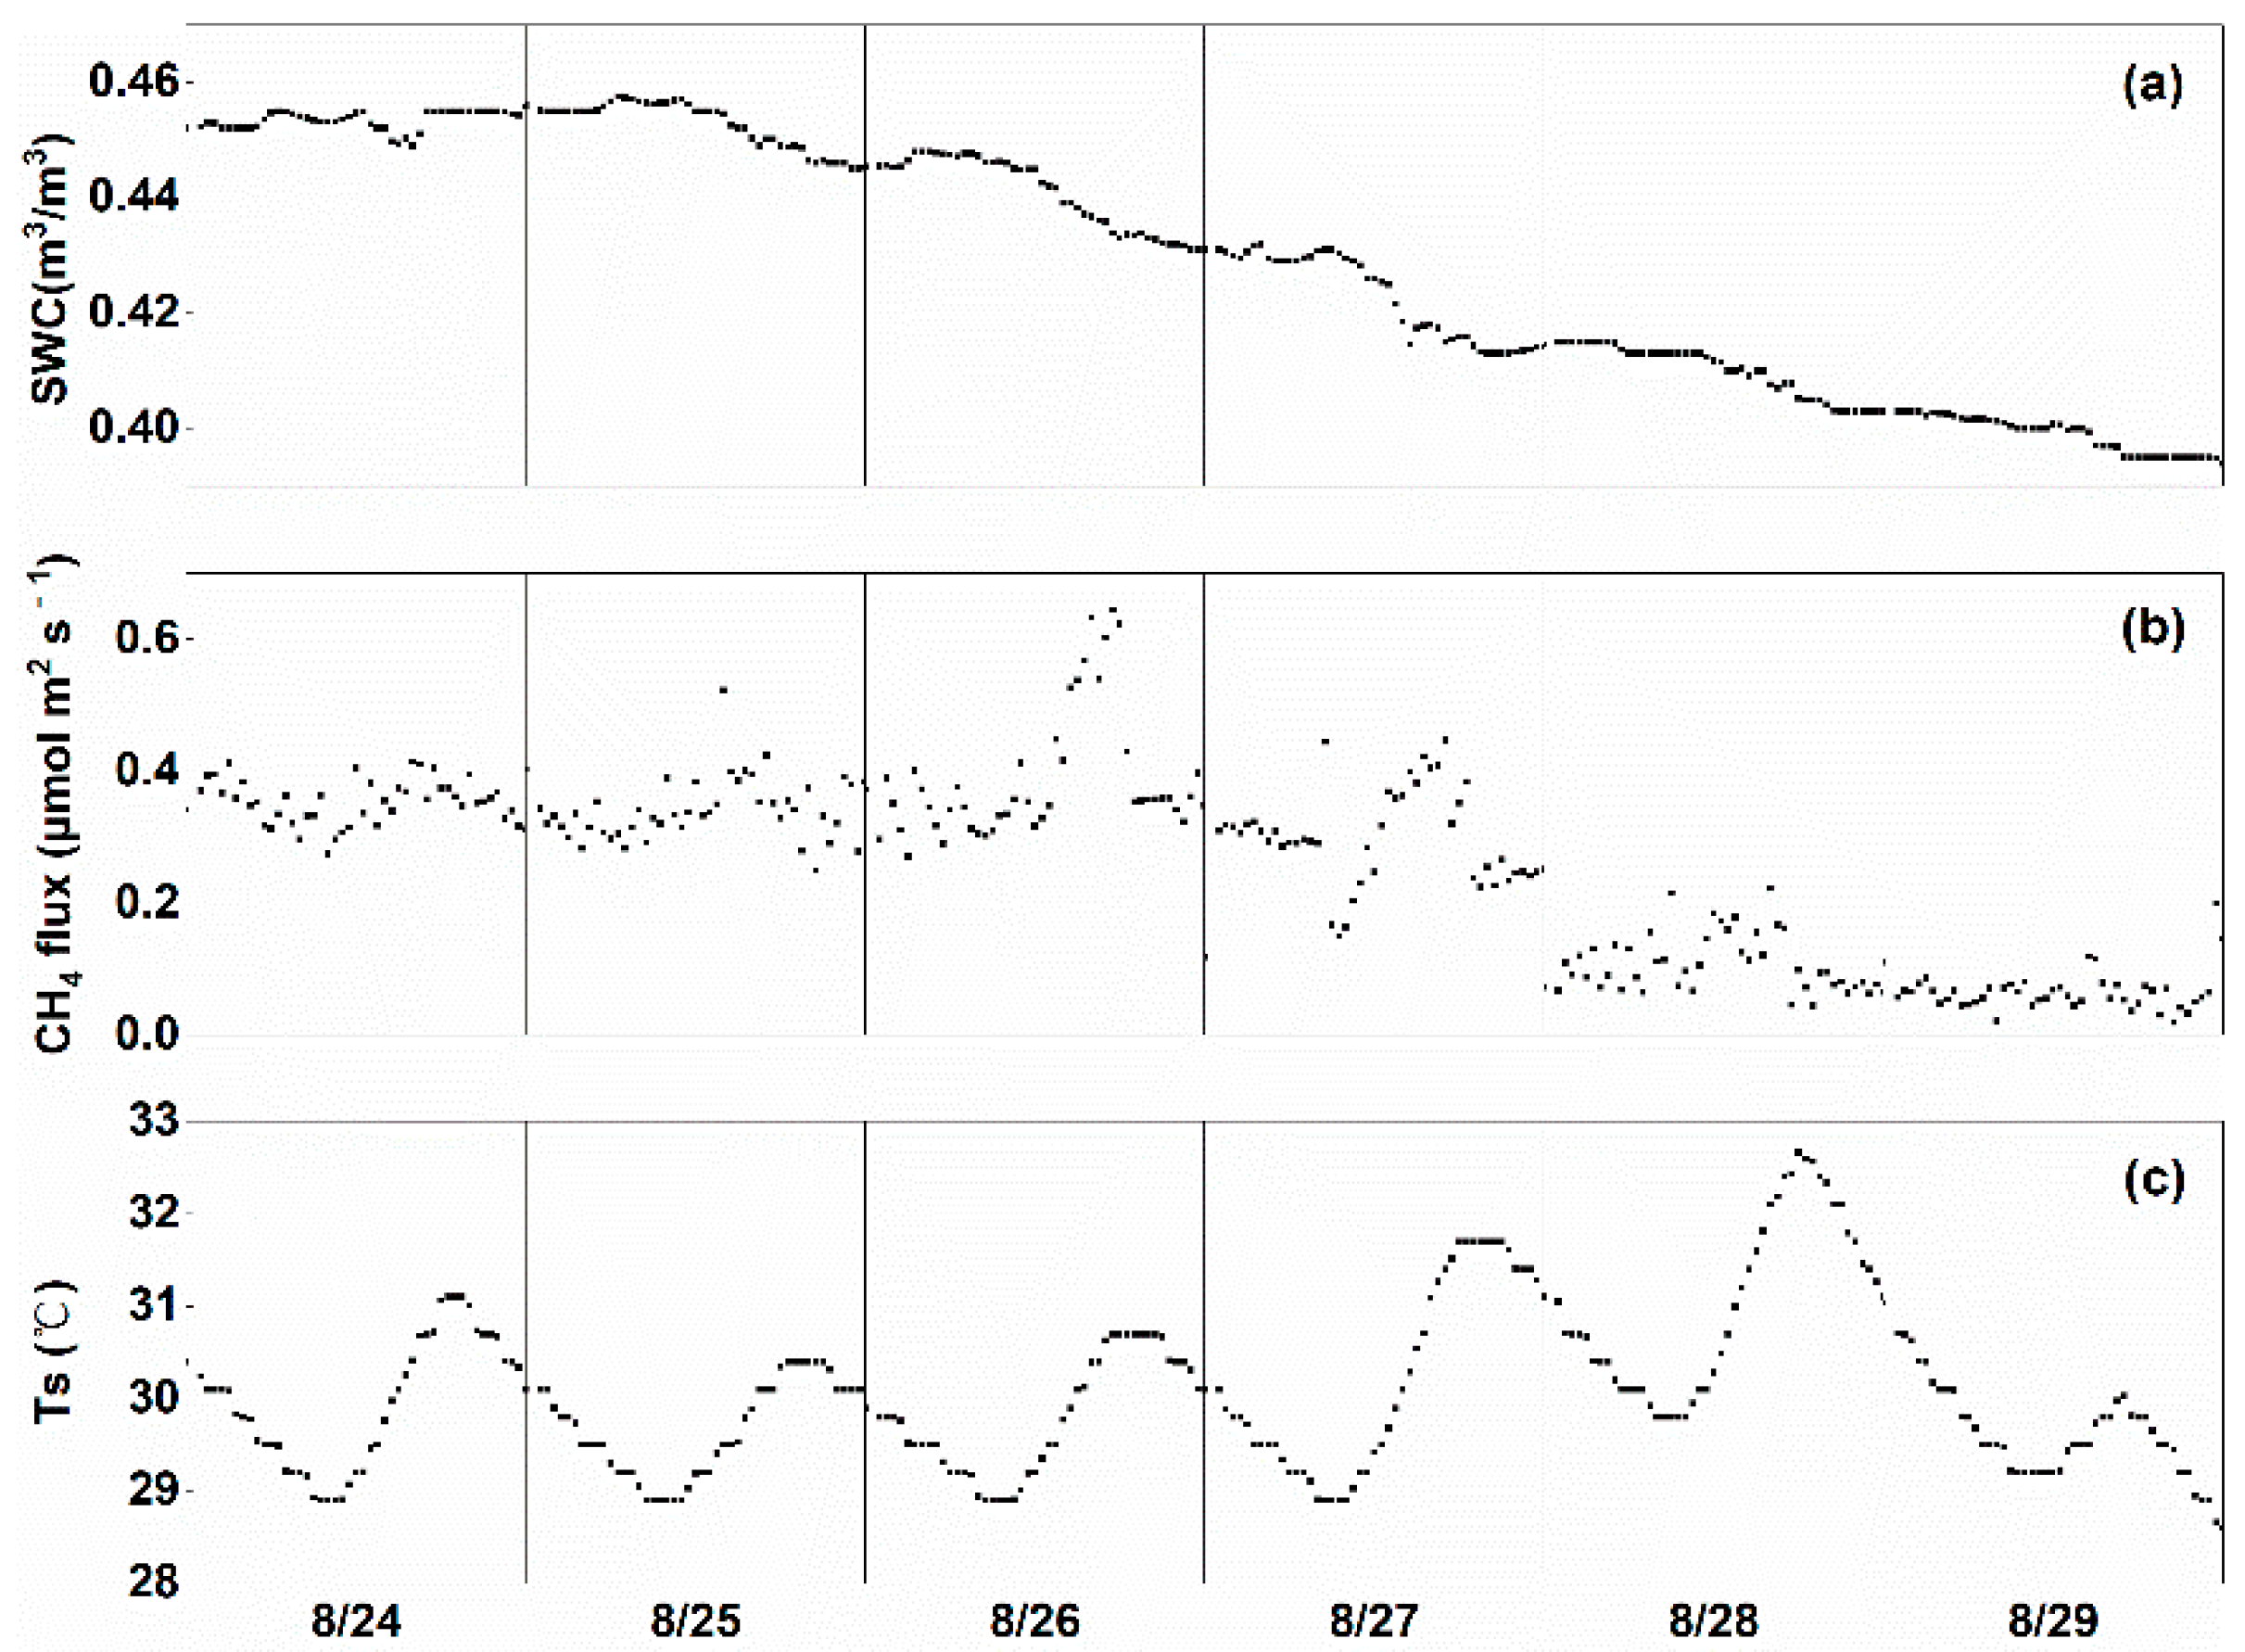
Mid-season drainage was performed during the four seasons observed in this study. In addition to drainage, natural field drying also caused the disappearance of the water layer in the field. The daily CH4 fluxes showed a brief rise followed by a sharp fall on 26 August 2019, 19 September 2019 and 23 July 2020, while the daily CH4 fluxes declined directly after the disappearance of the water layer on 9 September 2018 and 15 June 2020. Taking the mid-season drainage on 26 August 2019 as an example, the half-hourly CH4 fluxes, Ts5 and SWC are shown in Figure 6. On 26 August, the CH4 fluxes increased, SWC decreased and Ts5 varied little, implying that the production of CH4 did not change; thus, the increase in CH4 fluxes on 26 August was mostly likely attributable to the increase in transport efficiency. This finding could be explained by the fact that when the standing water had just disappeared, the soil in the paddy field experienced anaerobic conditions, and the resistance that CH4 gas needed to overcome to move from the soil to the air was reduced; therefore, the transport efficiency for CH4 increased [41]. Then, with the continuous decline in SWC, the soil environment changed from anaerobic to aerobic, resulting in a lower rate of methane production and a faster rate of oxidation; consequently, CH4 fluxes decreased. This finding was also reported by Alberto et al. [66], Ge et al. [49] and Iwata et al. [41]. Researchers have also found that the magnitude and duration of the increase in CH4 flux depended on how much CH4 was stored in the soil before mid-season drainage.
3.5. Inter-Seasonal Variations in CH4 Fluxes and Driving Factors
As shown in Table 3, the total emissions of CH4 were 21.63, 19.13, 23.95 and 14.52 g C-CH4 m−2 for late rice in 2018–2020 and early rice in 2020, respectively. The CH4 emissions of the total growing season in this study were comparable to those in the studies by Ge et al. [49] (19.20 g C-CH4 m−2 in a single-season paddy field in Yancheng, Jiangsu Province) and Wang et al. [39] (20.78 g C-CH4 m−2 in a single-season paddy field in Nanjing, Jiangsu Province) but were lower than those found by Dai et al. [50] (54.69 g C-CH4 m−2 in a rice-wheat rotation agroecosystem in Nanjing, Jiangsu Province) and greater than those found by Alberto et al. [66] (3.26 g C-CH4 m−2 in a single-season paddy field in the Philippines). Obviously, the seasonal total CH4 emissions were site dependent and varied with time. The differences in these results are due to the different environmental conditions and field management practices. Knox et al. [44] reported that CH4 emissions for the whole growing season ranged from 2.5–11.1 g C m−2 during 2009–2015 in a California paddy field, which was well below the emissions from Nanchang in this study. The mean Ta of the whole growing season averaged from 18.6 to 20.5 °C in California, and the greater temperature is thought to be the main reason for the greater CH4 emissions in Nanchang. Meijide et al. [46] observed that CH4 emissions ranged from 27.9 to 37.2 g C m−2 in an Italian paddy field; in this case, water management can account for the differences between the two sites because the paddy field in Italy was continuously flooded before ripening without mid-season drainage.
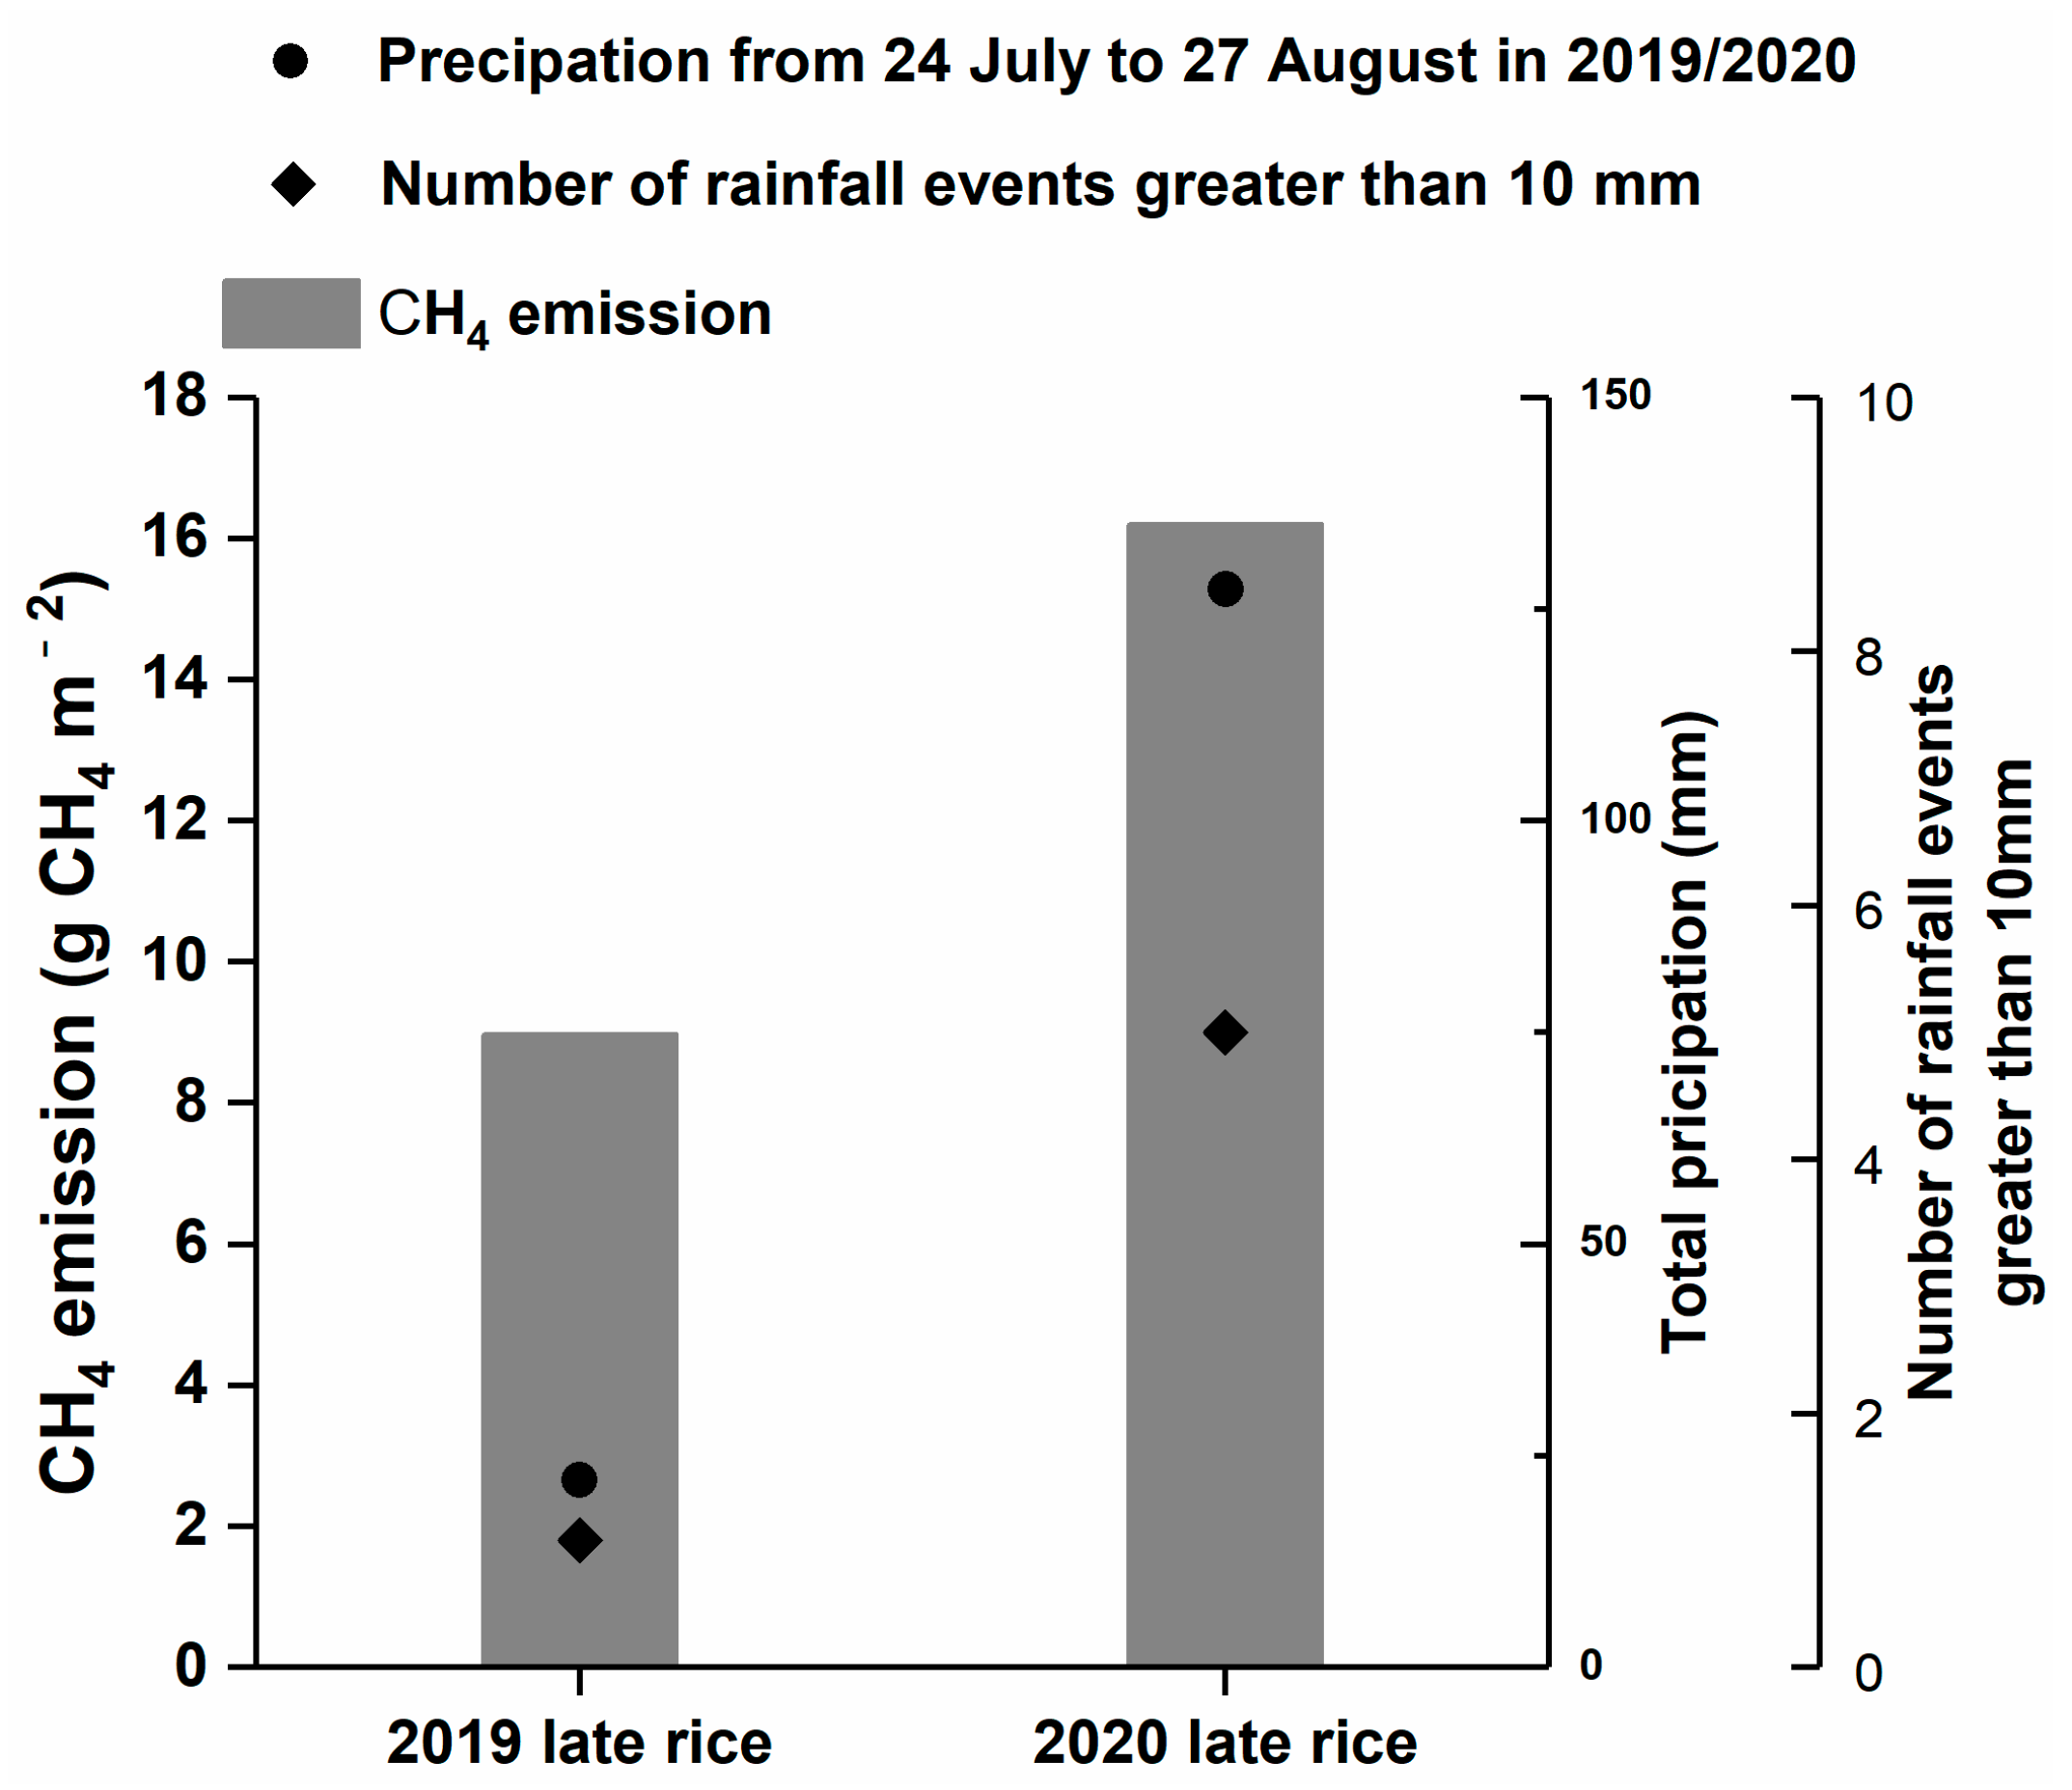
As shown in Table 3, the CH4 emissions before mid-season drainage were 13.70, 16.24, 21.14, and 6.78 g CH4 m−2 for 2018–2020 late rice and 2020 early rice and accounted for 63.4%, 84.9%, 88.3%, and 46.7% of the whole growing season emissions, respectively. Before mid-season drainage, the CH4 emissions of late rice in 2018 were lower than those in 2019 and 2020, which was attributed to the differences in planting type, irrigation type and climate. Late rice in 2018 was transplanted, but it was direct-seeded in 2019 and 2020; therefore, the periods before mid-season drainage were shorter in 2018. Additionally, because AWD was applied in 2018 late rice, the rice plants were dried several days after transplanting. Also, transplanted rice has a lower planting density than direct-seeded rice. Therefore, the GPP of late rice in 2018 was lower than that of late rice in 2019 and 2020 (as shown in Table 3, the GPP was 889.53, 1245.95 and 1081.13 g CO2 m−2 in 2018, 2019 and 2020 late rice, respectively). However, the CH4 emissions of late rice in 2018 were higher than those in 2019 and 2020 after mid-season drainage, which was due to rainfall during mid-season drainage for late rice in 2018. Kim et al. [31] reported that mid-season drainage decreased CH4 emissions from an irrigated rice paddy, but if rainfall occurred during the period, the reduction effect on CH4 emissions became small. As shown in Figure 5, the CH4 flux did not drop sharply after mid-season drainage for late rice in 2018, which was consistent with Kim et al. [31]. As shown in Figure 5, the difference in CH4 emissions between 2019 and 2020 late rice were originated from the CH4 emissions from 24 July to 27 August. Figure 7 shows that the total precipitation and times of rainfall events greater than 10 mm from 24 July to 27 August in 2019 were clearly greater than those in 2020. As shown in Figure 5, CH4 emissions of late rice in 2019 dropped sharply after mid-season drainage and remained low thereafter. Therefore, it is assumed that the drier soil conditions in the vegetative stage contributed to the lower CH4 emissions in late rice in 2019. The mean Ta of early rice was slightly lower than that of late rice, while the GPP was significantly lower. In addition, the total precipitation during the 2018–2020 late rice seasons and the 2020 early rice season was 415.0, 201.6, 409.8 and 1265.2 mm, respectively. It is speculated that photosynthesis decreased because of the lower temperatures and frequent rainfall events, which would have resulted in a decrease in methanogenic substrates. Thus, the difference between the CH4 emissions of early and late rice originated from variations in the growth state of rice plants.
The ratio of CH4 emissions to GPP (FCH4/GPP) was proposed by Knox et al. [44] as being useful for estimating CH4 emissions at the regional scale. The FCH4/GPP (%) values in 2018–2020 late rice and 2020 early rice in Nanchang were 2.52, 1.56, 1.97 and 1.94%, respectively. Simultaneous observations of CO2 and CH4 via EC are limited worldwide, and FCH4/GPP (%) has been observed to range from 1.3 to 2% in India [72] and Japan [61] and from 0.2% to 0.9% in a California rice paddy from 2009–2015 [44]. Knox et al. [44] suggested that FCH4 could be estimated as a variable fraction of GPP that increases linearly with increasing Ts5, which may be the reason why the FCH4/GPP in Nanchang was greater than that in California. Studies have indicated that FCH4/GPP depends on the soil, fertilizer type [73] and flood water management [66]. The mechanisms by which these factors influence FCH4/GPP are an issue that merits further research.
4. Conclusions
Based on continuous measurements performed in two double-cropping paddy fields using the EC technique in southern China from 2018 to 2020, this study investigated the variations and drivers of CH4 fluxes at diurnal, seasonal and inter-seasonal scales. A significant single-peak diurnal pattern was observed during the vegetative stage of all four rice growing seasons and the reproductive stage of early rice, and wavelet analysis indicated that GPP, rather than Ta, drove diurnal CH4 fluxes. Large seasonal variations in daily CH4 emissions were observed in the two double-cropping paddy fields, and Ts5 was able to explain most of the seasonality of the CH4 fluxes, followed by GPP and SWC. At the inter-seasonal timescale, the CH4 emissions for the total growing season ranged from 14.52 to 23.95 g C-CH4 m−2. The double-cropping paddy field in southern China is a relatively large source of CH4 emissions. The results of this study indicated that reducing the amount and frequency of irrigation during the vegetative stage under direct-seeded combined with traditional irrigation modes could decrease CH4 emissions in southern China. Choosing rice varieties that exhibit early tillering could reduce the length of time before mid-season drainage and then reduce GHG emissions from late rice. Our study on the pattern of CH4 fluxes and their linkages with biophysical controls at multiple timescales will be helpful for estimating GHG budgets at regional and global scales and offers useful information for field managers and policymakers.
Author Contributions
Conceptualization, L.M. and Y.C.; methodology, B.L.; software, Y.S.; writing—review and editing, L.M. and B.L.; supervision, Y.C. and Y.S. All authors have read and agreed to the published version of the manuscript.
Funding
This study was funded by the NSFC-MWR-CTGC Joint Yangtze River Water Science Research Project (No. U2040213) and the National Natural Science Foundation of China (51709180).
Institutional Review Board Statement
Not applicable.
Informed Consent Statement
Not applicable.
Data Availability Statement
The data in this study are available from the corresponding authors upon request.
Conflicts of Interest
The authors declare no conflict of interest.
References
- Hwang, Y.; Ryu, Y. Comprehensive assessments of carbon dynamics in an intermittently-irrigated rice paddy. Agric. For. Meteorol. 2020, 285–286, 107933. [Google Scholar] [CrossRef]
- Jia, Q.; Yu, W. Methane emissions from typical paddy fields in Liaohe plain and Sanjiang plain, northeast China. Environ. Res. Commun. 2019, 1, 011006. [Google Scholar]
- Stocker, T.F.; Qin, D. Contribution of Working Group I to the Fifth Assessment Report of the Intergovernmental Panel on Climate Change. In Climate Change 2013: The Physical Science Basis; Cambridge University Press: Cambridge, UK; New York, NY, USA, 2013. [Google Scholar]
- Saunois, M.; Stavert, A.R.; Poulter, B.; Bousquet, P.; Zhuang, Q. The Global Methane Budget 2000–2017. Earth Sys. Sci. Data 2020, 12, 1561–1623. [Google Scholar] [CrossRef]
- FAO. Statistical Yearbook 2013: World Food and Agriculture; Food and Agriculture Organization of the United Nations: Rome, Italy, 2013; p. 289. [Google Scholar]
- Wu, X.; Wang, W. Combined effects of straw and water management on CH4 emissions from rice fields. J. Environ. Manag. 2018, 231, 1257–1262. [Google Scholar] [CrossRef] [PubMed]
- Yuan, J.; Yuan, Y. Effects of different fertilizers on methane emissions and methanogenic community structures in paddy rhizosphere soil. Sci. Total Environ. 2018, 627, 770–781. [Google Scholar] [CrossRef]
- Ma, Y.; Liu, D.L.; Schwenke, G.; Yang, B. The global warming potential of straw-return can be reduced by application of straw-decomposing microbial inoculants and biochar in rice-wheat production systems. Environ. Pollut. 2019, 252, 835–845. [Google Scholar] [CrossRef] [PubMed]
- Miyata, A.; Leuning, R. Carbon dioxide and methane fluxes from an intermittently flooded paddy field. Agric. For. Meteorol. 2000, 102, 287–303. [Google Scholar] [CrossRef]
- Weller, S.; Kraus, D. Diurnal patterns of methane emissions from paddy rice fields in the Philippines. J. Plant Nutr. Soil Sci. 2015, 178, 755–767. [Google Scholar] [CrossRef]
- Long, K.D.; Flanagan, L.B. Diurnal and seasonal variation in methane emissions in a northern Canadian peatland measured by eddy covariance. Glob. Chang. Biol. 2009, 16, 2420–2435. [Google Scholar] [CrossRef]
- Kim, Y.; Johnson, M.S. Gap-filling approaches for eddy covariance methane fluxes: A comparison of three machine learning algorithms and a traditional method with principal component analysis. Glob. Chang. Biol. 2020, 26, 1499–1518. [Google Scholar] [CrossRef] [PubMed]
- Hollinger, D.Y.; Kelliher, F.M. Initial assessment of multi-scale measures of CO2 and H2O flux in the Siberian taiga. J. Biogeogr. 1995, 22, 425–431. [Google Scholar] [CrossRef]
- Moncrieff, J.B.; Massheder, J.M. A system to measure surface fluxes of momentum, sensible heat, water vapour and carbon dioxide. J. Hydrol. 1997, 188–189, 589–611. [Google Scholar] [CrossRef]
- Jiang, S.Z.; Liang, C. Water use efficiency and its drivers in four typical agroecosystems based on flux tower measurements. Agric. For. Meteorol. 2020, 295, 108200. [Google Scholar] [CrossRef]
- Wagle, P.; Gowda, P.H. Dynamics of CO2 and H2O fluxes in Johnson grass in the U.S. Southern Great Plains. Sci. Total Environ. 2020, 739, 140077. [Google Scholar] [CrossRef]
- Alberto, M.C.R.; Hirano, T. Influence of climate variability on seasonal and interannual variations of ecosystem CO2 exchange in flooded and non-flooded rice fields in the Philippines. Field Crops Res. 2012, 134, 80–94. [Google Scholar] [CrossRef]
- Schmidt, M.; Reichenau, T.G. The carbon budget of a winter wheat field: An eddy covariance analysis of seasonal and inter-annual variability. Agric. For. Meteorol. 2012, 165, 114–126. [Google Scholar] [CrossRef]
- Richardson, A.D.; Hollinger, D.Y. A multi-site analysis of random error in tower-based measurements of carbon and energy fluxes. Agric. For. Meteorol. 2006, 136, 1–18. [Google Scholar] [CrossRef] [Green Version]
- Leuning, R.; Gorsel, E.V. Reflections on the surface energy imbalance problem. Agric. For. Meteorol. 2012, 156, 65–74. [Google Scholar] [CrossRef]
- Liu, B.; Cui, Y.; Luo, Y.; Shi, Y.; Liu, M.; Liu, F. Energy partitioning and evapotranspiration over a rotated paddy field in Southern China. Agric. For. Meteorol. 2019, 276-277, 107626. [Google Scholar] [CrossRef]
- Dengel, S.; Levy, P.E. Methane emissions from sheep pasture, measured with an open-path eddy covariance system. Glob. Chang. Biol. 2011, 17, 3524–3533. [Google Scholar] [CrossRef]
- Morin, T.H.; Bohrer, G. The seasonal and diurnal dynamics of methane flux at a created urban wetland. Ecol. Eng. 2014, 72, 74–83. [Google Scholar] [CrossRef]
- Podgrajsek, E.; Sahlée, E. Diurnal cycle of lake methane flux. J. Geophys. Res. 2014, 119, 236–248. [Google Scholar] [CrossRef]
- Koebsch, F.; Jurasinski, G. Controls for multi-scale temporal variation in ecosystem methane exchange during the growing season of a permanently inundated fen. Agric. For. Meteorol. 2015, 204, 94–105. [Google Scholar] [CrossRef]
- Fortuniak, K.; Pawlak, W.O. Methane and carbon dioxide fluxes of a temperate mire in Central Europe. Agric. For. Meteorol. 2017, 232, 306–318. [Google Scholar] [CrossRef]
- Yagi, K.; Tsuruta, H. Effect of water management on methane emission from a Japanese rice paddy field: Automated methane monitoring. Glob. Biogeochem. Cycles 1996, 10, 255–267. [Google Scholar] [CrossRef]
- Acosta, M.; Dušek, J. Autumnal fluxes of CH4 and CO2 from Mediterranean reed wetland based on eddy covariance and chamber methods. Catena 2019, 183, 104191. [Google Scholar] [CrossRef]
- Suyker, A.E.; Verma, S.B. Methane flux in a boreal fen: Season-long measurement by eddy correlation. J. Geophys. Res. 1996, 101, 28637–28647. [Google Scholar] [CrossRef]
- Tokida, T.; Miyazaki, T. Ebullition of methane from peat with falling atmospheric pressure. Geophys. Res. Lett. 2005, 32, 13823. [Google Scholar] [CrossRef]
- Kim, Y.; Talucder, M.S.A. Interannual variations in methane emission from an irrigated rice paddy caused by rainfalls during the aeration period. Agric. Ecosyst. Environ. 2016, 223, 67–75. [Google Scholar] [CrossRef]
- Hatala, J.A.; Detto, M. Gross ecosystem photosynthesis causes a diurnal pattern in methane emission from rice. Geophys. Res. Lett. 2012, 39, 06409. [Google Scholar] [CrossRef] [Green Version]
- Bridgham, S.D.; Cadillo-Quiroz, H. Methane emissions from wetlands: Biogeochemical, microbial, and modeling perspectives from local to global scales. Glob. Chang. Biol. 2013, 19, 1325–1346. [Google Scholar] [CrossRef] [PubMed]
- Song, C.Q.; Liu, W. Characteristics and drivers of methane fluxes from a rice paddy based on the flux measurement. Adv. Earth Sci. 2019, 34, 1141–1151, (In Chinese with English Abstract). [Google Scholar]
- Cicerone, R.J.; Shetter, J.D. Seasonal variation of methane flux from a California rice paddy. J. Geophys. Res. 1983, 88, 11022–11024. [Google Scholar] [CrossRef] [Green Version]
- Wassmann, R.; Aulakh, M.S. The role of rice plants in regulating mechanisms of methane missions. Biol. Fertil. Soils 2000, 31, 20–29. [Google Scholar] [CrossRef]
- Cai, Z.C.; Tsuruta, H. Methane emission from rice fields in China: Measurements and influencing factors. J. Geophys. Res. 2000, 105, 17231–17242. [Google Scholar] [CrossRef] [Green Version]
- Conrad, R. Control of microbial methane production in wetland rice fields. Nutr. Cycl. Agroecosyst. 2002, 64, 59–69. [Google Scholar] [CrossRef]
- Wang, J.; Zhang, X. Methane emissions from a rice agroecosystem in South China: Effects of water regime, straw incorporation and nitrogen fertilizer. Nutr. Cycl. Agroecosyst. 2012, 93, 103–112. [Google Scholar] [CrossRef]
- Liao, B.; Wu, X. Effects of mild alternate wetting and drying irrigation and mid-season drainage on CH4 and N2O emissions in rice cultivation. Sci. Total Environ. 2020, 698, 134212. [Google Scholar] [CrossRef] [PubMed]
- Iwata, H.; Mano, M. Exploring sub-daily to seasonal variations in methane exchange in a single-crop rice paddy in central Japan. Atmos. Environ. 2018, 179, 156–165. [Google Scholar] [CrossRef]
- Moore, T.R.; Dalva, M. The influence of temperature and water table position on carbon dioxide and methane emissions from laboratory columns of peatland soils. J. Soil Sci. 2010, 44, 651–664. [Google Scholar] [CrossRef]
- Knox, S.H.; Sturtevant, C. Agricultural peatland restoration: Effects of land-use change on greenhouse gas (CO2 and CH4) fluxes in the Sacramento-San Joaquin Delta. Glob. Chang. Biol. 2014, 21, 750–765. [Google Scholar] [CrossRef] [PubMed]
- Knox, S.H.; Matthes, J.H. Biophysical controls on interannual variability in ecosystem-scale CO2 and CH4 exchange in a California rice paddy. J. Geophys. Res. 2016, 121, 978–1001. [Google Scholar] [CrossRef]
- Runkle, B.R.; Suvoscarev, K.; Reba, M.L.; Reavis, C.W.; Smith, S.F.; Chiu, Y.L.; Fong, B. Methane Emission Reductions from the Alternate Wetting and Drying of Rice Fields Detected Using the Eddy Covariance Method. Environ. Sci. Technol. 2019, 53, 671–681. [Google Scholar] [CrossRef] [PubMed]
- Meijide, A.; Manca, G. Seasonal trends and environmental controls of methane emissions in a rice paddy field in Northern Italy. Biogeosciences 2011, 8, 3809–3821. [Google Scholar] [CrossRef] [Green Version]
- Meijide, A.; Gruening, C. Water management reduces greenhouse gas emissions in a Mediterranean rice paddy field. Agric. Ecosyst. Environ. 2017, 238, 168–178. [Google Scholar] [CrossRef]
- Centeno, C.A.R.; Alberto, M.C.R. Assessing diel variation of CH4 flux from rice paddies through temperature patterns. Atmos. Environ. 2017, 167, 23–39. [Google Scholar] [CrossRef]
- Ge, H.X.; Zhang, H.S. The characteristics of methane flux from an irrigated rice farm in East China measured using the eddy covariance method. Agric. For. Meteorol. 2018, 249, 228–238. [Google Scholar] [CrossRef]
- Dai, S.; Ju, W. Variations and drivers of methane fluxes from a rice-wheat rotation agroecosystem in eastern China at seasonal and diurnal scales. Sci. Total Environ. 2019, 690, 973–990. [Google Scholar] [CrossRef]
- Berg, M.; Hengsdijk, H. The impact of increasing farm size and mechanization on rural income and rice production in Zhejiang province, China. Agric. Syst. 2007, 94, 841–850. [Google Scholar] [CrossRef]
- Chu, G.; Chen, T. Morphological and physiological traits of roots and their relationships with water productivity in water-saving and drought-resistant rice. Field Crops Res. 2014, 162, 108–119. [Google Scholar] [CrossRef]
- Carrijo, D.R.; Lundy, M.E. Rice yields and water use under alternate wetting and drying irrigation: A meta-analysis. Field Crops Res. 2017, 203, 173–180. [Google Scholar] [CrossRef]
- Chen, X.Y.; Wu, F.; Chen, H.X.; Wang, C.G. Analysis of the characteristics and causes of severe summer and autumn droughts in Jiangxi in 2019. Meteorol. Disaster Reduct. Res. 2020, 43, 170–179, (In Chinese with English Abstract). [Google Scholar]
- LI-COR Biosciences. EddyPro 5.0: Help and User’s Guide; LI-COR Biosciences: Lincoln, NE, USA, 2013. [Google Scholar]
- Webb, E.K.; Pearman, G.I. Correction of Flux Measurements for Density Effects Due to Heat and Water Vapor Transfer. Q. J. R. Meteorolog. Soc. 1980, 106, 100. [Google Scholar] [CrossRef]
- Fratini, G.; Ibrom, A. Relative humidity effects on water vapour fluxes measured with closed-path eddy-covariance systems with short sampling lines. Agric. For. Meteorol. 2012, 165, 53–63. [Google Scholar] [CrossRef]
- Falge, E.; Baldocchi, D. Gap filling strategies for defensible annual sums of net ecosystem exchange. Agric. For. Meteorol. 2001, 107, 43–69. [Google Scholar] [CrossRef] [Green Version]
- Taylor, J.L.A. On the Temperature Dependence of Soil Respiration. Funct. Ecol. 1994, 8, 315–323. [Google Scholar]
- Minoda, T.; Kimura, M. Photosynthates as dominant source of CH4 and CO2 in soil water and CH4 emitted to the atmosphere from paddy fields. J. Geophys. Res. 1996, 101, 21091–21097. [Google Scholar] [CrossRef]
- Miyata, A.; Iwata, T. Seasonal variation of carbon dioxide and methane fluxes at single cropping paddy fields in central and western Japan. Phyton 2005, 45, 89–97. [Google Scholar]
- Gogoi, N.; Baruah, K.K. Methane emission characteristics and its relations with plant and soil parameters under irrigated rice ecosystem of northeast India. Chemosphere 2005, 59, 1677–1684. [Google Scholar] [CrossRef]
- Neue, H.U.; Wassmann, R. Factors and processes controlling methane emissions from rice fields. Nutr. Cycl. Agroecosyst. 1997, 49, 111–117. [Google Scholar] [CrossRef]
- Wang, M.; Dai, A. CH4 emission from Chinese rice paddy field. Acta Meteorol. Sin. 1990, 4, 265–275. [Google Scholar]
- Marik, T.; Fischer, H. Seasonal variations in stable carbon and hydrogen isotope ratios in methane from rice fields. Glob. Biogeochem. Cycles 2002, 16, 41-1–41-11. [Google Scholar] [CrossRef]
- Alberto, M.C.R.; Wassmann, R. Measuring methane flux from irrigated rice fields by eddy covariance method using open-path gas analyzer. Field Crops Res. 2014, 160, 12–21. [Google Scholar] [CrossRef]
- Simpson, I.J.; Thurtell, G.W. Tunable diode laser measurements of methane fluxes from an irrigated rice paddy field in the Philippines. J. Geophys. Res. 1995, 100, 7283–7290. [Google Scholar] [CrossRef]
- Xu, X.; Kuzyakov, Y. Root-derived respiration and non-structural carbon of rice seedlings. Eur. J. Soil Biol. 2008, 44, 22–29. [Google Scholar] [CrossRef]
- Holzapfel-Pschorn, A.; Seiler, W. Methane emission during a cultivation period from an Italian rice paddy. J. Geophys Res. 1986, 91, 11803–11814. [Google Scholar] [CrossRef]
- Inubushi, K.; Wada, H. Methane emission from paddy fields. Presented at the 14th International Congress of Soil Science, Kyoto, Japan, 12–18 August 1990. [Google Scholar]
- Wassmann, R.; Neue, H.U. Temporal patterns of methane emissions from wetland rice fields treated by different modes of N application. J. Geophys. Res. 1994, 991, 16457–16462. [Google Scholar] [CrossRef]
- Bhattacharyya, P.; Neogi, S. Tropical low land rice ecosystem is a net carbon sink. Agric. Ecosyst. Environ. 2014, 189, 127–135. [Google Scholar] [CrossRef]
- Lindau, C.W.; Bollich, P.K. Effect of urea fertilizer and environmental factors on CH4 emissions from a Louisiana, USA rice field. Plant Soil 1991, 136, 195–203. [Google Scholar] [CrossRef]
Figure 1.
Location of Ganfu Plain. (a) Sketch map of the station location; (b) Setup of the eddy covariance system at ST2 with a WindMaster Pro ultrasonic anemometer, LI7500A open-path CO2/H2O analyzer, and LI-7700 open-path CH4 analyzer; (c) Google Earth map of ST1 and ST2 (the yellow circles indicate the position of the eddy covariance towers).

Figure 2.
Diurnal variations in half-hourly CH4 fluxes in the vegetative, reproductive and ripening stages of the rice growing seasons of 2018–2020 late rice and 2020 early rice. The grey shading represents the standard deviations of the half-hourly CH4 fluxes.
Figure 2.
Diurnal variations in half-hourly CH4 fluxes in the vegetative, reproductive and ripening stages of the rice growing seasons of 2018–2020 late rice and 2020 early rice. The grey shading represents the standard deviations of the half-hourly CH4 fluxes.

Figure 3.
The wavelet coherence of CH4 flux with (a) gross primary production (GPP), (b) air temperature (Ta) in 2018 late rice, (c) GPP, (d) Ta in 2019 late rice, (e) GPP, (f) Ta in 2020 early rice, (g) GPP, (h) Ta in 2020 late rice. The direction of the arrows indicates the phase angle between the two time series; an arrow with an inclination of zero points to the right indicates zero lag (i.e., the series are perfectly correlated).

Figure 4.
Seasonal variations in (a) net solar radiation (Rn); (b) Ta and soil temperature at 5 cm depth (Ts5) and (c) soil water content at 5 cm depth (SWC).
Figure 4.
Seasonal variations in (a) net solar radiation (Rn); (b) Ta and soil temperature at 5 cm depth (Ts5) and (c) soil water content at 5 cm depth (SWC).

Figure 5.
Seasonal variations of (a) CH4 flux, (b) ecosystem respiration (Reco), (c) GPP, and (d) net ecosystem exchange (NEE) during flooded (gray shaded area) and non-flooded (non-shaded area) periods. Black rectangles indicate periods of mid-season drainage in each season.
Figure 5.
Seasonal variations of (a) CH4 flux, (b) ecosystem respiration (Reco), (c) GPP, and (d) net ecosystem exchange (NEE) during flooded (gray shaded area) and non-flooded (non-shaded area) periods. Black rectangles indicate periods of mid-season drainage in each season.

Figure 6.
Time series of (a) SWC, (b) CH4 fluxes, and (c) Ts5 for 24–29 August 2019.

Figure 7.
Total CH4 emissions (black bars), number of rainfall events greater than 10 mm (square dots), and total precipitation (circle dots) from 24 July to 27 August of 2019 and 2020.
Figure 7.
Total CH4 emissions (black bars), number of rainfall events greater than 10 mm (square dots), and total precipitation (circle dots) from 24 July to 27 August of 2019 and 2020.


Table 1.
Crop management for ST1 and ST2.
| Growth Stage | Field Management | Fertilizer Application | |||
|---|---|---|---|---|---|
| 2018–late rice–ST1 (WT a: AWD) | |||||
| Vegetative stage | 27 July–25 August | Field ponding | 20 July | Basal fertilizer | 26 July |
| Reproductive stage | 26 August–6 October | Transplanting | 26 July | Tillering fertilizer | 2 August |
| Ripening stage | 7 October–31 October | Mid-season drainage | 21 August–25 August | Panicle fertilizer | 28 August |
| Harvest | 1 November | ||||
| 2019–late rice–ST2 (WT a: local farms’ traditional irrigation method) | |||||
| Vegetative stage | 12 July–30 August | Field ponding | 6 July | Basal fertilizer | 11 July |
| Reproductive stage | 31 August–2 October | Seeding | 10 July | Tillering fertilizer | 20 August |
| Ripening stage | 3 October–14 November | Mid-season drainage | 26 August–30 August | ||
| Fallow season | 15 November–10 March | Harvest | 15 November | ||
| 2020–early rice–ST2 (WT a: local farms’ traditional irrigation method) | |||||
| Vegetative stage | 24 March–13 May | Field ponding | 20 March | Basal fertilizer | 24 March |
| Reproductive stage | 14 May–16 Jun | Seeding | 23 March | Tillering fertilizer | 1 May |
| Ripening stage | 17 June–11 July | Mid-season drainage | 8 May–13 May | ||
| Harvest | 12 July | ||||
| 2020–late rice–ST2 (WT a: local farms’ traditional irrigation method) | |||||
| Vegetative stage | 12 July–7 September | Field ponding | 6 July | Basal fertilizer | 12 July |
| Reproductive stage | 8 September–10 October | Seeding | 10 July | Tillering fertilizer | 19 August |
| Ripening stage | 11 October–20 November | Mid-season drainage | 28 August–7 September | ||
| Harvest | 21 November | ||||
a WT: water management.
Table 2.
Coefficients of determination (R2) a for the stepwise multivariate regression models.
| Model-1 | Model-2 | ||||||
|---|---|---|---|---|---|---|---|
| P1 b | P2 b | P3 b | |||||
| Variable | R2 | Variable | R2 | Variable | R2 | Variable | R2 |
| 2018 late rice | |||||||
| Ts5 | 0.921 | Ts5 | 0.690 | Ts5 | 0.789 | ||
| SWC | 0.941 | GPP | 0.735 | SWC | 0.839 | ||
| U* | 0.942 | RH | 0.737 | GPP | 0.850 | ||
| GPP | 0.942 | SWC | 0.739 | RH | 0.850 | ||
| RH | 0.942 | U* | 0.739 | U* | 0.850 | ||
| 2019 late rice | |||||||
| Ts5 | 0.793 | SWC | 0.809 | GPP | 0.856 | Ts5 | 0.903 |
| GPP | 0.836 | RH | 0.848 | RH | 0.872 | SWC | 0.906 |
| SWC | 0.847 | Ts5 | 0.878 | U* | 0.881 | GPP | 0.909 |
| RH | 0.854 | U* | 0.882 | Ts5 | 0.881 | U* | 0.911 |
| U* | 0.856 | GPP | 0.882 | SWC | 0.881 | RH | 0.911 |
| 2020 early rice | |||||||
| SWC | 0.163 | GPP | 0.108 | SWC | 0.838 | ||
| Ts5 | 0.584 | SWC | 0.534 | GPP | 0.860 | ||
| RH | 0.702 | RH | 0.541 | RH | 0.875 | ||
| GPP | 0.702 | Ts5 | 0.555 | Ts5 | 0.876 | ||
| U* | 0.702 | U* | 0.555 | U* | 0.876 | ||
| 2020 late rice | |||||||
| Ts5 | 0.826 | U* | 0.142 | RH | 0.458 | Ts5 | 0.791 |
| RH | 0.852 | RH | 0.292 | GPP | 0.578 | GPP | 0.814 |
| GPP | 0.874 | SWC | 0.328 | U* | 0.647 | SWC | 0.825 |
| SWC | 0.881 | Ts5 | 0.381 | SWC | 0.728 | U* | 0.827 |
| U* | 0.881 | GPP | 0.449 | Ts5 | 0.731 | RH | 0.827 |
(R2) a: R2 corresponded to the coefficient of determination when the corresponding row and the elements above it were used to construct the multiplicative model. P1–P3 b: different periods of the whole growing season determined as described in Section 2.4.2.
Table 3.
CH4 emissions, GPP during the whole season and before mid-season drainage, mean Ta, and the ratio of CH4 to GPP for the whole growing season in the four growing seasons.
Table 3.
CH4 emissions, GPP during the whole season and before mid-season drainage, mean Ta, and the ratio of CH4 to GPP for the whole growing season in the four growing seasons.
| Rice Season | CH4 (g CH4 m−2) | GPP (g CO2 m−2) | Mean Ta (°C) | F(CH4/GPP) % | ||
|---|---|---|---|---|---|---|
| Whole Season | Before Mid-Season Drainage | Whole Season | Before Mid-Season Drainage | |||
| 2018 late rice | 21.63 | 13.70 | 889.53 | 242.26 | 25.83 | 2.43 |
| 2019 late rice | 19.13 | 16.24 | 1245.95 | 471.40 | 26.46 | 1.54 |
| 2020 early rice | 14.52 | 6.78 | 746.57 | 134.71 | 23.11 | 1.94 |
| 2020 late rice | 23.95 | 21.14 | 1081.13 | 460.60 | 24.74 | 2.22 |
Publisher’s Note: MDPI stays neutral with regard to jurisdictional claims in published maps and institutional affiliations. |
© 2021 by the authors. Licensee MDPI, Basel, Switzerland. This article is an open access article distributed under the terms and conditions of the Creative Commons Attribution (CC BY) license (https://creativecommons.org/licenses/by/4.0/).
Share and Cite
MDPI and ACS Style
Ma, L.; Liu, B.; Cui, Y.; Shi, Y. Variations and Drivers of Methane Fluxes from Double-Cropping Paddy Fields in Southern China at Diurnal, Seasonal and Inter-Seasonal Timescales. Water 2021, 13, 2171. https://doi.org/10.3390/w13162171
AMA Style
Ma L, Liu B, Cui Y, Shi Y. Variations and Drivers of Methane Fluxes from Double-Cropping Paddy Fields in Southern China at Diurnal, Seasonal and Inter-Seasonal Timescales. Water. 2021; 13(16):2171. https://doi.org/10.3390/w13162171
Chicago/Turabian StyleMa, Linhua, Bo Liu, Yuanlai Cui, and Yuanzhi Shi. 2021. "Variations and Drivers of Methane Fluxes from Double-Cropping Paddy Fields in Southern China at Diurnal, Seasonal and Inter-Seasonal Timescales" Water 13, no. 16: 2171. https://doi.org/10.3390/w13162171
Note that from the first issue of 2016, this journal uses article numbers instead of page numbers. See further details here.