Article

Seasonal Variations in the Biochemical Compositions of Phytoplankton and Transparent Exopolymer Particles (TEPs) at Jang Bogo Station (Terra Nova Bay, Ross Sea), 2017–2018

1
Department of Oceanography, Pusan National University, Busan 46241, Korea
2
Korea Polar Research Institute, Incheon 21990, Korea
*
Author to whom correspondence should be addressed.
Water 2021, 13(16), 2173; https://doi.org/10.3390/w13162173
Submission received: 10 June 2021 / Revised: 4 August 2021 / Accepted: 5 August 2021 / Published: 8 August 2021
(This article belongs to the Special Issue Marine Nitrogen Fixation and Phytoplankton Ecology)

Abstract

:
The biochemical composition of particulate organic matter (POM) mainly originates from phytoplankton. Transparent exopolymer particles (TEPs) depend on environmental conditions and play a role in the food web and biogeochemical cycle in marine ecosystems. However, little information on their characteristics in the Southern Ocean is available, particularly in winter. To investigate the seasonal characteristics of POM and TEPSs, seawater samples were collected once every two weeks from November 2017 to October 2018 at Jang Bogo Station (JBS) located on the coast of Terra Nova Bay in the Ross Sea. The total chlorophyll-a (Chl-a) concentrations increased from spring (0.08 ± 0.06 μg L−1) to summer (0.97 ± 0.95 μg L−1) with a highest Chl-a value of 2.15 μg L−1. After sea ice formation, Chl-a rapidly decreased in autumn (0.12 ± 0.10 μg L−1) and winter (0.01 ± 0.01 μg L−1). The low phytoplankton Chl-a measured in this study was related to a short ice-free period in summer. Strong seasonal variations were detected in the concentrations of proteins and lipids (one-way ANOVA test, p < 0.05), whereas no significant difference in carbohydrate concentrations was observed among different seasons (one-way ANOVA test, p > 0.05). The phytoplankton community was mostly composed of diatoms (88.8% ± 11.6%) with a large accumulation of lipids. During the summer, the POM primarily consisted of proteins. The composition being high in lipids and proteins and the high caloric content in summer indicated that the phytoplankton would make a good food source. In winter, the concentrations of proteins decreased sharply. In contrast, relatively stable concentrations of carbohydrates and lipids have been utilized for respiration and long-term energy storage in the survival of phytoplankton. The TEPS values were significantly correlated with variations in the biomass and species of the phytoplankton. Our study site was characterized by dominant diatoms and low Chl-a concentrations, which could have resulted in relatively low TEP concentrations compared to other areas. The average contributions of TEP-C to the total POC were relatively high in autumn (26.9% ± 6.1%), followed by those in summer (21.9% ± 7.1%), winter (13.0% ± 4.2%), and spring (9.8% ± 3.1%).

1. Introduction

The Ross Sea is one of the most productive regions in the Southern Ocean, with strong seasonal variations in the biomass and production of phytoplankton [1]. The high phytoplankton biomass commonly observed in coastal areas during spring is linked to the stabilization of the water column and the release of micronutrients during ice melting [2]. However, phytoplankton growth is limited by micronutrient availability in ice-free waters under conditions of high irradiance in summer [3,4]. Furthermore, the changes in complex hydrographic features such as sea ice formation during the transition between late autumn and winter are likely to substantially influence the distribution of phytoplankton [5] and consequently the biochemical processes in the water columns [6,7,8]. Recently, sea ice concentration has increased significantly in the Ross Sea [9] and the annual ice-free period has shortened [10], which could potentially reduce water stratification and irradiance throughout the surface water. These changes can influence the composition and biomass of phytoplankton [11,12] and consequently the biogeochemical cycles and the food web structure in the Southern Ocean [13].
Through photosynthesis, phytoplankton synthesize inorganic nutrients into various organic compounds, which mainly consist of carbohydrates, proteins, and lipids [14]. The macromolecular composition of phytoplankton can change depending upon various environmental factors, such as nutrient concentrations, light intensity, and the species composition of the phytoplankton [14,15,16]. In the Southern Ocean, phytoplankton growth is generally limited by irradiance in spring [17] and by iron in summer [3,4,18]. Previous studies on the macromolecular composition of phytoplankton in the Ross Sea have been conducted primarily during spring and summer seasons [19,20,21,22]. Only a few studies [23] on the biochemical characteristics of phytoplankton have been previously conducted throughout a single year in the Southern Ocean. The Jang Bogo Station (JBS), located on the coast of Terra Nova Bay (TNB) in the Ross Sea, is one of the overwintering science stations in Antarctica. This study was conducted for approximately one year from November 2017 to October 2018 to monitor seasonal variations in the biochemical compositions of particulate organic matter (POM) and transparent exopolymer particles (TEPs) strongly related to phytoplankton.
TEPs are carbon-rich gel organic particles stainable with Alcian Blue, a specific dye for acidic polysaccharides, and phytoplankton are considered to be the main source of TEPs and their precursors [24,25]. TEPs are formed naturally by self-assembly of dissolved precursors, which appreciably contribute to the dissolved organic matter pool in the water column [26]. The formation of TEPs is critical as a significant pathway in which dissolved organic matter is transformed into POM [26]. Furthermore, TEPs are considered to play an important role in carbon cycling [27]. Because of their great stickiness, TEPs increase the aggregation rate of particles, forming marine snow, and enhance the carbon sinkage into deep waters in the marine system [28,29]. The distribution of TEPs is affected by environmental factors such as nutrient conditions [30,31] and the species and growth conditions of phytoplankton [32,33,34]. However, little information on TEPs’ abundances and regulating ecological factors is currently available for the Southern Ocean [25,35,36]. Most previous studies on TEPs have described their formation and dynamics either under experimental conditions [25,37] or during phytoplankton bloom seasons [36,38]. Our study is the first to show seasonal variation in TEPs at the JBS in the Ross Sea. The present study aimed to (1) identify the seasonal characterization of phytoplankton, (2) investigate the seasonal variations in the macromolecular composition of phytoplankton and TEPs concentrations at the JBS throughout the year, and (3) understand the roles of macromolecules and TEPs’ contributions to the organic carbon pool in Antarctic coastal environments.

2. Materials and Methods

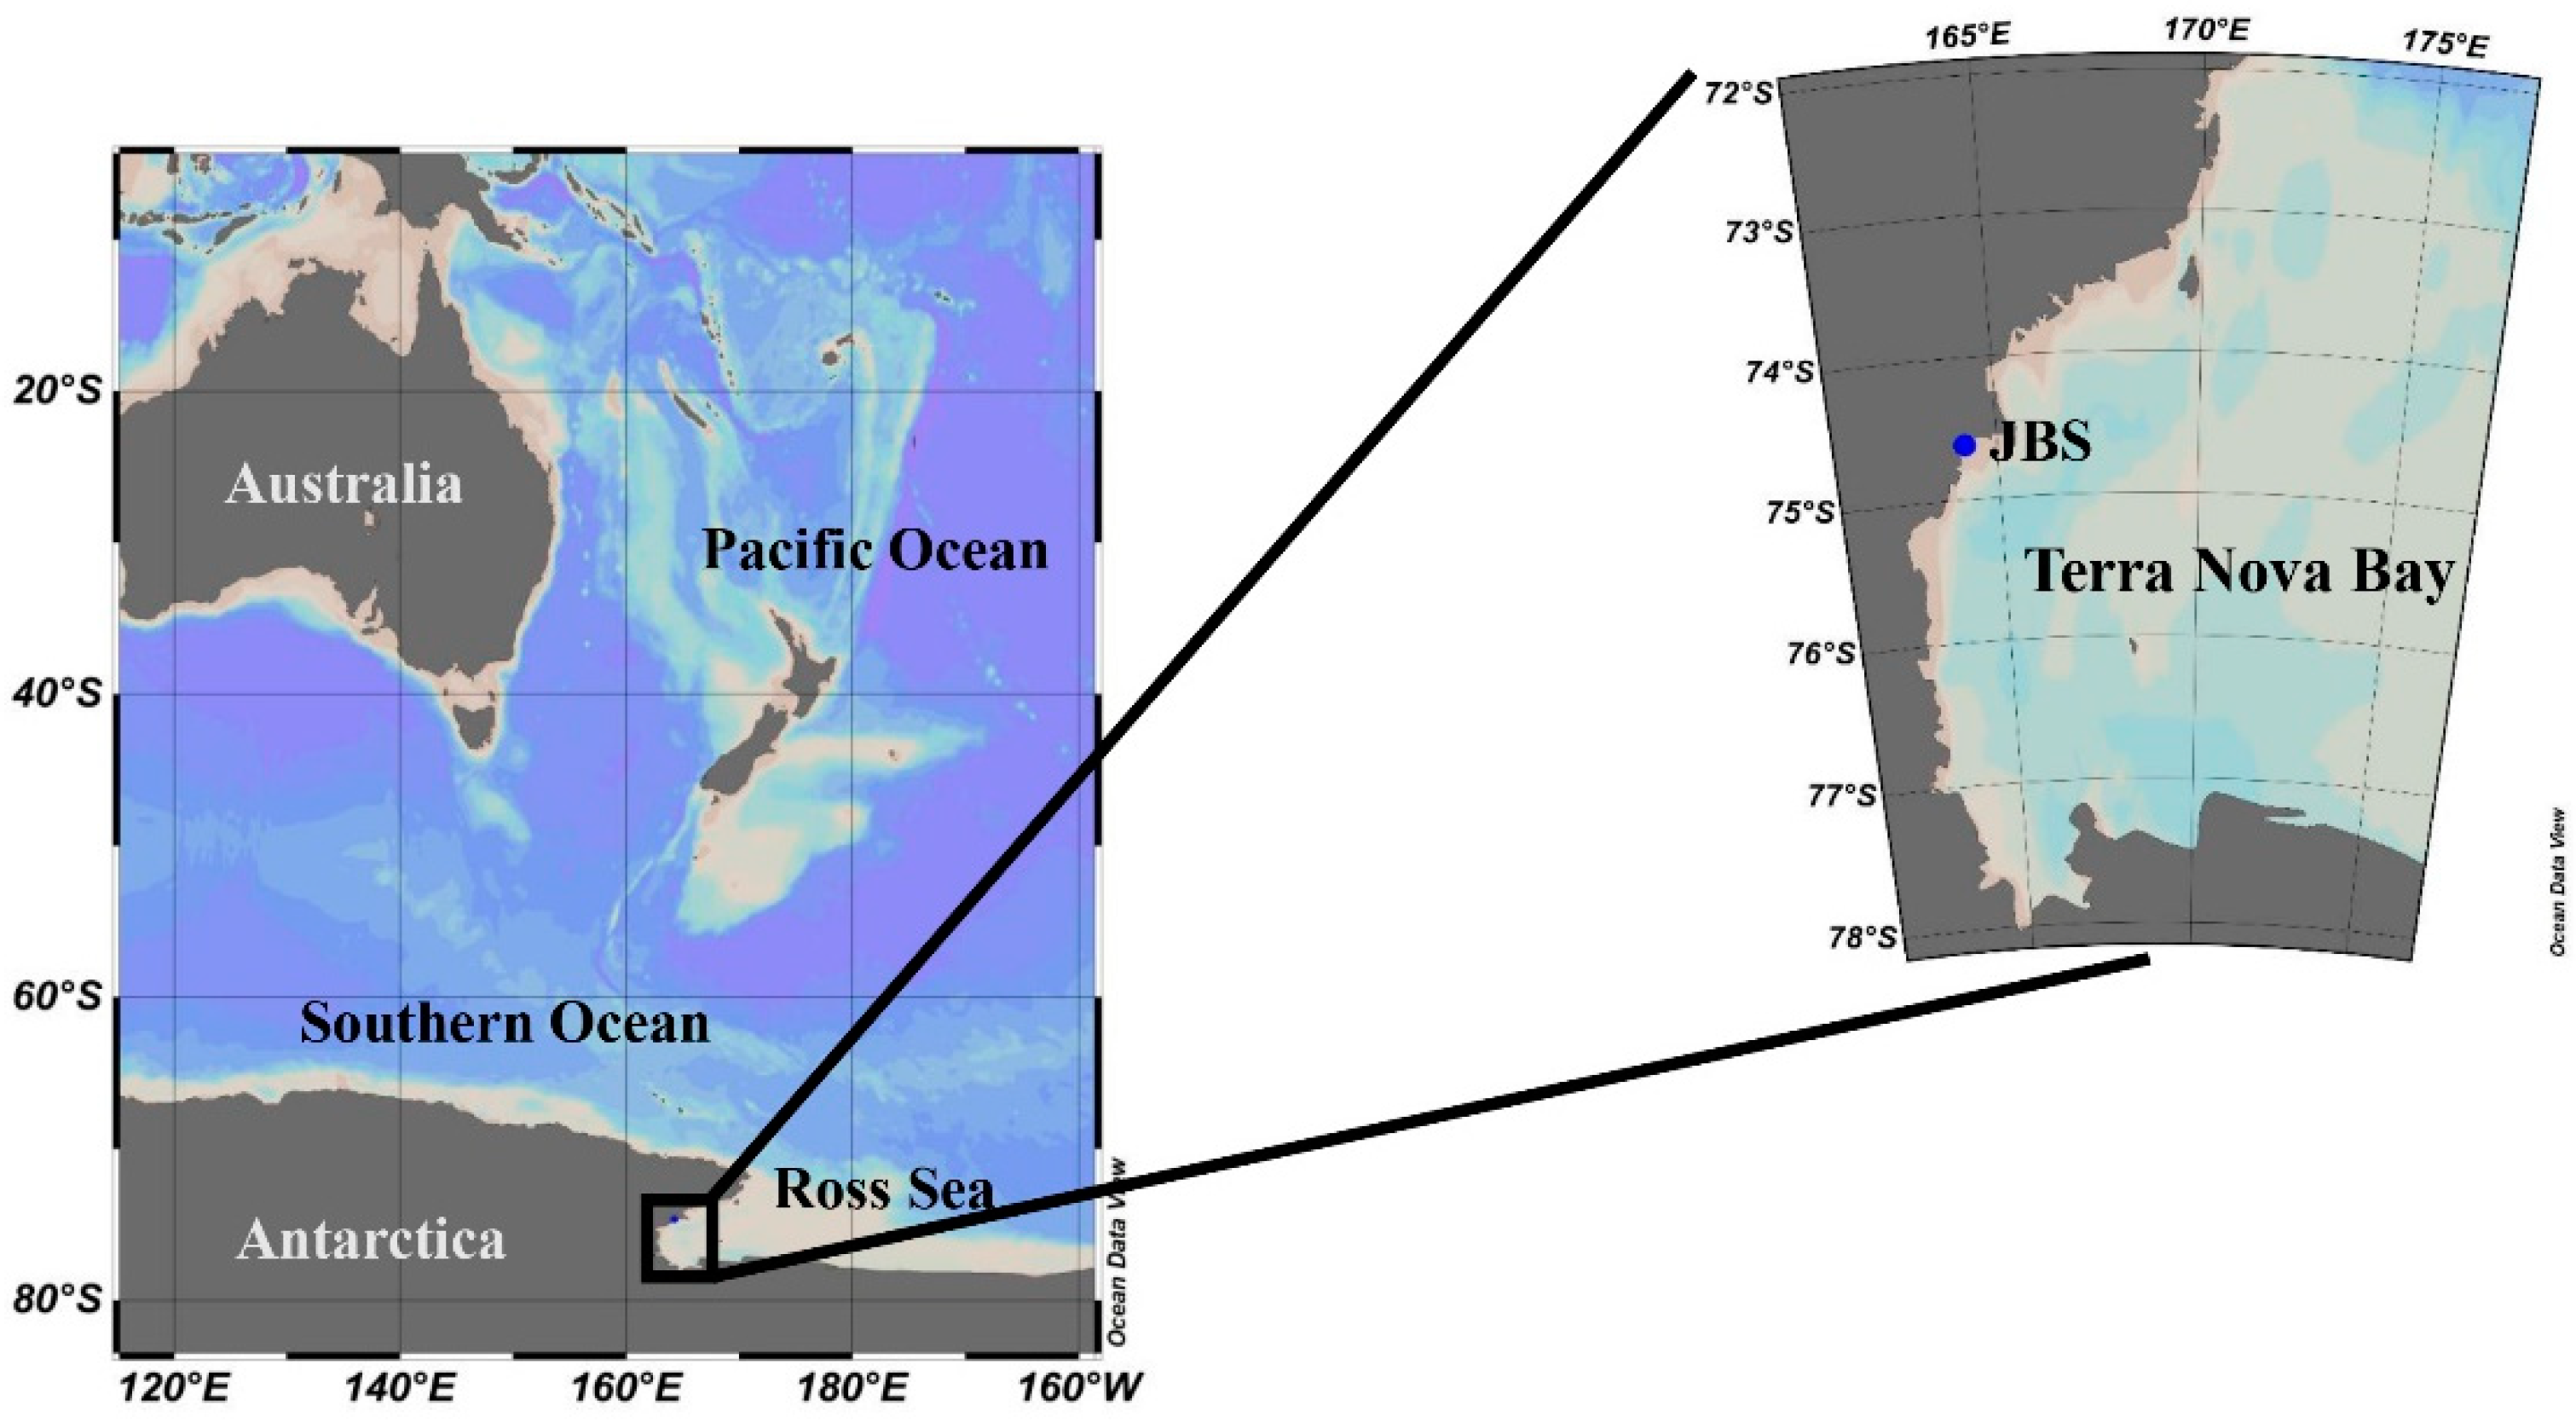
2.1. Study Area and Water Sampling

The JBS is located on the coast of TNB in the Ross Sea, Antarctica (74°37′39.59″ S, 164°14′25.75″ E) (Figure 1). Surface seawater samples for biochemical parameters from a continuously flowing water tank at the station were collected biweekly from 3 November 2017 to 26 October 2018. In situ seawater temperature and salinity were measured by YSI professional plus. To verify seasonal differences, our entire study period was divided into four seasons: spring (November to December), summer (January to February), autumn (March to April), and winter (May to October).

2.2. Nutrient Analysis

Water samples for major inorganic nutrients (nitrite + nitrate, ammonium, silicate, and phosphate) were filtered through a 47 mm GF/F (0.7 μm pore size), and the filtered water samples (45 mL) were stored frozen at −80 °C in a 50 mL conical tube until analysis. The concentrations of inorganic nutrients were analyzed using an automated nutrient analyzer (Quaatro, Seal Analytical, Norderstedt, Germany) based on the manufacturer’s instructions at the National Institute of Fisheries Science (NIFS).

2.3. Chlorophyll-a Analysis

Seawater samples (0.5 L) for the total chlorophyll-a (Chl-a) concentration were filtered through 0.7 μm pore size glass fiber filters (GF/F; Whatman, Maidstone, UK, 25 mm). Samples (1 L) for size-fractionated Chl-a concentration were passed sequentially through 20 and 2 μm Nuclepore membrane filters (20 μm; GVS, Sanford, Sioux Falls, SD, USA, 47 mm; 2 μm; Whatman, Maidstone, UK, 47 mm) and 0.7 μm pore size Whatman GF/F filters (47 mm). Chl-a was extracted with 90% acetone for 24 h in the dark at 4 °C following [39], and the Chl-a concentrations were measured using a Trilogy fluorometer (Turner Designs, San Jose, CA, USA) after calibration.

2.4. Particulate Organic Carbon and Nitrogen Analysis

For the particulate organic carbon (POC), nitrogen (PON), and δ13C analyses of POM, 0.5 L of each seawater sample was filtered through Whatman GF/F filters (25 mm). The GF/F filters were kept frozen at −80 °C until mass spectrometric analysis in the stable isotope laboratory of the University of Alaska Fairbanks after HCl fuming overnight to remove carbonate.

2.5. Phytoplankton Community

Water samples (2–3 L) for photosynthetic pigment analysis were filtered through Whatman GF/F filters (47 mm). The GF/F filters were wrapped in aluminum foil to prevent photooxidation and stored at −80 °C until the extraction and analysis of pigments at the home laboratory in Pusan National University, Korea. The phytoplankton pigments were extracted in 100% acetone (5 mL) with canthaxanthin (100 μL) as an internal standard for 24 h in the dark at 4 °C and analyzed using a high-performance liquid chromatography (HPLC- Agilent Infinite 1260, Santa Clara, CA, USA) system. The contribution of each phytoplankton class to the total Chl-a concentration was estimated from the ratio of the different pigments to Chl-a based on the CHEMTAX program [40,41,42]. The ratio of initial pigment to the total Chl-a concentrations for the determination of the phytoplankton classes at the JBS was based on diverse phytoplankton groups obtained around the Ross Sea [43].

2.6. Macromolecular Compositions

Seawater samples (0.5 L) for macromolecular components (carbohydrates, proteins, and lipids) of total phytoplankton were filtered through Whatman GF/F filters (47 mm). The filters were immediately frozen and stored at −80 °C until analysis at the home laboratory. The content of total carbohydrates was determined by the phenol–sulfuric acid method from [44] with a glucose standard (1 mg mL−1, 108 Sigma, St. Louis, MO, USA), and the protein concentration of POM was analyzed according to [45] with a protein standard solution (2 mg mL−1, Sigma). For lipid extraction and assay, the methods described by [46] and [47] were used with the chloroform–methanol mixture (1:2 v/v). Tripalmitin solution was used as a standard for the protein concentration. The detailed method for the determination of macromolecular compositions was described by [48].
The sum of carbohydrate, protein, and lipid concentrations of POM was referred to as the food material (FM) [49]. The calorific value (Kcal g−1) and contents (Kcal m−3) for each macromolecule component were calculated using the equation from [50] with conversion factors of 0.041, 0.055, and 0.095 for carbohydrates, protein, and lipid, respectively.

2.7. TEP Analysis

TEPs sampling began on 17 December, which was later than the other samplings because Alcian Blue solution, which is prohibited for air shipping, was needed for the TEP sampling but was delayed by a research vessel, Araon. The missing TEP data would not have affected our results in this study since the sampling time before 17 December was biologically stagnant with a low Chl-a biomass. Seawater samples (0.3 L) for TEPs were filtered at a low constant vacuum onto 0.4 μm pore sized polycarbonate membrane filters (ADVANTEC; 25 mm, Toyo Roshi Kaisha, Tokyo, Japan) and stained with Alcian Blue solution. The concentrations of TEPs were estimated according to the method of [35], and their units were used as gum xanthan equivalents (µg Xeq. L−1). The filters for TEP concentration were extracted with 80% sulfuric acid for 3 h, and the absorbance of the TEPs was measured by a spectrophotometer at 787 nm using Xanthan gum as a standard. Estimations of TEP carbon (TEP-C) for converting from micrograms of gum xanthan equivalents to micrograms of carbon were obtained from the conversion factor of 0.51 µg Xeq. L−1 reported by [51].

2.8. Data Treatment and Statistical Analyses

All statistical analyses were performed using the statistical software SPSS 12.0 K for Windows. Pearson’s correlation analysis at an alpha value <0.01 was used to estimate the correlation between Chl-a, TEP concentrations and nutrients measured in the water samples. One-way ANOVA at an alpha value <0.05 was applied to identify differences in macromolecular concentrations, phytoplankton compositions of different sizes, and TEP-C contributions for each season. Principal component analysis (PCA) was performed using the prcomp function in the R stats package (R studio, version 1.1.463, Inc., Boston, MA, USA) to evaluate the relationship among the environmental factors (e.g., salinity, temperature, nitrite + nitrate, ammonium, and species of phytoplankton) and biochemical variables (e.g., POC, Chl-a, POM originating from phytoplankton, and TEP) and to identify relatively significant factors during the study period. Eigenvalues (>1.0) were considered to determine the number of principal components and the rotated eigenvectors were the results using the Varimax method with Kaiser normalization.

3. Results

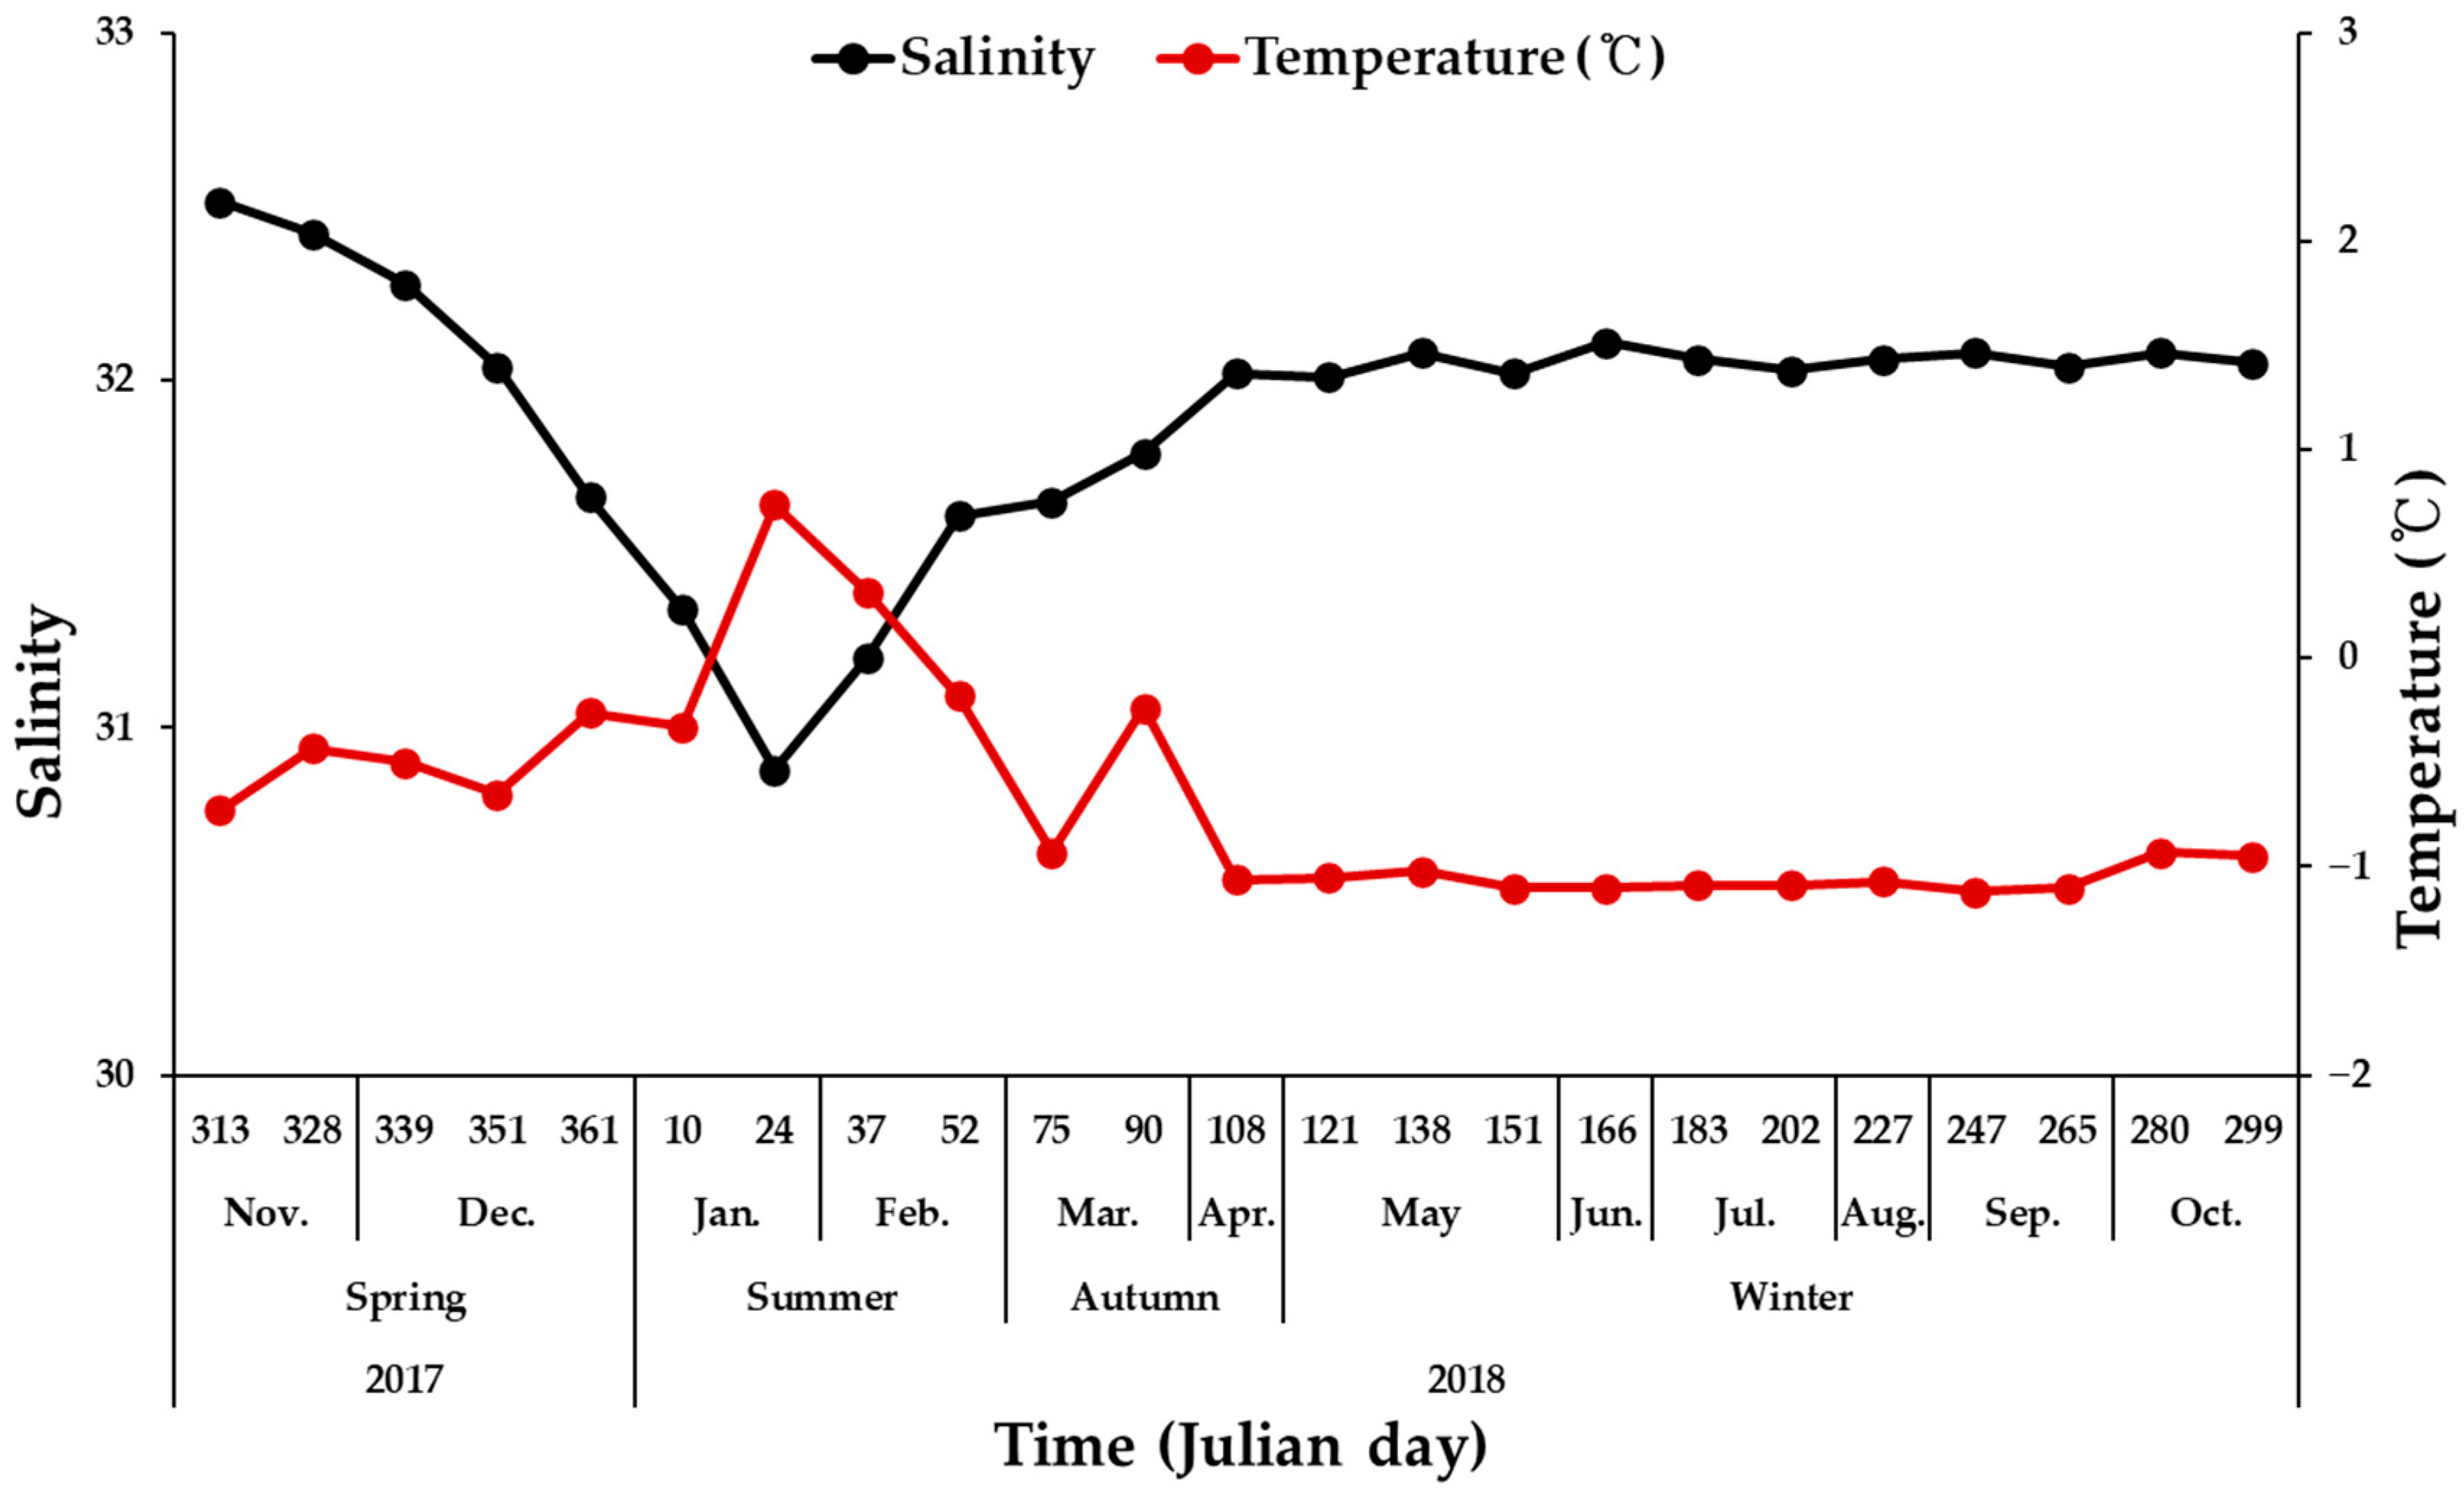
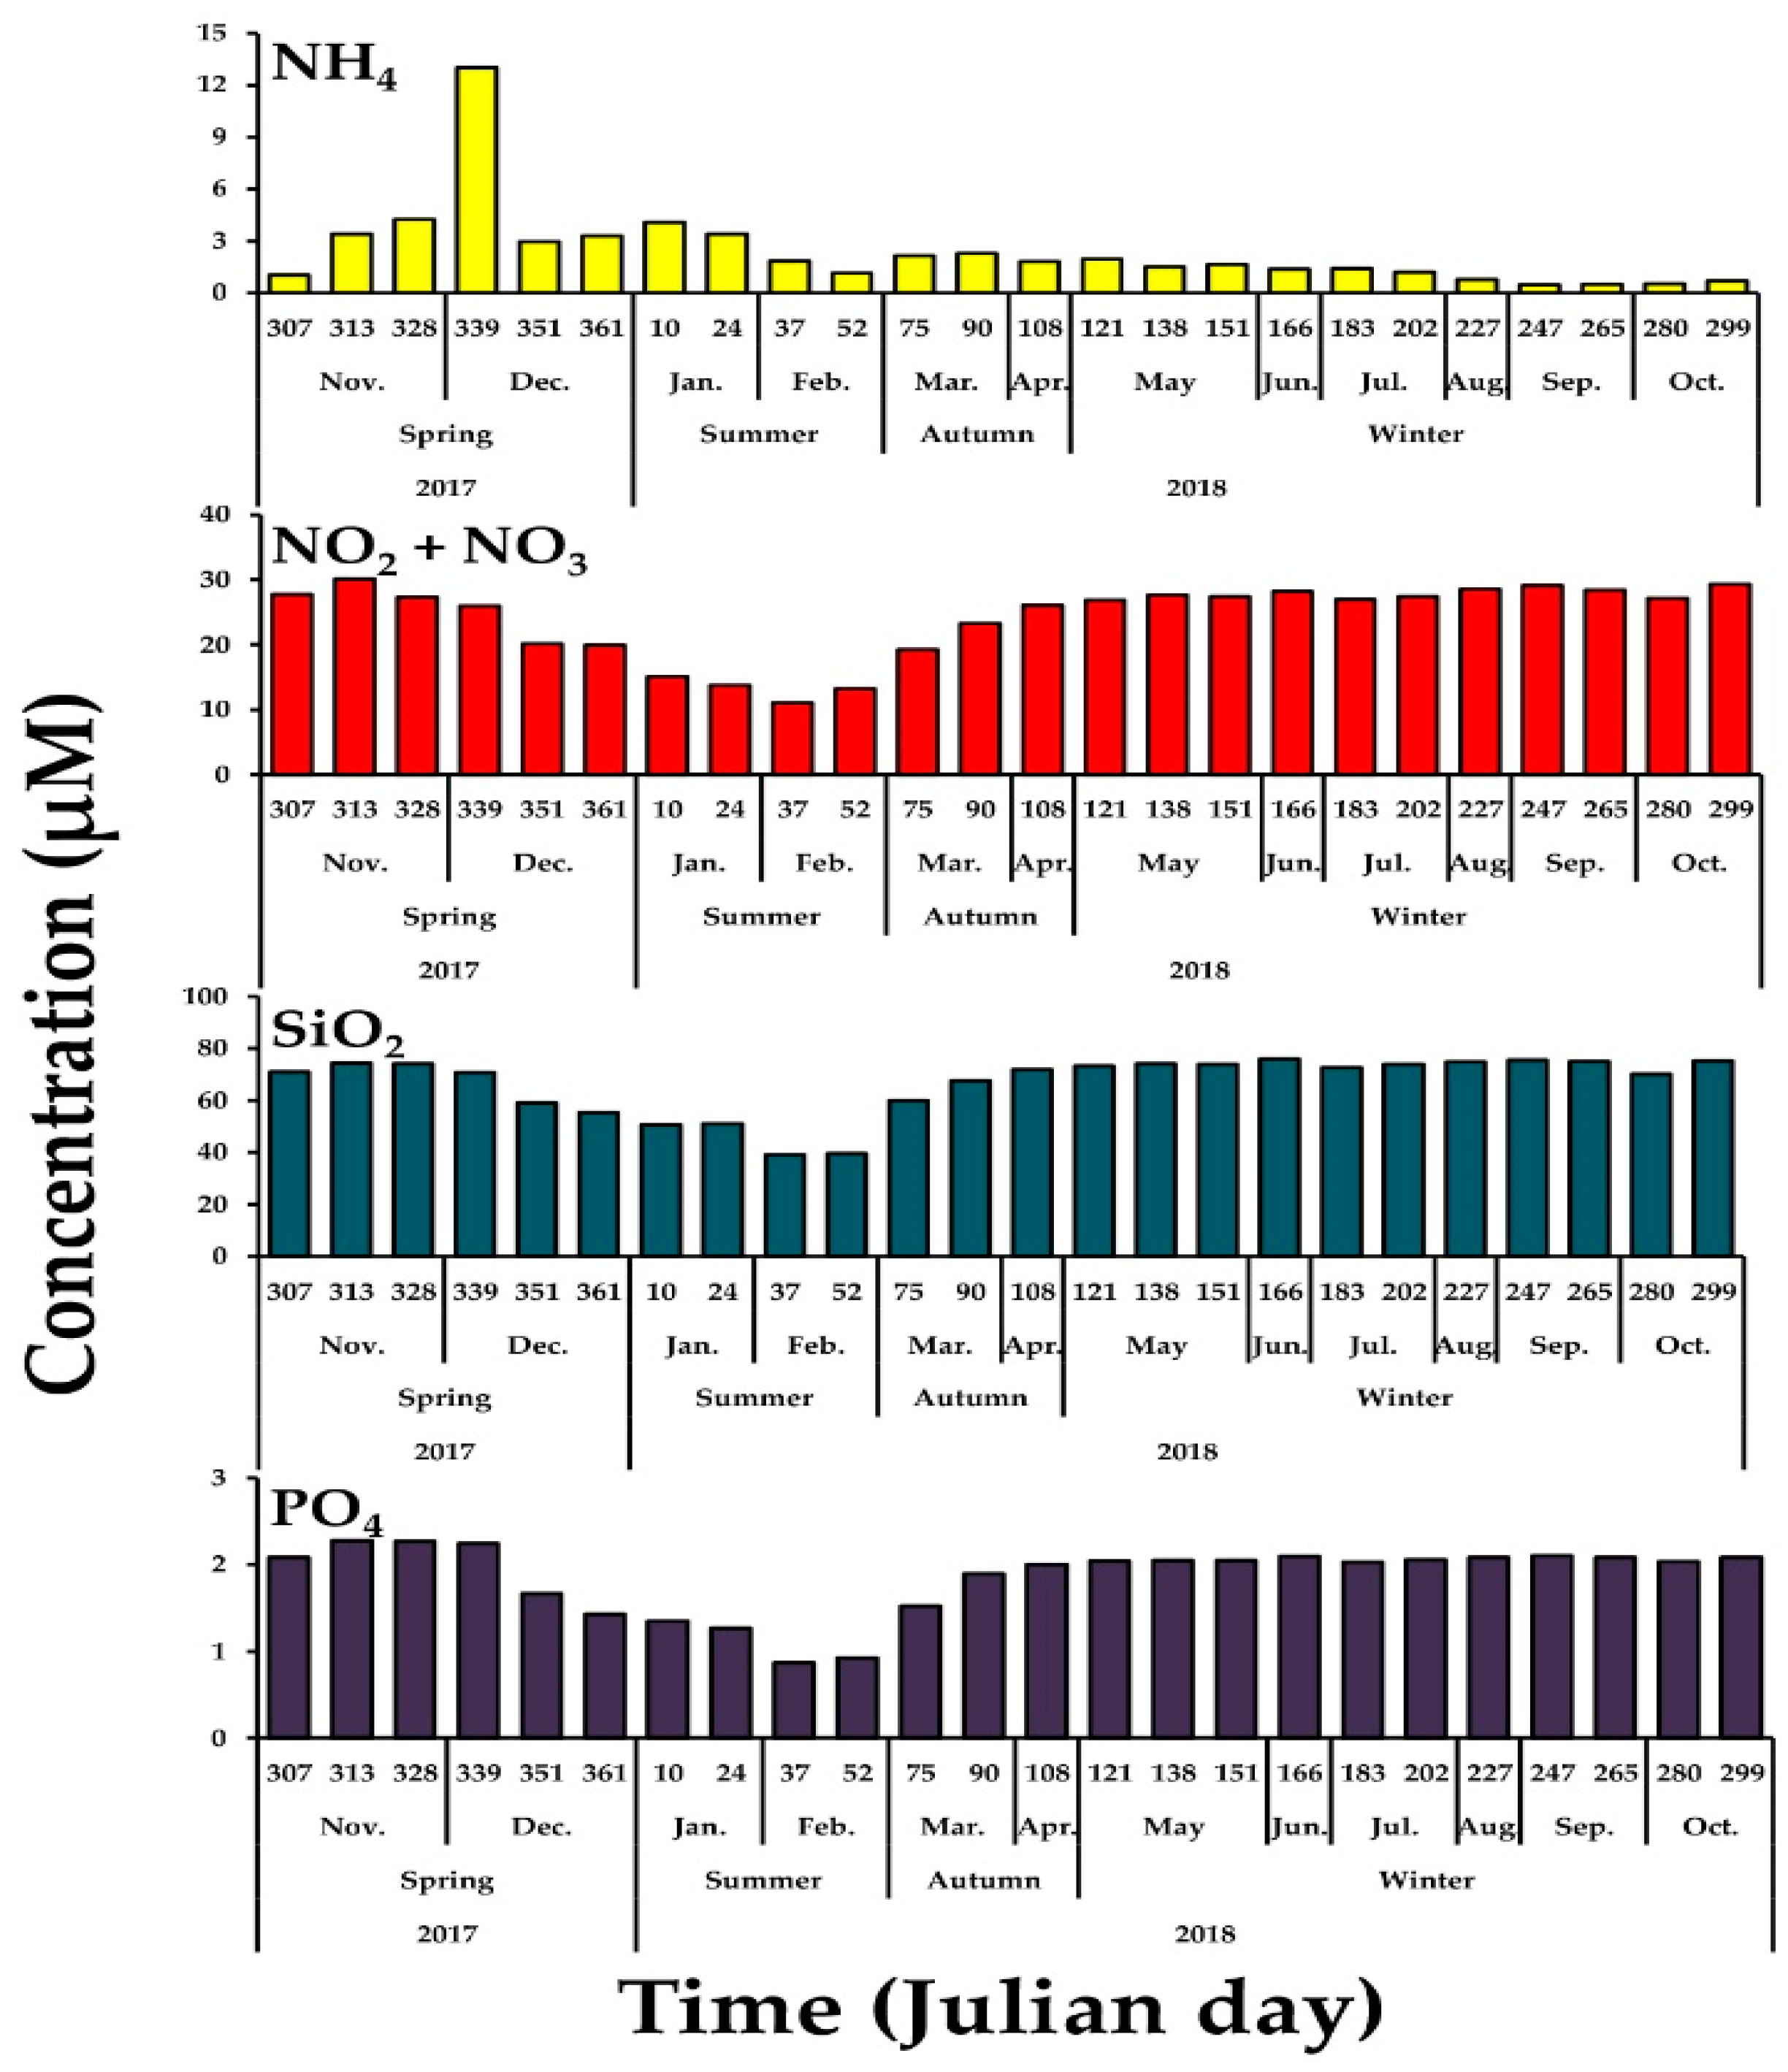
3.1. Physical and Chemical Conditions in the Study Area

The landfast sea ice in our study area completely melted on 13 February 2018 and formed again on 24 February 2018. During the overall study period, surface water temperature and salinity ranged from 0.74 to −1.12 °C (mean ± S.D. = −0.69 ± 0.51 °C) and 30.88 to 32.51 (31.91 ± 0.38), respectively. Temperature increased and salinity decreased toward summer, largely caused by melting sea ice. Little seasonal variation in temperature (−1.06 ± 0.06 °C) and salinity (32.06 ± 0.03) was detected from May to October (Figure 2).
Seasonal variations in major inorganic nutrient concentrations are shown in Figure 3. The concentrations of nitrate + nitrite, silicate, and phosphate were lowest in summer (11.0, 39.2, and 0.9 µM for nitrate + nitrite, silicate, and phosphate, respectively), whereas the ammonium concentration was lowest in winter 2018 (0.5 µM). In our study, all major inorganic nutrients had strong relationships with each other except for ammonium (r = 0.97, phosphate vs. nitrate + nitrite; r = 0.98, phosphate vs. silicate; r = 0.98, and nitrate + nitrite vs. silicate, p < 0.01, n = 24).

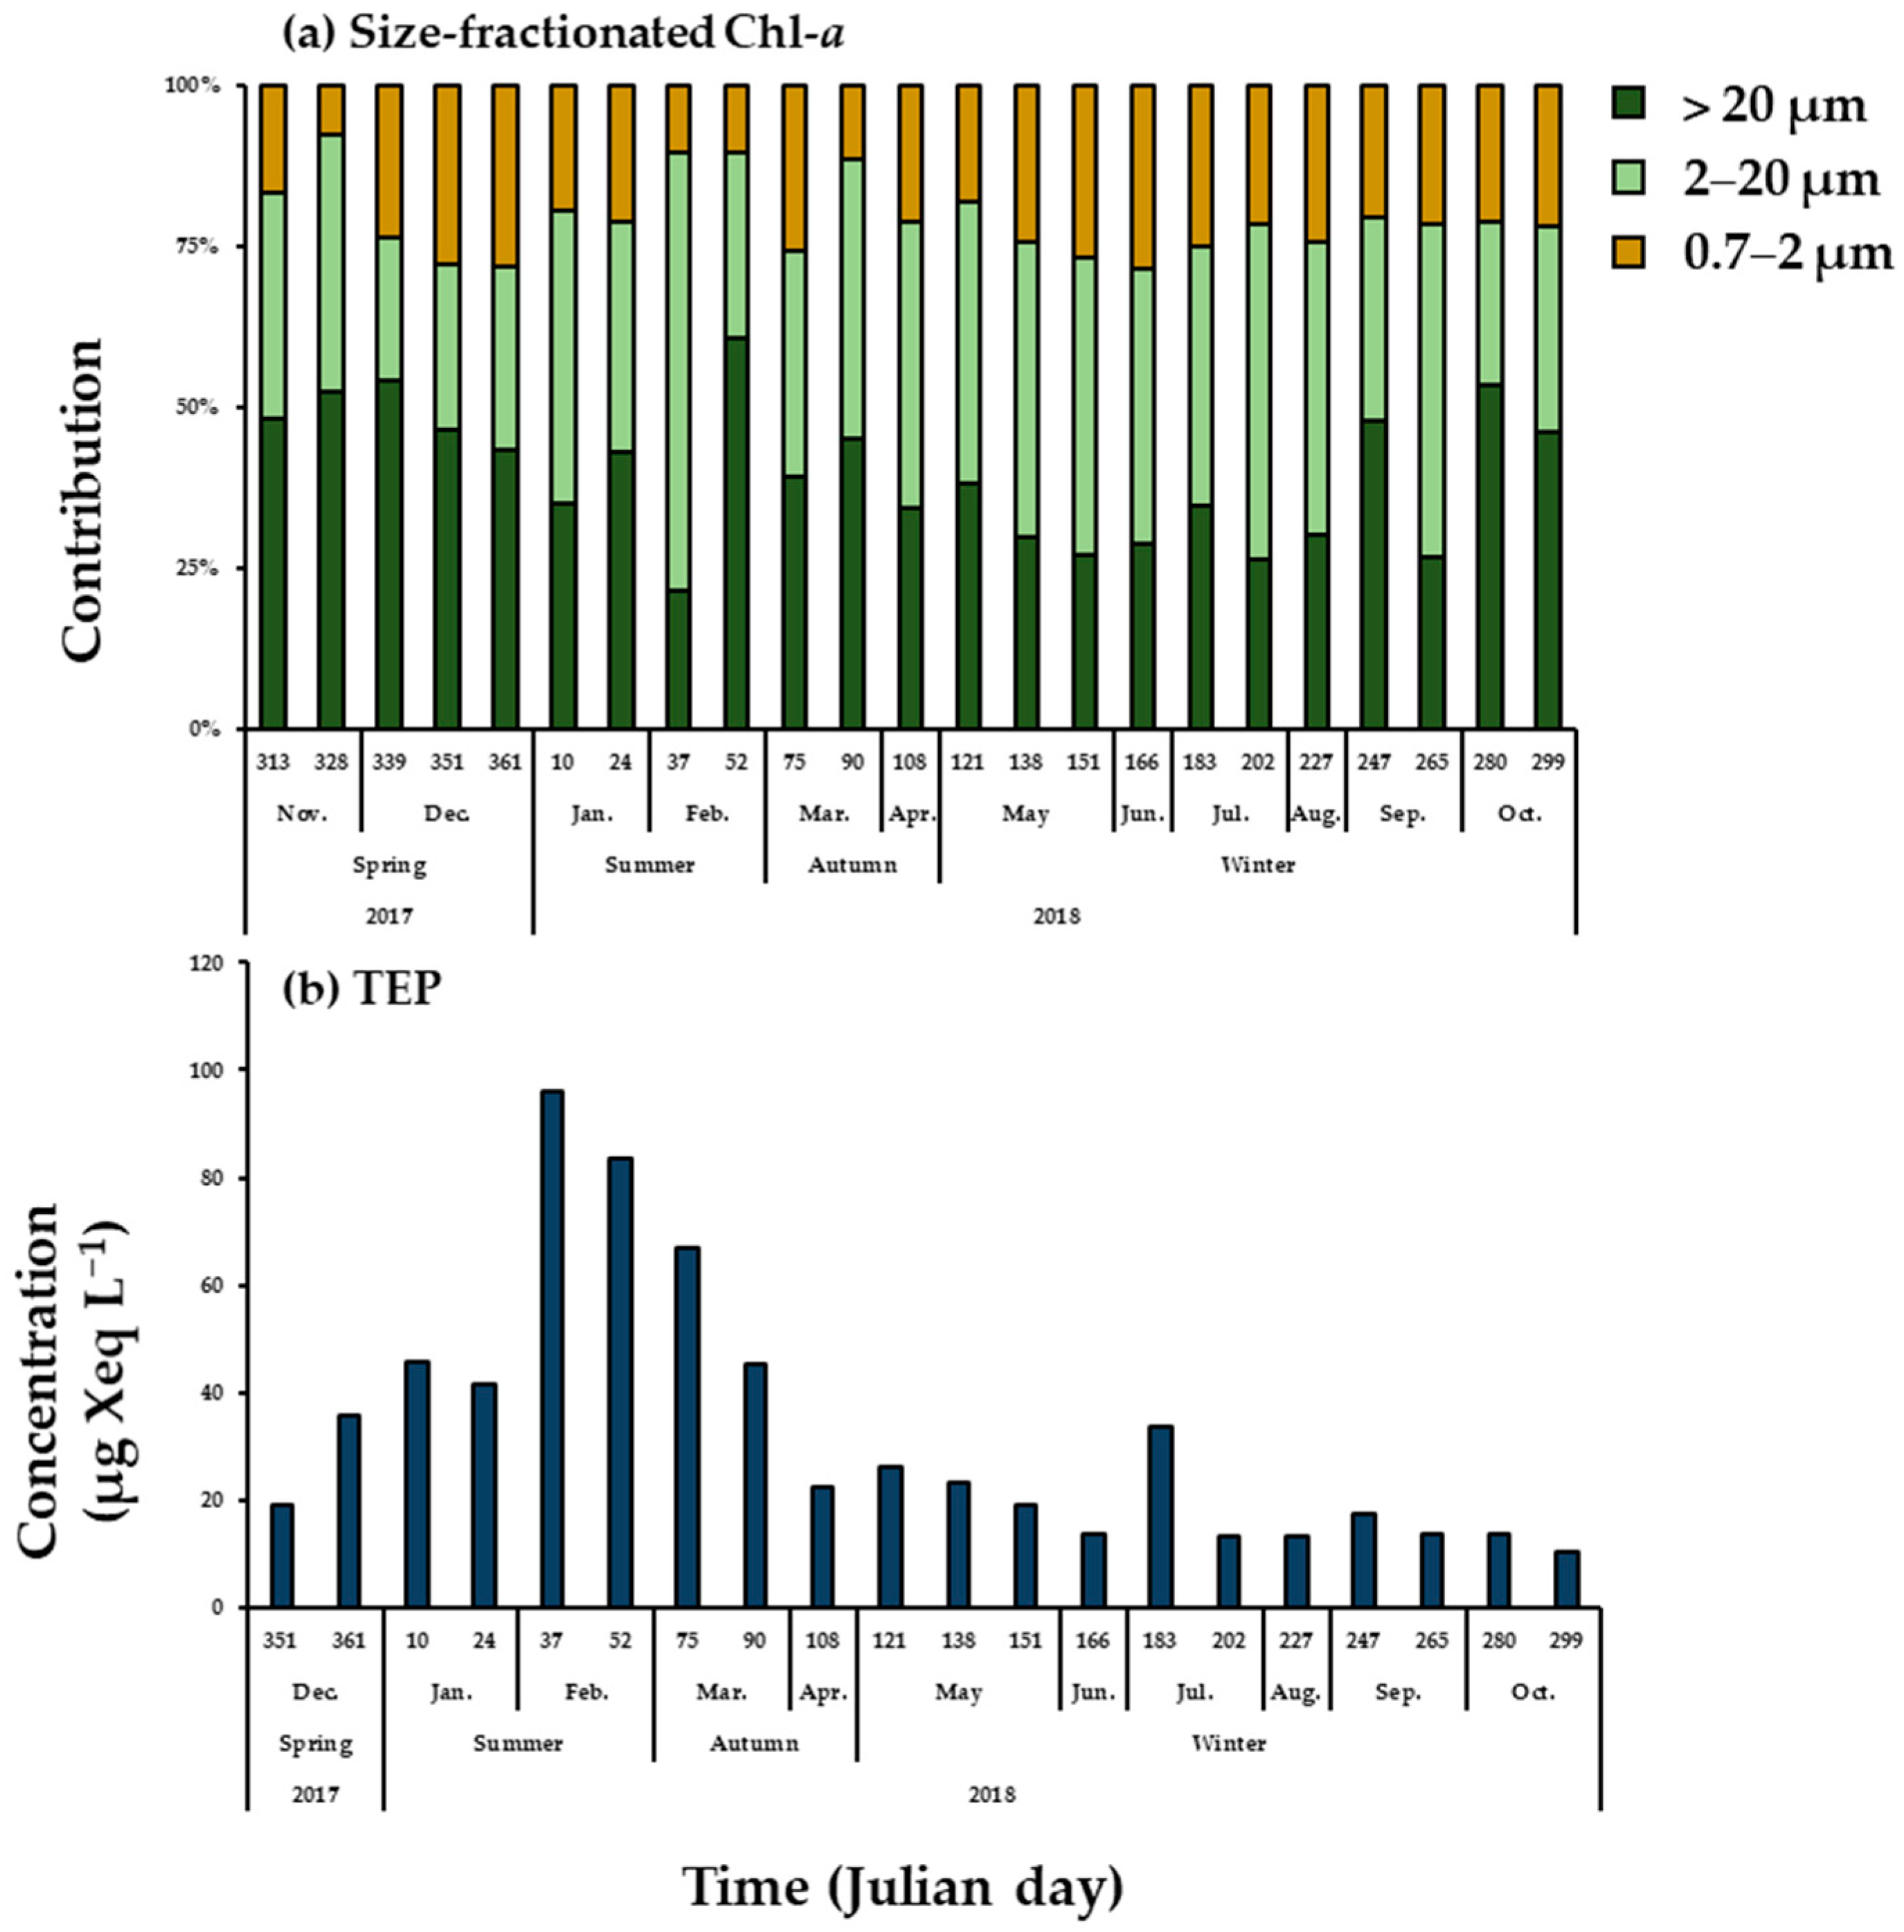
3.2. Chl-a Concentrations

The total Chl-a concentrations ranged from 0.01 to 2.15 μg L−1 (0.21 ± 0.50 μg L−1) at the JBS during our study period from November 2017 to October 2018. The total Chl-a concentrations increased from early December 2017 and were highest (2.15 μg L−1) in February 2018 (Figure 4). The concentration decreased rapidly as sea ice started to form between February and March, 2018. The average total Chl-a concentrations were 0.08 ± 0.06, 0.97 ± 0.95, 0.12 ± 0.10, and 0.01 ± 0.01 μg L−1 during spring, summer, autumn, and winter, respectively. The seasonal variations in the contributions of different size-fractionated Chl-a levels to the total Chl-a concentration are shown in Figure 5. The average contribution of micro-sized phytoplankton (>20 μm) to the total Chl-a in November 2017 to October 2018 was 39.7% ± 10.7%, and those of nano-sized (2–20 μm) and pico-sized (<2 μm) phytoplankton were 39.5% ± 10.5% and 20.8% ± 5.9%, respectively. Based on statistical analysis (one-way ANOVA test, p > 0.05), there were no significant differences in the average contributions of each size-fractionated Chl-a class over different seasons.

3.3. POC and PON

The POC and PON concentrations were 49.3–239.5 μg L−1 (92.5 ± 46.6 μg L−1) and 7.0–42.7 μg L−1 (14.0 ± 10.4 μg L−1), respectively. A strong linear relationship was found between POC and PON concentrations (PON = POC × 0.2192, r2 = 0.98, p < 0.01). Unlike the Chl-a concentration, the POC concentration did not largely decrease after bloom (45.6% and 89.5% for POC and Chl-a, respectively) and was persistent throughout the winter period (Figure 4). The average C/N ratios of POM were 7.1 (±1.0), 5.9 (±0.4), 8.3 (±0.7), and 10.6 (±0.9) during spring, summer, autumn, and winter, respectively.

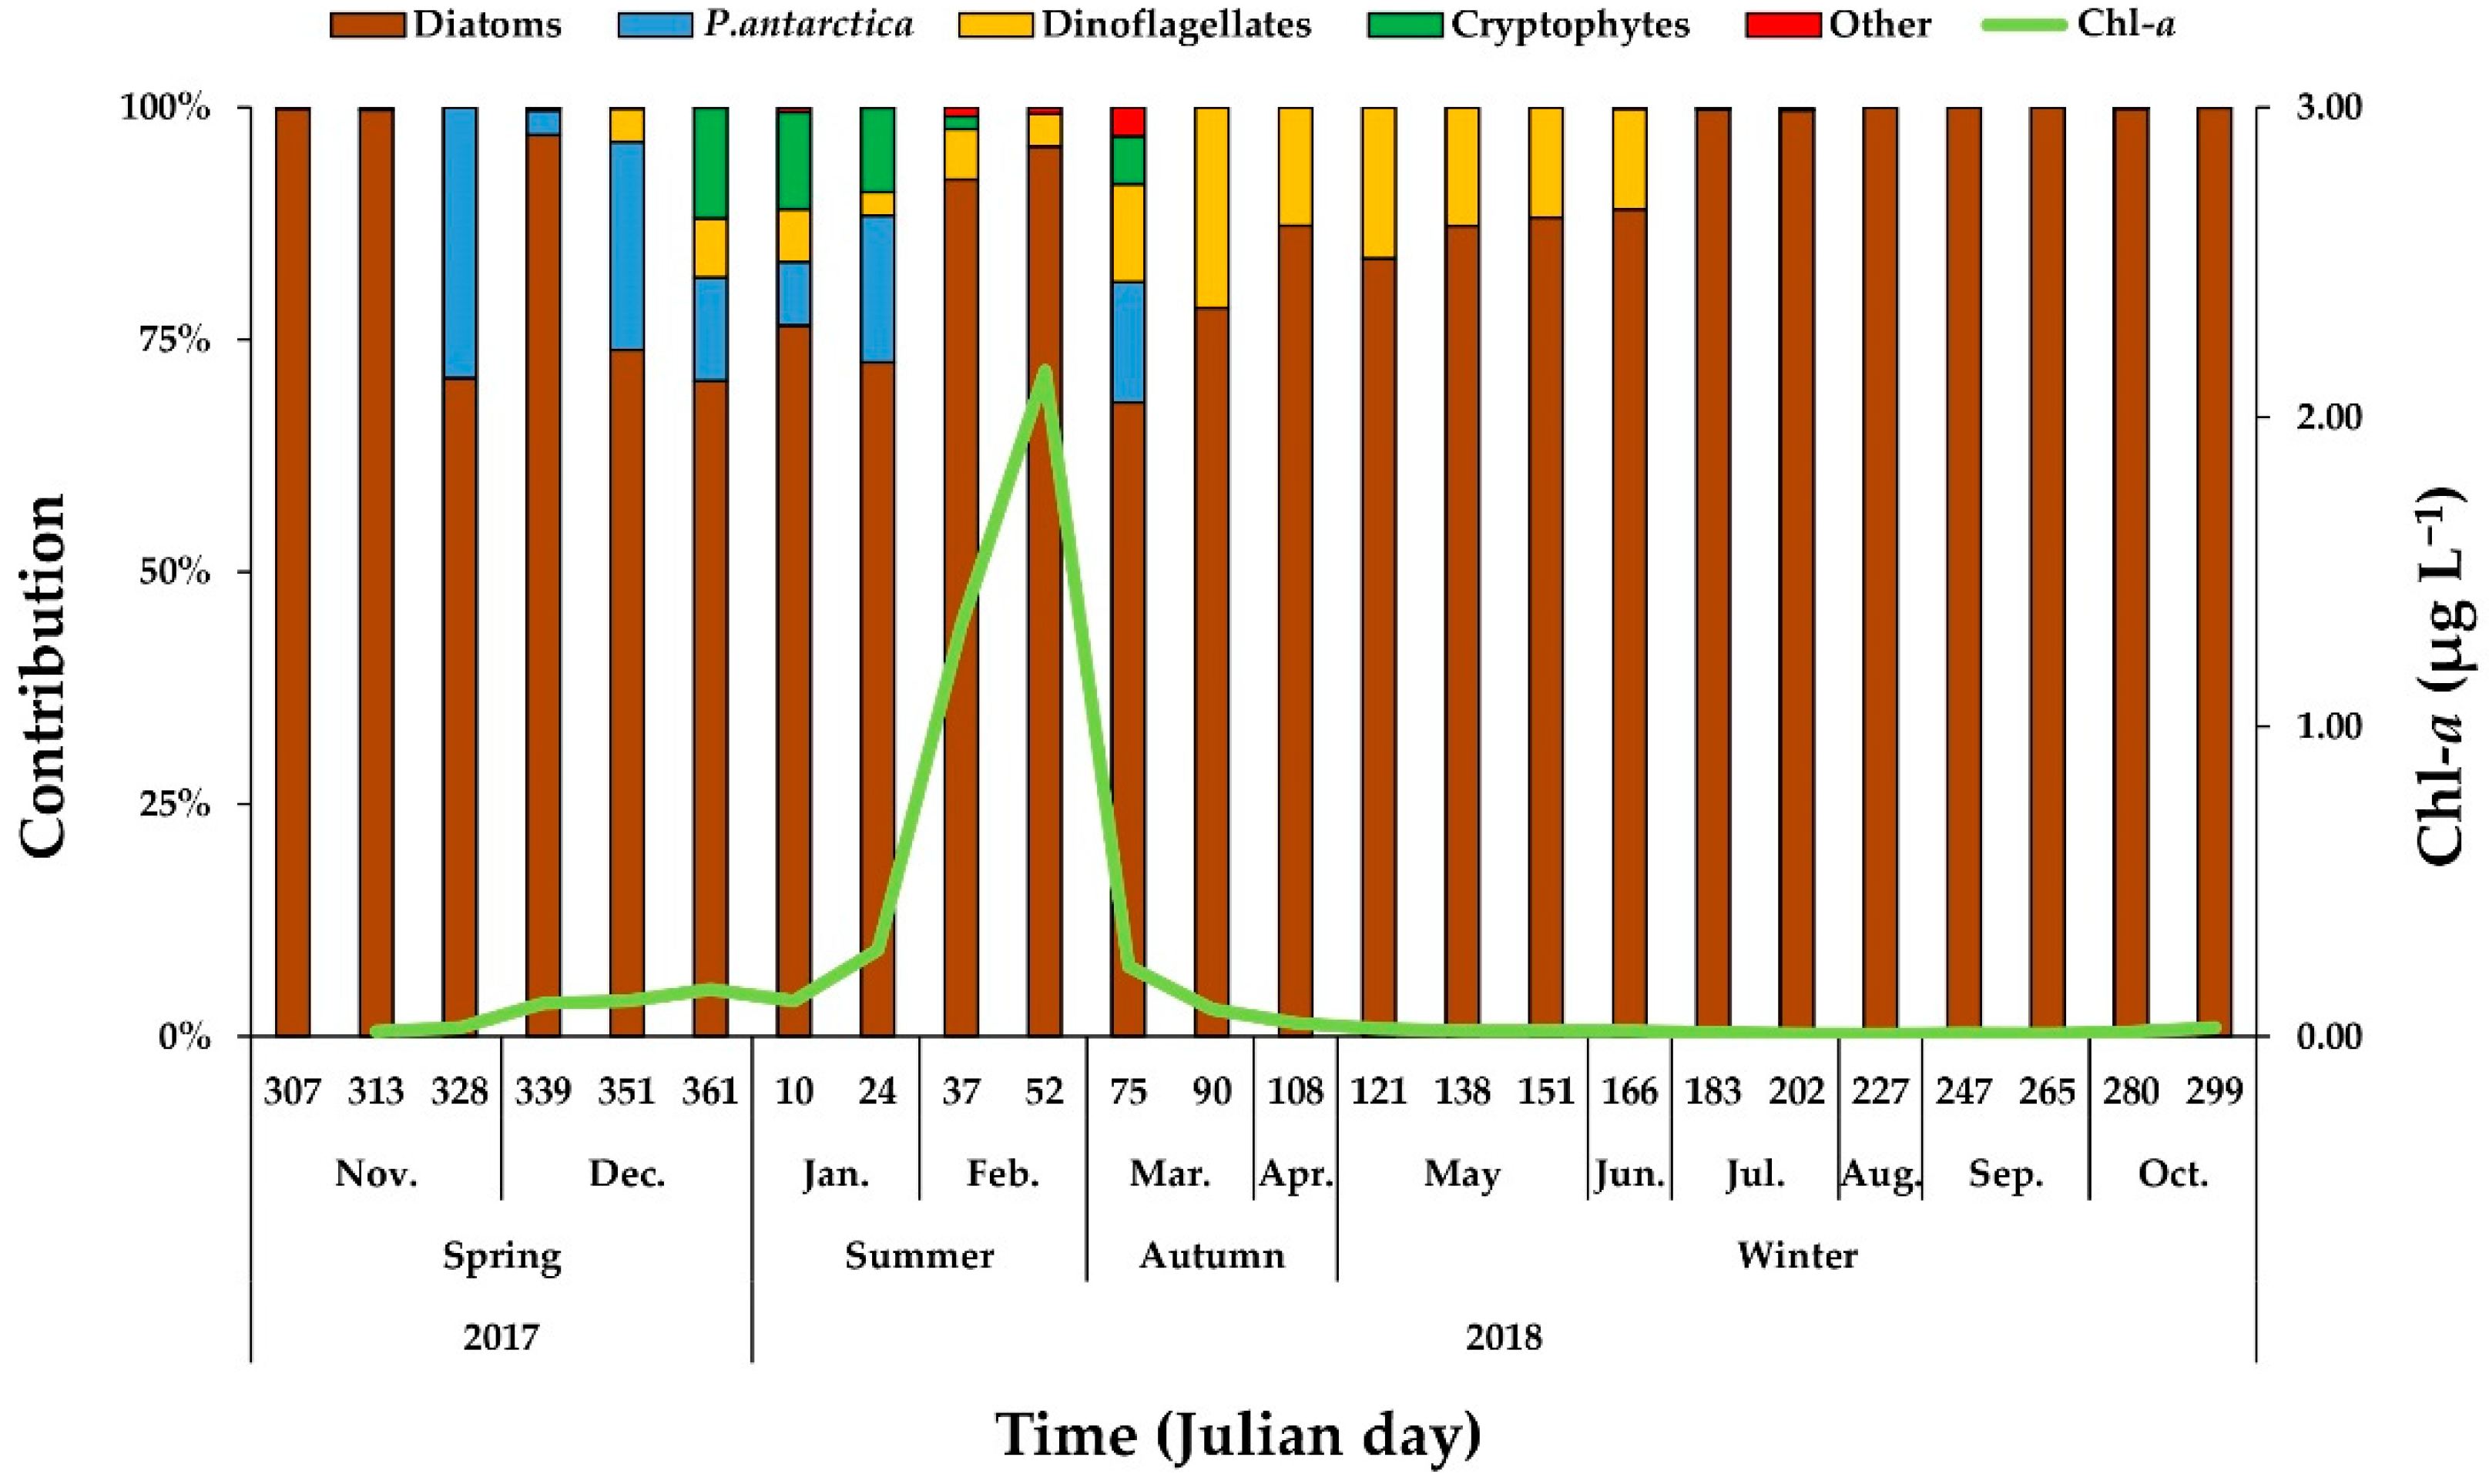
3.4. Phytoplankton Community Composition

A seasonal variation in the phytoplankton community is shown in Figure 6. Seasonally, diatoms accounted for 95.2% ± 6.6% of the phytoplankton community during winter from early July to late October in 2018, whereas dinoflagellates were mostly the second dominant group in autumn (14.9% ± 5.9%). Phaeocystis antarctica was dominant during spring (10.9% ± 12.4%), and cryptophytes were observed to be relatively high in summer (5.2% ± 5.3%). Other phytoplankton communities were rarely observed in this study.

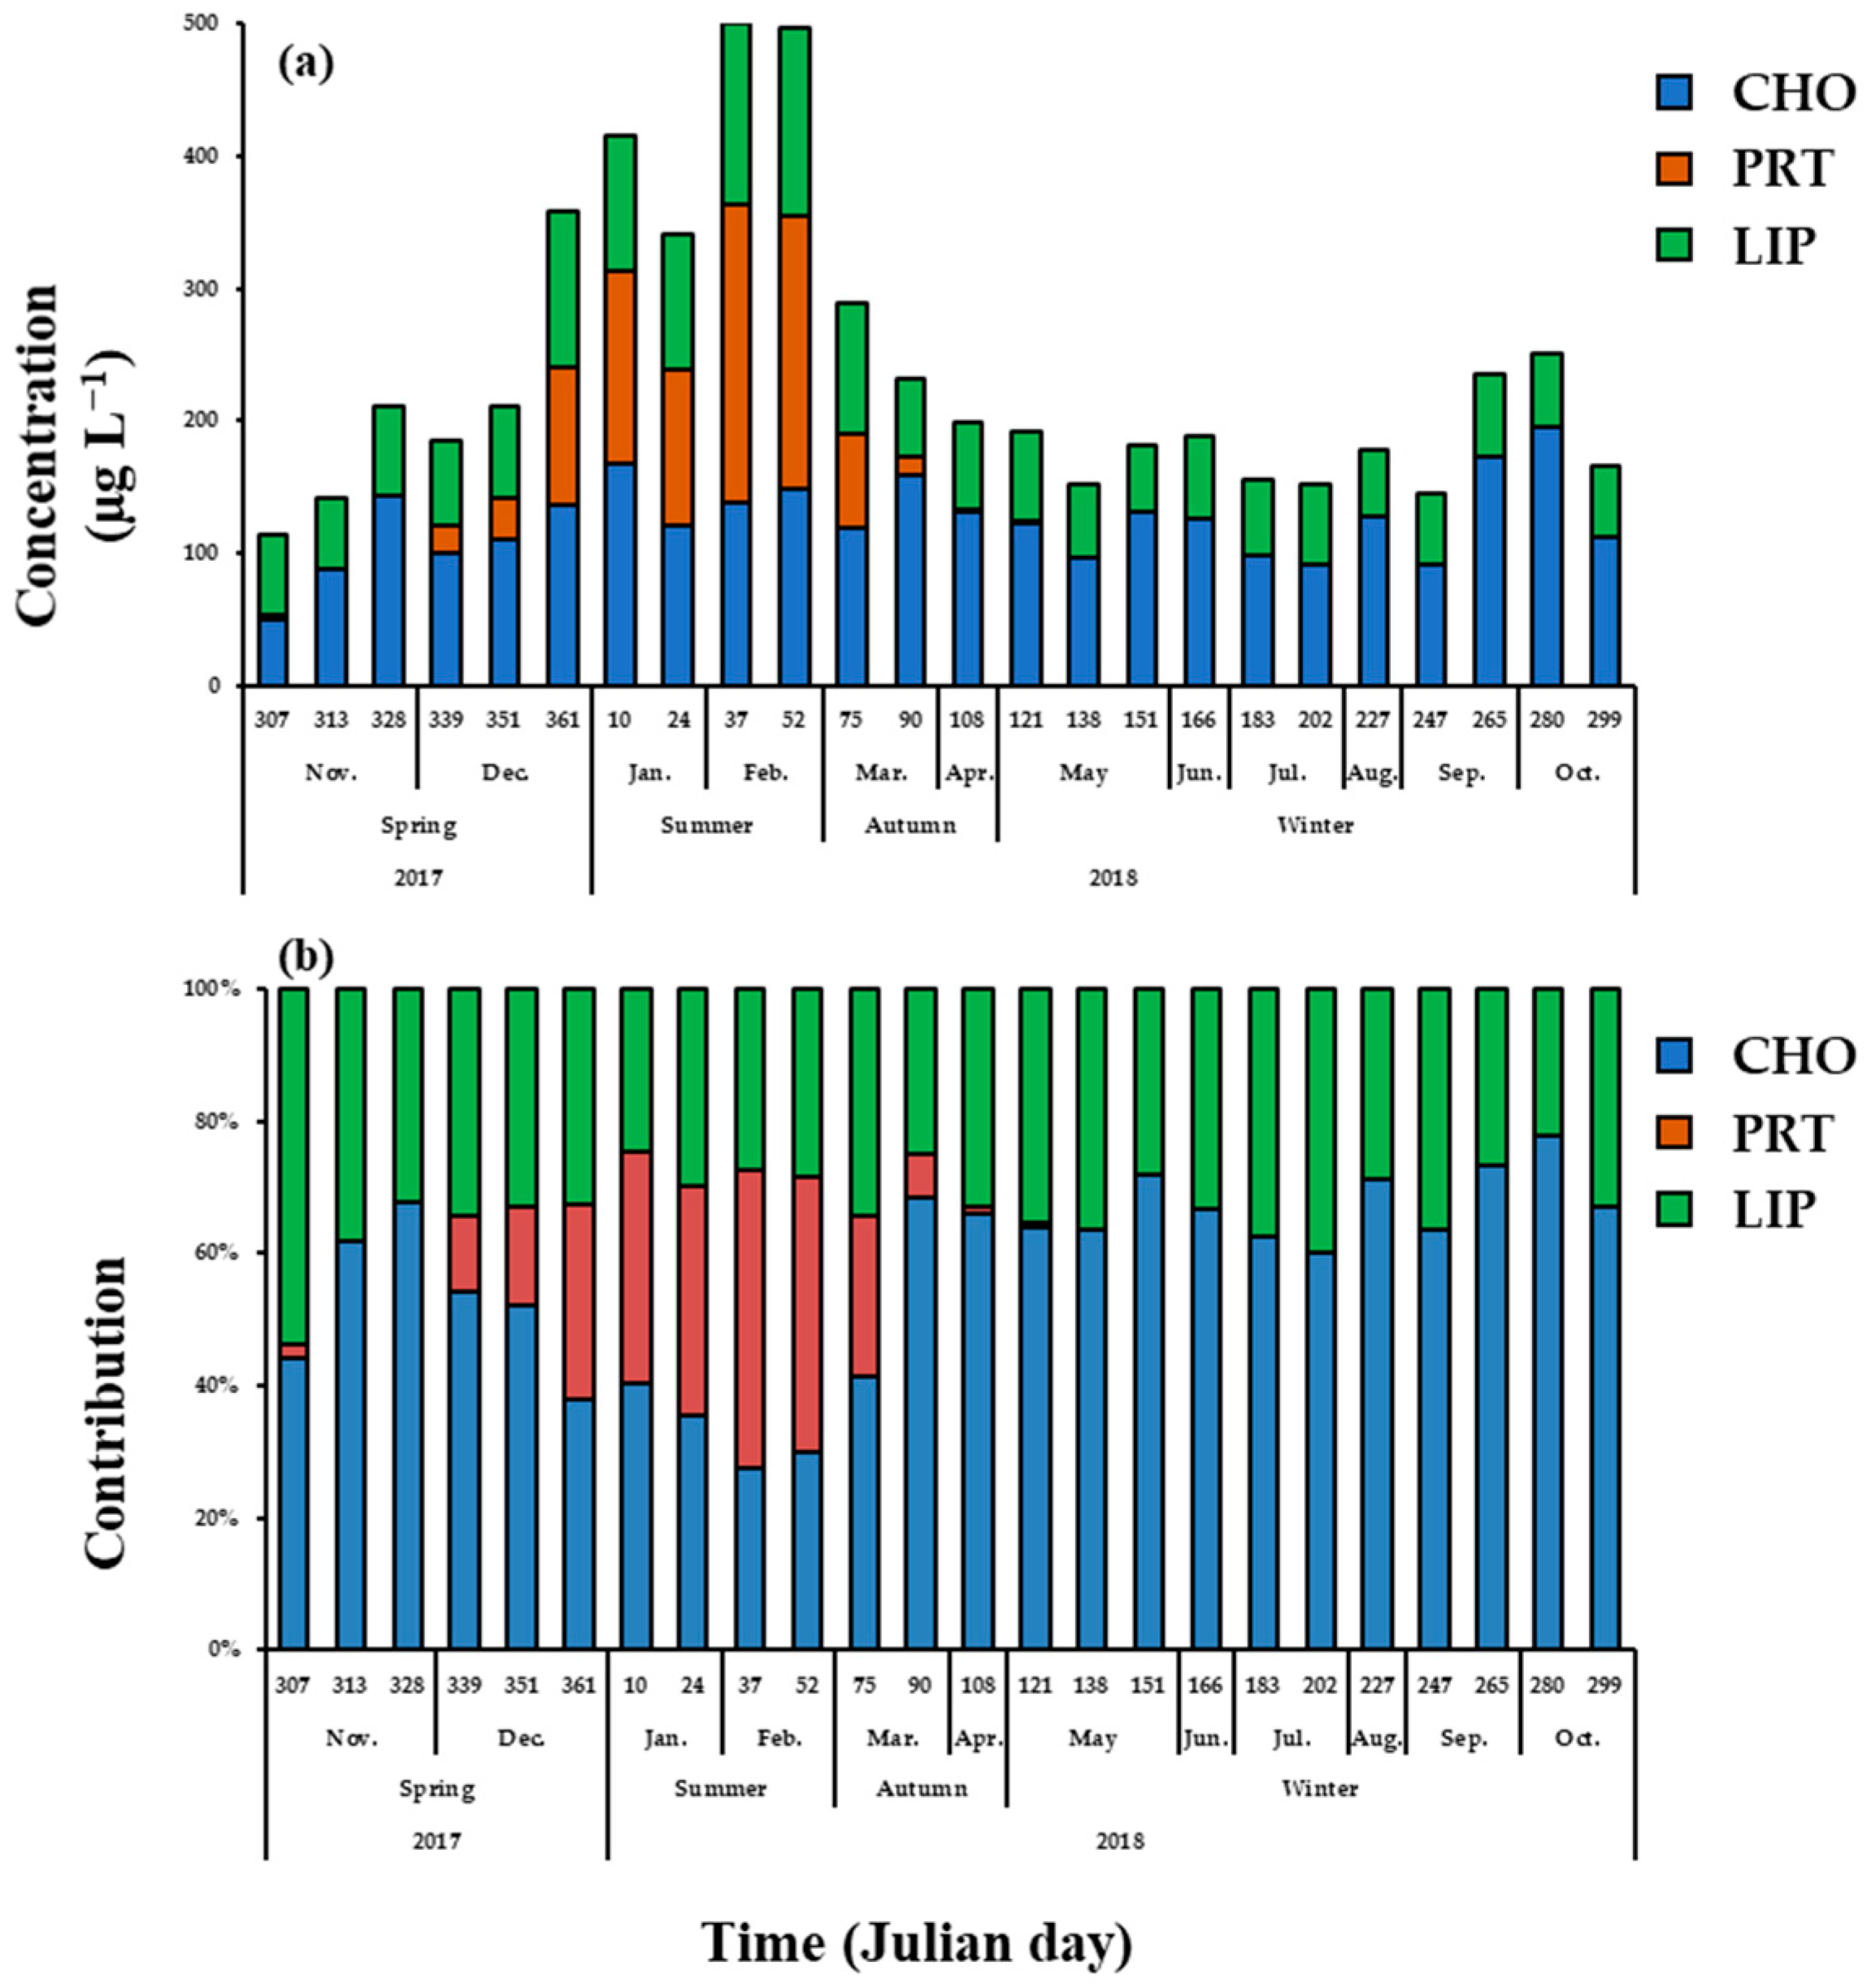
3.5. Macromolecular Composition of Phytoplankton

Strong seasonal variations in the concentrations of proteins and lipids (one-way ANOVA test, p < 0.05) were found, whereas no significant difference in carbohydrate concentrations was observed during the season (one-way ANOVA test, p > 0.05) in this study (Figure 7a). During the observation period, the overall carbohydrate, protein, and lipid concentrations of POM were 50.3–167.5 μg L−1 (123.7 ± 31.7 μg L−1), 0–226.1 μg L−1 (39.3 ± 68.9 μg L−1), and 51.1–141.9 μg L−1 (73.8 ± 27.1 μg L−1), respectively (Figure 7a). The average contributions of carbohydrates, proteins, and lipids to the total POM during spring were 53.0% ± 11.0%, 9.6% ± 11.5%, and 37.3% ± 8.4%, respectively (Figure 7b). The average contributions of each component in summer were 33.3% ± 5.8%, 39.1% ± 5.2%, and 27.6% ± 2.2%, respectively. In autumn and winter, the carbohydrate, protein, and lipid compositions were 58.7% ± 15.0%, 10.5% ± 12.2%, and 30.8% ± 5.1% and 67.4% ± 5.5%, 0.1% ± 0.3%, and 32.5% ± 5.4%, respectively. The contribution of proteins was observed to be high in summer but decreased sharply after autumn. Based on the sum of each macromolecular composition, the highest averaged FM concentration was observed in summer (437.8 ± 76.0 μg L−1), followed by autumn (239.6 ± 45.4 μg L−1), spring (203.3 ± 84.8 μg L−1), and winter (181.2 ± 34.5 μg L−1) (Figure 7a). In comparison, the averaged caloric contents of FM had the highest value in summer (2.7 ± 0.5 Kcal m−3) followed by autumn (1.4 ± 0.4 Kcal m−3), spring (1.3 ± 0.5 Kcal m−3), and winter (1.1 ± 0.2 Kcal m−3) (Figure 8). Proteins were rarely detected whereas lipids and carbohydrates remained relatively constant during winter.

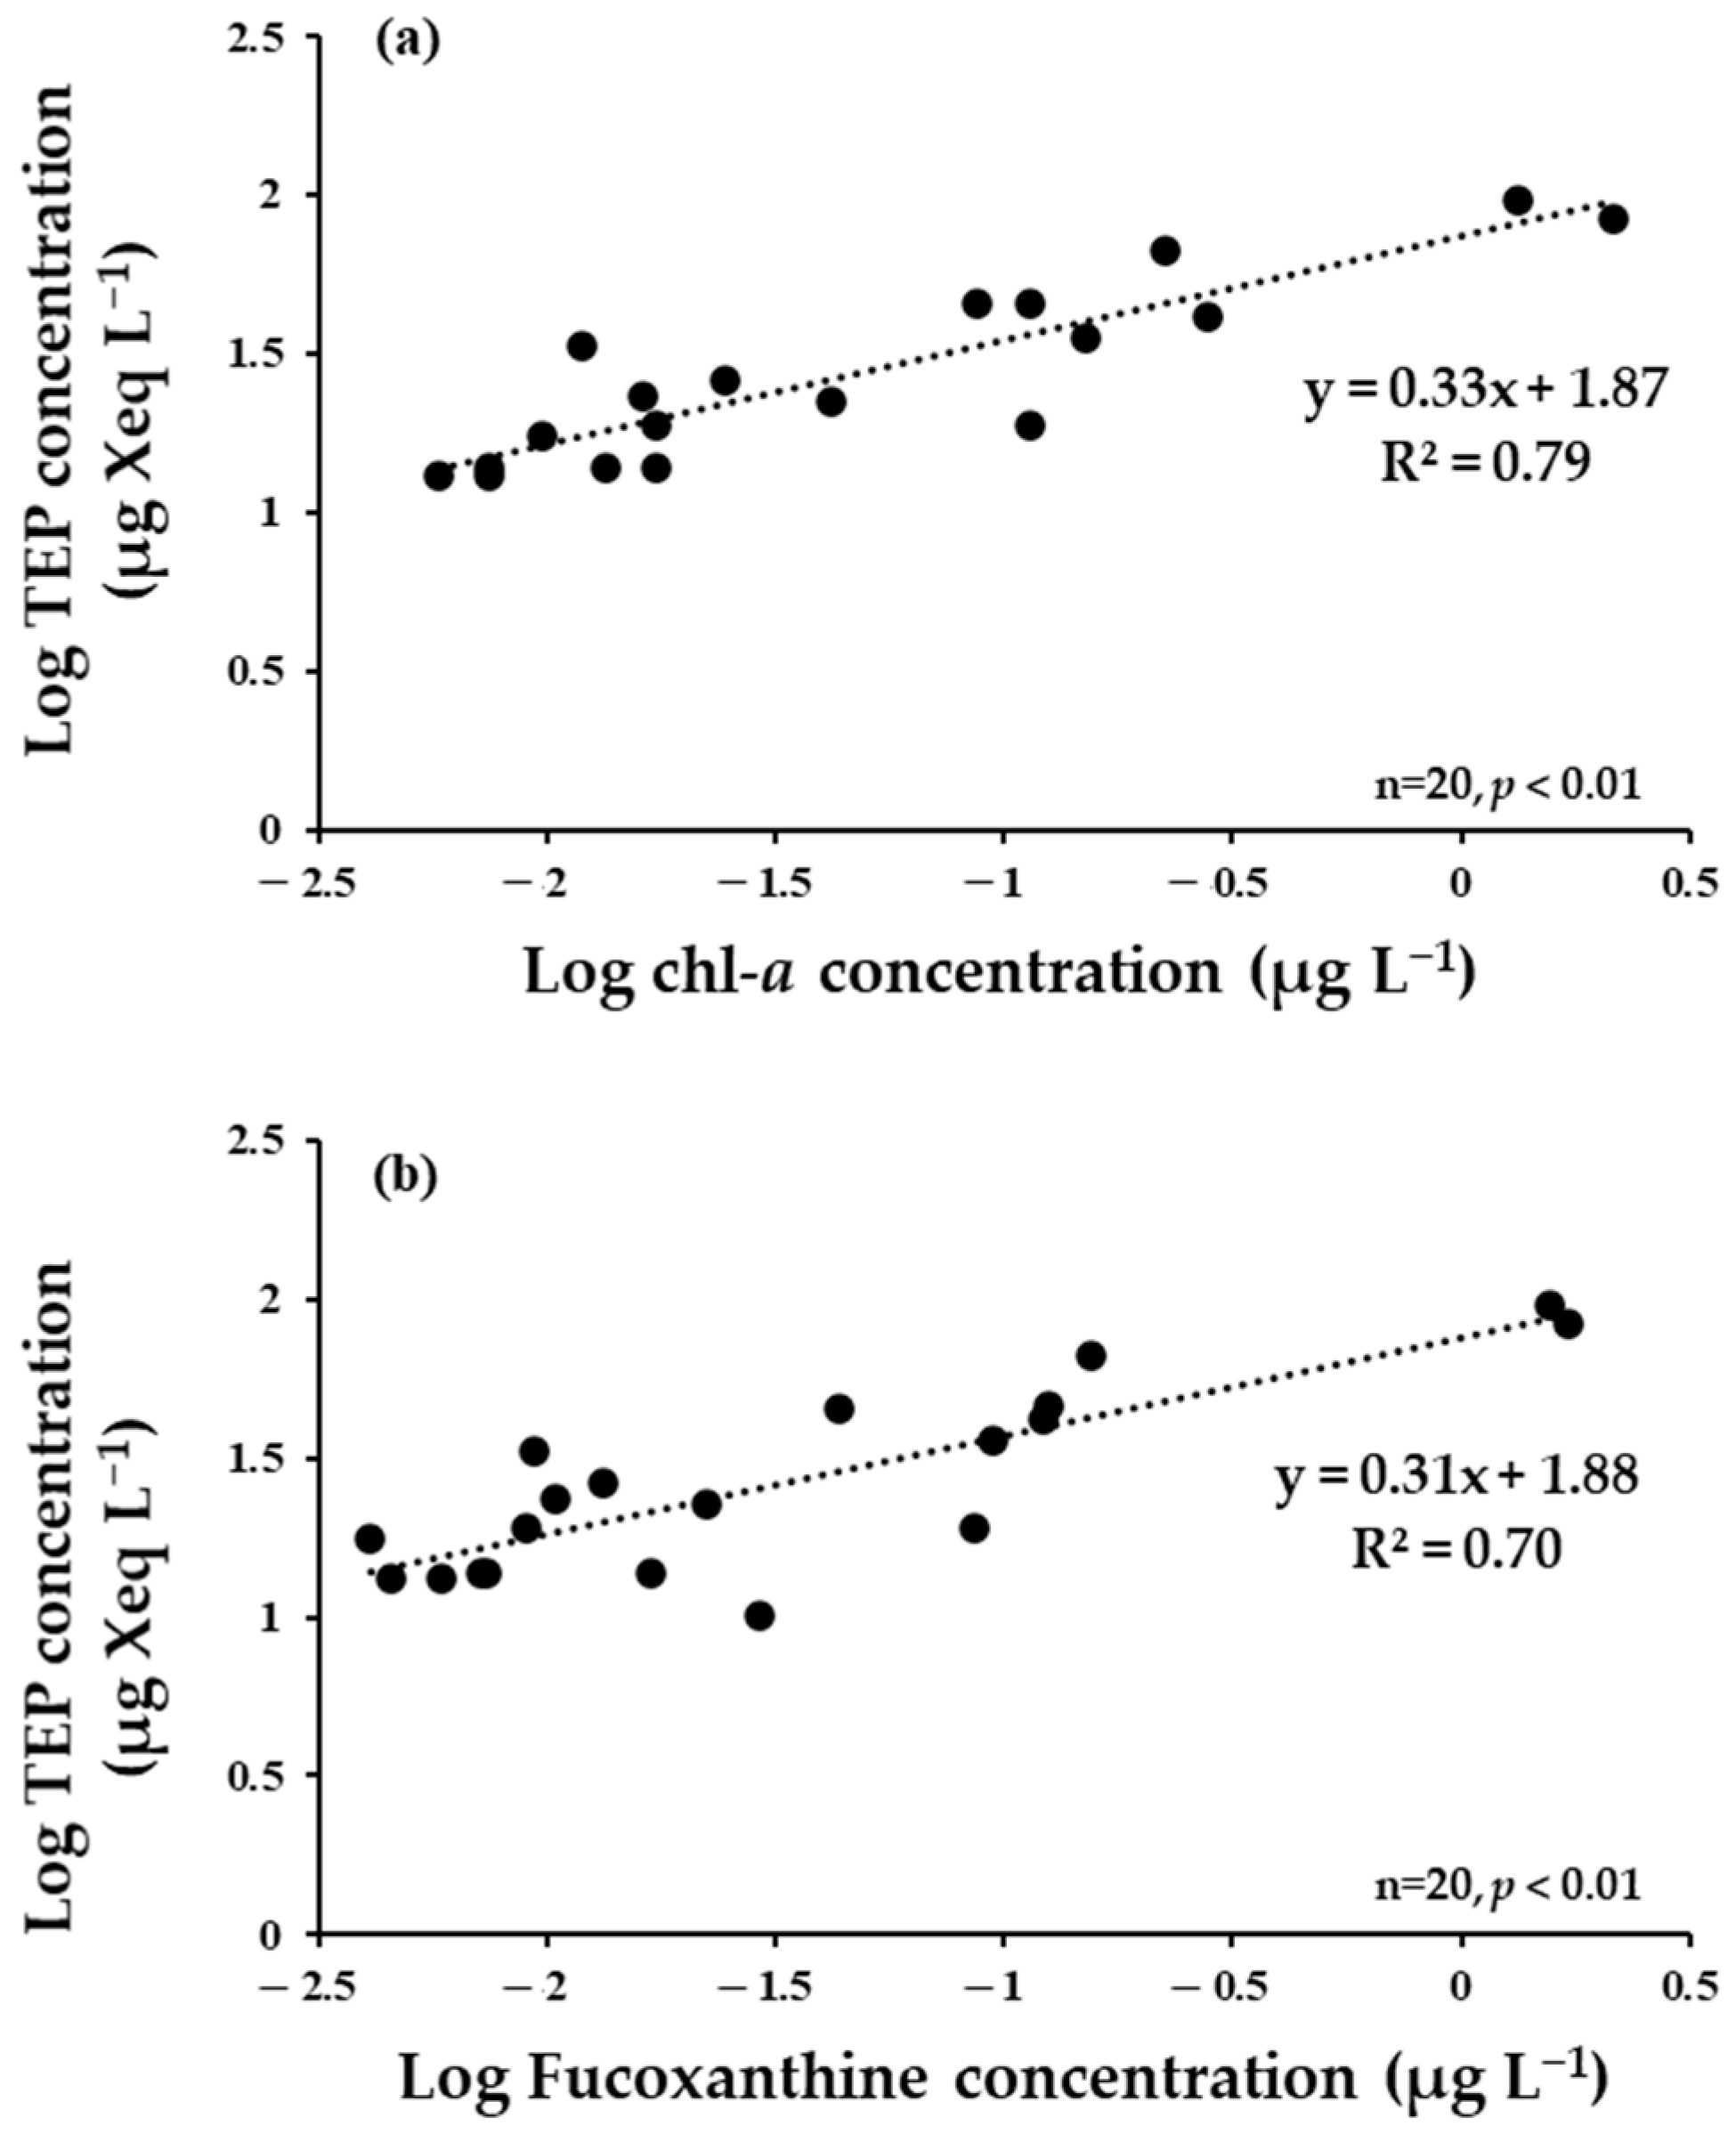
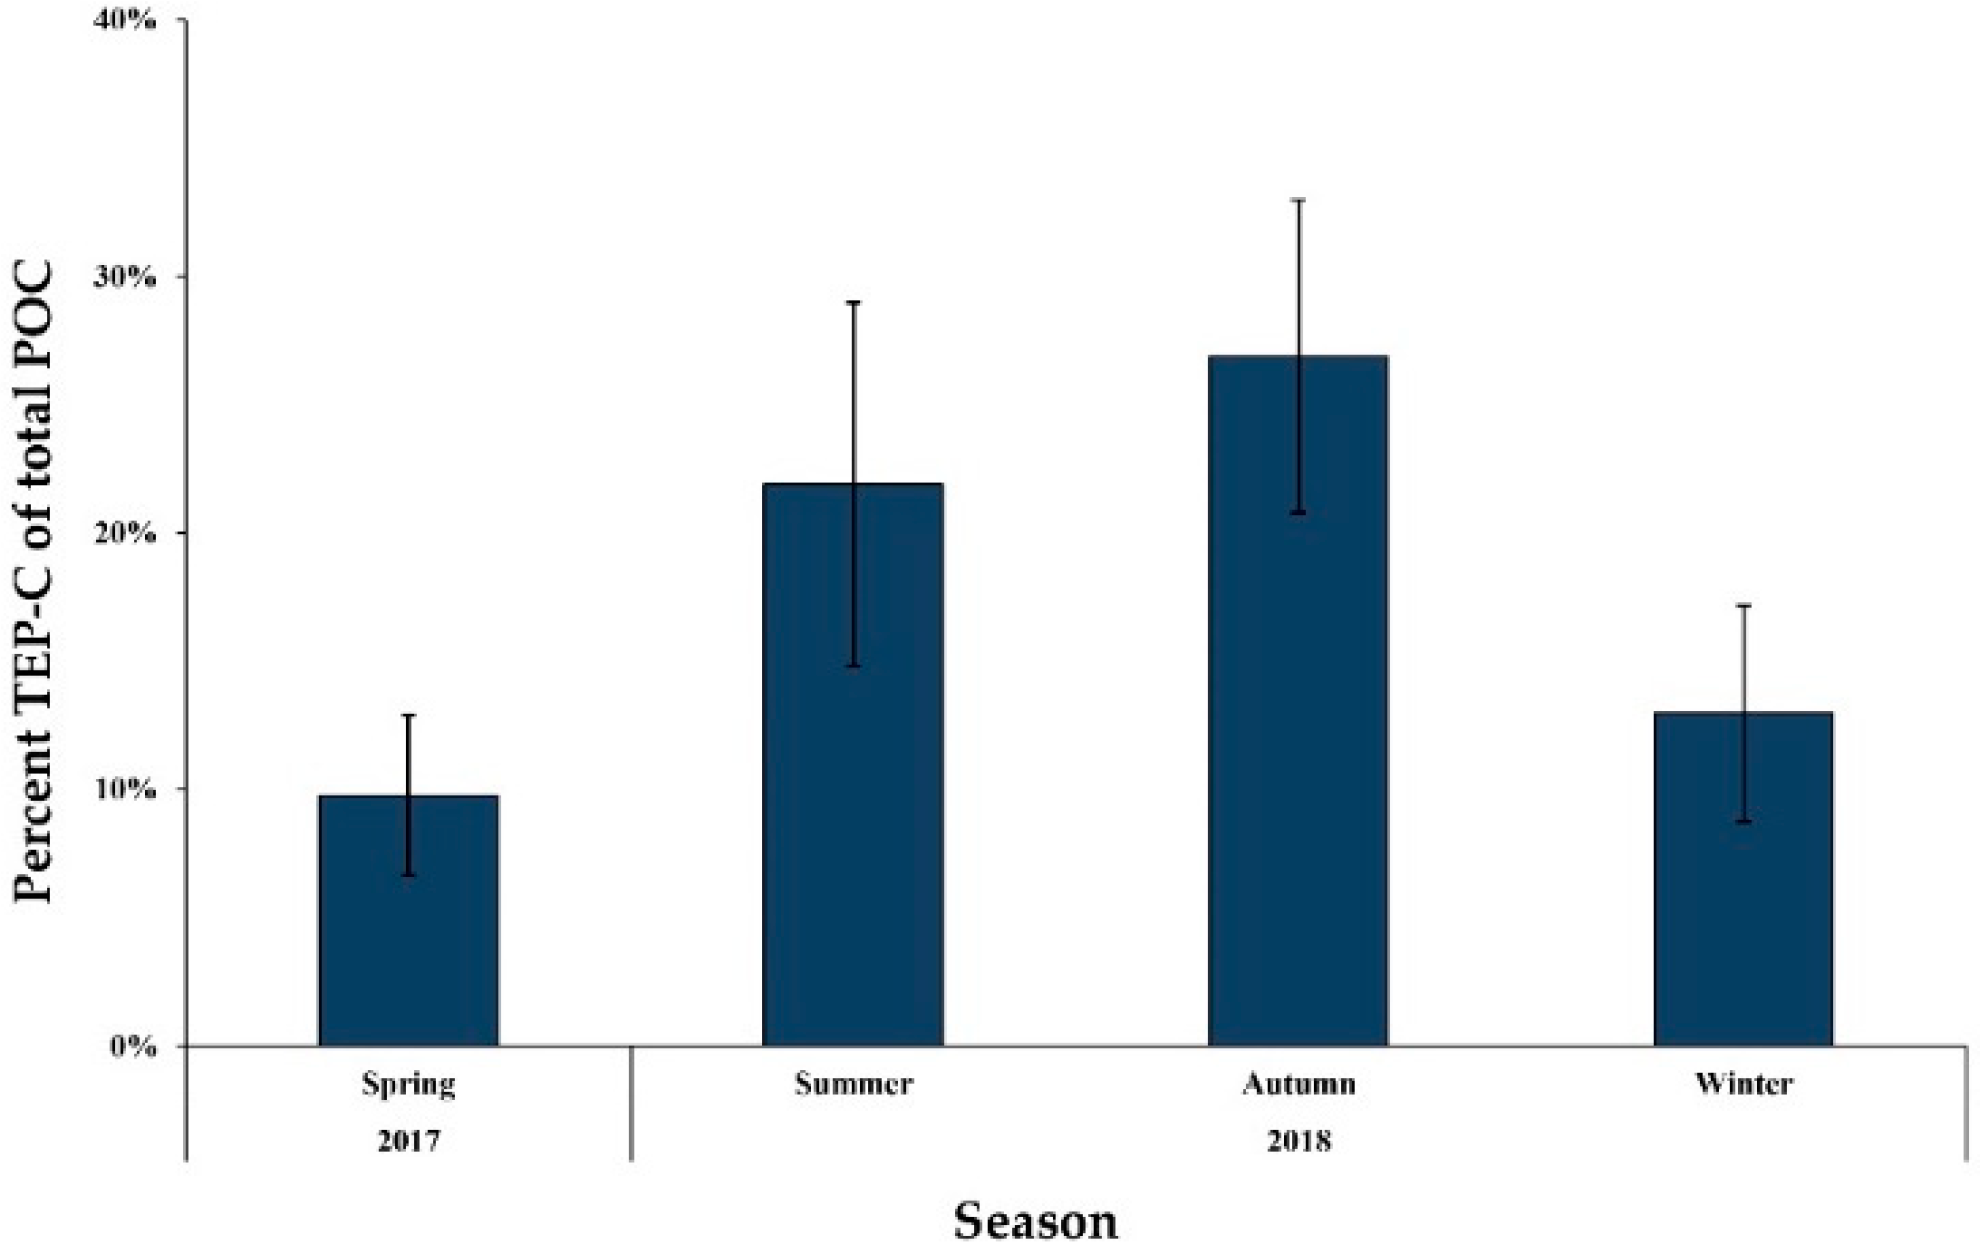
3.6. TEP Concentration
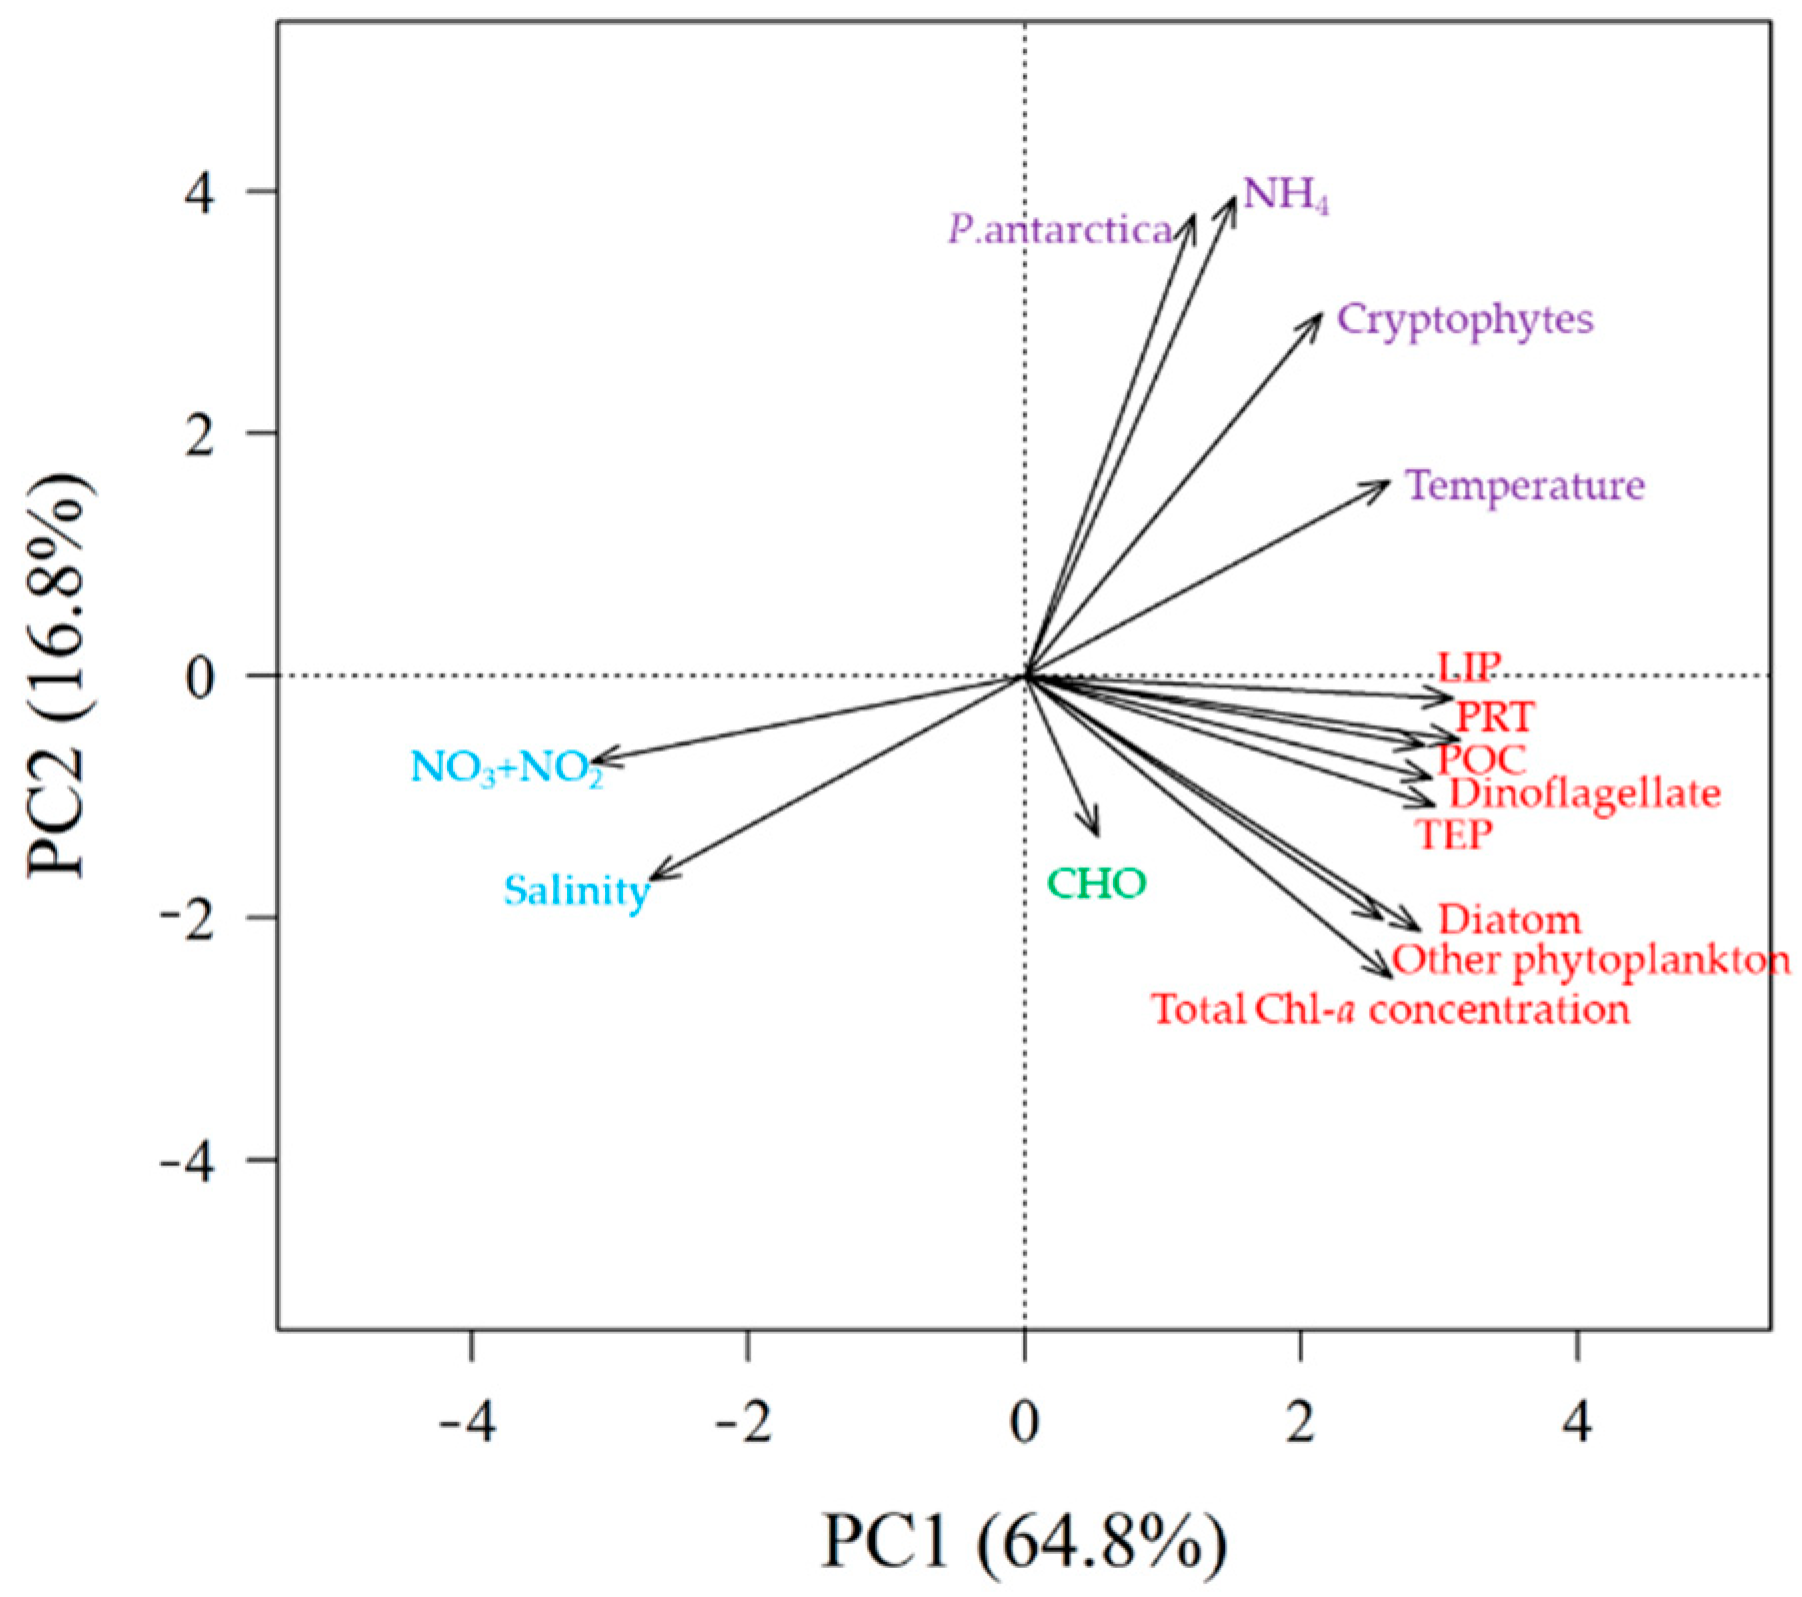
The TEP concentration ranged from 10.2 to 96.1 µg Xeq. L−1 (32.7 ± 24.6 µg Xeq. L−1) during our observation period from December 2017 to October 2018 (Figure 5b). The highest TEP concentration was observed during February, and the TEP concentrations were nearly stable during the winter period after April (18.3 ± 6.9 µg Xeq. L−1). Overall, the TEP concentrations were significantly correlated with Chl-a and fucoxanthine concentrations in this study (Figure 9).
The concentrations of TEP-C ranging from 7.6 to 62.8 µg Xeq. L−1 (24.5 ± 18.4 µg Xeq. L−1) were significantly different among each season (one-way ANOVA test, p < 0.05). The average contributions of TEP-C to the total POC were relatively higher in autumn (26.9% ± 6.1%), followed by summer (21.9% ± 7.1%), winter (13.0% ± 4.2%), and spring (9.8% ± 3.1%) (Figure 10).

3.7. PCA

PCA was conducted to determine major environmental factors controlling macromolecular concentrations, and TEPs primarily originated from phytoplankton during our sampling period (Figure 11). As a result of the PCA, the first and second principal components explained 64.8% and 16.8%, respectively, of the biochemical variables relative to the environmental factors during our research period. The first principal component was positively correlated with total Chl-a concentrations, POC, TEPs, lipids, proteins, diatoms, and dinoflagellates (eigenvectors of 0.957, 0.869, 0.911, 0.854, 0.894, 0.975, and 0.881, respectively) but negatively correlated with NO3 + NO2 (eigenvectors of −0.773). The second principal component was positively correlated with NH4, water temperature, cryptophytes, and P. antarctica (eigenvectors of 0.909, 0.704, 0.851, and 0.828, respectively) but had negative loadings for salinity (eigenvectors of −0.719). However, we did not find a correlation between carbohydrates with either the first or second principal components.

4. Discussion

4.1. Environmental Conditions

The seasonal variations in temperature and salinity at the JBS were lower than those previously reported from other studies in the Antarctic coastal environment [52,53]. In spring and summer, relatively large variations in temperature and salinity were observed with the melting of sea ice, but they were nearly stable during the winter period, as expected. The ice-free period in our study was only 12 days, which is a relatively shorter period compared with a previous study in which the ice-free period lasted more than a month [23].
The concentrations of major inorganic nutrients were generally abundant throughout the study period, although relatively lower concentrations were found during the phytoplankton growth season in summer. Because of the consistently high concentrations, the growth of phytoplankton in Antarctic coastal waters is not limited by major inorganic nutrients [54,55]. We estimated nutrient utilization following [55] by subtracting the average concentration in summer from the average concentration in winter, which was largely not affected by sea ice melting or biological uptake. Although nitrate and phosphate in our study (14.7 and 1.0 µM, respectively) were within the range of net nutrient utilization values (8.9–23.0 and 0.9–1.6 µM, respectively) measured in a previous study in TNB [55], the utilization of silicate was noticeably higher in our study (29.0 µM) than in [55] (12.8–23.0 µM). Silicate is necessary for the growth of diatoms [55], which is consistent with our pigment results for diatom-dominant phytoplankton communities observed at JBS in our study.

4.2. Seasonal Variations in Biomass and Major Species Compositions of Phytoplankton

Large variations in both Chl-a and POC concentrations were observed in spring and summer, but they were nearly stable in winter. Generally, Chl-a concentrations in the Ross Sea reach their maximum in spring and decline thereafter, and then the second peak can be observed again in summer [17,56]. In this study, one short peak of Chl-a concentration was distinct in summer. This difference could be due to different locations between this and other studies. This study was conducted at the JBS, which is in a coastal area. Consistently, the authors of [57] reported that a phytoplankton bloom appeared in coastal waters of the Ross Sea in late summer. In addition, the maximum biomass of phytoplankton was reported in February, although interannual variability in biomass was observed in the Ross Sea according to [58]. The maximum concentration of Chl-a at the JBS in 2018 was relatively low compared to those from previous studies in other Antarctic coastal regions in summer [52,53,59,60]. Consistently, the maximum concentration of POC in summer also showed a relatively lower value compared with those of previous studies conducted in coastal Antarctica [20,61,62]. Our maximum Chl-a concentration (2.15 μg L−1) was also relatively lower than that of [23], which was previously conducted in 2015 (4.29 μg L−1). In addition, the average total Chl-a concentrations were lower for all seasons during this study compared with those in 2015 [23]. This could have been due to different growing season periods between the two studies at the JBS. This study had a relatively shorter ice-free growing season (approximately 12 days) than that in 2015 (>1 month). The considerable contribution of nano-sized phytoplankton (>40%) in spring and summer persisted through winter in this study whereas micro-sized phytoplankton (>40%) continued to dominate in the autumn and winter in 2015 [23]. These results could support the results in a previous study reporting that the phytoplankton community structure in winter could be determined in a previous season [5].
Seasonal variations in Chl-a concentrations were also reflected in the POC and PON concentrations in this study, suggesting that the majority of POM in Antarctic coastal waters originated directly from phytoplankton [20]. Similarly, Fabiano et al. [61] found that the sea ice melting process in TNB was a key factor influencing the distribution and composition of POM originating from phytoplankton. The C/N ratio in summer in this study (6.02 ± 0.48) was very similar to that in previous studies (6.2–6.5) conducted in TNB during summer [20,61]. This indicates a typical POM dominated by fresh algal material [63]. Furthermore, Fabiano and Pusceddu [20] found that the C/N ratio continued to increase until the end of their study period in middle February. We also found an increasing C/N ratio from autumn to winter, which suggests that N-based materials decreased more than C-based materials in POM. This is consistent with the macromolecular compositions of POM with dominant carbohydrates and lipids in the winter season, as we discuss later.
According to Smith and Asper [64], major phytoplankton communities include diatoms and P. antarctica in the Ross Sea. In particular, both groups occur in the spring, whereas diatoms dominate summer phytoplankton assemblages [65]. During the entire study period in 2018, the phytoplankton community was mostly composed of diatoms (88.8% ± 11.6%), followed by dinoflagellates (5.2% ± 6.3%), P. antarctica (4.2% ± 8.1%), and cryptophytes (1.6% ± 3.6%). Although the composition of P. antarctica was highest in spring in this study, it accounted for only 10.9% of the phytoplankton community. The proportion of dinoflagellates increased in autumn and winter during this study. This was similar to previous results, which accounted for approximately 10%–20% of the composition of dinoflagellates during summer in TNB [66]. Arrigo et al. [67] found different N/P ratios depending on the major phytoplankton community in the Ross Sea. The N/P ratios were 9.7 and 19.2 for diatom- and P. antarctica–dominated communities, respectively [67]. The average N/P ratios were 12.7 (±0.9) and 12.2 (±1.6) in spring and summer at the JBS, respectively, which were similar to the value (11.0 ± 0.9) from a previous study with diatom blooms during late summer in the Ross Sea [68].

4.3. Seasonal Variations of Macromolecular Composition

The macromolecular compositions of POM mainly originating from phytoplankton are affected by various factors, such as nutrients [15,69,70], light conditions [16,71], species composition [14,72,73], and different growth phases of phytoplankton [74,75]. Considering the incomplete removal of macronutrients (e.g., nitrate) at the end of the growth phase, iron and irradiance could be assumed to exert major controls on the productivity of phytoplankton in the Ross Sea [4,76,77,78,79]. The light intensity is sufficiently strong in spring [80], but POM cannot be synthesized by phytoplankton in the water column due to the blocking of light by sea ice. This could cause the low composition of proteins and high composition of lipids during spring in our study. The highest contribution of proteins observed in summer represented high growth rates and physiologically healthy conditions of phytoplankton [16]. The assemblages and species of phytoplankton could also have significant impacts on seasonal variations in macromolecular composition [81,82]. Previous studies have claimed that the dominance of P. antarctica biomass could be a key reason for the high carbohydrate concentrations [83,84]. In contrast, polar diatoms have been observed to have a large accumulation of lipids, partially related to temperature effects by altering the allocation of carbon into storage products, such as cytoplasmic lipid droplets [85,86]. This may explain the relatively higher contents of lipids in this study with diatom-predominant communities compared with those in other studies [84,87] during the spring and summer seasons. Indeed, the PCA results showed that lipids had the highest correlations with diatoms (r = 0.87, p < 0.01) (Table 1).
In addition, proteins were positively correlated with diatoms in our study (r = 0.94, p < 0.01), which is consistent with previous results from the Ross Sea (r = 0.59, p < 0.01) [88]. These results suggest that polar diatoms in the Southern Ocean have physiological mechanisms to increase protein concentrations to compensate for slow enzyme rates at cold temperatures [89].
In addition, carbohydrates linked to P. antarctica rapidly decrease during the degradation process, while carbohydrates linked to diatoms are retained more within their cellular matrix [90]. This indicates that carbohydrates remain persistent throughout the winter season at our study site. Ahn et al. [75] linked the growth phases of phytoplankton with seasonal variations in macromolecular composition. During the exponential phase corresponding to the summer in our study, the POM was mainly composed of proteins (39.1% ± 5.2%) as a functional reservoir of cell growth and division [91]. In contrast, cell storage compounds such as carbohydrates and lipids tended to increase in the stationary periods [92], corresponding to the autumn and winter in our study, with high carbohydrate (58.7% ± 15.0% and 67.4% ± 5.5%, respectively) and lipid contents (30.8% ± 5.1% and 32.5% ± 5.4%, respectively).
The relative contributions of different macromolecule compositions in phytoplankton can be an indicator of the quality of phytoplankton as primary food resources [75]. Proteins have a relatively higher efficiency in carbon transfer to herbivores than other macromolecular components [16,93]. Carbohydrates and lipids are necessary components for all cell membranes as well as major energy reservoirs in phytoplankton bodies [94,95]. In particular, glucan in carbohydrates is mobilized during respiration to maintain growth in the dark [94]. In terms of quality aspects, the calorie content of POM represents the condition of energy sources. Although the overall Chl-a concentrations were lower than those in other studies, the overall calorie content (1.42 ± 0.68 Kcal m−3) in this study was similar to that from previous studies measured primarily in spring or summer [21,63,87]. The calorie content was high even during the polar night period, when photosynthesis was assumed to rarely occur. Although phytoplankton had a very low productivity in polar dark winters, they could maintain high caloric contents by having higher carbohydrate and lipid contents (Figure 8). Carbohydrates and lipids are maintained by respiration and long-term energy storage [96] for the survival of phytoplankton in winter.

4.4. Seasonal Variations of TEPs

Several previous studies on the distribution of TEPs in the Southern Ocean have previously been conducted in the Antarctic Peninsula [29,35,97], Drake Passage [97], and Ross Sea [36]. However, these previous studies were conducted during spring or summer. This is the first report of the annual variability in TEP concentrations in the Southern Ocean. The TEP concentrations obtained at the JBS during this study ranged from 10.2 to 96.1 µg Xeq. L−1, which generally falls within the range observed in other studies from various oceans around the world [98,99,100,101]. However, the overall TEP concentrations obtained in this study were relatively lower than those previously reported for the Southern Ocean (Table 2).
The species composition, biomass, and growth conditions of phytoplankton and environmental factors could have a great influence on the concentrations of TEPs [25,32,34]. Based on the PCA results (Figure 11), the seasonal variation in TEPs was primarily affected by diatoms and dinoflagellates in our study period. The TEP concentrations were positively correlated with the abundance of diatoms (r = 0.89, p < 0.01) and dinoflagellates (r = 0.95, p < 0.01) (Table 1). Similarly, previous studies reported that TEP concentrations in the Southern Ocean were significantly related to the abundance of diatoms (r = 0.67, p < 0.01) and dinoflagellates (r = 0.67, p < 0.01) [34]. In contrast, we found that TEP concentrations had no significant relationship with P. antarctica in our study, which conflicts with a previous finding that P. antarctica is a major producer of TEPs in the Southern Ocean [36], probably because the phytoplankton community was not dominated by P. antarctica in this study. In fact, TEP production by phytoplankton depends on the species composition of phytoplankton [25,32]. Hong et al. [36] observed that the concentrations of TEPs measured during a P. antarctica–dominant bloom were higher than those produced by coastal diatom blooms in the Ross Sea. The relatively lower TEP concentrations in this study could have resulted from the diatom-dominant phytoplankton community at the JBS. Additionally, the lower Chl-a concentrations observed in this study could be another reason for the lower TEP concentration since a significant relationship was found between the TEPs and Chl-a concentrations during this study period (Figure 10a). The relationship between TEPs and Chl-a can be expressed as TEPs = a(Chl-a)b [97]. The slope, a, of the log-converted TEP and Chl-a relationship in our study (0.33) is comparable to the previously reported values of 0.32, 0.38, and 0.35 for the Antarctic Peninsula, Bransfield Strait, and the Northern Weddell Sea in the Southern Ocean, respectively [29,34,97]. In comparison, Hong et al. [36] reported an extremely high value (3.63) when P. antarctica was dominant in the Ross Sea.
TEPs frequently make up a substantial fraction of the POC in the seawater column [100]. To estimate TEP-C, we used the lowest conversion factor (0.51 µg Xeq. L−1) commonly used for the diatom-dominated phytoplankton community [51,102]. Considerably large variations in the contribution of TEP-C to the POC stocks were observed seasonally during our observation period (Figure 9), which was different from the seasonal pattern in the TEP concentrations. TEP concentrations were highest in summer, but the contribution of TEP-C to the POC was highest in autumn (26.9% ± 6.1%). This suggests that TEPs could have a longer residence time than POC in the water column [29]. Previous studies have shown relatively faster degradation of protein compared to other components in the Antarctic Ocean [23,84]. Indeed, a decrease in the protein components of POC from the spring growth season to the summer and winter seasons was observed in this study (Figure 7). Therefore, TEP-C could stay longer and accumulate in comparison to phytoplankton or bacterial cells in the water column [29]. Although there have been few studies on TEP-C in the Southern Ocean, our average contribution of TEP-C to the total POC concentration in summer (21.9% ± 7.1%) was lower than that in the northern Weddell Sea (38.8% ± 12.3%) [34] but comparable to that on the Antarctic Peninsula (18%) [29]. The lower TEP-C contributions to the total POC suggest that relatively more particulate-based organic carbon materials were available in the water column during our observation period.

Author Contributions

Conceptualization, S.P., J.P., K.-C.Y., and S.-H.L.; methodology, S.P., K.K., N.J., and H.-K.J.; software, S.P.; validation, S.P. and S.-H.L.; formal analysis, S.P and S.-H.L.; investigation, S.P., K.-C.Y., and J.Y.; writing—original draft preparation, S.P.; writing—review and editing, S.-H.L.; visualization, S.P., K.K., N.J., H.-K.J., J.K. (Jaehong Kim), J.K. (Jaesoon Kim), and J.K. (Joonmin Kim); supervision, S.-H.L. All authors have read and agreed to the published version of the manuscript.

Funding

This research was funded by the National Research Foundation of Korea (NRF) grant funded by the Korea government (MSIT; NRF-2019R1A2C1003515) and the Korea Polar Research Institute (KOPRI; PE21110).

Institutional Review Board Statement

Not applicable.

Informed Consent Statement

Not applicable.

Data Availability Statement

Not applicable.

Acknowledgments

We sincerely thank members of the fifth overwintering team at the JBS for collecting seawater samples safely for 1 year. We would like to thank the anonymous reviewers and the handling editors for their constructive and valuable recommendations.

Conflicts of Interest

The authors declare no conflict of interest.

References

  1. Nelson, D.M.; DeMaster, D.J.; Dunbar, R.B.; Smith, W.O. Cycling of organic carbon and biogenic silica in the Southern Ocean: Estimates of water-column and sedimentary fluxes on the Ross Sea continental shelf. J. Geophys. Res. C Ocean. 1996, 101, 18519–18532. [Google Scholar] [CrossRef]
  2. Smith, W.O.; Nelson, D.M. Phytoplankton bloom produced by a receding ice edge in the ross sea: Spatial coherence with the density field. Science 1985, 227, 163–166. [Google Scholar] [CrossRef]
  3. Sedwick, P.N.; Ditullio, G.R. Regulation of algal blooms in Antarctic shelf waters by the release of iron from melting sea ice. Geophys. Res. Lett. 1997, 24, 2515–2518. [Google Scholar] [CrossRef] [Green Version]
  4. Sedwick, P.N.; Di Tullio, G.R.; Mackey, D.J. Iron and manganese in the Ross Sea, Seasonal iron limitation in Antarctic: Seasonal iron limitation in Antarctic shelf waters. J. Geophys. Res. Ocean. 2000, 105, 11321–11336. [Google Scholar] [CrossRef]
  5. Krell, A.; Schnack-Schiel, S.B.; Thomas, D.N.; Kattner, G.; Zipan, W.; Dieckmann, G.S. Phytoplankton dynamics in relation to hydrography, nutrients and zooplankton at the onset of sea ice formation in the eastern Weddell Sea (Antarctica). Polar Biol. 2005, 28, 700–713. [Google Scholar] [CrossRef]
  6. Garrison, D.L.; Buck, K.R. Surface-layer sea ice assemblages in Antarctic pack ice during the austral spring: Environmental conditions, primary production and community structure. Mar. Ecol. Prog. Ser. 1991, 75, 161–172. [Google Scholar] [CrossRef]
  7. Smetacek, V.; Scharek, R.; Gordon, L.I.; Eicken, H.; Fahrbach, E.; Rohardt, G.; Moore, S. Early spring phytoplankton blooms in ice platelet layers of the southern Weddell Sea, Antarctica. Deep Sea Res. Part A Oceanogr. Res. Pap. 1992, 39, 153–168. [Google Scholar] [CrossRef]
  8. Brierley, A.S.; Thomas, D.N. Ecology of Southern Ocean pack ice. Adv. Mar. Biol. 2002, 43, 171–276. [Google Scholar]
  9. Parkinson, C.L.; Cavalieri, D.J. Antarctic sea ice variability and trends, 1979–2010. Cryosphere 2012, 6, 871–880. [Google Scholar] [CrossRef] [Green Version]
  10. Eayrs, C.; Holland, D.; Francis, D.; Wagner, T.; Kumar, R.; Li, X. Understanding the Seasonal Cycle of Antarctic Sea Ice Extent in the Context of Longer-Term Variability. Rev. Geophys. 2019, 57, 1037–1064. [Google Scholar] [CrossRef]
  11. Goffart, A.; Catalano, G.; Hecq, J.H. Factors controlling the distribution of diatoms and Phaeocystis in the Ross Sea. J. Mar. Syst. 2000, 27, 161–175. [Google Scholar] [CrossRef]
  12. Grotti, M.; Soggia, F.; Ianni, C.; Frache, R. Trace metals distributions in coastal sea ice of Terra Nova Bay, Ross Sea, Antarctica. Antarct. Sci. 2005, 17, 289–300. [Google Scholar] [CrossRef]
  13. Smith, W.O.; Shields, A.R.; Peloquin, J.A.; Catalano, G.; Tozzi, S.; Dinniman, M.S.; Asper, V.A. Interannual variations in nutrients, net community production, and biogeochemical cycles in the Ross Sea. Deep Res. Part II Top. Stud. Oceanogr. 2006, 53, 815–833. [Google Scholar] [CrossRef]
  14. Finkel, Z.V.; Follows, M.J.; Liefer, J.D.; Brown, C.M.; Benner, I.; Irwin, A.J. Phylogenetic diversity in the macromolecular composition of microalgae. PLoS ONE 2016, 11, e0155977. [Google Scholar] [CrossRef] [Green Version]
  15. Ben-Amotz, A.; Tornabene, T.G.; Thomas, W.H. Chemical Profile of Selected Species of Microalgae With Emphasis on Lipids. J. Phycol. 1985, 21, 72–81. [Google Scholar] [CrossRef]
  16. Lee, S.H.; Kim, H.J.; Whitledge, T.E. High incorporation of carbon into proteins by the phytoplankton of the Bering Strait and Chukchi Sea. Cont. Shelf Res. 2009, 29, 1689–1696. [Google Scholar] [CrossRef]
  17. Smith, W.O.; Marra, J.; Hiscock, M.R.; Barber, R.T. The seasonal cycle of phytoplankton biomass and primary productivity in the Ross Sea, Antarctica. Deep Res. Part II Top. Stud. Oceanogr. 2000, 47, 3119–3140. [Google Scholar] [CrossRef]
  18. Olson, R.J.; Sosik, H.M.; Chekalyuk, A.M.; Shalapyonok, A. Effects of iron enrichment on phytoplankton in the Southern Ocean during late summer: Active fluorescence and flow cystometric analyses. Deep Res. Part II Top. Stud. Oceanogr. 2000, 47, 3181–3200. [Google Scholar] [CrossRef]
  19. Fabiano, M.; Povero, P.; Danovaro, R. Participate organic matter composition in Terra Nova Bay (Ross Sea, Antarctica) during summer 1990. Antarct. Sci. 1996, 8, 7–13. [Google Scholar] [CrossRef]
  20. Fabiano, M.; Pusceddu, A. Total and hydrolizable particulate organic matter (carbohydrates, proteins and lipids) at a coastal station in Terra Nova Bay (Ross Sea, Antarctica). Polar Biol. 1998, 19, 125–132. [Google Scholar] [CrossRef]
  21. Pusceddu, A.; Cattaneo-Vietti, R.; Albertelli, G.; Fabiano, M. Origin, biochemical composition and vertical flux of particulate organic matter under the pack ice in Terra Nova Bay (Ross Sea, Antarctica) during late summer 1995. Polar Biol. 1999, 22, 124–132. [Google Scholar] [CrossRef]
  22. Baldi, F.; Marchetto, D.; Pini, F.; Fani, R.; Michaud, L.; Lo Giudice, A.; Berto, D.; Giani, M. Biochemical and microbial features of shallow marine sediments along the Terra Nova Bay (Ross Sea, Antarctica). Cont. Shelf Res. 2010, 30, 1614–1625. [Google Scholar] [CrossRef]
  23. Kim, K.; Park, J.; Jo, N.; Park, S.; Yoo, H.; Kim, J.; Lee, S.H. Monthly Variation in the Macromolecular Composition of Phytoplankton Communities at Jang Bogo Station, Terra Nova Bay, Ross Sea. Front. Microbiol. 2021, 12, 618999. [Google Scholar] [CrossRef]
  24. Alldredge, A.L.; Passow, U.; Logan, B.E. The abundance and significance of a class of large, transparent organic particles in the ocean. Deep Sea Res. Part I Ocean. Res. Pap. 1993, 40, 1131–1140. [Google Scholar] [CrossRef]
  25. Passow, U. Production of transparent exopolymer particles (TEPS) by phyto- and bacterioplankton. Mar. Ecol. Prog. Ser. 2002, 236, 1–12. [Google Scholar] [CrossRef] [Green Version]
  26. Passow, U. Formation of transparent exopolymer particles, TEPS, from dissolved precursor material. Mar. Ecol. Prog. Ser. 2000, 192, 1–11. [Google Scholar] [CrossRef]
  27. Mari, X.; Passow, U.; Migon, C.; Burd, A.B.; Legendre, L. Transparent exopolymer particles: Effects on carbon cycling in the ocean. Prog. Oceanogr. 2017, 151, 13–37. [Google Scholar] [CrossRef] [Green Version]
  28. Passow, U.; Shipe, R.F.; Murray, A.; Pak, D.K.; Brzezinski, M.A.; Alldredge, A.L. The origin of transparent exopolymer particles (TEPS) and their role in the sedimentation of particulate matter. Cont. Shelf Res. 2001, 21, 327–346. [Google Scholar] [CrossRef] [Green Version]
  29. Ortega-Retuerta, E.; Reche, I.; Pulido-Villena, E.; Agustí, S.; Duarte, C.M. Uncoupled distributions of transparent exopolymer particles (TEPS) and dissolved carbohydrates in the Southern Ocean. Mar. Chem. 2009, 115, 59–65. [Google Scholar] [CrossRef]
  30. Mari, X.; Rassoulzadegan, F.; Brussaard, C.P.D.; Wassmann, P. Dynamics of transparent exopolymeric particles (TEPS) production by Phaeocystis globosa under N- or P-limitation: A controlling factor of the retention/export balance. Harmful Algae 2005, 4, 895–914. [Google Scholar] [CrossRef]
  31. Beauvais, S.; Pedrotti, M.L.; Egge, J.; Iversen, K.; Marrasé, C. Effects of turbulence on TEPS dynamics under contrasting nutrient conditions: Implications for aggregation and sedimentation processes. Mar. Ecol. Prog. Ser. 2006, 323, 47–57. [Google Scholar] [CrossRef] [Green Version]
  32. Hung, C.C.; Guo, L.; Santschi, P.H.; Alvarado-Quiroz, N.; Haye, J.M. Distributions of carbohydrate species in the Gulf of Mexico. Mar. Chem. 2003, 81, 119–135. [Google Scholar] [CrossRef]
  33. Passow, U. Transparent exopolymer particles (TEPS) in aquatic environments. Prog. Oceanogr. 2002, 55, 287–333. [Google Scholar] [CrossRef] [Green Version]
  34. Zamanillo, M.; Ortega-Retuerta, E.; Nunes, S.; Estrada, M.; Sala, M.M.; Royer, S.J.; López-Sandoval, D.C.; Emelianov, M.; Vaqué, D.; Marrasé, C.; et al. Distribution of transparent exopolymer particles (TEPS) in distinct regions of the Southern Ocean. Sci. Total Environ. 2019, 691, 736–748. [Google Scholar] [CrossRef] [Green Version]
  35. Passow, U.; Alldredge, A.L. A dye-binding assay for the spectrophotometric measurement of transparent exopolymer particles (TEPS). Limnol. Oceanogr. 1995, 40, 1326–1335. [Google Scholar] [CrossRef]
  36. Hong, Y.; Smith, W.O.; White, A.M. Studies on transparent exopolymer particles (TEPS) produced in the ross sea (Antarctica) and by Phaeocystis antarctica (Prymnesiophyceae). J. Phycol. 1997, 33, 368–376. [Google Scholar] [CrossRef]
  37. Sugimoto, K.; Fukuda, H.; Baki, M.A.; Koike, I. Bacterial contributions to formation of transparent exopolymer particles (TEPS) and seasonal trends in coastal waters of Sagami Bay, Japan. Aquat. Microb. Ecol. 2007, 46, 31–41. [Google Scholar] [CrossRef]
  38. Huertas, E.; Navarro, G.; Rodríguez-Gálvez, S.; Prieto, L. The influence of phytoplankton biomass on the spatial distribution of carbon dioxide in surface sea water of a coastal area of the Gulf of Cádiz (southwestern Spain). Can. J. Bot. 2005, 83, 929–940. [Google Scholar] [CrossRef]
  39. Parsons, T.R.; Maita, Y.; Lalli, C.M. A Manual of Chemical and Biological Methods for Seawater Analysis; Pergamon Press: New York, NY, USA, 1984. [Google Scholar]
  40. Mackey, M.D.; Mackey, D.J.; Higgins, H.W.; Wright, S.W. CHEMTAX—A program for estimating class abundances from chemical markers: Application to HPLC measurements of phytoplankton. Mar. Ecol. Prog. Ser. 1996, 144, 265–283. [Google Scholar] [CrossRef] [Green Version]
  41. Wright, S.W.; Thomas, D.P.; Marchant, H.J.; Higgins, H.W.; Mackey, M.D.; Mackey, D.J. Analysis of phytoplankton of the Australian sector of the Southern Ocean: Comparisons of microscopy and size frequency data with interpretations of pigment HPLC data using the “CHEMTAX” matrix factorisation program. Mar. Ecol. Prog. Ser. 1996, 144, 285–298. [Google Scholar] [CrossRef]
  42. Wright, S.W.; Van den Enden, R.L. Phytoplankton community structure and stocks in the East Antarctic marginal ice zone (BROKE survey, January-March 1996) determined by CHEMTAX analysis of HPLC pigment signatures. Deep Res. Part II Top. Stud. Oceanogr. 2000, 47, 2363–2400. [Google Scholar] [CrossRef]
  43. DiTullio, G.R.; Geesey, M.E.; Jones, D.R.; Daly, K.L.; Campbell, L.; Smith, W.O. Phytoplankton assemblage structure and primary productivity along 170° W in the South Pacific Ocean. Mar. Ecol. Prog. Ser. 2003, 255, 55–80. [Google Scholar] [CrossRef] [Green Version]
  44. Dubois, M.; Gilles, K.A.; Hamilton, J.K.; Rebers, P.A.; Smith, F. Colorimetric Method for Determination of Sugars and Related Substances. Anal. Chem. 1956, 28, 350–356. [Google Scholar] [CrossRef]
  45. Lowry, O.H.; Rosebrough, N.J.; Farr, A.L.; Randall, R.J. Protein measurement with the Folin phenol reagent. J. Biol. Chem. 1951, 193, 265–275. [Google Scholar] [CrossRef]
  46. Bligh, E.G.; Dyer, W.J. A rapid method of total lipid extraction and purification. Can. J. Biochem. Physiol. 1959, 37, 911–917. [Google Scholar] [CrossRef] [Green Version]
  47. Marsh, J.B.; Weinstein, D.B. Simple charring method for determination of lipids. J. Lipid Res. 1966, 7, 574–576. [Google Scholar] [CrossRef]
  48. Bhavya, P.S.; Kim, B.K.; Jo, N.; Kim, K.; Kang, J.J.; Lee, J.H.; Lee, D.; Lee, J.H.; Joo, H.T.; Ahn, S.H.; et al. A Review on the Macromolecular Compositions of Phytoplankton and the Implications for Aquatic Biogeochemistry. Ocean Sci. J. 2019, 54, 1–14. [Google Scholar] [CrossRef]
  49. Danovaro, R.; Dell’Anno, A.; Pusceddu, A.; Marrale, D.; Della Croce, N.; Fabiano, M.; Tselepides, A. Biochemical composition of pico-, nano- and micro-particulate organic matter and bacterioplankton biomass in the oligotrophic Cretan Sea (NE Mediterranean). Prog. Oceanogr. 2000, 46, 279–310. [Google Scholar] [CrossRef]
  50. Winberg, G.G. Symbols, Units and Conversion Factors in Study of Fresh Waters Productivity; International Biological Programme: London, UK, 1971. [Google Scholar]
  51. Engel, A.; Passow, U. Carbon and nitrogen content of transparent exopolymer particles (TEPS) in relation to their Alcian Blue adsorption. Mar. Ecol. Prog. Ser. 2001, 219, 1–10. [Google Scholar] [CrossRef] [Green Version]
  52. Schloss, I.R.; Abele, D.; Ferreyra, G.A.; González, O.; Moreau, S.; Demers, S. Response of Potter Cove phytoplankton dynamics to long term climate trends. In Proceedings of the Open Science Conference XXXI SCAR, Buenos Aires, Argentina, 3–6 August 2010. [Google Scholar]
  53. Lee, S.H.; Joo, H.M.; Joo, H.T.; Kim, B.K.; Song, H.J.; Jeon, M.; Kang, S.H. Large contribution of small phytoplankton at Marian Cove, King George Island, Antarctica, based on long-term monitoring from 1996 to 2008. Polar Biol. 2015, 38, 207–220. [Google Scholar] [CrossRef]
  54. Schloss, I.R.; Ferreyra, G.A.; Ruiz-Pino, D. Phytoplankton biomass in Antarctic shelf zones: A conceptual model based on Potter Cove, King George Island. J. Mar. Syst. 2002, 36, 129–143. [Google Scholar] [CrossRef]
  55. Rivaro, P.; Luisa Abelmoschi, M.; Grotti, M.; Ianni, C.; Magi, E.; Margiotta, F.; Massolo, S.; Saggiomo, V. Combined effects of hydrographic structure and iron and copper availability on the phytoplankton growth in Terra Nova Bay Polynya (Ross Sea, Antarctica). Deep Res. Part I Oceanogr. Res. Pap. 2012, 62, 97–110. [Google Scholar] [CrossRef]
  56. Tremblay, J.E.; Smith, W.O. Chapter 8 Primary Production and Nutrient Dynamics in Polynyas. Elsevier Oceanogr. Ser. 2007, 74, 239–269. [Google Scholar] [CrossRef]
  57. Arrigo, K.R.; Weiss, A.M.; Smith, W.O. Physical forcing of phytoplankton dynamics in the southwestern Ross Sea. J. Geophys. Res. Ocean. 1998, 103, 1007–1021. [Google Scholar] [CrossRef]
  58. Peloquin, J.A.; Smith, W.O. Phytoplankton blooms in the Ross Sea, Antarctica: Interannual variability in magnitude, temporal patterns, and composition. J. Geophys. Res. Ocean. 2007, 112, 1–12. [Google Scholar] [CrossRef] [Green Version]
  59. Trimborn, S.; Hoppe, C.J.M.; Taylor, B.B.; Bracher, A.; Hassler, C. Physiological characteristics of open ocean and coastal phytoplankton communities of Western Antarctic Peninsula and Drake Passage waters. Deep Res. Part I Oceanogr. Res. Pap. 2015, 98, 115–124. [Google Scholar] [CrossRef]
  60. Kim, H.; Ducklow, H.W.; Abele, D.; Barlett, E.M.R.; Buma, A.G.J.; Meredith, M.P.; Rozema, P.D.; Schofield, O.M.; Venables, H.J.; Schloss, I.R. Inter-decadal variability of phytoplankton biomass along the coastalWest Antarctic Peninsula. Philos. Trans. R. Soc. A Math. Phys. Eng. Sci. 2018, 376, 20170174. [Google Scholar] [CrossRef]
  61. Fabiano, M.; Povero, P.; Danovaro, R. Distribution and composition of particulate organic matter in the Ross Sea (Antarctica). Polar Biol. 1993, 13, 525–533. [Google Scholar] [CrossRef]
  62. Mangoni, O.; Saggiomo, V.; Bolinesi, F.; Margiotta, F.; Budillon, G.; Cotroneo, Y.; Misic, C.; Rivaro, P.; Saggiomo, M. Phytoplankton blooms during austral summer in the Ross Sea, Antarctica: Driving factors and trophic implications. PLoS ONE 2017, 12, e0176033. [Google Scholar] [CrossRef] [Green Version]
  63. Pusceddu, A.; Fabiano, M. Changes in the biochemical composition of Tetraselmis suecia and Isochrysis galbana during growth and decay. Chem. Ecol. 1996, 12, 199–212. [Google Scholar] [CrossRef]
  64. Smith, W.O.; Asper, V.L. The influence of phytoplankton assemblage composition on biogeochemical characteristics and cycles in the southern Ross Sea, Antarctica. Deep Res. Part I Oceanogr. Res. Pap. 2001, 48, 137–161. [Google Scholar] [CrossRef]
  65. Mangoni, O.; Modigh, M.; Conversano, F.; Carrada, G.C.; Saggiomo, V. Effects of summer ice coverage on phytoplankton assemblages in the Ross Sea, Antarctica. Deep Res. Part I Oceanogr. Res. Pap. 2004, 51, 1601–1617. [Google Scholar] [CrossRef]
  66. Andreoli, C.; Tolomio, C.; Moro, I.; Radice, M.; Moschin, E.; Bellato, S. Diatoms and dinoflagellates in Terra Nova Bay (Ross Sea-Antarctica) during austral summer 1990. Polar Biol. 1995, 15, 465–475. [Google Scholar] [CrossRef]
  67. Arrigo, K.R.; Robinson, D.H.; Worthen, D.L.; Dunbar, R.B.; DiTullio, G.R.; VanWoert, M.; Lizotte, M.P. Phytoplankton community structure and the drawdown of nutrients and CO2 in the Southern Ocean. Science 1999, 283, 365–367. [Google Scholar] [CrossRef] [Green Version]
  68. Saggiomo, V.; Catalano, G.; Mangoni, O.; Budillon, G.; Carrada, G.C. Primary production processes in ice-free waters of the Ross Sea (Antarctica) during the austral summer 1996. Deep Res. Part II Top. Stud. Oceanogr. 2002, 49, 1787–1801. [Google Scholar] [CrossRef]
  69. Kilham, S.S.; Kreeger, D.A.; Goulden, C.E.; Lynn, S.G. Effects of nutrient limitation on biochemical constituents of Ankistrodesmus falcatus. Freshw. Biol. 1997, 38, 591–596. [Google Scholar] [CrossRef]
  70. Van Leeuwe, M.A.; Scharek, R.; De Baar, H.J.W.; De Jong, J.T.M.; Goeyens, L. Iron enrichment experiments in the Southern Ocean: Physiological responses of plankton communities. Deep Res. Part II Top. Stud. Oceanogr. 1997, 44, 189–207. [Google Scholar] [CrossRef]
  71. Morris, I.; Glover, H.E.; Yentsch, C.S. Products of photosynthesis by marine phytoplankton: The effect of environmental factors on the relative rates of protein synthesis. Mar. Biol. 1974, 27, 1–9. [Google Scholar] [CrossRef]
  72. Liebezeit, G. Particulate carbohydrates in relation to phytoplankton in the euphotic zone of the Bransfield Strait. Polar Biol. 1984, 24, 225–228. [Google Scholar] [CrossRef]
  73. Moal, J.; Jezequel, V.M.; Harris, R.P.; Samain, J.F.; Poulet, S.A. Interspecific and intraspecific variability of the chemical composition of marine phytoplankton. Oceanol. Acta 1987, 10, 339–346. [Google Scholar]
  74. Fabregas, J.; Herrero, C.; Cabezas, B.; Abalde, J. Mass culture and biochemical variability of the marine microalga Tetraselmis suecica Kylin (Butch) with high nutrient concentrations. Aquaculture 1985, 49, 231–244. [Google Scholar] [CrossRef] [Green Version]
  75. Ahn, S.H.; Whitledge, T.E.; Stockwell, D.A.; Lee, J.H.; Lee, H.w.; Lee, S.H. The biochemical composition of phytoplankton in the Laptev and East Siberian seas during the summer of 2013. Polar Biol. 2019, 42, 133–148. [Google Scholar] [CrossRef]
  76. Fitzwater, S.E.; Johnson, K.S.; Gordon, R.M.; Coale, K.H.; Smith, W.O. Trace metal concentrations in the Ross Sea and their relationship with nutrients and phytoplankton growth. Deep Res. Part II Top. Stud. Oceanogr. 2000, 47, 3159–3179. [Google Scholar] [CrossRef]
  77. Smith, W.O.; Dinniman, M.S.; Klinck, J.M.; Hofmann, E. Biogeochemical climatologies in the Ross Sea, Antarctica: Seasonal patterns of nutrients and biomass. Deep Res. Part II Top. Stud. Oceanogr. 2003, 50, 3083–3101. [Google Scholar] [CrossRef]
  78. Arrigo, K.R.; van Dijken, G.L. Phytoplankton dynamics within 37 Antarctic coastal polynya systems. J. Geophys. Res. Ocean. 2003, 108. [Google Scholar] [CrossRef]
  79. Ryan-Keogh, T.J.; DeLizo, L.M.; Smith, W.O.; Sedwick, P.N.; McGillicuddy, D.J.; Moore, C.M.; Bibby, T.S. Temporal progression of photosynthetic-strategy in phytoplankton in the Ross Sea, Antarctica. J. Mar. Syst. 2017, 166, 87–96. [Google Scholar] [CrossRef] [Green Version]
  80. McKnight, D.M.; Howes, B.L.; Taylor, C.D.; Goehringer, D.D. Phytoplankton dynamics in a stably stratified antarctic lake during winter darkness. J. Phycol. 2000, 36, 852–861. [Google Scholar] [CrossRef]
  81. Brown, P.C.; Painting, S.J.; Cochrane, K.L. Estimates of phytoplankton and bacterial biomass and production in the northern and southern benguela ecosystems. S. Afr. J. Mar. Sci. 1991, 11, 537–564. [Google Scholar] [CrossRef]
  82. Lee, J.H.; Lee, D.; Kang, J.J.; Joo, H.T.; Lee, J.H.; Lee, H.W.; Ahn, S.H.; Kang, C.K.; Lee, S.H. The effects of different environmental factors on the biochemical composition of particulate organic matter in Gwangyang Bay, South Korea. Biogeosciences 2017, 14, 1903–1917. [Google Scholar] [CrossRef] [Green Version]
  83. Alderkamp, A.C.; Buma, A.G.J.; Van Rijssel, M. The carbohydrates of Phaeocystis and their degradation in the microbial food web. Biogeochemistry 2007, 83, 99–118. [Google Scholar] [CrossRef] [Green Version]
  84. Kim, B.K.; Lee, S.H.; Ha, S.Y.; Jung, J.; Kim, T.W.; Yang, E.J.; Jo, N.; Lim, Y.J.; Park, J.; Lee, S.H. Vertical Distributions of Macromolecular Composition of Particulate Organic Matter in the Water Column of the Amundsen Sea Polynya During the Summer in 2014. J. Geophys. Res. Ocean. 2018, 123, 1393–1405. [Google Scholar] [CrossRef]
  85. DiTullio, G.R.; Smith, W.O. Spatial patterns in phytoplankton biomass and pigment distributions in the Ross Sea. J. Geophys. Res. C Ocean. 1996, 101, 18467–18477. [Google Scholar] [CrossRef]
  86. Fabiano, M.; Danovaro, R.; Chiantore, M.; Pusceddu, A. Bacteria, Protozoa and Organic Matter Composition in the Sediments of Terra Nova Bay (Ross Sea); Ross Sea ecology; Faranda, F., Guglielmo, L., Ianora, A., Eds.; Springer: Berlin/Heidelberg, Germany; Springer: New York, NY, USA, 2000; pp. 159–169. [Google Scholar]
  87. Kim, B.K.; Lee, J.H.; Yun, M.S.; Joo, H.T.; Song, H.J.; Yang, E.J.; Chung, K.H.; Kang, S.H.; Lee, S.H. High lipid composition of particulate organic matter in the northern Chukchi Sea, 2011. Deep Res. Part II Top. Stud. Oceanogr. 2015, 120, 72–81. [Google Scholar] [CrossRef]
  88. Jo, N.; La, H.S.; Kim, J.H.; Kim, K.; Kim, B.K.; Kim, M.J.; Son, W.; Lee, S.H. Different Biochemical Compositions of Particulate Organic Matter Driven by Major Phytoplankton Communities in the Northwestern Ross Sea. Front. Microbiol. 2021, 12, 5. [Google Scholar] [CrossRef]
  89. Young, J.N.; Goldman, J.A.L.; Kranz, S.A.; Tortell, P.D.; Morel, F.M.M. Slow carboxylation of Rubisco constrains the rate of carbon fixation during Antarctic phytoplankton blooms. New Phytol. 2015, 205, 172–181. [Google Scholar] [CrossRef]
  90. Hitchcock, G.L. A comparative study of the size-dependent organic composition of marine diatoms and dinoflagellates. J. Plankton Res. 1982, 4, 363–377. [Google Scholar] [CrossRef]
  91. Berdalet, E.; Latasa, M.; Estrada, M. Effects of nitrogen and phosphorus starvation on nucleic acid and protein content of Heterocapsa sp. J. Plankton Res. 1994, 16, 303–316. [Google Scholar] [CrossRef] [Green Version]
  92. Myklestad, S.; Haug, A. Production of carbohydrates by the marine diatom Chaetoceros affinis var. willei (Gran) Hustedt. I. Effect of the concentration of nutrients in the culture medium. J. Exp. Mar. Bio. Ecol. 1972, 9, 125–136. [Google Scholar] [CrossRef]
  93. Lindqvist, K.; Lignell, R. Intracellular partitioning of 14CO2 in phytoplankton during a growth season in the northern Baltic. Mar. Ecol. Prog. Ser. 1997, 152, 41–50. [Google Scholar] [CrossRef]
  94. Handa, N. Carbohydrate metabolism in the marine diatom Skeletonema costatum. Mar. Biol. 1969, 4, 208–214. [Google Scholar] [CrossRef]
  95. Parrish, C.C. Time series of particulate and dissolved lipid classes during spring phytoplankton blooms in Bedford Basin, a marine inlet. Mar. Ecol. Prog. Ser. 1987, 35, 129–139. [Google Scholar] [CrossRef]
  96. Taipale, S.J.; Galloway, A.W.E.; Aalto, S.L.; Kahilainen, K.K.; Strandberg, U.; Kankaala, P. Terrestrial carbohydrates support freshwater zooplankton during phytoplankton deficiency. Sci. Rep. 2016, 6, 30897. [Google Scholar] [CrossRef] [Green Version]
  97. Corzo, A.; Rodríguez-Gálvez, S.; Lubian, L.; Sangrá, P.; Martínez, A.; Morillo, J.A. Spatial distribution of transparent exopolymer particles in the Bransfield Strait, Antarctica. J. Plankton Res. 2005, 27, 635–646. [Google Scholar] [CrossRef] [Green Version]
  98. Ramaiah, N.; Yoshikawa, T.; Furuya, K. Temporal variations in transparent exopolymer particles (TEPS) associated with a diatom spring bloom in a subarctic ria in Japan. Mar. Ecol. Prog. Ser. 2001, 212, 79–88. [Google Scholar] [CrossRef]
  99. Ortega-Retuerta, E.; Duarte, C.M.; Reche, I. Significance of bacterial activity for the distribution and dynamics of transparent exopolymer particles in the Mediterranean Sea. Microb. Ecol. 2010, 59, 808–818. [Google Scholar] [CrossRef] [Green Version]
  100. Malpezzi, M.A.; Sanford, L.P.; Crump, B.C. Abundance and distribution of transparent exopolymer particles in the estuarine turbidity maximum of Chesapeake Bay. Mar. Ecol. Prog. Ser. 2013, 486, 23–35. [Google Scholar] [CrossRef]
  101. Yamada, Y.; Yokokawa, T.; Uchimiya, M.; Nishino, S.; Fukuda, H.; Ogawa, H.; Nagata, T. Transparent exopolymer particles (TEPS) in the deep ocean: Full-depth distribution patterns and contribution to the organic carbon pool. Mar. Ecol. Prog. Ser. 2017, 583, 81–93. [Google Scholar] [CrossRef] [Green Version]
  102. Lee, J.H.; Lee, W.C.; Kim, H.C.; Jo, N.; Jang, H.K.; Kang, J.J.; Lee, D.; Kim, K.; Lee, S.H. Transparent exopolymer particle (TEPs) dynamics and contribution to particulate organic carbon (POC) in Jaran bay, Korea. Water 2020, 12, 1057. [Google Scholar] [CrossRef] [Green Version]
Figure 1. Location of the Jang Bogo Station (JBS) in Terra Nova Bay, Ross Sea.
Water 13 02173 g001
Figure 2. Salinity and temperature variations at the JBS during our sampling period.
Water 13 02173 g002
Figure 3. Variations in each major inorganic nutrient concentration at the JBS during our sampling period.
Water 13 02173 g003
Figure 4. Variations in POC and total Chl-a concentrations at the JBS during our sampling period.
Water 13 02173 g004
Figure 5. Contributions of different size-fractionated Chl-a concentrations to the total Chl-a concentration (a) and trans parent exopolymer particles (TEPs) concentrations (b) at the JBS during our sampling period.
Water 13 02173 g005
Figure 6. Contribution of phytoplankton communities at the JBS during our sampling period.
Water 13 02173 g006
Figure 7. Variations in concentrations (a) and relative contributions (b) of carbohydrate (CHO), protein (PRT), and lipid (LIP) concentrations (a) at the JBS during our sampling period.
Water 13 02173 g007
Figure 8. Seasonal variations in the caloric content of FM at the JBS during our sampling period.
Water 13 02173 g008
Figure 9. Correlations between log TEP concentrations and log Chl-a (a) and between log TEP concentrations and log fucoxanthine (b) at the JBS during our sampling period.
Water 13 02173 g009
Figure 10. Seasonal variations in percent TEP-C of total POC at the JBS during our sampling period.
Water 13 02173 g010
Figure 11. Principal component analysis based on environmental factors and biochemical variables.
Water 13 02173 g011
Table 1. Pearson’s correlation analysis for the environmental factors and biochemical variables.
123456789101112131415
1. Salinity1−0.93 **0.88 **−0.58 **−0.61 **−0.52 *−0.72 **−0.60 **−0.68 **-−0.82 **−0.50 *-−0.81 **−0.77 **
2. Temperature 1−0.88 **0.61 **0.63 **0.55 *0.66 **0.62 **0.64 **-0.71 **--0.80 **0.73 **
3. NO3 + NO2 1−0.59 **−0.86 **−0.76 **−0.87 **−0.82 **−0.86 **−0.50 *−0.68 **−0.71 **-−0.94 **−0.92 **
4. NH4+ 1-----0.76 **0.68 **----
5. POC 10.87 **0.80 **0.87 **0.80 **-0.47 *0.76 **-0.90 **0.92 **
6. Chl-a 10.83 **0.97 **0.77 **--0.80 **-0.88 **0.83 **
7. TEPs 10.89 **0.95 **-0.49 *0.90 **-0.89 **0.87 **
8. Diatoms 10.87 **--0.85 **-0.94 **0.87 **
9. Dinoflagellates 1-0.54 *0.90 **-0.88 **0.86 **
10. P. antarctica 10.62 **----
11. Cryptophytes 1--0.61 **0.67 **
12. Other phytoplankton 1-0.78 **0.78 **
13. CHO 1--
14. PRT 10.97 **
15. LIP 1
“-” indicates not significant, * p < 0.05, ** p < 0.01.
Table 2. Comparison of the TEP concentrations between this and previous studies from the Southern Ocean.
RegionSeasonDepth (m)TEP Range (Mean)TEPs/Chl-aTEPs–Chl-a RelationshipReferences
(µg Xeq. L−1)(Mean)(Log Converted)
Anvers IslandsummerSurface10–407 (207)12–708 (123)Not relatedPassow et al. (1995)
[35]
Ross Seasummer0–1500–2800 (308)89.1y = 3.63x + 1.01Hong et al. (1997)
[36]
Bransfield Straitsummer0–1000–346 (57)51y = 0.32x + 1.63Corzo et al. (2005)
[97]
Gerlache Straitsummer0–1000–28332.7y = 0.67x + 1.52Corzo et al. (2005)
[97]
Northern
Weddell Sea
summerSurface39.2–177.6 (102.3)79.3y = 0.35x + 1.90Zamanillo et al. (2019)
[34]
Antarctic Peninsulasummer0–2000–48.9 (15.4)0–1492 (40.9)y = 0.38x + 1.08Ortega-Retuerta et al. (2009) [29]
Jang Bogo StationsummerSurface 45.15–96.1 (73.0)38.9–404.3 (165.9)y = 0.33x + 1.87This Study
Jang Bogo StationwinterSurface 10–33.5 (17.9)371.1–2807.5 (1477.9)Not relatedThis Study
Publisher’s Note: MDPI stays neutral with regard to jurisdictional claims in published maps and institutional affiliations.

