
Size Characteristics of Sediments Eroded under Different Masson Pine Litter Covers in South China


School of Soil and Water Conservation, Beijing Forestry University, Beijing 100083, China
*
Author to whom correspondence should be addressed.
Water 2021, 13(16), 2190; https://doi.org/10.3390/w13162190
Submission received: 12 July 2021
/
Revised: 2 August 2021
/
Accepted: 7 August 2021
/
Published: 11 August 2021
(This article belongs to the Section Soil and Water)
Abstract
:The particle size distribution characteristics of runoff sediments are vital for understanding the effect of the mechanism of soil erosion on slopes. The objective of this study was to investigate the particle-size distribution of sediments eroded from slopes covered by different litter coverage masses under artificial rainfall simulation. Litter was spread on the surface of a soil tank according to different biomasses (0 g·m−2, 100 g·m−2, 200 g·m−2 and 400 g·m−2). The mean weight diameter (MWD), fractal dimension (D) and enrichment ratio (ER) are characteristic parameters of sediment particle size. The MWD and D were more sensitive to soil erosion and had a significant negative correlation with the slope angle and rainfall intensity. The performance of the MWD on the slope (5°) was less than the MWD on the slope (10°). The relationship between eroded sediment distribution characteristic parameters and the litter coverage mass had a significant influence on the content of coarse particles. The content of fine particles accelerated, decreased and then stabilized, whereas coarse particles increased first and then stabilized. The litter diameter and surface area were the main parameters that affected the MWD and D. Under different rain intensities and slopes, the ER varied inconsistently with litter coverage mass. Coarse particles were eroded easily and selectively, and soil erosion had no sorting effect on fine particles. These findings support the quantitative study of the relationship between the amount of litter coverage mass and the particle size of soil sediments.
1. Introduction
Soil erosion is a major environmental problem in China [1]. Rainfall is the main natural factor of soil erosion. Erosive rainfall often occurs in summer in Hubei Province, and the rainfall intensity can reach 120 mm·h−1. Strong soil erosion directly threatens the sustainable development of the regional economy and ecological environment. High levels of rainfall affect soil detachment and transport [2]. Piacentin [3] analyzed the soil erosion status in Italy and estimated that the triggering threshold for heavy soil erosion is 100 mm–110 mm. Raindrops damage the surface soil structure, increase the turbulence of slope runoff, and improve the erosion ability of slope runoff [4,5]. When raindrops impact the soil surface, raindrop energy is used to overcome the bonds that hold particles in the soil surface [6]. Artificial simulated rainfall experiments have typically been used to study the effects of variables such as rainfall intensity, rainfall duration, rainfall kinetic energy and raindrop diameter on soil erosion [7,8,9]. Most studies on the erosion process divide it into two stages: the raindrop splash and overland flow erosion stages [10,11]. In the raindrop splash erosion stage, given an equal depth of the flow and raindrop diameter, the amount of splash has been found to increase and then decrease [12]. During the slope runoff stage, raindrops have been found to change the flow pattern of the sheet flow and enhance the sand-carrying capacity of the slope runoff [13]. In one study, after eliminating the impact of raindrops, soil erosion on the slope in a black soil area was reduced by 59.4–71% [14]. Studying the change process of soil erosion under rainfall conditions is thus vital to reduce soil erosion.
Research on the process of forest soil loss must consider the impact of litter. The litter layer is one of the three hydrologic layers in the forest ecosystem and is crucial for controlling soil erosion [15]. Liu [16] studied the effects of the undecomposed layer and semi-decomposed layer of Quercus variabilis litter on soil erosion, and found that they reduced the runoff rate by 10.91–27.04% and 12.91–36.05%, respectively. The litter layer can consume the kinetic energy of raindrops, delay the runoff generation time, decrease the impact of the surface soil erosion ratio, reduce soil erosion and improve soil infiltration [17]. Litter types, coverage, quality, and other variables have an impact on slope soil erosion. Wang [18] compared the slopes covered by locust, pine, caragana and switchgrass with bare slopes and confirmed that the soil loss rate was reduced by 91%, 35%, 74% and 80%, respectively. Li [19] contrasted two typical litters on the loess plateau and found that the flow velocity on the slope decreased with the increase of litter cover as a power function. Shi [20]) examined the differences in erosion rates under six litter species coverage treatments and established that the erosion rate decreased exponentially as the coverage increased. Therefore, the functional relationship between litter mass and soil eroded sediment particle size is the research focus herein, and understanding this relationship will be beneficial to forest land water and soil conservation. In another study, soil particle separation and erosion were affected by rainfall and runoff [21], and they have been determined to have the character of sediment size separation [22,23]. The size characteristics of sediment particle size distribution reflect the interaction mechanism between slope runoff and soil particles, and it is important to analyze the response mechanism of sediment to flow hydrodynamics in the soil erosion process [24,25,26]. Furthermore, rainfall kinetic energy influences sediment grading [27].
In another study, given its large coarse particle mass and transport difficulty, the sediment particle size was smaller than the original soil [28]. The particle size characteristics of precipitants, in other studies, have mostly been determined by wet screening and a laser particle size analyzer [29,30]. Hao [31] used a wet-sieving method to examine the particle size characteristics of runoff sediment under natural rainfall, and confirmed that the accumulation degree of sediment depends on the clay content of the source. Yang [32] utilized laser particle size to measure the particle size characteristics of sediment under splash erosion and surface erosion, and verified that the degree of separation of each particle size of the eroded sediment increased with the extension of rainfall duration. At present, the research on sediment particle size distribution is mostly measured by instruments. Furthermore, the soil particle size analyzer has a high accuracy relative to that of the traditional wet screen method.
The transport and deposition capacity of the runoff to sediment is related to the sediment particle size, and the erosion form determines the particle size characteristics of eroded soil [33]. The masson pine forest land in southern China has a large litter coverage mass. This is due to the high density of the masson pine forest, the small amount of sunlight in the forest, and the fact that the litter is slow to decompose. Litter is closely connected to the soil layer and directly affects the process of soil erosion. At present, research on the hydrological effects of litter mostly focuses on flow reduction and sediment reduction. Few scholars have quantitatively studied the influence of litter on the sorting characteristics of eroded sediment. The water holding capacity of the Masson pine litter undecomposed layer is much larger than that of semi-decomposed and decomposed layers. Therefore, we only considered the effect of the undecomposed layer of litter on the particle size separation of the sediment. The objectives of the present study were to (1) analyze the characteristics of sediment particle size distribution in runoff under the Pinus massoniana litter coverage and (2) explore the functional relationship between the characteristic parameters of sediment particle size distribution and litter biomass, and rainfall intensity and slope angle.
2. Materials and Methods
2.1. Study Site and Soil Samples
Experimental materials were from the Pinus massoniana forest in the Taizi Mountain Farm, Hubei Province, China. The test forest coordinate (30°59′20″ N, 114°28′05″ E) shows that the viscous yellow brown soil is developed from the parent material of loess. The U.S. Soil Taxonomy (USDA, 1999) classifies these soils as Alfisol. The test materials were from the Taizi Mountain Farm. The test forest is located in the transition zone of north and south China, and has an annual average temperature of 16.4 °C and an altitude of 403–467.4 m. The forest belongs to a subtropical monsoon humid climate area, with the obvious karst landform. The forest coverage rate is 82.0%, and the vegetation consists of Pinus massoniana, Cunninghamia lanceolata and various broad-leaved tree species. Rainfall is concentrated in summer, with an average annual rainfall of 1094.6 mm. The soil particle size composition in this experiment is clay (<0.002 mm), fine silt (0.002–0.02 mm), coarse silt (0.02–0.05 mm), fine sand (0.05–0.25 mm), medium sand (0.25–0.5 mm), and coarse (0.5–1 mm), and very coarse sand (1–2 mm), which account for the following respective proportions: 32.22%, 52.09%, 9.947%, 1.627%, 1.297%, 1.733%, 1.086%.
2.2. Soil Tank Filling Test
Stratified sampling was carried out in Pinus massoniana forest land, with 40 cm of soil for a total of four layers obtained. The soil samples were then dried and crushed with a soil crusher and sifted through a 2 mm sieve to remove weeds and stones. The bottom of the soil tank was laid with 0.1m fine sand. To ensure uniform water infiltration, a layer of gauze was laid on the fine sand layer. Soil tanks (specification: length 5 m × width 2 m × height 0.5 m) were filled according to the bulk density and moisture content of each layer of soil during sampling. Runoff sediment sampling started after slope runoff generation, with the time interval of every 2 min in the first 10 min and every 10 min in the last 50 min used.
2.3. Rainfall Simulation Experiment
An artificial simulated rainfall experiment was performed using QYJY-503C simulation system in the Jiufeng experimental base of Beijing Forestry University, during which the collection of runoff and sediment samples was completed (Figure 1). The advantages of a rotary down spray nozzle are as follows: (1) the spray has an initial speed when spraying water, and this feature can ensure that the raindrops reach the end speed when falling; (2) the raindrops produced consist of different diameters, thereby making it easy to obtain a rainfall process similar to the natural counterpart. The spray nozzle height is 12 m, rainfall uniformity is greater than 85%, and the intensity can be controlled between 10 mm·h−1–300 mm·h−1, with a relative error under 1%. According to statistical analysis of the perennial meteorological data and field survey data, the slopes selected were 5° and 10°, rain intensities were 60 mm·h−1 and 120 mm·h−1, and the two rain intensities in this experiment were selected based on the typical summer erosive rain intensity in this area. Litter coverages of 0 g·m−2, 100 g·m−2, 200 g·m−2 and 400 g·m−2 were, respectively, coded as T1 to T4, and the coverage degree was 100% (Table 1). Each treatment was repeated thrice. The typical Masson pine forest land was selected from the Taizi Mountain watershed, and the undecomposed litter of its natural litter was collected. The density of litter was measured by the volume drainage method. The length, projected area, diameter and surface area of litter were measured by WinRHIZOPro 2.0 image analysis software. The results are shown in Table 2.
2.4. Particle Size Analysis Experiment
First, the sample was dried, and the litter debris was removed with tweezers. Dried sand (0.5 g) was placed into a beaker, to which 10 mL of 10% H2O2 was added (after the removal of organic matter). The beaker was heated with an electric heating plate for approximately two minutes until the reaction was complete, and was then left for 30 min. Then, 10 mL of 5% NaOH (to adjust the pH) was added, and the beaker was reheated. After the reaction was complete, the beaker was cooled. One sample was transferred to a centrifuge tube, distilled water was added, and the supernatant was removed by centrifugation at 2500 r·min−1. This process was repeated for three times until the sample was neutral. Subsequently, 5 mL of 0.5 mol·L−1 (NaPO3)6 (analytically pure) was added, and the beaker was shaken for 5 min to ensure even mixing of the sample. Then, the particle size measurement experiment was started. The instrument used in this experiment was the Marvin Mastersizer 3000 laser particle size meter, which employed the wet method. Referring to the soil particle size classification scheme of USDA, the soil particle size was divided into seven fractions in this study: clay (<0.002 mm), fine silt (0.002–0.02 mm), coarse silt (0.02–0.05 mm), fine sand (0.05–0.25 mm), medium sand (0.25–0.5 mm), and coarse (0.5–1 mm) and very coarse sand (1–2 mm).
2.5. Data Collection and Analysis
The mean weight diameter (MWD) is an indicator reflecting the size distribution of silt particles [34]. The larger the MWD value, the stronger the stability of soil aggregates and the stronger the soil erosion resistance. The MWD is calculated as
In Equation (1), is the average diameter of the sieved agglomerates (mm); is the ratio of the weight of the corresponding particle size to the weight of the sample (%); is the weight (g) of the aggregate with an average diameter of .
The fractal dimension D is the main indicator for describing irregular objects and is a measure of the roughness or complexity of geometric objects or the size of the occupied space. The D of different particle sizes is calculated as
In Equation (2), D is the dimensionless fractal dimension; V(r < ) is the cumulative volume of particles with a particle size smaller than (mm3); is the sum of the volume of each particle size of the soil (mm3); is the average diameter of the largest particle size (mm).
ERi is an important indicator for measuring the effect of soil erosion on the sorting of soil particles. When is > 1, the particle is enriched, whereas when is < 1, the particle is poor. Furthermore, when is close to 1, the particle size is close to the original soil and soil erosion has no sorting effect on it.
In Equation (3), Sedi and Soili are the quality percentages of the particle size i in the sediment and the original soil, respectively.
3. Results
3.1. Characteristics of Sediment Size Change under Litter Coverage
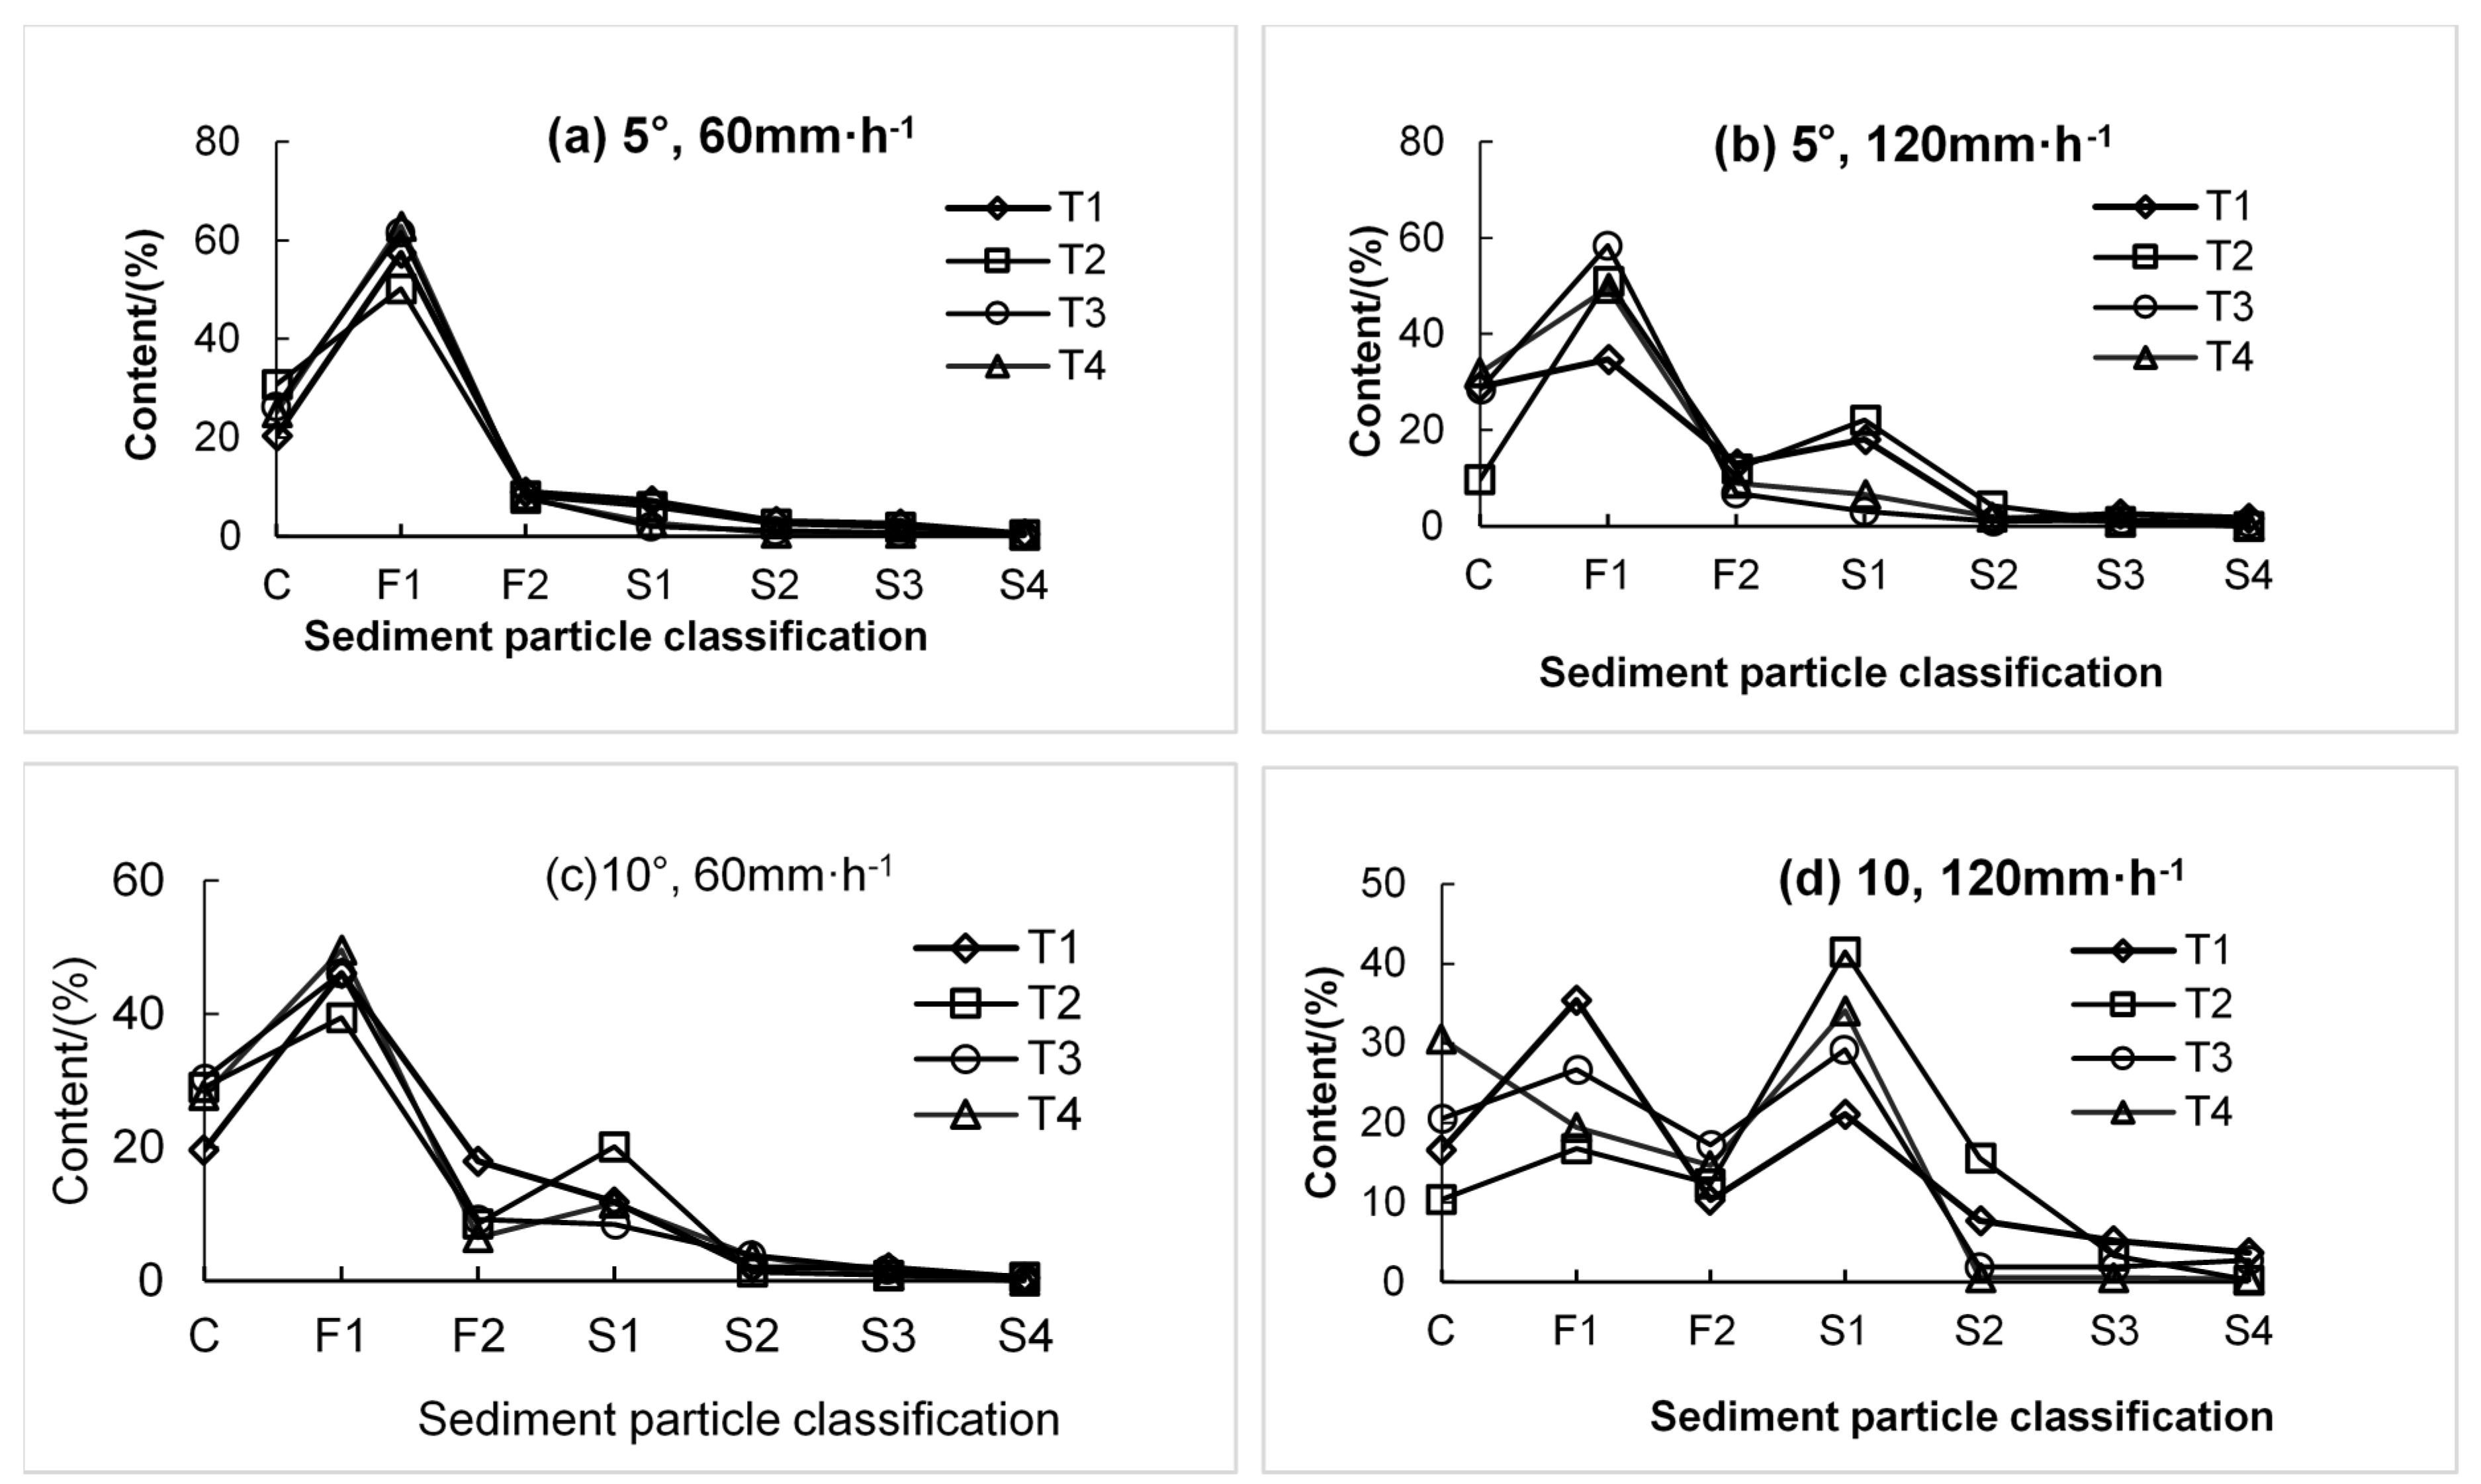
The particle size changes through the horizontal and vertical dimensions and under different treatments were analyzed to explore the characteristics of sediment particle size changes. The eroded sediment particle size composition of the erosion sediment is shown in Figure 2. Regardless of the slope treatment, the content of fine particles (<0.05 mm) of the erosion sediment was much higher than that of coarse particles (>0.05 mm). From a horizontal point of view, the sediment particle size change curve was a bimodal curve, with fine silt (0.002–0.02 mm) and fine sand (0.05–0.25 mm) at two peak points. The particle size distribution of the eroded sediment was affected by the rain intensity and slope. As the rain intensity and slope angle increased, the content of coarse particles (>0.05 mm) increased. When the slope was 10° and the rain intensity was 120 mm·h−1, the litter coverage had a more obvious influence on the particle size distribution of the eroded sediment.
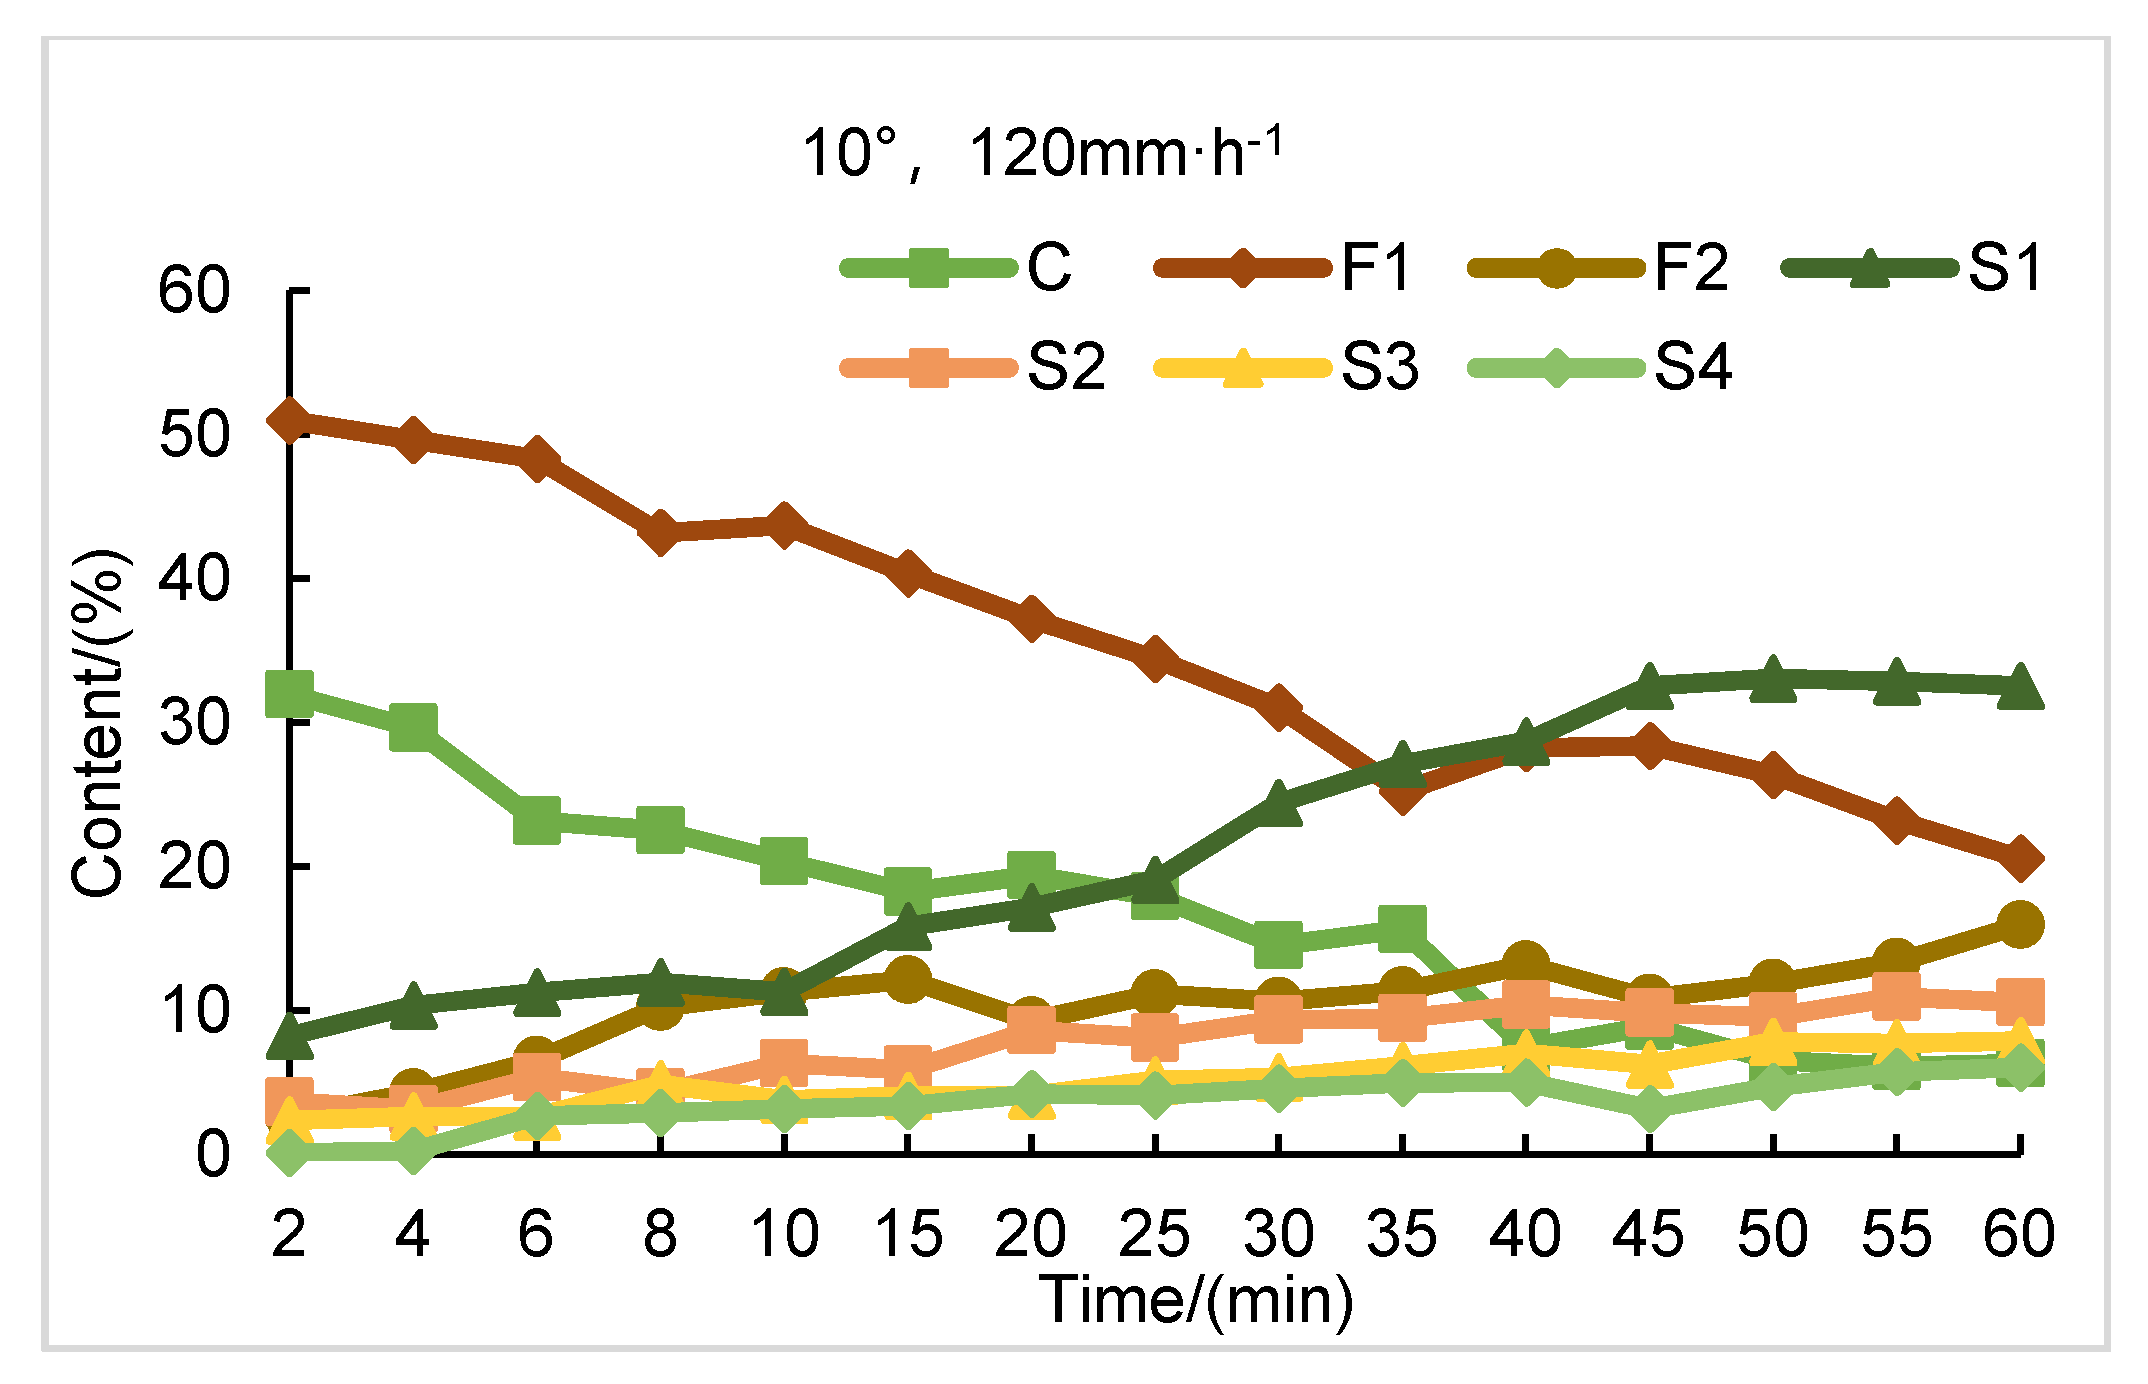
Among many treatments, a rain intensity of 120 mm·h−1, a slope of 10°, and no litter coverage were chosen as the research object. The variation characteristics of the eroded sediment particle size with the rainfall duration are shown in Figure 3. As the rainfall duration increased, the content of clay particles and fine silt particles first accelerated, then decreased and finally stabilized. By contrast, coarse silt, fine sand and medium sand particles increased first and then stabilized. Coarse sand and very coarse sand did not change significantly with rainfall duration, and their content increased slightly with the increase in rainfall duration.
3.2. Separation Characteristics of Eroded Sediment Particles under Different Litter Coverages
3.2.1. Mean Weight Diameter of Eroded Soil Particle Size under Litter Coverage
The MWD can represent the characteristics of the particle size distribution of the sediment. When the content of large particles of eroded sediment is high, the values of the MWD are large. Changes to the characteristic parameter MWD of the eroded sediment particle size distribution under different test treatments is shown in Table 3. The MWD of the eroded sediment under different slope treatments was basically smaller than the MWD of the original soil (Table 3). Therefore, the erosion process of the slope flow was a particle size sorting process. This study uses this indicator to describe the characteristics of sediment particle size distribution under different experimental treatments and further analyses whose eroded soil particle content was the decisive factor of the MWD under this test condition. On the whole, the MWD of the eroded sediment particles varied from 0.024 to 0.163 mm. Under different slopes and rain intensities, the MWD ranges changed when the slope was 5° and 10° to 0.024 mm–0.086 mm and 0.045 mm–0.163 mm, respectively. When the rain intensities were 60 mm·h−1 and 120 mm·h−1, the corresponding MWD ranges were 0.024–0.059 mm and 0.033 mm–0.163 mm, respectively. Under the same rain intensity and litter coverage mass values, comparing the MWD of the sediment particles with different slopes showed that the MWD of the eroded sediment particles was 5° < 10°. Given the same slope, the MWD of the eroded sediment particles produced when the rain intensity was 120 mm·h−1 was greater than the MWD of the sediment when the rain intensity was 60 mm·h−1. Under the same rain intensity and slope conditions, the MWD value decreased with an increase in litter coverage. The MWD had the largest volatility at 10° and 120 mm·h−1 rain intensity, with a drop of 0.92 mm recorded. Under the same litter coverage mass and 60 mm·h−1 rain intensity values, the MWD drop was shown in the slope as 5° > 10°. Finally, when the rain intensity was 120 mm·h−1, the MWD declined substantially on the slope of 10°.
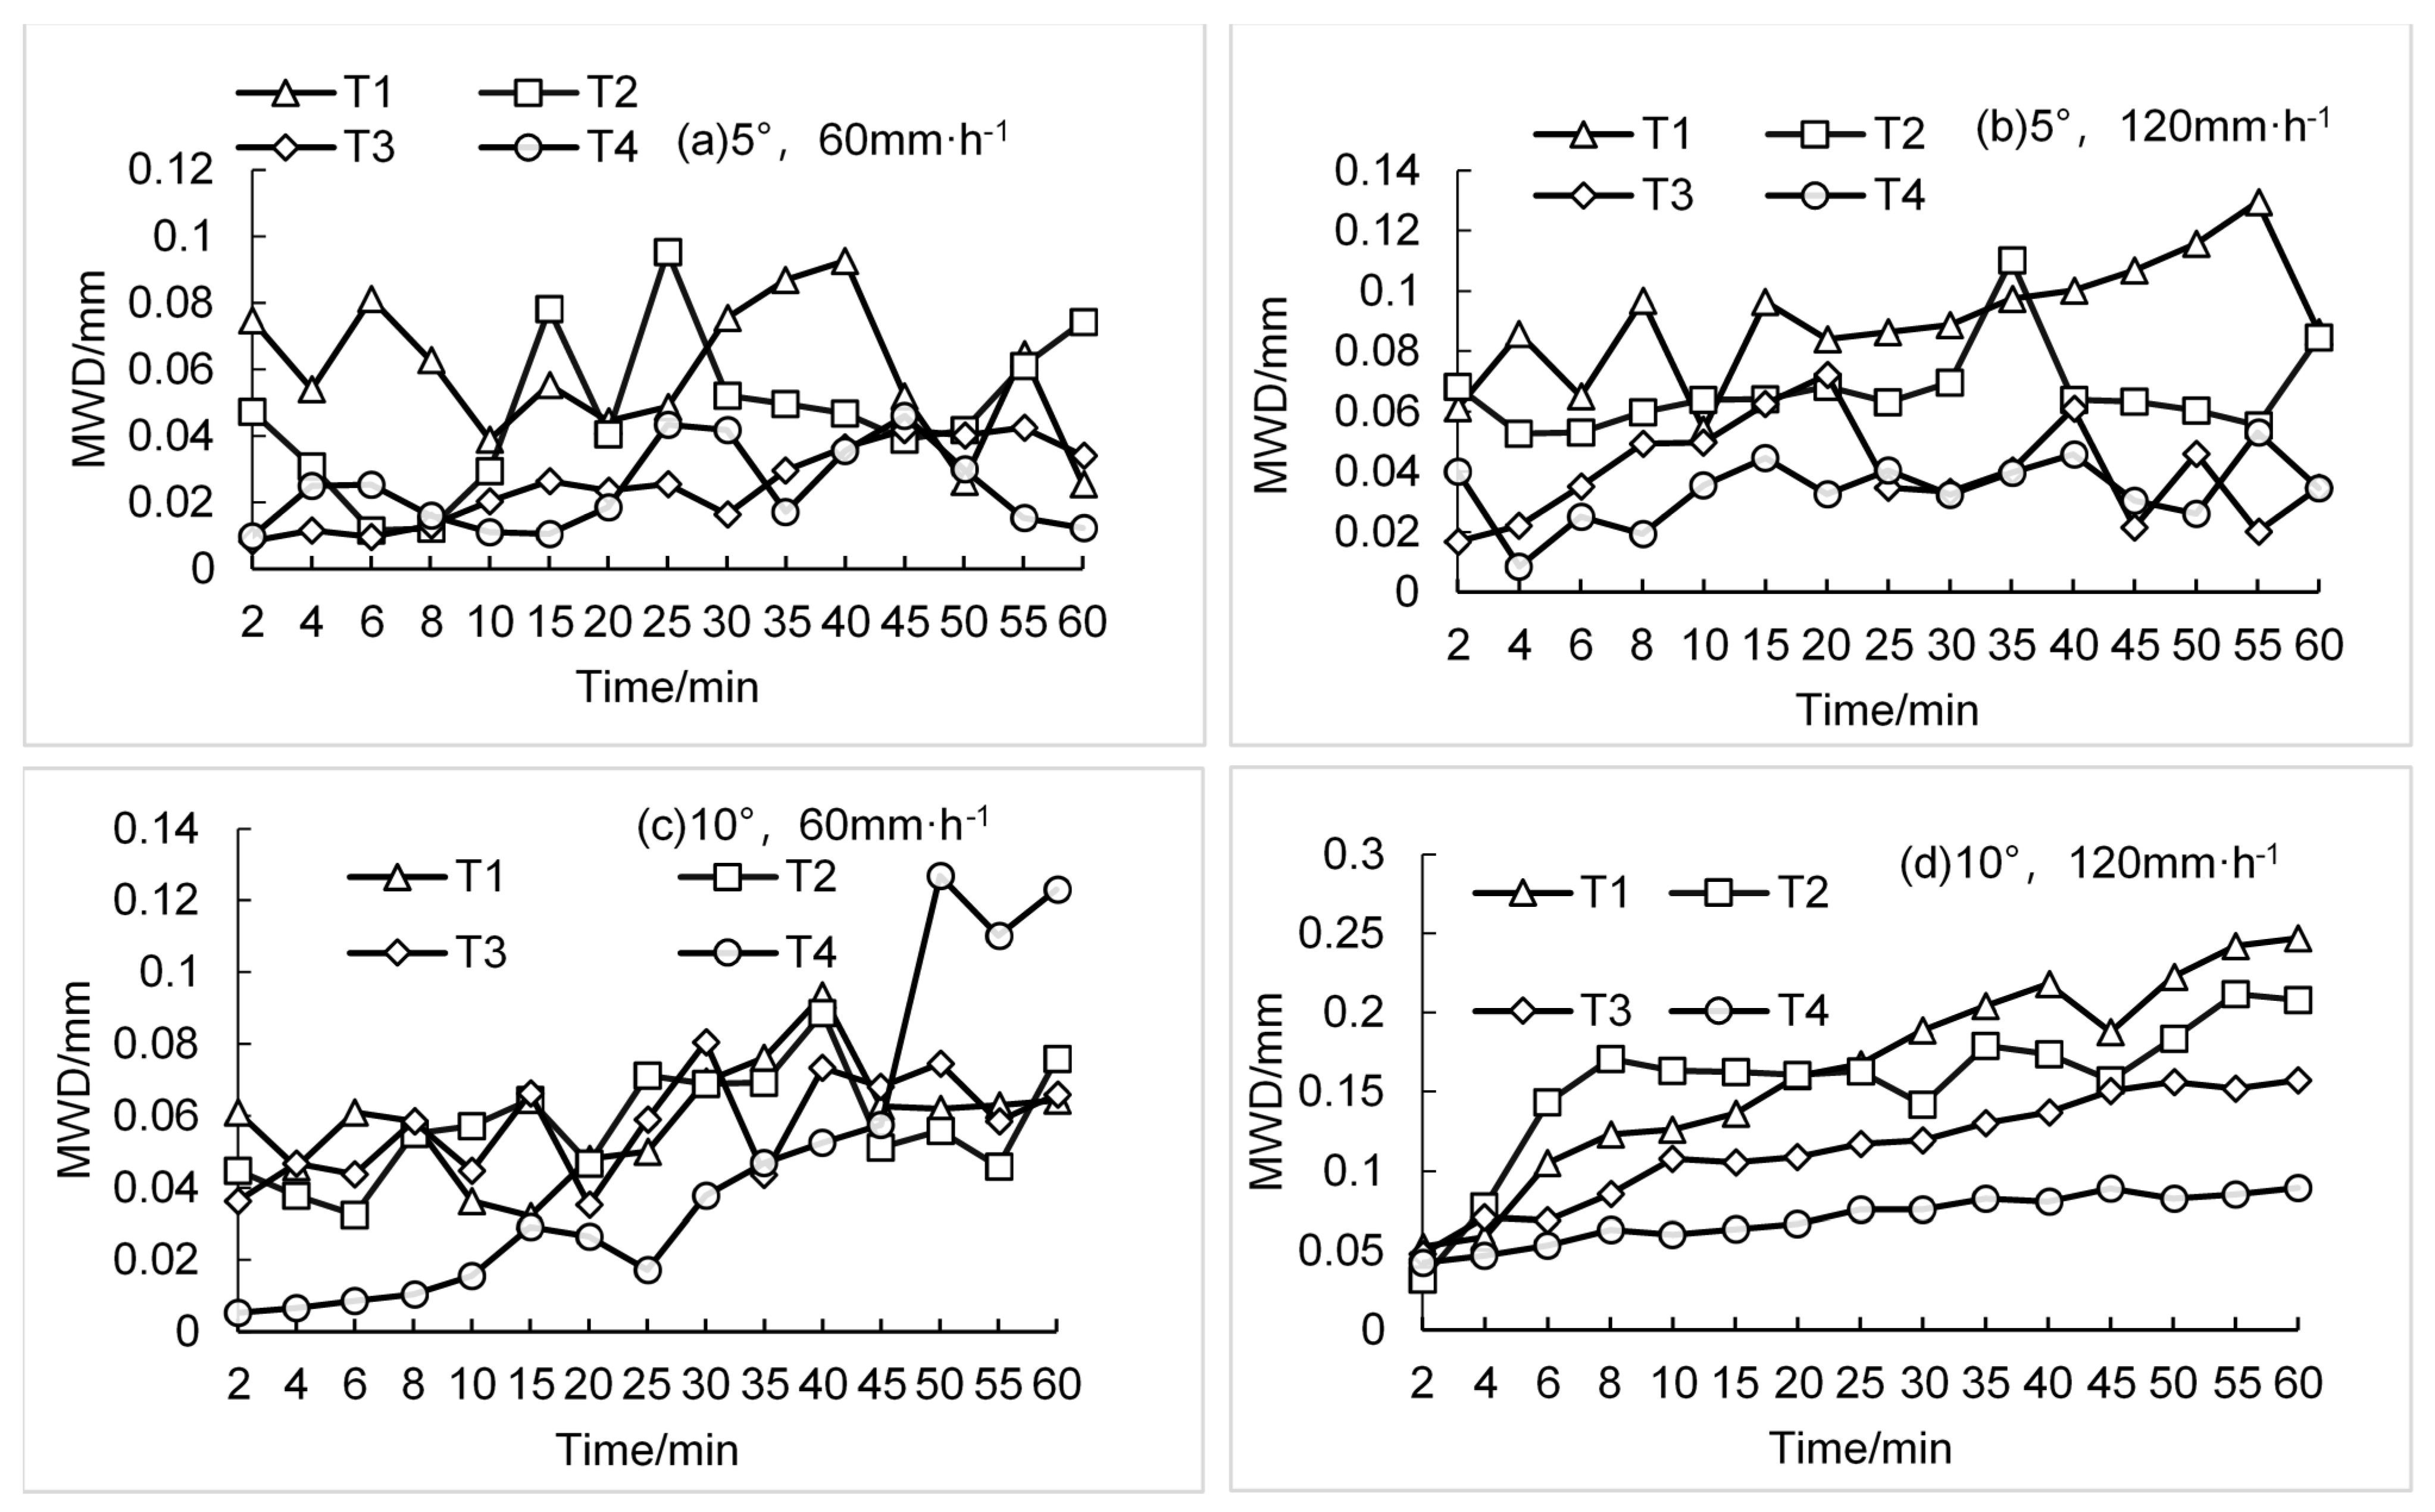
The changes to the MWD over time are shown in Figure 4. The MWD of the eroded sediment gradually increased with the rainfall duration, and the volatility basically decreased with the increase in litter coverage. In Figure 4c, the MWD under the T4 treatment peaked in the last ten minutes of the rainfall duration, and was larger than the MWD under the other three treatments, which was different from the results presented in the other three pictures. This is because the production of eroded sediment is related to the process of soil infiltration. When the rain intensity is small and the slope is large, the infiltration amount is small. Compared with other treatments, when the rain intensity was 60 mm·h−1 and the slope was 10°, it took the longest time for the soil moisture to reach saturation, and the presence of the litter layer increased the resistance to water migration. When the rainfall intensity was small, the slope angle was large, and when the litter cover was large, the amount of sediment increased due to the saturation of soil moisture in the late rainfall period, resulting in the peak of the MWD at the end of rainfall. On the whole, at the 10° slope and 60 mm·h−1 rainfall intensity, the MWD of T2 and T3 were 0.058 and 0.057, respectively. The two values are very close. In Figure 4, both T2 and T3 have great volatility, and the overall trend increases with time. T3 is only higher than T2 at a certain period of time. The reason for this situation is that the rainfall intensity was small, and the erosivity of the slope water fluctuated greatly. Therefore, when the rainfall intensity is small, it is difficult to compare T2 and T3 from a certain time period.
On the whole, at the beginning of rainfall, the MWD of the eroded sediments fluctuated greatly, and then gradually stabilized. The Pearson correlation analysis of the MWD and rain intensity, the slope angle and litter coverage, and the percentage of each particle size component suggested that the MWD had a significant positive correlation with the rain intensity and slope (p < 0.05). As the rain intensity and slope angle increased, the MWD increased. MWD had a negative correlation with litter coverage, and the increase in litter coverage can reduce the MWD.
MWD is determined by the size distribution of sediment particles. After multiple linear regression analyses, the relationship between the MWD of the eroded sediment and the percentage of each particle size component was revealed as follows. Equation (4) indicates that the percentage of fine sand and very coarse sand had the greatest impact on MWD. Under the condition of this test, the value of MWD depends on the content of coarse sand.
C is the percentage of clay components; F1 and F2 are the percentages of fine silt and coarse silt, respectively. S1, S2, S3 and S4 correspond to the percentages of fine sand, medium sand, coarse sand, and very coarse sand, respectively.
MWD = 0.0120 − 0.000143C + 0.00000708F1 + 0.000161F2 + 0.00144S1 + 0.00348S2 + 0.00763S3 + 0.0147S4 R2 = 1.00
3.2.2. The Fractal Dimension D of Eroded Soil Particle Size under Litter Coverage
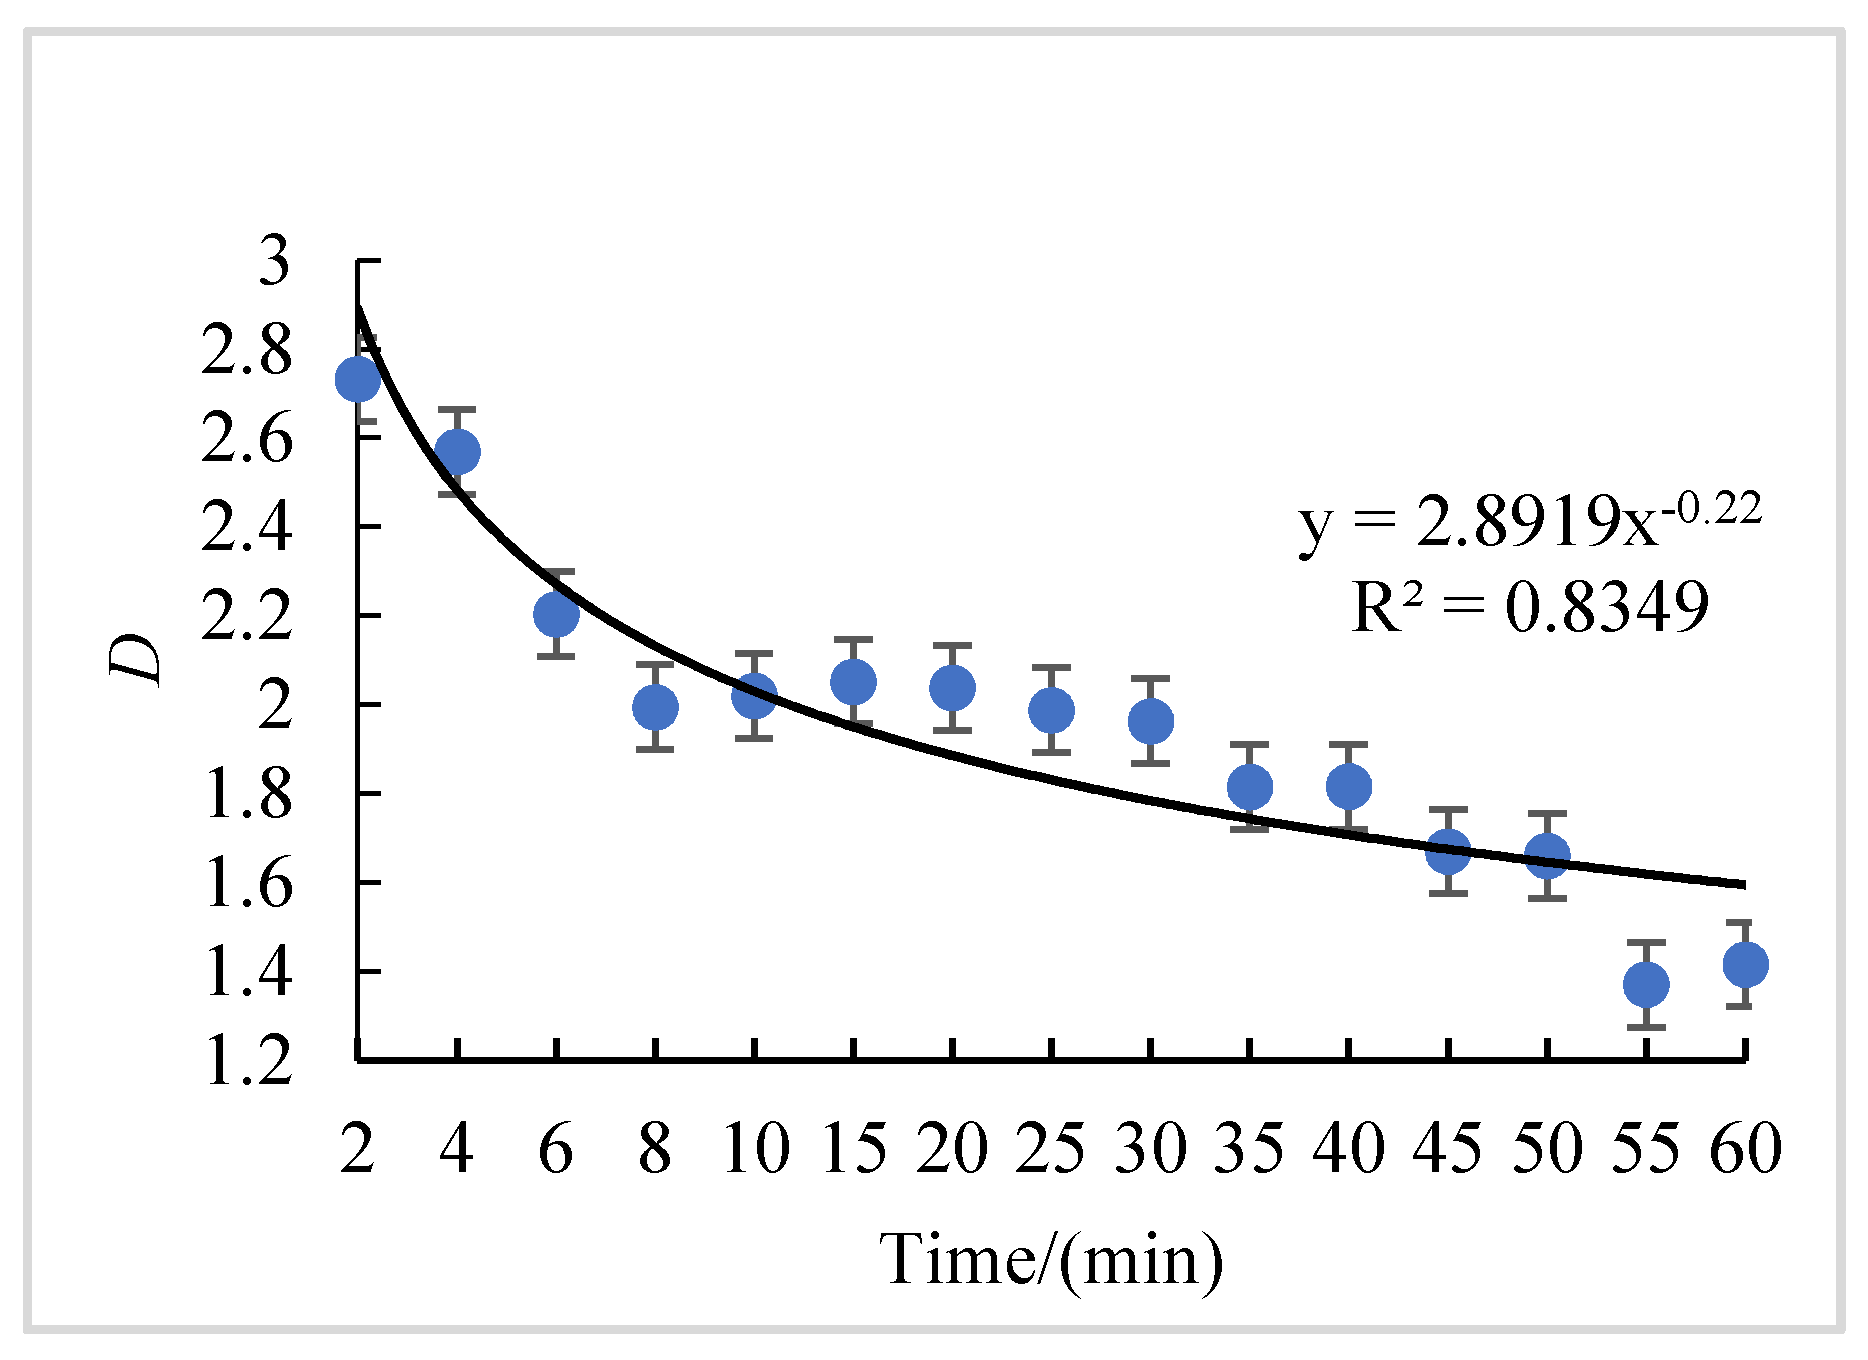
D is the main indicator for describing irregular objects, measuring the roughness or complexity of geometric objects, and describing the characteristics of soil erosion and sediment separation on slopes. Fractal theory models are widely used in the study of soil aggregate water stability and erosion resistance. In this study, when the slope was 5° and 10°, the range of D was 2.605–2.759 and 2.055–2.701, respectively. When the rain intensity was 60 mm·h−1 and 120 mm·h−1, the range of D was 2.600–2.759 and 2.055–2.754, respectively. From the perspective of the same slope angle and litter coverage mass, the variation of the D values in relation to rain intensity was 60 mm·h−1 > 120 mm·h−1, and at 60 mm·h−1, the volatility of D was greater. D had a significant negative correlation with rain intensity (p < 0.05). Under 60 mm·h−1 rain intensity, D increased with the increase in litter coverage mass, but under 120mm·h−1 rain intensity, D decreased first and then increased with the increase in litter coverage mass. A significant linear relationship occurred between particle size and mass fractions smaller than a certain size. In this study, the sediment particles eroded by raindrops had good dynamic characteristics, and their changes with the rainfall duration are shown in Figure 5. Under the rain intensity of 60 mm·h−1 and the slope of 5°, the fractal dimension D of sediment particles gradually decreased with the extension of the rainfall duration.
The decrease was larger in the first 20 min and then gradually became flat. Equation (5) indicates that under the condition of this test, the value of D depends on the content of coarse silt.
where C is the percentage of clay components, F1 and F2 are the percentages of fine and coarse silt, respectively, and S1, S2, S3 and S4 are the corresponding percentages of fine sand, medium sand, coarse sand, and very coarse sand.
D = −0.761 + 0.0406C + 0.0345F1 + 0.039F2 + 0.0277S1 + 0.0137S2 + 0.0265S3 + 0.00211S4
3.2.3. Particle Enrichment Ratio of Eroded Sediment
The enrichment of each particle size component of the eroded sediment under various test conditions is shown in Table 4. Fine particles were mostly less than 1, and coarse particles were mostly greater than 1. From an overall perspective, the enrichment ratio of the eroded sediment coarse particles for rain intensity was 120 mm·h−1 > 60 mm·h−1. Under 120 mm·h−1 rain intensity, coarse particles readily reached a state where the enrichment ratio was greater than 1. Coarse particles were easily and selectively eroded, and soil erosion had no sorting effect on fine particles. Under 120 mm·h−1 rain intensity, the enrichment of the eroded sediment fine particles was greater than in the case of a slope of 10°.
3.3. Quantitative Relationship between Litter Coverage Mass and Eroded Sediment Particle Separation Characteristic Parameters
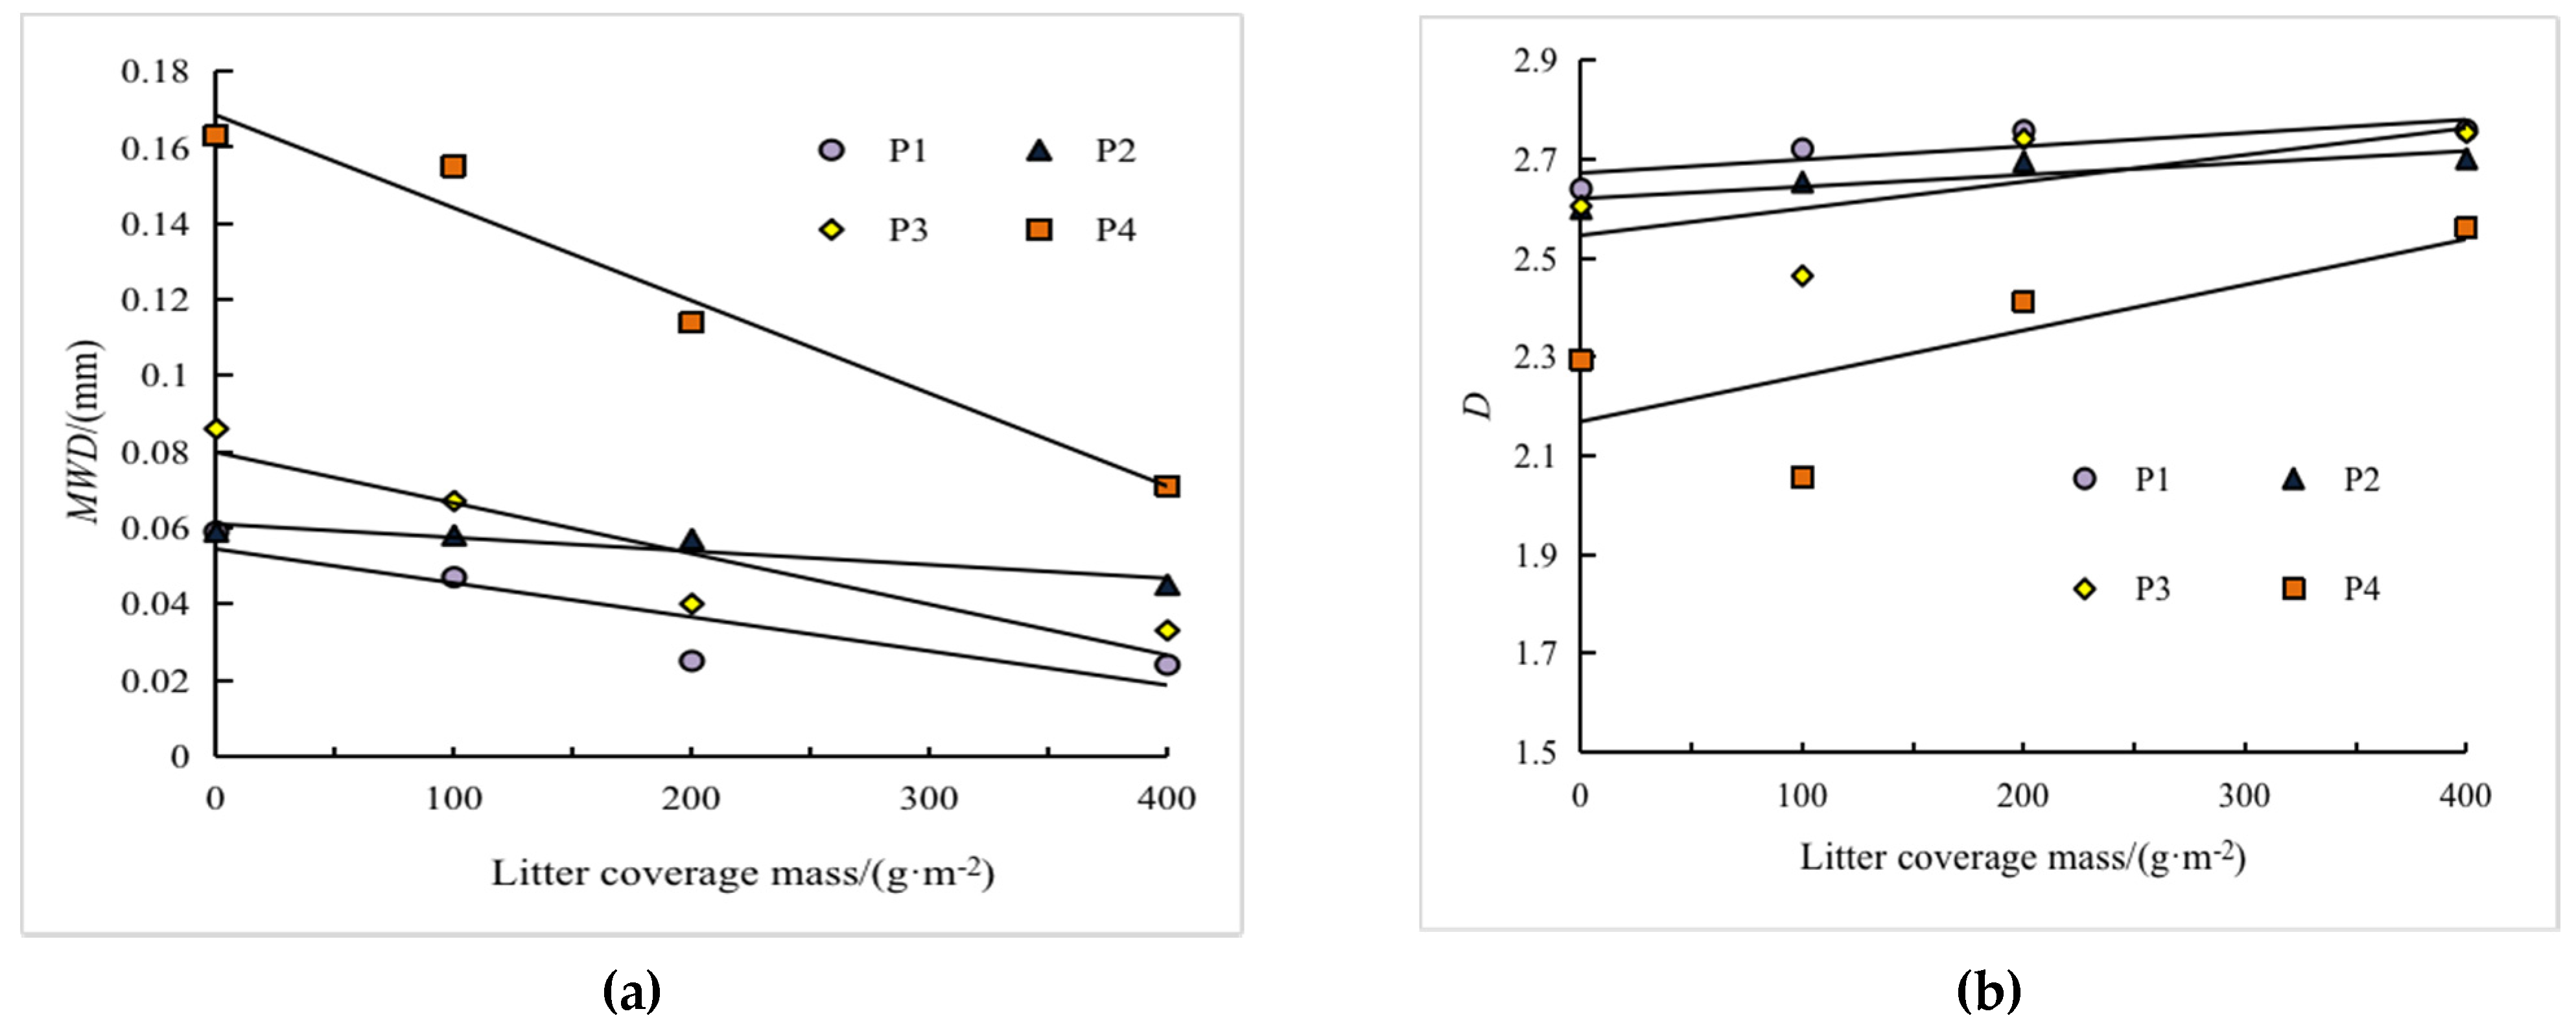
Litter coverage can significantly affect MWD and D. Further analysis showed that the average mass of MWD, D and litter coverage had a significant linear relationship (0.4655 ≤ R2 ≤ 0.9662; Figure 6 and Table 5). Moreover, MWD decreased and D increased with the increase in litter coverage mass. According to the above findings, the litter characteristic parameters (Table 2) were added to characterize the influence of litter characteristics on the sorting characteristics of the eroded sediment. The results of stepwise regression (Table 6) show that the characteristic parameters of erosion and sediment on each slope can be expressed as a power function relationship between the characteristic parameters of litter and runoff. The slope of the trend line at a 10° slope and 60 mm·h−1 rainfall intensity in Figure 6 is lower than other curves, but the overall trend is consistent. This is due to the significant relationship between runoff shear force and runoff. When the runoff was small, the change in the amount of litter cover did not have a significant effect on the runoff shear force. Further, the greater the slope, the less the surface soil infiltration, and the greater the shear force required for soil separation. Combining the above two factors, when the slope was 10° and the rainfall intensity was 60 mm·h−1, the slope of the trend line was smaller.
4. Discussion
The litter layer is an important hydrological layer that controls the conversion of water and energy between the atmosphere and the soil under the forest canopy, and its water conservation capacity is closely related to the accumulation of litter. Only calculating the total amount of sediment without further clarifying the transport methods of different sizes of sediment will not reveal the erosion process and mechanisms in depth [35]. The rainfall erosion process is divided into two parts: raindrop splash erosion and runoff erosion. The kinetic energy of raindrops is transformed into a splash erosion force perpendicular to the ground surface and the runoff shear force parallel to the slope. In this study, the content of fine particles in eroded sediment was greater than that of coarse particles, an outcome which was consistent with the original soil condition, thereby indicating that soil erosion is closely related to soil texture. The soil texture in the experimental area was yellow brown loam, and the particles with a particle size of less than 0.02 mm accounted for more than 50% of all particle sizes. Therefore, the variation range of MWD and D of the eroded sediment in this study was 0.024–0.163 mm and 2.055–2.759 mm. After the sediment particles underwent raindrop splash erosion and runoff erosion, the large particles were separated into small ones. Moreover, sediment particles with a diameter under 0.25 mm accounted for approximately 95% of the total sediment. Fine silt (0.002–0.02 mm) and fine sand (0.05–0.25 mm) had the largest particle size variation range, and this result was significantly correlated with the slope angle and rain intensity. This outcome may be because fine powder (0.002–0.02 mm) and fine sand (0.05–0.25 mm) are the smallest single particles of powder and sand, respectively. During erosion, powder and sand are transported and handled, and the aggregates are broken to form fine powder and sand. Clay particles mostly exist in the form of agglomerates, thereby resulting in two peaks of fine silt and fine sand in the sediment particle size change curve.
Affected by many factors such as rain intensity and slope and flow type, the characteristics of eroded sediment particles in Hubei showed significant differences. An increase in rain intensity led to an increase in the splashing erosivity perpendicular to the slope; the coarse particles peeled off the original soil and the coarse particle content in the eroded sediment increased. Litter covers the surface of the soil on the slope and can reduce the kinetic energy of raindrops, increase the roughness of the underlying surface and block runoff erosion. It was found that overland flow had a shielding effect on raindrops. Figure 1 shows that the composition of sediment particle size changes greatly at the beginning of rainfall. In the early stage of rainfall, the change of sediment particle size was mainly affected by the original soil. As the rainfall duration increased, raindrop erosivity and runoff erosivity had an impact on the eroded sediment particle content. The change in sediment particle content was mainly affected by raindrop splash erosion [32]. As the rainfall duration increased, overland runoff became the main driving force for soil separation. Clay particles and fine powder particles generally exist in the form of aggregates. Their small mass causes them to be largely separated from the soil surface during the raindrop splash erosion stage. In this study, by the runoff erosion stage, the content of soil surface clay particles and fine powder particles had already diminished.
When raindrops are splashed and eroded by runoff, the low-mass sediment is more easily stripped off from the original soil and transported. Slope angle and rain intensity are important factors affecting soil erosion. Analyzing the physical process of rainfall erosion (and ignoring the effect of wind) revealed that the kinetic energy of raindrops is transformed into a splash erosion force perpendicular to the ground surface and shear force parallel to the slope. Under the same rainfall conditions, the slope shear force increases as the slope angle increases, and large-size soil particles are easier to transport. When the rainfall intensity was 60 mm·h−1, the erosion sediment MWD in the slope of 10° was larger than that in the slope of 5°. When the slope was the same, producing a large runoff was easy under the action of heavy rain, which made the large-sized soil particles decompose into small-sized ones. Under the influence of gravity, overland flow and velocity increased with the increase in slope angle, thereby leading to an increase in the ability of runoff to transport sediment and an increase in the content of larger sand particles in the sediment. The amount of litter cover was directly proportional to the thickness. According to the kinetic energy formula, the increase of the migration route of raindrops in the litter layer will reduce the erosivity. The larger particles in the sediment are not readily transported, and the sand content is reduced.
The MWD of the test soil particles were larger than those of the eroded sediment, thereby proving that the erosion process of the runoff is a particle size sorting process. D intuitively expresses the sediment separation characteristics of different slopes under rainfall conditions. According to Formula (5), the decisive factor of the value of D is the content of coarse silt. When D is larger, more fine particles occur among the sediment particles. MWD is also determined by the particle size distribution of sediment particles, so its variation with the rainfall intensity (p < 0.05), slope (p < 0.05) and litter coverage mass corresponds to the variation in the percentage of particle size components with these variables. In this study, the MWD of eroded sediment was mainly affected by the content of coarse sand. With an increase in slope angle and rain intensity, the amount of erosion and migration of coarse particles will increase when the rainfall erosivity and runoff shear force increase simultaneously, and MWD will increase accordingly. Therefore, MWD decreased with the increase in litter coverage mass. The change to D was opposite of that to MWD, and the decisive factor for this feature was the fine particle content. The litter covering the slope surface caused uneven roughness of the slope surface. When flow shear stress fluctuates, the particle size of the sediment is poorly graded, and obvious steps arise. When the rainfall intensity is strong, the raindrops will produce large-volume aggregates in the erosion stage. Given the large runoff, the aggregates flow on the slope for a short time. Unstable factors are involved in the separation process of soil aggregate particles, so the change in D is not always obvious. In this study, according to the correlation analysis, the slope and D showed a significant negative correlation. Under certain rain intensity conditions, the slope runoff decreased with a decrease in the slope angle, reduced the water flow shear force τ and water flow power ω, increased the fluctuation of the sediment particle size separation process, reduced the eroded sediment coarse particle content, and increased D. The ER of the eroded sediment particles was greater than 1, thereby indicating that the particles were enriched. As the intensity of the rain and steepness of the slopes rises, the process of soil separation intensifies, and the capacity of water flow to transport sediment increases the coarse particle content. The strong particle size sorting results in the gradual coarsening of eroded soil. In the study, the enrichment ratio of the coarse particles (particle size < 50 μm) was basically greater than 1, and the enrichment ratio of fine particles (particle size > 50 μm) was usually below 1. Under different rain intensities and slope angles, the ER varied inconsistently with the litter coverage mass. Generally, however, when the rain intensity was 120 mm·h−1, the coarse grain ER was larger. This outcome was consistent with the change in the eroded sediment content. When the rainfall intensity was 120mm·h−1, the coarse ER of the eroded sediment was 5.678 than that of the fine ER.
According to Figure 6 and Table 4, a linear relationship occurred between the litter coverage mass and eroded sediment separation characteristic parameters. Under different rain intensity and slope conditions, the M WD of the eroded sediment decreased and D increased with the increase in litter coverage. According to Table 5, litter diameter and surface area were the main litter characteristic parameters that affected MWD and D. Litter is distributed on the surface, and the increase in its surface area leads to an increase in surface coverage which, in turn, will reduce the kinetic energy of raindrops and have a significant impact on the small particles of the sediment.
5. Conclusions
The litter layer plays a role in the distribution of eroded sediments by affecting the impact and runoff erosion forces. The particle size distribution of eroded sediment is the result of impact and runoff erosion forces. In this study, the sorting characteristics of eroded sediment under different rainfall intensities, slopes and litter coverage masses were analyzed. The results show that: (1) under the test conditions, the content of fine particles in the eroded sediment was much greater than that of coarse particles. With an increase in rainfall duration, the contents of fine particles first decreased and then tended to be stable, whereas the coarse particles increased first and then stabilized. (2) Under different litter coverage masses, the MWD of eroded sediment particles varied from 0.024 to 0.163 mm, and the D of the eroded sediment particles varied from 2.055 and 2.759. MWD is determined by the content of coarse particles in the eroded sediment, and D is determined by the content of fine particles. The variation in the soil particle enrichment ratio in this study was: fine particles were basically less than 1, and coarse particles were basically greater than 1. Coarse particles were easily and selectively eroded, and the process of soil erosion had no obvious sorting effect on fine particles. When the rainfall intensity was 120 mm·h−1, the enrichment ratio of coarse sediment was 5.678 times than that of fine sediment. (3) Litter diameter and surface area were the main parameters that affected MWD and D. The litter average diameter had a positive correlation with MWD and D, and litter surface area had a negative correlation with MWD and D. The litter layer affected the eroded sediment particle size sorting process by affecting the splash erosion force and runoff shear force. These results examined the process of soil particle separation and the influence of rainfall and leaf characteristics on soil erosion control.
Author Contributions
Conceptualization, F.Z. and Y.L.; methodology, F.Z., Y.L. and J.C.; software, F.Z.; validation, F.Z. and J.C.; formal analysis, F.Z.; investigation, F.Z.; resources, F.Z., Y.L. and J.C.; data curation, F.Z.; writing—original draft preparation, F.Z., J.C. and Y.L.; writing—review and editing, F.Z.; visualization F.Z.; supervision J.C.; funding acquisition, F.Z. and J.C. All authors have read and agreed to the published version of the manuscript.
Funding
This work was supported by the National Natural Science Foundation of China (32071839).
Institutional Review Board Statement
No studies involving humans or experimental animals were conducted in this research.
Informed Consent Statement
No studies involving humans or experimental animals were conducted in this research.
Data Availability Statement
The data presented in this study are available on request from the corresponding author. The data are not publicly available due to privacy or ethical restrictions.
Acknowledgments
Many thanks to the Taizishan Forest Farm for supporting experiment. We also gratefully acknowledge the editor and reviewers.
Conflicts of Interest
The authors declare no conflict of interest.
References
- Lu, J.; Sun, B.; Ren, F.; Li, H.; Jiao, X. Effect of Freeze-Thaw Cycles on Soil Detachment Capacities of Three Loamy Soils on the Loess Plateau of China. Water 2021, 13, 342. [Google Scholar] [CrossRef]
- Almeida, W.S.d.; Seitz, S.; Oliveira, L.F.C.d.; Carvalho, D.F.d. Duration and intensity of rainfall events with the same erosivity change sediment yield and runoff rates. Int. Soil Water Conserv. Res. 2021, 9, 69–75. [Google Scholar] [CrossRef]
- Piacentini, T.; Galli, A.; Marsala, V.; Miccadei, E. Analysis of Soil Erosion Induced by Heavy Rainfall: A Case Study from the NE Abruzzo Hills Area in Central Italy. Water 2018, 10, 1314. [Google Scholar] [CrossRef] [Green Version]
- Gao, B.; Walter, M.T.; Steenhuis, T.S.; Parlange, J.Y.; Richards, B.K.; Hogarth, W.L.; Rose, C.W. Investigating raindrop effects on transport of sediment and non-sorbed chemicals from soil to surface runoff. J. Hydrol. 2005, 308, 313–320. [Google Scholar] [CrossRef]
- Kinnell, P.I.A. Raindrop-impact-induced erosion processes and prediction: A review. Hydrol. Process. 2005, 19, 2815–2844. [Google Scholar] [CrossRef]
- Ma, R.M.; Li, Z.X.; Cai, C.F.; Wang, J.-G. The dynamic response of splash erosion to aggregate mechanical breakdown through rainfall simulation events in Ultisols (subtropical China). Catena 2014, 121, 279–287. [Google Scholar] [CrossRef]
- Kiani-Harchegani, M.; Sadeghi, S.H.; Singh, V.P.; Asadi, H.; Abedi, M. Effect of rainfall intensity and slope on sediment particle size distribution during erosion using partial eta squared. Catena 2019, 176, 65–72. [Google Scholar] [CrossRef]
- Nearing, M.A.; Bradford, J.M. Single Waterdrop Splash Detachment and Mechanical Properties of Soils. Soil Sci. Soc. Am. J. 1985, 49, 547–552. [Google Scholar] [CrossRef]
- Parsons, A.J.; Abrahams, A.D.; Wainwright, J. Rainsplash and erosion rates in an interrill area on semi-arid grassland, Southern Arizona. Catena 1994, 22, 215–226. [Google Scholar] [CrossRef]
- Zhang, X.C. Determining and Modeling Dominant Processes of Interrill Soil Erosion. Water Resour. Res. 2019, 55, 4–20. [Google Scholar] [CrossRef] [Green Version]
- Wirtz, S.; Seeger, M.; Ries, J.B. Field experiments for understanding and quantification of rill erosion processes. Catena 2012, 91, 21–34. [Google Scholar] [CrossRef]
- Palmer, V.J. Retardance coefficients for low flow in channels lined with vegetation. Eos. Trans. Amer. Geophys. Union 1946, 27, 187. [Google Scholar] [CrossRef]
- Wu, X.; Wei, Y.; Cai, C.; Yuan, Z.; Liao, Y.; Li, D. Effects of erosion-induced land degradation on effective sediment size characteristics in sheet erosion. Catena 2020, 195, 104843. [Google Scholar] [CrossRef]
- Lu, J.; Zheng, F.; Li, G.; Bian, F.; An, J. The effects of raindrop impact and runoff detachment on hillslope soil erosion and soil aggregate loss in the Mollisol region of Northeast China. Soil Tillage Res. 2016, 161, 79–85. [Google Scholar] [CrossRef]
- Descheemaeker, K.; Nyssen, J.; Poesen, J.; Raes, D.; Haile, M.; Muys, B.; Deckers, S. Runoff on slopes with restoring vegetation: A case study from the Tigray highlands, Ethiopia. J. Hydrol. 2006, 331, 219–241. [Google Scholar] [CrossRef]
- Liu, X.; Jia, G.; Yu, X. Effects of the undecomposed layer and semi-decomposed layer of Quercus variabilis litter on the soil erosion process and the eroded sediment particle size distribution. Hydrol. Process. 2021, 35, e14195. [Google Scholar] [CrossRef]
- Sun, L.; Zhang, G.h.; Luan, L.l.; Liu, F. Temporal variation in soil resistance to flowing water erosion for soil incorporated with plant litters in the Loess Plateau of China. Catena 2016, 145, 239–245. [Google Scholar] [CrossRef]
- Wang, L.; Zhang, G.; Zhu, P.; Wang, X. Comparison of the effects of litter covering and incorporation on infiltration and soil erosion under simulated rainfall. Hydrol. Process. 2020, 34, 2911–2922. [Google Scholar] [CrossRef]
- Li, X.; Niu, J.; Xie, B. Study on Hydrological Functions of Litter Layers in North China. PLoS ONE 2013, 8, e70328. [Google Scholar] [CrossRef] [PubMed]
- Shi, Z.H.; Yue, B.J.; Wang, L.; Fang, N.F.; Wang, D.; Wu, F.Z. Effects of Mulch Cover Rate on Interrill Erosion Processes and the Size Selectivity of Eroded Sediment on Steep Slopes. Soil Sci. Soc. Am. J. 2012, 77, 257–267. [Google Scholar] [CrossRef] [Green Version]
- Marzen, M.; Iserloh, T.; Casper, M.C.; Ries, J.B. Quantification of particle detachment by rain splash and wind-driven rain splash. Catena 2015, 127, 135–141. [Google Scholar] [CrossRef]
- Morgan, R.P.C.; Quinton, J.N.; Smith, R.E.; Govers, G.; Poesen, J.W.A.; Auerswald, K.; Chisci, G.; Torri, D.; Styczen, M.E. The European Soil Erosion Model (EUROSEM): A dynamic approach for predicting sediment transport from fields and small catchments. Earth Surf. Process. Landf. 1998, 23, 527–544. [Google Scholar] [CrossRef]
- Streeter, M.T.; Schilling, K.E.; Burras, C.L.; Wolter, C.F. Erosion and sediment delivery in southern Iowa watersheds: Implications for conservation planning. J. Soil Water Conserv. 2021, 76, 103–115. [Google Scholar] [CrossRef]
- Sadeghi, S.H.; Kiani Harchegani, M.; Asadi, H. Variability of particle size distributions of upward/downward splashed materials in different rainfall intensities and slopes. Geoderma 2017, 290, 100–106. [Google Scholar] [CrossRef]
- Pieri, L.; Bittelli, M.; Hanuskova, M.; Ventura, F.; Vicari, A.; Pisa, P.R. Characteristics of eroded sediments from soil under wheat and maize in the North Italian Apennines. Geoderma 2009, 154, 20–29. [Google Scholar] [CrossRef]
- Durnford, D.; King, J.P. Experimental Study of Processes and Particle-Size Distributions of Eroded Soil. J. Irrig. Drain. Eng. 1993, 119, 383–398. [Google Scholar] [CrossRef]
- Wang, L.; Shi, Z.H.; Wang, J.; Fang, N.F.; Wu, G.L.; Zhang, H.Y. Rainfall kinetic energy controlling erosion processes and sediment sorting on steep hillslopes: A case study of clay loam soil from the Loess Plateau, China. J. Hydrol. 2014, 512, 168–176. [Google Scholar] [CrossRef]
- Sutherland, R.A.; Wan, Y.; Lee, C.T.; Ziegler, A.D. Aggregate enrichment ratios for splash and wash transported sediment from an Oxisol. Catena 1996, 26, 187–208. [Google Scholar] [CrossRef]
- Beuselinck, L.; Steegen, A.; Govers, G.; Nachtergaele, J.; Takken, I.; Poesen, J. Characteristics of sediment deposits formed by intense rainfall events in small catchments in the Belgian Loam Belt. Geomorphology 2000, 32, 69–82. [Google Scholar] [CrossRef]
- Yang, Y.; Wendroth, O.; Walton, R.J. Field-Scale Bromide Leaching as Affected by Land Use and Rain Characteristics. Soil Sci. Soc. Am. J. 2013, 77, 1157–1167. [Google Scholar] [CrossRef]
- Hao, Y.; Yang, Y.; Liu, B.; Liu, Y.; Gao, X.; Guo, Q. Size characteristics of sediments eroded from three soils in China under natural rainfall. J. Soils Sediments 2016, 16, 2153–2165. [Google Scholar] [CrossRef]
- Yang, F.Z.; Cheng, H.J.; Zhou, Z.D. The Sediment Particles Characteristics of Splash and Sheetwash in Rocky Mountain Area of Northern China. J. Soil Water Conserv. 2016, 3, 71–77. [Google Scholar]
- Proffitt, A.P.B.; Rose, C.W.; Hairsine, P.B. Rainfall Detachment and Deposition: Experiments with Low Slopes and Significant Water Depths. Soil Sci. Soc. Am. J. 1991, 55, 325. [Google Scholar] [CrossRef]
- Gardner, W.R. Representation of Soil Aggregate-Size Distribution by a Logarithmic-Normal Distribution. Soil Sci. Soc. Am. J. 1956, 20, 151–153. [Google Scholar] [CrossRef]
- Moss, A.J.; Walker, P.H.; Hutka, J. Raindrop-stimulated transportation in shallow water flows: An experimental study. Sediment. Geol. 1979, 22, 165–184. [Google Scholar] [CrossRef]
Figure 1.
Artificial simulation rainfall experiment.

Figure 2.
Particle size composition of the erosion sediment. (a) Particle size composition of the erosion sediment under a slope of 5° and rainfall intensity of 60 mm·h−1; (b) Particle size composition of the erosion sediment under a slope of 5° and rainfall intensity 120 mm·h−1; (c) Particle size composition of the erosion sediment under a slope of 10° and rainfall intensity 60 mm·h−1; (d) Particle size composition of the erosion sediment under a slope of 10° and rainfall intensity 120 mm·h−1. C is clay (<0.002 mm), F1 is fine powder (0.002–0.02 mm), F2 is coarse silt (0.02–0.05 mm), S1 is fine sand (0.05–0.25 mm), S2 is medium sand (0.25–0.5 mm), S3 is coarse sand (0.5–1 mm), and S4 is very coarse sand (1–2 mm).

Figure 3.
Variation characteristics of the eroded sediment particle size with the rainfall duration. C is clay (<0.002 mm), F1 is fine silt (0.002–0.02 mm), F2 is coarse silt (0.02–0.05 mm), S1 is fine sand (0.05–0.25 mm), S2 is medium sand (0.25–0.5 mm), S3 is coarse sand (0.5–1 mm), and S4 is very coarse sand (1–2 mm).

Figure 4.
Changes to the MWD with rainfall duration under different treatment conditions. (a) Changes to the MWD with rainfall duration under a slope of 5° and rainfall intensity of 60 mm·h−1; (b) Changes to the MWD with rainfall duration under a slope of 5° and rainfall intensity of 120 mm·h−1; (c) Changes to the MWD with rainfall duration under a slope of 10° and rainfall intensity of 60 mm·h−1; (d) Changes to the MWD with rainfall duration under a slope of 10° and rainfall intensity of 120 mm·h−1.

Figure 5.
The change of fractal dimension D with time duration. Each error bar in the text is the standard deviation.
Figure 5.
The change of fractal dimension D with time duration. Each error bar in the text is the standard deviation.

Figure 6.
The relationship between eroded sediment separation characteristic parameters and litter coverage mass. Relationship between MWD (a), D (b) and litter coverage mass under different slopes and rainfall intensities. P1—slope of 5° and rainfall intensity of 60 mm·h−1; P2—slope of 10° and rainfall intensity of 60 mm·h−1; P3—slope of 5° and rainfall intensity of 120 mm·h−1; P4—slope of 10° and rainfall intensity of 120 mm·h−1.


Table 1.
Litter characteristics of Pinus massoniana.
| Litter Species | Length/ (cm·g−1) | Projected Area/ (cm2·g−1) | Surface Area/ (cm2·g−1) | Average Diameter/ mm | Litter Density/ (g·cm−3) |
|---|---|---|---|---|---|
| Pinus massoniana | 29.26 | 6.06 | 147.62 | 0.84 | 0.45 |
Table 2.
Litter mass of Pinus massoniana for each treatment.
| Treatment Number | T1 | T2 | T3 | T4 |
|---|---|---|---|---|
| Litter mass coverage/(g·m−2) | 0 | 100 | 200 | 400 |
Table 3.
Overland runoff, erosion, and eroded sediment characteristic parameters under different treatments.
Table 3.
Overland runoff, erosion, and eroded sediment characteristic parameters under different treatments.
| Treatment (Slope-Coverage Mass-Rainfall Intensity)/(°—mm·h−1) | MWD/(mm) | D | Q/(mL) |
|---|---|---|---|
| 5°T1-60 | 0.059 ± 0.021 | 2.640 ± 0.017 | 438.933 ± 80.368 |
| 5°T2-60 | 0.047 ± 0.02 | 2.721 ± 0.014 | 316.133 ± 72.796 |
| 5°T3-60 | 0.025 ± 0.011 | 2.758 ± 0.008 | 264.433 ± 68.551 |
| 5°T4-60 | 0.024 ± 0.012 | 2.759 ± 0.010 | 185.200 ± 14.338 |
| 10°T1-60 | 0.0590 ± 0.016 | 2.600 ± 0.031 | 920.533 ± 41.815 |
| 10°T2-60 | 0.058 ± 0.015 | 2.654 ± 0.034 | 674.510 ± 32.179 |
| 10°T3-60 | 0.057 ± 0.014 | 2.695 ± 0.020 | 590.069 ± 26.571 |
| 10°T4-60 | 0.045 ± 0.042 | 2.701 ± 0.024 | 373.999 ± 34.078 |
| 5°T1-120 | 0.086 ± 0.021 | 2.605 ± 0.034 | 763.698 ± 44.152 |
| 5°T2-120 | 0.067 ± 0.015 | 2.464 ± 0.047 | 462.533 ± 44.071 |
| 5°T3-120 | 0.040 ± 0.016 | 2.741 ± 0.007 | 369.867 ± 95.027 |
| 5°T4-120 | 0.033 ± 0.011 | 2.754 ± 0.016 | 293.667 ± 55.978 |
| 10°T1-120 | 0.163 ± 0.055 | 2.295 ± 0.036 | 1791.000 ± 579.379 |
| 10°T2-120 | 0.155 ± 0.016 | 2.055 ± 0.123 | 1627.357 ± 108.354 |
| 10°T3-120 | 0.114 ± 0.030 | 2.411 ± 0.057 | 1428.186 ± 217.291 |
| 10°T4-120 | 0.071 ± 0.014 | 2.561 ± 0.068 | 1030.629 ± 25.739 |
Table 4.
Enrichment ratio of eroded sediment in each size fraction under different treatment conditions.
Table 4.
Enrichment ratio of eroded sediment in each size fraction under different treatment conditions.
| Treatment (Slope-Coverage Mass-Rainfall Intensity)/(°—mm·h−1) | Clay <0.002 mm | Fine Silt 0.002–0.02 mm | Coarse Silt 0.02–0.05 mm | Fine Sand 0.05–0.25 mm | Medium Sand 0.25–0.5 mm | Coarse 0.5–1 mm | Very Coarse Sand 1–2 mm |
|---|---|---|---|---|---|---|---|
| 5° T1-60 | 0.618 | 0.874 | 1.762 | 6.224 | 2.228 | 1.540 | 0.528 |
| 5° T2-60 | 0.914 | 0.748 | 0.841 | 10.602 | 1.486 | 0.687 | 0.582 |
| 5° T3-60 | 0.953 | 0.875 | 0.907 | 4.444 | 4.303 | 1.312 | 0.623 |
| 5° T4-60 | 0.874 | 0.941 | 0.638 | 6.116 | 4.185 | 0.581 | 0.001 |
| 10° T1-60 | 0.642 | 1.089 | 0.879 | 3.795 | 3.419 | 2.012 | 0.552 |
| 10° T2-60 | 0.967 | 0.952 | 0.802 | 3.165 | 2.897 | 1.514 | 0.389 |
| 10° T3-60 | 0.830 | 1.167 | 0.765 | 1.092 | 1.292 | 0.549 | 0.206 |
| 10° T4-60 | 0.791 | 1.191 | 0.761 | 1.476 | 0.743 | 0.452 | 0.211 |
| 5° T1-120 | 0.838 | 0.659 | 1.276 | 9.541 | 1.664 | 2.005 | 1.815 |
| 5° T2-120 | 0.306 | 0.966 | 1.175 | 11.631 | 4.739 | 0.777 | 0.030 |
| 5° T3-120 | 0.896 | 1.107 | 0.673 | 1.627 | 1.141 | 1.064 | 0.864 |
| 5° T4-120 | 1.005 | 0.939 | 0.886 | 3.467 | 2.112 | 0.685 | 0.133 |
| 10° T1-120 | 0.522 | 0.671 | 1.013 | 11.105 | 8.667 | 4.107 | 3.880 |
| 10° T2-120 | 0.325 | 0.317 | 1.215 | 21.805 | 17.500 | 2.607 | 0.250 |
| 10° T3-120 | 0.645 | 0.506 | 1.687 | 15.368 | 2.121 | 1.456 | 2.844 |
| 10° T4-120 | 0.959 | 0.368 | 1.432 | 17.926 | 0.577 | 0.412 | 0.425 |
Table 5.
Eroded sediment separation characteristic parameters as function of litter coverage mass.
| Slope | 60 mm·h−1 | 120 mm·h−1 | ||
|---|---|---|---|---|
| F(x) | R2 | F(x) | R2 | |
| 5° | MWD= −0.00009x + 0.0544 | 0.7909 | MWD = −0.0001x + 0.0798 | 0.8593 |
| 10° | MWD = −0.00004x + 0.061 | 0.8669 | MWD = −0.0002x + 0.1684 | 0.9662 |
| 5° | D = 0.0003x + 2.6722 | 0.6826 | D = 0.0002x + 2.6204 | 0.7770 |
| 10° | D = 0.0005x + 2.546 | 0.4655 | D = 0.0009x + 2.169 | 0.5449 |
Table 6.
Eroded sediment separation characteristic parameters as function of litter characteristics.
Table 6.
Eroded sediment separation characteristic parameters as function of litter characteristics.
| Functional Relation F(x) | R2 |
|---|---|
| D = 100.022SA0.148AD−0.272Q0.908 | 0.6625 |
| MWD = 102.821SA0.097AD−0.032Q−0.876 | 0.8015 |
SA: surface area; AD: average diameter; Q: runoff.
Publisher’s Note: MDPI stays neutral with regard to jurisdictional claims in published maps and institutional affiliations. |
© 2021 by the authors. Licensee MDPI, Basel, Switzerland. This article is an open access article distributed under the terms and conditions of the Creative Commons Attribution (CC BY) license (https://creativecommons.org/licenses/by/4.0/).
Share and Cite
MDPI and ACS Style
Zhu, F.; Li, Y.; Cheng, J. Size Characteristics of Sediments Eroded under Different Masson Pine Litter Covers in South China. Water 2021, 13, 2190. https://doi.org/10.3390/w13162190
AMA Style
Zhu F, Li Y, Cheng J. Size Characteristics of Sediments Eroded under Different Masson Pine Litter Covers in South China. Water. 2021; 13(16):2190. https://doi.org/10.3390/w13162190
Chicago/Turabian StyleZhu, Fangfang, Yuchen Li, and Jinhua Cheng. 2021. "Size Characteristics of Sediments Eroded under Different Masson Pine Litter Covers in South China" Water 13, no. 16: 2190. https://doi.org/10.3390/w13162190
Note that from the first issue of 2016, this journal uses article numbers instead of page numbers. See further details here.