Article

Investigation of Local Scouring around Hydrodynamic and Circular Pile Groups under the Influence of River Material Harvesting Pits

1
Department of Civil Engineering, Faculty of Engineering, University of Maragheh, Maragheh 8311155181, Iran
2
Department of Civil Engineering, Faculty of Engineering, University of Zanjan, Zanjan 537138791, Iran
3
Department of Engineering, Niccolò Cusano University, 00166 Rome, Italy
*
Authors to whom correspondence should be addressed.
Water 2021, 13(16), 2192; https://doi.org/10.3390/w13162192
Submission received: 4 June 2021 / Revised: 4 August 2021 / Accepted: 9 August 2021 / Published: 11 August 2021
(This article belongs to the Special Issue Research on Hydraulics and River Dynamics)

Abstract

:
Mining activities can endanger the stability of hydraulic structures. Numerical modeling of local scouring around hydrodynamic and circular bridge pile groups, due to the action of clear water conditions via non-cohesive sediment, was performed using a computational fluid dynamics (CFD) model, a large eddy simulation (LES) turbulence model, and a van Rijn sedimentary model with FLOW-3D software. The pile groups were positioned upstream and downstream of a sand mining pit. The results showed that the scour depth around the downstream pile group was greater than that of the upstream one. Using hydrodynamic piers reduced the scour depth upstream of all piers and the material harvesting pit. The maximum reduction in scour depth was observed in front of the fifth pier, with a 29% reduction in scour depth. Additionally, for all models, as the material harvesting pit was moved downstream, the downstream turbulence was enhanced and stronger flow reversal and horseshoe vortices were detected in from of the downstream pile group. The flow patterns around the pile group showed that the presence of hydrodynamic piers in the upstream pile group leads to a decrease in the maximum flow velocity, whereas, when such piers were positioned in the downstream pile group, the velocity increases.

1. Introduction

Increased transportation requirements have increased the need for wide bridges supported by large piers. Large piers are less hydraulically efficient, since their supports occlude a large flow area and thus disrupt the main flow patterns. As an alternative to singular large piers, it is possible to adopt groups of piers with smaller dimensions.
Furthermore, harvesting of riverbed materials is one of the most common methods used to provide the materials needed in civil works [1]. In fact, sands that are exposed to continuous water flow are a good source of quality granular materials, because their loose materials have been removed by abrasion. Therefore, materials harvested from the riverbed require less processing than other materials, and due to the proximity of rivers to transportation roads and administrative neighborhoods, they reduce excessive transportation costs.
Activities such as harvesting river materials can cause additional concerns. For example, the removal of materials from a river can alter the channel, river hydraulics, or sediment budget, which in turn can alter the distribution of habitats and ecosystem functioning [1]. If harvesting is not performed correctly, disruption can be worsened with consequent long-term damage to the river environment. As examples, the Talar and Balaroud Bridges in Iran are cases where the bridges were destroyed because of scouring resulting from the harvesting of river materials.
Previously, several research efforts have studied scouring around groups of bridge piers, but scouring in the presence of harvesting pits has rarely been investigated. Among the studies of group piers is the study of Ataei-Ashtiani and Beheshti [2], which investigated local scour around pile groups. They observed that the use of pile groups instead of single piers increases the scouring around the piles. Zhou and Alam [3] conducted an extensive review of studies on the flow pattern of dual piers. These researchers shared their findings as a full picture of the flow patterns and discussed the Reynolds number effect, momentum transport characteristics, and fluid forces. Liang et al. [4] performed a laboratory study on scouring around a single pier, two piers next to each other, and a three-on-three pile group. They provided empirical relationships to calculate scour depth. Solaimani et al. [5] studied the effect of the distance and arrangement of bridge piers on the depth, length, and volume of scouring around the piers. They found that increasing the distance between piers increases the depth, area, and the volume of scour. Vaghefi et al. [6] investigated the effect of the vertical trinity of arranged piers on the topographic changes of the bed in a laboratory flume with a 180-degree bend. The maximum scour depth occurred with piers arranged perpendicular to the flow and at an angle of 90 degrees to the bend. Namaee and Sui [7] investigated local scouring around four piers of side-by-side piers under two flow conditions: Open channel and ice-covered flow. They observed, for both cases, that the maximum scour occurred in front of the piers. Moreover, they provided an equation to estimate the scour depth. Malik and Setia [8] conducted a laboratory study of scouring around bridge pile groups in three arrangements: Piles adjacent to each other, aligned in the flow direction, and in a triangular arrangement. For piers arranged in a row, if the distance between the piers exceeds 16 pier diameters, the piers behave as independent entities. Yang et al. [9] investigated the dimensionless ratio of distance to the pier diameter and the Froude number and their effect on scouring. They showed that increasing the ratio of separation distance to the pier diameter leads to a decrease in scour depth. They also found that with an increasing Froude number, there were increases in the dimensionless ratio He/D (He: scour depth at equilibrium time; D: pier diameter).
There are many studies on the mining of riverbed materials. Decker et al. [10] studied the effects of river material harvesting on the life and environment of fish in the rivers of Georgia in the United States. They concluded that material harvesting has detrimental effects on the environmental conditions of fish. Lee et al. [11] presented regression equations for the migration speed of a rectangular pit. They observed channel degradation in both the upstream and downstream locations of the pit. Cao and Pender [12] provided a 2D numerical study to predict the hydrodynamics of alluvial rivers subjected to interactive sediment mining. The 2D model predicted bed lowering in the downstream side of the mining region. Experiments conducted by Barman et al. [13,14] reported a rise in the turbulent stresses in the mining pit and in the downstream side of the pit. With increasing discharge and length-to-width ratio of the pit, the migration rate of the upstream edge of the pit increases. Extensive studies have been conducted by other researchers about mining pits in a channel, as well as empirical approaches to the migration of pit and channel bed deformation [15,16,17]. To the best of the authors’ knowledge and according to the existing literature from Lee at al. [11] and Barman et al. [13,14], the excavation of a pit in an alluvial channel can induce erosion in the downstream side and can cause streambed instabilities around hydraulic structures such as bridge piers. Lade et al. [18] conducted experimental research on a rectangular pit that was excavated upstream of two circular piers embedded in the sand-bed in a tandem arrangement. They found that mining activities near the piers can lead to significant changes in the flow field, causing excessive scour around piers. Majedi-Asl et al. [19] studied the effect of river material harvesting pits on scouring around pile groups under different hydraulic and sedimentary conditions. They observed that an increase in the Froude number and the presence of a river material harvest pit increases the scour equilibrium time. They also used experimental methods to calculate scour depth and developed a regression method for predicting the depth. Daneshfaraz et al. [20] investigated the effect of flow rate on scour around pile groups bridged with sand in the presence of a material harvesting pit. They concluded that with an increasing flow rate, scour around the base group increased and rough sand on the surface of the foundations reduced scouring around said foundations and increased the scouring time.
A review of previous studies shows that despite the importance of material harvesting pits on local scouring around pile groups, few studies have been conducted in this field. The present study is an attempt to fill these gaps and to provide a better apprehension of these effects. The research is focused on the alterations in the flow parameters and local scouring around three groups of piers placed in the middle of the channel and in arrangements upstream and downstream of an excavated oval pit. Advanced numerical simulation software, FLOW-3D, was used to simulate the problem, and numerical simulations were validated with laboratory experiments. In addition, these works used two shapes of grouped piers in the simulation, namely, circular and hydrodynamic. Streambed alterations, such as scour depth and bed levels and alterations in flow parameters, such as mean velocity around the piers, were investigated.

2. Dimensional Analysis

The scouring around a bridge pile group in the presence of a material harvesting pit is influenced by parameters related to the material harvesting pit, fluid flow, sediment, flume geometry, bridge piers, and scour pit. A functional relationship connecting the dependent and variables with scouring can be provided as follows:
f 1 ( V , y 0 , g , ρ , ν , d 50 , σ g , ρ s , B , D , K p , K r , m p , L s x , L s y , d s , l p , b p , t ) = 0
where V is the upstream velocity, y0 is the initial flow depth, g is the gravitational acceleration, ρ is the fluid density, ν is the kinematic viscosity, d50 indicates the average particle diameter size, σg is the deviation from average size, ρs represents the sediment density, B is the flume width, D is the pier diameter, Kp is the curvature of the upstream surface of the pier, Kr is the pier surface roughness, mp is the length of the pier at the plan, Lsx refers to the scour width, Lsy is the scour length, ds indicates the scour depth, lp represents the length of the harvest pit, bp is the width of the harvest pit, and t is the time.
Considering ρ, V, and D as iterative variables and using the π-Buckingham method, the dimensionless parameters can be expressed as follows:
f 2 ( y 0 D , V g D , V . D ν , B D , ρ s ρ , d 50 D , m p D , K r D , V . t D , L s x D , L s y D , d s D , l p D , b p D , K p , σ g ) = 0
By inserting the dimensionless equivalents ( V g D = F r ,   V . D ν = R e ,   ρ s ρ = G s ) and dividing the dimensionless parameters, we can simplify Equation (2) as follows:
f 3 ( F r , Re , G s , d 50 D , m p D , K r D , V . t D , L s x L s y , d s D , B D , l p b p , K p , σ g ) = 0
According to Mastbergen and van den Berg [21], if Re ≥ 7000, the kinematic viscosity will not affect local scouring. Considering that in the present study, the Reynolds number for the experiment was 25,600, the Reynolds number (Re) can be ignored. According to Chiew and Melville [22], if B/D = (1.2/0.09) ≥ 10, the effect of the flume walls on the local scour depth can also be neglected, and consequently, the dimensionless parameter B/D was omitted. Then, due to the uniform distribution of sediment particles and the constancy of the sediment type, their effect on scour depth was neglected [23,24]. The simplified dimensionless relationship can now be expressed as:
f 4 ( F r , d 50 D , m p D , K r D , V . t D , L s x L s y , d s D , l p b p , K p ) = 0

3. Numerical Model

3.1. Flow Field Simulation

FLOW-3D v11.2 software was used to simulate the turbulent three-dimensional flow around the bridge pile group. This program evaluates the location of flow boundaries by utilizing two modeling methods: The FAVOR method (area–volume fraction method), to simulate surfaces and rigid volumes (such as geometric boundaries), and the VOF method (volume of fluid method), to determine the free surface behavior [25]. The ruling equations of the flow include continuity and conservation of momentum. The continuity equation is expressed as follows:
V F ρ t + x ( ρ u A x ) + y ( ρ v A y ) + z ( ρ w A z ) = R S O R + R D I F
In this equation, VF is the ratio of the volume of fluid passing through an element to the total volume of the element and ρ is the density of the fluid. The parameters u, v, and w are the velocities in the three coordinate directions. The symbols Ax, Ay, and Az indicate the fraction of area for flow in the x, y, and z directions, respectively. The terms R and x correspond to the selected coordinate system and take on values of 1 and 0, respectively [26].
On the right-hand side of the equation, the term RDIF represents a turbulent diffusion and RSOR is the mass source. It is related to the porous media and the entry of secondary flow into the computational domain. The equations of motion are as follows [27]:
u t + 1 V F ( u A x u x + v A y u y + w A z u z ) = 1 ρ P x + G x + f x
v t + 1 V F ( u A x v x + v A y v y + w A z v z ) = 1 ρ P y + G y + f y
w t + 1 V F ( u A x w x + v A y w y + w A z w z ) = 1 ρ P z + G z + f z
In these equations, P is the pressure; Gx, Gy, and Gz are the accelerations of gravity in the x, y, and z directions; and fx, fy, and fz are the viscous forces, respectively, in the three coordinate directions. The initial conditions for the momentum are as follows:
A.
The fluid is continuous and the stress is linearly related to the strain rate;
B.
The fluid is isotropic, i.e., the properties of the fluid are independent of direction. As a result, the law of deformation is independent of the chosen axis;
C.
When the strain rate is zero, the law of deformation is reduced to hydrostatic pressure.

3.2. Turbulence Model

A turbulence model is needed for additional modeling of the nonlinear Reynolds stress term. Some numerical studies have proposed the Reynolds-Averaged Navier–Stokes (RANS)-based k-omega and the Renormalization Group (RNG) k-ε [28,29,30,31,32,33,34,35,36,37] and LES (large eddy simulation) models [38,39,40] for the scouring problem. The LES turbulence model was used to perform computation of fluid dynamics (CFD). Compared to the RANS models, LES is more computationally demanding. Its application will be more extensive with the development of computer technology. According to Kirkil et al.’s [33] study, the LES turbulence and van Rijn sediment transport models allow to achieve a more accurate result with providing the mesh grids, and are sufficient compared to other models. LES kinematic eddy viscosity (νT) performs as:
ν T = ( c L ) 2 2 e i j 2 e j i
where c is a constant (0.1–0.2), L is the length scale, and eij is the strain rate tensor components in the i and j directions.

3.3. Sediment Scour Model

Since many parameters affect scouring, a method based on experimental results can be used to estimate its value. This approach was used in [30,41] to forecast the critical Shields parameter according to the following formulation:
T = d [ ρ ( ρ s ρ ) g μ 2 ] 1 / 3
where µ is the dynamic viscosity, ρs is the fluid density, d is the particle diameter, and g is the acceleration of gravity. Equation (11) is applied to calculate the critical shear stress of sediment in a flat riverbed:
τ c r = ρ g ( s 1 ) d 50 θ c r
where τcr is the critical shear stress of the sediment, s is the specific density, d50 is the mean diameter of the sediment particles, and θcr is the critical Shields number. The Soulsby–Whitehouse equation is used to calculate the dimensionless critical Shields parameter:
θ c r = 0.3 1 + 1.2 T + 0.055 [ 1 exp ( 0.02 T ) ]
In reality, the bed of a river is not flat, so the critical Shields number can be modified for sloping surfaces to include the angle of repose as follows:
θ c r / = θ c r cos ψ sin β + cos 2 β tan 2 φ sin 2 ψ sin 2 β tan φ
where β is the angle of the slope of bed, φ is the angle of the repose for sediment (the default is 32°), and ψ is the angle between the flow and the upslope direction. The sediment transfer rate is one of the important criteria for estimating scour; accurate scouring predictions can be achieved if the sediment transport equations are modified. In this study, because of using non-cohesive sediment, the van Rijn equation was used to calculate the dimensionless bed load transfer rate:
ϕ = β V R T ( θ θ c r 1 ) 2.1 C b
where β V R is van Rijn coefficient and is equal to 0.053, Cb is bed load coefficient, and   ϕ is the dimensionless bed load transport rate, which is related to the volumetric bed load transport rate, qb, as follows:
q b = ϕ [ g d 3 ( ρ s ρ ρ ) ] 1 / 2
This equation computes the bed load transport rate in units of volume per bed width per time. The law of the wall for the mean velocity, as modified for roughness, is expressedby Equation (16):
u p u = 1 k [ E ρ c μ 0.25 k p 0.5 z p μ ] B
where up is the main flow velocity at point p, k is von Kàrmàn’s constant (0.418), u* is the shear velocity related to the bottom shear stress (τ = ρu* 2), E is Young’s modulus, ρ is the fluid density, cμ is the constant, kp is the turbulent kinetic energy at point p, zp is the distance from point p to the wall, and ∆B is the roughness function [42]. In this study, the parameters selected for sediment scour, obtained after calibration of many runs, were the critical Shields number (θcr) of 0.03 and the bed load coefficient (Cb) of 0.5

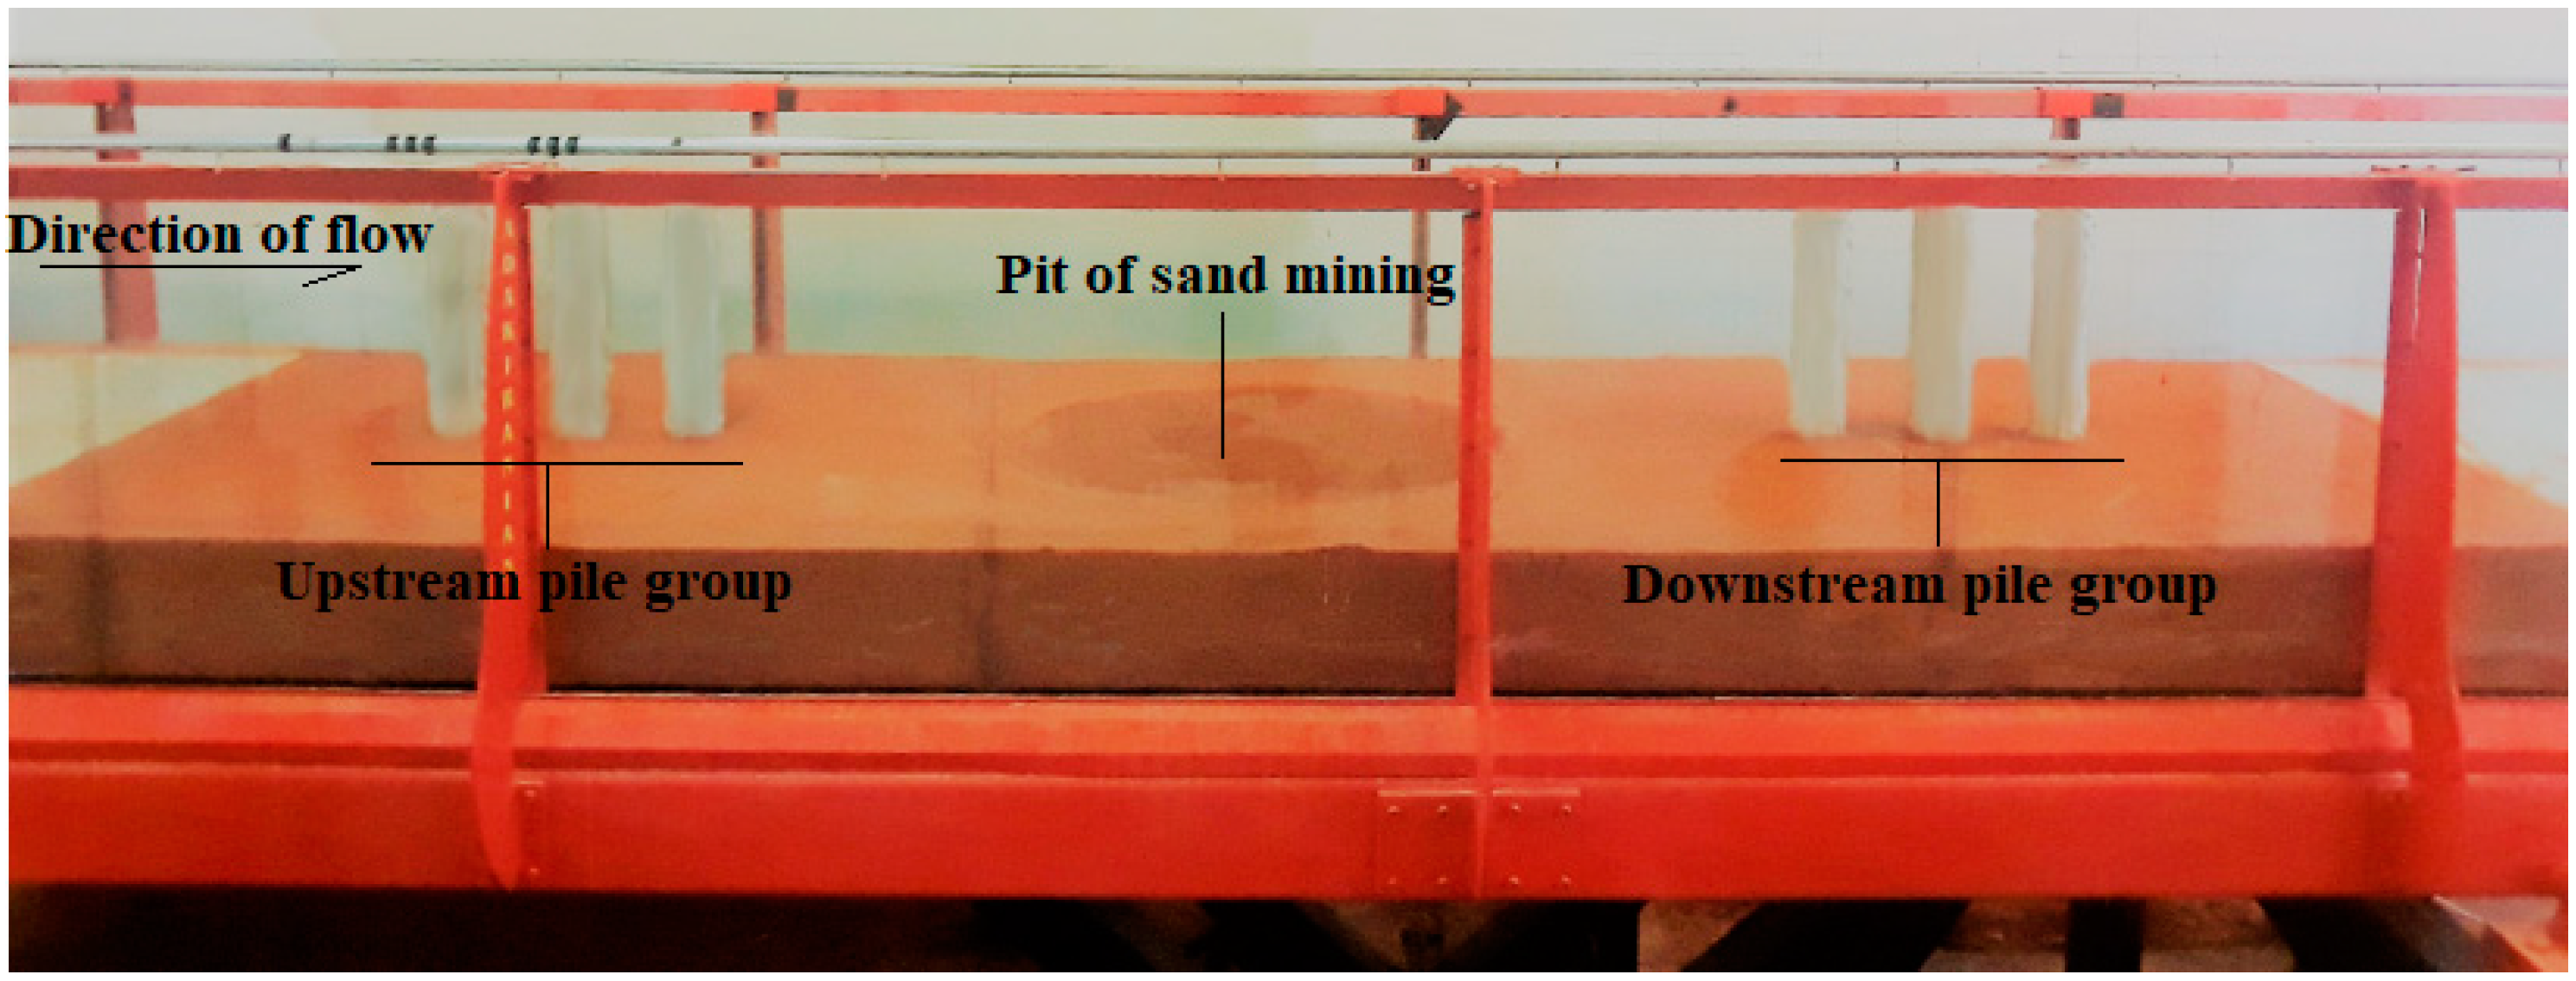
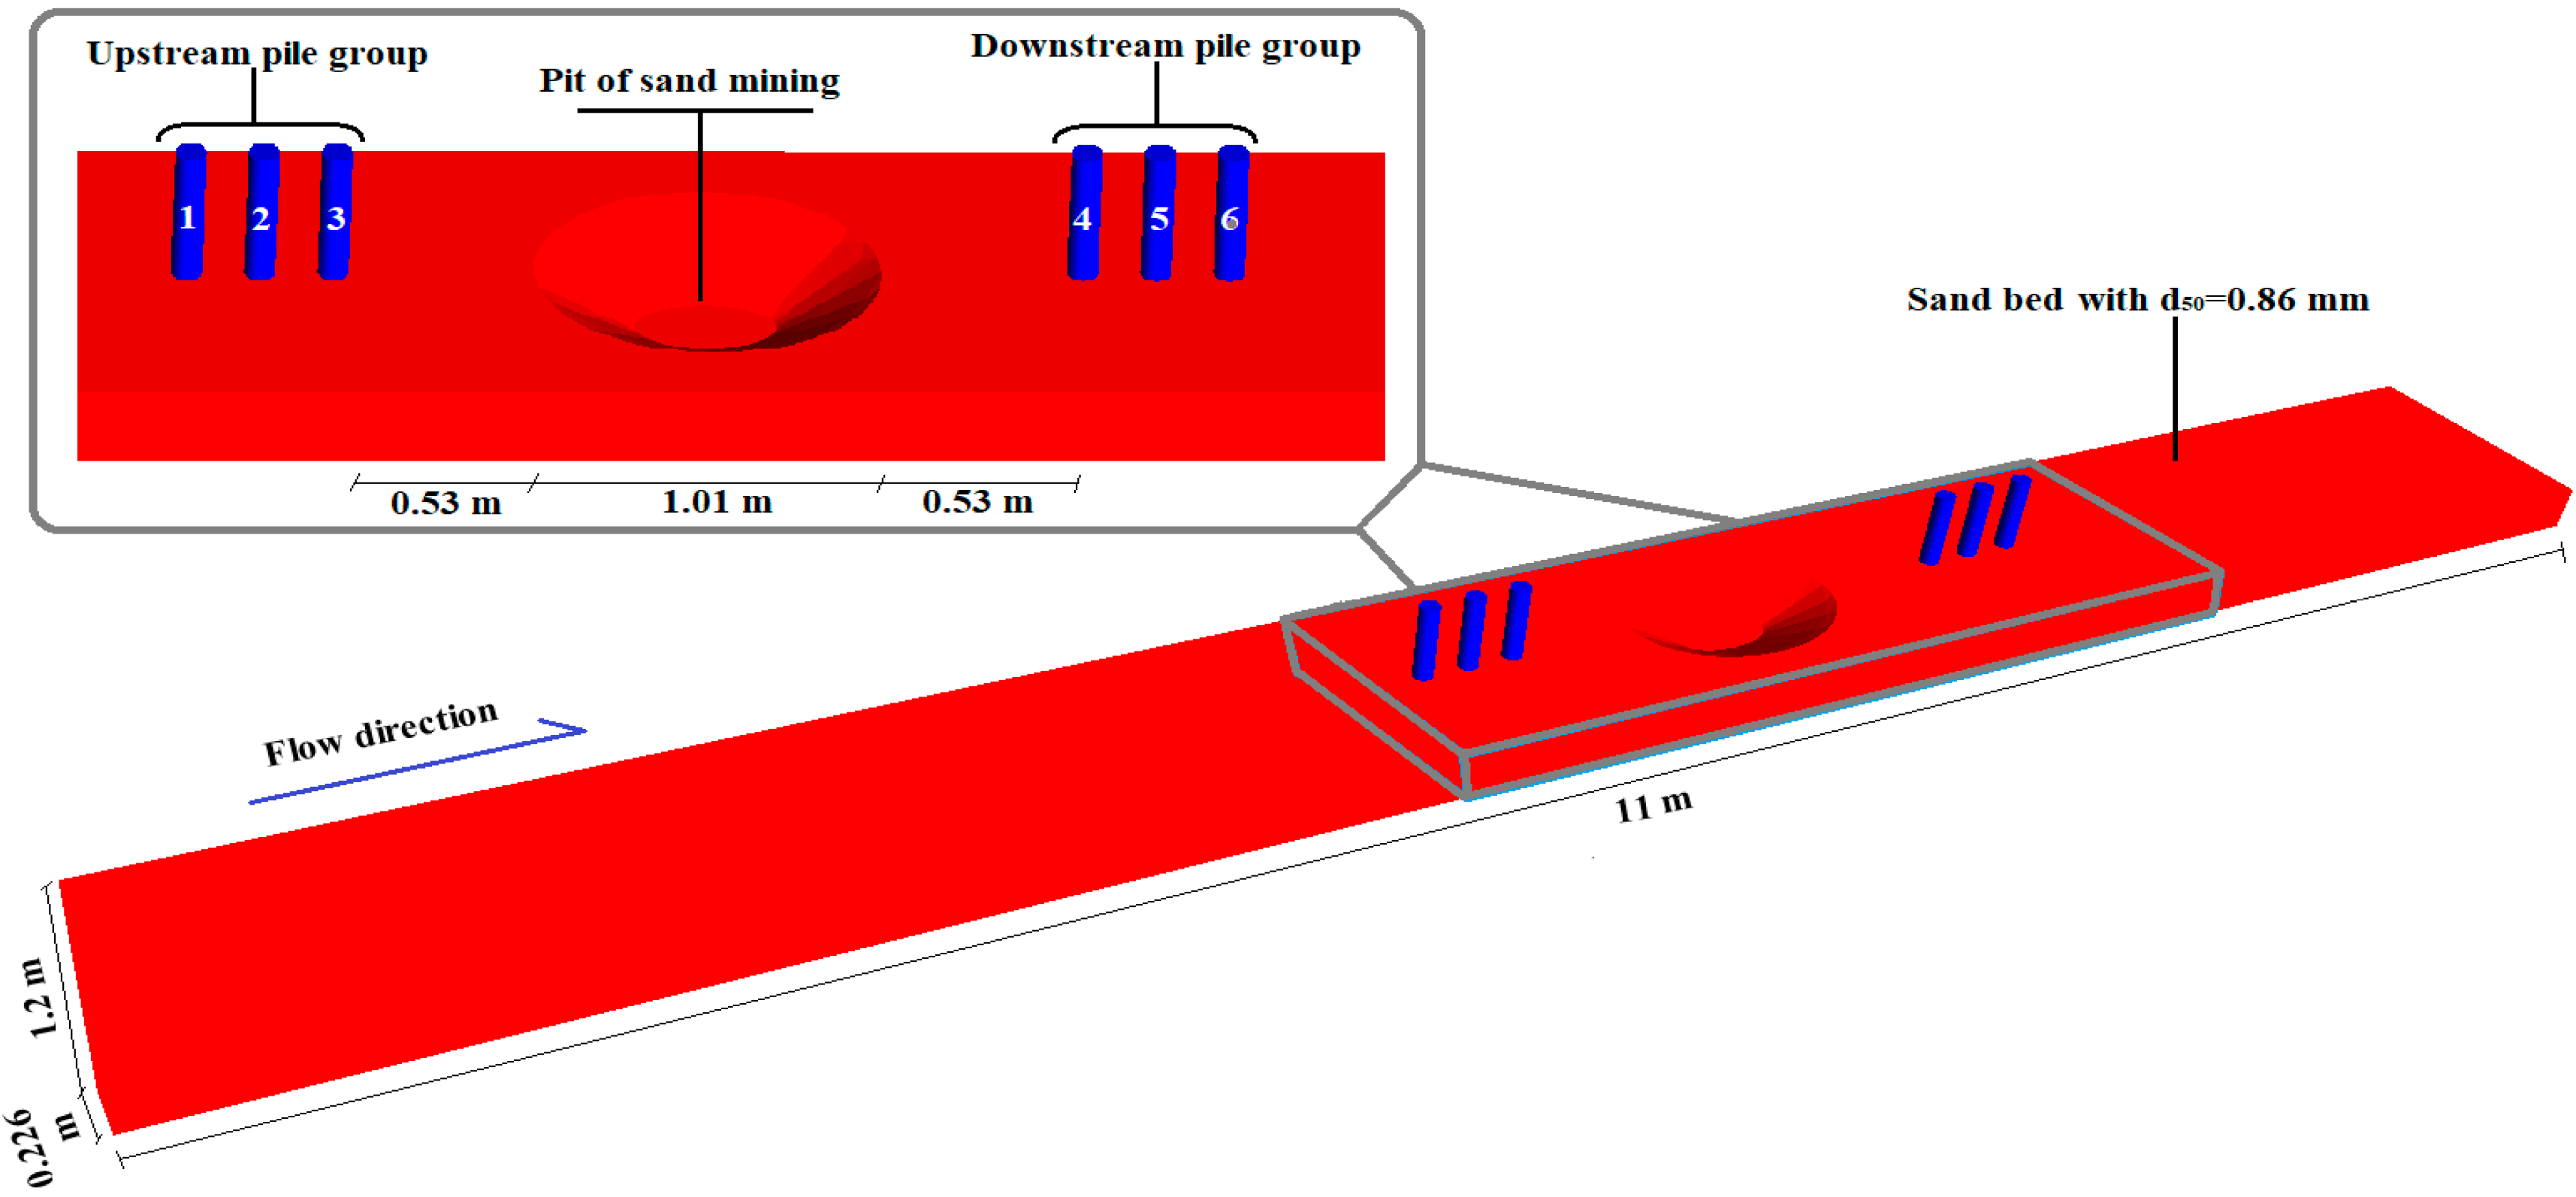
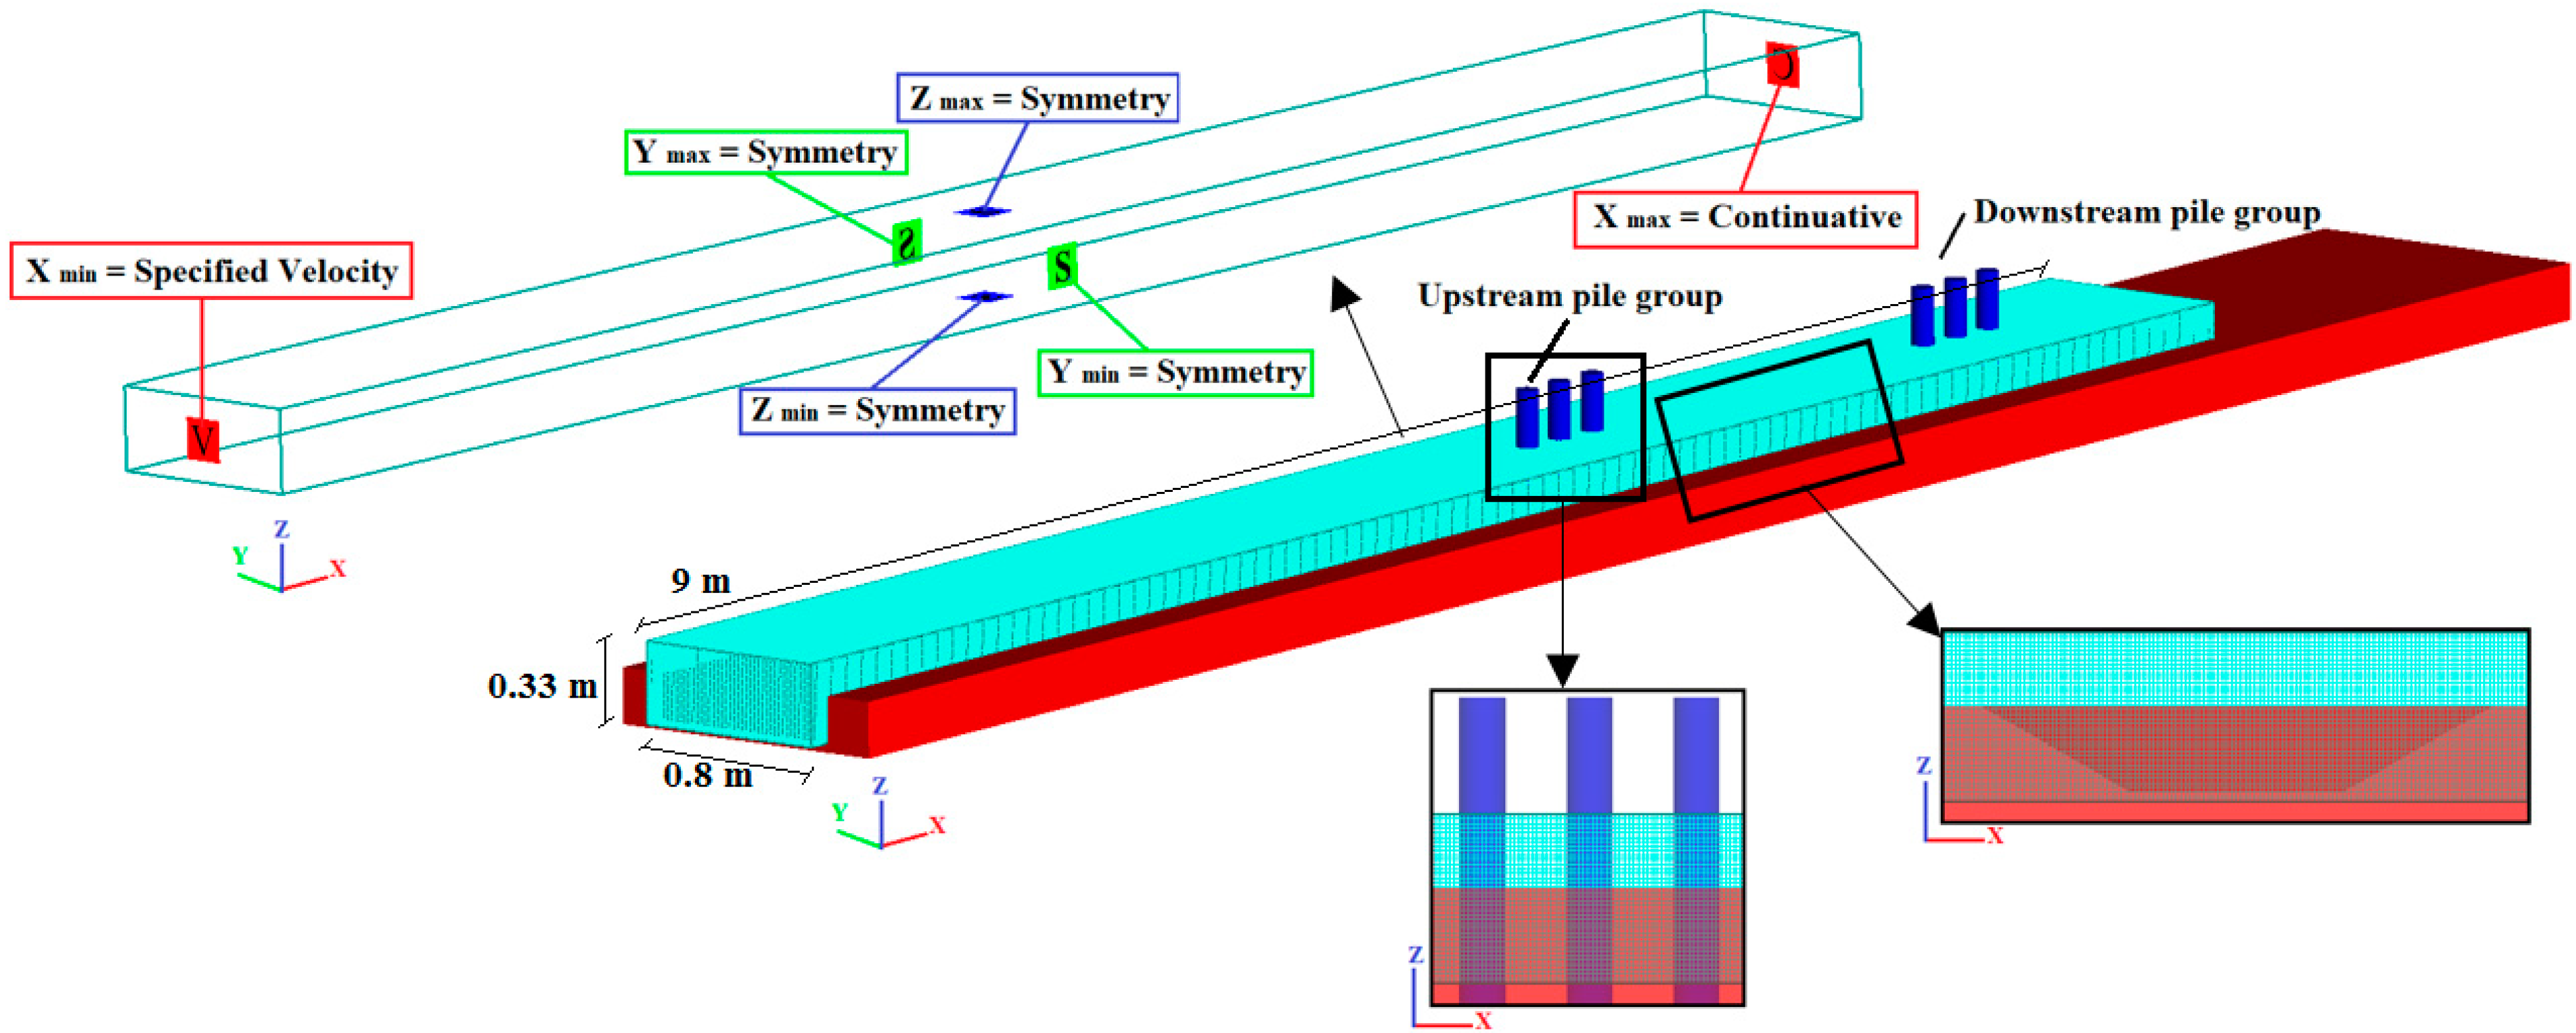
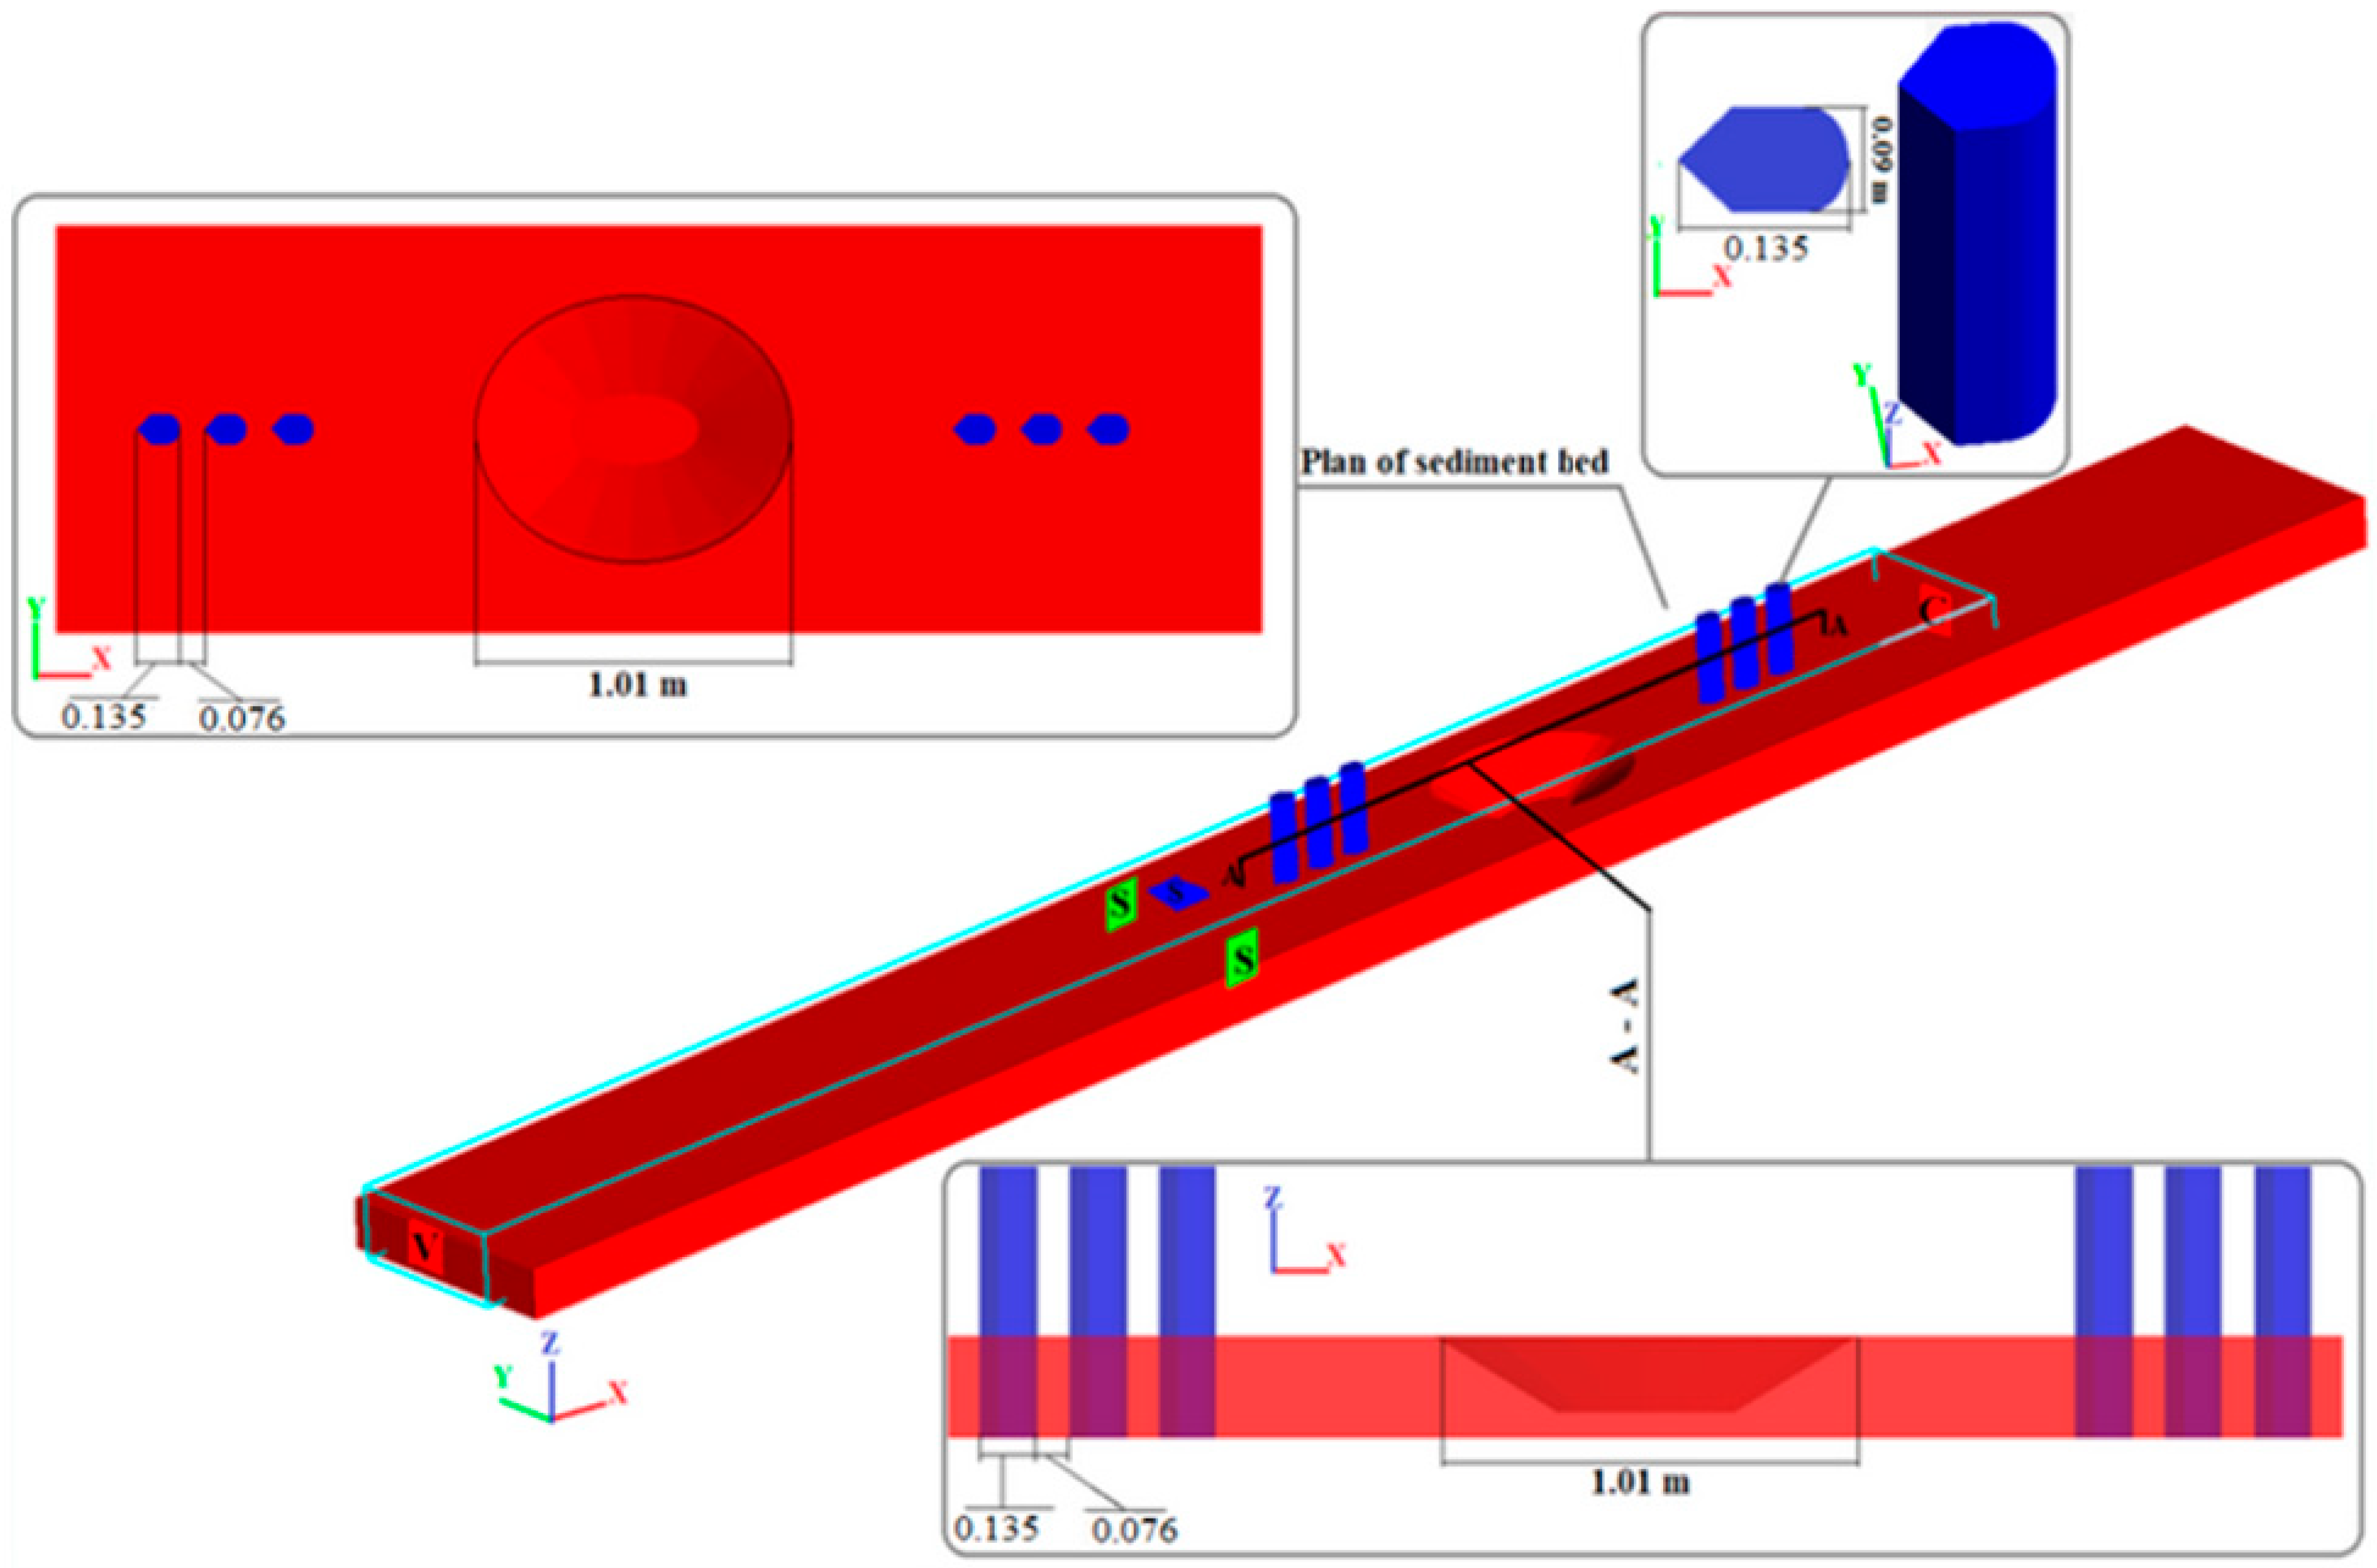
3.4. Description of the Laboratory Experiment and Numerical Setup

This research was carried out in a laboratory flume with a length of 13 m, a width of 1.2 m, and a height of 0.8 m in the hydraulic laboratory of the University of Maragheh, Iran. The flume was constructed using plexiglas walls. A turbulent grid was placed at the inlet to reduce the turbulence of the flow [43]. At the outlet, a metal sluice was installed to adjust the flow depth. Based on insight from Ataei-Ashtiani and Beheshti [2], if x/D (x is the distance between piers and D is the pier diameter) is between 0.15 and 2, the piers behave the same as the pile group. If this ratio becomes less than 0.15, all piers will behave like a large, single pier. However, if the ratio exceeds 2, each pier of the pile group will behave independently. Here, three PVC pipes with a diameter of 0.09 m, positioned at a distance of 0.12 m, were used upstream and downstream of a harvesting pit. In the middle of the flume, a sedimentary bed with a length of 4.26 m, a width of 1.2 m, and a height of 0.226 m was created. According to Raudkivi and Ettema [44], if the D/d50 exceeds 20–25, the size of the sediment particles does not affect the final scour depth. They also showed that the average particle diameter must be more than 0.7 mm to prevent the formation of ripples in the sedimentary bed. Therefore, the selected bed sediments were non-cohesive sands with a median size (d50) of 0.86 mm, a specific gravity (Gs) of 2.65, and a geometric standard deviation (σg) of 1.32. An oval pit was constructed with large and small dimensions of 1.01 and 0.8 m, respectively. The pit was located in the middle of the bed. Three groups of bridge piers were installed consecutively 1 m apart upstream and downstream of the material harvesting pit.
The physical model was tested under clear water conditions. The flow depth was maintained at 0.132 m. The flow was directed into the flume by a pump capable of providing 7–52 L/s. This flow was sufficient to cause scouring. For experiments, after leveling the sediment bed, it was saturated with a stream of water so that the sediment bed did not change suddenly. Then, the desired hydraulic conditions were adjusted by the gate installed in the flume and water pump, and the test started from that moment. Data were also collected during the experiments. At the end of the tests, the pump was turned off and the flow was slowly drained through the end gate. Details of experiments utilized for validation are shown in Table 1.
The data acquired in this study include the scouring depth around the piers at 30 min intervals. Using a 3D laser scanner, water depths were collected with a measurement accuracy of ±1 mm. In both the laboratory experiment and the numerical simulation, all data were gathered from exactly in front of the piers. Figure 1 shows the sediment bed with the relevant details annotated.
The flow geometry, built in AutoCAD software, was then inserted into the computational fluid dynamics program FLOW-3D (see Figure 2). In order to complete the simulation of the flow, the solution region was subdivided into fine cells with a uniform block mesh (Figure 3). The boundary conditions for the numerical model were selected to match the conditions created in the laboratory model. The inlet condition was a uniform velocity, while the output condition was a zero gradient on the transported variables (a continuative boundary condition). According to [44], if the ratio of the flume width to the diameter of the piers (B/D) exceeds 6.25, the effect of the flume walls on scouring can be ignored. Accordingly, if the width of the flume become 0.8 m, the wall effect is ignored, so in order to reduce simulation time, the block mesh’s width was assumed to be 0.8 m with symmetry boundary conditions (see Figure 3). “No special conditions are required at the boundaries of symmetry, because there are derivatives of zero velocity at that boundary, and hence the production of zero turbulence. Also, there is a no flow area that does not automatically guarantee any advertising flux or diffusion. Additionally, at these borders, the nodes can slide freely along the border, but they cannot penetrate and retreat.”

3.5. Effect of the Computational Mesh on the Scour Depth Results

Sensitivity of numerical solutions to the meshing is an important consideration in computational studies. To validate the results of the numerical solution, three different computational meshes were constructed and the resulting scour depths are presented in Table 2. In this table, Mexp is the experimental value and Mcal is the calculated data. From this table, with a decreasing mesh size, the differences between the calculations and measurements decreased. For 2 cm meshes, there was a large difference between the calculations and the measurements (i.e., 84%). However, when the mesh sizes were reduced to 0.9 cm, the difference was reduced to 6.7% for the upstream pier. Similar improvements were observed at the downstream site as well. Table 2 provides a summary list of the results for the three different mesh sizes (0.02, 0.015, and 0.009 m).

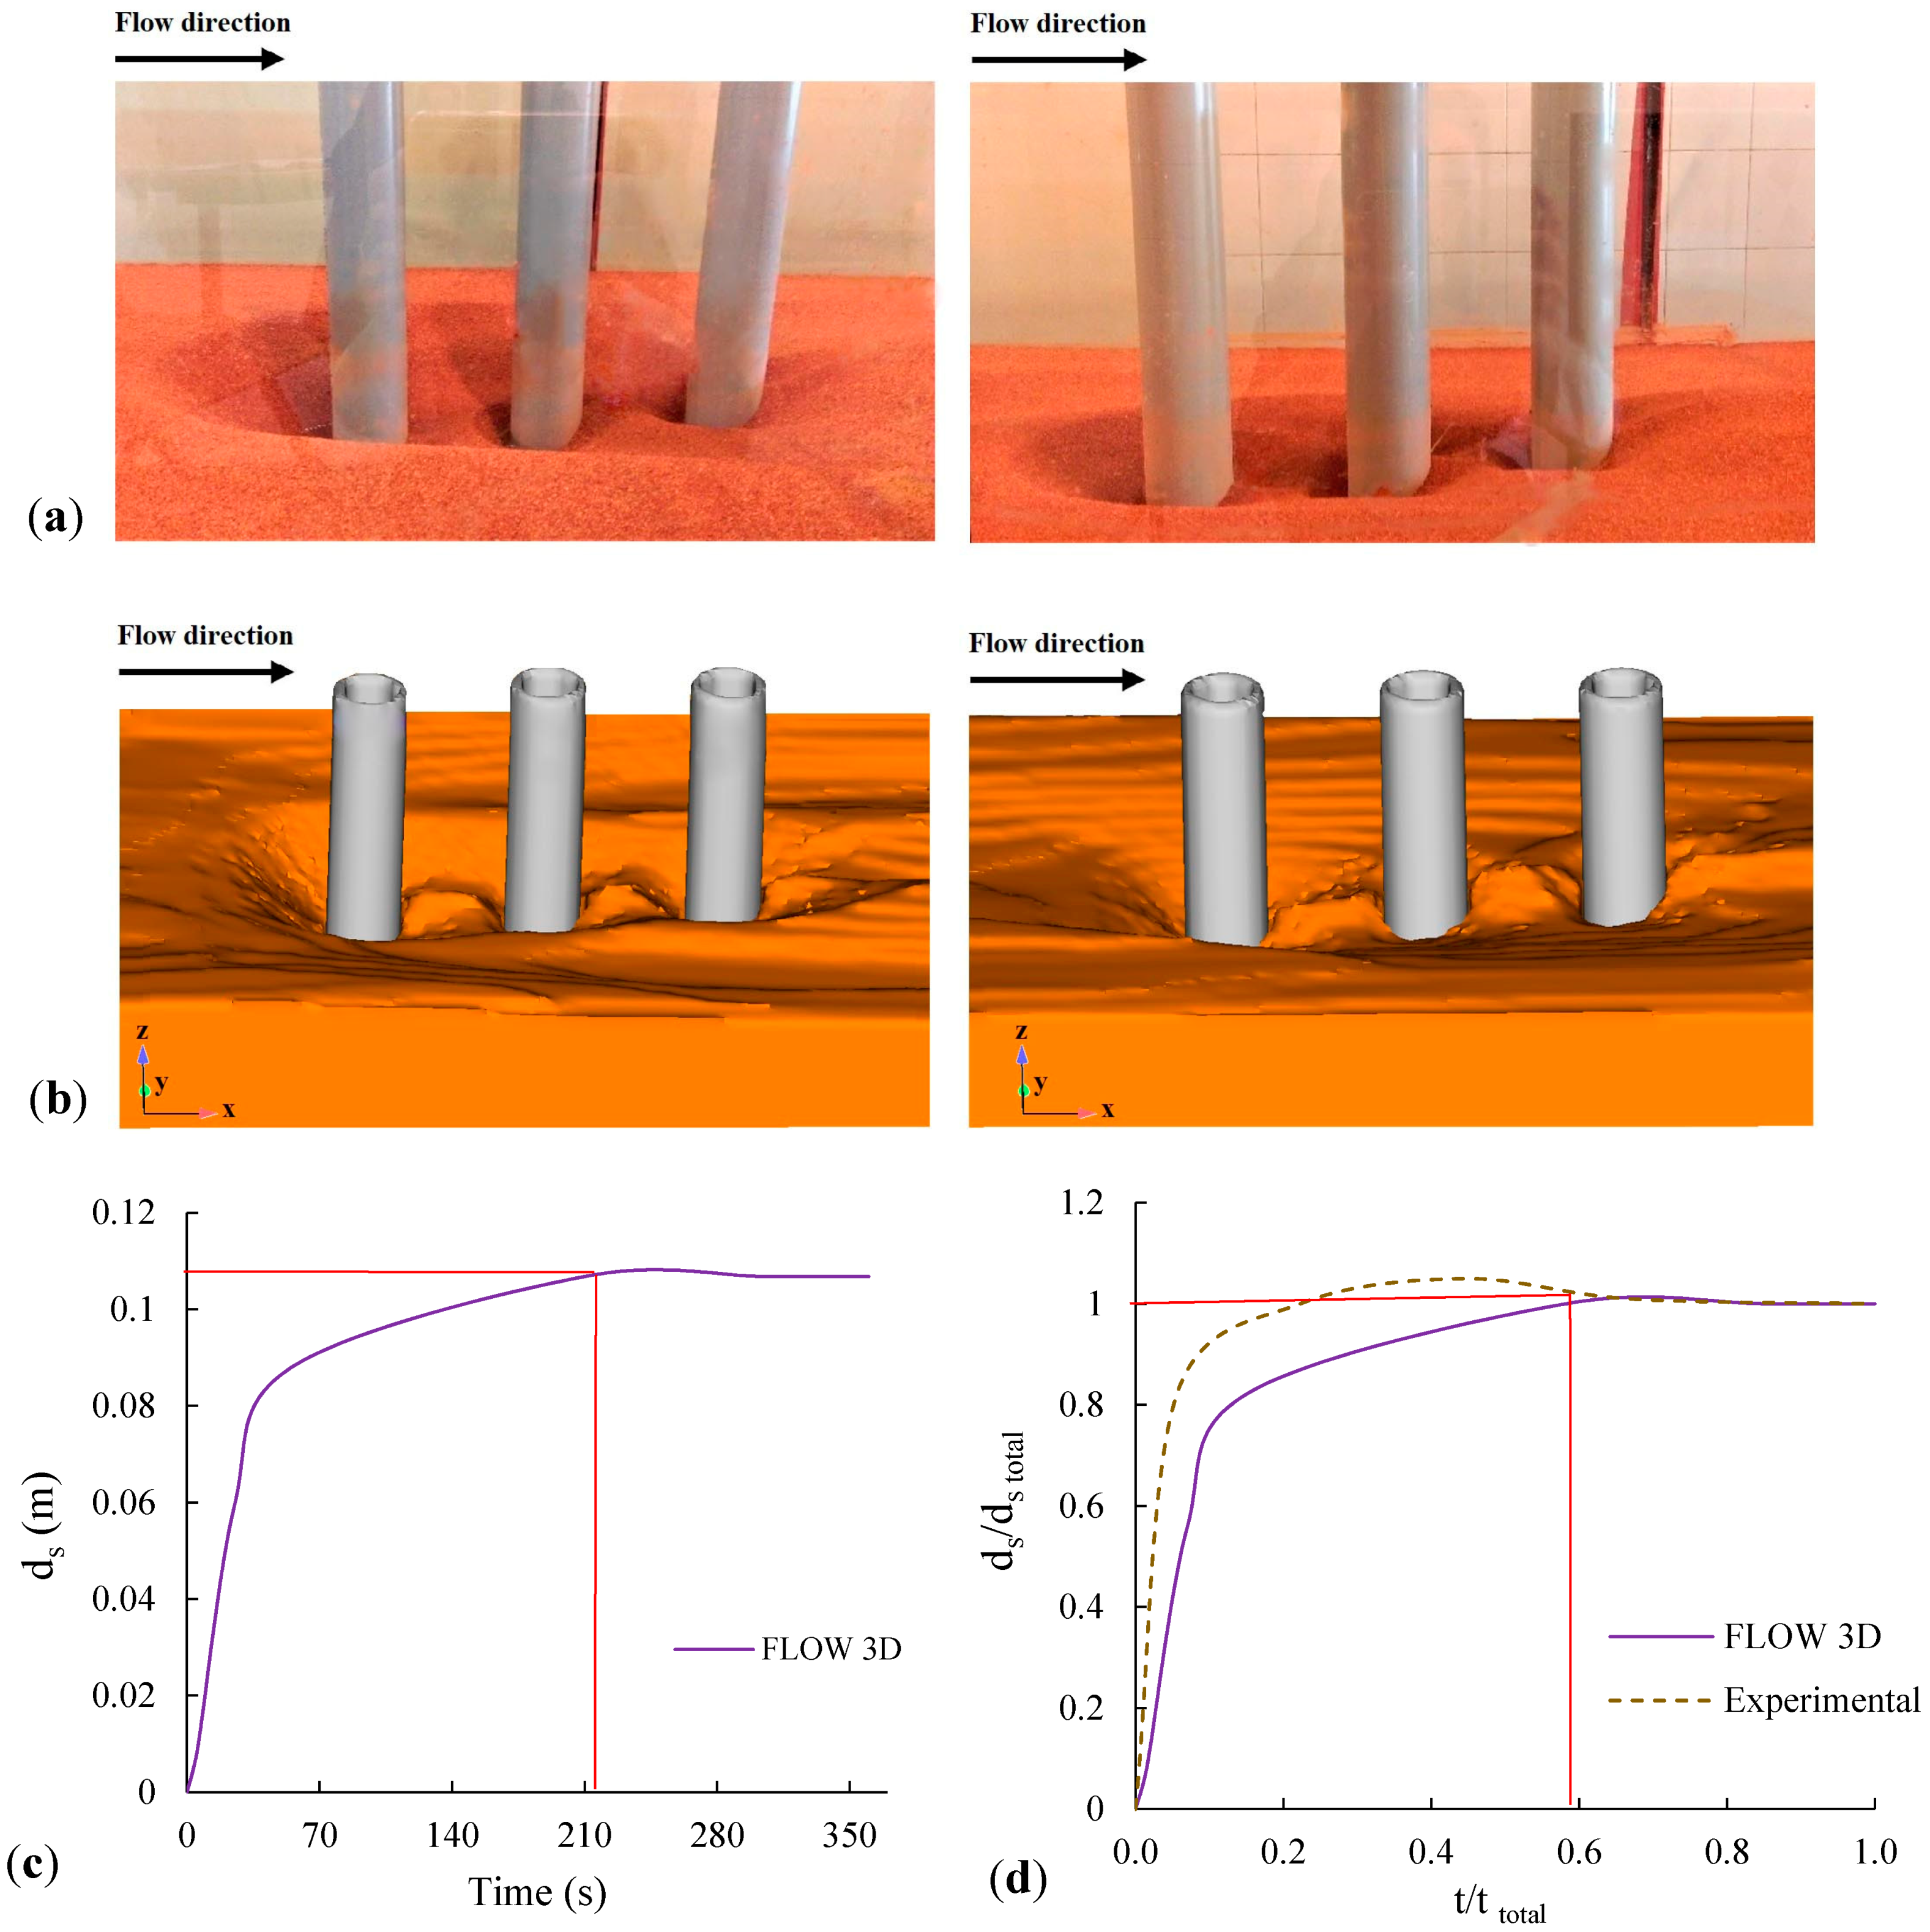
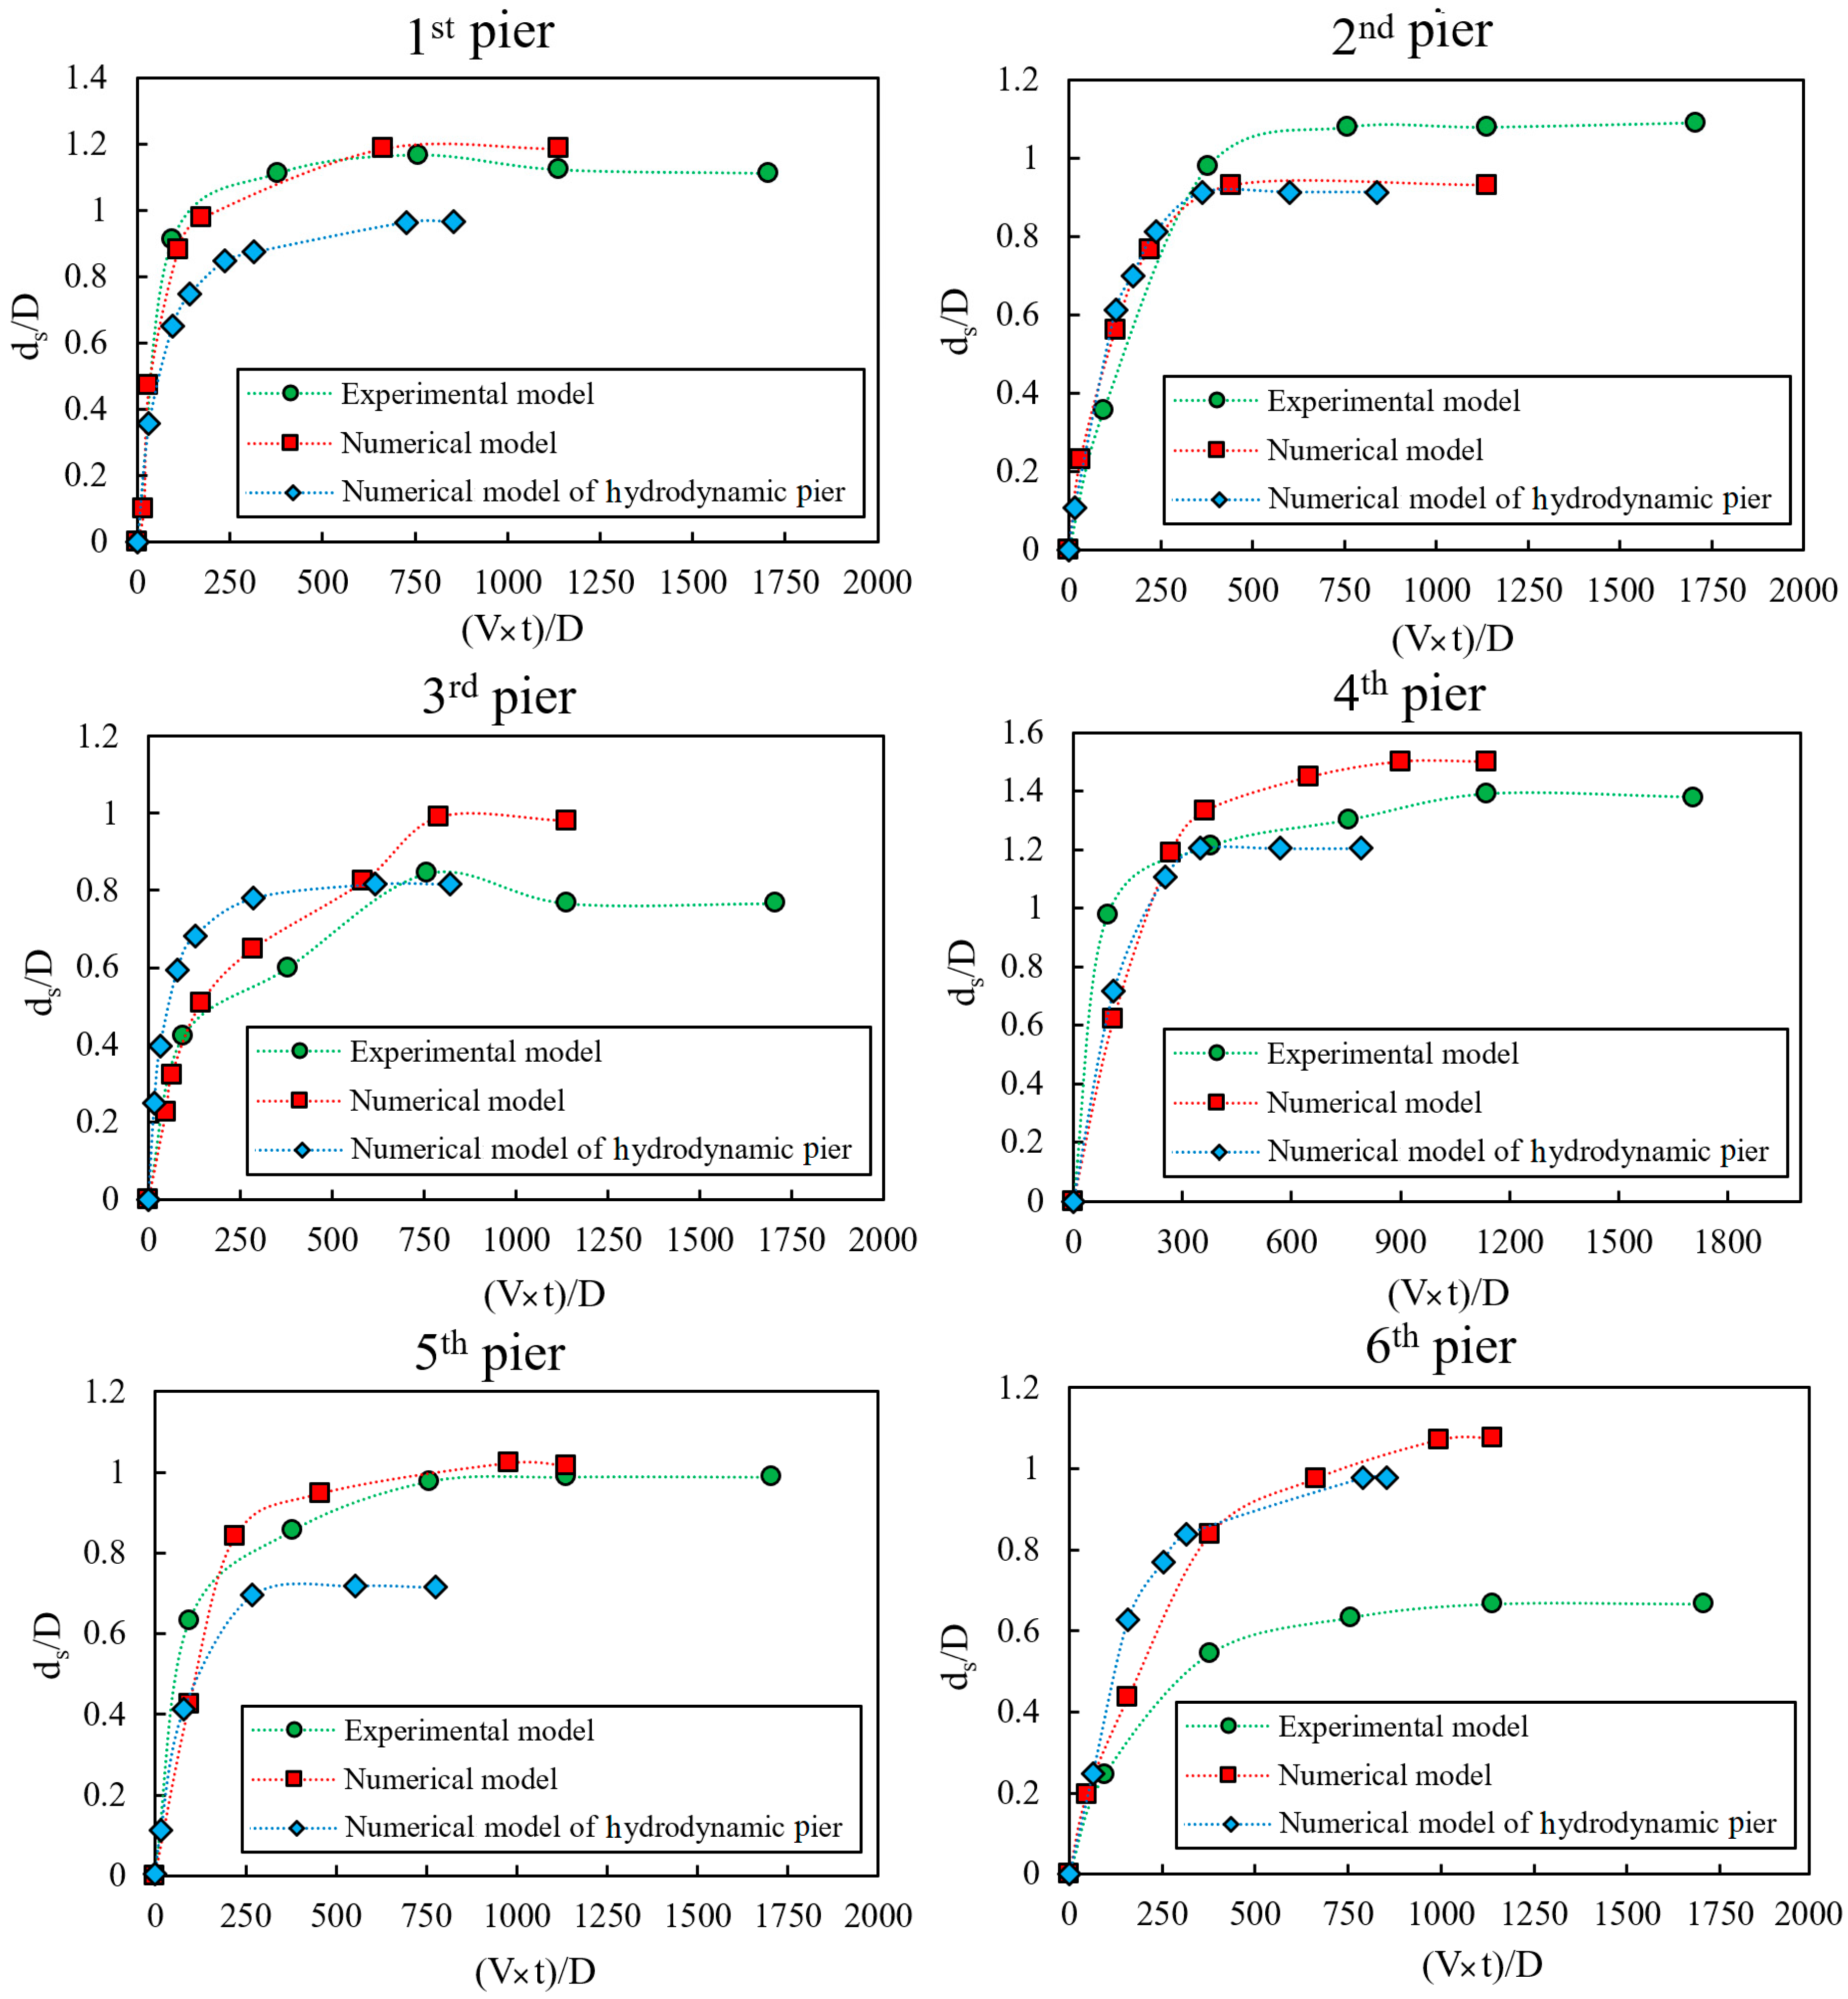
3.6. Validation of the Numerical Simulation

The applicability of a numerical model to realistically reproduce the flow field of a particular application needs to be validated using physical model data (Figure 4a,b). In the laboratory experiments, we reached their equilibrium state in 540 min. The equilibrium conditions correspond to the time after which evolution of the scour hole ceased. Based on the scouring–time chart of the numerical simulation (Figure 4c), the simulation equilibrium was evident, and the modeling time was therefore reduced and set to 360 s. Comparison of the two numerical and laboratory experiments was performed using dimensionless time (Figure 4d). Comparison of the two charts shows good performance of the numerical simulation in simulating the scouring process. In this figure, ttotal is the total time period of the simulation and ds total is the final scour depth in the equilibrium state.
The validation of the numerical results for the pile group simulations followed a different process than for flow around a single pier. The flow and scouring around the first pier (where maximum scouring occurs) were used as the validation metric. In order to compare the laboratory results with the numerical results, the criteria that were utilized were the relative error percentage (E (%)), the root mean square error (RMSE), the coefficient of determination (R2), and the mean absolute error value (MAE). The definitions of these metrics are provided below:
E ( % ) = M exp M c a l M exp × 100
R M S E = 1 N 1 N ( M e x p M c a l ) 2
R 2 = ( ( N M e x p M c a l ) ( M e x p ) ( M c a l ) N ( M e x p 2 ) ( M e x p ) 2 N ( M c a l 2 ) ( M c a l ) 2 ) 2
M A E = 1 N | M exp M c a l | N
where N is the number of experimental tests, Mexp refers to the experimental values, and Mcal refers to the calculated data. The fitting equations are acceptable when the RMSE values are close to zero and R2 is ~1. From Table 3, it can be seen that based on the accuracy of the parameters applied (R2, MAE, RMSE, and E in Table 3), the numerical results are acceptable. For instance, with the first pier (relative error percentage of 6%) and the fourth pier (relative error percentage of 7%), the agreement is excellent. These two piers are the most upstream piers in the two pier groups.

3.7. Simulation of Local Scouring around the Hydrodynamic Pile Group

To create non-circular piers, their cross-sections were modified, as shown in Figure 5. These piers are called hydrodynamic piers, which have sharp noses that coordinate with the flow streamlines and follow the equations of hydrodynamic flow conditions. Based on Ghaderi and Abbasi’s [32] study, keen and round nose piers reduce the bed shear stress value more than a circular pier does. According to the recommendations of Ataei-Ashtiani and Beheshti [2], bridge piers with a length of 13.5 cm and a diameter of 9 cm were placed at intervals of 7.6 cm.

4. Results

First, laboratory-based scouring for circular piers is presented. Then, the scour depth upstream of the hydrodynamic piers is studied and compared with the circular model (both numerical and laboratory results). Finally, by utilizing the computational model, comparisons between circular and hydrodynamic pier scouring are provided.

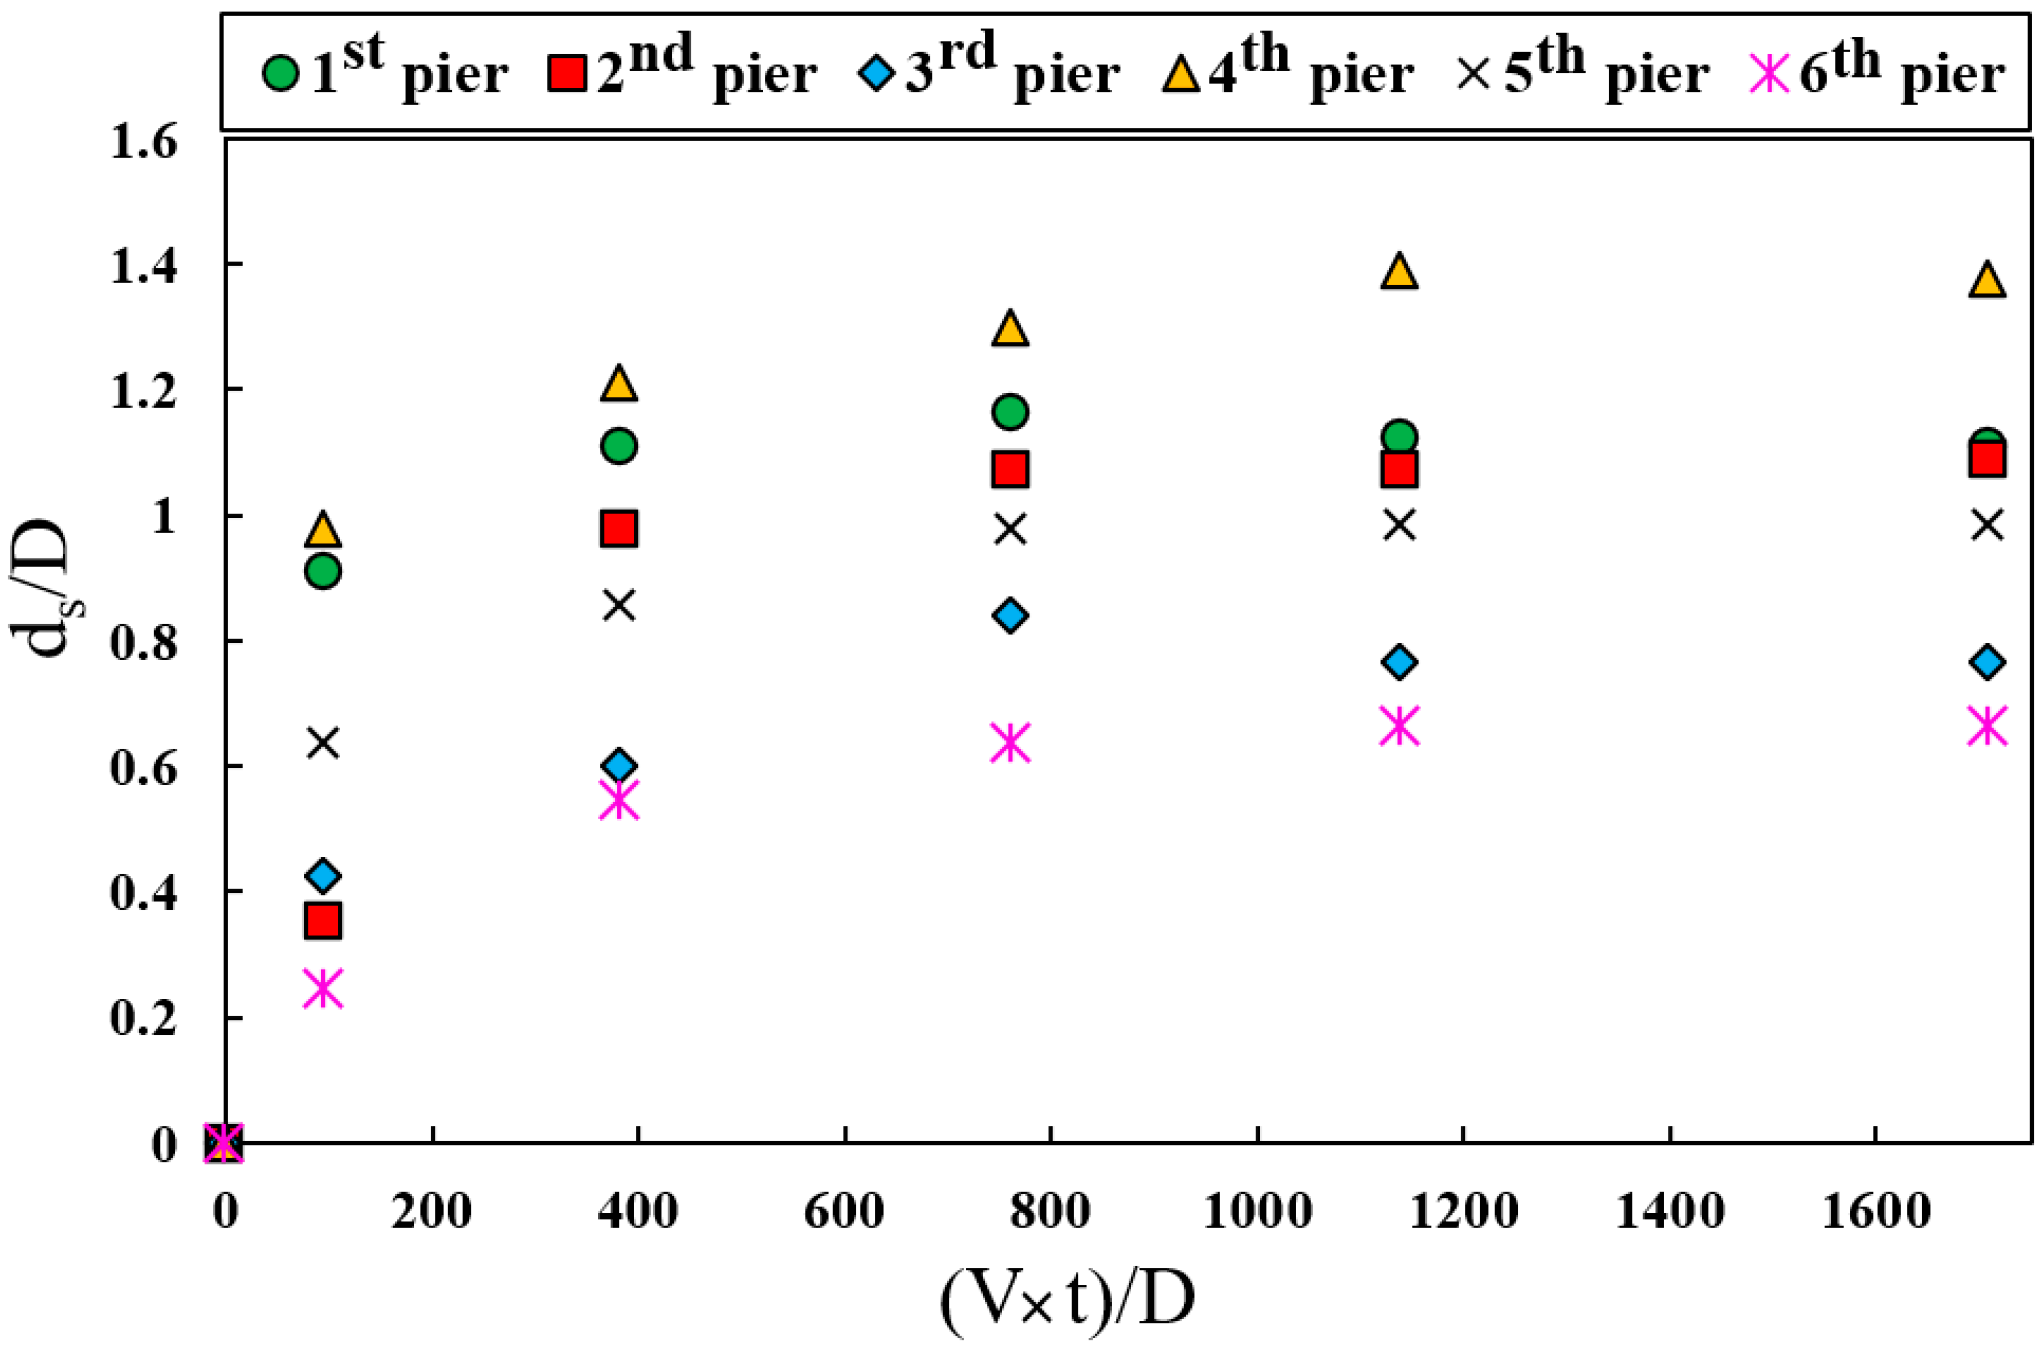
4.1. Results of Laboratory Study

Figure 6 shows the laboratory results, which include the scour depth around each bridge pier. According to Figure 6, the scour depth around the downstream pile group was greater than that of the upstream pile group. The maximum scour depth around the downstream piers occurred at pier 4 and was 12.4 cm, while for the upstream group, the most significant scouring occurred at pier 1 with a depth of 10.5 cm. The reason for this behavior is the presence of the material harvesting pit, which caused turbulence in the flow and increased the scour depth around the downstream pile group.

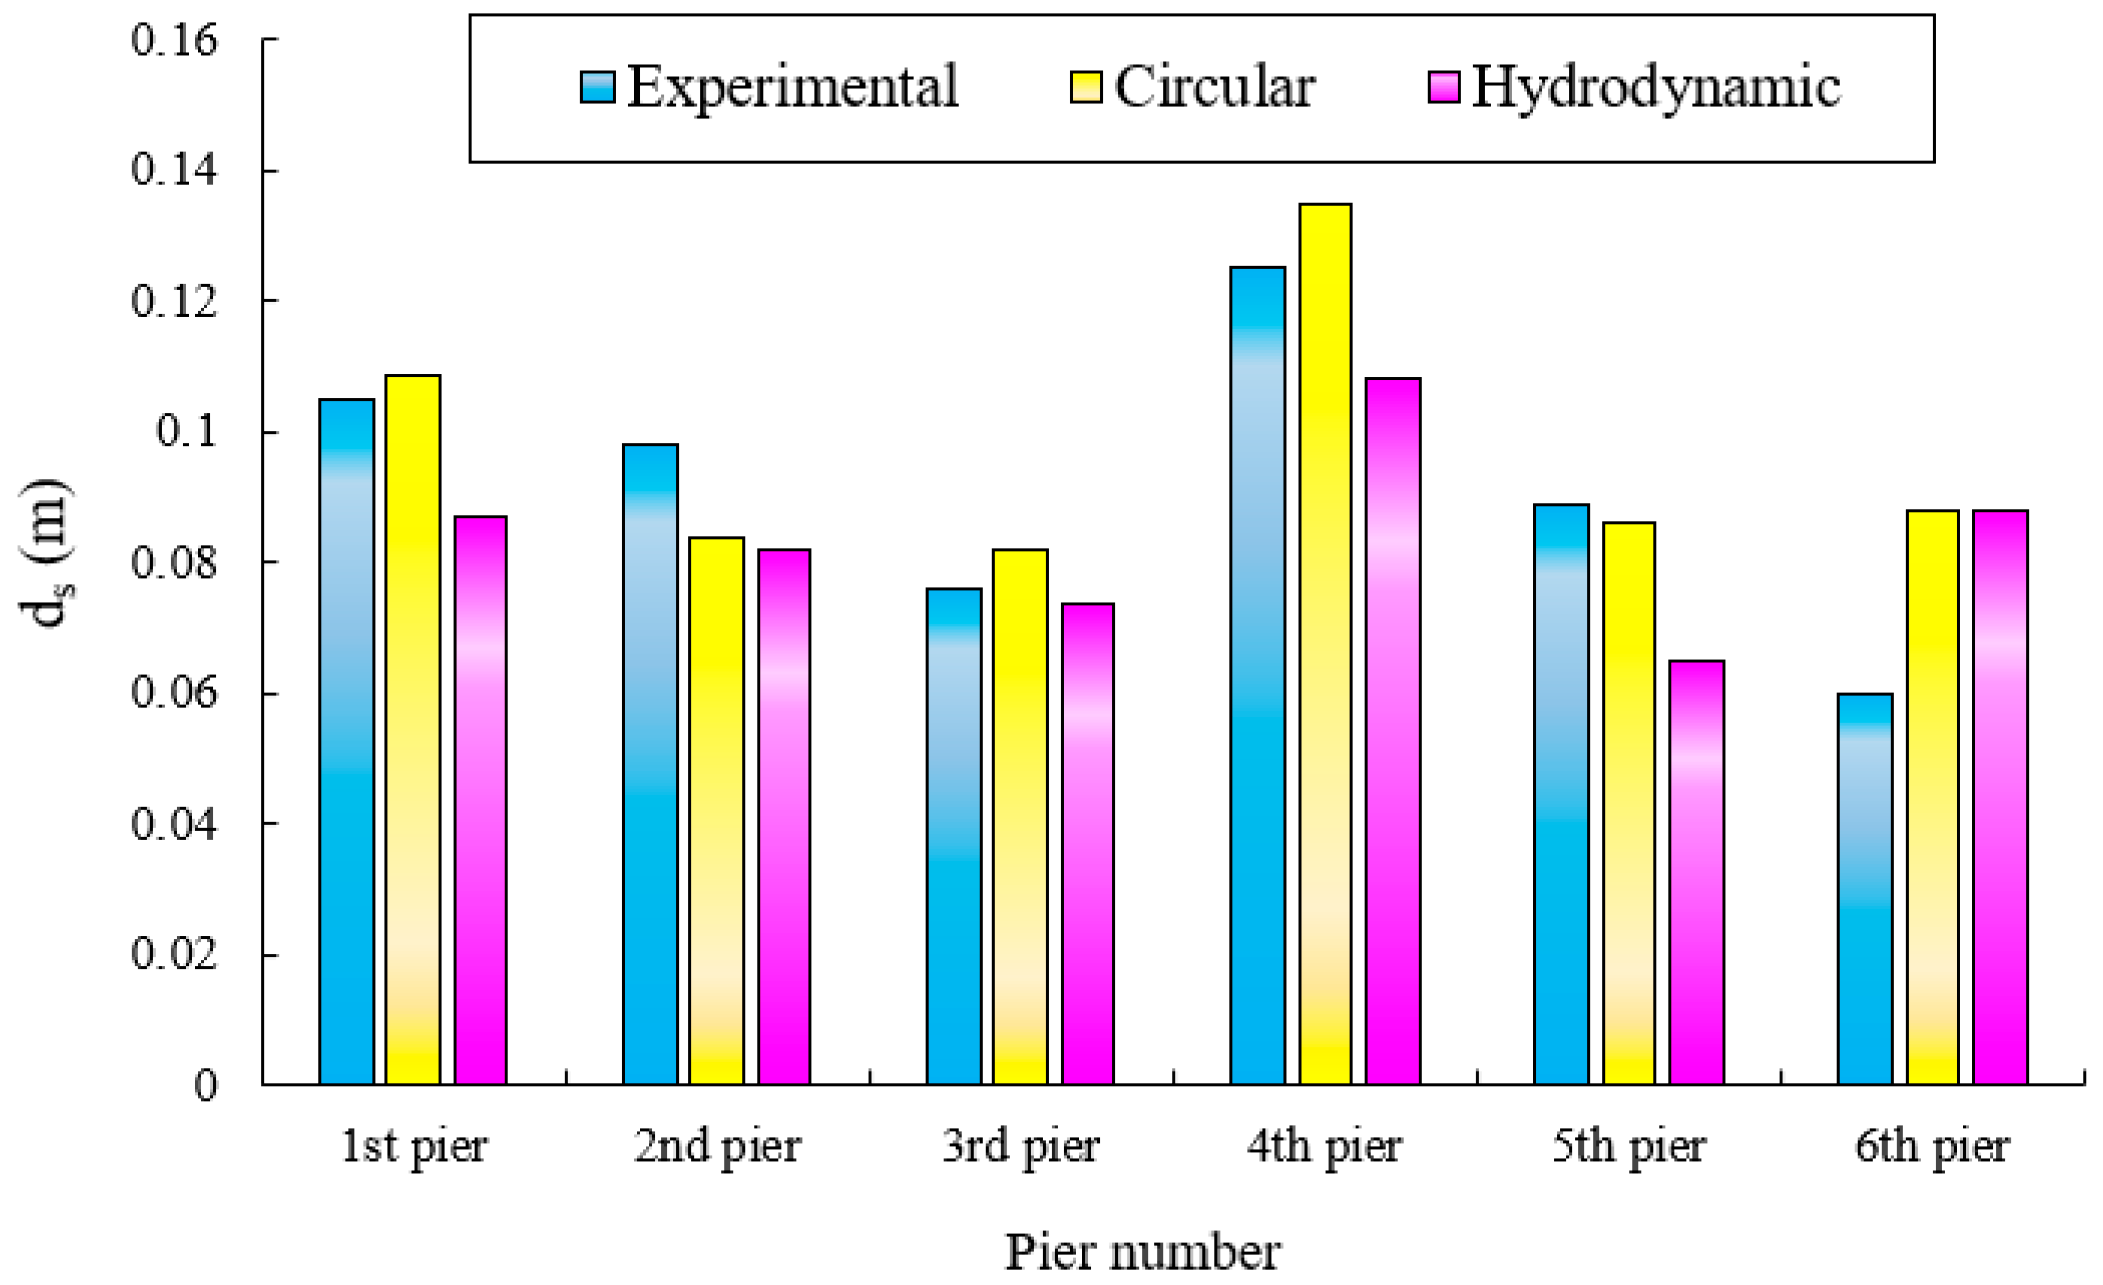
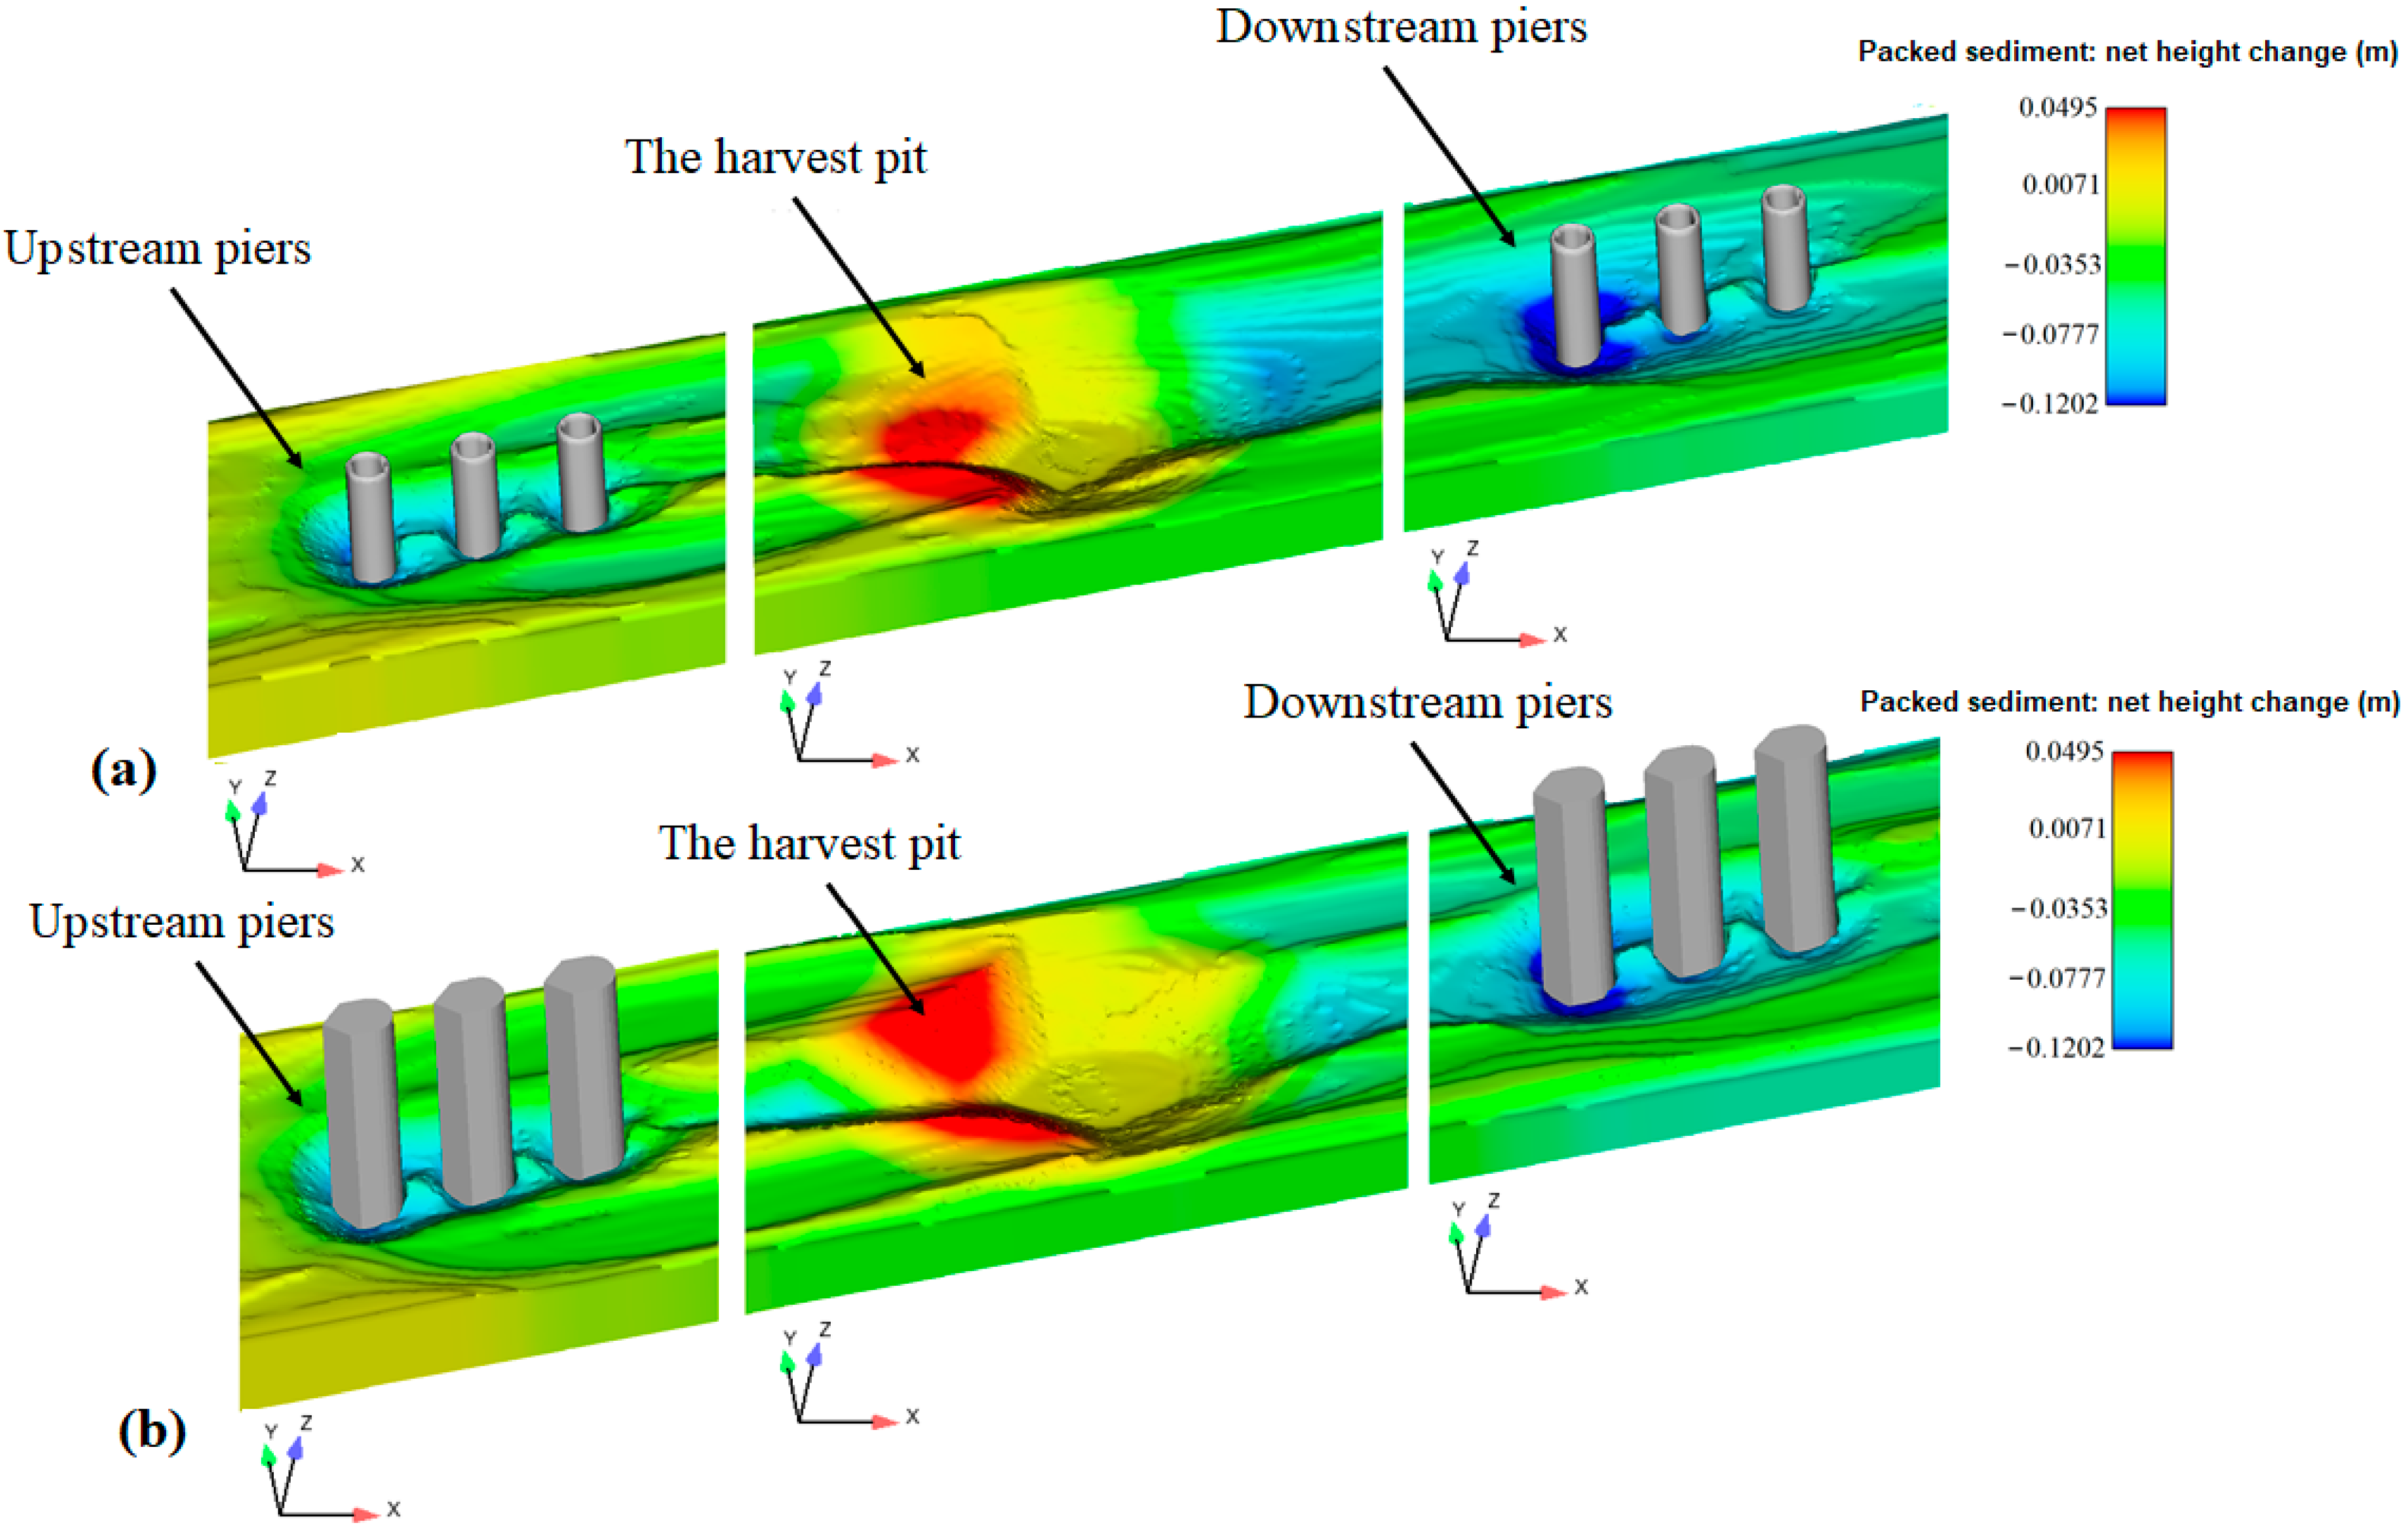
4.2. Comparison of Scour for the Hydrodynamic and Circular Pile Groups

Figure 7 shows the evolution of time-dependent scour depths. It can be seen that the use of hydrodynamic piers reduced the scour depths for all piers. According to Figure 7, for the circular model, the maximum scouring depth was 13.4 cm and this occurred at the fourth pier. For the hydrodynamic model, the corresponding maximum scour was, instead, 10.8 cm. A comparison between the circular and hydrodynamic models showed that maximum reduction of the scour depth occurred at the fifth pier in the hydrodynamic model, with a 29% reduction. The reduction in scour depths is related to the reduced turbulence engendered by the hydrodynamic shape. Reducing the turbulence of the flow around the piers reduces the strength of the horseshoe vortices and causes less sediment to be transported downstream by the flow vortices. The simulated maximum scour depths are summarized in Figure 8 and Table 4.

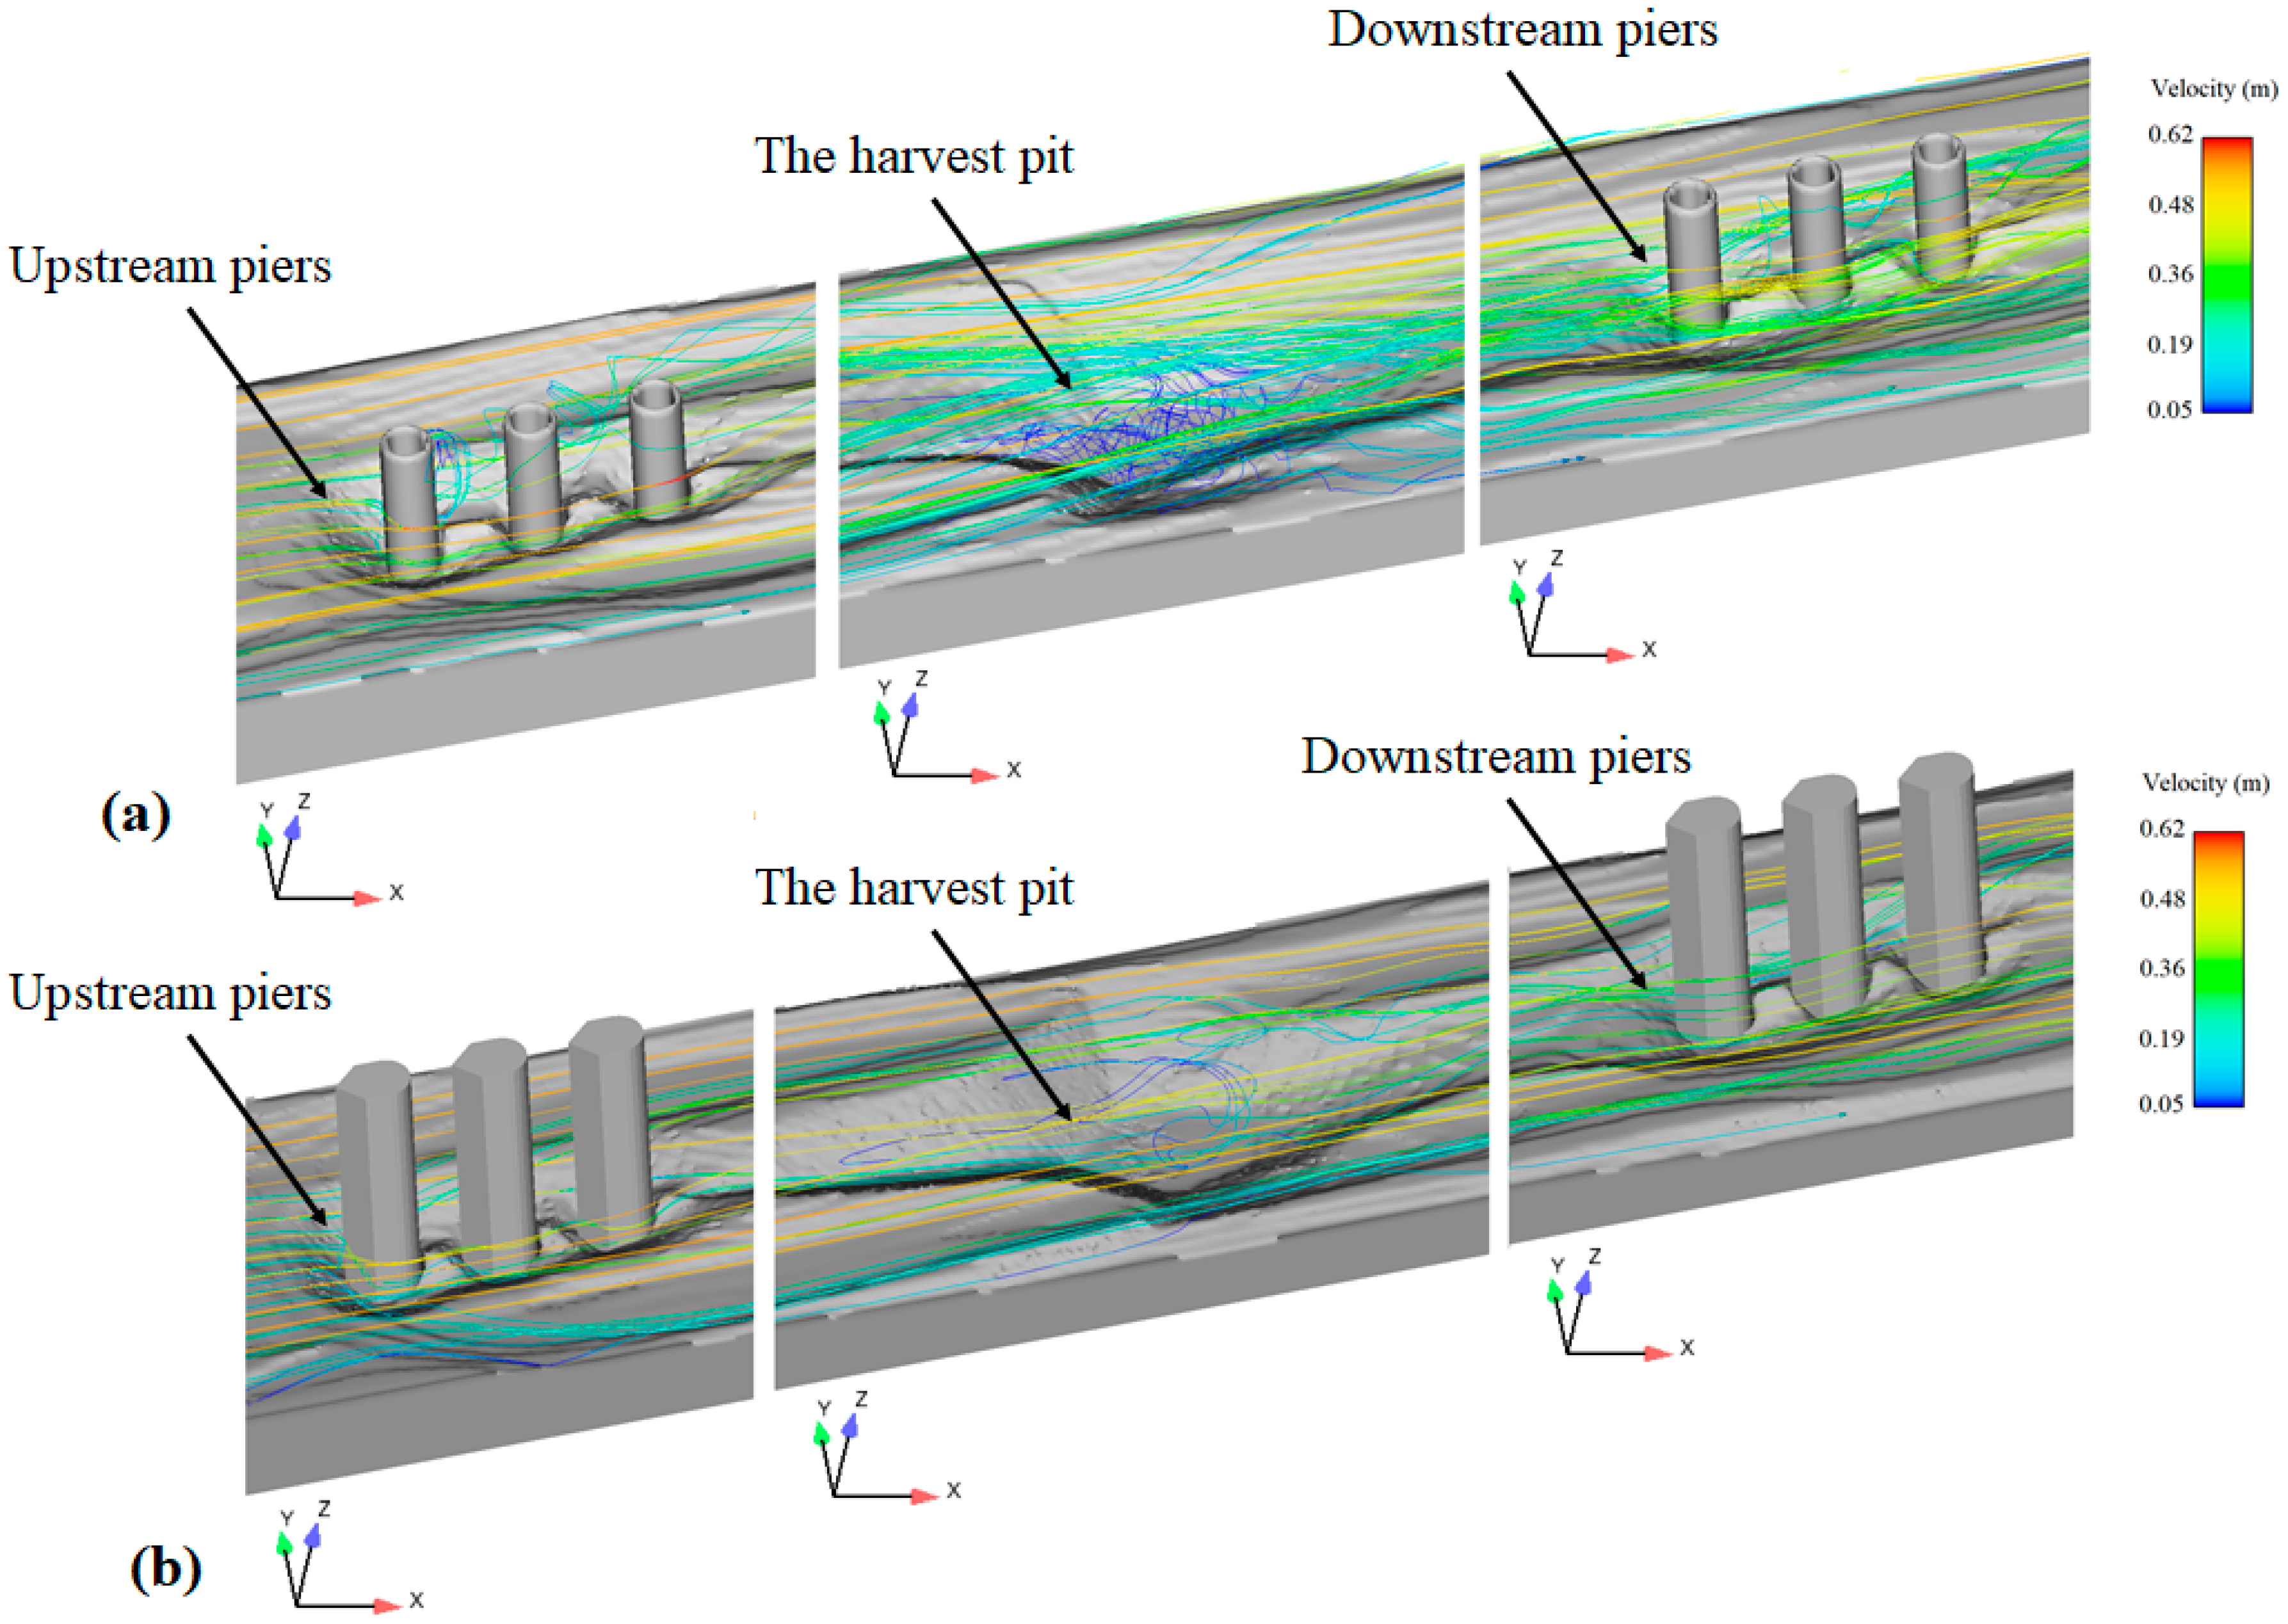
4.3. Flow Patterns around the Hydrodynamic and Circular Pile Groups

The flow patterns around the pile groups were different compared to the single pier. For a group, the first pier was a barrier to the flow and caused turbulence and a vortex flow pattern. Subsequently, the presence of the second pier reduced this turbulence and caused a sheltering effect. The third pier, in addition to playing a protective role for the rearward side of the second pier, also experienced less scouring due to the deposition of washed particles from around the second pier. Figure 9 shows the flow pattern around the pile groups upstream and downstream of the material harvest pit. The graphs correspond to the instantaneous velocity at the end of the simulation, at which point the scouring was balanced. According to this figure, for both the circular and hydrodynamic piers, the flow velocity in the wake regions behind the piers was very small, while a maximum value occurred at the sides of the piers. In the circular model, the flow lines struck the surface of the first pier and then abruptly deflected to the sides. However, for the hydrodynamic piers, the fluid flow was split more gradually, so that sudden flow deviation was avoided.
The presence of the harvest pit caused turbulence in the downstream areas. For the upstream pile group, the prevailing flow was uniform. This uniform flow was disturbed by its collision with the first pier, while the turbulence of the flow around the downstream pile group was due to both collisions of the flow with the downstream pile group and advection of the turbulence from the upstream locations. The hydrodynamic piers led to a reduction in the maximum velocity adjacent to the upstream group and a reduction in the maximum velocity of the downstream group.
For the upstream pile group, the maximum local velocity was associated with a circular shape and took on a value of 0.67 m/s. For the hydrodynamic model, this quantity decreased by 5% to a value of 0.63 m/s. In the downstream pile group, the maximum value occurred with the hydrodynamic model and was 0.67 m/s. Considering that the distance between piers in the hydrodynamic model (0.076 m) was less than in the circular model (0.12), based on Figure 9, it can be found that the protective role between the piers due to increased pier interference in the hydrodynamic model was larger than in the circular model.

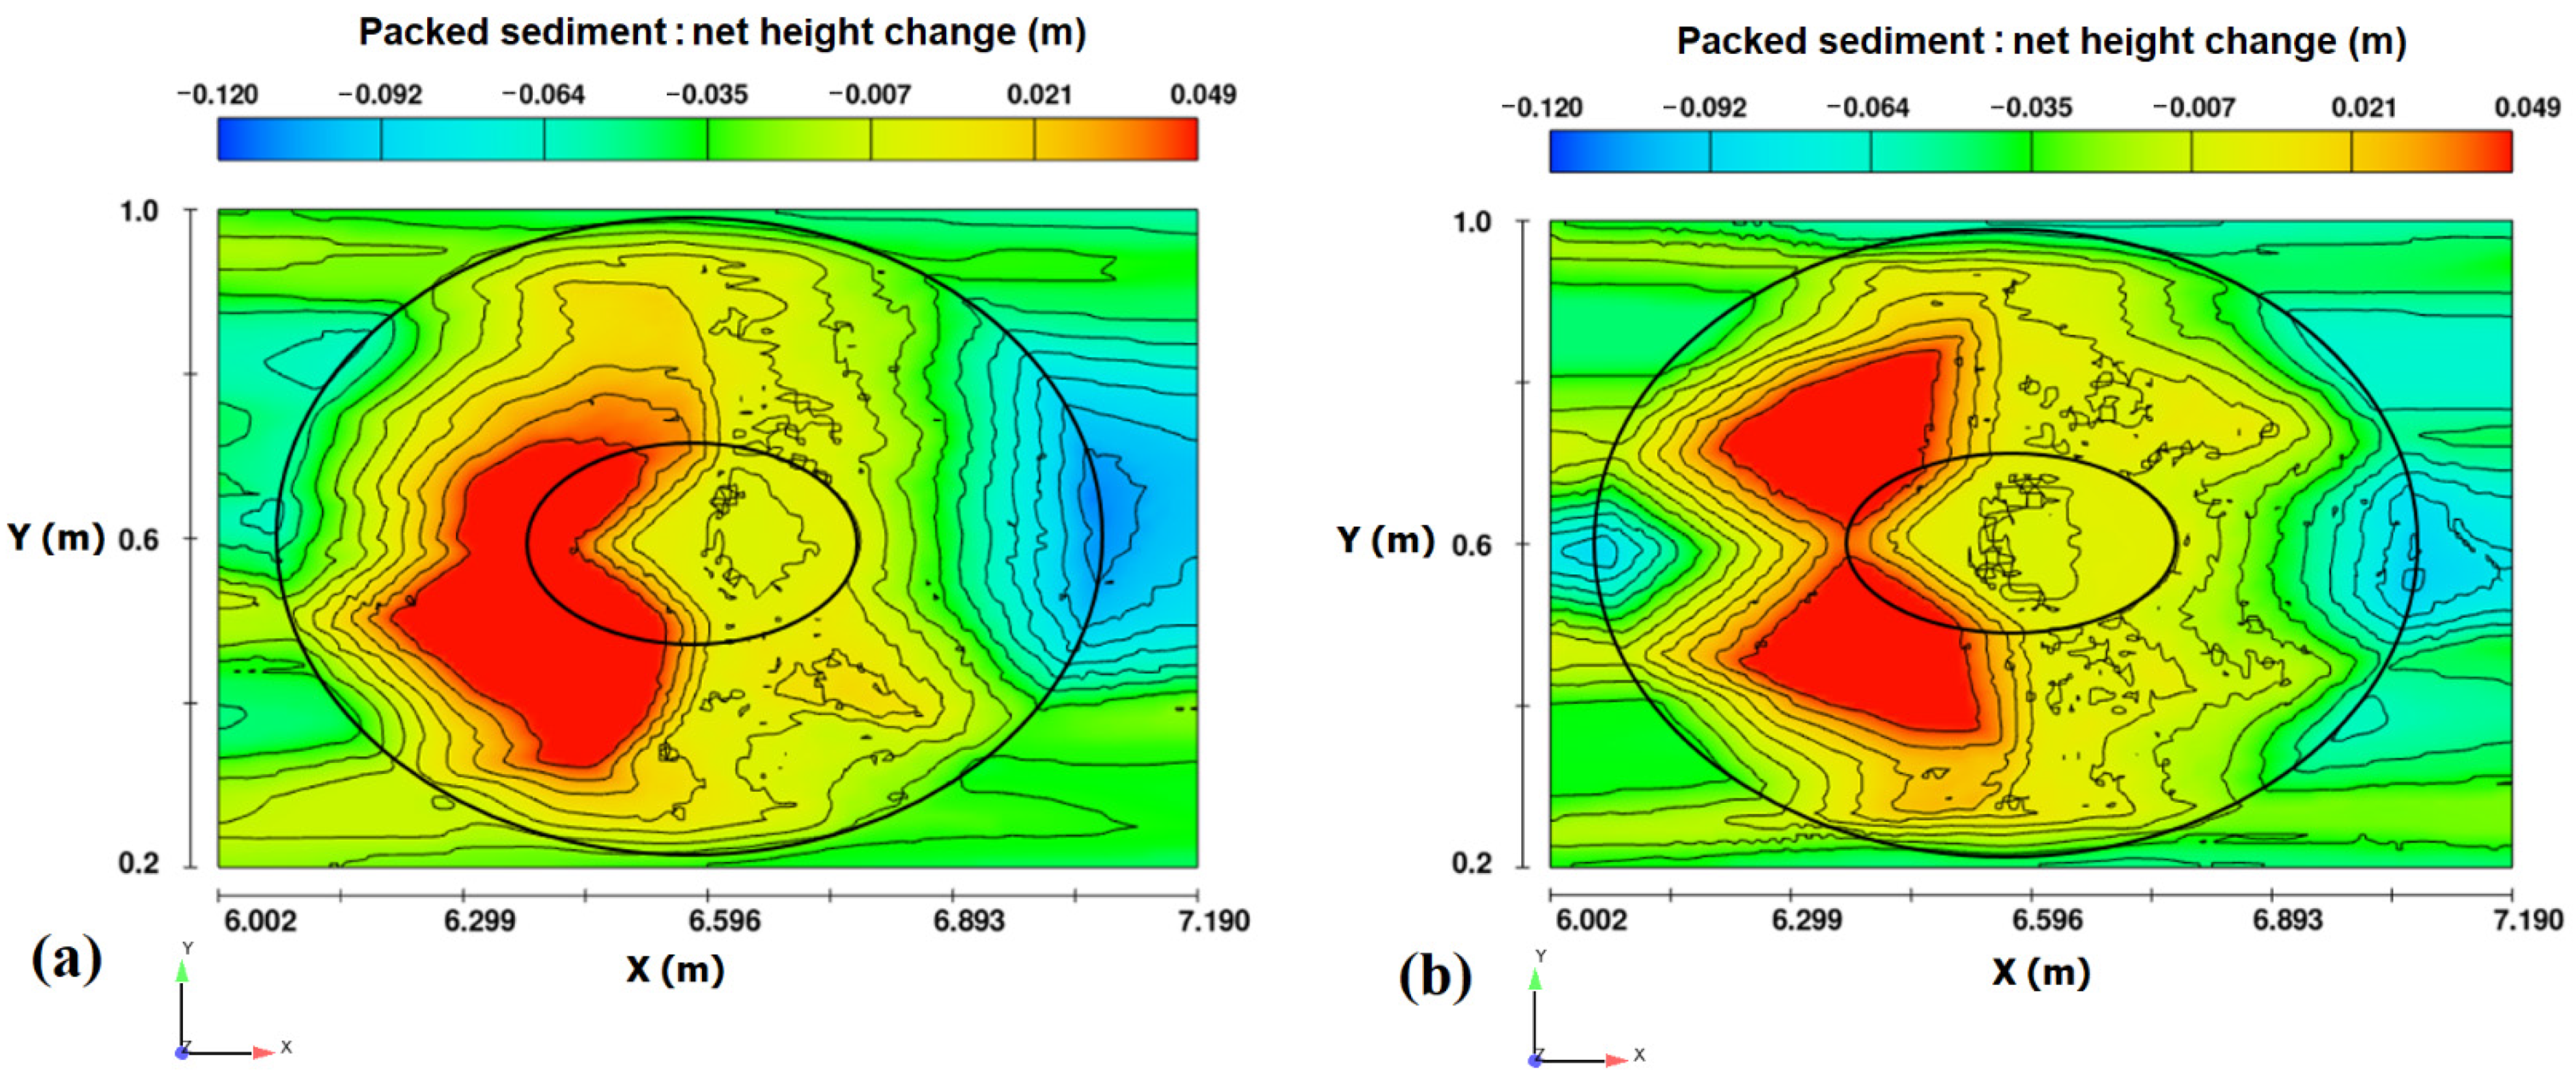
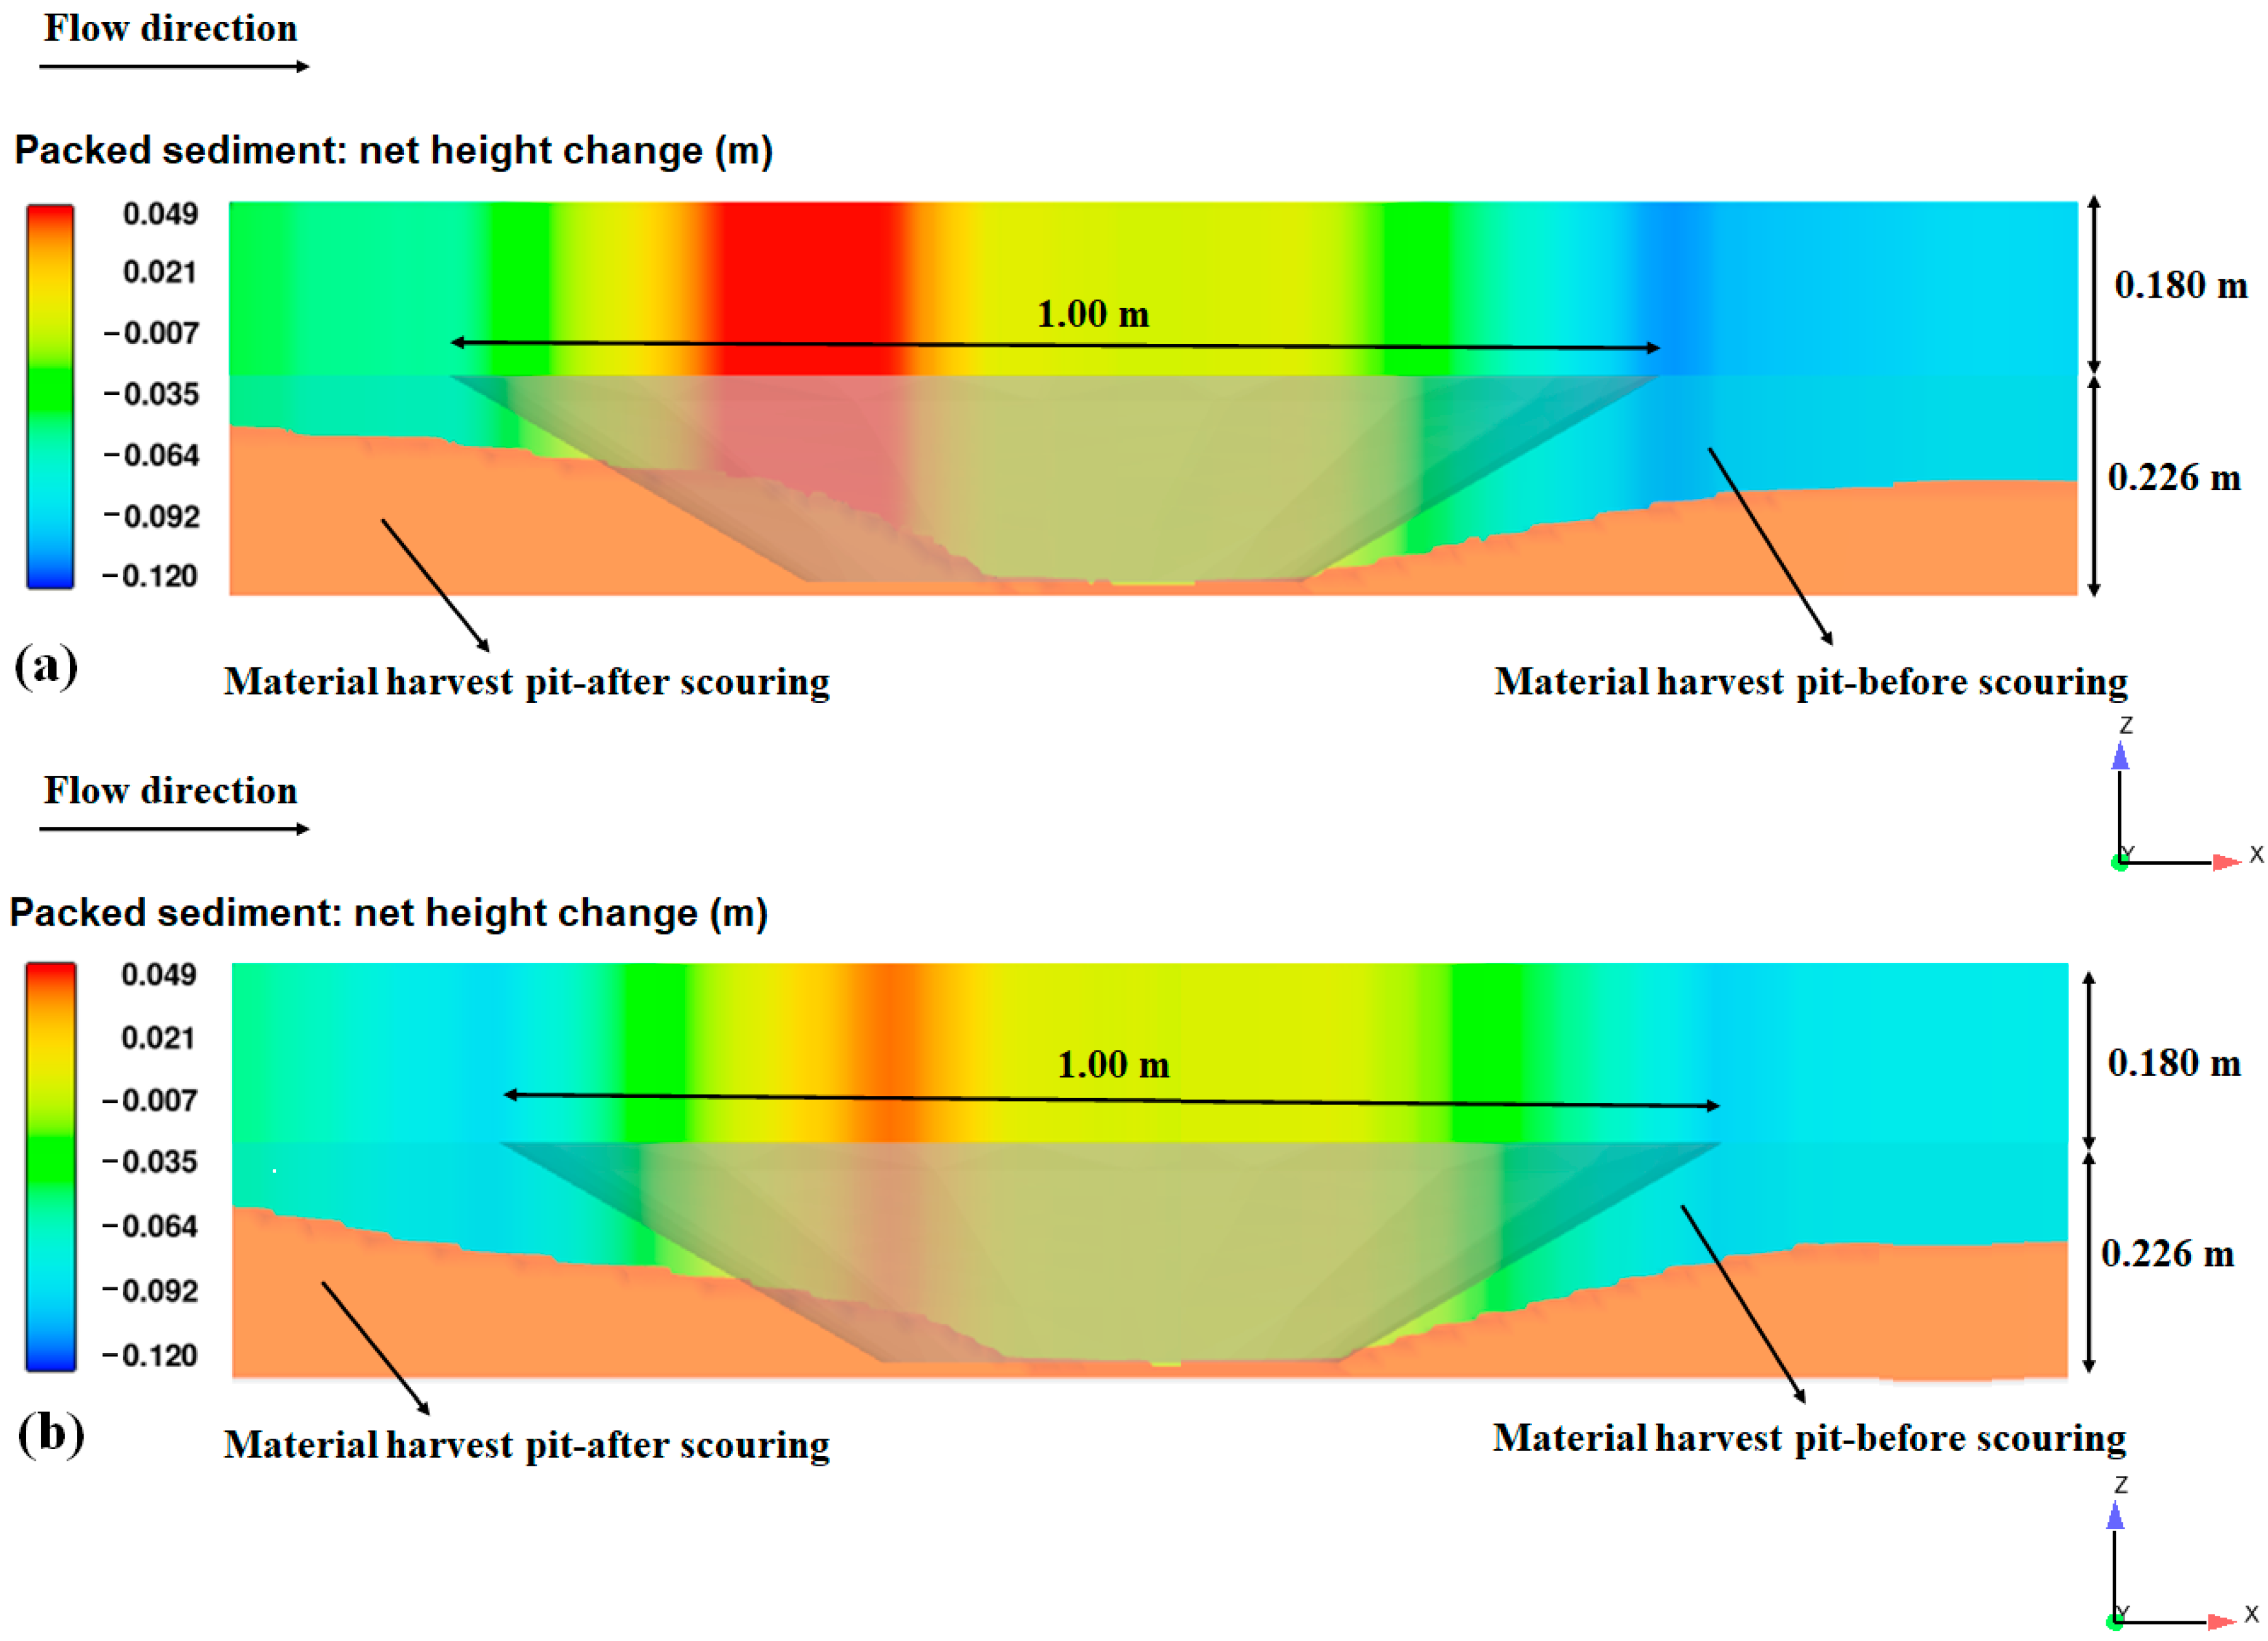
4.4. Investigation of the Material Harvest Pit Changes

The final shapes of the scouring around the group piles and the material harvest pit are shown in Figure 10. In these figures, the negative and positive elevation changes reflect areas that were eroded and built up, respectively. In Figure 10, the upstream portion of the harvesting pit experienced sediment deposition, whereas the more downstream locations experienced erosion. The source of the upstream deposition came from locations such as the crown of the pit and the upstream piles. The harvest pit for the hydrodynamic model exhibited less changes compared to the circular model. The maximum erosion for the circular model was 11.3 cm, which in the hydrodynamic model decreased by 17% to 9.3 cm. The reduction in scouring was related to the reduced volume of particles that had been transferred into the harvest pit (see Figure 11).
Figure 12 shows the longitudinal profiles of the harvest pit in the x–z plane, while Figure 13 shows the changes in the material harvest pit in the y–z plane. The water flow expanded the dimensions of the material harvesting pit in both the transverse and longitudinal directions. However, the expansion of the pit in the downstream direction, relative to the width of the pit, was so great that it can be clearly seen that the material harvesting pit moved downstream.

5. Conclusions

The current study investigated local scour around pile groups positioned upstream and downstream of a harvest pit. Both circular and hydrodynamic shaped piers were considered. The key findings of the comparative analysis are given below.
After passing over a pit, the flow approached the downstream pile group with higher mean velocities and increased turbulent stresses. Thus, the scour depth around the downstream pile group was greater than that of the upstream pile group.
The hydrodynamic piers reduced the scour depth in front of all piers, thanks to the alignment of the piers in the flow and their consequent reduction in turbulence. The maximum scour depth reduction (reduction of 29%) occurred at the fifth pier in the hydrodynamic model.
The material harvest pit was moved downstream and the evolution of local scour was remarkably faster in the presence of a pit, especially in the downstream pile group. However, the changes to the pit were smaller when hydrodynamic piers were used, compared to circular piers. The maximum erosion for the circular piers was 11.3 cm, while for the hydrodynamic piers, the maximum erosion was 9.3 cm (a 17% reduction).
By comparing the flow patterns around the pile groups, both upstream and downstream of the material harvesting pit, it was observed that the presence of the pit caused turbulence in the downstream areas. The evaluation of the flow patterns around the pile groups showed that for both pier shapes, the velocity downstream of the piers was minimal, while the velocities at the sides of the piers were maximum.
Thus, mining activities upstream of pile groups cause local scouring around piers and excess riverbed erosion. These alterations in the flow field and morphology around piers caused by mining activities can jeopardize the stability of such hydraulic structures.

Author Contributions

Conceptualization, R.D., A.G., M.S., B.A., M.M.A. and S.D.F.; methodology, R.D., A.G., M.S., B.A., M.M.A. and S.D.F.; software, A.G. and M.S.; validation, A.G. and M.S.; formal analysis, R.D., A.G. and M.S.; investigation, R.D., A.G., M.S., B.A., M.M.A. and S.D.F.; resources, R.D., A.G. and M.S.; data curation, R.D., A.G. and M.S.; writing—original draft preparation, R.D., A.G., M.S., B.A., M.M.A. and S.D.F.; writing—review and editing, R.D., A.G., M.S., B.A., M.M.A. and S.D.F.; visualization, A.G. and M.S.; supervision, R.D., B.A. and M.M.A.; project administration, R.D., A.G., B.A. and M.M.A. All authors have read and agreed to the published version of the manuscript.

Funding

This research received no external funding.

Institutional Review Board Statement

Not applicable.

Informed Consent Statement

Not applicable.

Data Availability Statement

All data are contained within the article.

Acknowledgments

The authors express their sincere thanks to the Editor, Academic Editor, Associate Editor, and anonymous reviewers for devoting their precious time and providing useful suggestions and constructive comments.

Conflicts of Interest

The authors declare no conflict of interest.

References

  1. Koehnken, L.; Rintoul, M.S.; Goichot, M.; Tickner, D.; Loftus, A.C.; Acreman, M.C. Impacts of riverine sand mining on freshwater ecosystems: A review of the scientific evidence and guidance for future research. River Res. Appl. 2020, 36, 362–370. [Google Scholar] [CrossRef]
  2. Ataei-Ashtiani, B.; Beheshti, A.A. Experimental investigation of clear-water local scour at pile groups. J. Hydraul. Eng. 2006, 10, 1100–1104. [Google Scholar] [CrossRef] [Green Version]
  3. Zhou, Y.; Mahbub, A.M. Wake of two interacting circular cylinders: A review. Int. J. Heat Fluid Flow 2016, 62, 510–537. [Google Scholar] [CrossRef]
  4. Liang, F.; Wang, C.; Huang, M.; Wang, Y. Experimental observations and evaluations of formulae for local scour at pile groups in steady currents. Mar. Georesources Geotechnol. 2017, 35, 245–255. [Google Scholar] [CrossRef]
  5. Solaimani, N.; Amini, A.; Banejad, H.; Taherei Ghazvinei, P. The effect of pile spacing and arrangement on bed formation and scour hole dimensions in pile groups. Int. J. River Basin Manag. 2017, 15, 219–225. [Google Scholar] [CrossRef]
  6. Vaghefi, M.; Motlagh, M.J.T.N.; Hashemi, S.S.; Moradi, S. Experimental study of bed topography variations due to placement of a triad series of vertical piers at different positions in a 180 bend. Arab. J. Geosci. 2018, 11, 102. [Google Scholar] [CrossRef]
  7. Namaee, M.R.; Sui, J. Local scour around two side-by-side cylindrical bridge piers under ice-covered conditions. Int. J. Sediment Res. 2019, 34, 355–367. [Google Scholar] [CrossRef]
  8. Malik, R.; Setia, B. Interference between pier models and its effects on scour depth. SN Appl. Sci. 2020, 2, 68. [Google Scholar] [CrossRef] [Green Version]
  9. Yang, Y.; Qi, M.; Wang, X.; Li, J. Experimental study of scour around pile groups in steady flows. Ocean. Eng. 2020, 195, 106651. [Google Scholar] [CrossRef]
  10. Decker, C.; Keyes, J.; Jackson, C.R.; Shelton, J.; Jackson, B. The Effects of Sand Dredging on Channel Morphology, Habitat, and Water Quality in Urban DeKalb County Streams; Georgia Institute of Technology: Atlanta, GA, USA, 1999. [Google Scholar]
  11. Lee, H.Y.; Fu, D.T.; Song, M.H. Migration of rectangular mining pit composed of uniform sediment. J. Hydraul. Eng. 1993, 119, 64–80. [Google Scholar] [CrossRef]
  12. Cao, Z.; Pender, G. Numerical modeling of alluvial rivers subjected to interactive sediment mining and feeding. Adv. Water Resour. 2004, 27, 533–546. [Google Scholar] [CrossRef]
  13. Barman, B.; Kumar, B.; Sarma, A.K. Turbulent flow structures and geomorphic characteristics of a mining affected alluvial channel. Earth Surf. Proces. Landf. 2018, 43, 1811–1824. [Google Scholar] [CrossRef]
  14. Barman, B.; Kumar, B.; Sarma, A.K. Dynamic characterization of the migration of a mining pit in an alluvial channel. Int. J. Sediment Res. 2019, 34, 155–165. [Google Scholar] [CrossRef]
  15. Barman, B.; Sharma, A.; Kumar, B.; Sarma, A.K. Multiscale characterization of migrating sand wave in mining induced alluvial channel. Ecol. Eng. 2017, 102, 199–206. [Google Scholar] [CrossRef]
  16. Neyshabouri, S.A.A.S.; Farhadzadeh, A.; Amini, A. Experimental and field study of mining pit migration. Int. J. Sedim. Res. 2002, 17, 323–333. [Google Scholar]
  17. Barman, B.; Kumar, B.; Sarma, A.K. Impact of sand mining on alluvial channel flow characteristics. Ecol. Eng. 2019, 135, 36–44. [Google Scholar] [CrossRef]
  18. Lade, A.D.; Deshpande, V.; Kumar, B.; Oliveto, G. On the Morphodynamic Alterations around Bridge Piers under the Influence of Instream Mining. Water 2019, 11, 1676. [Google Scholar] [CrossRef] [Green Version]
  19. Majedi-Asl, M.; Daneshfaraz, R.; Abraham, J.; Valizadeh, S. Effects of Hydraulic Characteristics, Sedimentary Parameters, and Mining of Bed Material on Scour Depth of Bridge Pier Groups. J. Perform. Constr. Facil. 2020, 35, 04020148. [Google Scholar] [CrossRef]
  20. Daneshfaraz, R.; Sattariyan Karajabad, M.; Alinejad, B.; Majedi-Asl, M. Experimental Investigation of the Effects of Flow Discharge on the Scour Rate around the Groups of Bridge Piers with a Rough Surface in the Presence of Aggregate Extraction Pits. JWSS 2021, 24, 111–125. [Google Scholar]
  21. Mastbergen, D.R.; van den Berg, J.H. Breaching in fine sands and the generation of sustained turbidity currents in submarine canyons. Sedimentology 2003, 50, 625–637. [Google Scholar] [CrossRef]
  22. Chiew, Y.M.; Melville, B.W. Local scour around bridge piers. J. Hydraul. Res. 1987, 25, 15–26. [Google Scholar] [CrossRef]
  23. Melville, B.W.; Chiew, Y.M. Time scale for local scour at bridge piers. J. Hydraul. Eng. 1999, 125, 59–65. [Google Scholar] [CrossRef]
  24. Ghaderi, A.; Daneshfaraz, R.; Torabi, M.; Abraham, J.; Azamathulla, H.M. Experimental investigation on effective scouring parameters downstream from stepped spillways. Water Supply 2020, 20, 1988–1998. [Google Scholar] [CrossRef]
  25. Flow Science Inc. FLOW-3D V 11.2 User’s Manual; Flow Science, Inc.: Santa Fe, NM, USA, 2016. [Google Scholar]
  26. Abbasi, S.; Fatemi, S.; Ghaderi, A.; Di Francesco, S. The Effect of Geometric Parameters of the Antivortex on a Triangular Labyrinth Side Weir. Water 2021, 13, 14. [Google Scholar] [CrossRef]
  27. Daneshfaraz, R.; Ghaderi, A.; Akhtari, A.; Di Francesco, S. On the Effect of Block Roughness in Ogee Spillways with Flip Buckets. Fluids 2020, 5, 182. [Google Scholar] [CrossRef]
  28. Baykal, C.; Sumer, B.M.; Fuhrman, D.R.; Jacobsen, N.G.; Fredsøe, J. Numerical simulation of scour and backfilling processes around a circular pile in waves. Coast. Eng. 2017, 122, 87–107. [Google Scholar] [CrossRef] [Green Version]
  29. Li, Y.; Ong, M.C.; Fuhrman, D.R.; Larsen, B.E. Numerical investigation of wave-pluscurrent induced scour beneath two submarine pipelines in tandem. Coast. Eng. 2020, 156, 103619. [Google Scholar] [CrossRef]
  30. Ghaderi, A.; Abbasi, S. CFD simulation of local scouring around airfoil-shaped bridge piers with and without collar. Sādhanā 2019, 44, 216. [Google Scholar] [CrossRef] [Green Version]
  31. Li, Y.; Ong, M.C.; Fuhrman, D.R. CFD investigations of scour beneath a submarine pipeline with the effect of upward seepage. Coast. Eng. 2020, 156, 103624. [Google Scholar] [CrossRef]
  32. Ghaderi, A.; Dasineh, M.; Aristodemo, F.; Aricò, C. Numerical Simulations of the Flow Field of a Submerged Hydraulic Jump over Triangular Macroroughnesses. Water 2021, 13, 674. [Google Scholar] [CrossRef]
  33. Fuhrman, D.R.; Schløer, S.; Sterner, J. RANS-based simulation of turbulent wave boundary layer and sheet-flow sediment transport processes. Coast. Eng. 2013, 73, 151–166. [Google Scholar] [CrossRef]
  34. Choufu, L.; Abbasi, S.; Pourshahbaz, H.; Taghvaei, P.; Tfwala, S. Investigation of Flow, Erosion, and Sedimentation Pattern around Varied Groynes under Different Hydraulic and Geometric Conditions: A Numerical Study. Water 2019, 11, 235. [Google Scholar] [CrossRef] [Green Version]
  35. Ghaderi, A.; Daneshfaraz, R.; Dasineh, M.; Di Francesco, S. Energy Dissipation and Hydraulics of Flow over Trapezoidal–Triangular Labyrinth Weirs. Water 2020, 12, 1992. [Google Scholar] [CrossRef]
  36. Ghaderi, A.; Daneshfaraz, R.; Dasineh, M. Evaluation and prediction of the scour depth of bridge foundations with HEC-RAS numerical model and empirical equations (Case Study: Bridge of Simineh Rood Miandoab, Iran). Eng. J. 2019, 23, 279–295. [Google Scholar] [CrossRef]
  37. Daneshfaraz, R.; Aminvash, E.; Ghaderi, A.; Kuriqi, A.; Abraham, J. Three-Dimensional Investigation of Hydraulic Properties of Vertical Drop in the Presence of Step and Grid Dissipators. Symmetry 2021, 13, 895. [Google Scholar] [CrossRef]
  38. Kirkil, G.; Constantinescu, G.; Ettema, R. Detached eddy simulation investigation of turbulence at a circular pier with scour hole. J. Hydraul. Eng. 2009, 135, 888–901. [Google Scholar] [CrossRef]
  39. McCoy, A.; Constantinescu, G.; Weber, L.J. Numerical investigation of flow hydrodynamics in a channel with a series of groynes. J. Hydraul. Eng. 2008, 134, 157–172. [Google Scholar] [CrossRef]
  40. Koken, M.; Constantinescu, G. An investigation of the flow and scour mechanisms around isolated spur dikes in a shallow open channel: 1. Conditions corresponding to the initiation of the erosion and deposition process. Water Resour. Res. 2008, 44. [Google Scholar] [CrossRef]
  41. Soulsby, R. Chapter 9: Bedload transport. In Dynamics of Marine Sands; Thomas Telford Publications: London, UK, 1997. [Google Scholar]
  42. Omara, H.; Elsayed, S.M.; Abdeelaal, G.M.; Abd-Elhamid, H.F.; Tawfik, A. Hydromorphological numerical model of the local scour process around bridge piers. Arab. J. Sci. Eng. 2019, 44, 4183–4199. [Google Scholar] [CrossRef]
  43. Ghaderi, A.; Abbasi, S. Experimental and Numerical Study of the Effects of Geometric Appendance Elements on Energy Dissipation over Stepped Spillway. Water 2021, 13, 957. [Google Scholar] [CrossRef]
  44. Raudkivi, A.J.; Ettema, R. Clear-water scour at cylindrical piers. J. Hydraul. Eng. 1983, 109, 338–350. [Google Scholar] [CrossRef]
Figure 1. Sediment bed, material harvesting pit, and arrangement of the bridge pile groups in the laboratory model.
Water 13 02192 g001
Figure 2. Simulated laboratory flume.
Water 13 02192 g002
Figure 3. Annotated boundary conditions.
Water 13 02192 g003
Figure 4. Comparison of scouring around the piers between the laboratory and numerical studies. (a) Laboratory scouring around the upstream and downstream pile groups. (b) Numerical scouring around the upstream and downstream pile groups. (c) Time changes of the local scouring depth in the laboratory model. (d) Comparison of the time changes of the local scouring depth between the laboratory model and the numerical simulation.
Water 13 02192 g004
Figure 5. 3D view of the hydrodynamic pile groups and the sediment bed (all dimensions are in meters).
Water 13 02192 g005
Figure 6. Dimensionless scour depths at various dimensionless times.
Water 13 02192 g006
Figure 7. Scour depths for the circular and hydrodynamic piers.
Water 13 02192 g007
Figure 8. Maximum scour depth in the group piers.
Water 13 02192 g008
Figure 9. Flow patterns for the pier group and the material harvest pit: (a) Circular model; (b) hydrodynamic model.
Water 13 02192 g009
Figure 10. Bed elevation changes from around the group piles and the material harvest pit: (a) Circular model; (b) hydrodynamic model.
Water 13 02192 g010
Figure 11. Changes in the harvest pit in the plane (plane x–y): (a) circular model, (b) hydrodynamic model.
Water 13 02192 g011
Figure 12. Material harvest pit changes in the x–z plane: (a) Circular model; (b) hydrodynamic model.
Water 13 02192 g012
Figure 13. Changes in the harvest pit in the y–z plane: (a) Circular model; (b) hydrodynamic model.
Water 13 02192 g013
Table 1. Specifications of the parameters for validation.
Test No.Q (L/s)y0 (m)u (m/s)FrReu/ucrd50 (m)Gsσg
T1450.1320.2840.2525,6000.720.000862.651.32
Table 2. Comparison of the numerical results for different mesh cell sizes with the laboratory results.
ModelNumber of Cellsds of the 1st Pier Upstream (m) E ( % ) = M exp M cal M exp × 100 ds of the 1st Pier Downstream (m) E ( % ) = M exp M cal M exp × 100
Physical model-0.1-0.124-
Mesh size 0.02 m307,3600.016840.02480
Mesh size 0.015 m707,7620.047530.05654
Mesh size 0.009 m3,332,5160.1076.70.1358.8
Table 3. Validation of the numerical simulations.
Pier NumberThe Dimensionless Scour Depth at the End of the Laboratory ModelThe Dimensionless Scour Depth at the End of the Numerical Model R 2 M A E   R M S E E
1st1.12261.18760.990.050.060.06
2nd1.09890.94040.990.100.130.15
3rd0.76470.98260.930.100.140.21
4th1.4051.50090.920.140.210.07
5th0.99401.0200.950.080.150.03
6th0.67101.07920.980.140.210.36
Table 4. Comparison of the maximum scour depths.
Pier Model1st Pier2nd Pier3rd Pier4th Pier5th Pier6th Pier
Scour depth around the
hydrodynamic piers (m)
0.08680.08210.07340.10830.06430.0880
Scour depth around the
circular piers (m)
0.10670.08380.08830.13490.09150.0968
Publisher’s Note: MDPI stays neutral with regard to jurisdictional claims in published maps and institutional affiliations.

