
Comprehensive Insight into Lake Nasser Environment: Water Quality and Biotic Communities—A Case Study before Operating the Renaissance Dam

 , , , , ,
Abstract
:1. Introduction
2. Materials and Methods
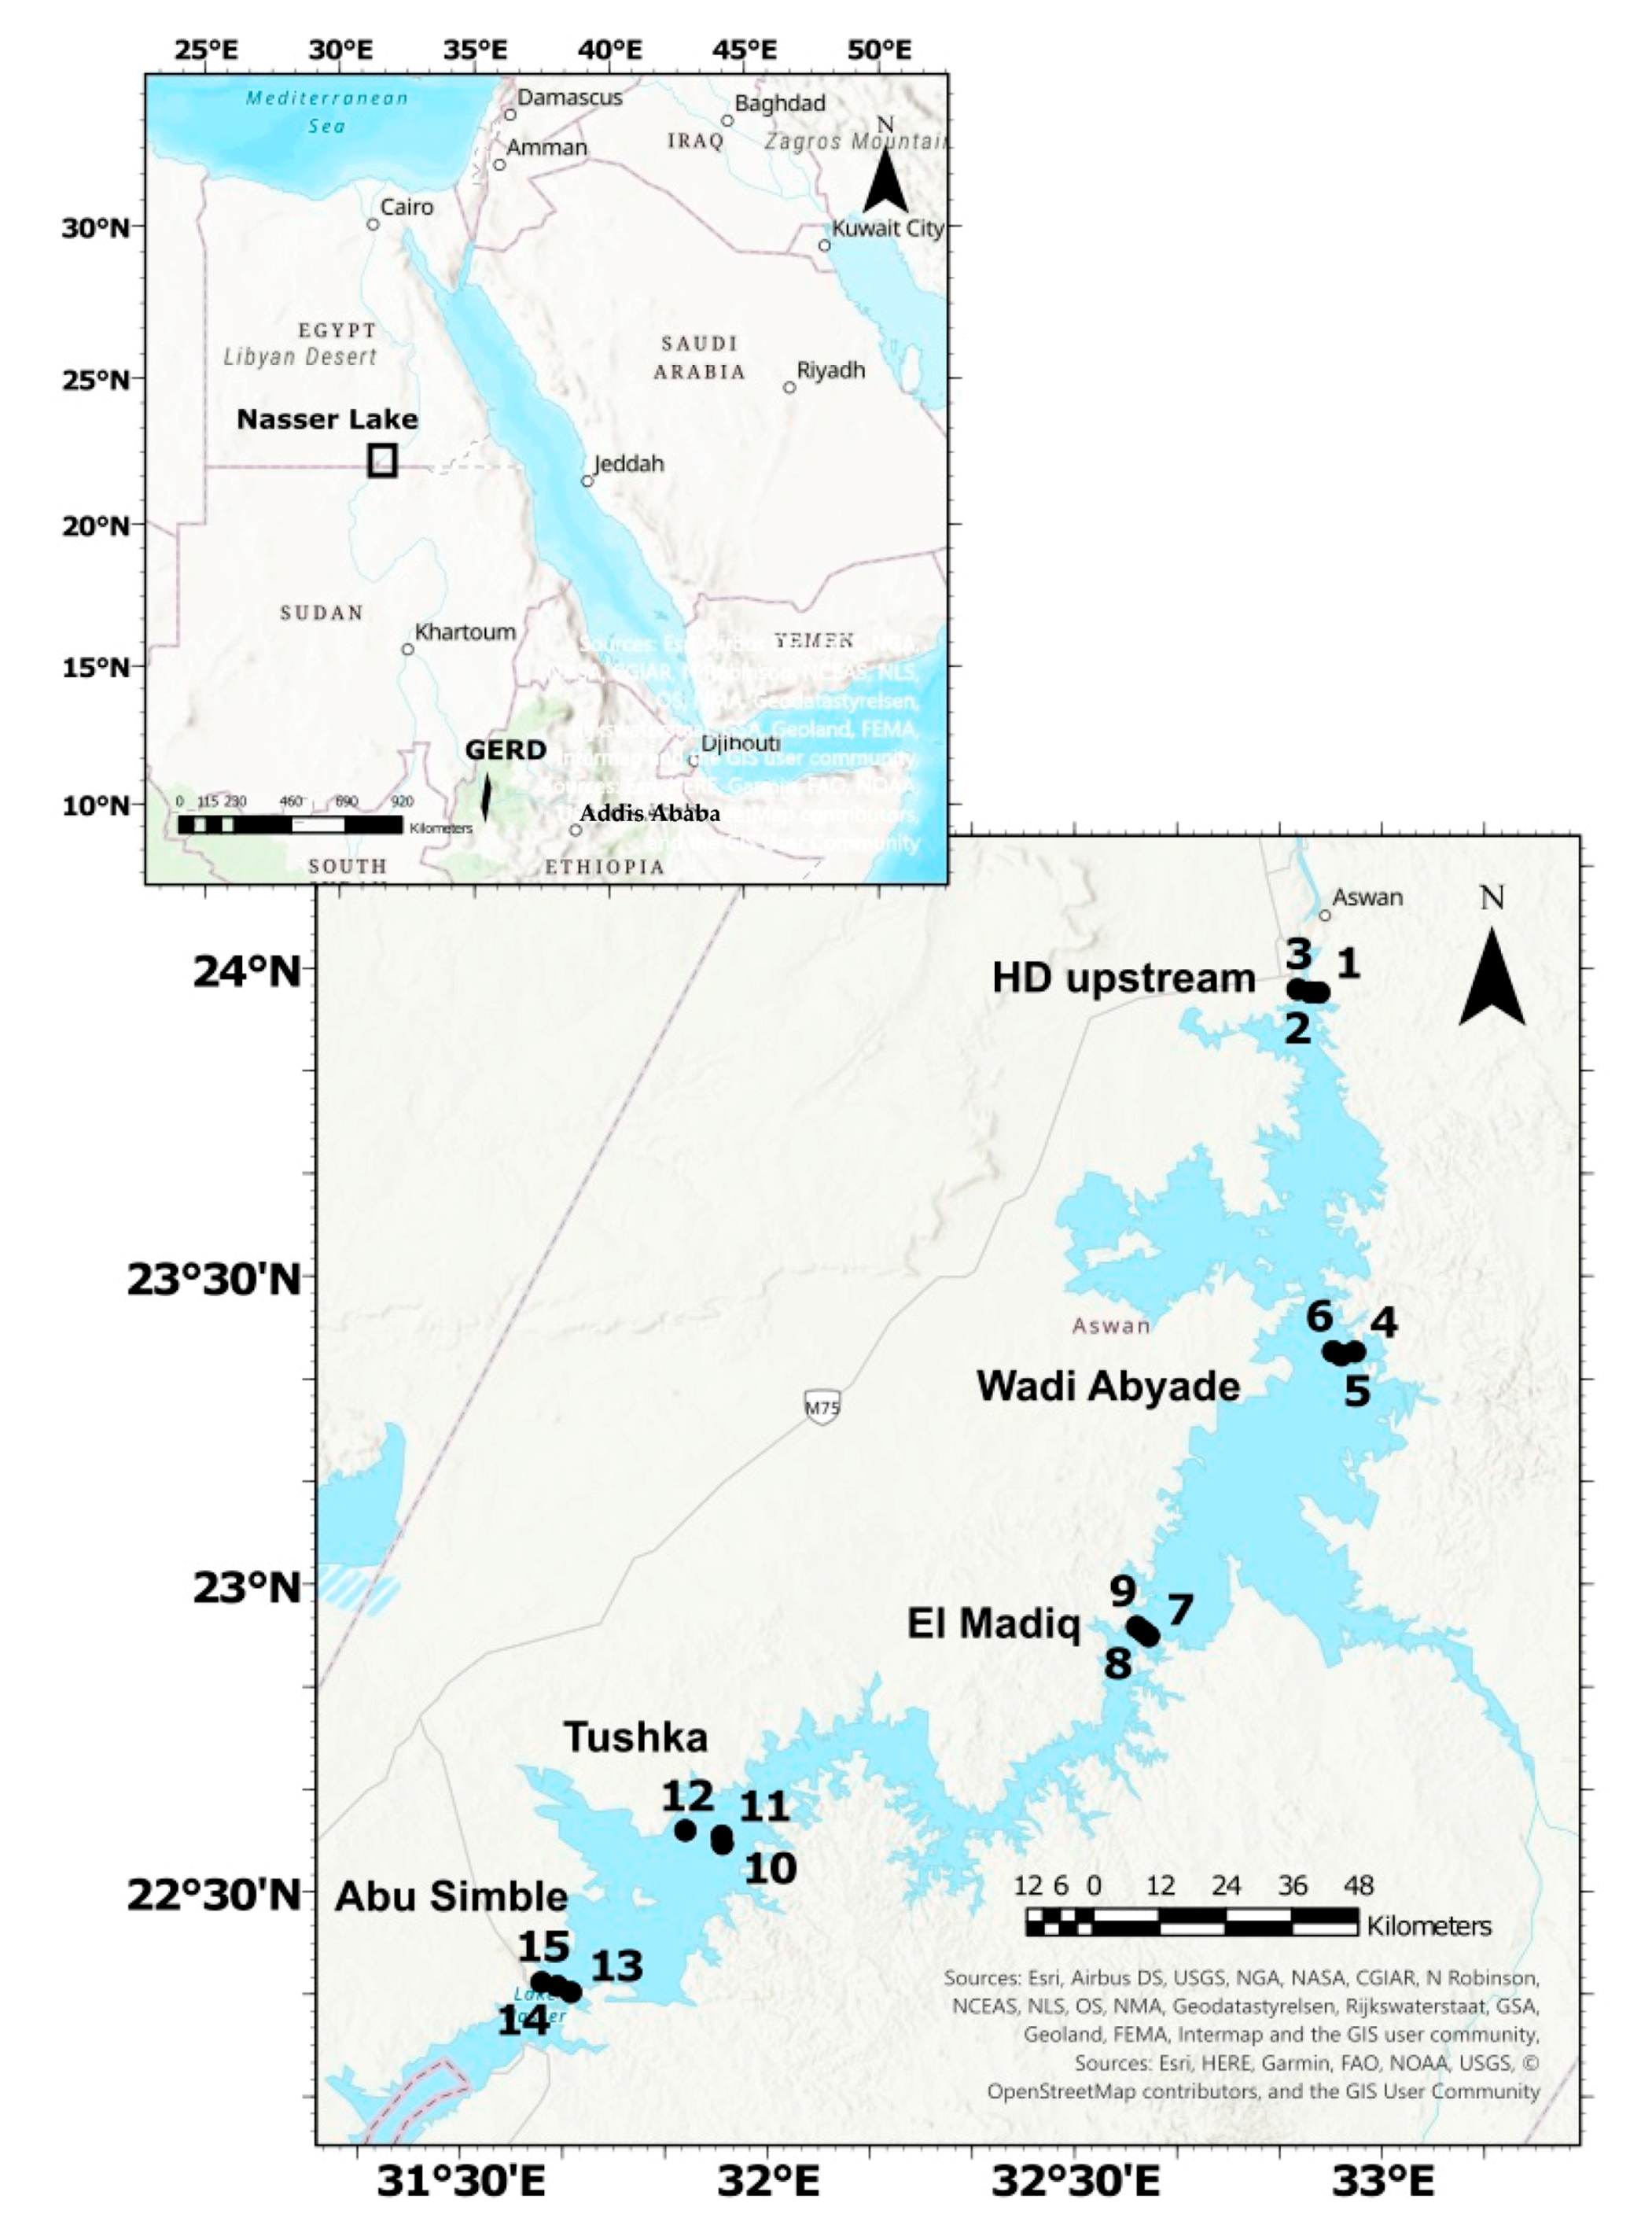
2.1. Study Area
2.2. Sampling Program and Methods
2.3. Physicochemical Parameters
2.4. Bacteria
2.5. Phytoplankton
2.6. Zooplankton
2.7. Macrophytes and Epiphytes
2.8. Fish
2.9. Statistical Analyses
3. Results
3.1. Physicochemical Parameters
3.2. Bacteria
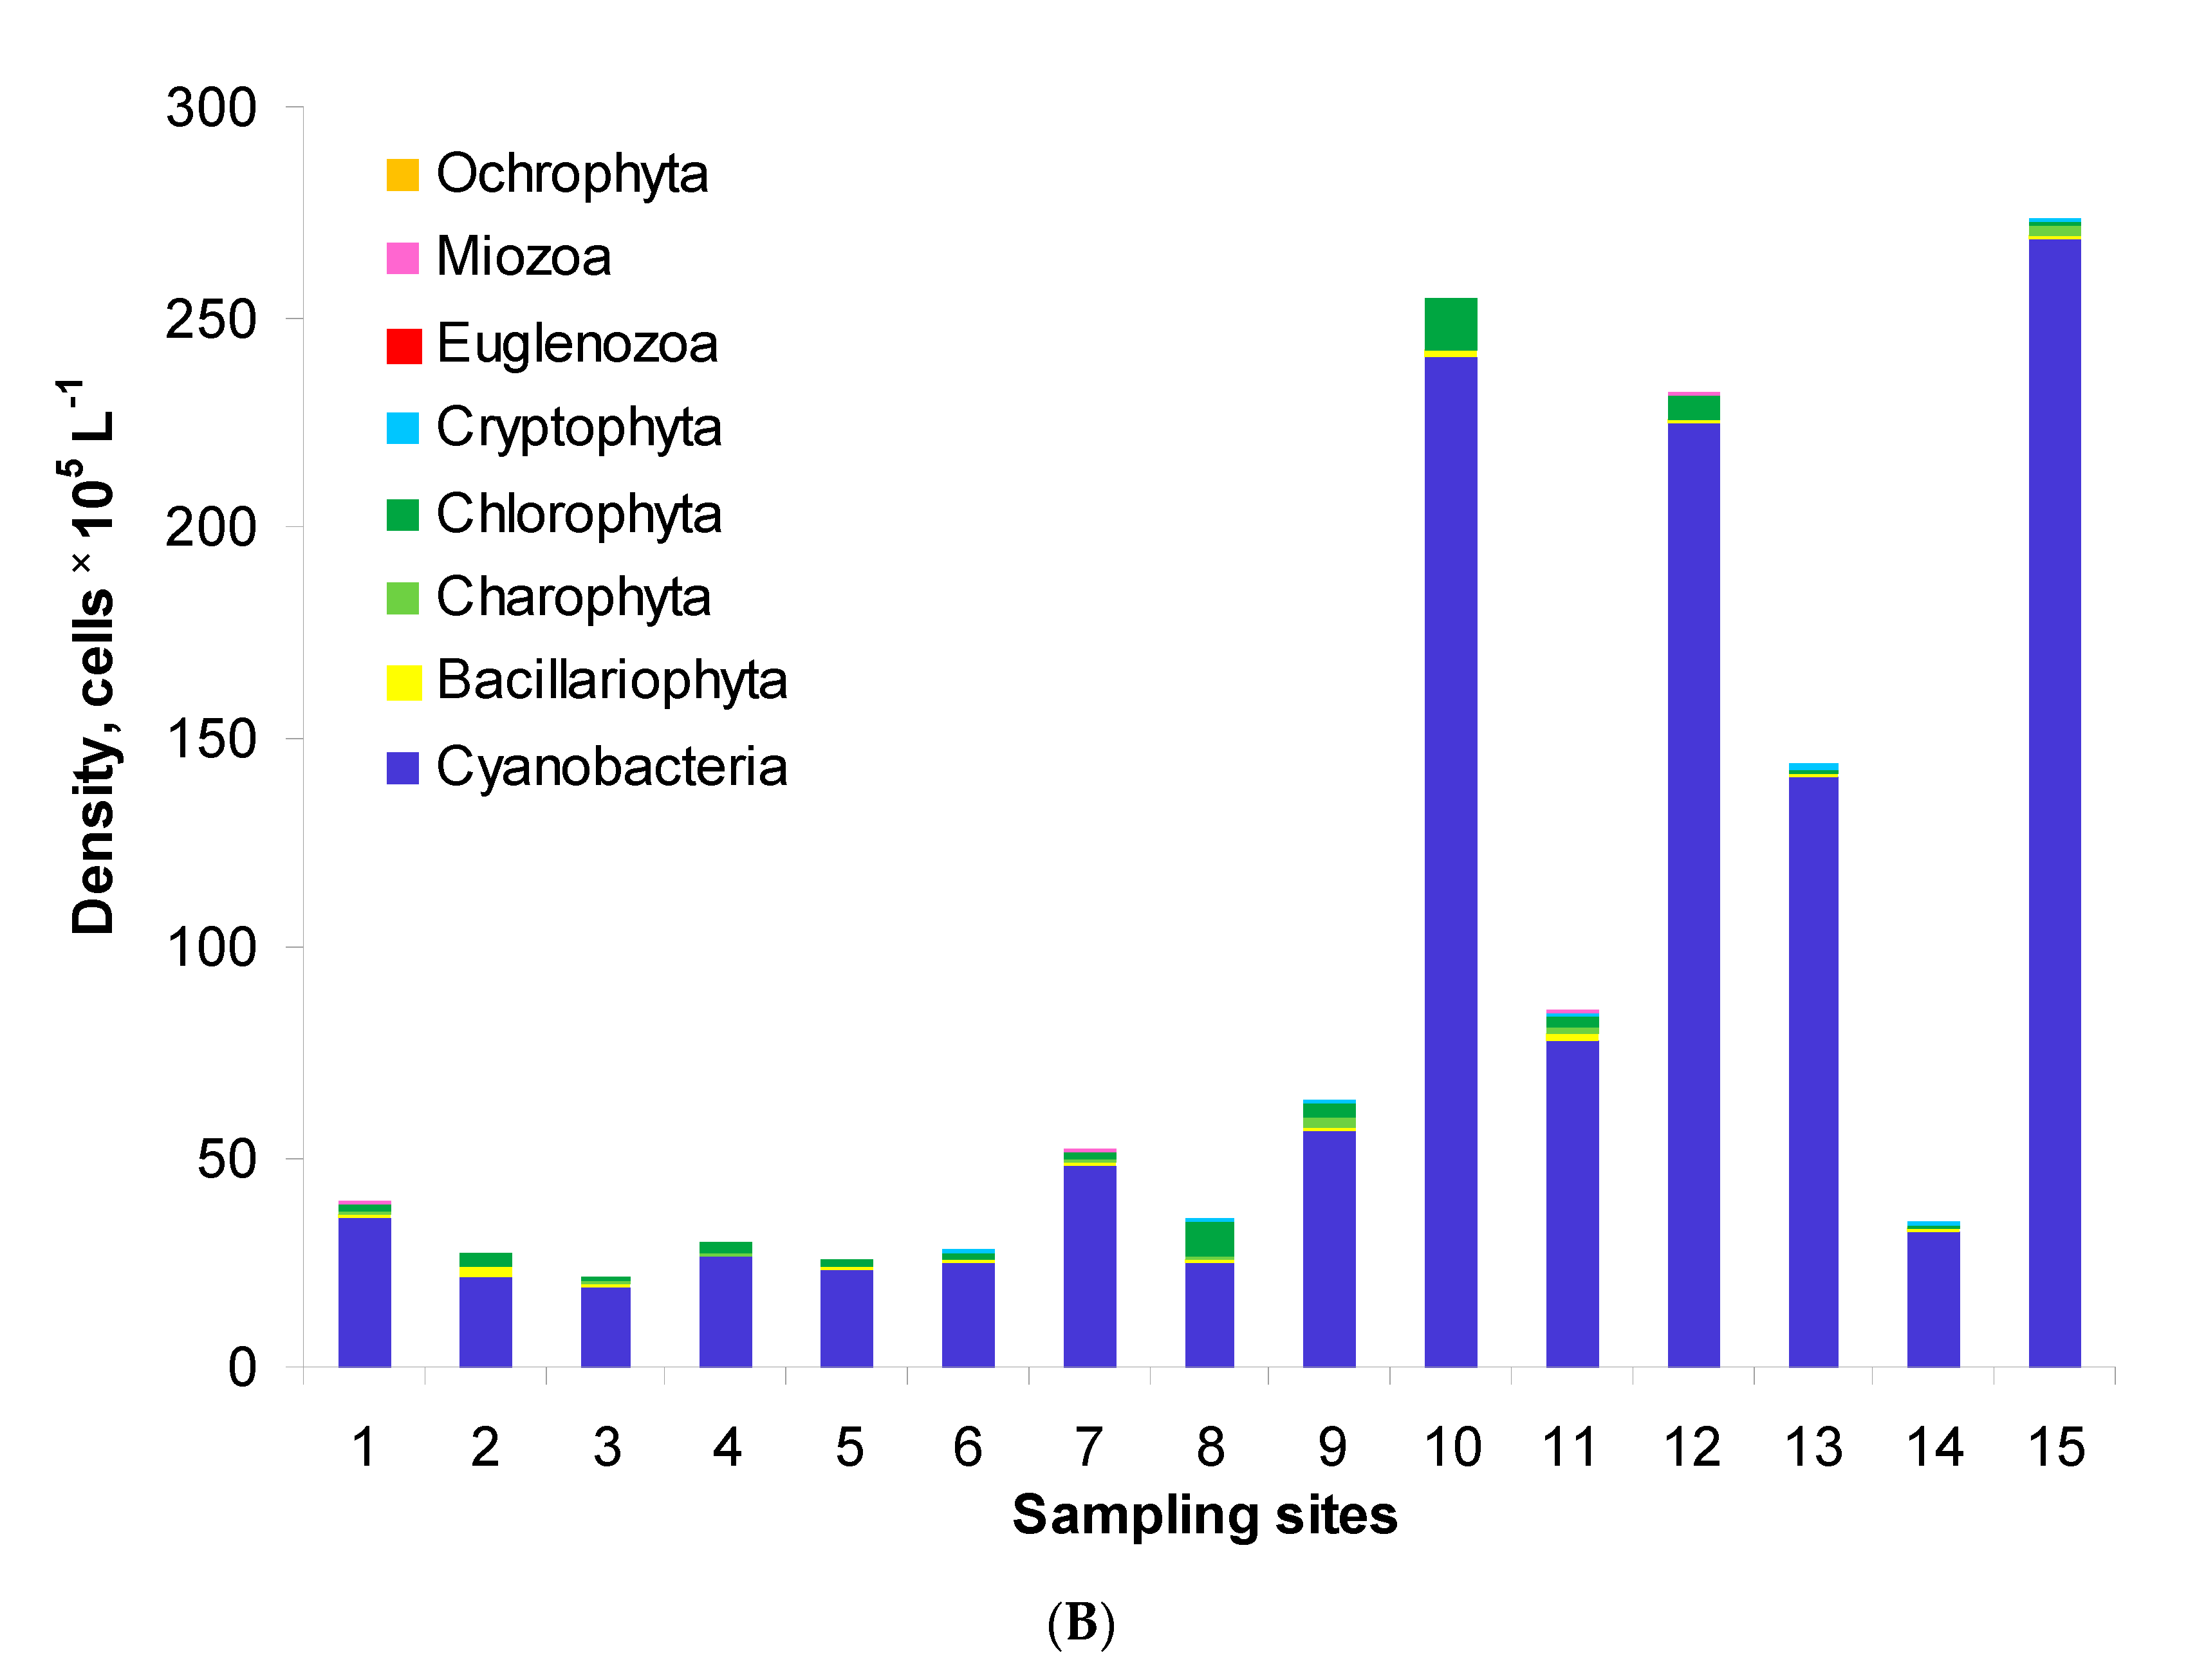
3.3. Phytoplankton
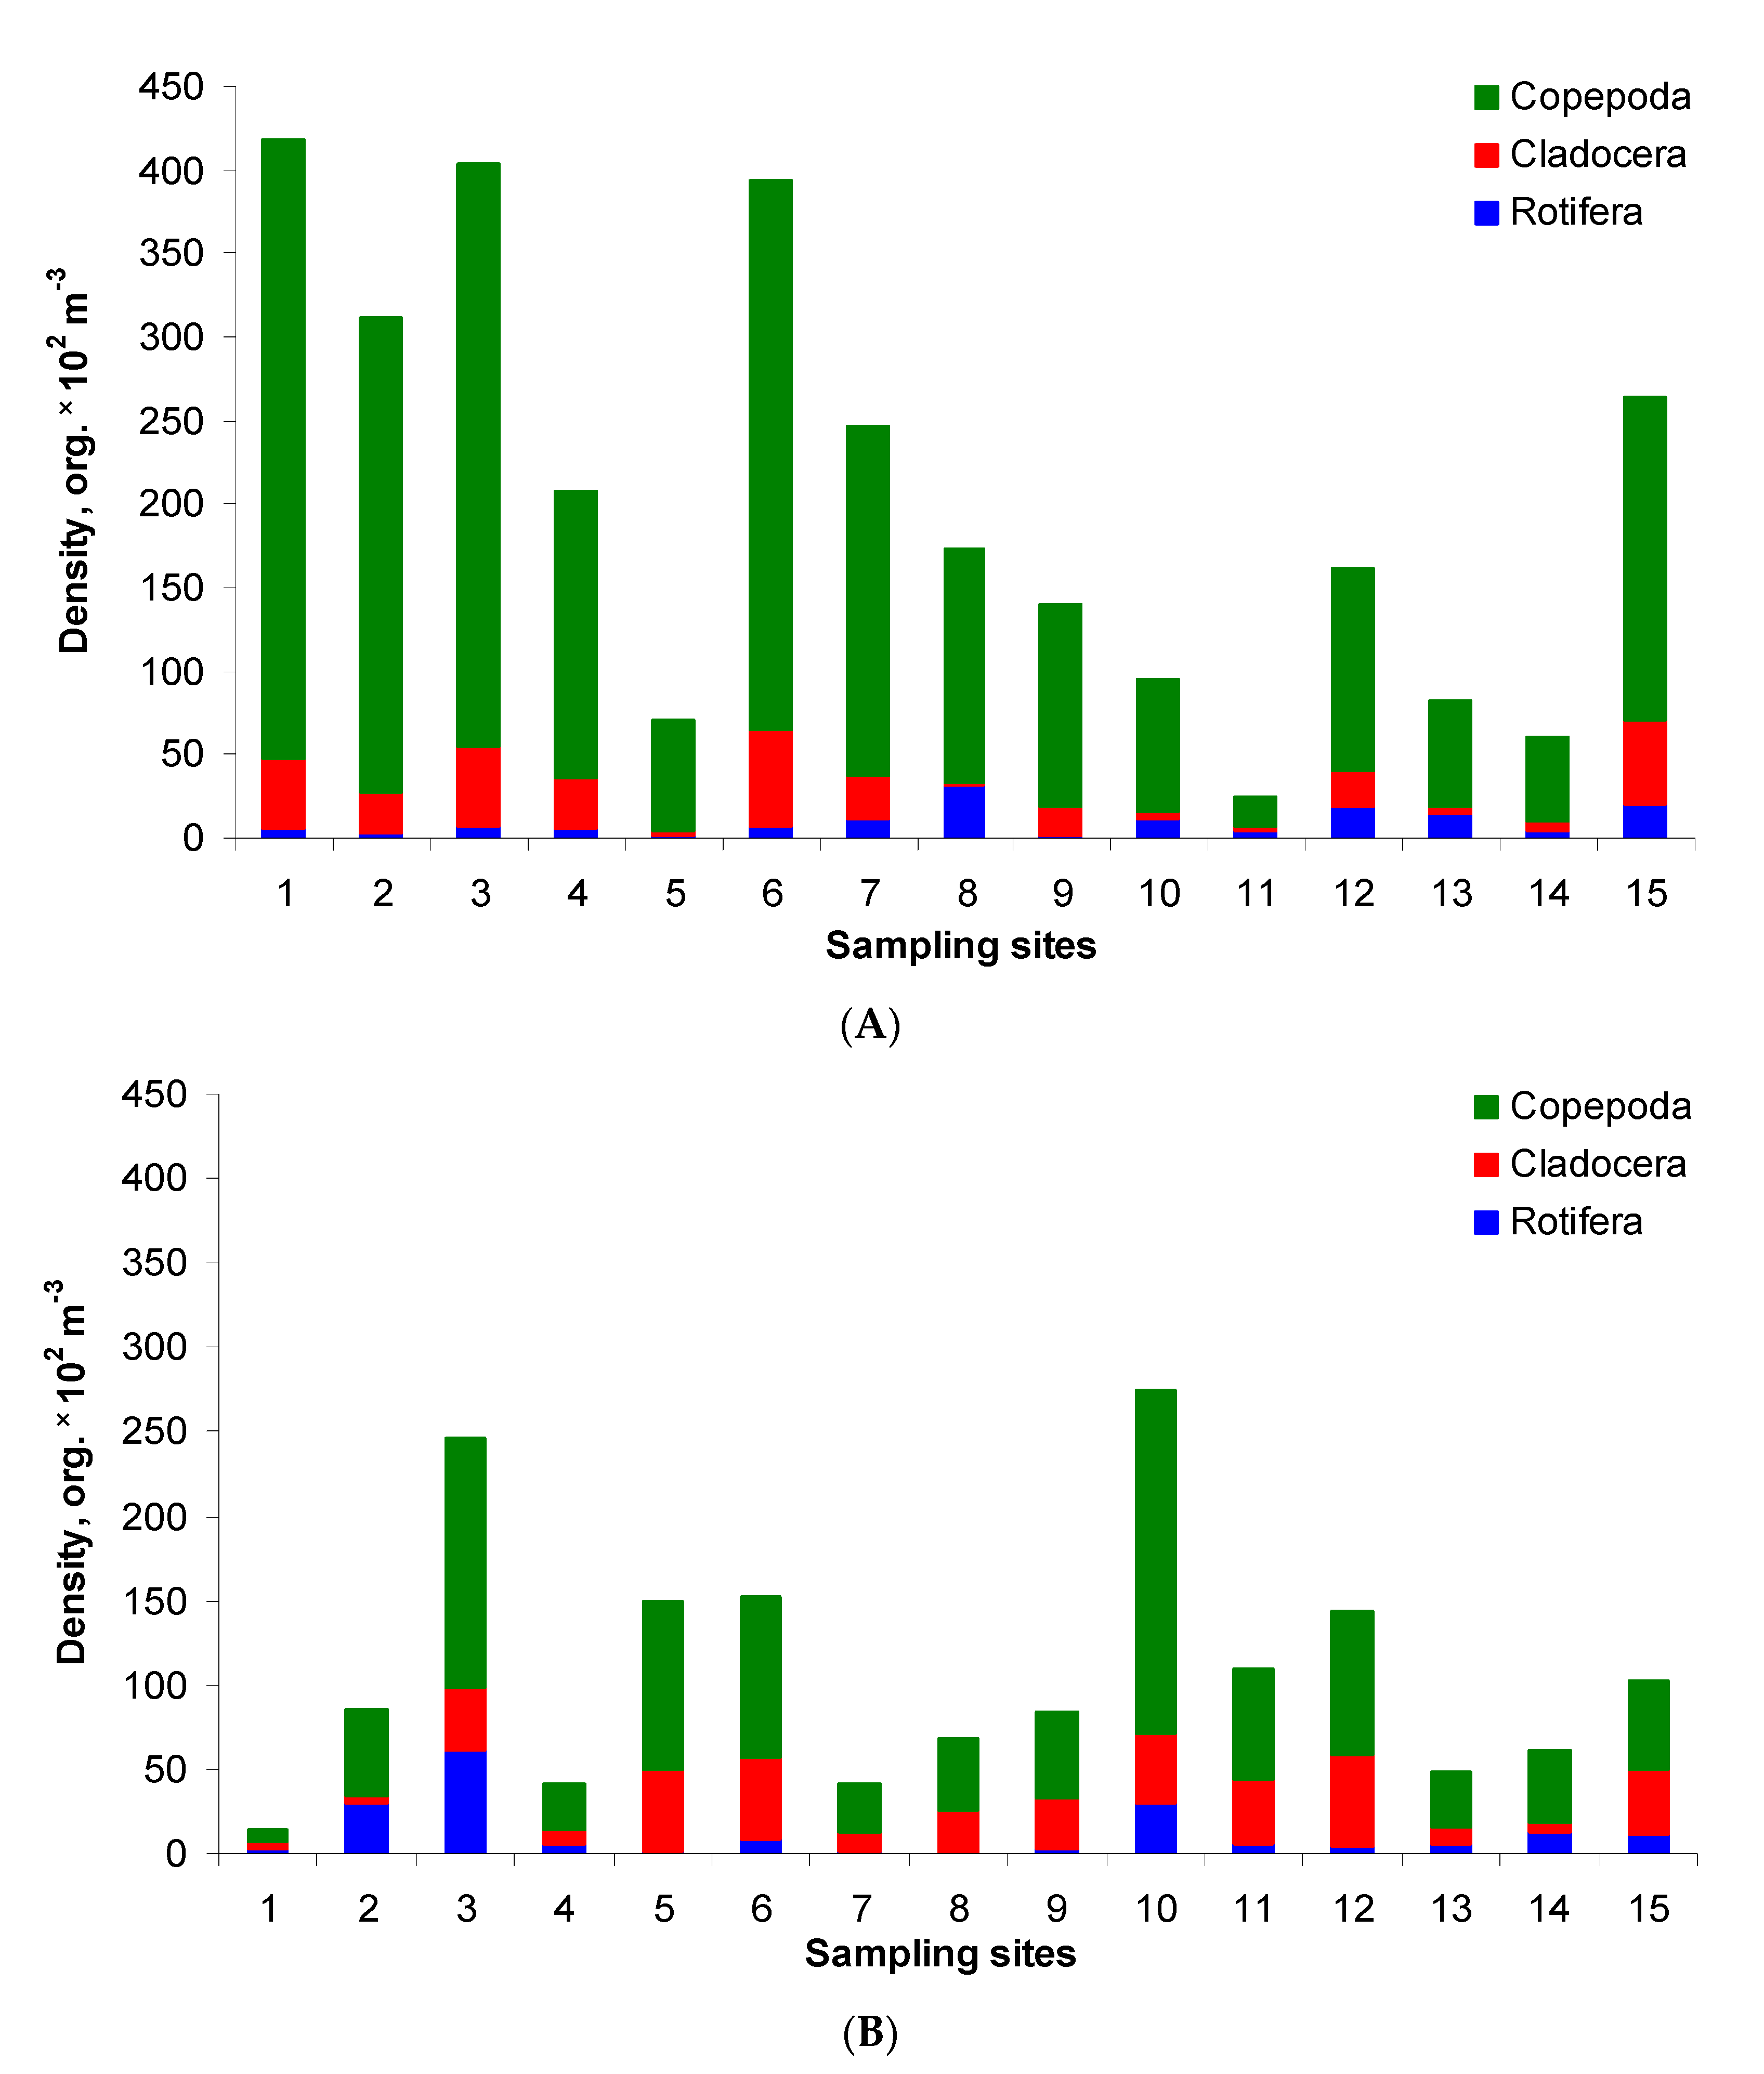
3.4. Zooplankton
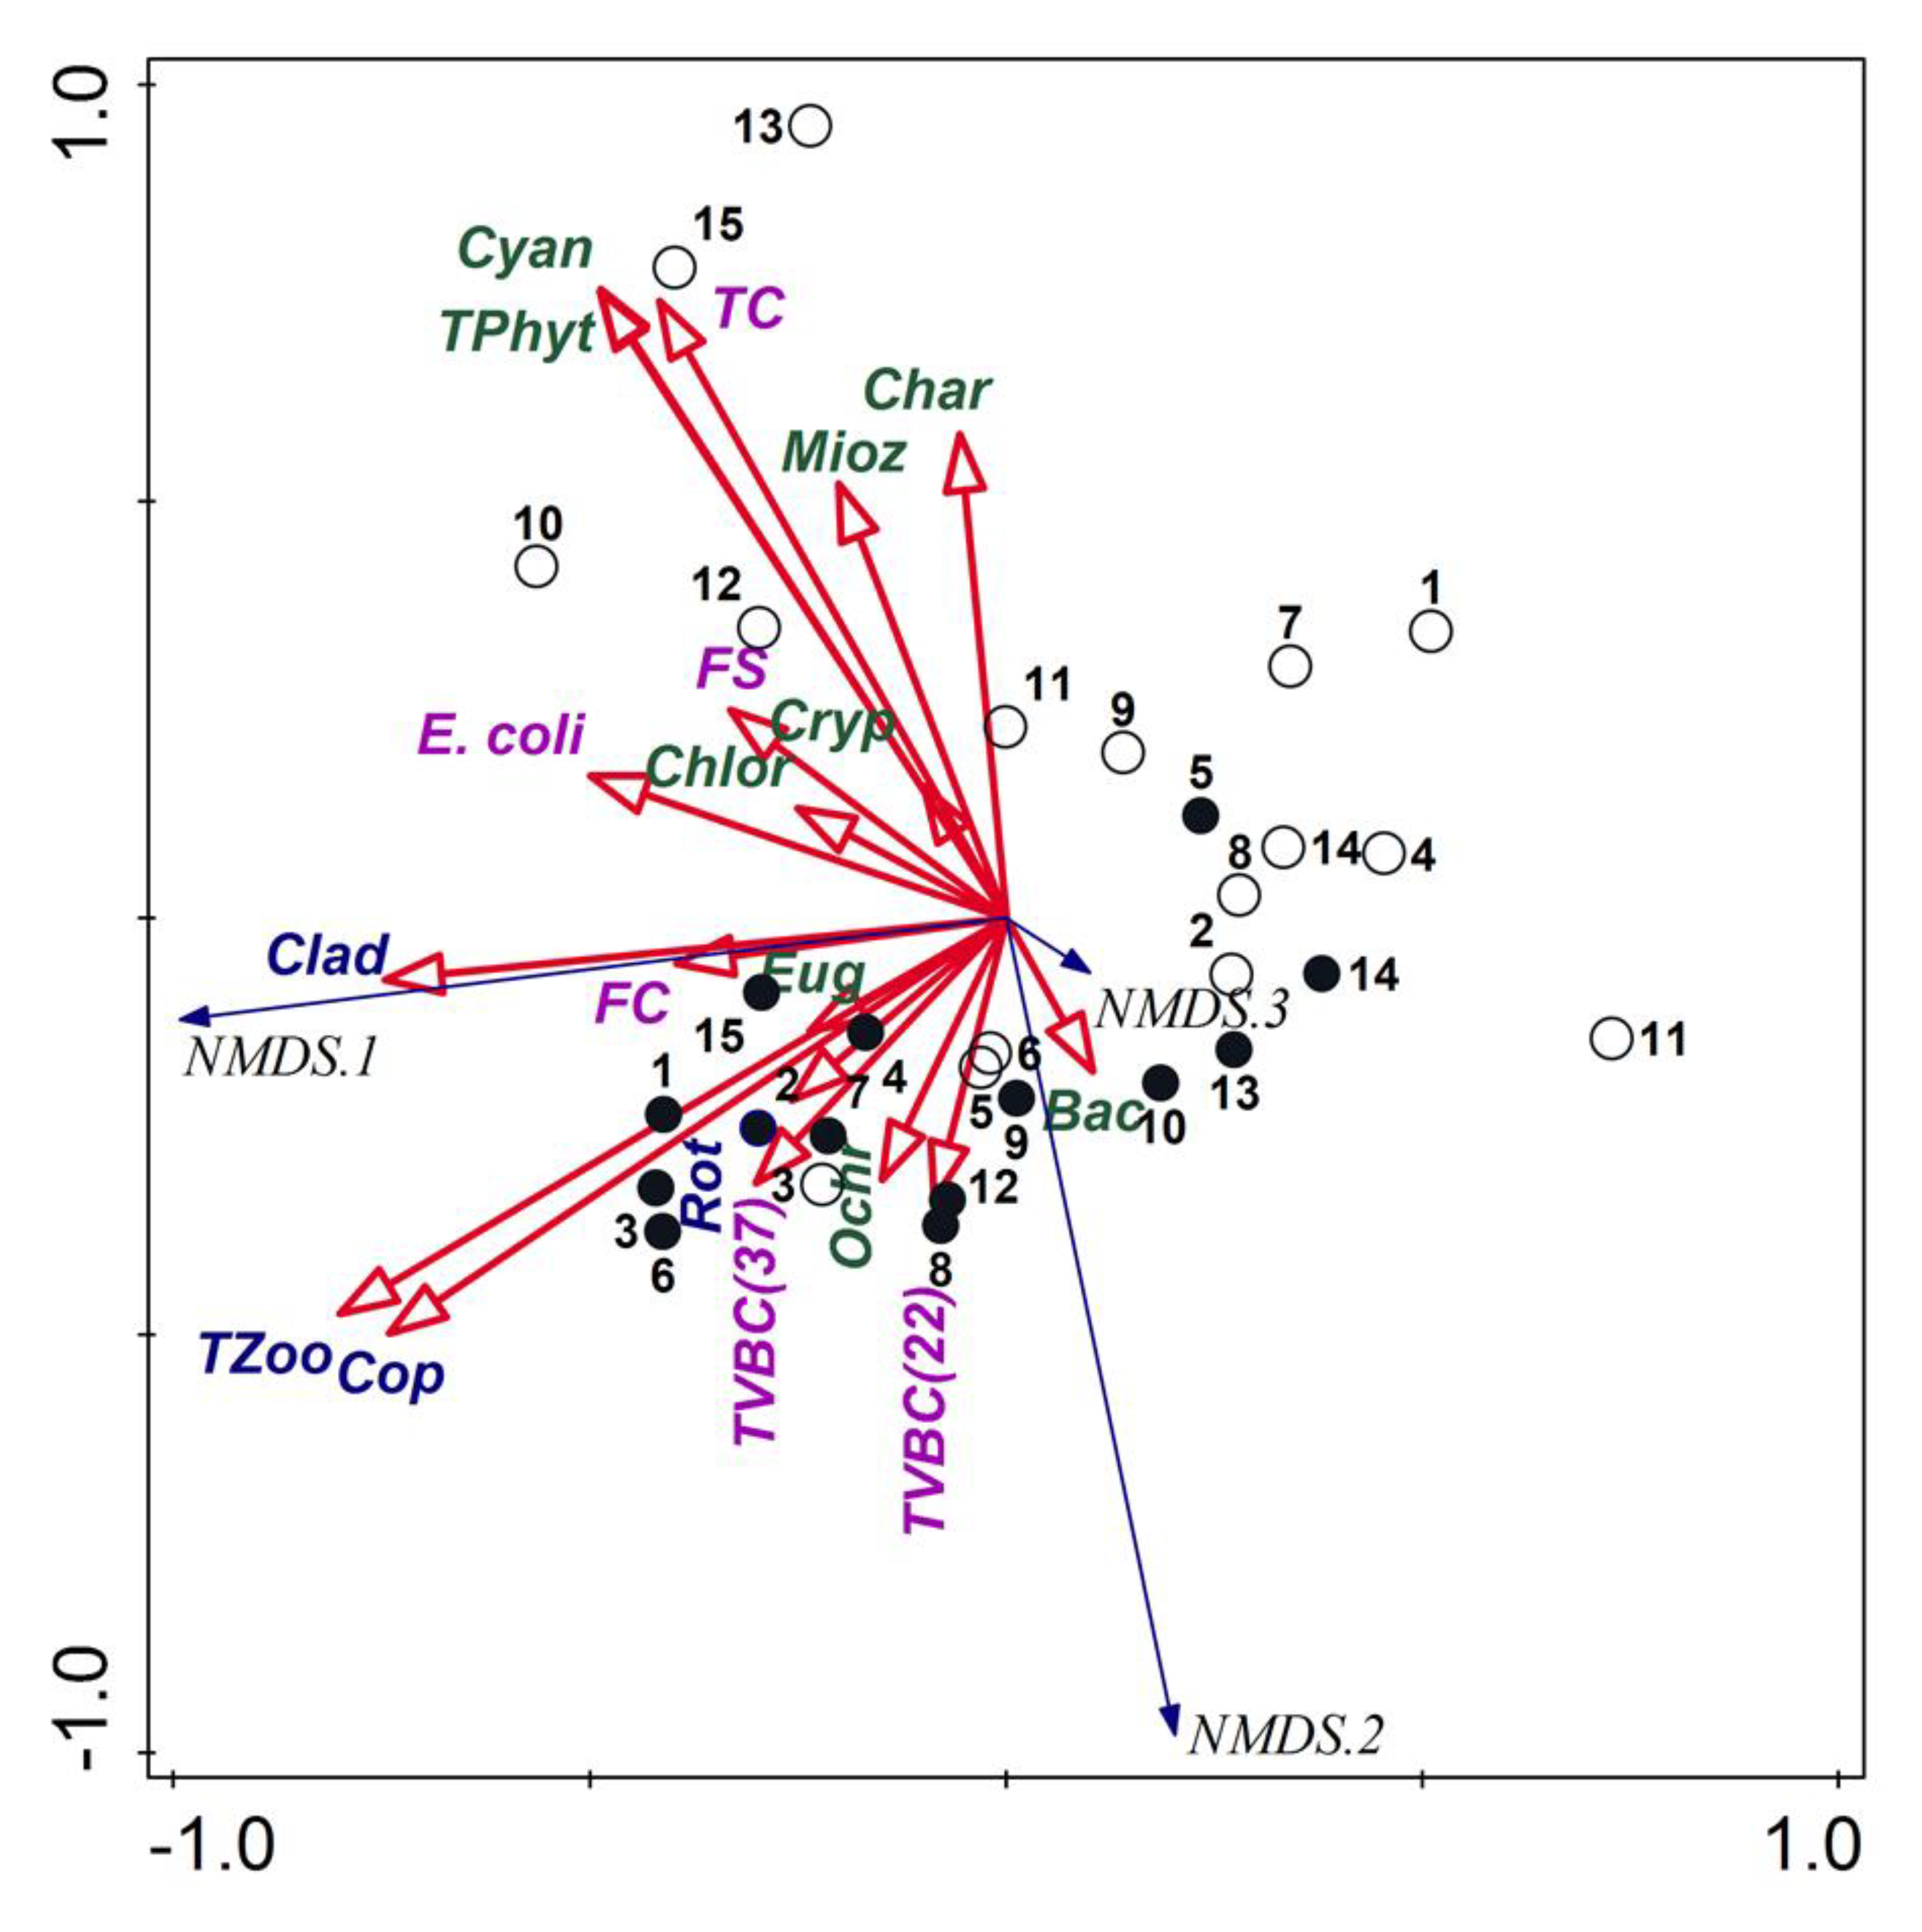
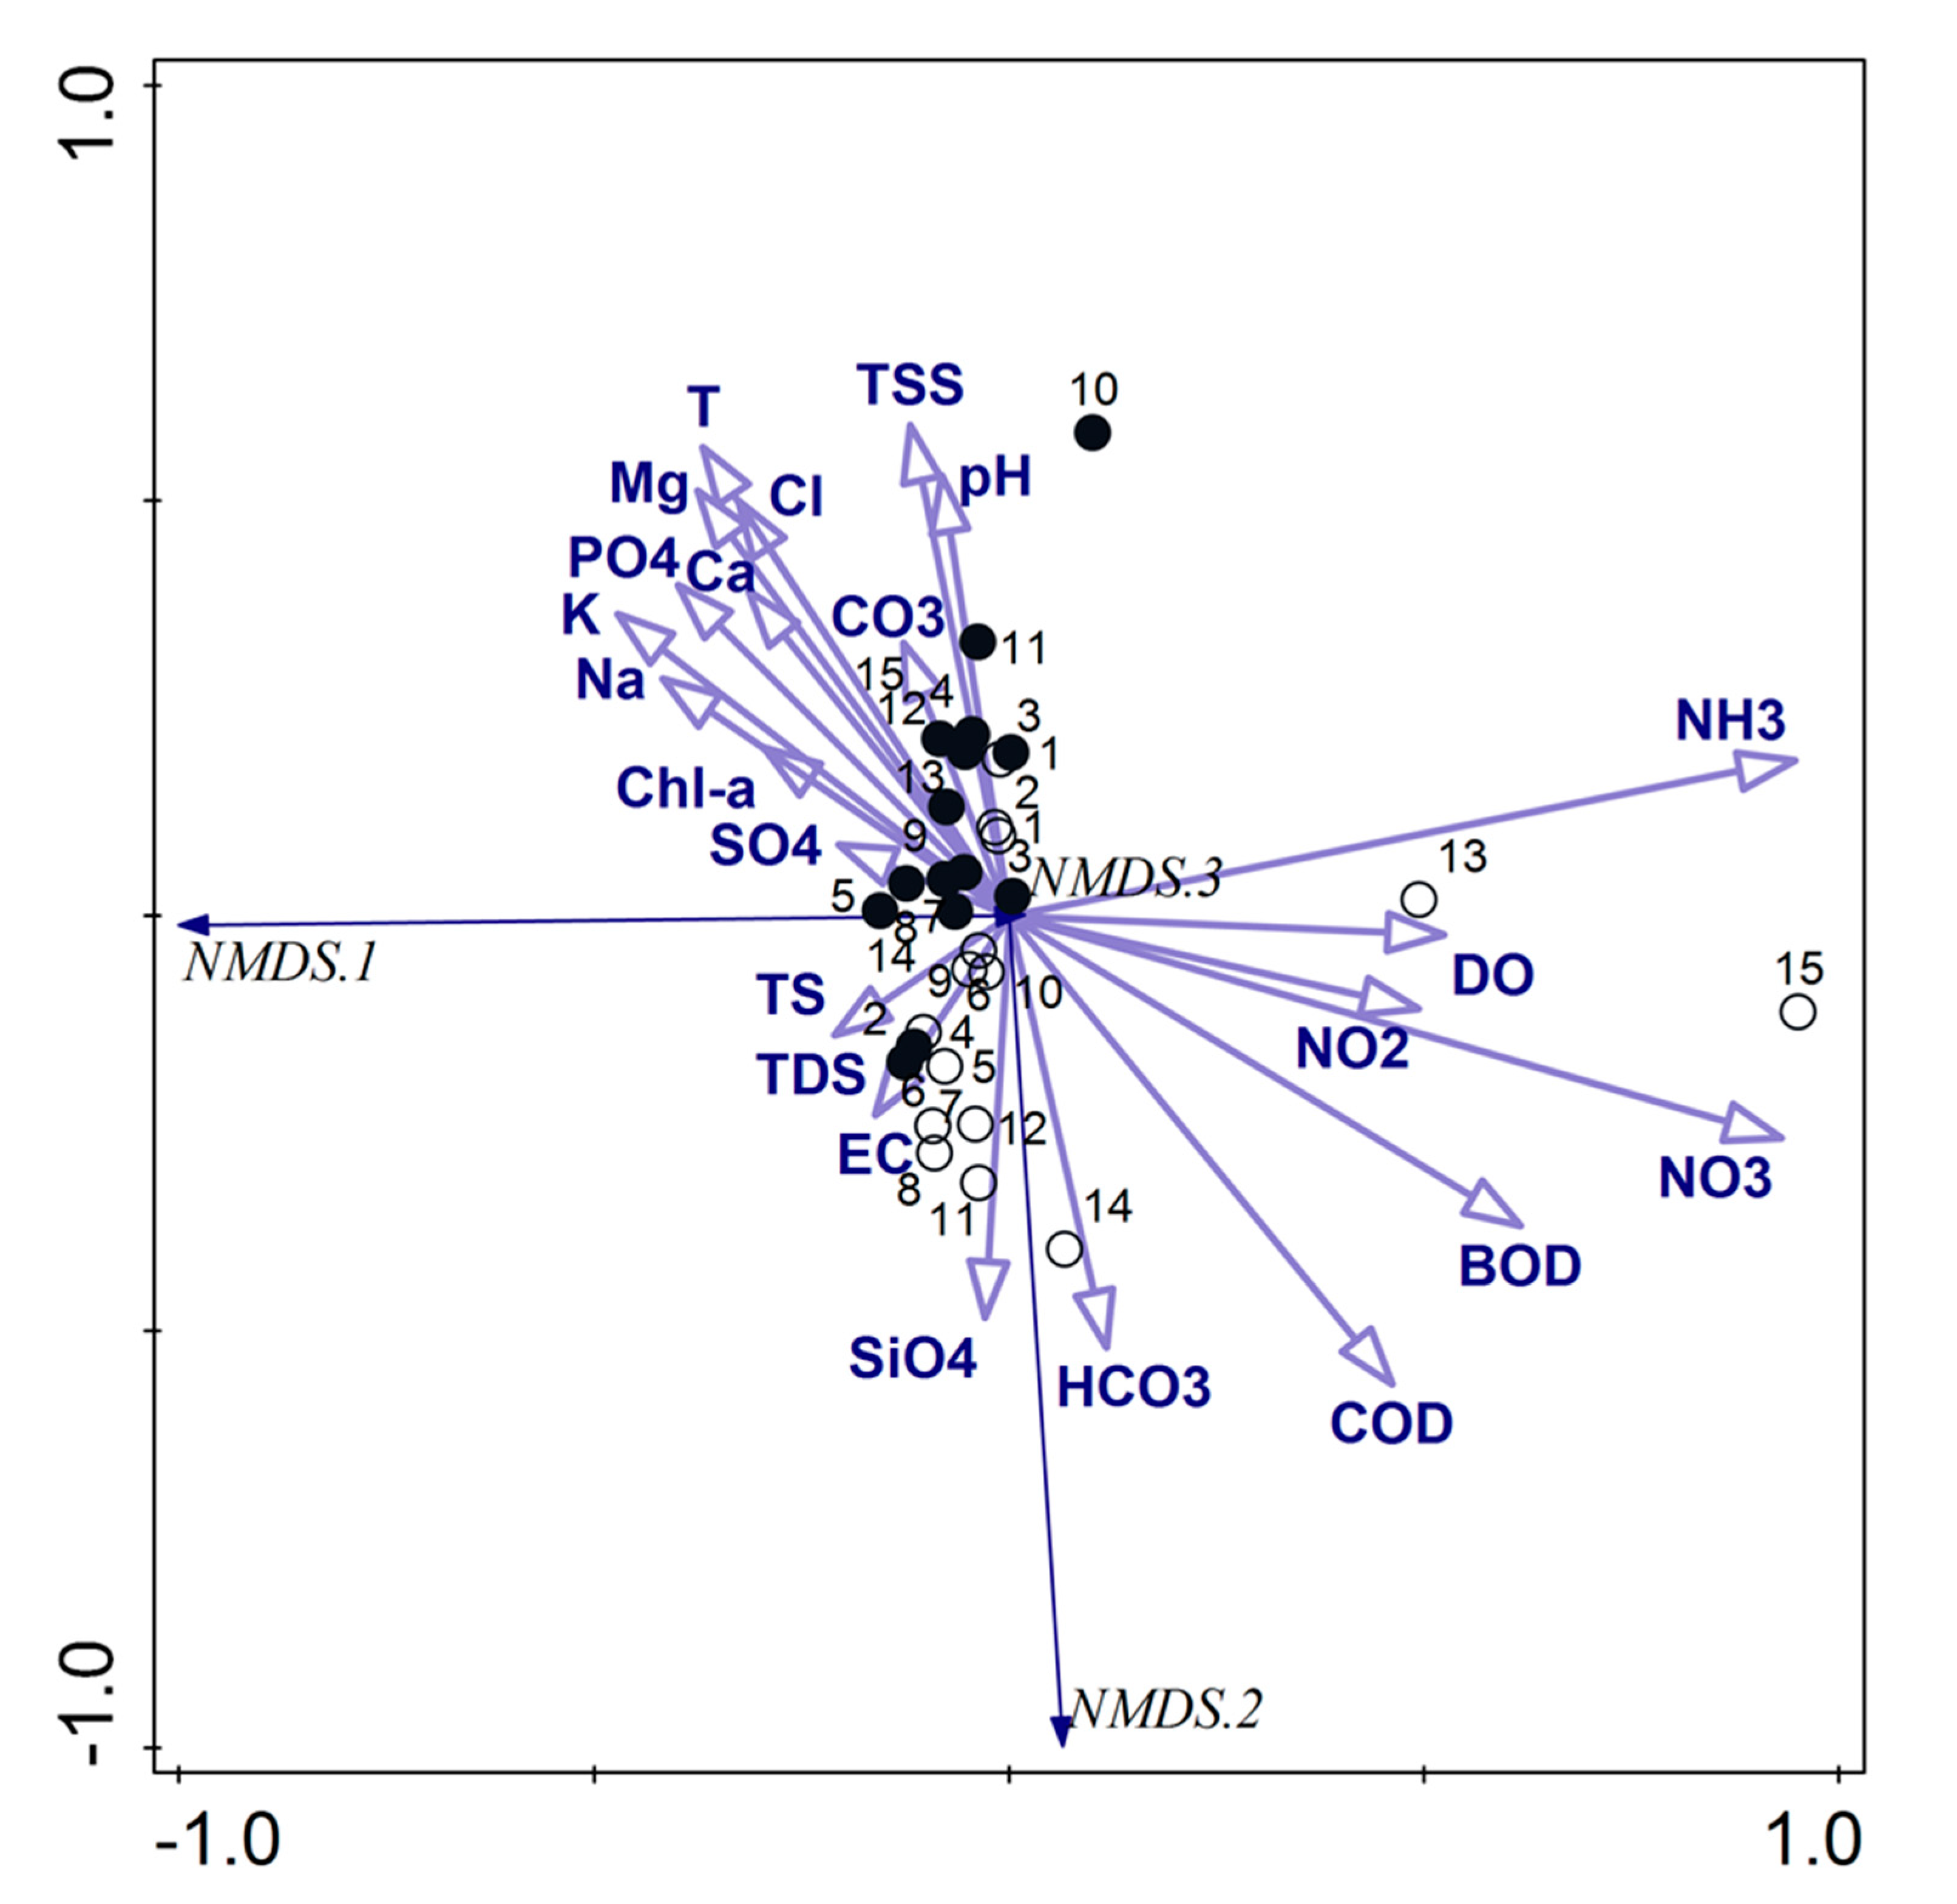
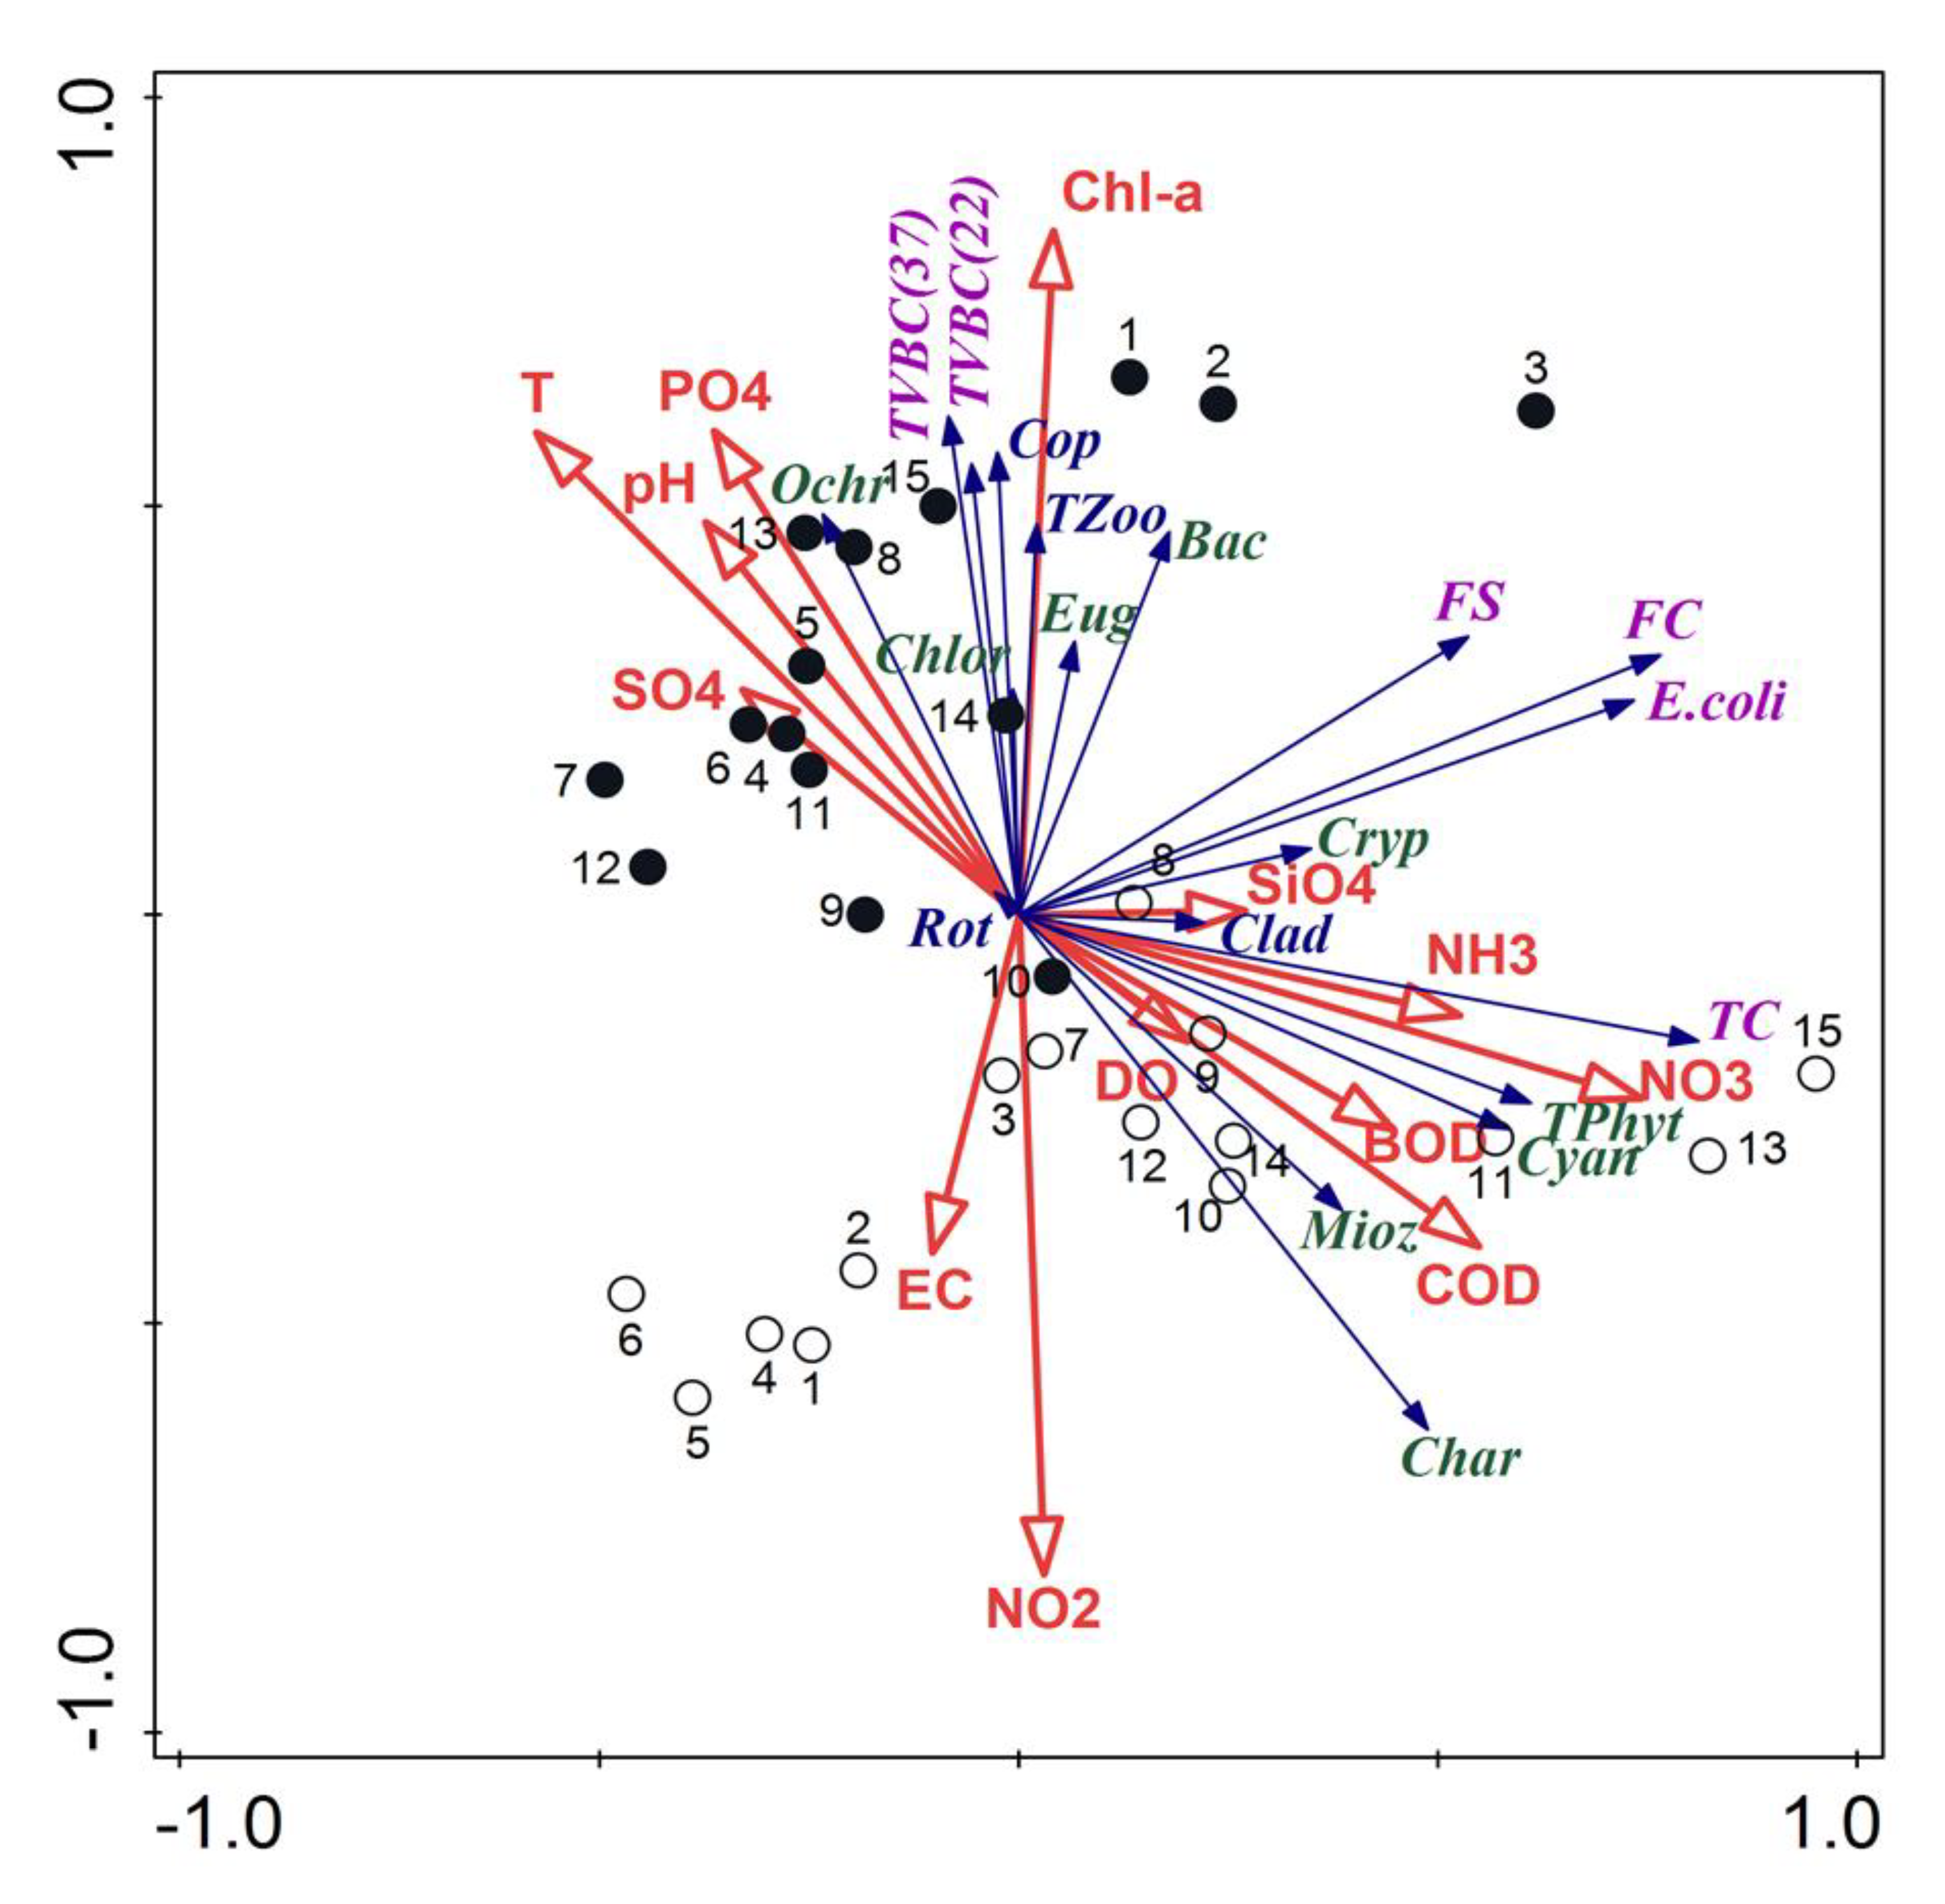
3.5. Planktonic Organisms and Physicochemical Parameters—Relations within and between
3.6. Macrophytes and Epiphytes
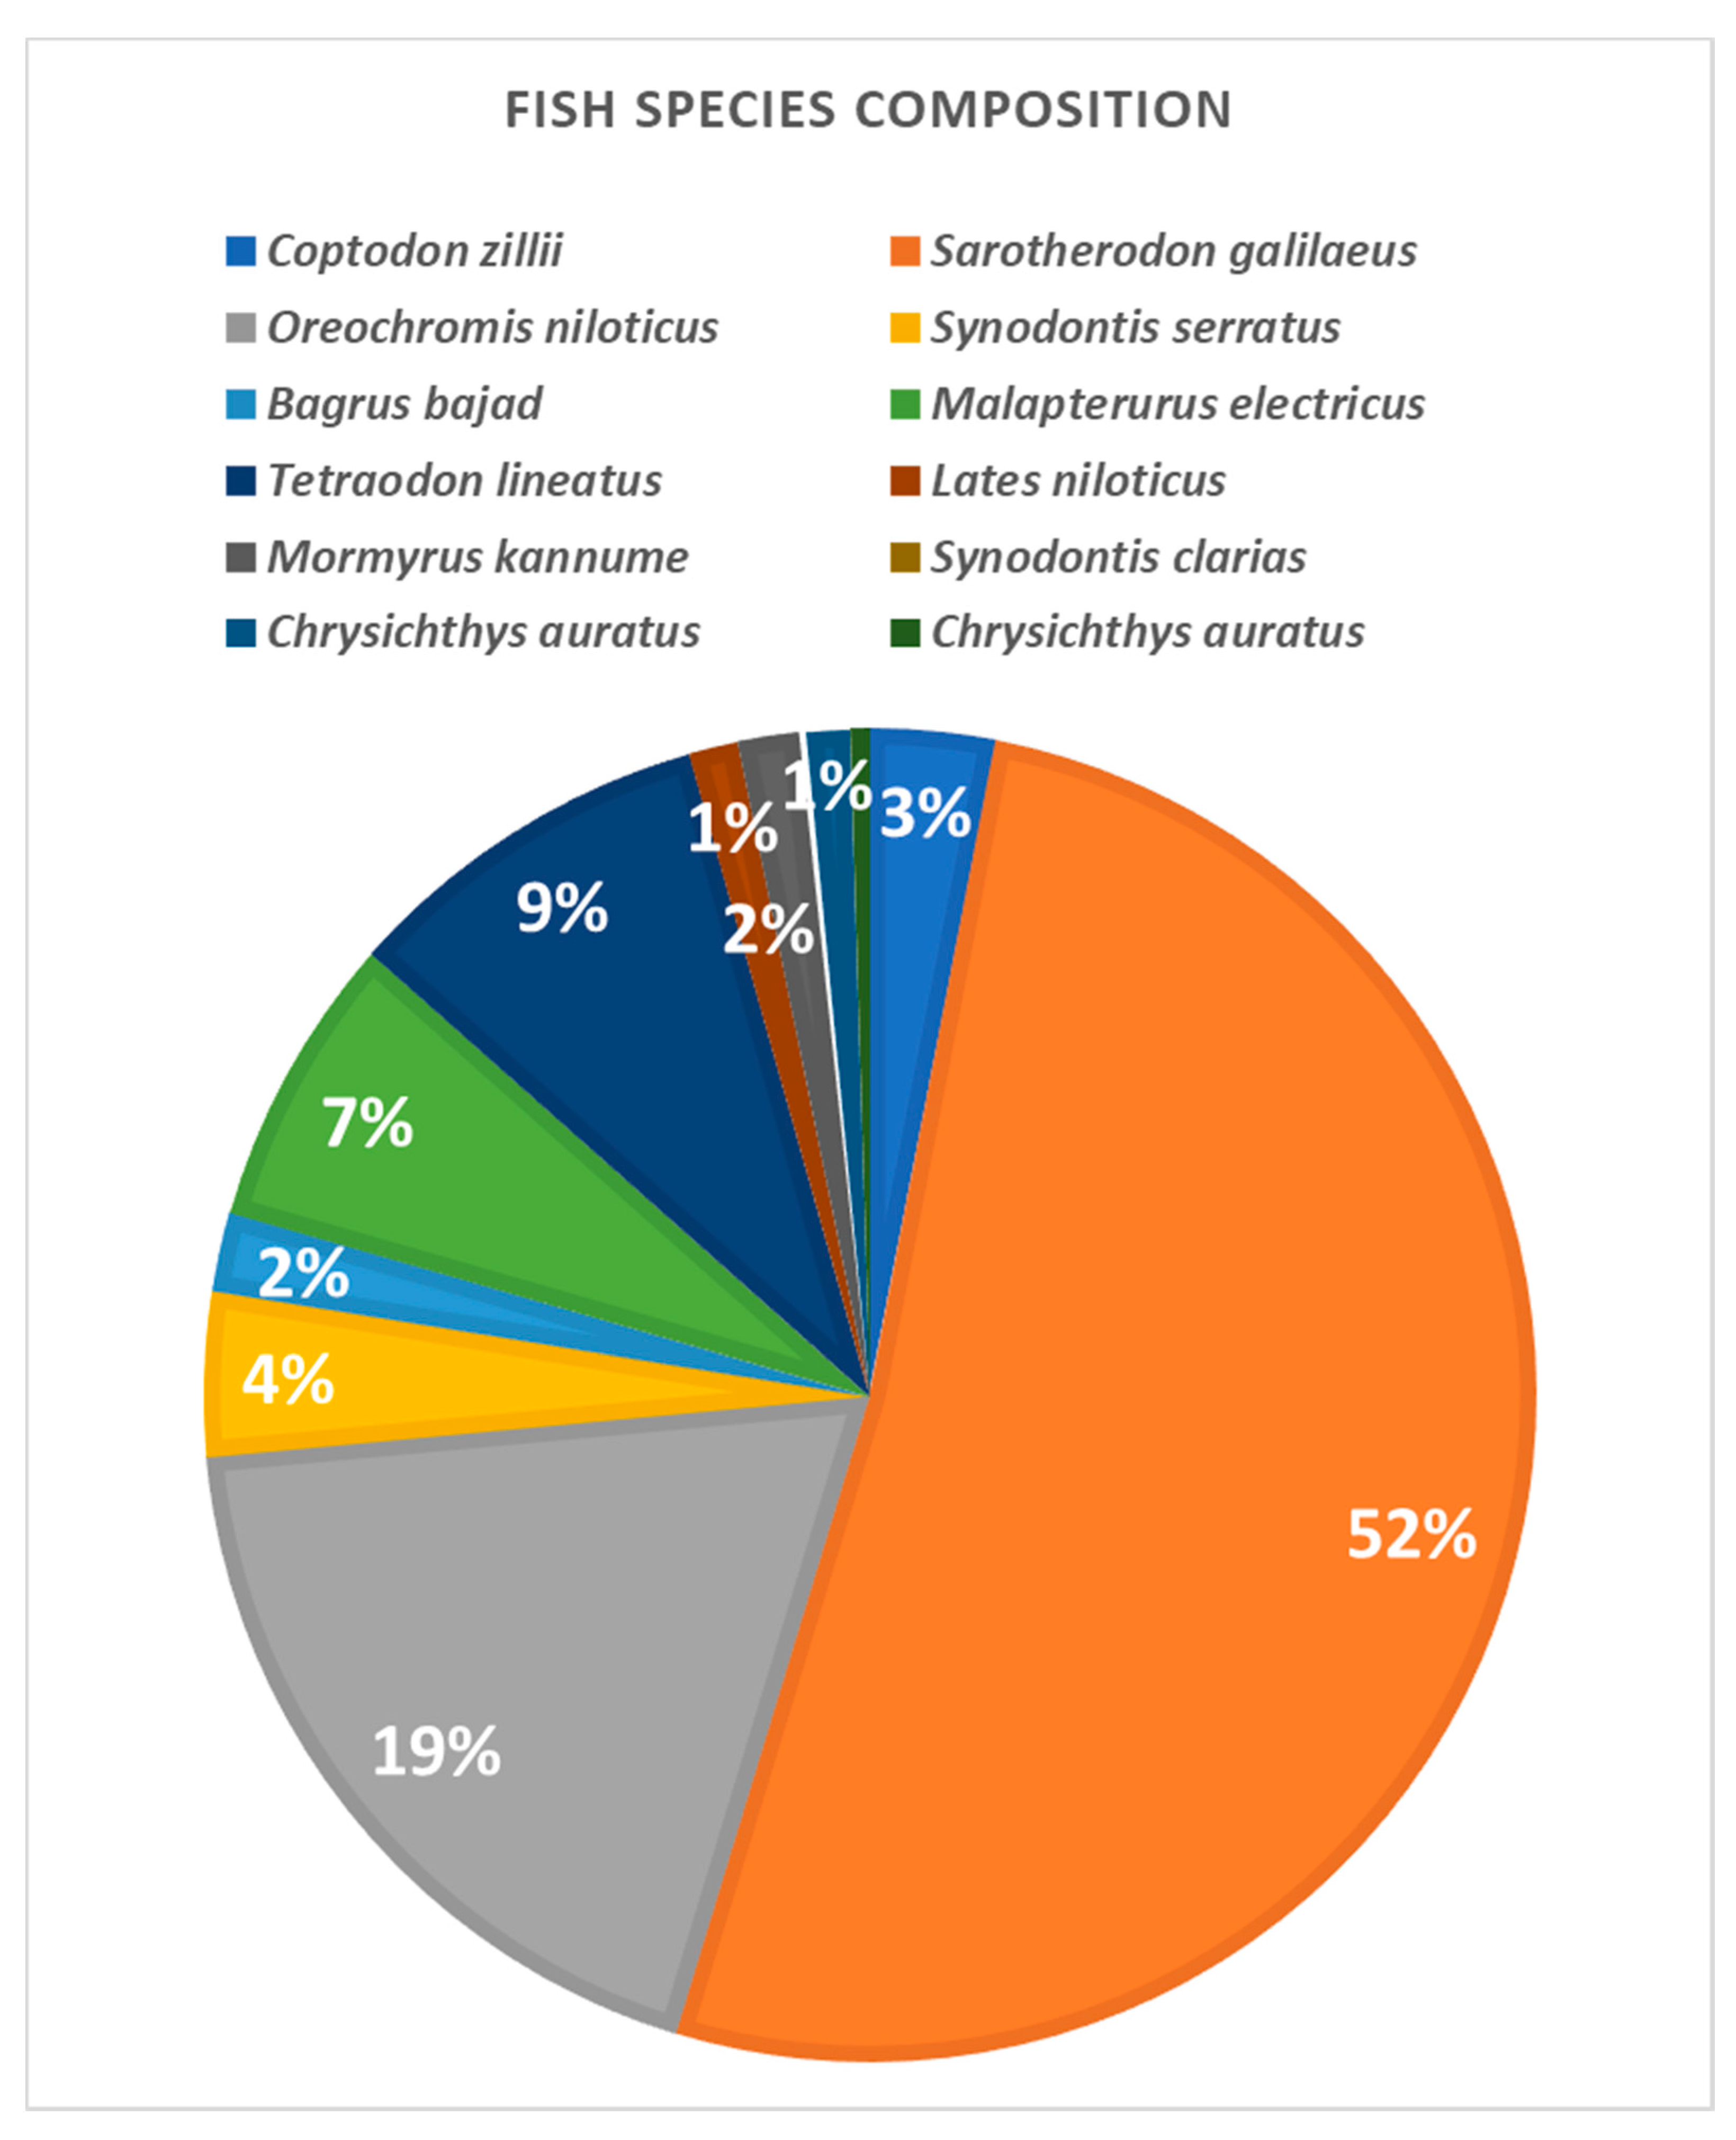
3.7. Fish
4. Discussion
5. Conclusions
Supplementary Materials
Author Contributions
Funding
Institutional Review Board Statement
Informed Consent Statement
Data Availability Statement
Acknowledgments
Conflicts of Interest
References
- Abou El Ella, S.M.; El Samman, T.A. Ecosystem status of the north part of Lake Nubia African. J. Biol. Sci. 2010, 6, 7–21. [Google Scholar]
- Street-Perrott, F.A.; Roberts, N. Fluctuations in closed-basin lakes as an indicator of past atmospheric circulation patterns. In Variations in the Global Water Budget; Street-Perrott, A., Beran, M., Ratcliffe, R., Eds.; Springer: Dordrecht, The Netherlands, 1983; pp. 331–345. [Google Scholar]
- Goher, M.E.S.; Farhat, H.; Abdo, M.H.; Salem, S.G. Metal pollution assessment in the surface sediment of Lake Nasser, Egypt. Egypt. J. Aquat. Res. 2014, 40, 213–224. [Google Scholar] [CrossRef] [Green Version]
- El-Sheekh, M.M. Impact of Water Quality on Ecosystems of the Nile River. In The Handbook of Environmental Chemistry; Springer Science and Business Media LLC: Cham, Switzerland, 2016; Volume 56, pp. 357–385. [Google Scholar]
- Salem, T.A.; Mageed, A.A.A. Assessment of the Impact of the Nile Flood on Food Chain in Lake Nasser—Egypt, with Special Reference to Turbidity. Open J. Ecol. 2021, 11, 41–51. [Google Scholar] [CrossRef]
- Goher, M.E.S.; Ali, M.; El-Sayed, S.M. Heavy metals contents in Nasser Lake and the Nile River, Egypt: An overview. Egypt. J. Aquat. Res. 2019, 45, 301–312. [Google Scholar] [CrossRef]
- Parmar, T.K.; Rawtani, D.; Agrawal, Y.K. Bioindicators: The natural indicator of environmental pollution. Front. Life Sci. 2016, 9, 110–118. [Google Scholar] [CrossRef] [Green Version]
- Hegab, M.H.; Khalifa, N.; Aly, W. Zooplankton communities in Lake Nasser, Egypt, under the current flood regime, before the construction of Grand Ethiopian Renaissance Dam (GERD). Afr. J. Aquat. Sci. 2020, 2020, 1800443. [Google Scholar] [CrossRef]
- Mao, Z.; Gu, X.; Cao, Y.; Zhang, M.; Zeng, Q.; Chen, H.; Shen, R.; Jeppesen, E. The Role of Top-Down and Bottom-Up Control for Phytoplankton in a Subtropical Shallow Eutrophic Lake: Evidence Based on Long-Term Monitoring and Modeling. Ecosystems 2020, 23, 1449–1463. [Google Scholar] [CrossRef]
- Castellani, C. Plankton: A Guide to their Ecology and Monitoring for Water Quality. J. Plankton Res. 2009, 32, 261–262. [Google Scholar] [CrossRef] [Green Version]
- Napiórkowska-Krzebietke, A. Phytoplankton response to fish-induced environmental changes in a temperate shallow pond-type lake. Arch. Pol. Fish. 2017, 25, 211–262. [Google Scholar] [CrossRef] [Green Version]
- Carpenter, S.R.; Lodge, D.M. Effects of submersed macrophytes on ecosystem processes. Aquat. Bot. 1986, 26, 341–370. [Google Scholar] [CrossRef]
- Pace, M.; Carpenter, S.R.; Johnson, R.; Kurtzweil, J.T. Zooplankton provide early warnings of a regime shift in a whole lake manipulation. Limnol. Oceanogr. 2013, 58, 525–532. [Google Scholar] [CrossRef] [Green Version]
- Wilkinson, G.M.; Carpenter, S.R.; Cole, J.J.; Pace, M.L.; Batt, R.D.; Buelo, C.D.; Kurtzweil, J.T. Early warning signals precede cyanobacterial blooms in multiple whole-lake experiments. Ecol. Monogr. 2018, 88, 188–203. [Google Scholar] [CrossRef]
- Wilk-Woźniak, E.; Krztoń, W.; Górnik, M. Synergistic impact of socio-economic and climatic changes on the ecosystem of a deep dam reservoir: Case study of the Dobczyce dam reservoir based on a 30-year monitoring study. Sci. Total Environ. 2021, 756, 144055. [Google Scholar] [CrossRef] [PubMed]
- Hassan, R.M.; Abdelrahman, E.M.; Tealeb, A.; Zahran, K.H.; Jentzsch, G. Hydrogeological signals due to the seasonal variation of Lake Nasser and its effect on the surrounding crust as deduced from tidal gravity observations. Bull. Inf. Marées Terr. 2010, 146, 11807–11818. [Google Scholar]
- American Public Health Association. Standard Methods for the Examination of Water and Waste Water, 22nd ed.; Water Environment Federation: Alexandra, VA, USA, 2012. [Google Scholar]
- Utermöhl, H. Zur Vervollkommnung der quantitativen Phytoplankton-Methodik. Mitt. Int. Verein. Limnol. 1958, 9, 1–38. [Google Scholar] [CrossRef]
- Guiry, M.D.; Guiry, G.M. AlgaeBase, World-Wide Electronic Publication, National University of Ireland, Galway. 2021. Available online: http://www.algaebase.org (accessed on 8 May 2021).
- Shannon, C.E.; Weaver, W. The Mathematical Theory of Communication; The University of Illinois Press: Urbana, IL, USA, 1964. [Google Scholar]
- Margalef, R. Perspectives in Ecological Theory; University Chicago Press: Chicago, IL, USA, 1968; Volume 111, pp. 313–315. [Google Scholar]
- Pielou, E.C. The measurement of diversity in different types of biological collections. J. Theor. Biol. 1966, 13, 131–144. [Google Scholar] [CrossRef]
- Edmondson, W.T. Fresh Water Biology; Wiley: New York, NY, USA, 1959; p. 1248. [Google Scholar]
- Pennak, R.W. Fresh-Water Invertebrates of the United States; Wiley: New York, NY, USA, 1978; p. 803. [Google Scholar]
- Verheye, H.M.; Dumont, H.J. The calanoid copepods of the Nile system. Hydrobiology 1984, 110, 191–212. [Google Scholar] [CrossRef]
- Boulos, L. Flora of Egypt; Checklist All-Hadara Publishing: Cairo, Egypt, 2009; p. 410. [Google Scholar]
- Cattaneo, A.; Kerimian, T.; Roberge, M.; Marty, J. Periphyton distribution and abundance on substrata of different size along a gradient of stream trophy de Montréal. Hydrobiology 1997, 354, 101–110. [Google Scholar] [CrossRef]
- Ter Braak, C.J.F.; Smilauer, P. Canoco Reference Manual and User’s Guide: Software for Ordination (Version 5.10); Microcomputer Power: Ithaca, NY, USA, 2018. [Google Scholar]
- Carr, G.M.; Rickwood, C.J. Water Quality Index for Biodiversity Technical Development Document; Report Prepared for Bio-Diversity Indicators Partnership; World Conservation Monitoring Center: Cambridge, UK, 2008; p. 64. [Google Scholar]
- El-Halag, R.S.F.; Shaker, I.M.; Mehanna, S.F.; Othman, M.F.; El-Deen Farouk, A. Impact of Some Environmental Condition on Water Quality and Some Heavy metals in Water from Bardawil Lake. N. Y. Sci. J. 2013, 6, 5–13. [Google Scholar]
- Hooda, P.; Edwards, A.; Anderson, H.; Miller, A. A review of water quality concerns in livestock farming areas. Sci. Total. Environ. 2000, 250, 143–167. [Google Scholar] [CrossRef]
- Yesuf, H.M.; Assen, M.; Melesse, A.; Alamirew, T. Detecting land use/land cover changes in the Lake Hayq (Ethiopia) drainage basin, 1957–2007. Lakes Reserv. Res. Manag. 2015, 20, 1–18. [Google Scholar] [CrossRef]
- Yuan, D.; Zhao, Y.; Guo, X.; Zhai, L.; Wang, X.; Wang, J.; Cui, Y.; He, L.; Yan, C.; Kou, Y. Impact of hydrophyte decomposition on the changes and characteristics of dissolved organic matter in lake water. Ecol. Indic. 2020, 116, 106482. [Google Scholar] [CrossRef]
- Imam, N.; El-Sayed, S.M.; Goher, M.E.-S. Risk assessments and spatial distributions of natural radioactivity and heavy metals in Nasser Lake, Egypt. Environ. Sci. Pollut. Res. 2020, 27, 25475–25493. [Google Scholar] [CrossRef]
- Technical Memorandum. pH Requirements of Freshwater Aquatic Life; Robertson-Bryan, Inc.: Rancho Cordova, CA, USA, 2004; pp. 1–13.
- EWQS. Egyptian Drinking Water Quality Standards; Population Decision Number 458; Ministry of Health: Cairo, Egypt, 2007.
- USEPA. United States Environmental Protection Agency Drinking Water Standards and Health Advisory Tables. 2018. Available online: https://www.epa.gov/sites/production/files/2018-03/documents/dwtable2018.pdf. (accessed on 24 April 2017).
- WHO. World Health Organization, Guidelines for Drinking Water Quality. The Fourth Edition Incorporating the First Addendum 2017. Available online: https://www.who.int/water_sanitation_health/water-quality/guidelines/en/ (accessed on 24 April 2017).
- Ayers, R.; Westcot, D. Water Quality for Agriculture. In FAO Irrigation and Drainage Paper 29 (Last Updated 1994); Food and Agriculture Organization of the United Nations: Quebec City, QC, Canada, 1985. [Google Scholar]
- CCME. Canadian Council of Ministers of the Environment For the protection of aquatic life 2007. In Canadian Environmental Quality Guidelines, 1999; Canadian Council of Ministers of the Environment: Winnipeg, MB, Canada, 1999. [Google Scholar]
- Napiorkowska-Krzebietke, A.; Hussian, A.-E.M.; Toufeek, M.A.; El-Monem, A.M.A.; Morsi, H.H. Phytoplankton response to changes of physicochemical variables in Lake Nasser, Egypt. J. Elem. 2012, 20, 855–871. [Google Scholar] [CrossRef]
- Abdel, S.S.; Ab, E.I. Impact of Flood Cycle on Phytoplankton and Macroinvertebrates Associated with Myriophyllum spicatum in Lake Nasser Khors (Egypt). J. Biol. Sci. 2018, 18, 51–67. [Google Scholar] [CrossRef] [Green Version]
- El-Nashar, W.Y.; Elyamany, A.H. Managing risks of the Grand Ethiopian Renaissance Dam on Egypt. Ain Shams Eng. J. 2018, 9, 2383–2388. [Google Scholar] [CrossRef]
- Aziz, S.A.; Zeleňáková, M.; Mésároš, P.; Purcz, P.; Abd-Elhamid, H. Assessing the Potential Impacts of the Grand Ethiopian Renaissance Dam on Water Resources and Soil Salinity in the Nile Delta, Egypt. Sustainability 2019, 11, 7050. [Google Scholar] [CrossRef] [Green Version]
- Joshi, P. Microbial Diversity of Aquatic Ecosystem and its Industrial Potential. J. Bacteriol. Mycol. Open Access 2016, 3, 1–4. [Google Scholar] [CrossRef]
- Rochelle-Newall, E.; Nguyen, T.M.H.; Le, T.P.Q.; Sengtaheuanghoung, O.; Ribolzi, O. A short review of fecal indicator bacteria in tropical aquatic ecosystems: Knowledge gaps and future directions. Front. Microbiol. 2015, 6, 308. [Google Scholar] [CrossRef] [PubMed]
- Trombetta, T.; Vidussi, F.; Mas, S.; Parin, D.; Simier, M.; Mostajir, B. Water temperature drives phytoplankton blooms in coastal waters. PLoS ONE 2019, 14, e0214933. [Google Scholar] [CrossRef] [PubMed] [Green Version]
- Abdel Aziz, N.E.; Gharib, S.M. The interaction between phytoplankton and zooplankton in a Lake-Sea connection, Alexandria, Egypt. Int. J. Ocean. Oceanogr. 2006, 1, 151–165. [Google Scholar]
- Zaher, S.S.; Aly, W. Impact of flood regime on phytoplankton communities in the large African reservoir, Lake Nasser, Egypt. Afr. J. Aquat. Sci. 2021, 2021, 1888688. [Google Scholar] [CrossRef]
- El-Shabrawy, G.M.; Dumont, H.J. Spatial and seasonal variation of the zooplankton in the coastal zone and main khors of Lake Nasser (Egypt). Hydrobiology 2003, 491, 119–132. [Google Scholar] [CrossRef]
- El-Serafy, S.S.; Mageed, A.A.; Hesham, R. Impact of flood on the distribution of zooplankton in Lake Nasser khors-Egypt. J. Egypt. Acad. Environ. Dev. 2009, 10, 121–141. [Google Scholar]
- Khalifa, N.; El-Damhogy, K.A.; Fishar, M.R.; Nasef, A.M.; Hegab, M.H. Vertical distribution of zooplankton in Lake Nasser. Egypt. J. Aquat. Res. 2015, 41, 177–185. [Google Scholar] [CrossRef] [Green Version]
- Idso, S.B. Relative Rates of Evaporative Water Losses from Open and Vegetation Covered Water Bodies. J. Am. Water Resour. Assoc. 1981, 17, 46–48. [Google Scholar] [CrossRef]
- Crundwell, M.E. A review of hydrophyte evapotranspiration. Rev. Hydrobiol. Trop. 1986, 19, 215–232. [Google Scholar]
- Ali, M.M. Aquatic macrophytes in Egyptian Nubia pre and post-formation of Lake Nasser. In Sustainable Fish Production in Lake Nasser: Ecological Basis and Management Policy; Craig, J.F., Ed.; International Centel for LIVing AquatiC Resources Management: Laguna, Philippine, 2000; pp. 61–65. [Google Scholar]
- Haroon, A.M. Long Term Changes of Macrophytes in Lake Nasser. In Ecological Basis for Lake Nasser Ecosystem; El shabrawy, G., Ed.; Lambert Academic Publishing: Saarbrücken, Germany, 2014; pp. 169–192. [Google Scholar]
- Haroon, A.M.; Abd Ellah, R.G. Variability response of aquatic macrophytes in inland lakes: Case study Lake Nasser, Egypt. Egypt. J. Aquat. Res. 2021, 46, 103–115. [Google Scholar]
- Hussian, A.M.; Haroon, A.M. Sensitivity of submerged aquatic macrophytes and their epiphytic microalgae to the different environmental variables in River Nile, Egypt. Int. J. Ecol. Environ. Sci. 2019, 45, 107–122. [Google Scholar]
- Adam, M.S.; Hifney, A.F.; Fawzy, M.A.; Al-Badaani, A.A. Seasonal biodiversity and ecological studies on the epiphytic microalgae communities in polluted and unpolluted aquatic ecosystem at Assiut, Egypt. Eur. J. Ecol. 2017, 3, 92–106. [Google Scholar] [CrossRef] [Green Version]
- Dos Santos, T.R.; Castilho, M.C.; Henry, R.; Ferragut, C. Relationship between epipelon, epiphyton and phytoplankton in two limnological phases in a shallow tropical reservoir with high Nymphaea coverage. Hydrobiology 2020, 847, 1121–1137. [Google Scholar] [CrossRef]
- Carvalho, C.; Hepp, L.U.; Palma-Silva, C.; Albertoni, E.F. Decomposition of macrophytes in a shallow subtropical lake. Limnological 2015, 53, 1–9. [Google Scholar] [CrossRef]
- Körner, S.H. Nee Allelopathic inhibition of epiphytes by submerged macrophytes. Aquat. Bot. 2006, 85, 252–256. [Google Scholar] [CrossRef]
- Abd El-Karim, M.S.; Fishar, M.R.; Abdel Gawad, S.S. Epiphytic algae and macroinvertebrates communities of Myriophyllum spicatum Lemm and their cascade in the littoral food web of Lake Nasser, Egypt. Glob. Vet. 2009, 3, 165–177. [Google Scholar]
- Fawzy, M.A. Spatial distribution of epiphytic algae growing on the aquatic macrophytes Phragmites australis and Echinochloa stagnina at Assuit-Egypt. Minia Sci. Bull. 2016, 2, 1–26. [Google Scholar]
- Abdel-Aal, E.I. Species composition and diversity of epiphytic microalgae on Myriophyllum spicatum in the El-Ibrahimia Canal, Egypt. Afr. J. Aquat. Sci. 2021, 2021, 1884523. [Google Scholar] [CrossRef]
- GAFRD. Fisheries Statistics Yearbook; General Authority for Fish Resources Development: Cairo, Egypt, 2018.
- YEAG. Youth Employment in Aswan Governorate Project; Report of Fisheries Assessment of Lake Nasser, Aswan–Egypt; World Fish Center: Penang, Malaysia, 2017. [Google Scholar]
- Nasr-Allah, A.M.; Habib, O.A.; Dickson, M.; Dickson, C. Value Chain Analysis of Lake Nasser Fisheries in Aswan, Upper Egypt; Program Report: 2016-11; World Fish Center: Penang, Malaysia, 2016. [Google Scholar]
- Bishai, H.; Abdel Malek, S.; Khalil, M. Lake Nasser. Egyptian Environmental Affairs Agency (EEAA production); National Biodiversity Unit: Cairo, Egypt, 2000; Volume 11, p. 577. [Google Scholar]
- Halls, A.S.; Habib, O.A.; Nasr-Allah, A.M.; Dickson, M. Lake Nasser Fisheries: Literature Review and Situation Analysis; Program Report: 2015-42; World Fish Center: Penang, Malaysia, 2015. [Google Scholar]
- Zwieten, P.A.M.; Bene, C.; Kolding, J.; Brummett, R.; Valbo-Jorgensen, J. Review of Tropical Reservoirs and Their Fisheries—The Cases of Lake Nasser, Lake Volta and Indo-Gangetic Basin Reservoirs; FAO Fisheries and Aquaculture Technical Paper, No. 557; Food and Agriculture Organization of the United Nation: Rome, Italy, 2011. [Google Scholar]
- El-Far, A.; Aly, W.; El-Haweet, A.E.-D.; Nasr-Allah, A.; Karisa, H. Fisheries management based on gear selectivity of a tropical reservoir, Lake Nasser, Egypt. Egypt. J. Aquat. Res. 2020, 46, 71–77. [Google Scholar] [CrossRef]


| Sampling Site | Longitude N | Latitude E | ||
|---|---|---|---|---|
| 1. HD upstream | E1 | 1 | 32°53′53.14″ | 23°57′38.34″ |
| M1 | 2 | 32°52′59.84″ | 23°57′39.40″ | |
| W1 | 3 | 32°51′45.25″ | 23°57′57.24″ | |
| 2. Wadi Abyade | E2 | 4 | 32°57′21.50″ | 23°22′39.27″ |
| M2 | 5 | 32°56′02.10″ | 23°22′17.93″ | |
| W2 | 6 | 32°55′13.30″ | 23°22′41.22″ | |
| 3. El Madiq | E3 | 7 | 32°37′14.70″ | 22°54′55.41″ |
| M3 | 8 | 32°36′43.69″ | 22°55′21.23″ | |
| W3 | 9 | 32°36′04.35″ | 22°55′51.28″ | |
| 4.Tushka | E4 | 10 | 31°55′38.27″ | 22°34′39.42″ |
| M4 | 11 | 31°55′33.98″ | 22°35′28.23″ | |
| W4 | 12 | 31°52′00.53″ | 22°35′58.79″ | |
| 5. Abu Simble | E5 | 13 | 31°40′50.66″ | 22°20′11.31″ |
| M5 | 14 | 31°39′31.38″ | 22°20′47.88″ | |
| W5 | 15 | 31°37′57.75″ | 22°21′10.13″ | |
| Parameter | Post-Flood Period | Pre-Flood Period | ||||||||
|---|---|---|---|---|---|---|---|---|---|---|
| Min | Max | Mean | SD | CV, % | Min | Max | Mean | SD | CV, % | |
| 1 T, °C | 23.0 | 28.5 | 24.5 | 1.3 | 5 | 25.5 | 29.7 | 28.4 | 1.2 | 4 |
| 2 EC, µS cm−1 | 225 | 270 | 245.6 | 13.5 | 6 | 214 | 244 | 230.5 | 11.7 | 5 |
| 3 SDD, m | 1.8 | 4.0 | 2.7 | 0.8 | 29 | 1.3 | 4.8 | 3.4 | 1.1 | 32 |
| 2 TDS, mg L−1 | 146.3 | 175.5 | 159.7 | 8.8 | 6 | 139.1 | 158.6 | 149.8 | 7.6 | 5 |
| 1 TSS, mg L−1 | 0.8 | 2.9 | 2.0 | 0.7 | 32 | 3.9 | 6.9 | 5.2 | 1.0 | 20 |
| 3 TS, mg L−1 | 149.1 | 176.3 | 161.7 | 8.5 | 5 | 145.8 | 163.2 | 155.0 | 6.7 | 4 |
| 1 pH | 8.1 | 8.6 | 8.4 | 0.1 | 1 | 8.3 | 8.9 | 8.7 | 0.2 | 2 |
| DO, mg L−1 | 5.0 | 8.0 | 6.5 | 0.9 | 13 | 4.9 | 7.0 | 6.3 | 0.7 | 11 |
| BOD, mg L−1 | 1.4 | 5.2 | 2.9 | 1.2 | 42 | 0.8 | 2.9 | 2.0 | 0.7 | 32 |
| 2 COD, mg L−1 | 3.7 | 5.7 | 4.8 | 0.6 | 13 | 3.8 | 4.4 | 4.1 | 0.2 | 4 |
| NH4, µg L−1 | 74.8 | 1343 | 251.7 | 319.3 | 127 | 90.1 | 436.9 | 186.7 | 84.5 | 45 |
| 1 NO2, µg L−1 | 3.6 | 16.0 | 9.2 | 4.0 | 44 | 1.6 | 7.2 | 3.8 | 1.6 | 41 |
| 3 NO3, µg L−1 | 40.8 | 657.6 | 153.8 | 193.3 | 126 | 18.4 | 93.6 | 50.5 | 24.1 | 48 |
| 1 PO4, µg L−1 | 4.4 | 13.2 | 9.8 | 2.5 | 25 | 11.2 | 20.9 | 14.8 | 2.8 | 19 |
| SiO4, mg L−1 | 4.4 | 6.7 | 5.4 | 0.6 | 11 | 2.8 | 6.4 | 4.9 | 1.1 | 22 |
| 2 CO3, mg L−1 | 0 | 2.4 | 1.3 | 0.7 | 52 | 0 | 4.5 | 2.5 | 1.6 | 63 |
| 1 HCO3, mg L−1 | 116.8 | 140.2 | 131.7 | 8.7 | 7 | 90.3 | 109.8 | 99.6 | 7.5 | 8 |
| 3 SO4, mg L−1 | 3.6 | 5.3 | 4.4 | 0.4 | 10 | 3.8 | 6.1 | 4.9 | 0.6 | 12 |
| 1 Cl, mg L−1 | 8.2 | 9.6 | 8.6 | 0.4 | 5 | 9.1 | 9.9 | 9.3 | 0.3 | 3 |
| 1 Ca, mg L−1 | 8.0 | 8.7 | 8.4 | 0.2 | 2 | 9.2 | 10.9 | 10.1 | 0.6 | 6 |
| 1 Mg, mg L−1 | 6.1 | 7.6 | 6.5 | 0.4 | 6 | 8.1 | 8.7 | 8.4 | 0.2 | 3 |
| 2 Na, mg L−1 | 9.9 | 11.3 | 10.5 | 0.5 | 4 | 10.3 | 12.2 | 11.3 | 0.7 | 6 |
| 1 K, mg L−1 | 3.4 | 4.1 | 3.7 | 0.2 | 6 | 3.8 | 4.5 | 4.1 | 0.2 | 6 |
| 1 Chl-a, µg L−1 | 19.9 | 102.4 | 53.4 | 25.3 | 19.9 | 19.9 | 102.4 | 53.4 | 25.3 | 47 |
| Site | TVBC at 37 °C × 103 (CFU mL−1) | TVBC at 22 °C × 103 (CFU mL−1) | TC (MPN 100 mL−1) | FC (MPN 100 mL−1) | FS (MPN 100 mL−1) | E. coli (CFU 100 mL−1) |
|---|---|---|---|---|---|---|
| 1 | 68 | 60 | 35 | 21 | 120 | 12 |
| 2 | 85 | 80 | 460 | 460 | 290 | 250 |
| 3 | 45 | 39 | 1100 | 1100 | 460 | 200 |
| 4 | 29 | 50 | n.d. | n.d. | 43 | n.d. |
| 5 | 25 | 66 | 16 | 16 | 23 | 9 |
| 6 | 33 | 58 | 29 | 6 | 24 | n.d. |
| 7 | 110 | 102 | 29 | 15 | 5 | 9 |
| 8 | 22 | 29 | 53 | 24 | 14 | 8 |
| 9 | 46 | 75 | 16 | 16 | 20 | 5 |
| 10 | 1.2 | 2 | 460 | 93 | 43 | 25 |
| 11 | 4 | 8 | 11 | 7 | n.d. | n.d. |
| 12 | 1 | 1.5 | n.d. | n.d. | 3 | n.d. |
| 13 | 99 | 135 | 16 | 16 | 23 | 7 |
| 14 | 50 | 95 | 15 | 7 | 7 | n.d. |
| 15 | 66 | 75 | 23 | 23 | 4 | 10 |
| Mean | 45.6 | 58.4 | 150.9 | 120.3 | 71.9 | 35.7 |
| SD | 34.4 | 38.2 | 304.6 | 294.7 | 130.5 | 77.7 |
| CV | 75.5 | 65.5 | 201.9 | 245.0 | 181.5 | 217.9 |
| Site | TVBC at 37 °C × 103 (CFU mL−1) | TVBC at 22 °C × 103 (CFU mL−1) | TC (MPN 100 mL−1) | FC (MPN 100 mL−1) | FS (MPN 100 mL−1) | E. coli (CFU 100 mL−1) |
|---|---|---|---|---|---|---|
| 1 | 16 | 11 | 93 | 7 | 4 | n.d. |
| 2 | 12 | 10 | 9 | 4 | n.d. | n.d. |
| 3 | 24 | 18 | 43 | 9 | n.d. | n.d. |
| 4 | 12 | 10 | 9 | n.d. | n.d. | n.d. |
| 5 | 1.6 | 1.3 | 4 | n.d. | 9 | n.d. |
| 6 | 21 | 24 | 21 | n.d. | 9 | n.d. |
| 7 | 18 | 16 | 15 | 4 | 240 | n.d. |
| 8 | 29 | 23 | 4 | 4 | 4 | n.d. |
| 9 | 25 | 34 | 150 | 23 | n.d. | 12 |
| 10 | 32 | 28 | 46,000 | 240 | 23 | 150 |
| 11 | 0.9 | 0.8 | 460 | 93 | 460 | 46 |
| 12 | 19 | 22 | 1100 | 43 | 4 | 22 |
| 13 | 12 | 10 | 46,000 | 150 | 93 | 90 |
| 14 | 1.9 | 21 | 460 | 43 | n.d. | 25 |
| 15 | 16 | 21 | 46,000 | 150 | 460 | 95 |
| Mean | 16.0 | 16.7 | 9357.9 | 51.3 | 87.1 | 29.3 |
| SD | 9.6 | 9.4 | 18,966.4 | 73.7 | 164.0 | 46.4 |
| CV | 59.9 | 56.5 | 202.7 | 143.7 | 188.3 | 158.0 |
| Site | Species Richness (SR) | Shannon Index (SI) | Evenness (E) | |||
|---|---|---|---|---|---|---|
| Post-Flood | Pre-Flood | Post-Flood | Pre-Flood | Post-Flood | Pre-Flood | |
| 1 | 39 | 38 | 2.007 | 1.859 | 0.548 | 0.511 |
| 2 | 33 | 46 | 1.817 | 2.533 | 0.520 | 0.662 |
| 3 | 27 | 29 | 1.691 | 1.694 | 0.513 | 0.503 |
| 4 | 28 | 30 | 1.221 | 1.877 | 0.366 | 0.552 |
| 5 | 32 | 41 | 1.700 | 1.914 | 0.491 | 0.515 |
| 6 | 38 | 42 | 1.986 | 2.041 | 0.546 | 0.546 |
| 7 | 28 | 32 | 1.392 | 1.259 | 0.418 | 0.363 |
| 8 | 25 | 29 | 2.031 | 1.761 | 0.631 | 0.523 |
| 9 | 25 | 31 | 1.699 | 1.635 | 0.528 | 0.476 |
| 10 | 25 | 29 | 2.179 | 1.196 | 0.677 | 0.355 |
| 11 | 24 | 30 | 1.887 | 1.154 | 0.594 | 0.339 |
| 12 | 24 | 27 | 2.308 | 1.026 | 0.726 | 0.311 |
| 13 | 15 | 20 | 2.113 | 0.864 | 0.780 | 0.289 |
| 14 | 26 | 20 | 1.813 | 1.270 | 0.556 | 0.424 |
| 15 | 41 | 26 | 0.944 | 0.955 | 0.254 | 0.293 |
| Mean | 27.9 | 30.9 | 1.770 | 1.513 | 0.543 | 0.439 |
| SD | 6.5 | 7.6 | 0.377 | 0.484 | 0.139 | 0.116 |
| CV | 23.1 | 24.5 | 21.3 | 32.0 | 25.7 | 26.4 |
| Species | Sampling SITES | ||||||||||||||
|---|---|---|---|---|---|---|---|---|---|---|---|---|---|---|---|
| 1 | 2 | 3 | 4 | 5 | 6 | 7 | 8 | 9 | 10 | 11 | 12 | 13 | 14 | 15 | |
| Post-Flood Period | |||||||||||||||
| Chroococcus dispersus | 5 | 4 | 0 | 3 | 1 | 2 | 3 | 0 | 0 | 4 | 0 | 2 | 0 | 2 | 0 |
| Chroococcus minimus | 21 | 55 | 42 | 65 | 49 | 42 | 67 | 48 | 46 | 30 | 49 | 34 | 16 | 53 | 83 |
| Coelosphaerium dubium | 2 | 0 | 0 | 3 | 0 | 0 | 0 | 0 | 0 | 0 | 0 | 11 | 0 | 7 | 4 |
| Raphidiopsis raciborskii | 0 | 0 | 4 | 1 | 2 | 3 | 1 | 5 | 2 | 3 | 2 | 0 | 7 | 2 | 0 |
| Merismopedia tenuissima | 7 | 2 | 0 | 1 | 10 | 0 | 4 | 10 | 6 | 0 | 11 | 0 | 0 | 0 | 2 |
| Aphanocapsa incerta | 0 | 9 | 0 | 0 | 0 | 0 | 0 | 0 | 21 | 0 | 0 | 0 | 0 | 0 | 0 |
| Pseudanabaena sp. | 44 | 10 | 34 | 21 | 24 | 27 | 13 | 6 | 14 | 28 | 14 | 7 | 13 | 11 | 1 |
| Coelastrum cambricum | 2 | 0 | 3 | 0 | 2 | 2 | 1 | 0 | 3 | 0 | 0 | 0 | 5 | 0 | 0 |
| Coelastrum microporum | 0 | 0 | 0 | 0 | 2 | 0 | 2 | 0 | 0 | 0 | 0 | 0 | 10 | 0 | 0 |
| Monactinus simplex | 0 | 0 | 0 | 0 | 0 | 0 | 1 | 0 | 0 | 4 | 2 | 11 | 0 | 2 | 0 |
| Desmococcus olivaceus | 0 | 0 | 3 | 0 | 1 | 3 | 1 | 0 | 1 | 2 | 5 | 6 | 23 | 8 | 0 |
| Aulacoseira granulata | 0 | 0 | 0 | 0 | 0 | 0 | 1 | 1 | 0 | 9 | 5 | 9 | 17 | 5 | 0 |
| Pantocsekiella ocellata | 2 | 2 | 2 | 1 | 1 | 1 | 2 | 5 | 3 | 2 | 0 | 0 | 0 | 0 | 0 |
| Melosira sp. | 0 | 0 | 0 | 0 | 0 | 0 | 0 | 0 | 0 | 5 | 2 | 3 | 3 | 1 | 0 |
| Cryptomonas erosa | 0 | 0 | 0 | 0 | 0 | 0 | 0 | 9 | 0 | 2 | 1 | 1 | 1 | 1 | 0 |
| Pre-Flood Period | |||||||||||||||
| Chroococcus dispersus | 0 | 0 | 0 | 5 | 1 | 0 | 0 | 0 | 0 | 0 | 0 | 0 | 0 | 0 | 0 |
| Chroococcus minimus | 4 | 6 | 12 | 2 | 9 | 6 | 4 | 0 | 2 | 3 | 76 | 34 | 0 | 0 | 0 |
| Chroococcus minutus | 47 | 32 | 54 | 43 | 38 | 35 | 69 | 35 | 54 | 47 | 0 | 0 | 17 | 21 | 31 |
| Coelosphaerium kuetzingianum | 0 | 5 | 0 | 0 | 0 | 0 | 0 | 0 | 0 | 0 | 0 | 0 | 0 | 0 | 0 |
| Raphidiopsis raciborskii | 0 | 7 | 0 | 0 | 0 | 0 | 0 | 0 | 0 | 0 | 4 | 0 | 0 | 0 | 0 |
| Merismopedia punctata | 10 | 4 | 6 | 16 | 6 | 11 | 5 | 6 | 5 | 1 | 4 | 2 | 2 | 4 | 1 |
| Microcystis aeruginosa f. aeruginosa | 4 | 6 | 0 | 2 | 1 | 0 | 1 | 1 | 2 | 1 | 1 | 0 | 1 | 0 | 0 |
| Oscillatoria limosa | 0 | 0 | 0 | 0 | 14 | 0 | 0 | 0 | 0 | 0 | 0 | 1 | 0 | 0 | 0 |
| Spirulina laxa | 20 | 16 | 14 | 18 | 23 | 29 | 14 | 28 | 24 | 41 | 0 | 59 | 76 | 62 | 63 |
| Chlamydomonas globosa | 0 | 5 | 0 | 5 | 0 | 0 | 0 | 0 | 0 | 0 | 0 | 2 | 0 | 0 | 0 |
| Coelastrum microporum | 1 | 2 | 3 | 0 | 1 | 1 | 0 | 21 | 3 | 4 | 1 | 0 | 0 | 0 | 0 |
| Sites | Myriophyllum spicatum | Potamogeton schweinfurthii | Najasmarina subsp. armata | |||
|---|---|---|---|---|---|---|
| Post-Flood | Pre-Flood | Post-Flood | Pre-Flood | Post-Flood | Pre-Flood | |
| 1 | + | + | − | − | − | − |
| 3 | + | + | − | − | − | − |
| 4 | + | − | − | + | − | − |
| 6 | + | + | − | − | − | − |
| 7 | + | + | + | − | − | − |
| 9 | + | + | − | + | − | − |
| 10 | − | + | − | − | + | − |
| 12 | − | + | − | − | − | − |
| 13 | − | + | − | − | − | − |
| 15 | − | + | − | − | − | − |
Publisher’s Note: MDPI stays neutral with regard to jurisdictional claims in published maps and institutional affiliations. |
© 2021 by the authors. Licensee MDPI, Basel, Switzerland. This article is an open access article distributed under the terms and conditions of the Creative Commons Attribution (CC BY) license (https://creativecommons.org/licenses/by/4.0/).
Share and Cite
Goher, M.E.; Napiórkowska-Krzebietke, A.; Aly, W.; El-Sayed, S.M.; Tahoun, U.M.; Fetouh, M.A.; Hegab, M.H.; Haroon, A.M.; Sabae, S.A.; Abdel-Aal, E.I.; et al. Comprehensive Insight into Lake Nasser Environment: Water Quality and Biotic Communities—A Case Study before Operating the Renaissance Dam. Water 2021, 13, 2195. https://doi.org/10.3390/w13162195
Goher ME, Napiórkowska-Krzebietke A, Aly W, El-Sayed SM, Tahoun UM, Fetouh MA, Hegab MH, Haroon AM, Sabae SA, Abdel-Aal EI, et al. Comprehensive Insight into Lake Nasser Environment: Water Quality and Biotic Communities—A Case Study before Operating the Renaissance Dam. Water. 2021; 13(16):2195. https://doi.org/10.3390/w13162195
Chicago/Turabian StyleGoher, Mohamed E., Agnieszka Napiórkowska-Krzebietke, Walid Aly, Seliem M. El-Sayed, Usama M. Tahoun, Mohamed A. Fetouh, Mahmoud H. Hegab, Amany M. Haroon, Soaad A. Sabae, Eman I. Abdel-Aal, and et al. 2021. "Comprehensive Insight into Lake Nasser Environment: Water Quality and Biotic Communities—A Case Study before Operating the Renaissance Dam" Water 13, no. 16: 2195. https://doi.org/10.3390/w13162195