
Dynamic Analysis of Wake Characteristics of the Circular Cylinder with a Dimpled Surface
by
Jiyang Qi
1, 
Yuyao Shao
2,
Qunyan Chen
3,
Ping Liu
4,*,
Chen Chen
1,
Deqiang Wang
1,
Haifeng Yang
1 and
Fei Yan
1,* 1
School of Mechanical Engineering, Jiangsu University of Science and Technology, Zhenjiang 212000, China
2
School of Science, Xi’an Jiaotong-Liverpool University, Suzhou 215000, China
3
Department of Metallurgy and Automotive Engineering, Shandong Vocational College of Industry, Zibo 256414, China
4
Mining College, Guizhou University, Guiyang 550025, China
*
Authors to whom correspondence should be addressed.
Water 2021, 13(16), 2197; https://doi.org/10.3390/w13162197
Submission received: 6 July 2021
/
Revised: 5 August 2021
/
Accepted: 9 August 2021
/
Published: 12 August 2021
(This article belongs to the Section Hydraulics and Hydrodynamics)
Abstract
:In order to understand the wake characteristics for the circular cylinder with the dimpled structure, particle image velocimetry (PIV) and proper orthogonal decomposition (POD) method are used to measure and analyze the flow field velocity and the flow characteristic of the wake flow of the circular cylinder with the dimpled surface. This study focuses on the distribution of Reynolds stress and turbulent kinetic energy, the velocity profiles and recirculation zones, and the velocity fluctuating characteristics of flow field with POD technology. It is found that the equivalent high-intensity Reynolds stress and turbulent kinetic energy regions of the circular cylinder with the dimpled surface are smaller, and the peak values are lower, and the velocity gradient in the wake region of the circular cylinder with the dimpled surface is larger. Otherwise, the energy contained by the dominant modes of the smooth cylinder is larger than that contained by the dominant modes of the circular cylinders with the dimpled surface, which means the energy of the dimpled cylinder is more distributed. At the same time, it is observed that the dimpled structure will decrease the vortex shedding intensity, but may increase the vortex shedding frequency, and destroy the inherent flow mode of the flow field around the cylinder.
1. Introduction
As a classical and fundamental fluid mechanics problem, the research on the flow field around a cylinder has been ongoing. The research point of this problem has been placed on the drag reduction and wake characteristics by various researchers. These researchers are continuously validating their hypotheses in the subsequent studies through the combination of experiment and theory. The ongoing interest in this research point stems from the danger of drag to buildings and equipment, which can lead to safety hazards and reduce the service life of buildings and equipment.
There are many reported studies on flow past cylinders and use of passive devices on the cylinder in order to reduce the drag force and delay the vortex release. Simantiras and Willis [1] took advantage of the towing arrangement and relevant instrumentation of both the test programs to study the suppression effect of the in-house helical strake on drag. It was found that the tested in-house helical strakes were demonstrated to effectively suppress the first mode of the vortex-induced vibration response, even at the higher inclination angles. When the single hand helical strake was subjected to inclined flows, it would provide a considerable displacing force on the test pipes. Yamagishi and Oki [2] used the RNG k-ω turbulent model and oil-film technique to analyze the effect of the number of grooves on flow characteristics around a circular cylinder with triangular grooves. One of the more important conclusions was that a sudden decrease in the mean drag coefficient of a cylinder with 32 triangular grooves occurred at a lower Reynolds number compared with 20 and 26 triangular grooves. Baek and Karniadakis [3] used numerical simulation methods to study the influence of the slit parallel to the incoming flow on the wake characteristics. Through either weakening or detuning vortex shedding, the slit was proved to be very useful in reducing drag, and the optimal size of the slit was found at Reynolds number 500, but this size was smaller at a higher Re = 1000. Assi et al. [4] experimentally studied the use of two-dimensional control devices to suppress VIV and reduce drag. It was found that the crossflow and in-line VIV of a circular cylinder are suppressed and the drag coefficients of the two-dimensional control plates less than that for a fixed plain cylinder. The maximum drag reduction occurs with parallel plates and is about 38%. Owen and Baman [5] used experimental methods to measure the drag and vortex-induced vibration amplitudes of a circular cylinder, a circular cross-sectional body with a sinuous axis and a circular cylinder with hemispherical bumps attached. The results show that the suppression of vortex shedding and drag reductions up to 47% for the body with a sinuous axis. Drag reductions of about 25% and suppression of vortex shedding for the cylinder with bumps. Shiels and Leonad [6] studied drag reduction of two-dimensional flow by rotating oscillation on a cylinder through computational simulation. Analysis of the data shows that boundary layer bursting result in the formation of a multipole vorticity structure, which is triggered by appropriate rotational oscillation, leads to a time-averaged separation delay and thus drag reduction. Xu et al. [7] studied the aerodynamic characteristics of a circular cylinder (diameter = 600mm) with and without ice accretion via wind tunnel tests for Re = 1.29 × 10⁵ − 1.27 × 10⁶. Experimental results showed that the MAFCs of the ice-accreted cylinders exhibited significant Reynolds number effects, and the Reynolds number effects are closely related to the ice shapes. Zhang et al. [8] used numerical simulation to study the torsional vibration caused by the flow of an elastically mounted circular cylinder with an attached splitter plate in laminar flow with a Reynolds number of 100. The numerical results show that the synchronization range of VIV extends, the peak VIV amplitude increases, and the critical reduced flow velocity for the bifurcation decreases with decreasing the moment of inertia. Besides, Zhu and Zhang [9], Yang and Wu [10], and Williamson and Govardhan [11] have carried out relevant studies. In particular, Zhou et al. [12] studied the drag reduction effect of the circular cylinder with the dimpled surface. In their study, the roughness coefficient (k/D) of dimples is 0.05, and two types of surfaces, half dimpled and fully dimpled, were decorated on the circular cylinders. However, the wake characteristic of the circular cylinder with the number of the dimpled structure has not been studied, this is of fundamental significance and, thus becoming an objective of this study.
There are many ways to study the flow field, and proper orthogonal decomposition (POD) is one of them. POD, which mainly considers the optimal decomposition in terms of energy, can be used to describe the flow field through a few dominant modes [13]. This allows reducing large data sets obtained from particle image velocimetry drastically, while still preserving the most important features of the flow field. Berkooz et al. [14] had introduced the POD theory in their research and expounded its adhibition of the analysis and modeling of turbulent flows. Ma et al. [15] simulated unsteady fluid flows through a new approach, which had the advantage of only very few degrees of freedom. Zwintzscher et al. [16] employed a data-driven approach to control vortex shedding on a circular cylinder for Reynolds numbers 100 and 20,000, in this study, POD method is used to determine the spatial position of the nonlinear forcing driving the wake. The results show that when Re = 100, a suppression of 15% of the highest forcing is sufficient to completely control the vortex shedding, while when Re = 20,000, a suppression of 50% of the highest forcing is sufficient to suppress the formation of the vortex. Alok and Ashoke [17] used POD and DMD methods investigate the dominant vortical structure for slit through the cylinder in the laminar regime (Re = 100–500). It is shown that the slit width ratio S/D (slit width/diameter) on the modified cylinder plays an essential role to control the vortex shedding. The new approach was based on the eigenmodes extracted directly from the experimental data of PIV measurement. So, POD method had been applied to the analysis of the flow around a circular cylinder.
In this paper, the particle image velocimetry (PIV) and proper orthogonal decomposition (POD) technology are used to measure and analyze the flow field velocity and the flow characteristic of the wake flow of the circular cylinder with the dimpled surface. This study focuses on the flow field variation in the circular cylinder with the dimpled surface in terms of the distribution of Reynolds stress and turbulent kinetic energy, the velocity profiles and recirculation zones, and the velocity fluctuating characteristics of flow field with POD technology.
2. Experimental Apparatus
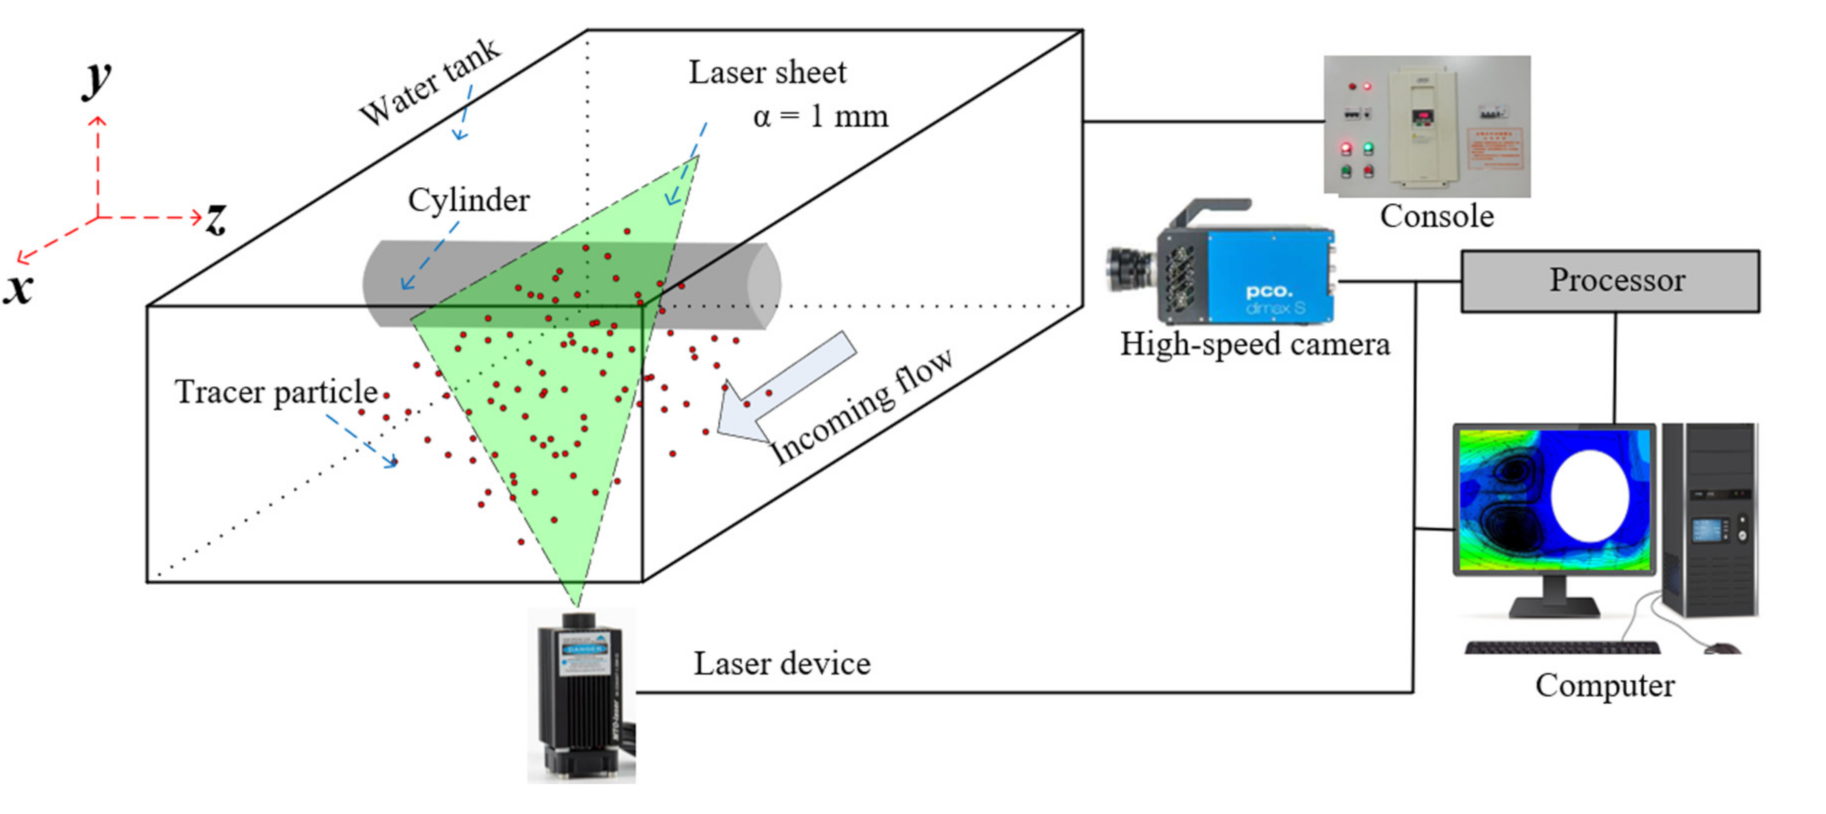
The experiment was carried out in a circulating tank whose length is about 4 m long with a rectangular cross-section of 0.3 m × 0.45 m (width × height), as provided in Figure 1. The rectifier’s function was to stabilize the water flow so that the water in the experimental section could flow through the cylinder stably, ensuring the stable experimental data. Besides that, the two side walls and bottom surfaces of the circulating tank are made of glass to promote the access of lasers generated by optical equipment, which is for easy visual assessment with PIV measurements.
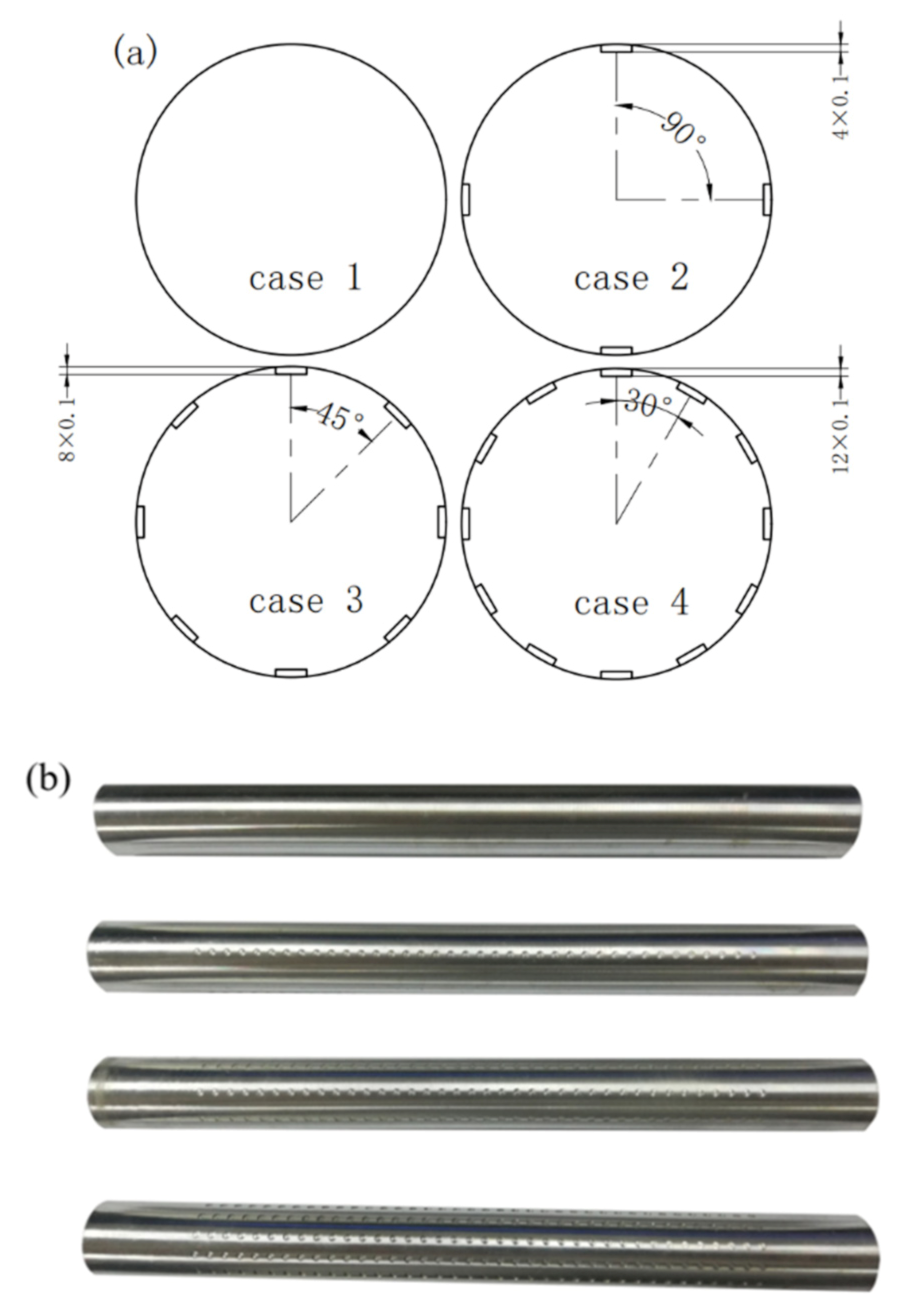
The cylinders utilized in the experiment are made of aluminum. Figure 2a shows the cross section of the cylinder, and Figure 2b shows the finished products. The diameter (d) and depth (h) of the dimples are 2 mm (d/D = 0.1) and 0.1 mm (k = h = 0.1 mm, k/D = 5 × 10⁻³, k/D is the roughness coefficient), respectively. The distance between two dimple centers is 4 mm. Based on those sizes, the dimples on the circular cylinder belong to the miniature structure. All the dimples are machined by the CNC machining center to ensure the accuracy of the dimensions. The dimples are evenly distributed on the surface of the cylinder in an equal-angle manner, the length (L) of the cylinders is 302 mm, and the diameter (D) of the cylinders is 20 mm.
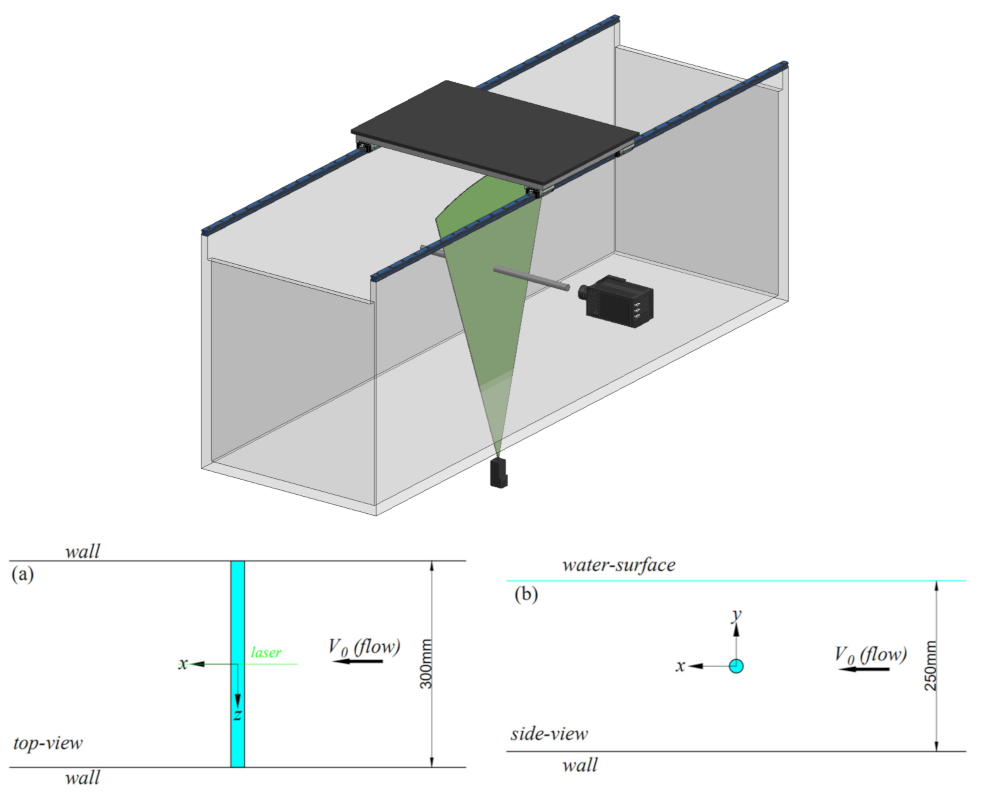
Figure 3 presents the installation position of the cylinder in the experiment. The flow direction is provided in the schematic diagram. x, y, and z represent the streamwise, the transverse, and the spanwise directions, respectively. The laser is shining on the location where dimples are arranged. The length-to-diameter of the cylinders used in the experiment is 15.1, which is considered large enough to make sure a 2D flow of the cylinder’s near-wake [18]. The cylinder should be located in the center of the tank as much as possible to extract experimental data more smoothly. The free-stream velocity in the experiment is 0.226 m/s, which results in the Re = 4.52 × 10³. The number of dimpled columns is 0, 4, 8, and 12, respectively. The corresponding marks are case 1, case 2, case 3, and case 4.
In addition to that, the PIV technique was employed to obtain the flow field data, which was an essential step for the POD method to analyze the flow field. Figure 1 also presents the experimental set-up of high-speed PIV. In this experiment, the high-speed camera (pco. dimax S1) with a typical resolution of 1008 × 1008 pixels was used to capture the 2000 successive digital particle images in the space of 2 s (i.e., 1000 frame per second), and the shutter speed of each frame was set at 1.5 μs, which was sufficient to cover the range of data of interest. The wake behind the cylinder was presented using the tracer particles (the diameter of the tracer particle is 10μm). As shown in Figure 1, a thin light-sheet of thickness α = 1 mm produced by a high-intensity continuous light source was used to illuminate around the cylinder. The distance from the camera’s focal plane mark to the light-sheet plane was fixed at about 0.5 m. The PIV view software based on the standard cross-correlation algorithm, combined with window offset theory [19], was applied to record the particle trajectories in the flow around a cylinder, and these methods would improve the signal-to-noise ratio.
3. POD Method
For a spatiotemporal velocity field u(x,y,ti) (i = 1,2, …, N) can be decomposed into the mean velocity field and the fluctuating component:
Here is the mean flow field, and is the fluctuating component.
The general goal of the POD method is to find the optimal representation of the field realizations. Due to this goal, the problem of the eigenvalue solution will be encountered, which will lead to many calculations. The “method of snapshots” proposed by Sirovich [13] is employed to reduce the computational effort involved in solving the eigenvalue problem, and the method involves using linear combinations of function space elements to describe the eigenmodes. By taking advantage of this method, the fluctuating component can be expanded as two eigenfunctions in terms of space modes and time coefficients (POD mode coefficients):
Here is associated with the spatial characteristic, while is linked with the temporal component, and is the solution to the following maximization problem:
Here, denotes the inner product of L2(Ω). Ω is the flow domain of interest.
Through the “method of snapshots”, the above problems can be simplified by the following process:
By supposing that the fluctuating component of the spatiotemporal velocity field has the form , all the fluctuating velocity components from the N snapshots can be arranged in a matrix U’ as follows:
Here u’ and v’ denote the fluctuation velocities in the streamwise and transverse directions, l and m represent the number of nodes in the two directions of the flow field, and N represents the total number of samples in the time direction (in this experiment, N = 2000).
Then, the autocovariance matrix C can be created by the matrix transformation , and the symbol T denotes the transpose operator. After that, the relationship between a set of N eigenvalues λi and a corresponding set of eigenvectors Ai can be represented by . At the same time, the eigenvalues follow a descending order, i.e., , and the corresponding eigenvalue also represents the energy contained in each mode. In this way, each eigenvalue ratio to the sum of all eigenvalues is , which represents the “energy” provided by the i-th POD mode. The normalized POD modes can be constructed using the projection of the eigenvectors Ai through the following equation:
The symbol is defined as . From Equation (2), it can be found that each fluctuating component is expanded into a series of the POD modes with POD mode coefficients ai(t). So, those POD mode coefficients ai(t) are related to POD modes. By projecting the fluctuating part of the velocity field onto the POD modes, POD mode coefficients can be determined, i.e., , where is the mode matrix. Then, the fluctuation part of an instantaneous velocity field can be expanded by:
4. Results and Discussions
4.1. The Distributions of Reynolds Stress and Turbulent Kinetic Energy
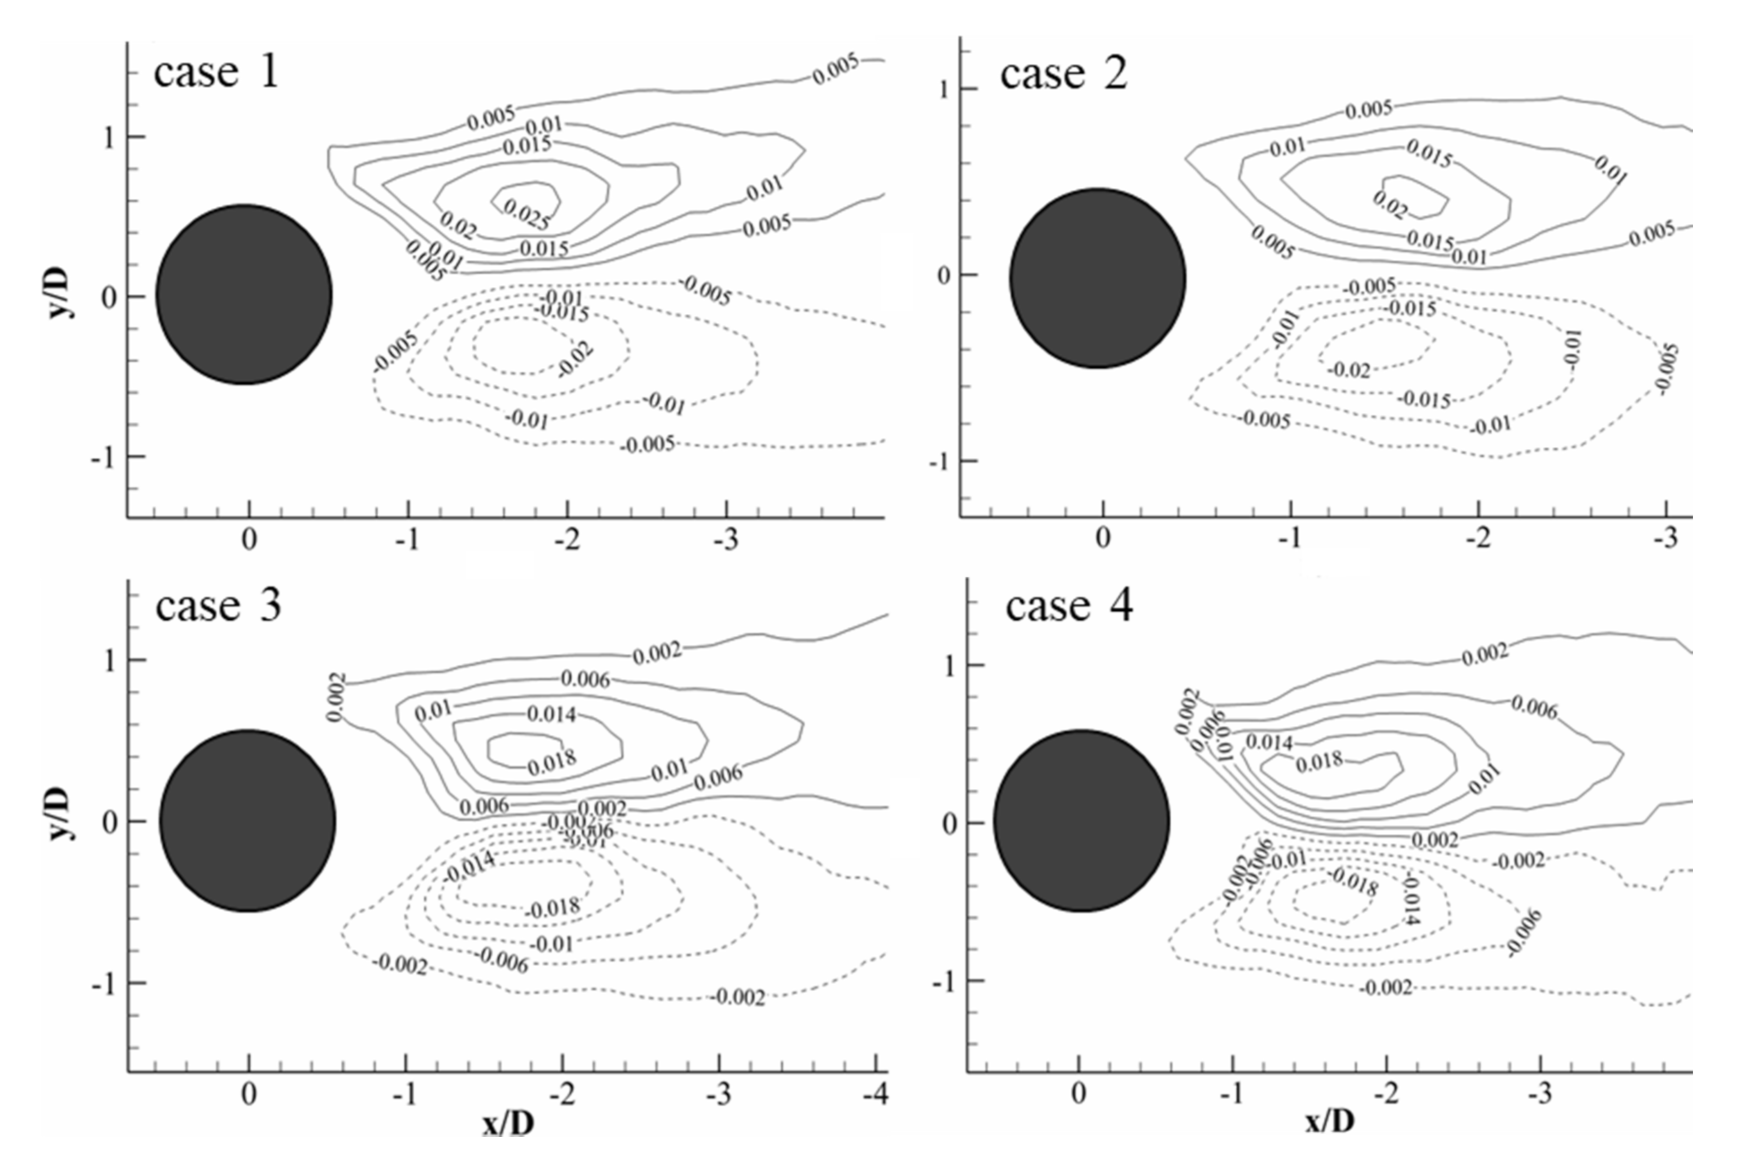
Reynold’s stress is caused by dividing the physical quantities in turbulence into the sum of the mean value and the pulsation value over time. The analysis of Reynolds stress is helpful to understand the additional stress distribution in the flow field. While turbulence kinetic energy (TKE) is a measure of turbulence intensity, which is directly related to the momentum and energy transport in the boundary layer. Contour plots of the Reynolds stress and turbulent kinetic energy distributions are shown in Figure 4 and Figure 5, respectively.
The distributions of normalized Reynold’s stress seem to be symmetric with respect to the wake centerline (y/D = 0), and the upper and lower shear layers are represented as positive and negative regions respectively [21], as shown in Figure 4. Another obvious phenomenon is that the shear layers for case 2, case 3, and case 4 are relatively smaller in both the value and area compared to that for case 1. The peak value of case 1 is 0.025, while that of case 2, case 3, and case 4 are 0.02, 0.018, and 0.018, which is about 80%, 72%, and 72% of that of case 1. The area of contour line 0.018 for case 3 is larger than that of case 4, as shown in Figure 4, and there is contour line 0.02 for case 2. It indicates that the dimple structure suppresses the turbulent fluctuation caused by the separation flow and reduces the generation of the Reynolds shear stress, and this effect becomes more obvious with the number of the dimple increases [22]. Beyond that, it explains that the dimple structure suppresses the vortices, or the downwash flow originated from the boundary layer separation.
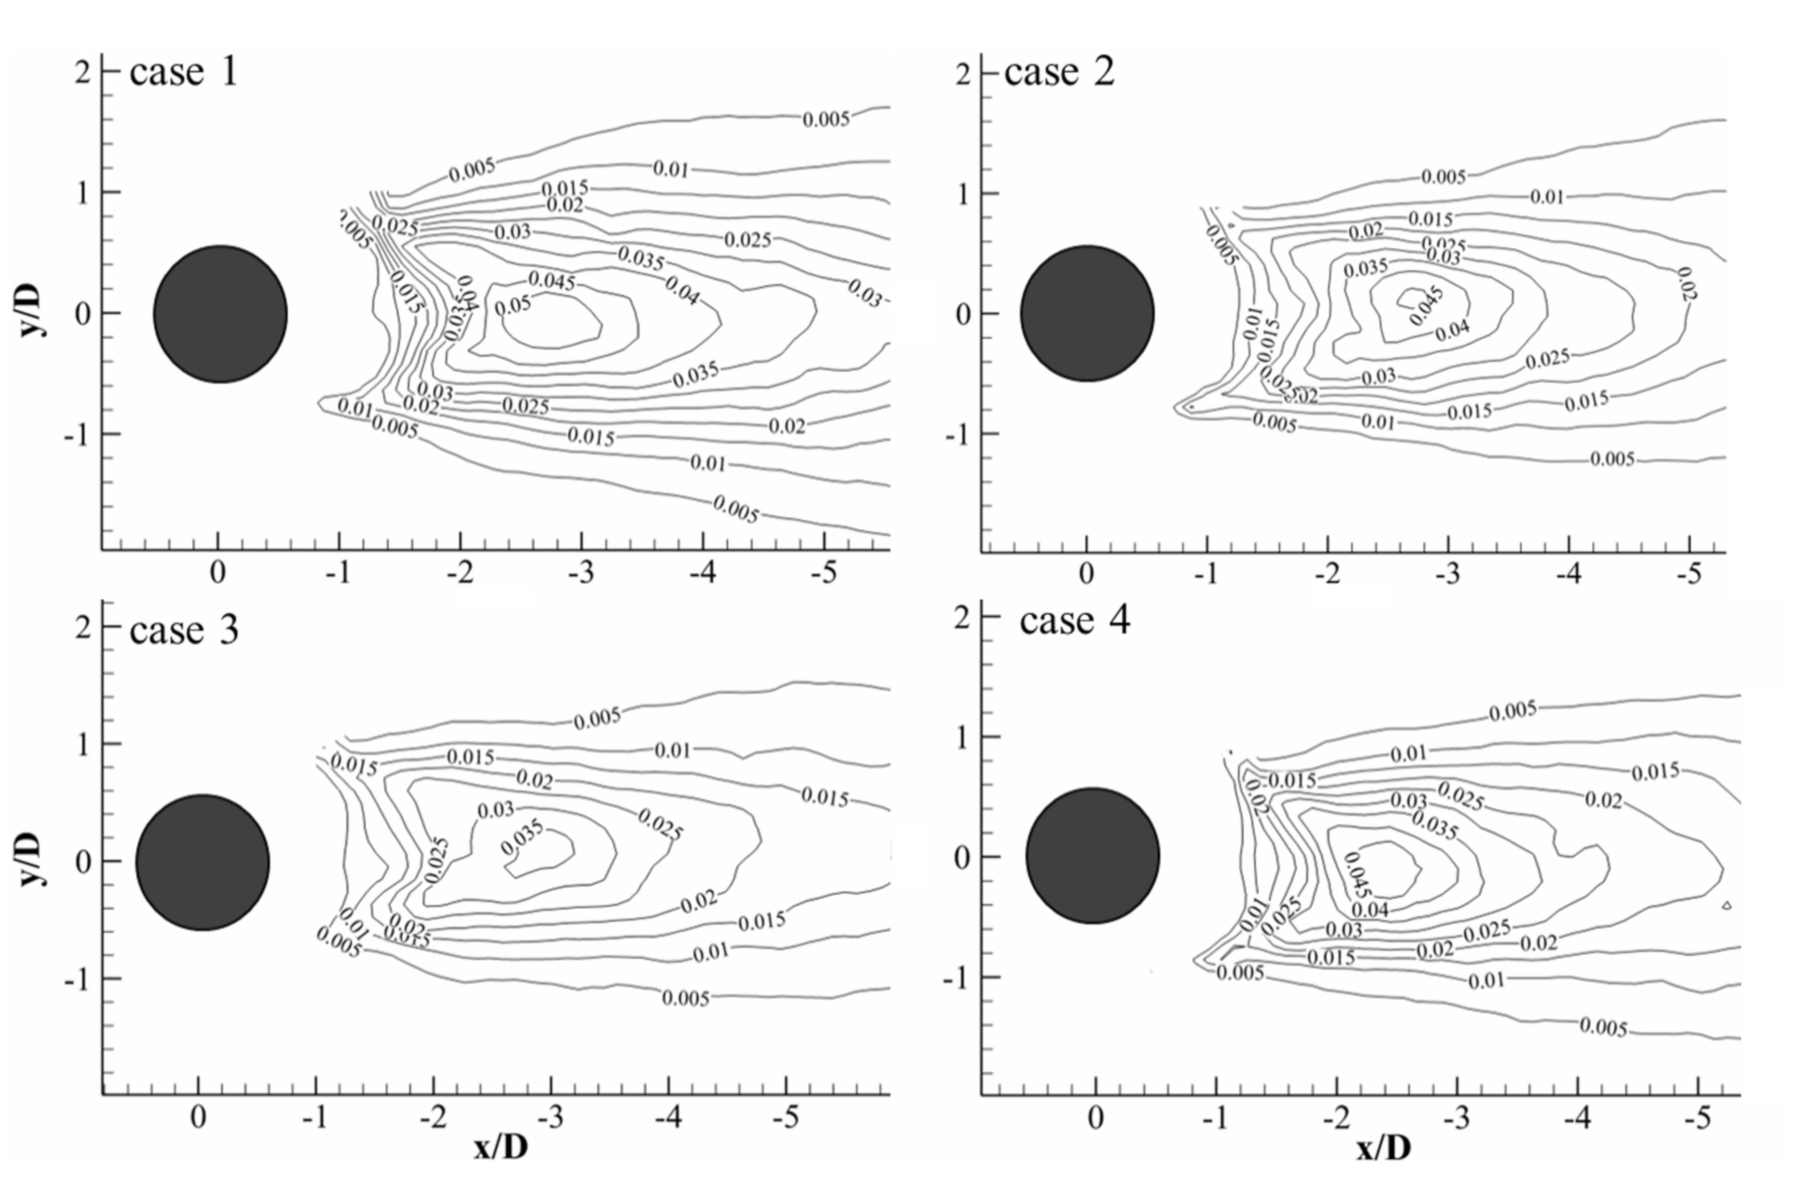
The distribution of turbulent kinetic energy is shown in Figure 5, and the high-intensity turbulent kinetic energy is located in the downstream region of the cylinder. The peak value of case 1 is 0.05, while that of case 2, case 3, and case 4 are 0.045, 0.035, and 0.045, which is about 90%, 70% and 90% of that of case 1. It is obvious that the peak values of TKE and its region for the circular cylinders with the dimple surface are smaller than that of the smooth cylinder. This may be because that the interaction of the small scale vortices generated from the dimple and the big scale vortices originated from the boundary layer separation reduces the turbulent kinetic energy [23]. The peak values of TKE and its region are different for the circular cylinders with the different numbers of dimple surface are different, case 4 is greater than case 3, which may be due to the small distance of the dimple. Zhou et al. studied the flow of circular cylinder with smooth, grooved, and dimpled surface. Compared with the smooth cylinder, the peak values of Reynolds stress and turbulent kinetic energy of the grooved cylinder or the dimpled cylinder are decreased [21]. This is qualitatively consistent with the results of this paper.
This flow behavior shows that the drag reduction effect of the dimple structure is related to the reduction of Reynolds number and turbulent flow energy. The Reynolds stress and turbulence energy decreases with the dimple number increasing. Therefore, the drag reduction effect is also improved.
4.2. The Velocity Profiles and Recirculation Zones
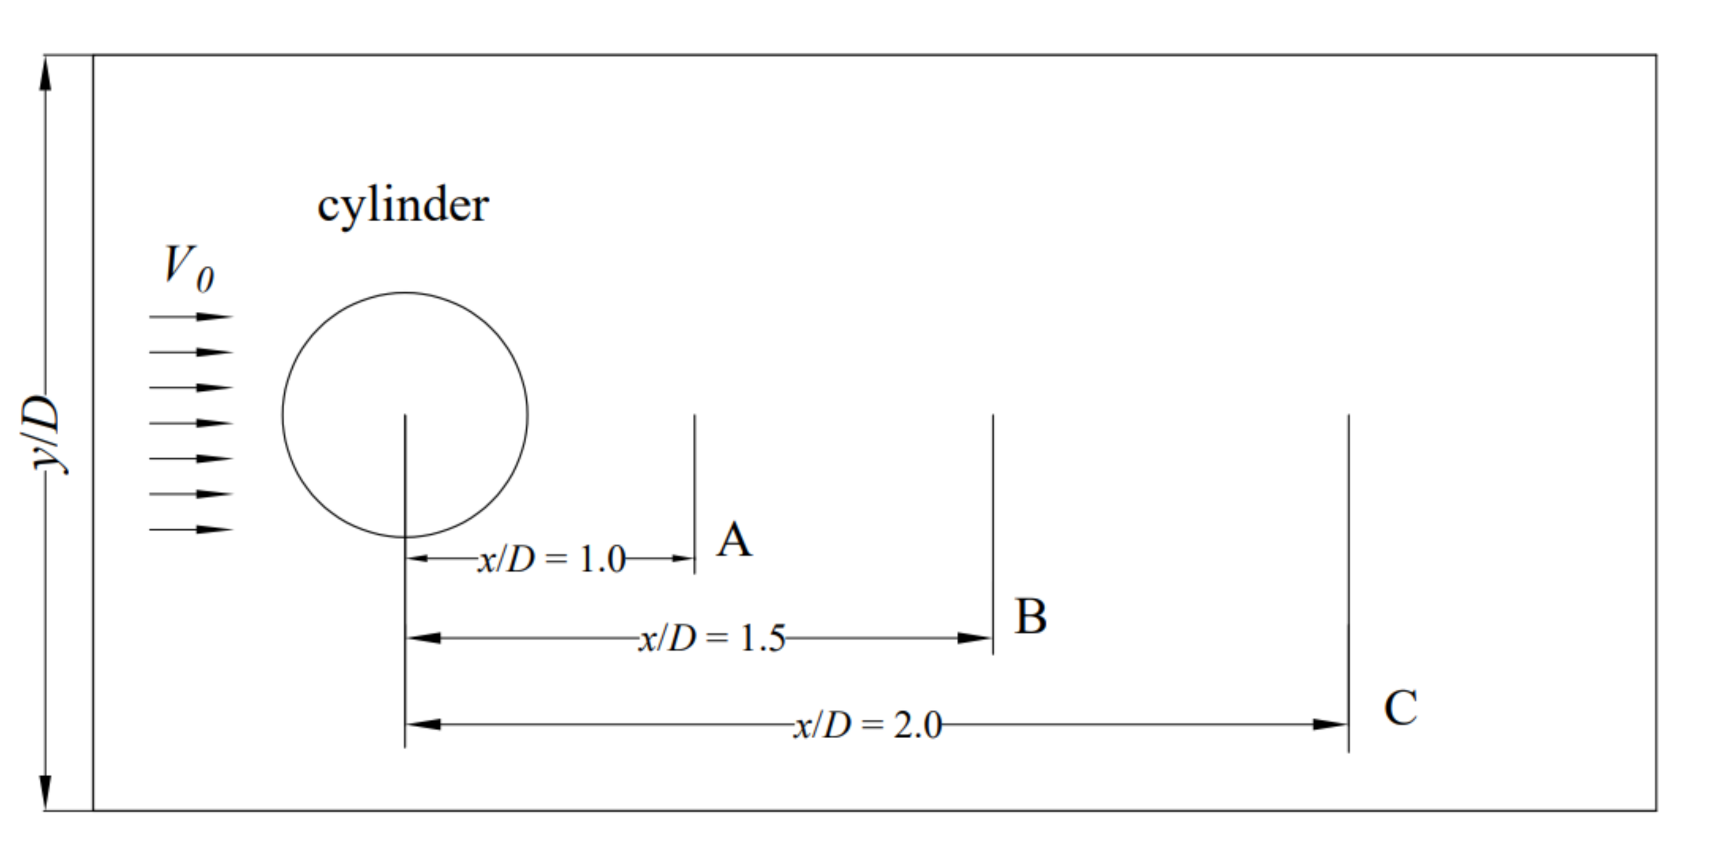
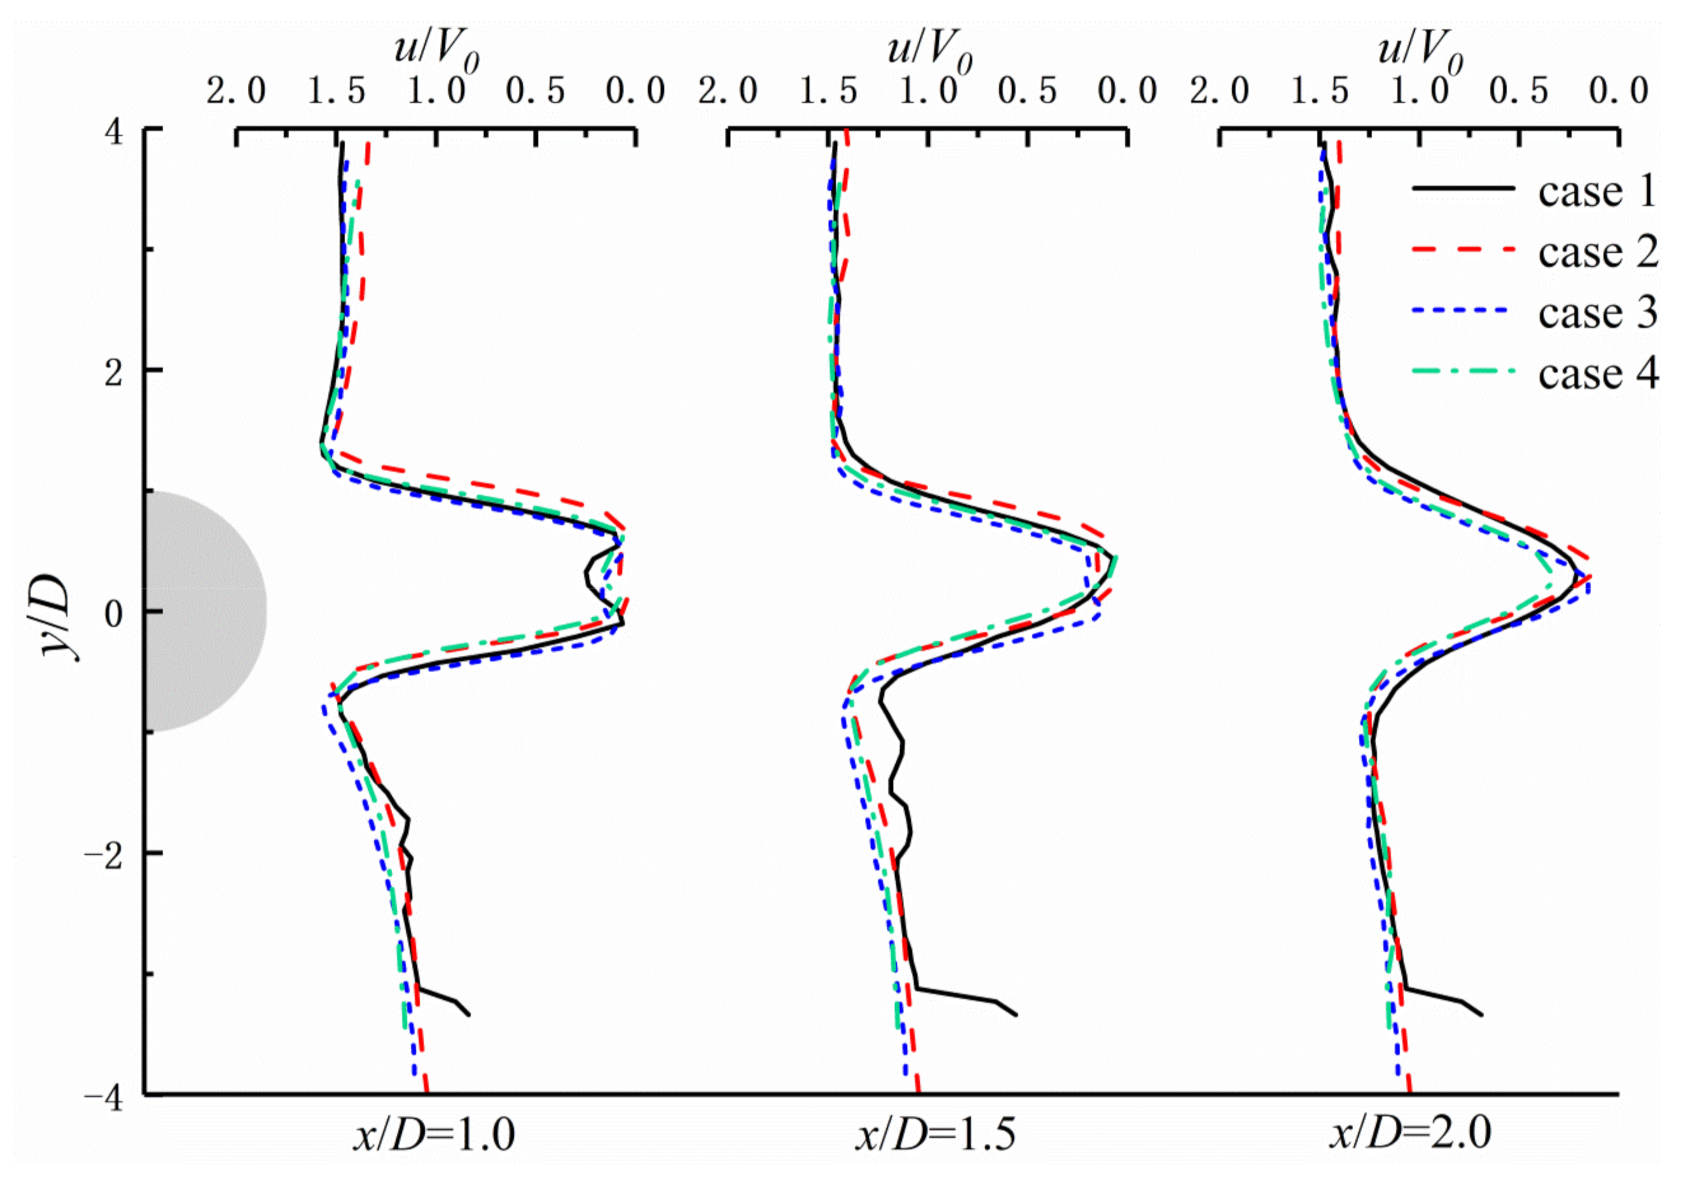
As shown in Figure 6, in order to observe the velocity profiles at the near wake of the cylinder, the streamwise velocity profiles at three locations near the cylinder wake was extracted and compared. The three locations are x/D = 1.0 (location A), x/D=1.5 (location B), and x/D = 2.0 (location C). It can be observed from Figure 7 that the velocity profile is in the shape of “U” (location A) near the cylinder, and when the distance gradually increases, the velocity profile is in the shape of “V” [24] (location B and location C).
As shown in Figure 7, it is worth noting that the velocity gradients of case 2, case 3, and case 4 are larger than that of case 1 at locations A, B, and C, this is because that a large number of low-speed vortexes are formed inside the dimple and develop towards the wake. There is no significant difference in the velocity gradient among case 2, case 3, and case 4. And then the sliding friction between the solid and the fluid is transformed into the rolling friction between the fluid and the fluid, thus reducing the energy loss of incoming flow and reducing the drag [25].
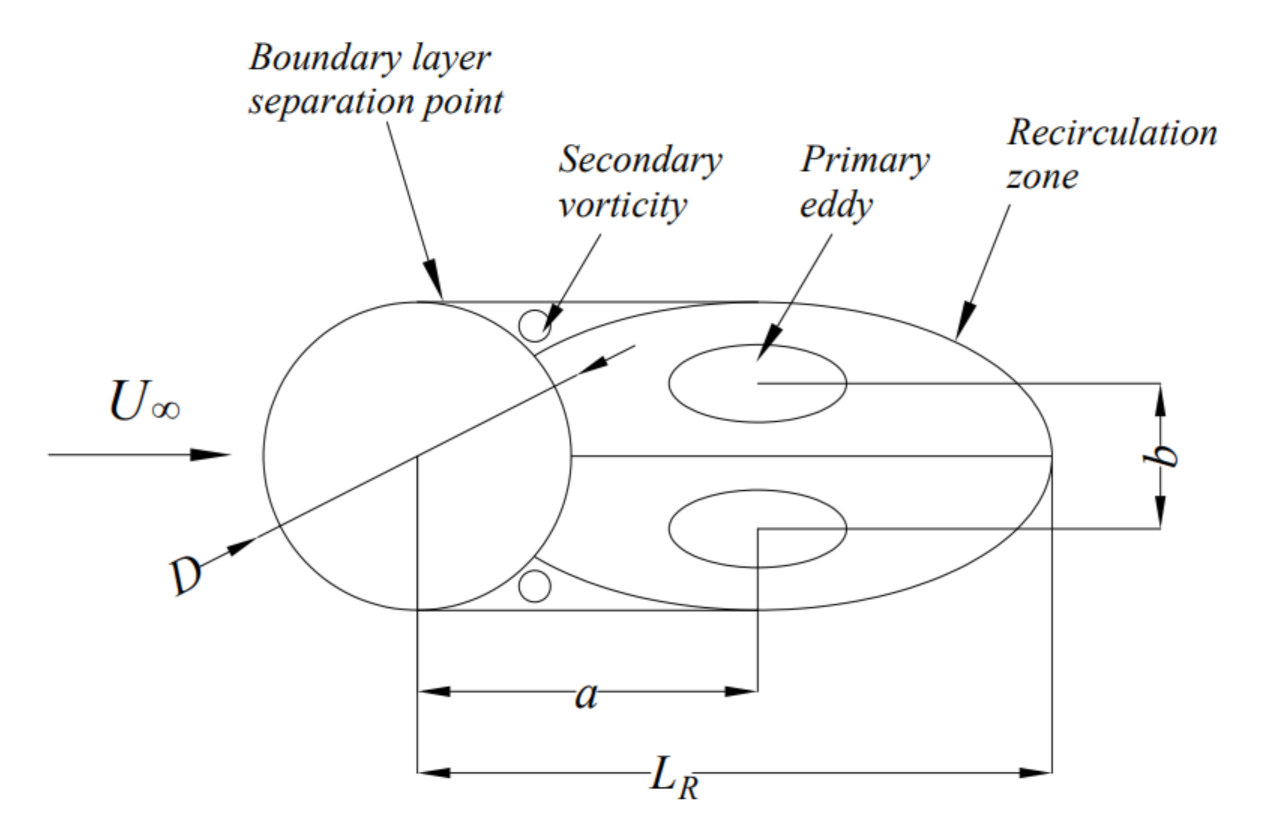
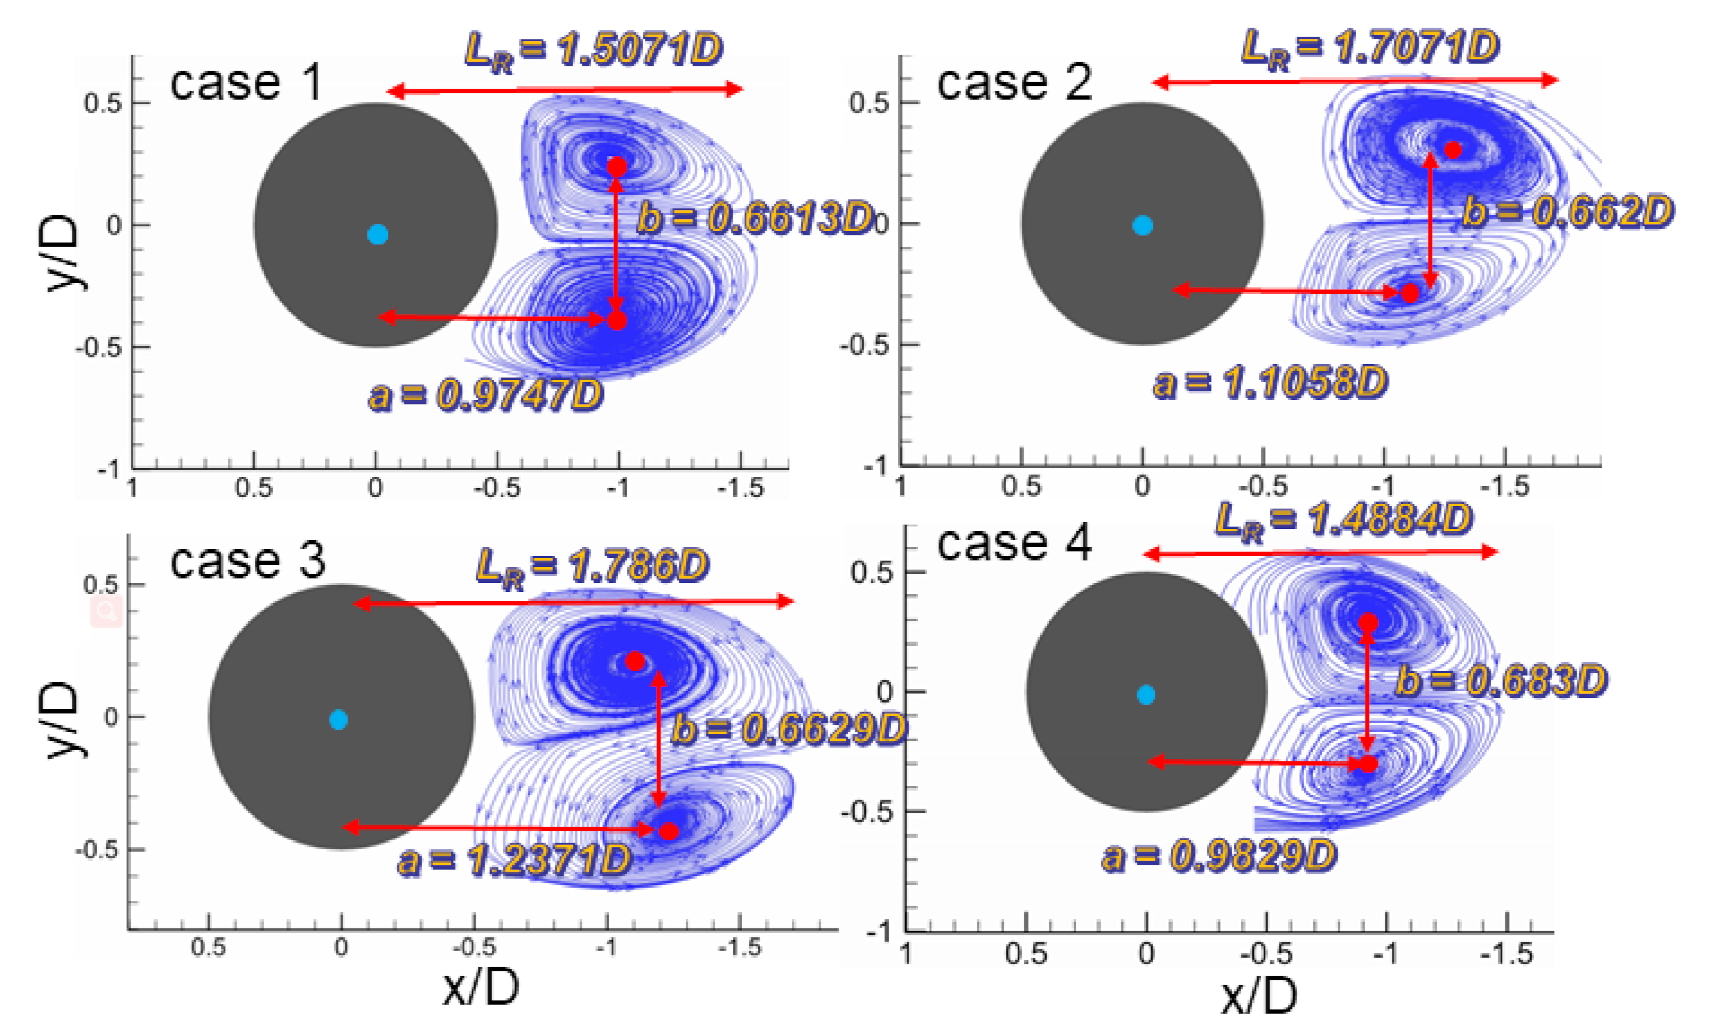
Figure 8 provides the vortex features and the related parameters, which can describe the near-wake recirculation zone. In this schematic, LR is the length of the recirculation zone, measured from the center of the cylinder along with the streamwise direction. a is the distance between the center of the cylinder and the center of the vortex. b is the distance between the centers of the pair of vortices [26].
Figure 9 depicts the streamline patterns and mean velocity vector. As plotted in this figure, LR and a of case 2, case 3 are more substantial than those of case 1. However, the value of LR for case 4 decreases, which may be due to the small distance of the dimple. The low-speed vortices formed in the dimple fuse with other vortices and fall off in advance before playing a role, thus failing to improve the quality of the flow field. So, the conclusion can be drawn that when the dimpled distance is set reasonably, the recirculation zone of the circular cylinders with the dimpled surface is larger than that of the smooth cylinder, which means that the structure and number of dimple interfere with the wake vortex. Therefore, the formation of the larger vortex leads to a decrease in the vortex shedding frequency, thus the drag is reduced [27]. Furthermore, a close inspection revealed that b of case 2, case 3, and case 4 was slightly larger than that of case 1, which might be due to an increase in the separation angle [28,29]. Liu et al. [28] conducted a comparative study of the wakes behind cylinders with grooved and smooth surfaces. The length of the recirculation zone of the grooved and smooth cylinders was approximately 3.9D and 3.3D, respectively. The increase in the length of the recirculation zone by 18.2% was qualitatively in agreement with the results of this paper.
The difference of the scale of the recirculation zone for the smooth cylinder and the dimpled cylinders proves the conclusion of the velocity profiles, which is that the “secondary vortices” are generated in the wake of the dimpled cylinder.
The phenomenon above may be attributed to the change of the wake characteristics such as the Reynolds stress and turbulent kinetic energy of the cylinder, which is related to the length of the recirculating zone and the velocity profiles. And the length of the recirculating region is associated with the boundary layer separation and the drag of the cylinder.
In order to further clarify the wake characteristics for the dimpled cylinder with different numbers, the velocity fluctuation feature is analyzed using POD technology in terms of the POD mode energy, POD mode coefficients, and the correlation of POD mode coefficients in the following study.
4.3. POD Mode Energy
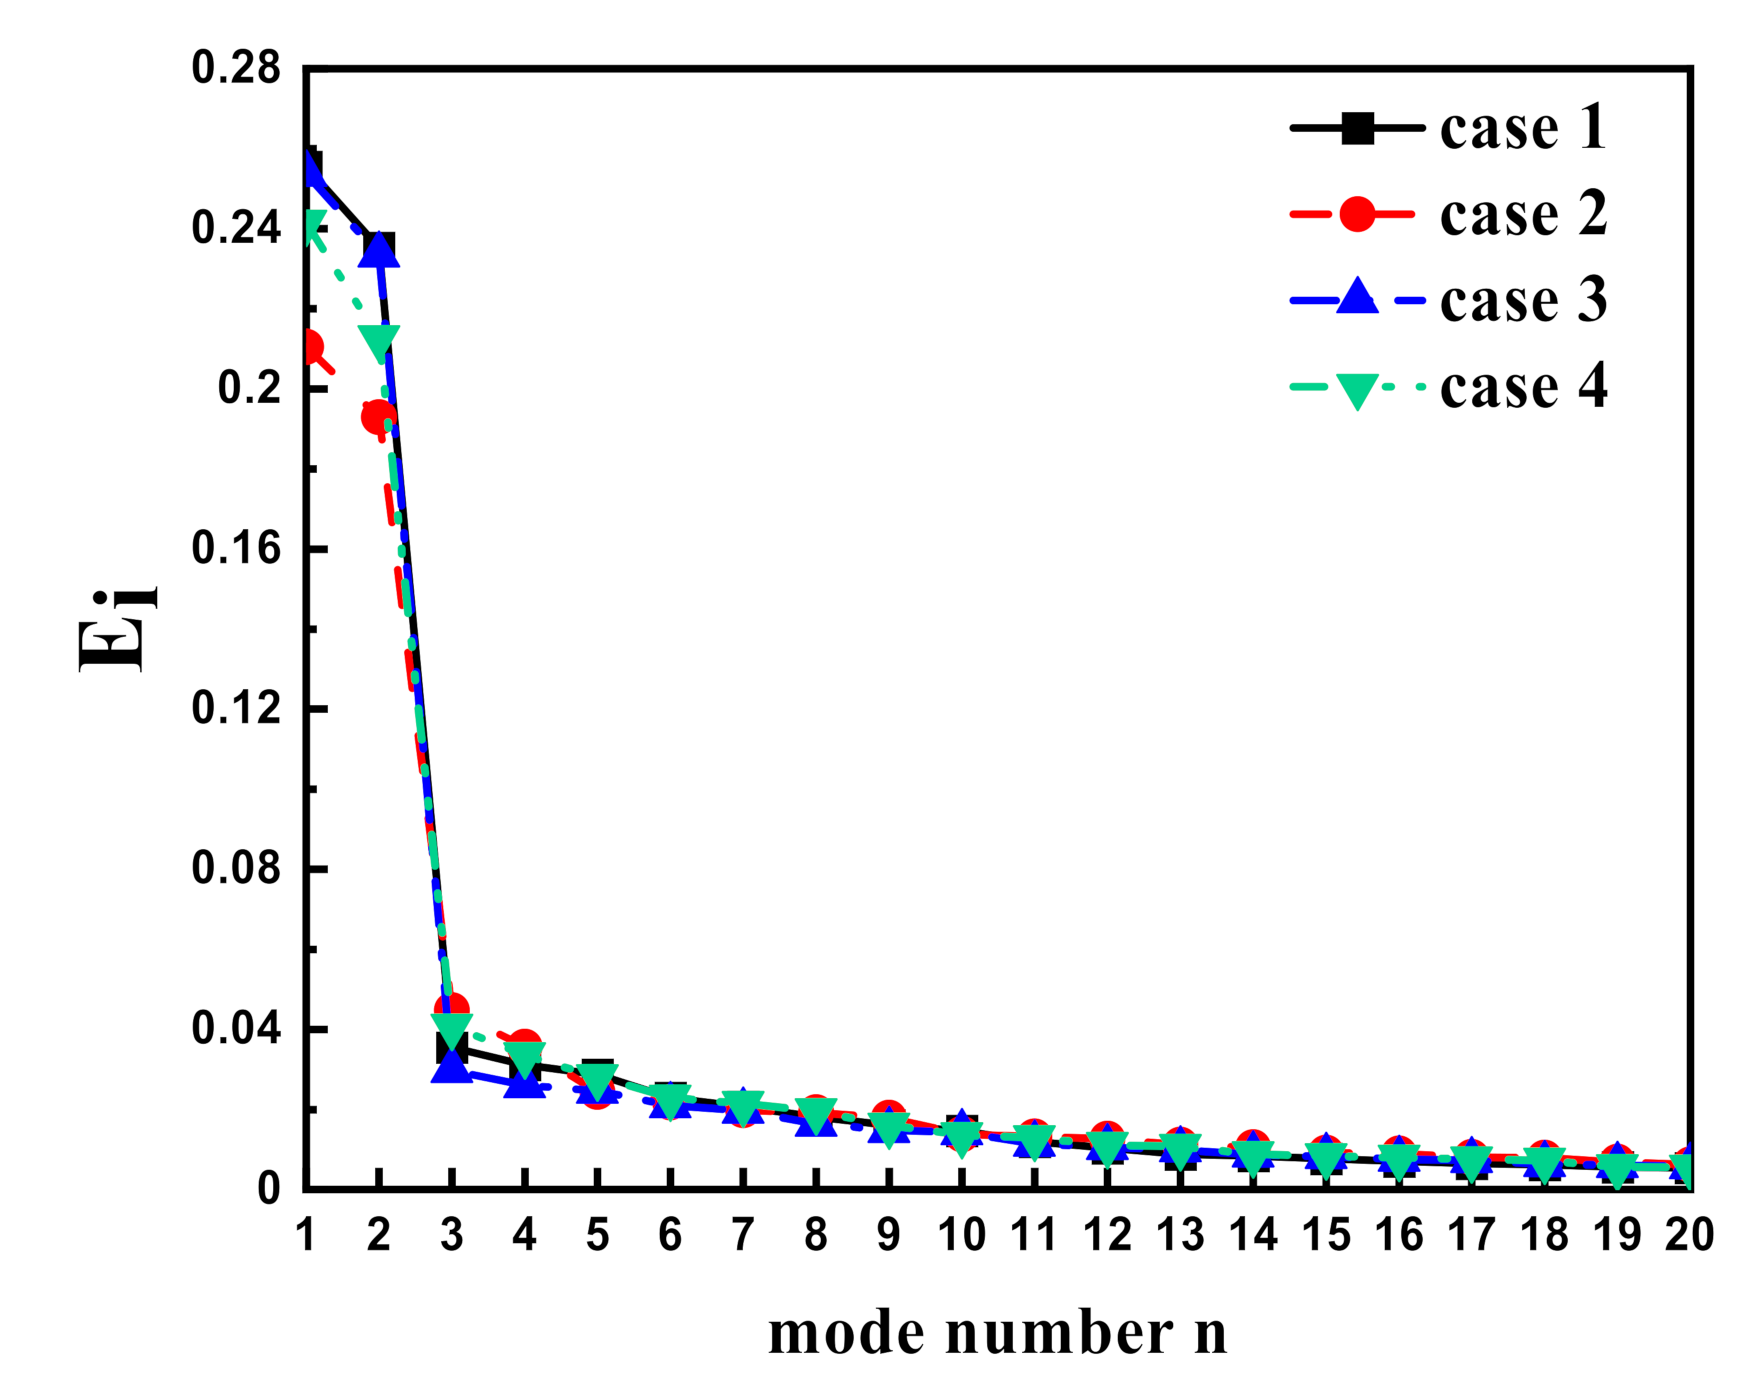
Figure 10 presents the distributions of POD mode energy for the smooth cylinder and the circular cylinders with the dimpled surface. Ei represents the corresponding POD modes’ contribution to the total turbulent fluctuating energy, as plotted in Figure 10. And it is clearly seen that Mode 1 and Mode 2 contain most of the flow field energy, while the proportion of the energy of other POD modes is much smaller than that of Mode 1 and Mode 2. With an increasing POD mode number, the energy contained in the POD modes decreases rapidly and approaches zero [28,30].
As provided in Figure 10, for case 1, the contributions of Mode 1 and Mode 2 to the total energy are 25.55% and 23.53%, respectively. However, Mode 1 and Mode 2 are less dominant for case 2, case 3, and case 4 than case 1, reaching 21.05% ~ 25.37% and 19.29% ~ 23.35% of the total energy, respectively. The reduced dominance of Mode 1 and Mode 2 for the circular cylinders with the dimpled surface might be due to the influence of the boundary layer by the dimpled structure, which leads to the weakened vortex shedding process and the delayed formation of the vortex street [28,31], as shown in Figure 9.
4.4. POD Mode Coefficients
Based on the above energy analysis, Mode 1 and Mode 2 with the largest energy can describe the main characteristics of the flow field. So, this paper focuses on the impact of Mode 1 and Mode 2 in the flow field.
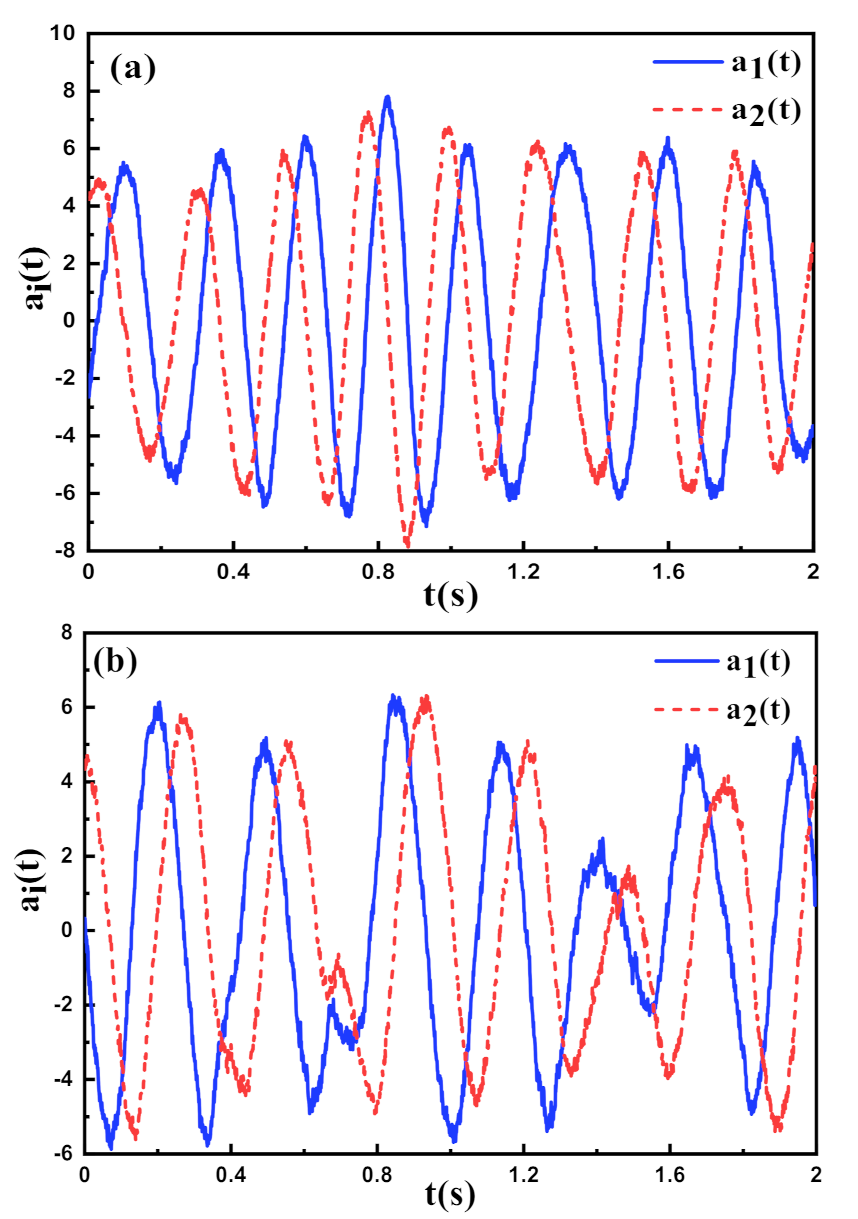
Figure 11 illustrates the distributions of a1(t) and a2(t) for case 1 and case 2. For the smooth cylinder and the circular cylinder with the dimpled surface, a1(t) and a2(t) exhibit a regular sinusoidal variation, which the change of a1(t) and a2(t) corresponds to the vortex shedding process [30,31]. And the POD coefficients of Mode 1 and Mode 2 (a1(t) and a2(t)) had the same frequency and amplitude (δ), and only their phases differed [30]. In other words, the a1(t) and a2(t) of the smooth cylinder and the circular cylinder with the dimpled surface have similar phenomenon. Therefore, a1(t) will be selected as a representative factor in this study.
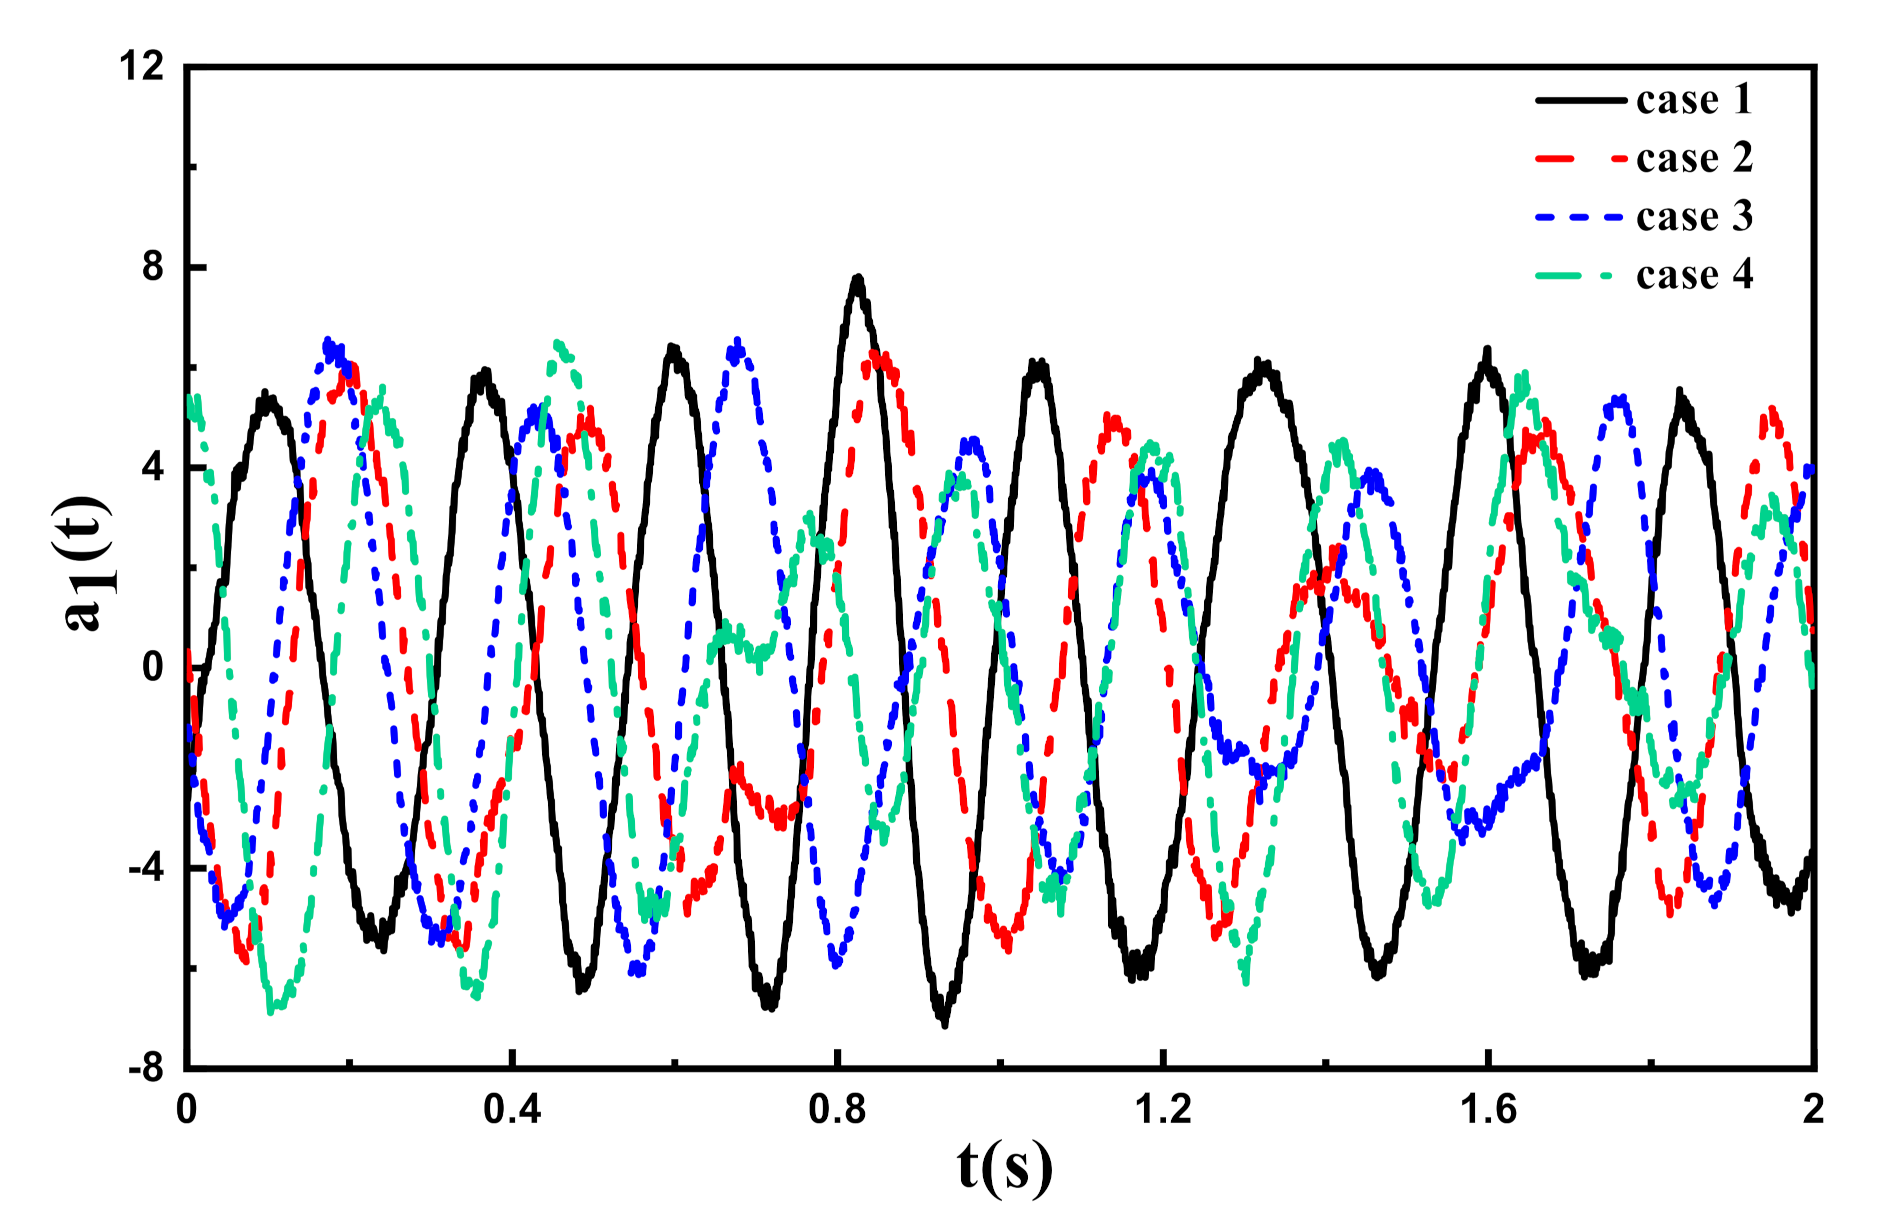
Figure 12 shows the distributions of a1(t) over the flow time for the smooth cylinder and the dimpled cylinder with different numbers. It can be seen that a1(t) has a relatively complete sinusoidal periodicity for case 1, however, the periodicity becomes unstable while in case 2, case 3, and case 4, as shown in Figure 12. On the other hand, the fluctuation intensity of a1(t) of case 2, case 3, and case 4 are smaller than that of case 1. And the peaks of a1(t) of case 2, case 3, and case 4 are different from each other, reflecting that the number of dimples influences the fluctuation intensity. This is another reason why the recirculation zone of the circular cylinder with a dimpled surface is larger than that of the smooth cylinder.
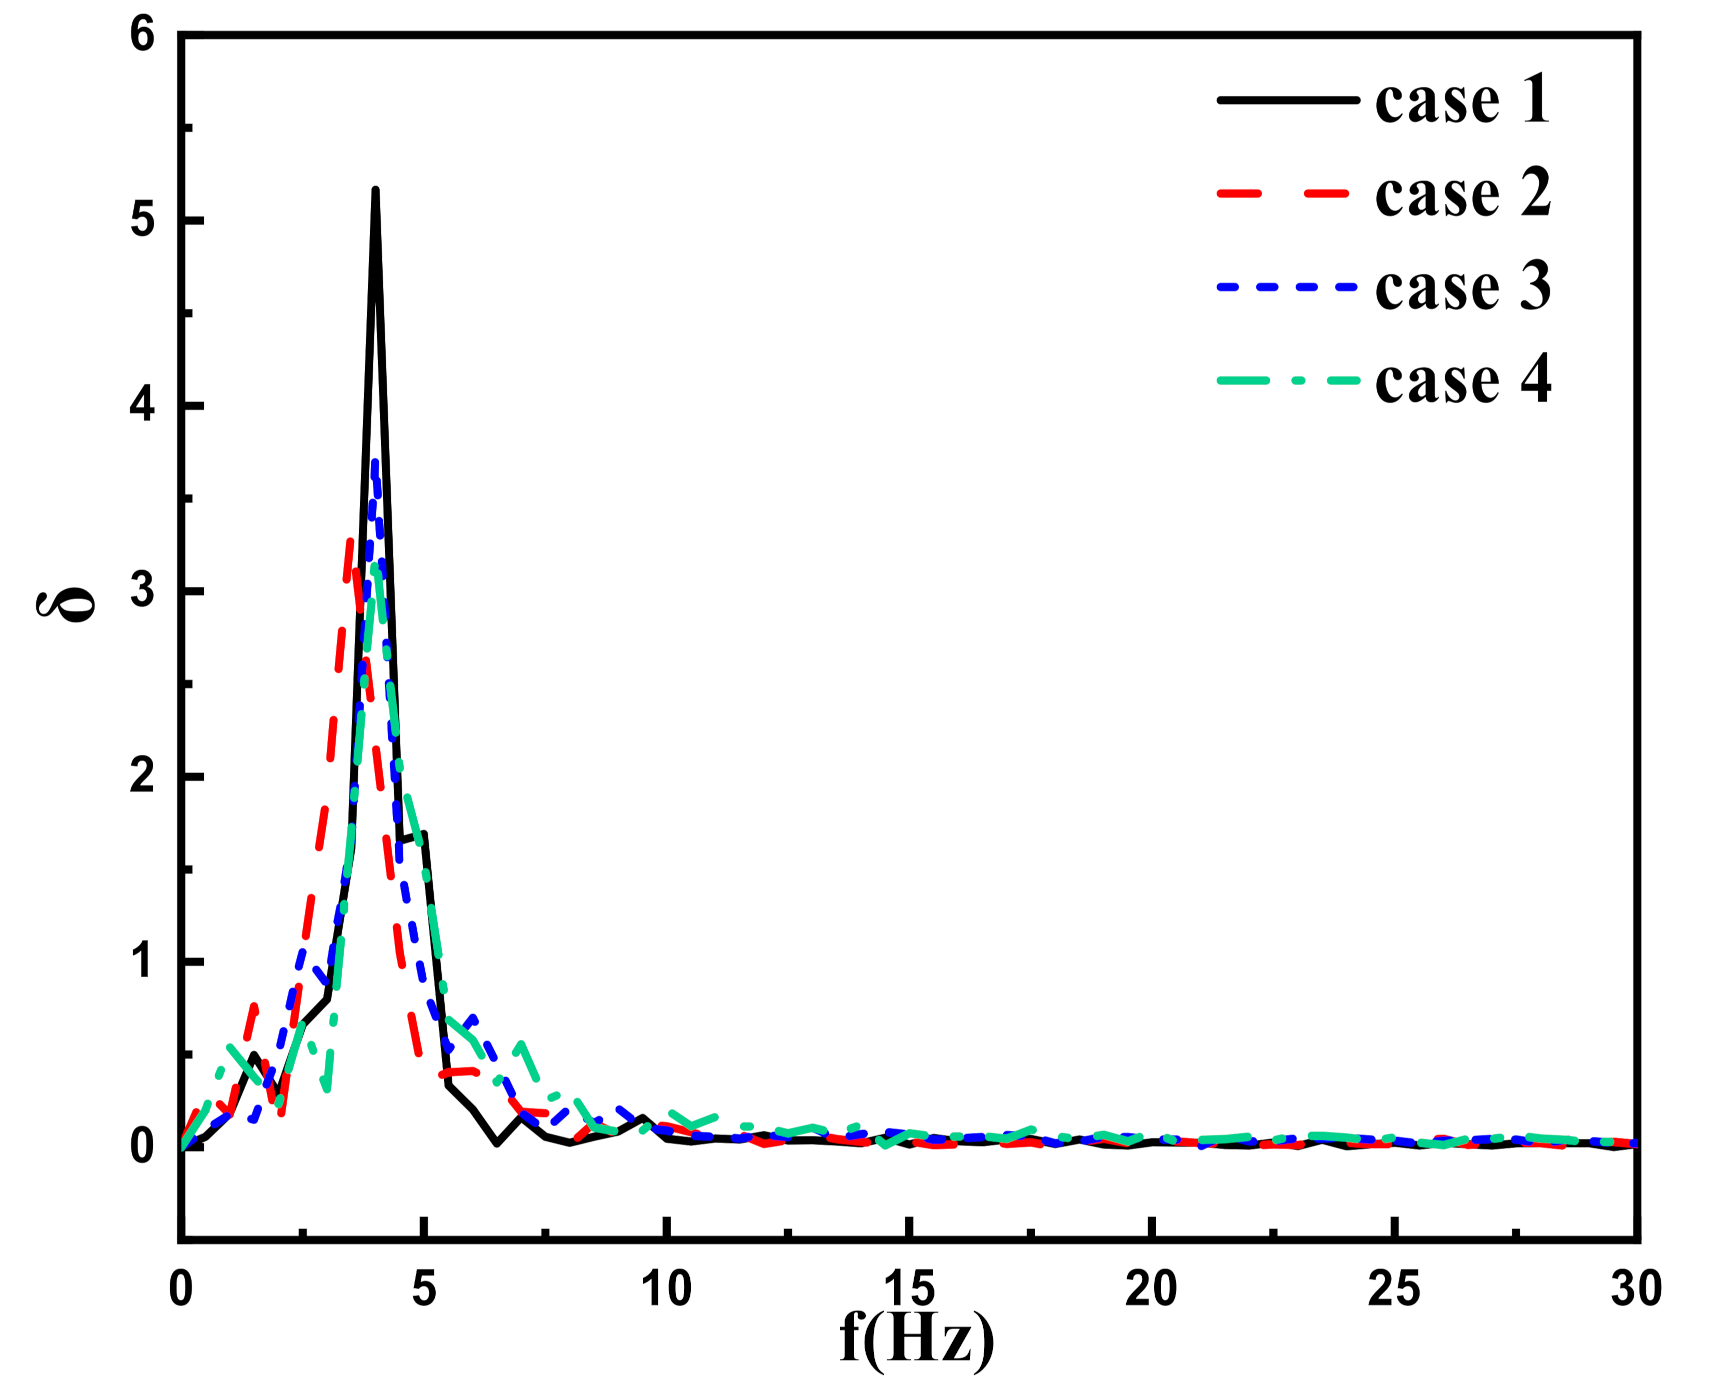
Figure 13 provides the spectra of a1(t) for the smooth cylinder and the dimpled cylinder with different numbers. The frequency of the maximum amplitude corresponds to the vortex shedding frequency, as plotted in Figure 13, it is evident that the maximum amplitudes of case 2, case 3, and case 4 are smaller than that of case 1, meaning the vortex shedding intensity is reduced. Also, the maximum amplitudes of case 2, case 3, and case 4 are different from each other. The explanation for the amplitude result is the delayed vortex shedding caused by the dimpled structure controlling the boundary layer. However, another phenomenon is that the vortex shedding frequency of case 3, and case 4 is almost the same as that of case 1, supporting the conclusion in Figure 9, which is that too small, dimpled distance will lead to a large number of vortices shedding in advance.
4.5. Correlation of POD Mode Coefficients
For a complex vortex flow field, the vortices represented by the POD modes coexist and interfere with each other. By observing the correlation of POD mode coefficients, the flow’s fine structure can be understood to understand the reasons for the macroscopic improvement in the vortex release [32].
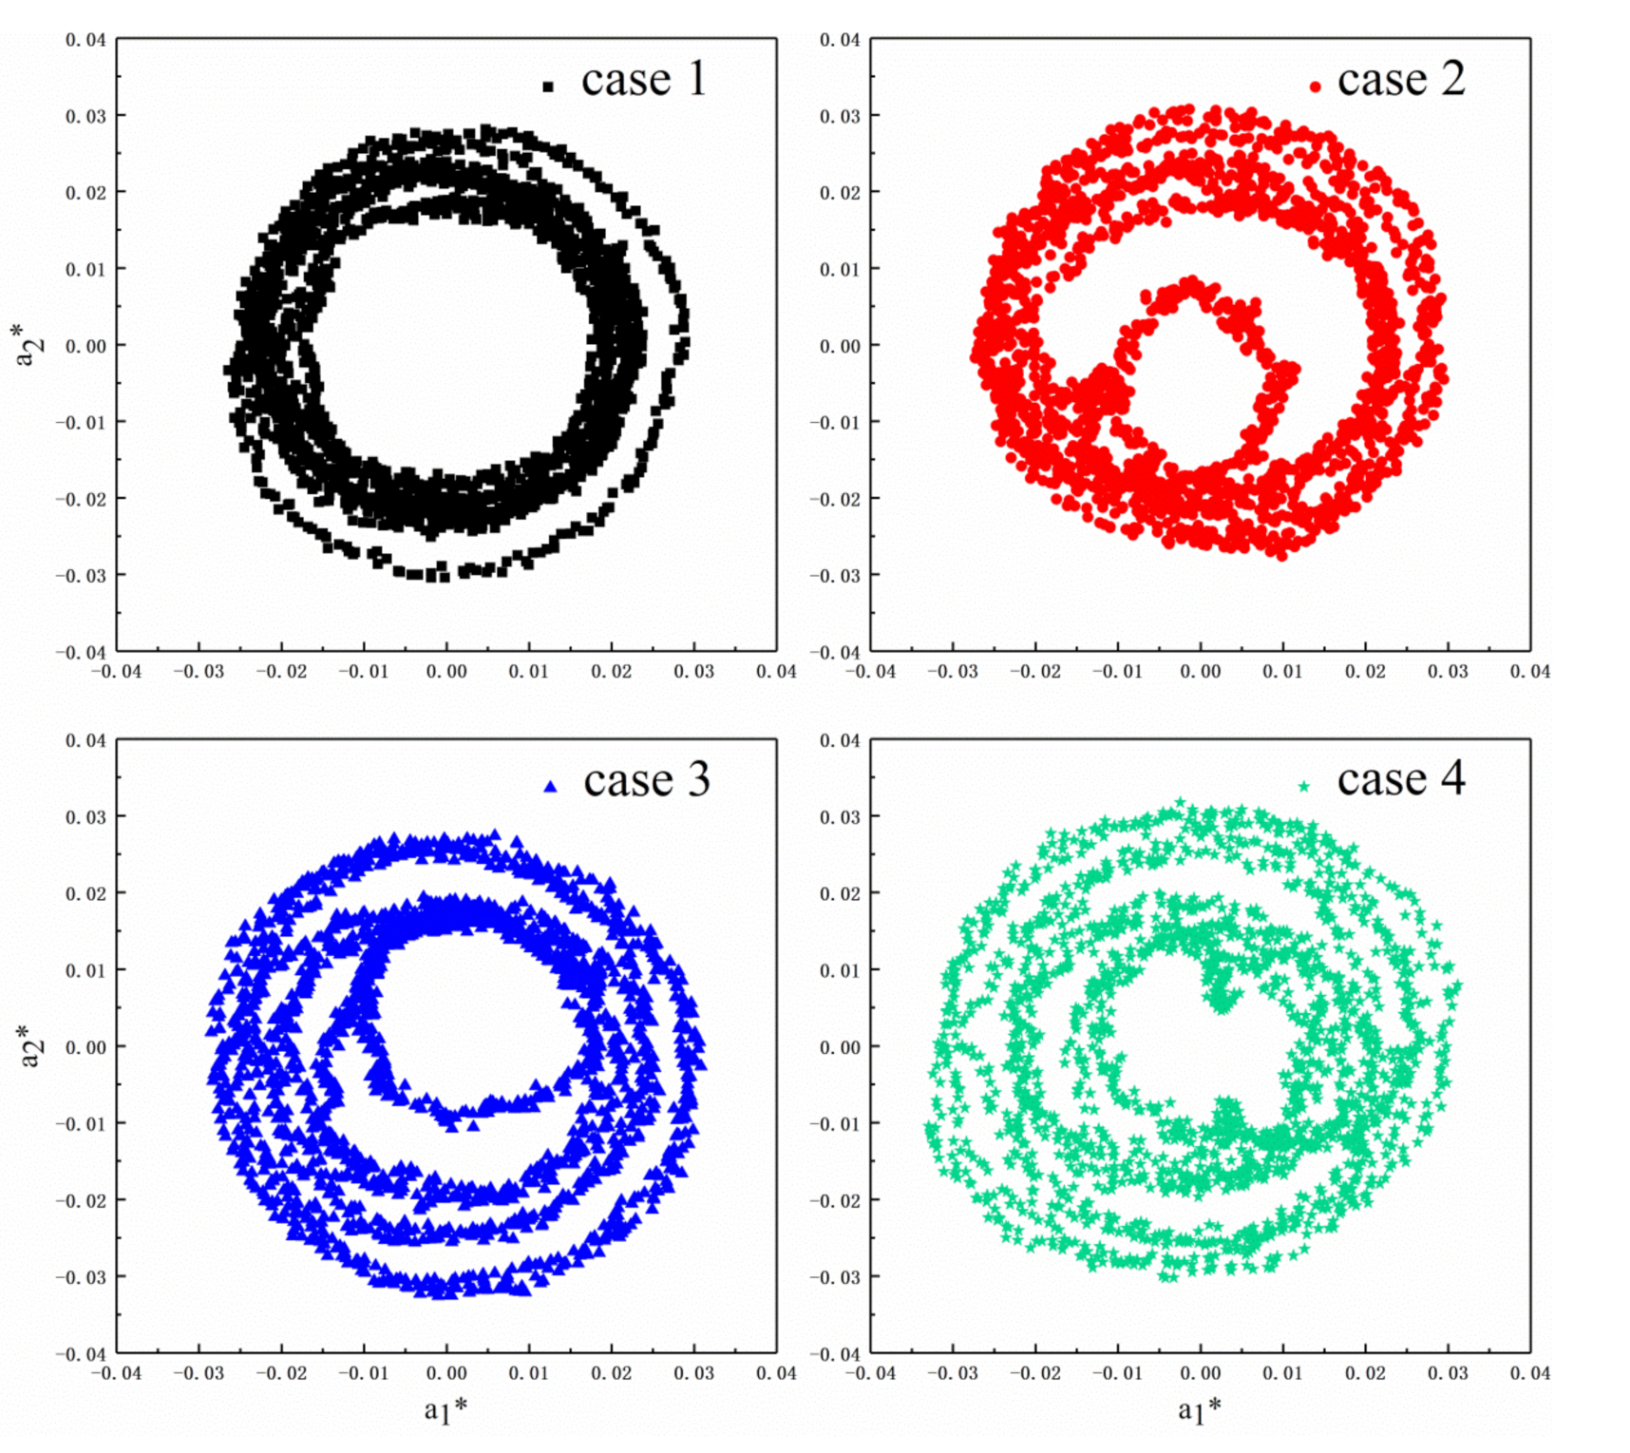
The POD mode coefficients ai(t) will be normalized by its corresponding eigenvalues λi, i.e., . As depicted in Figure 14, the correlation of a1(t) and a2(t) clearly shows the coupling relationship between a1* and a2*. For case 1, the correlation of a1* and a2* is related to a quasi-circular [30,31], which might be induced by small scale fluctuations or turbulence [33,34]. However, the quasi-circular cannot be observed in case 2, case 3, and case 4, this is because the dimples structure suppresses the vortex shedding to a certain extent, resulting in the correlation of a1* and a2* is disturbed. Furthermore, the correlation of a1* and a2* become more and more disordered with the number of dimples increasing, further proving that the effect of dimples structure on vortex shedding.
5. Conclusions
In this paper, PIV and POD methods are used to observe the flow field to understand the dimpled structure’s effect on wake characteristics. This study focuses on the flow field variation in terms of flow field statistical results, POD mode energy distribution, and other related aspects. The following conclusions can be drawn from the above discussions:
- Compared with the smooth cylinder, the equivalent high-intensity Reynolds stress and turbulent kinetic energy regions of the circular cylinder with the dimpled surface are smaller and the peak values are lower, the drag reduction effect is also improved.
- For the dimpled cylinder with different numbers, a large number of low-speed vortexes generated in the dimple enlarge the recirculation region, and the velocity gradient in the cylindrical wake region is larger, and the drag is reduced.
- The energy contained by Mode 1 and Mode 2 of the dimpled cylinder with different numbers is lower than that contained by Mode 1 and Mode 2 of the smooth cylinder, meaning that the energy of the dimpled cylinder is more distributed.
- The analysis of a1(t) shows that the dimpled structure will decrease the vortex shedding intensity but may increase the vortex shedding frequency.
- The correlation between a1* and a2* indicates that the dimpled structure will destroy the inherent flow mode of the flow field around the cylinder.
Author Contributions
Conceptualization, J.Q.; methodology, J.Q.; software, Y.S.; validation, F.Y. and P.L.; formal analysis, J.Q.; investigation, F.Y.; resources, F.Y.; data curation, J.Q.; writing—original draft preparation, J.Q.; writing—review and editing, F.Y.; visualization, C.C.; supervision, Q.C. and D.W.; project administration, F.Y. and H.Y. All authors have read and agreed to the published version of the manuscript.
Funding
This research received no external funding.
Institutional Review Board Statement
The authors choose to exclude this statement.
Informed Consent Statement
Not applicable.
Data Availability Statement
No new data were created or analyzed in this study. Data sharing is not applicable to this article.
Acknowledgments
The author wishes to acknowledge support given to him by Natural Science Foundation of Jiangsu Province of China (No.BK20191459) and National Natural Science Foundation of China (Grant No.51705214, 12002138), and Science and Technology Foundation of Guizhou Province of China ([2020]1Z047).
Conflicts of Interest
The authors declare no conflict of interest.
References
- Simantiras, P.; Willis, N. Investigation on vortex induced oscillations and helical strakes effectiveness at very high incidence angles. In Proceedings of the Ninth International Offshore and Polar Engineering Conference (ISOPE), Brest, France, 30 May–4 June 1999. [Google Scholar]
- Yamagishi, Y.; Oki, M. Effect of the number of grooves on flow characteristics around a circular cylinder with triangular grooves. J. Vis. 2005, 8, 57–64. [Google Scholar] [CrossRef]
- Baek, H.; Karniadakis, G.E. Suppressing vortex-induced vibrations via passive means. J. Fluids Struct. 2009, 25, 848–866. [Google Scholar] [CrossRef]
- Assia, G.R.S.; Bearmana, P.W.; Kitney, N. Low drag solutions for suppressing vortex-induced vibration of circular cylinders. J. Fluids Struct. 2009, 25, 666–675. [Google Scholar] [CrossRef]
- Owen, J.C.; Bearman, P.W. Passive control of VIV with drag reduction. J. Fluids Struct. 2001, 15, 597–605. [Google Scholar] [CrossRef]
- Shiels, D.; Leonard, A. Investigation of a drag reduction on a circular cylinder in rotary oscillation. J. Fluid Mech. 2001, 431, 297–322. [Google Scholar] [CrossRef] [Green Version]
- Xu, F.Y.; Yu, H.Y.; Zhang, M.J.; Han, Y. Experimental study on aerodynamic characteristics of a large-diameter ice-accreted cylinder without icicles. J. Wind. Eng. Ind. Aerodyn. 2021, 208, 104453. [Google Scholar] [CrossRef]
- Zhang, M.J.; Wang, X.; Øisetha, O. Torsional vibration of a circular cylinder with an attached splitter plate in laminar flow. J. Ocean. Eng. 2021, 236, 109514. [Google Scholar] [CrossRef]
- Zhu, R.Q.; Zhang, Y.L. Suppressing vortex induced vibration of an elastic mounted circular cylinder by wavy wall. J. Ship Mech. 2011, 15, 1203–1209. [Google Scholar]
- Yang, Z.; Wu, J.Z. Drag reduction by axisymmetric traveling wavy wall. J. Univ. Sci. Technol. China 2005, 35, P471–P479. [Google Scholar]
- Williamson, C.H.K.; Govardhan, R. A brief review of recent results in vortex-induced vibrations. J. Wind. Eng. Ind. Aerodyn. 2008, 96, 713–735. [Google Scholar] [CrossRef]
- Zhou, B.; Wang, X.; Guo, W. Control of flow past a dimpled circular cylinder. J. Exp. Therm. Fluid Sci. 2015, 69, 19–26. [Google Scholar] [CrossRef]
- Sirovich, L. Turbulence and the dynamics of coherent structures, Part I: Coherent structures, C.Q. Appl. Math. 1987, 3, 561–571. [Google Scholar] [CrossRef] [Green Version]
- Berkooz, G.; Holmes, P.; Lumley, J.L. The proper orthogonal decomposition in the analysis of turbulent flows. J. Annu. Rev. Fluid Mech. 1993, 25, 539–575. [Google Scholar] [CrossRef]
- Ma, X.; Karniadakis, G.E.; Park, H.; Gharib, M. DPIV-Driven Flow Simulation: A New Computational Paradigm. J. Proc. Math. Phys. Eng. Sci. 2003, 459, 547–565. [Google Scholar] [CrossRef]
- Zwintzschera, P.; Goméza, F.; Blackburn, H.M. Data-driven control of the turbulent flow past a cylinder. J. Fluids Struct. 2019, 89, 232–243. [Google Scholar] [CrossRef]
- Alok, M.; Ashoke, D. Suppression of vortex shedding using a slit through the circular cylinder at low Reynolds number. Eur. J. Mech. B Fluids 2021, 89, 349–366. [Google Scholar]
- Szepessy, S.; Bearman, P.W. Aspect ratio and end plate effects on vortex shedding from a circular cylinder. J. Fluid Mech. 1992, 234, 191–217. [Google Scholar] [CrossRef]
- Westerweel, J.; Dabiri, D.; Gharib, M. The effect of a discrete window offset on the accuracy of cross-correlation analysis of digital PIV recordings. J. Exp. Fluids 1997, 23, 20–28. [Google Scholar] [CrossRef]
- Meyer, K.E.; Pedersen, J.M.; Ozcan, O. A turbulent jet in crossflow analysed with proper orthogonal decomposition. J. Fluid Mech. 2007, 583, 199–227. [Google Scholar] [CrossRef] [Green Version]
- Zhou, B.; Wang, X.K.; Guo, W. Experimental study on flow past a circular cylinder with rough surface. Ocean Eng. 2015, 109, 7–13. [Google Scholar] [CrossRef]
- Rinoshika, H.; Rinoshika, A. Passive control of a front inclined hole on flow structures around a surface-mounted short cylinder. Ocean. Eng. 2019, 189, 106383. [Google Scholar] [CrossRef]
- Lim, H.C.; Lee, S.J. PIV measurements of near wake behind a U-grooved cylinder. J. Fluids Struct. 2003, 18, 119–130. [Google Scholar] [CrossRef]
- Liyes, A.; Djaffar, S.; Abdallah, S.; Berrouk, A.; Abdelwahid, O. Hamid, 3D vortex structure investigation using large eddy simulation of flow around a rotary oscillating circular cylinder. J. Eur. J. Mech. B Fluids 2018, 71, 113–125. [Google Scholar]
- Chen, X.; Ruan, X.J.; Wang, S. Mechanism study of aerodynamic drag reduction and noise reduction of bionic non-smooth rear-view mirror cover. J. Hunan Univ. 2020, 47, 16–23. [Google Scholar]
- Tonui, N.; Sumner, D. Temporal development of the wake of a non-impulsively started circular cylinder. In Proceedings of the Fluids Engineering Division Summer Meeting, ASME, Vail, CO, USA, 2–6 August 2009. [Google Scholar]
- Yan, F.; Yang, H.F.; Wang, L.H. Study on the Drag Reduction Characteristics of Circular Cylinder with the Dimpled Surface. Water 2020, 13, 197. [Google Scholar] [CrossRef]
- Liu, Y.Z.; Shi, L.L.; Yu, J. TR-PIV measurement of the wake behind a grooved cylinder at low Reynolds number. J. Fluids Struct. 2011, 27, 394–407. [Google Scholar] [CrossRef]
- Babu, P.; Mahesh, K. Aerodynamic loads on cactus-shaped cylinders at low Reynolds numbers. J. Phys. Fluids 2008, 20, 035112. [Google Scholar] [CrossRef] [Green Version]
- Jiang, J.H.; Bao, F. POD analysis of a slit circular cylinder near wake. J. Phys. Gases 2017, 2, 28–36. [Google Scholar]
- Shi, L.L.; Liu, Y.Z.; Wan, J.J. Influence of wall proximity on characteristics of wake behind a square cylinder: PIV measurements and POD analysis. J. Exp. Therm. Fluid Sci. 2010, 34, 28–36. [Google Scholar] [CrossRef]
- Wang, Y.G.; Chen, J.X.; Xian, S.C. Analysis and research of two-dimensional square column flow field with low Reynolds number based on POD method. J. Northwestern Polytech. Univ. 2014, 32, 612–617. [Google Scholar]
- Rinoshika, A.; Zhou, Y. Orthogonal wavelet multi-resolution analysis of a turbulent cylinder wake. J. Fluid Fluid Mech. 2005, 524, 229–248. [Google Scholar] [CrossRef] [Green Version]
- Van Oudheusden, B.W.; Scarano, F.; van Hinsberg, N.P.; Watt, D.W. Phase-resolved characterization of vortex shedding in the near wake of a square-section cylinder at incidence. J. Exp. Fluids 2005, 39, 86–98. [Google Scholar] [CrossRef]
Figure 1.
The experimental set-up for the PIV experiments in the circulating tank (only a partial side view of the tank is shown).
Figure 1.
The experimental set-up for the PIV experiments in the circulating tank (only a partial side view of the tank is shown).

Figure 2.
The cylinders used in the experiment: (a) the schematic sketches of the cylinder cross sections, (b) the finished cylinders.
Figure 2.
The cylinders used in the experiment: (a) the schematic sketches of the cylinder cross sections, (b) the finished cylinders.

Figure 3.
The installation location of the experimental cylinders: (a) top-view, (b) side-view.

Figure 4.
The distribution of Reynolds stress for the smooth cylinder and the dimpled cylinder with different numbers. case 1: Smooth cylindrical; case 2: Dimpled columns is 4; case 3: Dimpled columns is 8; case 4: Dimpled columns is 12.
Figure 4.
The distribution of Reynolds stress for the smooth cylinder and the dimpled cylinder with different numbers. case 1: Smooth cylindrical; case 2: Dimpled columns is 4; case 3: Dimpled columns is 8; case 4: Dimpled columns is 12.

Figure 5.
The distribution of turbulent kinetic energy for the smooth cylinder and the dimpled cylinder with different numbers. case 1: Smooth cylindrical; case 2: Dimpled columns is 4; case 3: Dimpled columns is 8; case 4: Dimpled columns is 12.
Figure 5.
The distribution of turbulent kinetic energy for the smooth cylinder and the dimpled cylinder with different numbers. case 1: Smooth cylindrical; case 2: Dimpled columns is 4; case 3: Dimpled columns is 8; case 4: Dimpled columns is 12.

Figure 6.
Schematic diagram of wake velocity extraction location.

Figure 7.
The distribution of the streamwise velocity for the smooth cylinder and the dimpled cylinder with different numbers.
Figure 7.
The distribution of the streamwise velocity for the smooth cylinder and the dimpled cylinder with different numbers.

Figure 8.
A schematic sketch of the recirculation zone.

Figure 9.
The streamline patterns and mean velocity vector plot for the smooth cylinder and the dimpled cylinder with different numbers.
Figure 9.
The streamline patterns and mean velocity vector plot for the smooth cylinder and the dimpled cylinder with different numbers.

Figure 10.
The energy contained by POD modes for all cases for the smooth cylinder and the dimpled cylinder with different numbers.
Figure 10.
The energy contained by POD modes for all cases for the smooth cylinder and the dimpled cylinder with different numbers.

Figure 11.
The distribution of POD mode coefficients (Mode 1 and Mode 2) with the temporal variation for case 1 and case 2: (a) case 1 and (b) case 2.
Figure 11.
The distribution of POD mode coefficients (Mode 1 and Mode 2) with the temporal variation for case 1 and case 2: (a) case 1 and (b) case 2.

Figure 12.
The distribution of POD mode coefficient with the temporal variation for the smooth cylinder and the dimpled cylinder with different numbers.
Figure 12.
The distribution of POD mode coefficient with the temporal variation for the smooth cylinder and the dimpled cylinder with different numbers.

Figure 13.
The spectra of POD mode coefficient (Mode 1) for the smooth cylinder and the dimpled cylinder with different numbers.
Figure 13.
The spectra of POD mode coefficient (Mode 1) for the smooth cylinder and the dimpled cylinder with different numbers.

Figure 14.
The correlation of POD mode coefficients (Mode 1 and Mode 2) for the smooth cylinder and the dimpled cylinder with different numbers.
Figure 14.
The correlation of POD mode coefficients (Mode 1 and Mode 2) for the smooth cylinder and the dimpled cylinder with different numbers.

Publisher’s Note: MDPI stays neutral with regard to jurisdictional claims in published maps and institutional affiliations. |
© 2021 by the authors. Licensee MDPI, Basel, Switzerland. This article is an open access article distributed under the terms and conditions of the Creative Commons Attribution (CC BY) license (https://creativecommons.org/licenses/by/4.0/).
Share and Cite
MDPI and ACS Style
Qi, J.; Shao, Y.; Chen, Q.; Liu, P.; Chen, C.; Wang, D.; Yang, H.; Yan, F. Dynamic Analysis of Wake Characteristics of the Circular Cylinder with a Dimpled Surface. Water 2021, 13, 2197. https://doi.org/10.3390/w13162197
AMA Style
Qi J, Shao Y, Chen Q, Liu P, Chen C, Wang D, Yang H, Yan F. Dynamic Analysis of Wake Characteristics of the Circular Cylinder with a Dimpled Surface. Water. 2021; 13(16):2197. https://doi.org/10.3390/w13162197
Chicago/Turabian StyleQi, Jiyang, Yuyao Shao, Qunyan Chen, Ping Liu, Chen Chen, Deqiang Wang, Haifeng Yang, and Fei Yan. 2021. "Dynamic Analysis of Wake Characteristics of the Circular Cylinder with a Dimpled Surface" Water 13, no. 16: 2197. https://doi.org/10.3390/w13162197
Note that from the first issue of 2016, this journal uses article numbers instead of page numbers. See further details here.