Article

Validating Circular Performance Indicators: The Interface between Circular Economy and Stakeholders

1
Department of Civil & Environmental Engineering, Uxbridge Campus, Institute of Environment, Health and Societies, Brunel University London, Middlesex, Uxbridge UB8 3PH, UK
2
Department of Applied Economics, Faculty of Economics, University of Malaga, Ejido 6, 29013 Malaga, Spain
3
Institute for Circular Economy & Nature-Based Solutions, Alchemia-Nova GmbH, Baumgartenstrasse 93, A-1140 Vienna, Austria
4
Department of Civil Engineering, Florya Campus, İstanbul Aydın University, K. Cekmece, İstanbul 34295, Turkey
5
Division of Environmental Sciences, College of Health, Medicine and Life Sciences, Brunel University London, Uxbridge UB8 3PH, UK
6
Department of Science and Engineering of Materials, Environment and Urban Planning, Università Politecnica delle Marche, Via Brecce Bianche 12, 60129 Ancona, Italy
7
Faculty of Civil and Geodetic Engineering, University of Ljubljana, Jamova 2, 1000 Ljubljana, Slovenia
*
Author to whom correspondence should be addressed.
Water 2021, 13(16), 2198; https://doi.org/10.3390/w13162198
Submission received: 1 June 2021 / Revised: 5 August 2021 / Accepted: 7 August 2021 / Published: 12 August 2021
(This article belongs to the Special Issue Water and Circular Cities)

Abstract

:
The development and application of appropriate Circular Economy indicators is an issue that concerns both the scientific and the business community, as well as decision makers. The existing gap between research, policy and practice could be bridged by using a dynamic indicators selection approach that combines both expert and participatory practices. This study aims to develop such a novel approach for the selection of indicators based on views and needs of practitioners, whilst considering the complex interdependencies of the indicators and determining their importance. Twenty circularity indicators for the Water-Energy-Food-Ecosystems nexus are selected and ranked by different stakeholders. The interrelationships of the indicators are identified using the Interpretive Structural Model, resulting in six levels of importance. Cross-impact matrix multiplication applied to classification (MICMAC) analysis further enabled the classification of the twenty indicators into four categories based on their driving and dependence power. The results indicate that seven indicators—one related to regeneration of natural environment principle, four related to keep resources in use, and two related to design out negative externalities—are the driving indicators to Circular Economy. The approach can be applied to other sets of indicators as well, enabling their prioritization and implementation with other systems.

1. Introduction

During the last decade, the concept of Circular Economy (CE) is seeing rising popularity among policymakers, industrial and academic communities, as a prominent approach to operationalization of sustainable development [1]. Although the CE terminology is divergent with the existence of 120 definitions [2], the tenet of this concept is a perceived alleviation of both economic and natural capital scarcity [3]. To enable a CE transition, corporate bodies and organizations have developed principles on which CE should be founded (e.g., regeneration of natural environment; keep resources in use; and design out negative externalities) [4]. CE—as a response to the current linear economic model of “take-make-dispose”—has shaped many political and strategic research agendas both in Europe (e.g., United Kingdom, Netherlands, Sweden among others) and worldwide (e.g., China, Thailand) [5]. In fact, the European Union founds its recovery strategy from the COVID-19 on the EU Green Deal and the New Circular Economy Action Plan (CEAP) [6]. In the new CEAP, water, food and nutrients are approached as a nexus, which is identified as one of the key value chains requiring urgent, comprehensive and coordinated circularity actions.
The increased traction of CE indicates the urgent need for a common circularity assessment framework and a metric system, capable of holistically and systemically measuring and evaluating CE actions. Working in this direction, many studies have focused on the identification and development of CE indicators at different implementation levels (i.e., nano, micro, meso, macro), different economic sectors, and addressing different CE aspects. Some examples include: 22 macro-level and 12 meso-level indicators introduced by Geng et al. [7], 28 company-level indicators proposed by Pauliuk [8], 10 sustainability related CE indicators suggested by Helander et al. [9], 10 macro-level indicators, including 16 sub-indicators proposed by EC [10], and many more. In total, Kravchenko et al. [11] identified 270 CE indicators existing in the literature. These findings suggest the great complexity of measuring CE as it involves the synthesis of multiple aspects, the consideration of sector-specific challenges resulting from specificities of different sectors [12], as well as the incorporation of different visions and needs of various stakeholders at different implementation levels. Focusing on water, it is not only the specificities of the water sector that need to be considered but rather the specificities of the nexus as mandated by the new CEAP. In a resource nexus, numerous factors and functional elements need to be considered [13], leading to additional interactions that need to be investigated, which further increases the complexity of implementing, measuring and assessing circularity.
As the concept of CE is becoming an integral component towards sustainable business practice [14], specific action plans have been developed (e.g., [12,15]) to enable this transition. The progress of CE actions is supported and measured by CE indicators [16], which need to be comprehensive and to meet the needs of CE participants, i.e., individual companies and industry, society and the nation [17,18]. Therefore, apart from the relevance of CE to policies, regulations and legislation, CE strategies need to be integrated into business practices that mandate for the operationalization of the concept for organizations [19]. Since the concept of CE is a new scientific research topic, in many cases, companies and industry lack of in-depth knowledge of CE benefits and drawbacks to businesses and society, indicating that businesses cannot propose solutions to CE problems [20]. Targeted guidance on CE implementation, monitoring and evaluation is still needed, the lack of which may further implicate the indicators selection process by organizations [8]. The water industry and related CE practitioners therefore need guidance and in-depth information regarding appropriate circularity indicators for the nexus. Park and Kremer [21] state that companies lack information on the usefulness of existing indicators that reduces and hinders their practical applicability. Additionally, each company, stakeholder or actor that intends to apply sustainable measures—or in this case circularity measures—has different concerns, needs, opportunities, goals and risks [22]. Therefore, the assessment process should match these requirements and limitations in order to increase its meaningfulness and implementation [23]. However, the individual needs of organizations should not overcome the CE fundaments as this would allow businesses to select indicators based on their own marketing purposes, discrediting CE as another form of greenwashing [24].
Recent studies focus on shedding light to classification, purpose and possible uses of various CE indicators (e.g., in Saidani et al. [25] and in Moraga et al. [16]) to enable decision-making. However, these studies do not provide information regarding the influence and the interrelationships between indicators. Such information would enhance the understanding on indicators behaviour and would enable the investigation of indicators importance, contributing to the selection process. This is particularly important for indicator sets targeting nexuses or other complex systems that require numerous indicators interfering with each other. Multi-criteria decision-making approaches can be used for this purpose. For example, Yadav et al. [26] used a hybrid Best Worst Method (BWM)- DEcision MAking Trial and Evaluation Laboratory (DEMATEL) approach to analyze the causal relationship of CE indicators for the manufacturing sector. Although DEMATEL method enables the investigation of relationships between the factors of a complex system, it cannot be used to establish structural hierarchy among the investigated factors. In cases where prioritization of factors needs to be established, Interpretive Structural Modelling (ISM) is the preferred methodology. The ISM method does not require quantitative data and in general has reduced data requirements compared to other similar methods [27]. The ISM method is an interactive learning process used to determine the mutual interactions and relationships between various factors that influence the system [28].
In this study, a closer collaboration between science and practice for a dynamic indicators’ selection process is suggested that is based on scientific and participatory approaches, ensuring the application of a meaningful set of CE indicators without compromising the principles of CE. A combined expert and participatory approach to CE indicators selection would enable the relevant stakeholders and practitioners to make more informed decisions based on representative indicators that they have critically prioritized. The stakeholders’ involvement to the participatory process is further expected to increase the adoption and uptake of holistic and systemic assessment to CE [23].
The aim of this research is to provide a multi-criteria decision-making methodology that can be applied in various sets of indicators in order to enable the selection of appropriate CE indicators, considering both the specificities of the sectors, the practical needs and the scientific knowledge. In this case, the suggested methodology is applied in the Water-Energy-Food-Ecosystems (WEFE) nexus and uses the CE indicators developed within the Multi-Sectoral Water Circularity Assessment (MSWCA) framework [29]. The indicators are ranked by industrial stakeholders and researchers in order to consider both the practical needs of the industry and the scientific consensus of CE. An Interpretive Structural Model (ISM) is then developed enabling the identification of interdependencies among the indicators and MICMAC analysis is further deployed classifying the indicators based on their driving and dependence power. MICMAC analysis is used to recognize the driver and reliance of inhibitors to transparency applying the ISM approach [30]. The suggested methodology enables the development of a structural understanding of the direct and indirect interrelationships between the specific CE indicators, as well as their prioritization based on the derived hierarchical structure. It provides the CE practitioners with a novel approach to strategically identify relevant indicators, understand behavioural aspects and the interactions between target indicators and ultimately use suitable CE indicators based on a multi-criteria decision-making process.
The study is structured in five sections. In Section 2, an analysis of the selected list of Circularity Performance Indicators (CPIs) is presented. Section 3 describes the ISM approach and MICMAC analysis used in this study. Section 4 then presents and discusses the results and explores the implications of this study. Conclusions are drawn in Section 5.

2. Identification of CE Indicators

The MSWCA is a framework developed to guide the implementation, monitoring and assessment of CE in systems under the WEFE nexus. CE in nexus systems is not thoroughly investigated, while CE in water systems mostly focuses on circularity measures, strategies and actions targeted at the wastewater treatment plants, underestimating circularity potential of upstream processes. The MSWCA approaches circularity from a systems perspective, targets the symbiotic management of various resources incorporated in the nexus, considers the interactions between the various sectors involved in the investigated systems and integrates the anthropogenic and natural sub-components of the system. This allows the investigation of the feedback loops between the human-managed and nature-managed systems, which may influence the circularity results. The framework develops an indicators database that includes data requirements and a thorough list of available indicators relevant for nexus systems at the macro-level to support data acquisition and CE assessment. The database serves as an initial step for the identification of appropriate indicators by providing insights on the different aspects that must be covered by circularity evaluations of nexus systems (e.g., economic, environmental, physical), the different resources, the sectors’ specificities, the CE principles.
The indicators database differentiates between whole-of-a-system and sector-specific indicators, i.e., indicators related to the system as a whole, and to the urban water, agro-food, energy, industrial, waste handling sectors and natural environment (i.e., non-economic sector). The indicators are divided into Information-Oriented Indicators (IOIs) and Action-Oriented Indicators (AOIs or CPIs). The IOIs consist of a long list of indicators per each socio-economic and non-economic sector and they are categorized based on the type of information they provide, i.e., generic, economic, information related to water, nutrients & substances, energy, biodiversity. The IOIs serve as an intermediate step, connecting the acquired data to the CPIs and result from the first itineration of calculations, providing detailed information regarding the different aspects for each component of the sectoral supply chain. The IOIs are not directly used for the circularity assessment of the system, but rather support the assessment as they give meaningful information for the interpretation of the outcomes.
The circularity assessment of multi-sectoral systems is based on the CPIs. The CPIs are derived from grouping different IOIs and they are used for communication of the results to the different stakeholders. CPIs consist of a short list of indicators—23 in total—targeted at the three CE principles in order to reduce the number of indicators used for circularity assessment. Therefore, information overload—regarding the results communicated to the different interested parties—is avoided but at the same time, access to IOIs offer the possibility of understanding underlying factors, processes, or interactions that are linked with circularity. However, each system under investigation is unique and may be composed by different components and different processes may be involved. Therefore, the suggested indicators may be modified based on the system’s requirements, purpose and specificities.
This research focuses on the evaluation, ranking and investigation of the interrelationships between the developed CPIs. The CPIs are presented and explained in the following section. The categorization of the CPIs according to the CE principle that they target is adopted by Nika et al. [29]. Therefore, the regeneration of natural environment principle aims to ensure a good environmental state and functional environmental flows and stocks. The keep resources in use principle aims at closing the resource loops of the system, while the design out negative externalities principle targets the reduction of negative impacts potentially caused by the system by turning them into positive outcomes. Since waste and emissions cause a negative impact that is not incurred by their producer, actions taken to reduce or reuse waste or emissions are evaluated under the design out negative externalities principle.

2.1. Indicators Related to the Regeneration of Natural Environment Principle

2.1.1. Gain/Loss of (Semi-)Natural Areas

Semi-natural and natural areas represent the environment where natural ecosystems can be developed and thrive, and provide a wide range of ecosystem services to people [31]. From a social point of view, access to natural or semi-natural areas has been linked to mental health benefits [32], reduced stress [33], physical health benefits [34], increased life expectancy [35], improved social relations [36], increased social cohesion [36], reduced violence and aggressive behaviour [37], and improved well-being and welfare [38].
This indicator requires the quantification of changes in land use land cover prior and after the implementation of CE measures. This quantification would indicate the state of (semi-)natural areas, enabling the evaluation of the impacts of the economic development on both the environment and the society, as well as the evaluation of sustainable management and utilization of natural resources.

2.1.2. Regenerative Capacity Index

This indicator serves as a comparison between the anthropogenic exploitation of natural resources (i.e., the rate/amount of natural resource extraction) and the capacity of nature to regenerate itself (i.e., the rate/amount of resource regeneration by nature). The indicator is inspired by the Planetary Boundaries concept [39] and their transferability to regional systems [40] and requires the quantification of “safe operating space limits” for nine natural processes—i.e., climate change, rate of biodiversity loss (terrestrial and marine), interference with the nitrogen and phosphorus cycles, stratospheric ozone depletion, ocean acidification, freshwater use, change in land use, chemical pollution, and atmospheric aerosol loading—at a local level. These “safe operating space limits” represent the critical natural thresholds, which—if crossed—would trigger an irreversible environmental change. Quantification of such regional thresholds would indicate the natural limits under which CE should operate. This indicator incorporates a social aspect as well, since crossing regional-specific tipping points may have severe impacts on humanity.

2.1.3. Carbon Balance

The carbon balance indicator is based on mass balances and allows for the detection and quantification of carbon added to or extracted from the atmosphere in the form of carbon dioxide. Both natural (e.g., carbon sequestration by soils and vegetation) and human activities (e.g., fossil fuel combustion) are considered when quantifying this measure. The quantification of this indicator can be achieved by utilizing either analytical tools—such as Carbon Footprint Accounting and Life Cycle Assessment—or biogeochemical modelling tools, which are more complex but enable a dynamic interpretation of the system [41]. This indicator allows both human-managed and natural-managed processes to be considered.

2.1.4. Nitrogen and Phosphorus Balance

The gross nitrogen balance and the gross phosphorus balance are two agro-environmental indicators used by European Statistical Office (EUROSTAT). Similarly to the carbon balance, this indicator quantifies nitrogen inputs and outputs and their difference results in the gross nitrogen surplus (GNS), indicating potential nitrogen losses to the environment (e.g., ammonia emissions, nitrate leaching, nitrous oxide emissions). On the other hand, if outputs outweigh the inputs, a nitrogen deficit is occurring, indicating potential risk of decline in soil fertility. The gross phosphorus balance follows the same approach for its quantification. However, the actual risk of phosphorus losses to the environment depends on various local factors, such as climate conditions, soil type and characteristics, agricultural management practices, etc.

2.1.5. Water Stress

Water stress is a widely known indicator that compares the freshwater demand to the available amount of freshwater resources for a specific period of time. The freshwater availability is defined considering both the water quantity and quality since reduced water quality is a major factor restricting its use. Freshwater supplies deteriorate as a result of water stress, such as dry rivers, eutrophicated lakes, and seawater intrusion into aquifers, and have major consequences for humans, habitats, and economic activities. There are many methodologies for quantifying this measure in the literature.

2.1.6. Hydrological Performance

The hydrological performance indicator is adopted by Renouf et al. [42] investigates the local water balance considering both natural and anthropogenic processes and estimates the produced runoff, evapotranspiration and infiltration of the system. Reduced evapotranspiration contributes to the heat island effect, and reduced infiltration reduces aquifer recharge. Increased runoff raises the risk of flooding and degrades the health of freshwater resources; reduced evapotranspiration contributes to the heat island effect; and reduced infiltration reduces aquifer recharge. As a result, decreased hydrological efficiency will have a negative effect on local habitats, as well as a reduction in some key ecosystem services.

2.1.7. Qualitative Water Withdrawal Reduction

Qualitative water withdrawals (i.e., reduced water quality) form the second aspect that contributes to water stress and has significant impacts on people, ecosystems and economy. The main contributor to reduced water quality is the production, inadequate treatment and discharge of municipal, industrial and agricultural wastewater. Monitoring and sampling campaigns on local freshwater resources would enable the evaluation of water quality improvements due to CE measures in the area of interest.

2.1.8. Soil Condition Improvement

Soil condition is defined as “the capacity of a soil to function, within land use and ecosystem boundaries, to sustain biological productivity, maintain environmental health, and promote plant, animal, and human health” [43]. Therefore, soil condition plays a key role in maintaining healthy ecosystems and providing ecosystem services. Soil condition improvement is particularly relevant for CE measures implemented on economic activities that have a direct impact to and/or are impacted directly by soil, e.g., agriculture. Soil condition and its improvement by CE measures can be measured using soil sampling campaigns and soil monitoring protocols.

2.1.9. Index of Biodiversity

As biodiversity has been declining at an alarming rate, the Global Economic Forum ranks biodiversity loss as one of the top five global risks in terms of likelihood [44]. The main contributors to biodiversity loss are land use change, pollution, species overexploitation, climate change and invasive species and diseases [45]. Therefore, CE measures aiming to reduce pollution and tackle climate change should have a positive impact to biodiversity restoration. Several protocols exist in the literature to measure biodiversity.

2.1.10. Revenues/Savings from Natural Capital Regeneration

This indicator focuses on ecosystem accounting [46] by assigning monetary estimates to ecosystems and their services in order to capture the value of both natural capital and the impacts of its loss. Ecosystem accounting distinguishes between ecosystem services that are directly used by people—using both market and non-market valuation approaches—and services that support ecological functions, which is estimated based on the costs of ecosystem’s restoration and maintenance. Ecosystem accounting enables the estimation of costs to the society that derive from changes in ecosystems, expressed in monetary terms or in relation to health and livelihood risks. CE should be able to reduce these costs and turn them into revenues.

2.2. Indicators Related to the Keep Resources in Use Principle

2.2.1. Circular Use

The Circular Use (CU) indicator is adopted by Enel S.p.A. [47] and considers the measures taken to extend the time of use of an asset. Extension of the use time of an asset can be achieved by design and maintenance improvements that would increase the useful life of the product, by product sharing and by selling services and the outcomes of a products rather that the product itself (i.e., service as a product). Such measures may potentially result in environmental benefits by reducing the consumption of materials and resources.
However, there are some products that are neither designed nor manufactured—e.g., water—and therefore, such measures are not directly applicable. In the case of water, the World Business Council for Sustainable Development (WBCSD) [48] developed a similar indicator, namely “Onsite circulation” that calculates the total amount of reused water onsite.

2.2.2. Circular Flow

The Circular Flow (CF) indicator [47] is based on mass balances and accounts for all inputs and outputs of the system. This indicator is further split into two sub-indicators—following the approach of WBCSD [48]—namely, “Circular Input Flow” and “Circular Output Flow”. Circular Input Flow is defined as the ratio of all circular inputs (i.e., input from recycle, reuse, renewables, reduction, etc.) to the total inputs, including inputs from non-renewable resources and virgin materials. Circular Output Flow is defined as the ratio of all effectively utilized outputs (i.e., output sent to recycle, output sent to reuse, output included in the final product, etc.) to the total output, including waste disposal. The average value of these two sub-indicators result in the value of the Circular Flow indicator.

2.2.3. Circular Index

Circular Index (CI) [47] combines Circular Use (CU) and Circular Flow (CF) indicators in the following equation:
CI = CF + ((1 − CF) × (CU − 1))/(2 × CU)
This indicator can be applied to all incorporated resources (e.g., water, energy, nutrients, etc.), materials, and (by-)products of a system.

2.2.4. Maximum Achievable Circularity

Maximum achievable circularity is an aspirational indicator, estimating the resource/material demand that can actually meet its requirements by using alternative/circular sources over the total system’s requirement of this resource/material. This indicator aims to account for the system’s demands that are restricted by regulations or market specifications (e.g., strict quality of products, materials, etc.) and thus, cannot meet their requirements by using alternative sources, indicating that in such cases the value of the circular index indicator could never reach 1. A value equal to 1 would indicate a closed resource/material loop. For example, water for potable uses cannot meet its requirements by using recycled water due to strict regulations.
However, this indicator is also influenced by the regenerative capacity index. For example, if a water system operates under safe water limits, then the water requirement for potable uses is considered to be circular and thus, the maximum achievable water circularity of the system can be equal to 1.
Therefore, if a circularity assessment restricts its boundaries to the human-managed system only, the maximum achievable circularity of strictly-regulated resources/materials/products cannot be 1, while if the nature-managed system falls under the system’s boundaries then the value of this indicator can potentially reach its maximum value.

2.2.5. Revenues/Savings from Circularity Measures

This indicator estimates the monetary impacts of the circular index, excluding the revenues/costs from both natural capital regeneration and design out negative externalities (explained in the following sub-section). Capital and operational costs are included to the estimation of the revenues. This indicator can take various forms from a pure monetary unit to a ratio of revenues/savings before and after CE implementation, etc.

2.3. Indicators Related to the Design out Waste Externalities Principle

2.3.1. Product Index

Product index is an indicator developed by Walker et al. [49] and measures the resources consumed that are returned to the system as a useful product. This indicator is based on the principle of waste equals food, indicating that in an eco-effective system (i.e., an ideal system) there are no generated emissions and all produced waste is utilized as a product by any system’s component.

2.3.2. Waste Index

Waste index [49] is the opposite of the product index, measuring the consumed resources of the system that are returned as a waste. In a CE, this indicator should be minimized.

2.3.3. Total Waste Reduction

This indicator is a direct measurement of the avoided waste due to CE measures and it is based on mass balances. Complementary to this indicator is the waste eco-efficiency index [49], which accounts for the value gained by the products of the system (in mass/volume of products) compared to the total unutilized waste of the system, i.e., waste that is disposed.

2.3.4. Total Emissions Reduction

Total emissions reduction is similar to the previous indicator but it accounts for the actual emissions (i.e., substances or compounds of interest). In CE, emissions should be either reduced or effectively utilized by any natural or anthropogenic system’s component. The value gained by the system’s products compared to the total generated and unutilized emissions, can provide additional useful information in this case as well.

2.3.5. Revenues/Savings Due to Minimization of Negative Externalities

This indicator estimates the economic impacts of CE by reducing the negative externalities that are created from the linear system. The indicator is mainly based on non-market evaluation methods, avoiding double counting with the economic-related indicator of the natural capital regeneration. Subsidies and other similar economic incentives should be accounted in this indicator.

3. Methods

In this section, the developed questionnaire used to validate the indicators, as well as the methodological steps for the ISM approach and MICMAC analysis are presented and analysed.

3.1. Questionnaire Design & Validation of Indicators

Evaluation and validation of the CPIs was performed by surveying purposely-selected stakeholders from academia, as well as from public and private agencies—i.e., water utility companies, agri-food industries, local authorities and consultancy companies—with direct and indirect roles in the different sectors. Purposeful sampling is a sampling technique widely used in qualitative research in order to identify and select information-rich cases (i.e., individuals with special knowledge and experience) related to the research topic [50,51]. Purposeful sampling often involves a small number of participants [52], for example similar studies using purposeful sampling involved 32 individuals [53] and 16 stakeholders [42]. Therefore, the stakeholders involved in the survey (both academic and industrial stakeholders) were individuals actively involved in the concept of CE in the WEFE nexus.
The surveys were conducted via an online questionnaire for the public and private stakeholders and via an online workshop for the academic stakeholders—participating in the COST Action CA17133 Circular City. The virtual workshop was conducted using Mural digital workspace, which was designed in the same way as the online questionnaire for the industrial stakeholders. Thus, academic and industrial stakeholders were asked the same questions. After the completion of the Mural session, a discussion between the experts was performed to better understand their views on the topic. The selected stakeholders and academics were asked to evaluate the importance of each CPI using a three-point scale rating from Low (1) to High (3). In total, 40 questionnaires were completed from 17 countries. The designed questionnaire and the responses can be found in Supplementary Materials—Section A.
Using stakeholders’ opinions to validate CPIs is an important and necessary activity. Indicators need to resonate with stakeholders, so that they can be properly used by them [54]. Including stakeholder participation in CPIs validation process is a robust way of representing the different stakeholders’ opinions, perceptions, values and concerns [55]. This approach combined with the interpretive structural modelling (ISM) offers analytical insights into the relevance and usefulness of the CPIs based on stakeholder representativeness and data availability, and is scientifically rigorous. The results from such a combined approach can influence stakeholders decision-making processes and support the development of a common way of evaluation by all relevant stakeholders.
Table 1 presents the results of the CPIs ranking as obtained by the conducted interviews. The responses per indicator were averaged, considering both the answers of industrial stakeholders and academics.
Based on the results of Table 1, waste reduction (I1) and circular index (I2) are evaluated as the most important CE indicators by the stakeholders, followed by the economic-related indicators of revenues/savings from circularity measures (I3) and revenues/savings due to minimization of negative externalities (I4). In general, indicators related to the keep resources in use and the design out negative externalities principles are perceived as more important compared to the indicators related to the regeneration of natural environment principle with the exception of carbon balance (I6) indicator probably due to its direct connection to global warming and climate change. The outcome is in line with the conclusion of some scientific studies that postulated that CE is mostly perceived by a technocentric perspective with reduced focus on the actual benefits to the natural systems and society [2,23]. All indicators received a good ranking (above 2), indicating that the participants are interested in all selected indicators. Therefore, all the selected indicators are included to the Interpretive Structural Modelling procedure.

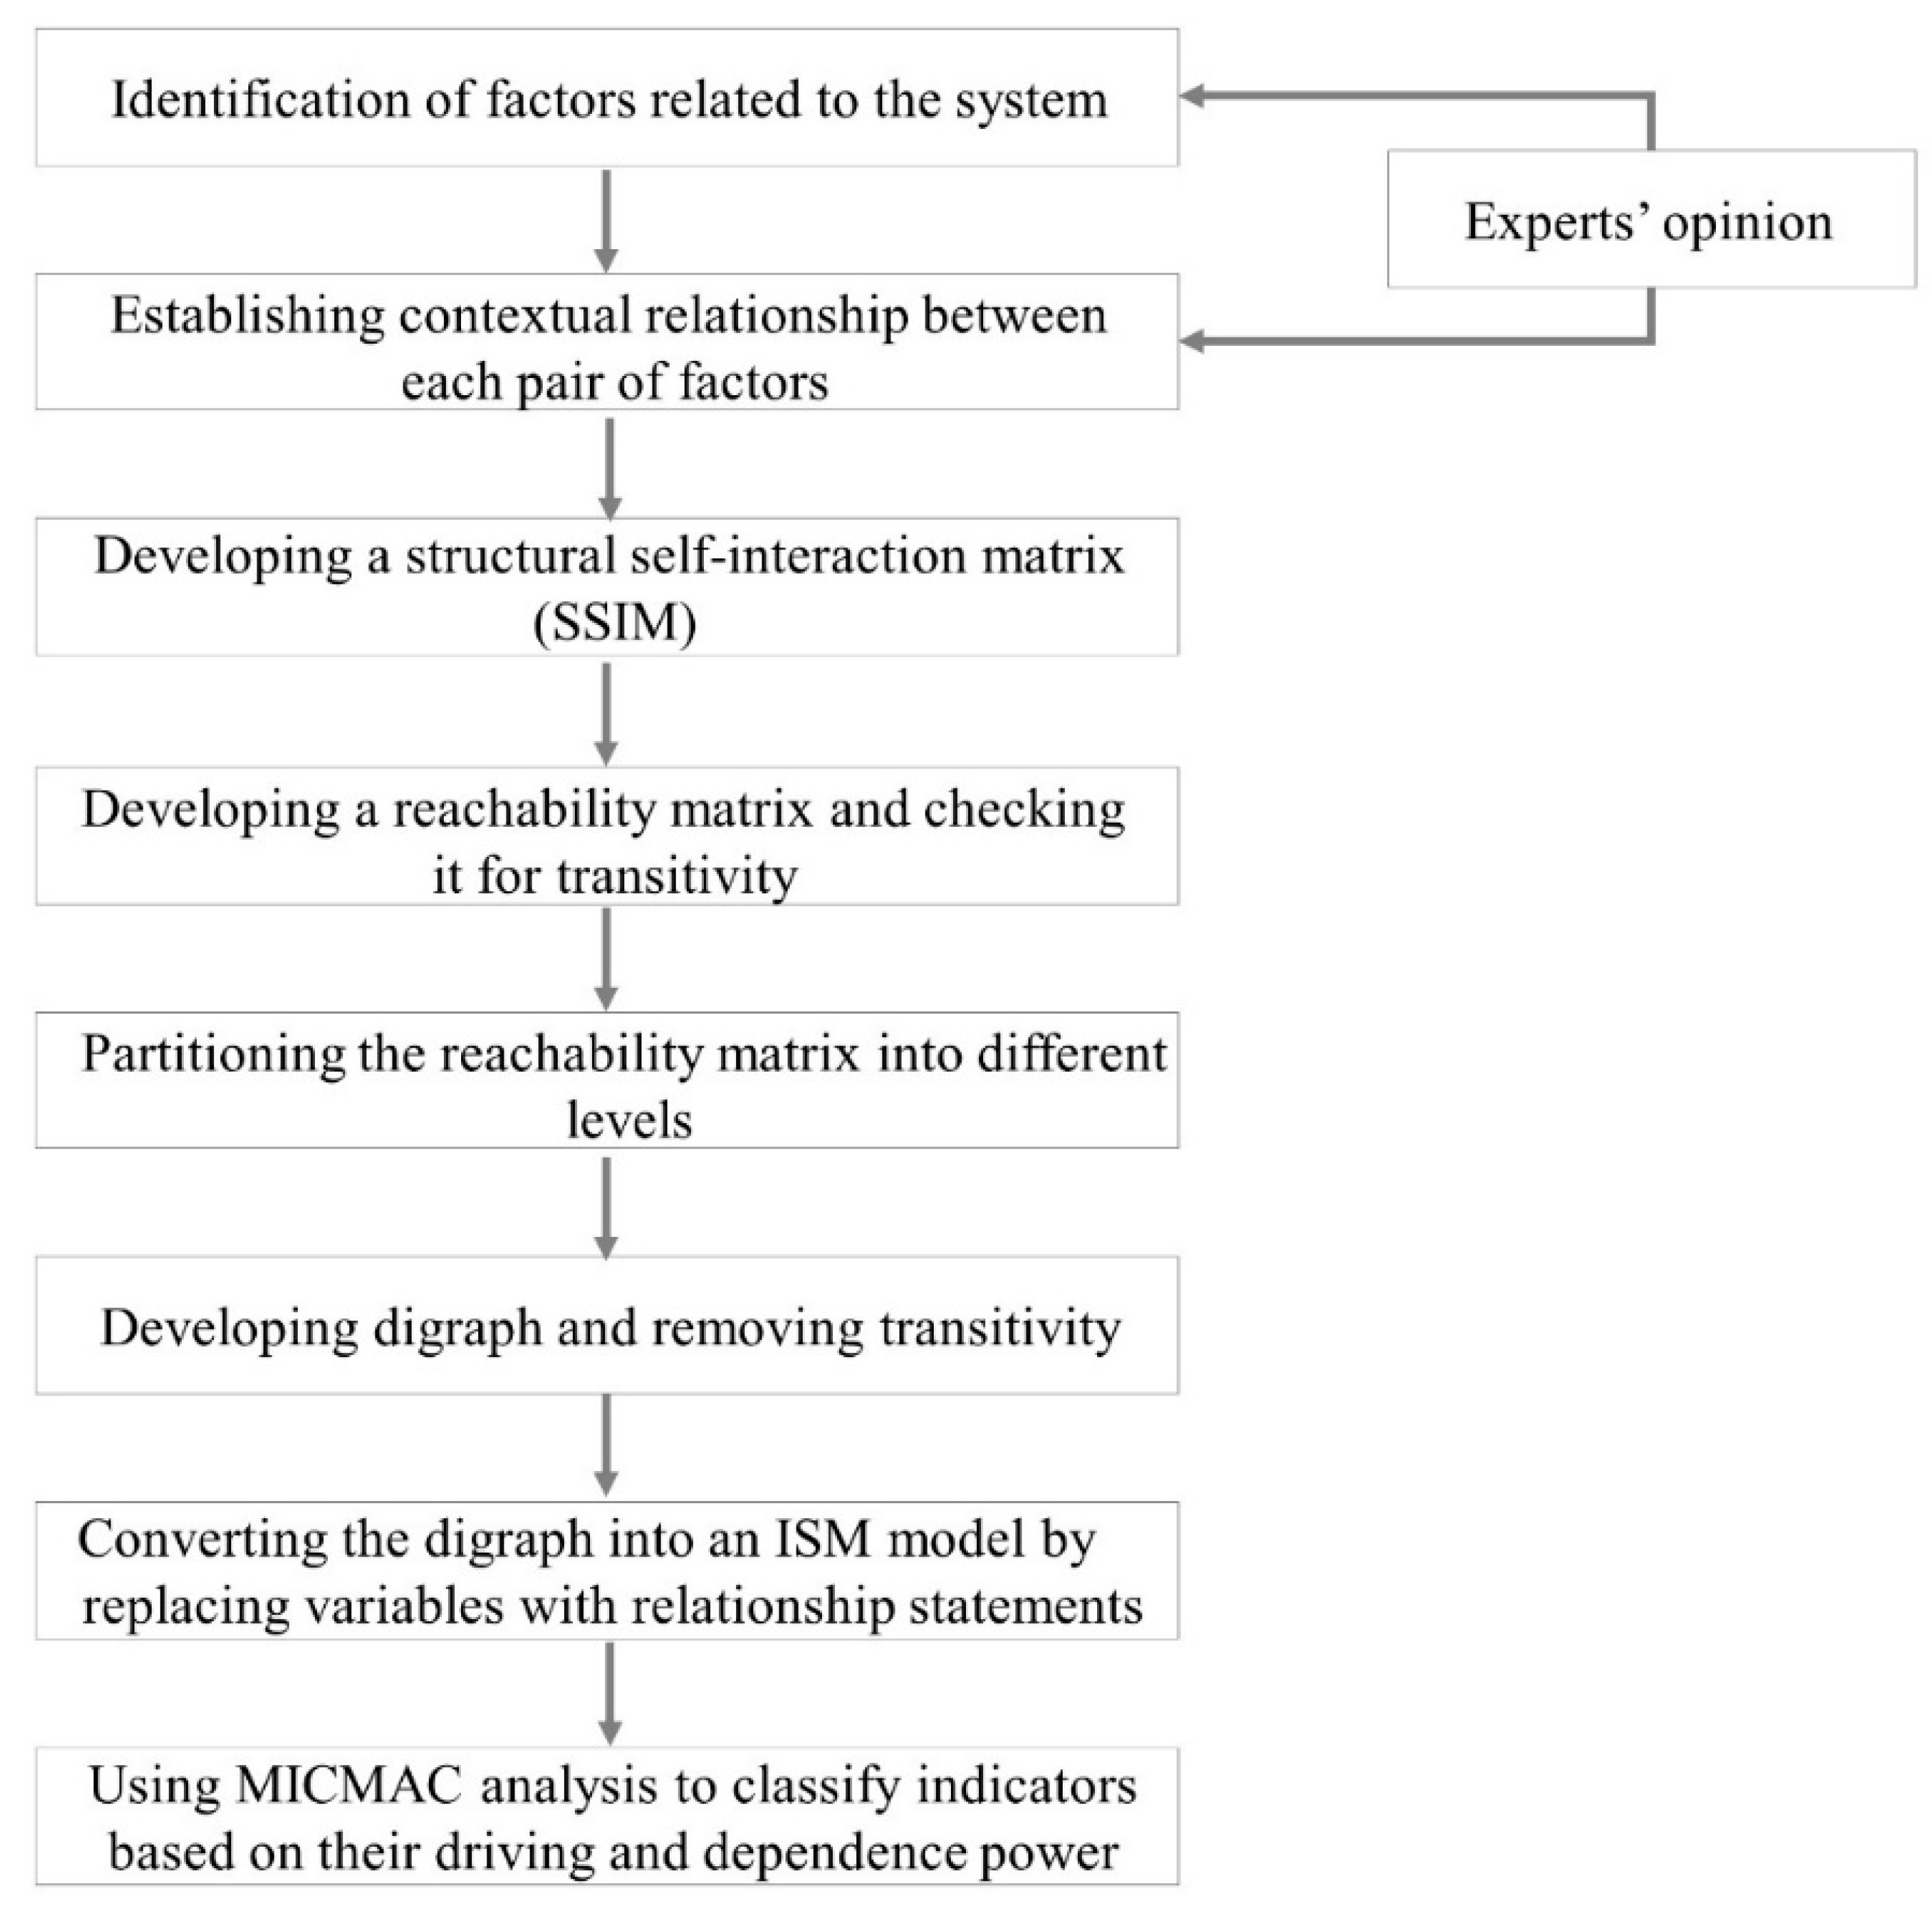
3.2. Interpretive Structural Modelling (ISM)

ISM is a well-established methodology for identifying the interactions between different interlinked factors involved in complex problems. The various direct and indirect interactions between different factors enable an accurate description and understanding of the problem, rather than focusing on each factor individually. ISM analyses the influence of one factor over all the others, by decomposing them into different levels and imposing order and direction on the complexity of their relationships. In complex indicator systems as the ones mandated by nexus approaches, the application of ISM would enable a better understanding and prioritization of the incorporated indicators based on their structural hierarchy. The development of indicators’ importance levels would enable practitioners and relevant stakeholders to better understand the indicators behaviour, facilitating the selection process.
ISM has been applied to understand the relationships between indicators in various studies. For example, Tseng [56] used ISM to analyze the interactive relations of sustainable production indicators, Amrina et al. [57] and Amrina et al. [58] identified the most influencing indicators related to sustainable maintenance performance in the rubber and cement industry, respectively, while Gardas et al. [59] investigated performance indicators of green supply chain management in agro-industry. In this study, the application of ISM enables the establishment of interrelationships between the different CPIs, as well as the identification of those indicators that have high driving power, requiring the consciousness of decision makers. ISM is chosen as a simple method that does not depend on the intensity of the relationship between the indicators but it only requires the dominance level [53].
ISM begins with the identification of relevant variables to the problem or question, and then progresses to a group problem-solving technique. Then a subordinate relation that is contextually appropriate is chosen. After deciding on the element set and contextual relationship, a structural self-interaction matrix (SSIM) is generated by comparing variables pairwise. The SSIM is then transformed into a reachability matrix (RM) and the transitivity of the RM is checked. A matrix model is obtained after transitivity embedding is completed. The partitioning of the elements is then determined, followed by the extraction of the structural model known as ISM. The various steps involved in ISM technique are illustrated in Figure 1 and are further analyzed in the following sub-sections.

3.2.1. Establishment of Relationships and Development of Structural Self-Interaction Matrix

For the identification of the contextual relationship among the different CPIs, eight experts on the field of CE assessment having more than 6 years of experience were consulted via direct interviews. For each pair of CPIs, the experts were asked to determine the interaction of the CPIs by considering the contextual relationship of “leads to” and “influences” type. The experts’ responses were averaged and the results were communicated to the same experts to finalize the direction of the relationships.
Based on the results of the experts’ consultation regarding the relationships between each pair of CPIs, the structural self-interaction matrix (SSIM) is developed and presented in Table 2, using the following symbols:
  • V for the relation from indicator i to indicator j—i.e., indicator i will influence indicator j
  • A for the relation from indicator j to indicator i—i.e., indicator i will be influenced by indicator j
  • X for both direction relations—i.e., indicators i and j will influence each other
  • O for no relation between the indicator—i.e., indicators i and j are unrelated

3.2.2. Reachability Matrix and Level Partitions

In the next step of the ISM approach, the initial reachability matrix from the SSIM is developed, by replacing the four symbols (i.e., V, A, X or O) of the SSIM with binary numbers in the initial reachability matrix. The rules for this substitution are the following:
  • If the (i, j) entry in the SSIM is V, then the (i, j) entry in the reachability matrix becomes 1 and the (j, i) entry becomes 0.
  • If the (i, j) entry in the SSIM is A, then the (i, j) entry in the matrix becomes 0 and the (j, i) entry becomes 1.
  • If the (i, j) entry in the SSIM is X, then the (i, j) entry in the matrix becomes 1 and the (j, i) entry also becomes 1.
  • If the (i, j) entry in the SSIM is O, then the (i, j) entry in the matrix becomes 0 and the (j, i) entry also becomes 0.
The initial reachability matrix (see Supplementary Materials—Section B needs to be tested for transitivity based on the basic assumption that if indicator A is related to indicator B and indicator B is related to indicator C, then indicator A is necessarily related to indicator C. Following the transitivity rule, some 0 values of the initial reachability matrix will change to 1. The final reachability matrix is prepared by indicating the changed values of the initial reachability matrix with 1* as illustrated in Table 3. Indicators in the same level across the rows and columns are clustered to calculate the drive and dependence powers. The drive power of an indicator is derived by summing up the binary numbers in the rows and its dependence power by summing up the binary numbers in the columns.
The determination of the importance level of each indicator is derived from the level partitions. From the final reachability matrix, the reachability and the antecedent sets are derived. The reachability set of an indicator consists of the indicator itself and the other indicators it may impact, while the antecedent set of an indicator consists of the indicator itself and the other indicators that may influence the specific indicator. Thereafter, the intersection set of an indicator derives from the intersection of the reachability and antecedent sets. The indicators that have the same intersection and reachability sets are identified as top-level indicators in the ISM hierarchy and are removed from consideration for the next levels. Top level indicators are the ones that do not influence any other indicators above their level. The same process is repeated to identify the indicators of the next level and the process continues until the importance level of all indicators is specified. In this case, the partitions level process resulted in six iterations (see Supplementary Materials—Section B and the results of the importance level of each indicator are illustrated in Table 4.

3.2.3. Digraph and ISM Model

The next step of the ISM procedure is the development of the digraph. The digraph represents the visual illustration of the indicators and their interdependencies and is generated by indicators nodes and lines of edges based on the results of the final reachability matrix and the partitioning levels. Therefore, the nodes of the top-level indicators are positioned at the top of the digraph, followed by the nodes of the second level indicators connected with arrows and so on, until the bottom level indicators are positioned at the lowest part of the digraph. The arrows represent the direct links of the indicators between the consequent importance levels. Therefore, each indicator at a higher importance level is influenced by at least one indicator at the next lower importance level. The generated digraph is converted into the ISM model by replacing the indicator nodes with statements. The results are presented and discussed in Section 4.

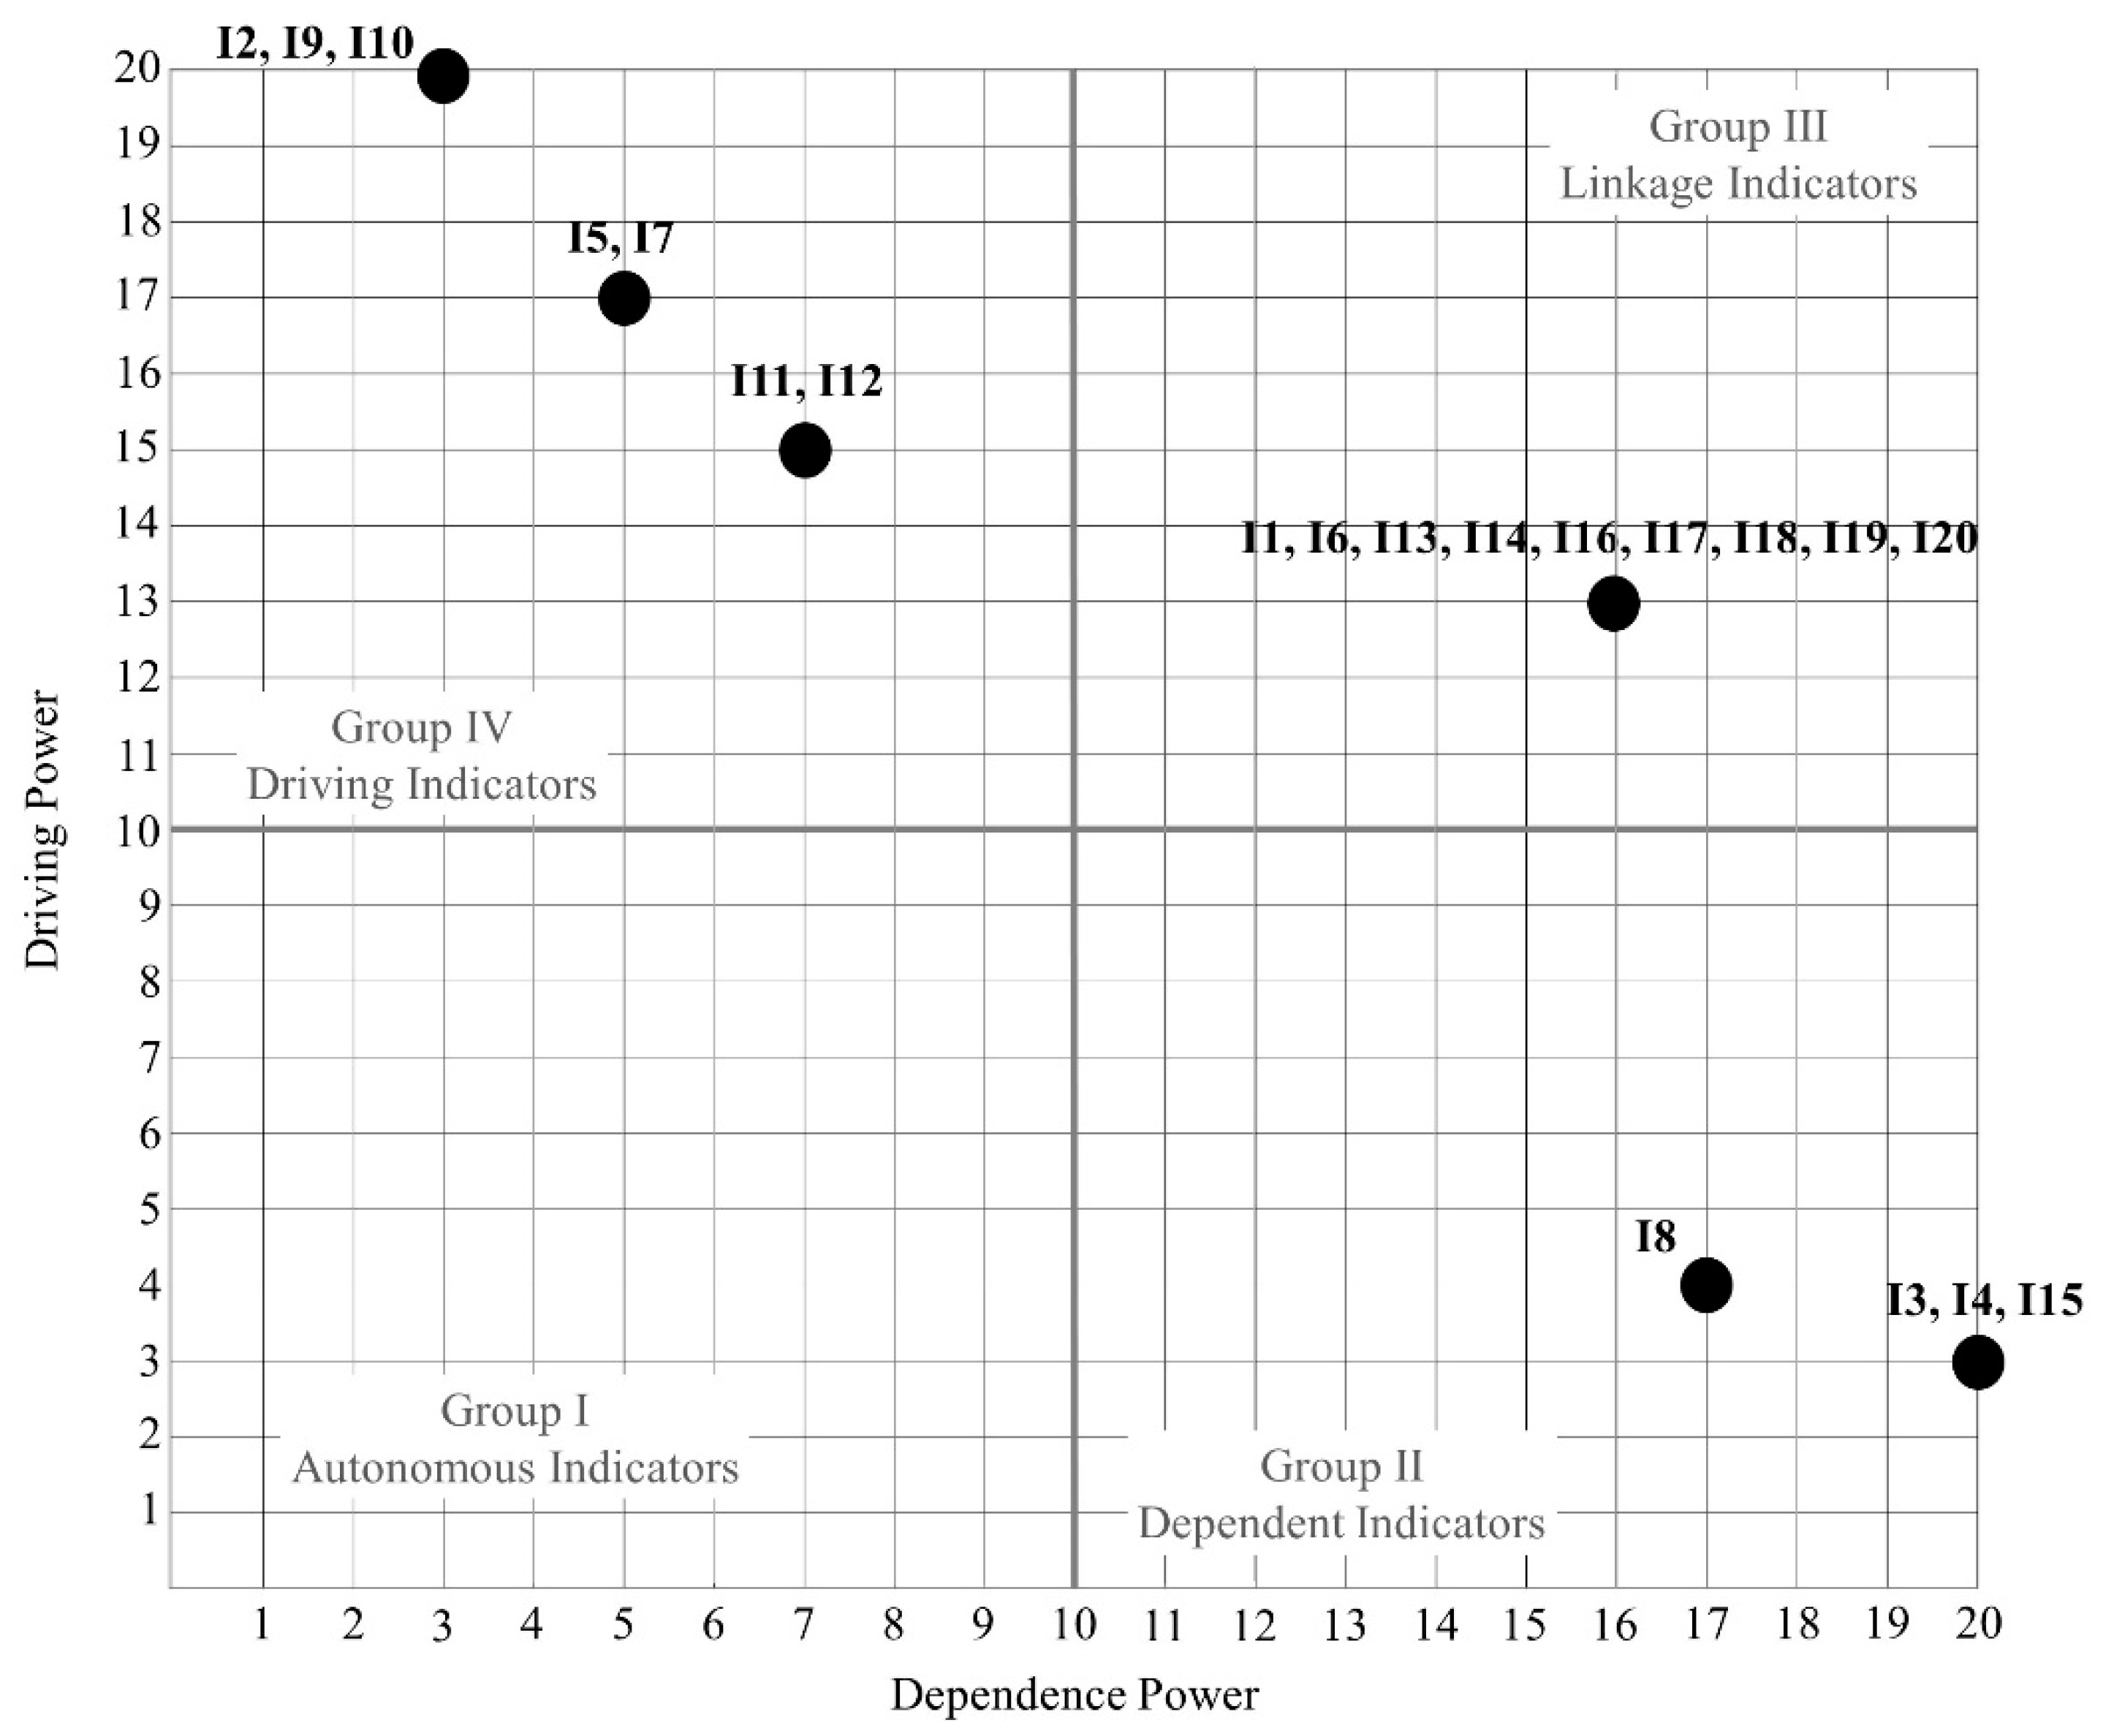
3.2.4. MICMAC Analysis

The ISM approach is complemented with the cross-impact matrix multiplication applied to classification (Matrice d’ Impacts Croisés Multiplication Appliquée á un Classment—MICMAC) in order to explore the grey area between 0 and 1. MICMAC is a structural prospective analysis used to investigate the indirect (i.e., cross-correlation) relationships between different variables and thus, it enables the selection of significant indicators in a more accurate way. MICMAC analysis is expected to provide additional valuable insights on the results of the ISM model by further identifying the complex and indirect interactions between the investigated indicators. The identification of indicators driving and dependence power enables the investigation of indicators feedback loops, highlighting the indicators that influence the most the remaining metrics.
In the MICMAC analysis, a graph classifying the indicators based on the driving and dependence powers is developed. Therefore, the indicators are clustered into the following four groups:
  • Group I—Autonomous Indicators that have weak driving and dependence power, indicating a relevant disconnection from the system;
  • Group II—Dependent Indicators that have weak driving power but strong dependence power, indicating that these indicators are strongly affected by other indicators but they have weak influence on others;
  • Group III—Linkage Indicators that have strong driving and dependence power, indicating their instability as they connect different indicators (meaning that they both are impacted by and impact other indicators) resulting in ripple effects;
  • Group IV—Independent/Driving Indicators that have strong driving power but weak dependence power, indicating that they are minimally influenced by other indicators but they have a strong impact on indicators thus, requiring maximum attention.
The results of the MICMAC analysis are also presented and discussed in following section.

4. Results and Discussion

In this section, the results of the ISM model and MICMAC analysis are presented and discussed, followed by a thorough elaboration on the contributions and limitations of the deployed methodology. The interference between circularity indicators and policies is further discussed in the final sub-section.

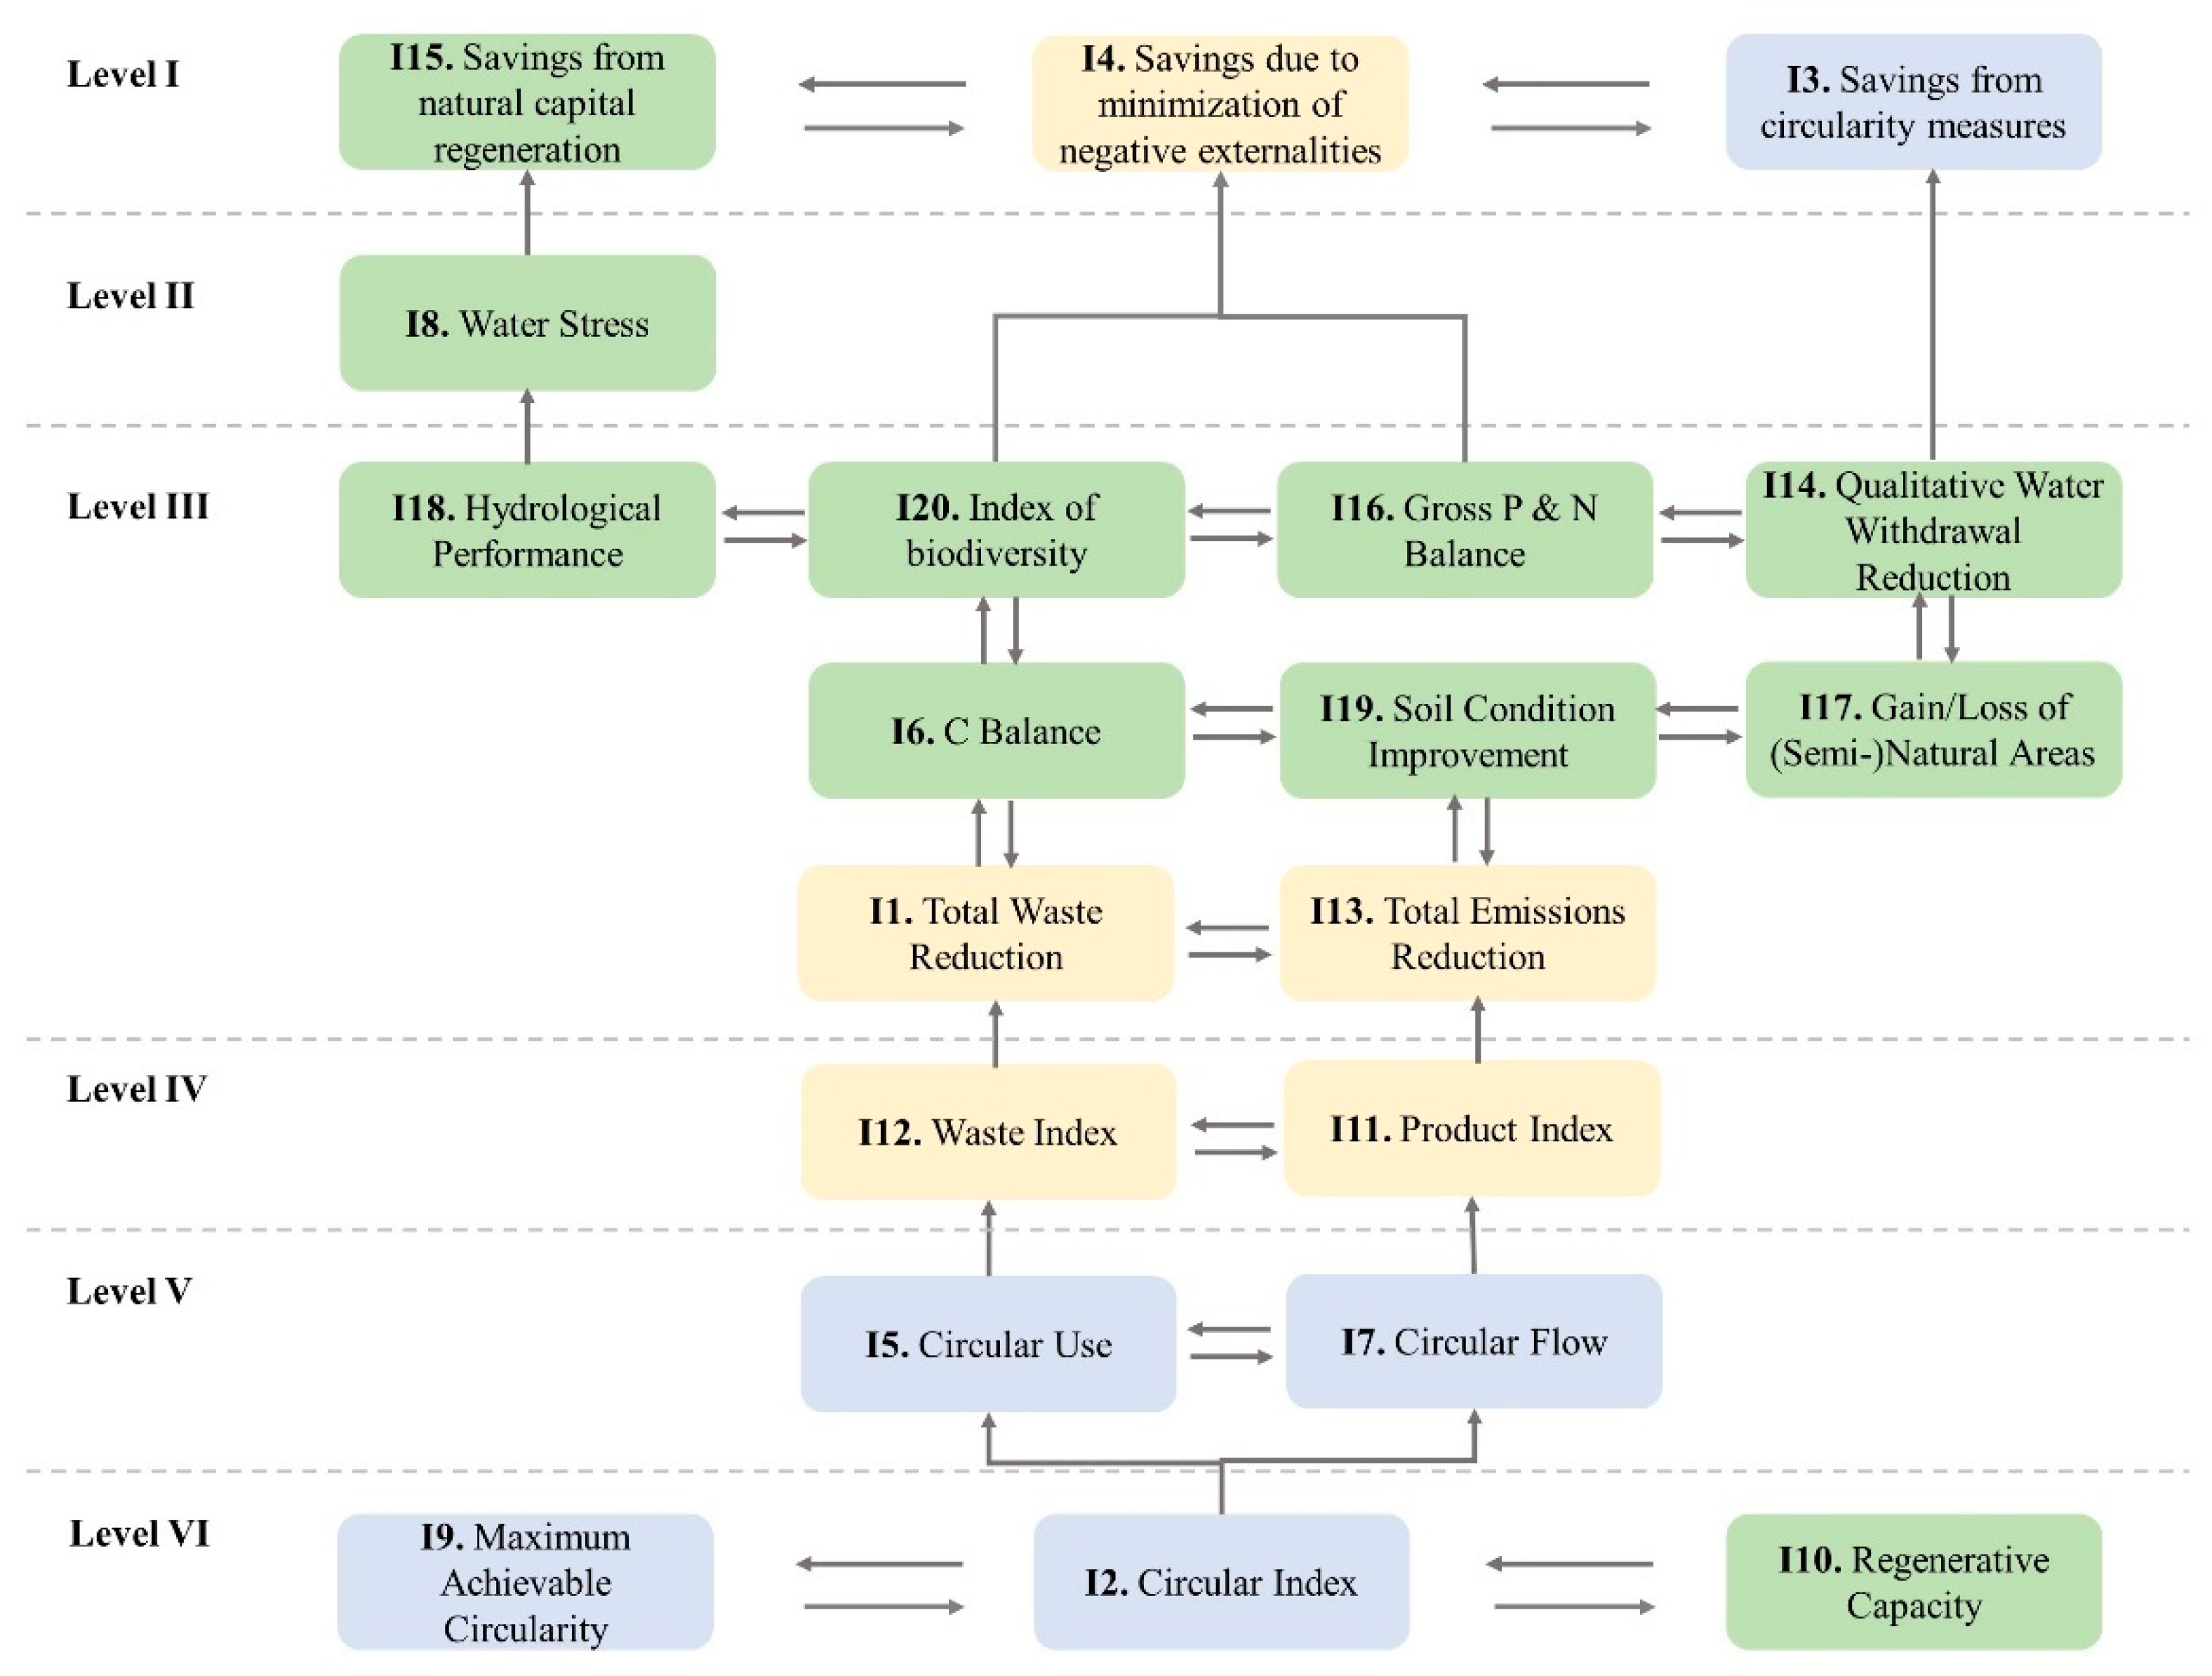
4.1. ISM Model Results and Discussion

The generated ISM model—illustrated in Figure 2—has six importance levels. Level I—placed at the top of the figure—includes the three economic-related indicators (i.e., I3, I4 and I15), indicating that these indicators do not influence any other indicator of the system. In Level II and III consist of ten indicators in total, eight of which are related to the regeneration of natural environment principle (i.e., I8, I6, I14, I16, I17, I18, I19, I20) and two are related to the design out negative externalities principle (i.e., I1, I13). Level IV includes two design out negative externalities indicators (i.e., I11, I12), while Circular Use (I5) and Circular Flow (I7)—falling under the keep resources in use principle—are classified as Level V indicators. Level VI consists of three indicators, two of which are related to the keep resources in use principle (i.e., I2 and I9) and one (i.e., I10) of the regeneration of natural environment principle.
Figure 2 indicates that the most critical indicators are the maximum achievable circularity (I9), the circular index (I2) and the regenerative capacity (I10) that are interdependent to each other and these three indicators will affect all the remaining seventeen indicators. Maximum achievable circularity indicates the physical limits of the anthropogenic system to close its loops, while the regenerative capacity represents the limits/thresholds of the natural system that should not be crossed. Circular index cannot overcome the maximum achievable circularity and should remain under the local regenerative capacity and in fact it should focus on even improving it. The results seem to be in line with recent studies indicating the increasingly recognised importance of the Planetary Boundaries concept [39] to CE in order for the latter to remain within a safe operating space [5,23,60]. Therefore, CE efforts should first and foremost measure and evaluate the local physical and natural limits and how circularity is influenced by or influences them—the correlation between the regenerative capacity of the area, the maximum achievable circularity and the circular index.

4.2. MICMAC Analysis Results and Discussion

The position of the indicators in the Driving—Dependence power graph derived from MICMAC analysis is illustrated in Figure 3. The indicators are located in Group II, III and IV, indicating that there are no autonomous indicators in the system.
In Group IV, there are seven indicators identified as driving indicators, namely circular index (I2), maximum achievable circularity (I9), regenerative capacity index (I10), circular use (I5), circular flow (I7), product index (I11) and waste index (I12). Among these indicators, two (I11, I12) are related to the design out negative externalities principle, four (I2, I5, I7, I9) are related to the keep resources in use principle, and one (I10) is related to the regeneration of natural environment principle. Therefore, it is indicated that the indicators’ positioning in Figure 3 does not necessarily represent the importance level of the indicators (Figure 2). Level IV and V indicators are specified as driving indicators, along with the most important indicators of Group VI, signifying a strong driving power in impacting all other indicators. These seven driving indicators are in fact intrinsic circularity indicators—following the indicators taxonomy proposed by Saidani et al. [25]—that measure the inherent circularity of a system. The driving indicators are the most important indicators to be measured as they influence all the remaining indicators.
Nine indicators (i.e., I1, I6, I13, I14, I16, I17, I18, I19, I20) are identified as linkage indicators, positioned in Group III. These nine indicators have mutual dependency and their positioning indicates that a change in any of these indicators will result in a ripple effect affecting all the other indicators of this group. Considering the indicators taxonomy of Saidani et al. [25], these linkage indicators are specified as consequential indicators, measuring the impacts of CE. The linkage indicators are important to be measured and monitored as they indicate the consequences of CE implementation. However, depending on the target system, some linkage indicators can be more important than others. For example, in a system where biodiversity is significantly reduced it would be important to measure and evaluate how and if CE actions affect the index of biodiversity, while in a system where agriculture is the main economic activity and the major system’s component the importance of monitoring soil condition improvement increases. Therefore, the selection of indicators strongly depends on the system, with the most important indicators to be regularly monitored and reported while the remaining could be monitored less frequently. That is because these indicators are interrelated indicating that the incorporated ripple effects may result in impacts, which can be neglected if not monitored at all.
In Group II, the remaining four indicators are identified as dependent indicators. These indicators include the three economic-related indicators of savings from circularity measures (I3), savings due to minimization of negative externalities (I4) and savings from natural capital regeneration (I15), as well one indicator targeted at the regeneration of natural environment principle; i.e., water stress (I8). This group includes indicators that strongly depend on the results of the other indicators but they do not influence any of them. Economic-related indicators are high in the hierarchy of the stakeholders ranking (Table 1). Although these indicators cannot influence the behaviour of the other ones, they can play an important role towards the transition to CE by providing important incentives to stakeholders. All four indicators are specified as Level I and II indicators in Figure 2.

4.3. Contributions, Recommendations and Limitations

This study develops a framework for CE indicators selection that is based on a computer-assisted learning process, using ISM approach and MICMAC analysis. This approach enables the investigation of interrelationships among various circularity performance indicators for the WEFE nexus and enables the identification of the driving indicators, i.e., the indicators that influence the remaining indicators the most. The interrelationships are represented in a hierarchical manner that classifies the indicators based on the degree of influence, enabling the investigation of the behavioural aspect of indicators. The behaviour of an indicator when it interacts with other indicators is of major importance in order to better understand which indicators would influence the results of a circularity assessment the most by identifying the feedback loops of the indicators system. As observed in the literature, very few studies have applied multi-criteria decision-making treatment for identifying the interrelationships between indicators, while none of them has focused on CE indicators related to the WEFE nexus. This study explicitly examines the relationship among a set of twenty CE indicators targeted at the WEFE nexus that will assist the practitioners and researchers to understand the behaviour of these indicators. All CE indicators cannot be implemented simultaneously. However, if the behavioural aspect and the relationships among these indicators are obtained, practitioners, scholars and policymakers of the nexus will be facilitated.
Focusing on the specific results of this study, the twenty analyzed CPIs were divided into three groups: seven driving CPIs (intrinsic indicators), nine linkage CPIs (consequential indicators), and four dependent CPIs. The results indicate that CE planning and implementation should start from an in-depth analysis of the local context and conditions, including an investigation on the regenerative capacity based on local safe operating spaces, as well as on the local maximum achievable circularity and the required circular index, adequate to perform under the local limits. These results are in line with the increasing recognition of a territorial approach to circularity indicating that CE materializes in very different ways based on the local conditions, needs and risks in which it operates [61]. While the circular index is simple to measure, the regenerative potential and ultimate achievable circularity are more aspirational measures, and future research should concentrate on developing measurement and evaluation methodologies for these two indicators. Following the specification of these values for the local context, CE calculation and evaluation should begin with a comparison of the adopted measures to these goals. Equally important is the evaluation and reporting of the circular use and flow and the product and waste indices, since these indicators have a significant impact on both consequential and dependent indicators. Monitoring and reporting of consequential or linkage indicators would show the impacts of the intrinsic indicators to both the human-managed (e.g., waste reduction) and nature-managed (e.g., soil condition improvement) systems. These indicators would prove whether or not CE measures work in the right direction and would further affect the economic-related indicators. It is worth noting that these last indicators have been signalized by the consulted stakeholders as highly relevant, and though they have shown not to affect any other indicator of the system, any comprehensive CE assessment should consider the valorization of potential revenues/savings from natural capital regeneration, minimization of negative externalities and circularity measures. To do that, a wide variety of economic methods based on market and non-market approaches are available [29].
Despite the study’s significant contributions to the identification of indicators for the WEFE nexus, it has a number of limitations. The study’s first drawback is that the contextual relationship of the indicators depends on experts judgement, which may be biased and therefore influence the results. To overcome this drawback, it is suggested to carefully select the experts based on their in-depth knowledge and experience on the specific indicators that are investigated, as well as on the studied system, level of implementation and sector specificities. Additionally, primary emphasis should be placed on saturation [62], e.g., the experts can be interviewed multiple times until no new substantive information is obtained. Furthermore, the model hasn’t been statistically checked. To further confirm these results, structural equation modelling (SEM) may be used. Integrating model/equations for estimating values of indicators in addition to experts’ assessments will increase the applicability and transferability of the method across case studies. Indicators estimated with SEM approach can be checked by experts and facilitate the validation of the method. The models/equations need to be supported with a concept database structure including publicly available data as well as specific data to case studies, which on one hand can be a bottleneck for applying the method, on the other hand it can be a driver for better organisation of public data sets to be used for estimation of circularity indicators.
Another drawback is that the current model only considers twenty macro-level CPIs that were produced by Nika et al. [29] and validated by experts. However, the literature contains several collections of CE macro-level metrics, implying that the CPIs examined are not exhaustive. In fact, appropriate indicators for monitoring and assessing CE are case-specific, depending on the sectors, supply and value chains, processes, products, resources and materials involved in the investigated system, indicating that CE indicators at various implementation levels (e.g., micro, meso) or sector-specific indicators can yield different results. Therefore, this study does not aim at indicating a specific set of CE indicators that are important and appropriate in all cases, but rather proposes a versatile methodology able to identify comprehensive indicators relevant to the specific systems.

4.4. Interface with Policy, Regulation and Finance

Sound analytical framework of circularity indicators within the WEFE nexus cross sectoral perspective is crucial in the current conjuncture of ambitious global (e.g., Sustainable Development Goals) and continental (e.g., European Green Deal) water-, energy- and food-related objectives, which securities are inextricably inter-linked and all supported by ecosystems [63,64].
Circularity indicators are also fundamental to direct and monitor effectiveness of investments towards sustainable projects and initiatives. In Europe, the recent action plan on financing sustainable growth [65] aims at establishing a clear and detailed EU Taxonomy, a classification system for sustainable activities. However, validated circularity indicators that consider and quantify WEFE inter-sectorial linkages are still missing and are not supporting decisions and framework to facilitate sustainable investments.
The harmonization of water, energy and food policy targets considering the benefit for the natural capital should also guide the currently evolving European water-related legislative and regulatory framework is evolving. Besides the EU Green Deal, there is a number of legal files relevant for the water sector under evaluation, revision or approval at EU level. Furthermore, unpredictable events, such as the Coronavirus pandemic, have heavily influenced the policy priorities. In this context, the alignment of new solid CE indicators with EU policies is crucial.
Finally, the CE indicators can support policy integration and wider perspective for the payment and reward of ecosystem services, even for their inclusion in the water and energy tariff framework. At the moment, mainly sectorial mechanism to evaluate the Environmental and Resource Cost (ERC) and reward the ecosystem services are applied, for example to the full recovery cost (FRC) within the water tariff. For instance, in Italy mainly aquatic ecosystems are considered [66], while indicators considering the WEFE nexus might better represent the needed holistic approach.

5. Conclusions

The development of performance indicators adequate to holistically and systemically measure circularity receives increasing attention towards a successful transition to CE. Yet, there is not a single widely accepted set of CE indicators. The indicators selection process is a key step for a holistic and sufficient evaluation of CE actions, requiring the consideration of multiple circularity aspects, systems specificities, scientific knowledge and practical needs of related stakeholders. In cases where system’s value chain exceeds the sectoral boundaries and nexus approaches are required, the complexity of measuring and assessing circularity increases significantly influencing the selection of appropriate CE indicators. It is therefore important to consider the behavioural aspect of CE indicators in order to better understand the interdependencies between them, facilitating the indicators selection procedure based on solid justification.
The current study focused on a set of macro-level CE indicators for the WEFE nexus, validated by academic and industrial experts in the field. The validated indicators were analyzed using ISM modelling and MICMAC analysis in order to identify direct and indirect relationships between these indicators. Six importance levels were identified in the ISM model, indicating that the most critical indicators—based on the structural hierarchy—are the maximum achievable circularity, the circular index and the regenerative capacity. The MICMAC analysis resulted in seven driving, nine linkage and four dependent indicators. The MICMAC analysis results provide additional insights regarding the indicators interconnections. Based on these results, the seven driving indicators—consisting of two design out negative externalities indicators and four keep resources in use indicators—are the ones that will influence the results of all the remaining indicators. According to the findings, regenerative capacity, overall achievable circularity, and the circular index are among the most important driving measures of circularity, followed by circular usage and flow, commodity and waste indices, and so on. These indicators should be at the heart of every CE assessment protocol that contributes to the achievement of consequential and economic-related goals.
The results of this study will help researchers, practitioners, and policymakers prepare and execute CE strategically, as well as define and use relevant metrics to assess and evaluate CE in a systematic way. As future research, Structural Equation Modelling (SEM) can be integrated in the proposed methodology to additionally formalize the cause and effect relationships between indicators. The latter would provide statistical checks of the method, more independency from experts’ opinions and facilitate transferability to different case studies including validation of the method itself.

Supplementary Materials

The following are available online at https://www.mdpi.com/article/10.3390/w13162198/s1, Figure S1: Distribution of responses per country, Figure S2: Distribution per sector, Figure S3: Interest in CE principles per sector, Figure S4: Interest in any other aspects for CE assessment, Table S1: List of CPIs to rate, Table S2: Number of responses per country, Table S3: Number of responses per sector, Table S4: Initial Reachability Matrix, Table S5: First iteration, Table S6: Second iteration, Table S7: Third iteration, Table S8: Fourth iteration, Table S9: Fifth iteration, Table S10: Sixth iteration.

Author Contributions

Conceptualization, E.K. and C.-E.N.; methodology, C.-E.N.; validation, E.K., V.V., N.A. and C.-E.N.; formal analysis, C.-E.N.; investigation, A.E., J.K., G.B., H.V.O., K.D., E.I., F.F. and C.-E.N.; data curation, C.-E.N.; writing—original draft preparation, C.-E.N.; writing—review and editing, A.E., J.K., G.B., H.V.O., K.D., E.I., F.F., N.A., V.V. and C.-E.N.; data curation, C.-E.N.; supervision, E.K. All authors have read and agreed to the published version of the manuscript.

Funding

This research received no external funding.

Institutional Review Board Statement

Not applicable.

Informed Consent Statement

Not applicable.

Data Availability Statement

Not applicable.

Acknowledgments

This research was supported by the COST Action CA17133 Circular City, the Horizon 2020 innovation projects HYDROUSA (grant agreement no. 776643) and HOUSEFUL (grant agreement no. 776708).

Conflicts of Interest

The authors declare no conflict of interest.

References

  1. Kirchherr, J.; Reike, D.; Hekkert, M. Conceptualizing the circular economy: An analysis of 114 definitions. Resour. Conserv. Recycl. 2017, 127, 221–232. [Google Scholar] [CrossRef]
  2. Friant, M.C.; Vermeulen, W.J.; Salomone, R. A typology of circular economy discourses: Navigating the diverse visions of a contested paradigm. Resour. Conserv. Recycl. 2020, 161, 104917. [Google Scholar] [CrossRef]
  3. Lonca, G.; Muggéo, R.; Imbeault-Tétreault, H.; Bernard, S.; Margni, M. Does material circularity rhyme with environmental efficiency? Case studies on used tires. J. Clean. Prod. 2018, 183, 424–435. [Google Scholar] [CrossRef]
  4. Ellen MacArthur Foundation. Water and Circular Economy: A White Paper. Available online: https://nextgenwater.eu/water-circular-economy/ (accessed on 29 May 2021).
  5. Korhonen, J.; Honkasalo, A.; Seppälä, J. Circular economy: The concept and its limitations. Ecol. Econ. 2018, 143, 37–46. [Google Scholar] [CrossRef]
  6. European Commission (EC). The EU’s 2021–2027 Long-Term Budget & NextGeneration EU-Facts and Figures; Publications Office of the European Union: Luxembourg, 2021. [Google Scholar] [CrossRef]
  7. Geng, Y.; Fu, J.; Sarkis, J.; Xue, B. Towards a national circular economy indicator system in China: An evaluation and critical analysis. J. Clean. Prod. 2012, 23, 216–224. [Google Scholar] [CrossRef]
  8. Pauliuk, S. Critical appraisal of the circular economy standard BS 8001:2017 and a dashboard of quantitative system indicators for its implementation in organizations. Resour. Conserv. Recycl. 2018, 129, 81–92. [Google Scholar] [CrossRef]
  9. Helander, H.; Petit-Boix, A.; Leipold, S.; Bringezu, S. How to monitor environmental pressures of a circular economy: An assessment of indicators. J. Ind. Ecol. 2019, 23, 1278–1291. [Google Scholar] [CrossRef]
  10. European Commission (EC). Measuring Progress towards Circular Economy in the European Union—Key Indicators for a Monitoring Framework; European Commission: Strasbourg, France, 2018. [Google Scholar]
  11. Kravchenko, M.; Pigosso, D.C.; McAloone, T.C. A Procedure to Support Systematic Selection of Leading Indicators for Sustainability Performance Measurement of Circular Economy Initiatives. Sustainability 2020, 12, 951. [Google Scholar] [CrossRef] [Green Version]
  12. European Commission (EC). Communication from the commission to the European parliament, the council, the European economic and social committee and the committee of the regions. In Closing the Loop—An EU Action Plan for the Circular Economy; European Commission: Brussels, Belgium, 2015; p. 614. [Google Scholar]
  13. Serrano-Tovar, T.; Suárez, B.P.; Musicki, A.; Juan, A.; Cabello, V.; Giampietro, M. Structuring an integrated water-energy-food nexus assessment of a local wind energy desalination system for irrigation. Sci. Total Environ. 2019, 689, 945–957. [Google Scholar] [CrossRef] [PubMed]
  14. Kopnina, H.; Blewitt, J. Sustainable Business: Key Issues, 2nd ed.; Routledge: Milton Park, UK; Abingdon-on-Thames, UK; Oxfordshire, UK, 2018. [Google Scholar] [CrossRef]
  15. European Commission (EC). Communication from the commission to the European parliament, the council, the European economic and social committee and the committee of the regions. In A New Circular Economy Action Plan—For a Cleaner and More Competitive Europe; European Commission: Brussels, Belgium, 2020; p. 98. [Google Scholar]
  16. Moraga, G.; Huysveld, S.; Mathieux, F.; Blengini, G.A.; Alaerts, L.; Van Acker, K.; Dewulf, J. Circular economy indicators: What do they measure? Resour. Conserv. Recycl. 2019, 146, 452–461. [Google Scholar] [CrossRef] [PubMed]
  17. Banaitė, D.; Tamošiūnienė, R. Sustainable development: The circular economy indicators’ selection model. J. Secur. Sustain. Issues 2016, 6. [Google Scholar] [CrossRef]
  18. Sánchez-Ortiz, J.; Rodríguez-Cornejo, V.; Río-Sánchez, D.; García-Valderrama, T. Indicators to measure efficiency in circular economies. Sustainability 2020, 12, 4483. [Google Scholar] [CrossRef]
  19. Lieder, M.; Rashid, A. Towards circular economy implementation: A comprehensive review in context of manufacturing industry. J. Clean. Prod. 2016, 115, 36–51. [Google Scholar] [CrossRef]
  20. Bocken, N.M.; Olivetti, E.A.; Cullen, J.M.; Potting, J.; Lifset, R. Taking the circularity to the next level: A special issue on the circular economy. J. Ind. Ecol. 2017, 21, 476–482. [Google Scholar] [CrossRef]
  21. Park, K.; Kremer, G. Text mining-based categorization and user perspective analysis of environmental sustainability indicators for manufacturing and service systems. Ecol. Indic. 2017, 72, 803–882. [Google Scholar] [CrossRef]
  22. Waas, T.; Hugé, J.; Block, T.; Wright, T.; Benitez-Capistros, F.; Verbruggen, A. Sustainability assessment and indicators: Tools in a decision-making strategy for sustainable development. Sustainability 2014, 6, 5512–5534. [Google Scholar] [CrossRef] [Green Version]
  23. Roos Lindgreen, E.; Salomone, R.; Reyes, T. A critical review of academic approaches, methods and tools to assess circular economy at the micro level. Sustainability 2020, 12, 4973. [Google Scholar] [CrossRef]
  24. Harris, S.; Martin, M.; Diener, D. Circularity for circularity’s sake? Scoping review of assessment methods for environmental performance in the circular economy. Sustain. Prod. Consum. 2020, 26, 172–186. [Google Scholar] [CrossRef]
  25. Saidani, M.; Yannou, B.; Leroy, Y.; Cluzel, F.; Kendall, A. A taxonomy of circular economy indicators. J. Clean. Prod. 2019, 207, 542–559. [Google Scholar] [CrossRef] [Green Version]
  26. Yadav, G.; Mangla, S.K.; Bhattacharya, A.; Luthra, S. Exploring indicators of circular economy adoption framework through a hybrid decision support approach. J. Clean. Prod. 2020, 277, 124186. [Google Scholar] [CrossRef]
  27. Panigrahi, S.S.; Sahu, B. Analysis of interactions among the enablers of green supply chain management using interpretive structural modelling: An Indian perspective. Int. J. Comp. Manag. 2018, 1, 377–399. [Google Scholar] [CrossRef]
  28. Bouzon, M.; Govindan, K.; Rodriguez, C.M.T. Reducing the extraction of minerals: Reverse logistics in the machinery manufacturing industry sector in Brazil using ISM approach. Resour. Policy 2015, 46, 27–36. [Google Scholar] [CrossRef]
  29. Nika, C.E.; Vasilaki, V.; Expósito, A.; Katsou, E. Water Cycle and Circular Economy: Developing a Circularity Assessment Framework for Complex Water Systems. Water Res. 2020, 187, 116423. [Google Scholar] [CrossRef] [PubMed]
  30. Sushil, S. Interpreting the Interpretive Structural Model. Glob. J. Flex. Syst. Manag. 2012, 13, 87–106. [Google Scholar] [CrossRef]
  31. Grima, N.; Corcoran, W.; Hill-James, C.; Langton, B.; Sommer, H.; Fisher, B. The importance of urban natural areas and urban ecosystem services during the COVID-19 pandemic. J. For. Res. 2020, 15, 553–567. [Google Scholar] [CrossRef]
  32. Bratman, G.N.; Anderson, C.B.; Berman, M.G.; Cochran, B.; de Vries, S.; Flanders, J.; Folke, C.; Frumkin, H.; Gross, J.J.; Hartig, T.; et al. Nature and mental health: An ecosystem service perspective. Sci. Adv. 2019, 5, eaax0903. [Google Scholar] [CrossRef] [PubMed] [Green Version]
  33. Bratman, G.N.; Hamilton, J.P.; Daily, G.C. The impacts of nature experience on human cognitive function and mental health. Ann. N. Y. Acad. Sci. 2012, 1249, 118–136. [Google Scholar] [CrossRef] [PubMed]
  34. Eigenschenk, B.; Thomann, A.; McClure, M.; Davies, L.; Gregory, M.; Dettweiler, U.; Inglés, E. Benefits of outdoor sports for society. A systematic literature review and reflections on evidence. Int. J. Environ. Res. Public Health 2019, 16, 937. [Google Scholar] [CrossRef] [Green Version]
  35. Takano, T.; Nakamura, K.; Watanabe, M. Urban residential environments and senior citizens’ longevity in megacity areas: The importance of walkable green spaces. J. Epidemiol. Community Health 2002, 56, 913–918. [Google Scholar] [CrossRef] [Green Version]
  36. Hartig, T.; Mitchell, R.; de Vries, S.; Frumkin, H. Nature and Health. Annu. Rev. Public Health 2014, 35, 207–228. [Google Scholar] [CrossRef] [PubMed] [Green Version]
  37. Kuo, F.E.; Sullivan, W.C. Aggression and Violence in the Inner City: Effects of Environment via Mental Fatigue. Environ. Behav. 2001, 33, 543–571. [Google Scholar] [CrossRef]
  38. Kaplan, R. The Nature of the View from Home: Psychological Benefits. Environ. Behav. 2001, 33, 507–542. [Google Scholar] [CrossRef]
  39. Rockström, J.; Steffen, W.; Noone, K.; Persson, Å.; Chapin, F.S.; Lambin, E.F.; Lenton, T.M.; Scheffer, M.; Folke, C.; Schellnhuber, H.J.; et al. A safe operating space for humanity. Nature 2009, 461, 472–475. [Google Scholar] [CrossRef]
  40. Dearing, J.A.; Wang, R.; Zhang, K.; Dyke, J.G.; Haberl, H.; Hossain, M.d.S.; Langdon, P.G.; Lenton, T.M.; Raworth, K.; Brown, S.; et al. Safe and just operating spaces for regional social-ecological systems. Glob. Environ. Chang. 2014, 28, 227–238. [Google Scholar] [CrossRef] [Green Version]
  41. Nika, C.E.; Gusmaroli, L.; Ghafourian, M.; Atanasova, N.; Buttiglieri, G.; Katsou, E. Nature-based solutions as enablers of circularity in water systems: A review on assessment methodologies, tools and indicators. Water Res. 2020, 183, 115988. [Google Scholar] [CrossRef]
  42. Renouf, M.A.; Serrao-Neumann, S.; Kenway, S.J.; Morgan, E.A.; Choy, D.L. Urban water metabolism indicators derived from a water mass balance—Bridging the gap between visions and performance assessment of urban water resource management. Water Res. 2017, 122, 669–677. [Google Scholar] [CrossRef] [PubMed] [Green Version]
  43. Doran, J.W.; Zeiss, M.R. Soil health and sustainability: Managing the biotic component of soil quality. Appl. Soil Ecol. 2000, 15, 3–11. [Google Scholar] [CrossRef] [Green Version]
  44. World Economic Forum. The Global Risks Report 2020. Available online: https://www.weforum.org/reports/the-global-risks-report-2020 (accessed on 25 May 2021).
  45. WWF. Living Planet Report 2020—Bending the Curve of Biodiversity Loss; Almond, R.E.A., Grooten, M., Petersen, T., Eds.; WWF: Gland, Switzerland, 2020. [Google Scholar]
  46. Uhel, R.; Spyropoulou, R.; Breton, F.; Beltrame, C.; Arévalo, J.; Richard, D.; Gómez-Baggethun, E.; Martín-López, B.; Lomas, P.; Tomas, P.; et al. Ecosystem Accounting and the Cost of Biodiversity Losses: The Case of Costal Mediterranean Wetlands; European Environmental Agency: Copenhagen, Denmark, 2010; p. 92. [Google Scholar] [CrossRef]
  47. Enel, S.P.A. CirculAbility Model. Available online: https://corporate.enel.it/en/circular-economy-sustainable-future/performance-indicators (accessed on 18 May 2021).
  48. WBCSD. Water Circularity Metric: Tool and Guidance Note; WBCSD: Geneva, Switzerland, 2021; Available online: https://www.wbcsd.org/Programs/Food-and-Nature/Water/Resources/Water-Circularity-Metric-Tool-and-guidance-note (accessed on 18 May 2021).
  49. Walker, R.V.; Jiang, F.; Osidele, O.O.; Beck, M.B. Eco-effectiveness, eco-efficiency, and the metabolism of a city: A multi-sectoral analysis. In Proceedings of the IEEE International Conference on Systems, Man and Cybernetics, San Antonio, TX, USA, 11–14 October 2009; pp. 1470–1475. [Google Scholar] [CrossRef]
  50. Patton, M.Q. Qualitative Research & Evaluation Methods: Integrating Theory and Practice; Sage publications: Thousand Oaks, CA, USA, 2014. [Google Scholar]
  51. Creswell, J.W.; Clark, V.L.P. Designing and Conducting Mixed Methods Research; Sage publications: Thousand Oaks, CA, USA, 2011. [Google Scholar]
  52. Palinkas, L.A.; Horwitz, S.M.; Green, C.A.; Wisdom, J.P.; Duan, N.; Hoagwood, K. Purposeful sampling for qualitative data collection and analysis in mixed method implementation research. Adm. Policy Ment. Health 2015, 42, 533–544. [Google Scholar] [CrossRef] [PubMed] [Green Version]
  53. Sarabi, S.; Han, Q.; Romme, A.G.L.; de Vries, B.; Valkenburg, R.; den Ouden, E. Uptake and implementation of Nature-Based Solutions: An analysis of barriers using Interpretive Structural Modeling. J. Environ. Manag. 2020, 270, 110749. [Google Scholar] [CrossRef]
  54. Falck, W.E.; Spangenberg, J.H. Selection of social demand-based indicators: EO-based indicators for mining. J. Clean. Prod. 2014, 84, 193–203. [Google Scholar] [CrossRef]
  55. Mascarenhas, A.; Nunes, L.M.; Ramos, T.B. Selection of sustainability indicators for planning: Combining stakeholders’ participation and data reduction techniques. J. Clean. Prod. 2015, 92, 295–307. [Google Scholar] [CrossRef]
  56. Tseng, M.L. Modeling sustainable production indicators with linguistic preferences. J. Clean. Prod. 2013, 40, 46–56. [Google Scholar] [CrossRef]
  57. Amrina, E.; Yulianto, A.; Kamil, I. Fuzzy multi criteria approach for sustainable maintenance evaluation in rubber industry. Procedia Manuf. 2019, 33, 538–545. [Google Scholar] [CrossRef]
  58. Amrina, E.; Kamil, I.; Aridharma, D. Fuzzy Multi Criteria Approach for Sustainable Maintenance Performance Evaluation in Cement Industry. Procedia Manuf. 2020, 43, 674–681. [Google Scholar] [CrossRef]
  59. Gardas, B.; Raut, R.; Jagtap, A.H.; Narkhede, B. Exploring the key performance indicators of green supply chain management in agro-industry. J. Model. Manag. 2019, 4, 1. [Google Scholar] [CrossRef]
  60. Kalmykova, Y.; Sadagopan, M.; Rosado, L. Circular economy—From review of theories and practices to development of implementation tools. Resour. Conserv. Recycl. 2018, 135, 190–201. [Google Scholar] [CrossRef]
  61. Alessandrini, M.; Celotti, P.; Dallhammer, E.; Gorny, H.; Gramillano, A.; Schuh, B.; Zingaretti, C. Implementing a Place-Based Approach to EU Industrial Policy Strategy; European Committee of the Regions: Brussels, Belgium, 2019. [Google Scholar] [CrossRef]
  62. Miles, M.B.; Huberman, A.M. Qualitative Data Analysis: An Expanded Sourcebook; Sage Publications: Thousand Oaks, CA, USA, 1994; ISBN 0-8039-5540-5. [Google Scholar]
  63. Bidoglio, G.; Vanham, D.; Bouraoui, F.; Barchiesi, S. The Water-Energy-Food-Ecosystems (WEFE) Nexus. In Encyclopedia of Ecology, 2nd ed.; Fath, B., Ed.; Elsevier: Amsterdam, The Netherlands, 2019; Volume 4, pp. 459–466. [Google Scholar] [CrossRef]
  64. Malagó, A.; Comero, S.; Bouraoui, F.; Kazezyılmaz-Alhan, C.M.; Gawlik, B.M.; Easton, P.; Laspidou, C. An analytical framework to assess SDG targets within the context of WEFE nexus in the Mediterranean region. Resour. Conserv. Recycl. 2021, 164, 105205. [Google Scholar] [CrossRef]
  65. European Commission. Communication from the Commission “Action Plan: Financing Sustainable Growth”. Brussels, Belgium, 2018. Available online: https://eur-lex.europa.eu/legal-content/EN/TXT/?uri=CELEX:52018DC0097 (accessed on 25 May 2021).
  66. ARERA. Water: Tariff Methodology for 5th Regulatory Period (2020–2023, MTI-3). Available online: https://www.arera.it/it/index.htm (accessed on 25 May 2021).
Figure 1. Flow diagram for preparing ISM model.
Water 13 02198 g001
Figure 2. The six—level ISM model for interdependent CE indicators.
Water 13 02198 g002
Figure 3. MICMAC analysis.
Water 13 02198 g003
Table 1. Ranking of CPIs by industrial & academic stakeholders.
RankRanked Indicators for Circularity AssessmentAverage Value
1Total Waste Reduction (I1)2.76
2Circular Index (I2)2.72
3Revenues/Savings from Circularity Measures (I3)2.72
4Revenues/Savings due to Minimization of Negative Externalities (I4)2.67
5Circular Use (I5)2.65
6C balance (I6)2.60
7Circular Flow (I7)2.59
8Water Stress (I8)2.58
9Maximum Achievable Circularity (I9)2.50
10Regenerative Capacity (I10)2.44
11Product Index (I11)2.44
12Waste Index (I12)2.44
13Total Emissions Reduction (I13)2.42
14Qualitative Water Withdrawal Reduction (I14)2.39
15Revenues/Savings from Natural Capital Regeneration (I15)2.39
16Gross P & N balance (I16)2.31
17Gain/Loss of (Semi-)Natural Areas (I17)2.29
18Hydrological Performance (I18)2.26
19Soil Condition Improvement (I19)2.19
20Index of Biodiversity (I20)2.06
Colour labels: Yellow—CPIs for Design out negative externalities, Blue—CPIs for Keep resources in use, Green—CPIs for Regeneration of natural environment.
Table 2. Structural Self-Interaction Matrix.
CPIs1234567891011121314151617181920
1-OOOOVOVOOAAXVOVOOVV
2 -VOVOVOAXOOOOOOOOOO
3 -XOOOOOOOOOOOOOOOO
4 -OAOAOOOOOAXAAAAA
5 -OXOOOVVOOOOOOOO
6 -OOOAOOAOVOAOXX
7 -OOOVVOOOOOOOO
8 -OAOOAAVOAAAA
9 -XOOOOOOOOOO
10 -OOOVOVVVVV
11 -XVOOOOOOO
12 -VOOOOOOO
13 -VOVXOVV
14 -VAAOOV
15 -AAAAA
16 -AOXX
17 -AXX
18 -XX
19 -X
20 -
Table 3. Final Reachability Matrix.
CPIs1234567891011121314151617181920Driving Power
1101*1*01010000111*11*1*1113
21*111*11*11*1*11*1*1*1*1*1*1*1*1*1*20
3001100000000001*000003
4001100000000001000003
51*01*1*11*11*00111*1*1*1*1*1*1*1*17
61*01*10101*00001*1*11*1*1*1113
71*01*1*11*11*00111*1*1*1*1*1*1*1*17
8001*100010000001000004
91*11*1*1*1*1*1*111*1*1*1*1*1*1*1*1*1*20
101*11*1*1*11*1111*1*1*11*1111120
11101*1*01*01*001111*1*1*1*1*1*1*15
12101*1*01*01*001111*1*1*1*1*1*1*15
13101*1*01010000111*111*1113
141*01*101*0100001*111*1*1*1*113
15001*100000000001000003
161*01*101*01*00001*1111*1*1113
171*01*101010000111111*1113
181*01*101*0100001*1*11*111113
191*01*1010100001*1*11111113
201*01*1010100001*1*11111113
Dependence Power 163202051651733771616201616161616
1* Indicates the values that have changed compared to the initial reachability matrix.
Table 4. Importance levels of the indicators.
LevelCPIs
II3. Savings from circularity measures
I4. Savings due to minimization of negative externalities
I15. Savings from natural capital regeneration
III8. Water Stress
IIII1. Total Waste Reduction
I6. C Balance
I13. Total Emissions Reduction
I14. Qualitative Water Withdrawal Reduction
I16. Gross N & P Balance
I17. Gain/Loss of (Semi-)Natural Areas
I18. Hydrological Performance
I19. Soil Condition Improvement
I20. Index of Biodiversity
IVI12. Waste Index
I13. Product Index
VI5. Circular Use
I7. Circular Flow
VII2. Circular Index
I9. Maximum Achievable Circularity
I10. Regenerative Capacity
Publisher’s Note: MDPI stays neutral with regard to jurisdictional claims in published maps and institutional affiliations.

