
Evaluation of Rainfall-Triggered Debris Flows under the Impact of Extreme Events: A Chenyulan Watershed Case Study, Taiwan

1
Department of Hydraulic Engineering, Fujian College of Water Conservancy and Electric Power, Yongan 366000, China
2
Ecological Soil and Water Conservation Research Center, National Cheng Kung University, Tainan 70101, Taiwan
*
Author to whom correspondence should be addressed.
Water 2021, 13(16), 2201; https://doi.org/10.3390/w13162201
Submission received: 30 May 2021
/
Revised: 16 July 2021
/
Accepted: 5 August 2021
/
Published: 12 August 2021
(This article belongs to the Special Issue Natural Disasters Occurrence, Reduction, and Restoration in Mountain Regions)
Abstract
:This study examined the conditions that lead to debris flows, and their association with the rainfall return period (T) and the probability of debris flow occurrence (P) in the Chenyulan watershed, central Taiwan. Several extreme events have occurred in the Chenyulan watershed in the past, including the Chi-Chi earthquake and extreme rainfall events. The T for three rainfall indexes (i.e., the maximum hourly rainfall depth (Im), the maximum 24-h rainfall amount (Rd), and RI (RI = Im Rd)) were analyzed, and the T associated with the triggering of debris flows is presented. The P–T relationship can be determined using three indexes, Im, Rd, and RI; how it is affected and unaffected by extreme events was developed. Models for evaluating P using the three rainfall indexes were proposed and used to evaluate P between 2009 and 2020 (i.e., after the extreme rainfall event of Typhoon Morakot in 2009). The results of this study showed that the P‒T relationship, using the RI or Rd index, was reasonable for predicting the probability of debris flow occurrence.
1. Introduction
In recent years, the frequency and magnitude of disasters associated with climate extremes have increased [1,2,3,4,5,6]. Extreme rainfall has given rise to massive sediment transport in mountainous areas; in particular, debris flows have caused significant damage in many countries [7,8,9,10,11,12,13,14].
Studies of rainfall that triggers debris flows, for the purpose of issuing hazard warnings, have focused on empirical thresholds based on rain gauge observations [15]. The properties of cumulative rainfall depth, rainfall intensity, and rainfall duration have been widely used to develop an empirical threshold for triggering of debris flows [16,17,18,19,20,21]. However, debris flow initiation depends not only on local rainfall properties, but also on sediment availability in the catchment area and local terrain conditions, such as topography, lithology, and soil cover [15,18,22]. The sediment supply can change significantly after extreme events, such as a major earthquake and extreme rainfall, and the triggering threshold or critical rainfall for debris flow may change accordingly [23,24,25,26,27,28]. This leads to several uncertainties when determining rainfall thresholds, and makes debris flow monitoring and prediction a challenge [29,30]. However, most of the existing empirical models were developed for real-time warning or monitoring of debris flows. In the face of climate change and increasing extreme events, there are few studies on how to reflect the long-term variation in rainfall characteristics of a region (composed of multiple debris flow gullies, townships, and villages) and the impact of extreme rainfall events on debris flow monitoring. After extreme rainfall events, the rainfall conditions that can trigger a debris flow will change, and this unstable period lasts for several years [26,28]. Thus, it is necessary to establish an empirical model for critical rainfall which can be combined with the effects of long-term rainfall changes and extreme events (on an annual scale) for debris flow monitoring and prediction. There are many rainfall indexes, such as cumulative rainfall depth and rainfall intensity, which researchers have used to develop empirical models of critical rainfall. This study aims to integrate these rainfall indicators and establish a model for evaluation of the probability of debris flow occurrence.
The Chenyulan watershed, located in central Taiwan, has experienced extreme events including the Chi-Chi earthquake (CCE) and extreme rainfall, and was therefore selected as the study area. The conditions that lead to debris flows, and their association with the rainfall return period (T) and the probability of debris flow occurrence (P), were examined. This study had two main purposes: (1) to develop an empirical model for how the P‒T relationship was affected by extreme rainfall and the CCE, using different rainfall indexes, and (2) to apply the P–T relationship to evaluate P after the recent extreme event of Typhoon Morakot.
2. Study Area and Extreme Events
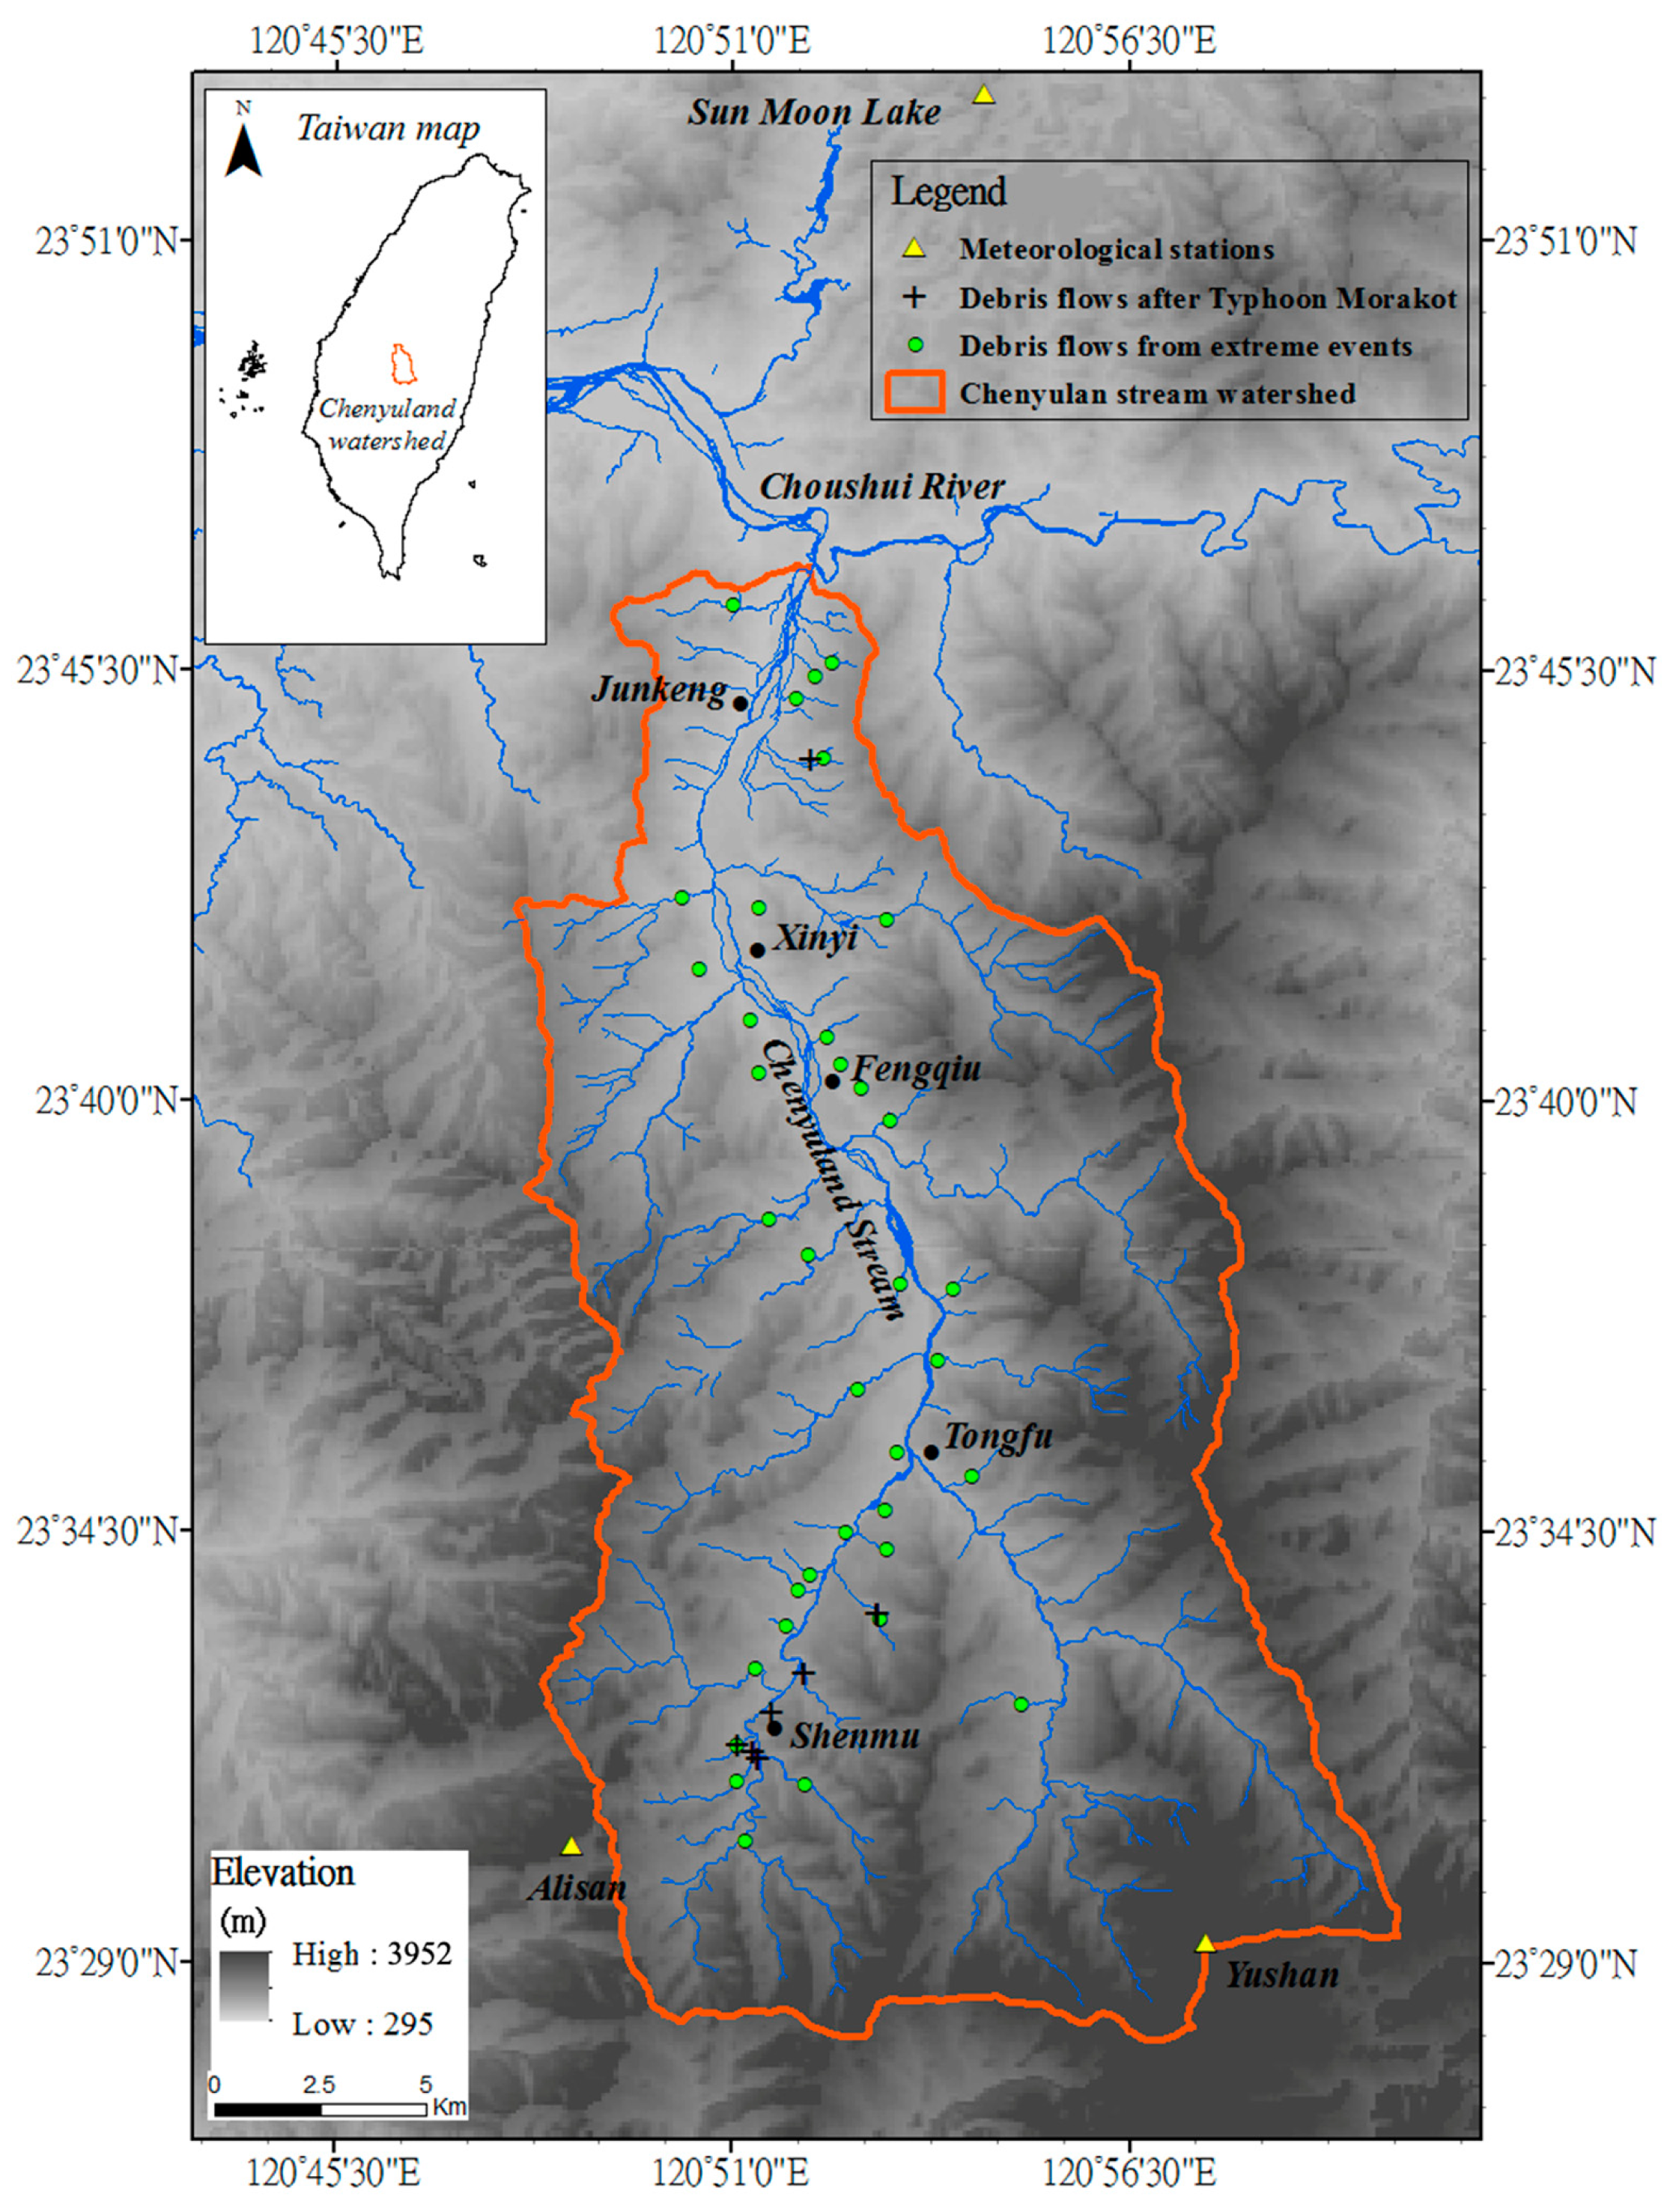
The study area was the Chenyulan watershed (from 23°24′30″–23°53′30″ N latitude and 120°42′10″–121°02′30″ E longitude) in central Taiwan, as shown in Figure 1. This area is conducive to the study of debris flows caused by extreme events owing to its weak geological characteristics (many faults accompanied by fracture zones; enormous landslides and an abundant source of rock debris [31]), abundant rainfall (the average annual rainfall in the watershed is approximately 3500 mm), as well as the occurrence of the Chi-Chi earthquake (a moment magnitude of MW 7.6, in 1999) [25,32] and many other extreme events [26,28]. Thus, many studies associated with landslides and debris flows have been conducted in this watershed [25,26,28,32].
Extreme rainfall events in Taiwan have not yet been clearly defined; however, they generally can be considered as rainfall events with accumulated rainfall (R) > 130 mm within 3 h, R > 200 mm within 6 h, or R > 350 mm within 24 h [33]. The rainfall index (RI) is defined as the product of the maximum hourly rainfall depth Im and the maximum 24-h rainfall amount Rd (i.e., RI = Rd × Im). Extreme rainfall events with an RI of >365 cm2/h have triggered multiple debris flows in the Chenyulan watershed [26]. The five most extreme rainfall events in the Chenyulan watershed were Typhoon Herb (TH) in 1996, Typhoon Toraji (TT) in 2001, Typhoon Mindulle (TMi) in 2004, a heavy rainstorm (HR) in 2006, and Typhoon Morakot (TM) in 2009.
3. Debris Flow Occurrence Associated with Rainfall Return Period
As shown in Figure 1, there are three meteorological stations in the study area, namely Sun Moon Lake, Yushan, and Alisan, which have recorded long-term hourly rainfall since 1963. The hourly rainfall recorded from the three meteorological stations was used to determine the representative rainfall for the Chenyulan watershed, which is the regional or average rainfall for the entire watershed. The regional hourly rainfall in the Chenyulan watershed can be determined [6] using the following equation:
where I1, I2, and I3 represent the hourly rainfall records from the Sun Moon Lake, Yushan, and Alisan meteorological stations, respectively. Equation (1) calculates the areal average rainfall at the centroid of the Chenyulan watershed area, using the reciprocal-distance-squared method [34]; the weighting factors in Equation (1) represent a distance function, being inversely proportional to the square of the distance measured between the meteorological station and the centroid point. The reciprocal-distance-squared method may not actually reflect the rainfall characteristics at specific locations where local rainfall varied significantly due to elevation changes [6]. Although the different locations of meteorological stations may influence the average rainfall result, this is a simple method which can be used to directly compute the regional average rainfall characteristics of a watershed [6]. Moreover, Equation (1) can easily represent the long term variation trend in the Chenyulan watershed [6] and it was therefore used to determine the regional hourly rainfall in this study. However, it should be noted that the estimated average rainfall contains high uncertainty. Thus, three rainfall indexes, described in Section 3.1, and the probability concept were introduced in this study in the analysis of debris flow occurrence. Rainfall events in this study were identified by the following criteria: a rainfall event occurred when the hourly rainfall depth was >4 mm and ended when this value remained at <4 mm continuously for 6 h. These criteria have generally been used in official Taiwanese warning models to identify rainfall events that trigger debris flows [35].
I = 0.099I1 + 0.387I2 + 0.514I3
3.1. Rainfall Return Period
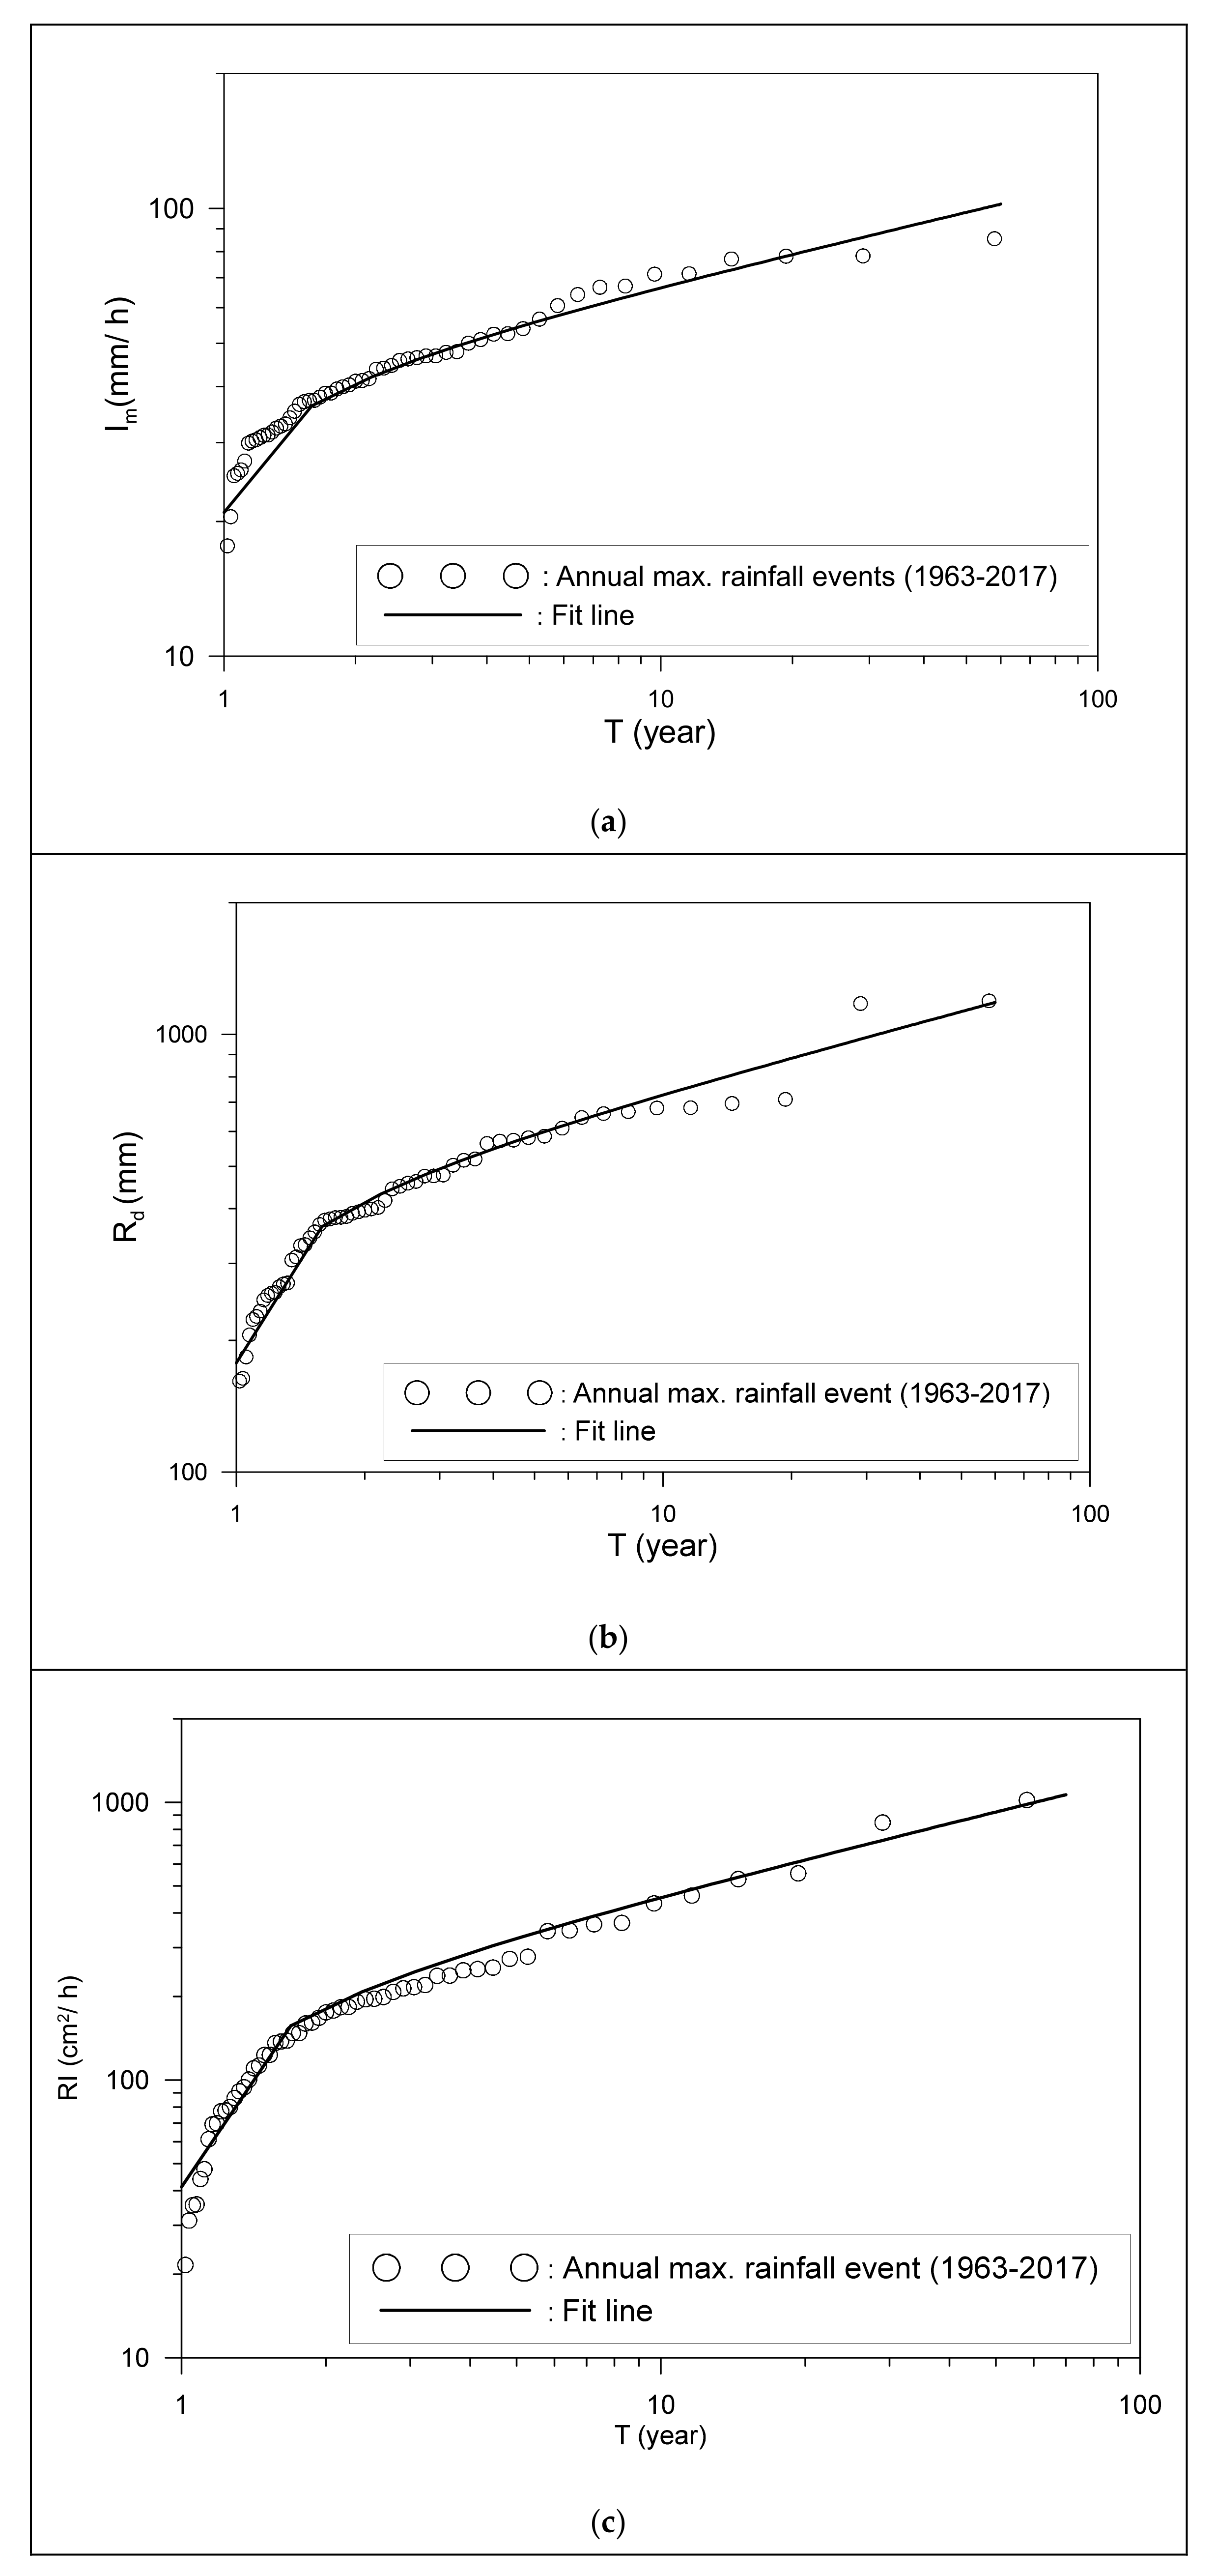
Three rainfall indexes associated with debris flow occurrence, Im, Rd, and RI, have been proposed and discussed by [26,28], and were used to analyze T in the Chenyulan watershed. The rainfall return period can be evaluated using many methods, such as the Weibull, Jenkinson, and Gringorten formulae, various computational methods, and the modified Gumbel method [34]. The Weibull formula was used in this study because it is the most efficient and commonly used for most sample data [36]; moreover, it can predict rainfall events with much shorter return periods than the other methods [37]. T can be estimated using the Weibull formula:
where n refers to the number of years in the record and m is the rank of the observed rainfall value in a list arranged in descending order. The rainfall index of the annual maximum series collected in the Chenyulan watershed between 1963–2017 (with the exception of 1964; no rainfall record) was used to determine T using Equation (2). A total of 53 years of rainfall index data (Im, Rd, or RI) and T are shown in Figure 2. The relationship between the rainfall index and T can be expressed in the following form:
where xi is the variable of the rainfall index (i.e., Im, Rd, or RI); and a, b, and c are empirical coefficients, which can be determined by regression analysis based on xi and T data. Table 1 lists the empirical coefficients a, b, and c, and the coefficient of determination R2 for rainfall indices Im, Rd, and RI. All rainfall indexes have high R2 to T.
T = (n+1) / m
xi = a (T − b) c
or T = (xi / a)1/c + b
Equations (3) and (4) represent the long-term rainfall characteristics of the Chenyulan watershed. The return period for the critical rainfall needed to trigger a debris flow can be determined using Equation (4). The xi ‒ T relationship (Equations (3) or (4)) was developed based on 54 years of data, and the annual maximum xi was selected. Thus, the optimal range for T was 1–54 years.
3.2. Debris Flow Events Related to the Rainfall Return Period
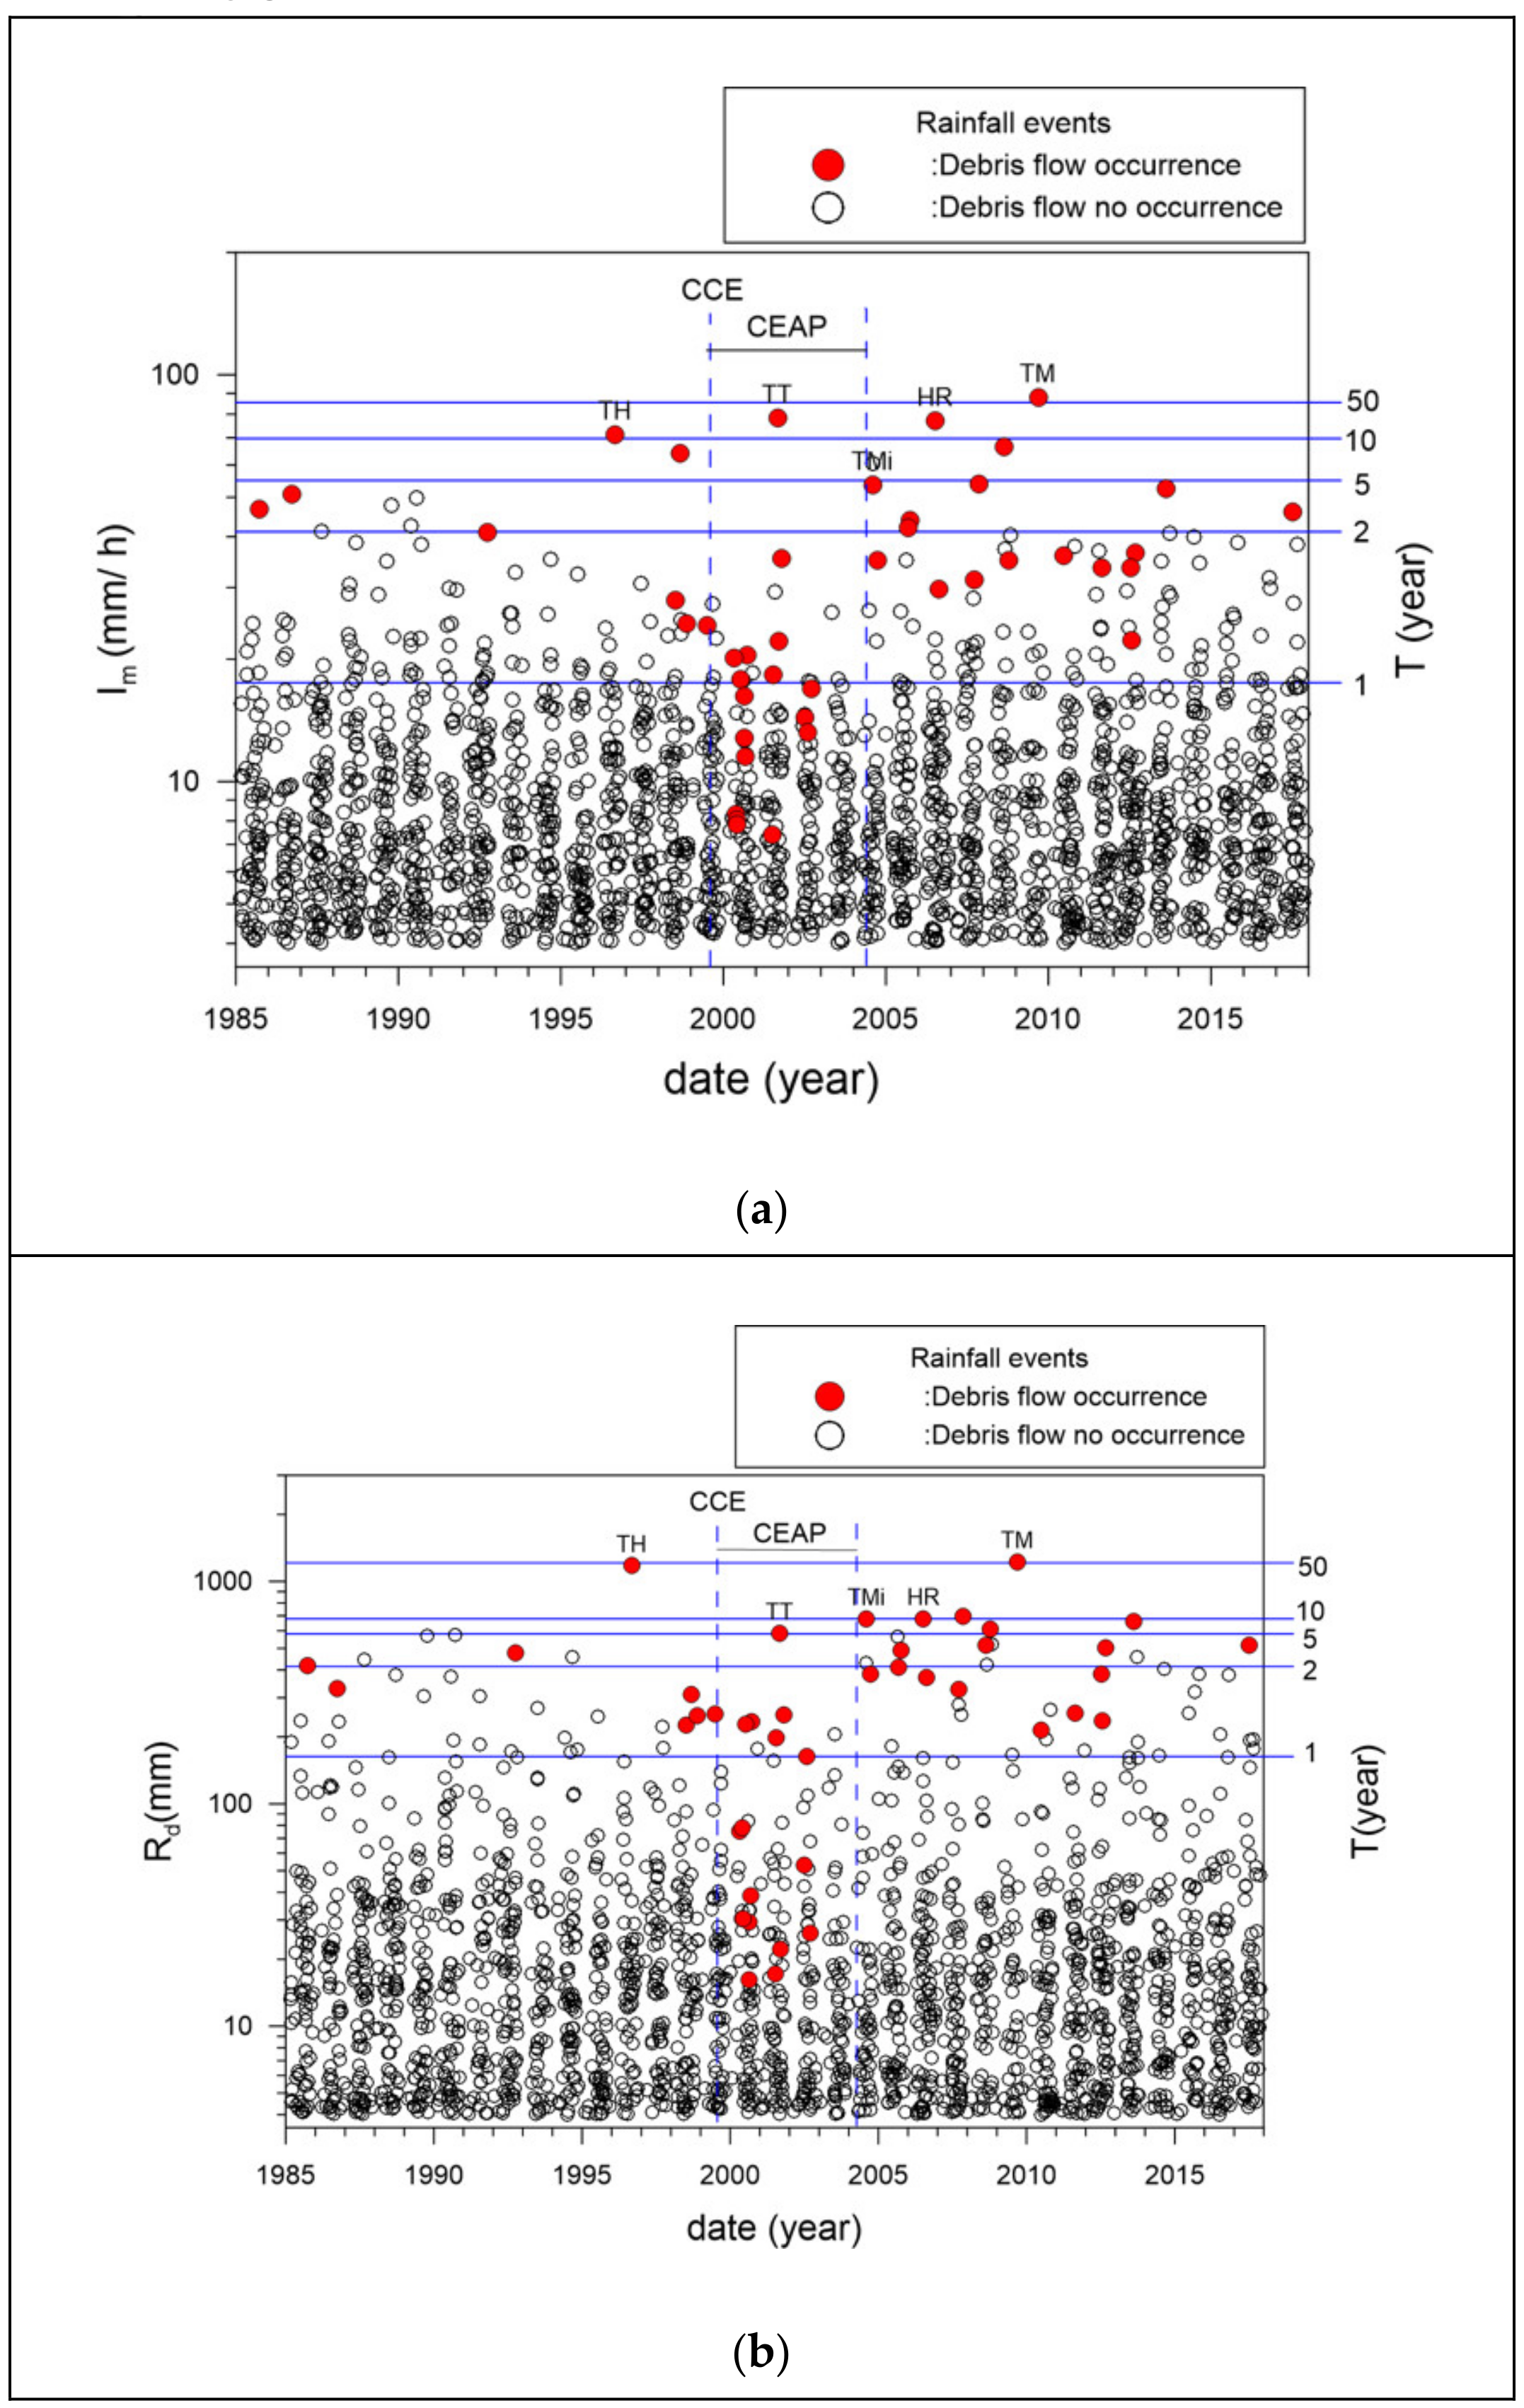
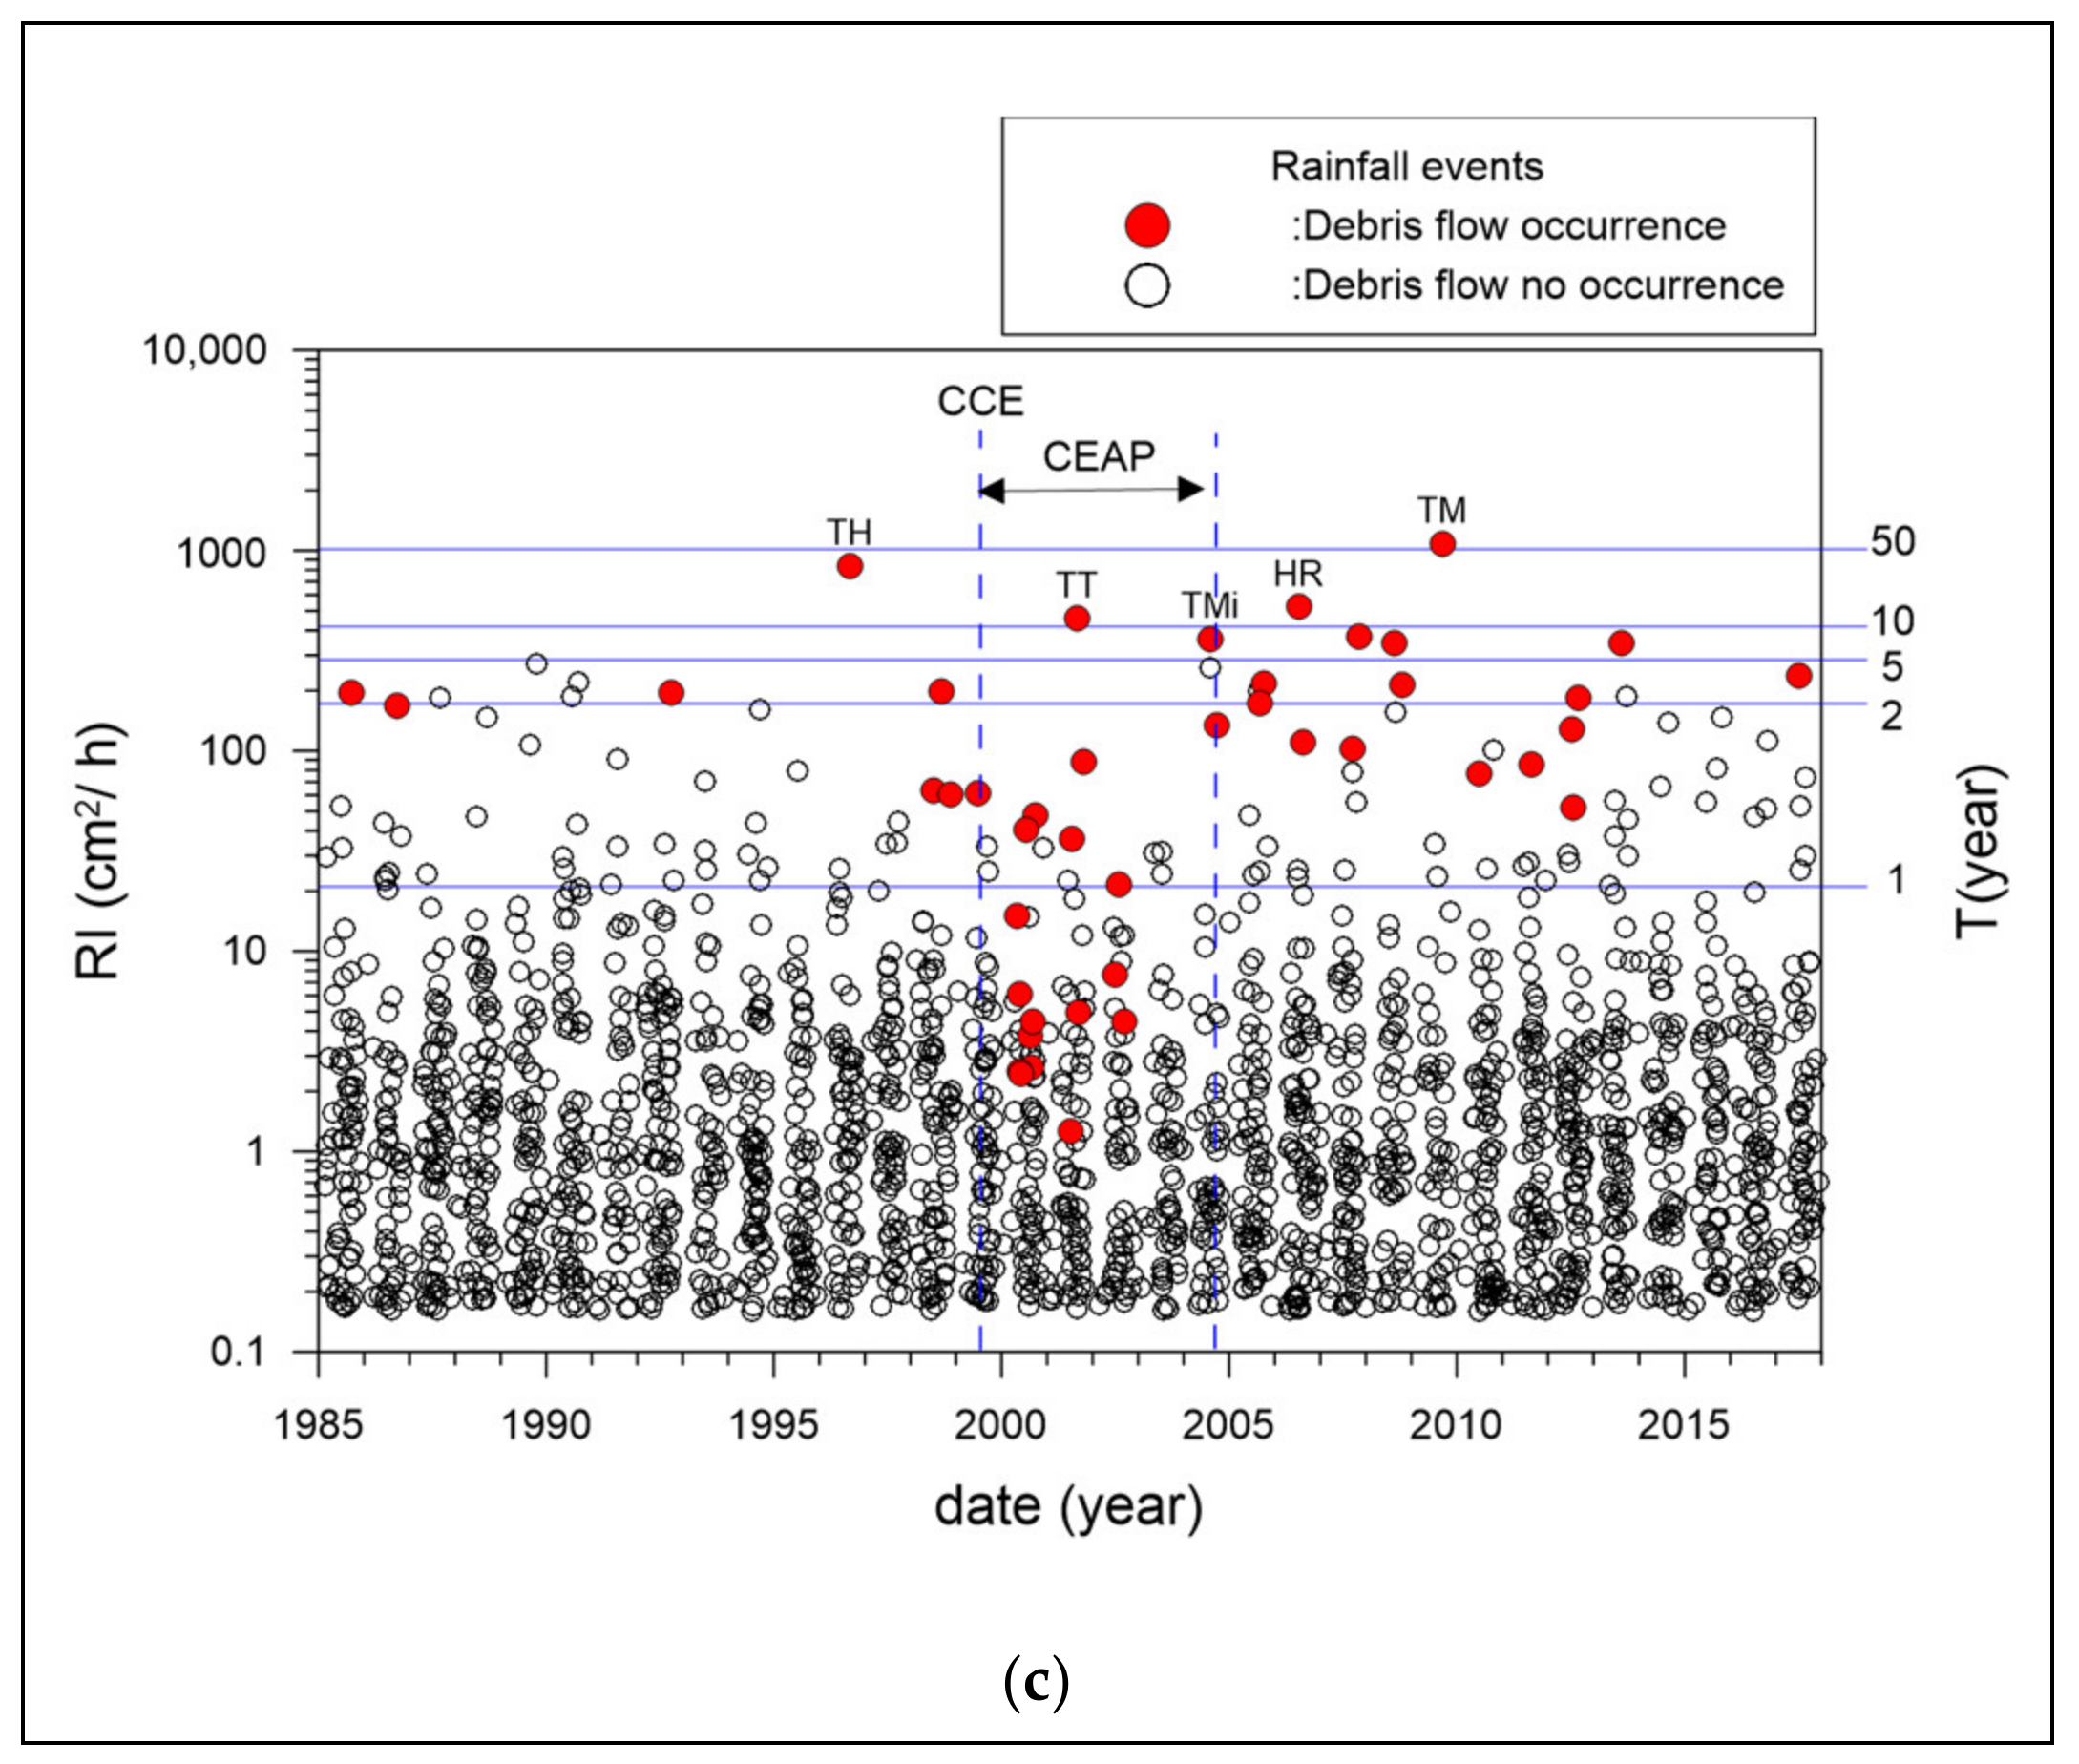
There are no field investigation data or scientific reports on debris flows in the Chenyulan watershed prior to 1985; therefore, debris flow events prior to 1985 were not considered in the analysis of P. Figure 3 shows rainfall events, using the rainfall indices of Im, Rd, or RI, and rainfall-triggered debris flow events between 1985–2017. The blue lines in Figure 3 indicate various return periods (T), corresponding to three rainfall indies (Im, Rd, or RI), which were determined by Equation (3). Data on debris flow events triggered by the five extreme rainfall events (TMi, TT, HR, TH, and TM) and the CCE are also shown in Figure 3.
The extreme rainfall events that triggered numerous debris flows had T values > 5 years. Within approximately 5 years of the CCE, debris flows could be triggered at lower Im, Rd, or RI values, corresponding to rainfall events with lower T values. After the CCE, the critical rainfall for debris flows decreased significantly, and the critical rainfall returned to the pre-earthquake level within approximately 5 years of the earthquake. This result is consistent with those of previous studies [25,26,28]. In this paper, the period encompassing approximately 5 years after CCE is referred to as the CCE-affected period (CEAP) and is shown in Figure 3. After the CCE, debris flows could be triggered at low RI values with a T of <1 year, which was much smaller than after the other extreme rainfall events. Excluding debris flow events in the CEAP, the majority of debris flow events occurred with T > 1 year. Many rainfall-triggered debris flow events coincided with maximum annual Im, Rd, or RI values.
4. Models for Evaluating Probability of Debris Flow Occurrence
The rainfall return period T is the average interval in years between events equaling or exceeding a certain magnitude and represents the long-term rainfall characteristics of an area. The probability of debris flow occurrence P considers rainfall events that do not trigger debris flow and represents the uncertainty of debris flow occurrence. The development of an empirical model for the relationship between P and T is presented in this section.
4.1. Probability of Debris Flow Occurrence (P)
Debris flow initiation depends on local rainfall properties, sediment availability, lithology, topography, and soil cover. These properties have a nonuniform spatial distribution and may lead to uncertainty in the evaluation of debris flow occurrence. The average hourly rainfall in the study area was obtained from the long-term rain records of the three meteorological stations. The rainfall was assumed to have a uniform distribution. The benefits of ignoring the spatial variability of hydrogeological properties are as follows: (1) more debris flow events can be identified and analyzed over the whole watershed, and (2) it assists in determining the long-term rainfall characteristics (or T) associated with the triggering of debris flows. However, ignoring spatial distribution characteristics can result in uncertainties. Thus, to reflect the resulting uncertainty, the probability concept was introduced in this study to analyze the probability of a rainfall event that triggered one or more debris flows in the entire watershed.
The P at a rainfall threshold of xi is referred to as the probability that one or more debris flows are triggered when the rainfall amount is > xi. P can be calculated using the following equation:
where NR is the number of rainfall events for rainfall amounts > xi. ND is the number of those rainfall events that triggered debris flows. P is then determined at various rainfall thresholds xi, from the maximum annual Im, Rd, or RI or their corresponding T values. For example, if there were eight rainfall events and all of them triggered debris flows when RI > 285 cm2/h or T > 5 years (see Figure 3c), thus, ND = NR = 8 and P = 1.
P = ND/NR
4.2. Relationship between Probability of Debris Flow Occurrence (P) and Rainfall Return Period (T)
After obtaining datasets for the historical maximum annual Im, Rd, or RI and their corresponding T, the empirical relationships between P and T can be determined for Im, Rd, or RI at different periods.
Several extreme events occurred in the Chenyulan watershed during the study period, such as the CCE and five extreme rainfall events. The critical rainfall for debris flows drops significantly after extreme events [25,26,28]; however, it does recover within a certain period thereafter. Thus, periods affected by the CCE and extreme rainfall events were separated in this analysis. The CEAP in the Chenyulan watershed was defined as the 5 years after the CCE [23,32]. The maximum recovery period of critical rainfall is approximately 3 years after extreme rainfall [28]. Rainfall events occurring within the 3 years after extreme rainfall events, were selected to determine the relationship between P and T during the extreme rainfall-affected period (ERAP). Such events included the rainfall events for 3 years after Typhoon Herb and Typhoon Morakot, 2 years after the heavy rainstorm in 2006, and 1 year after Typhoon Mindulle.
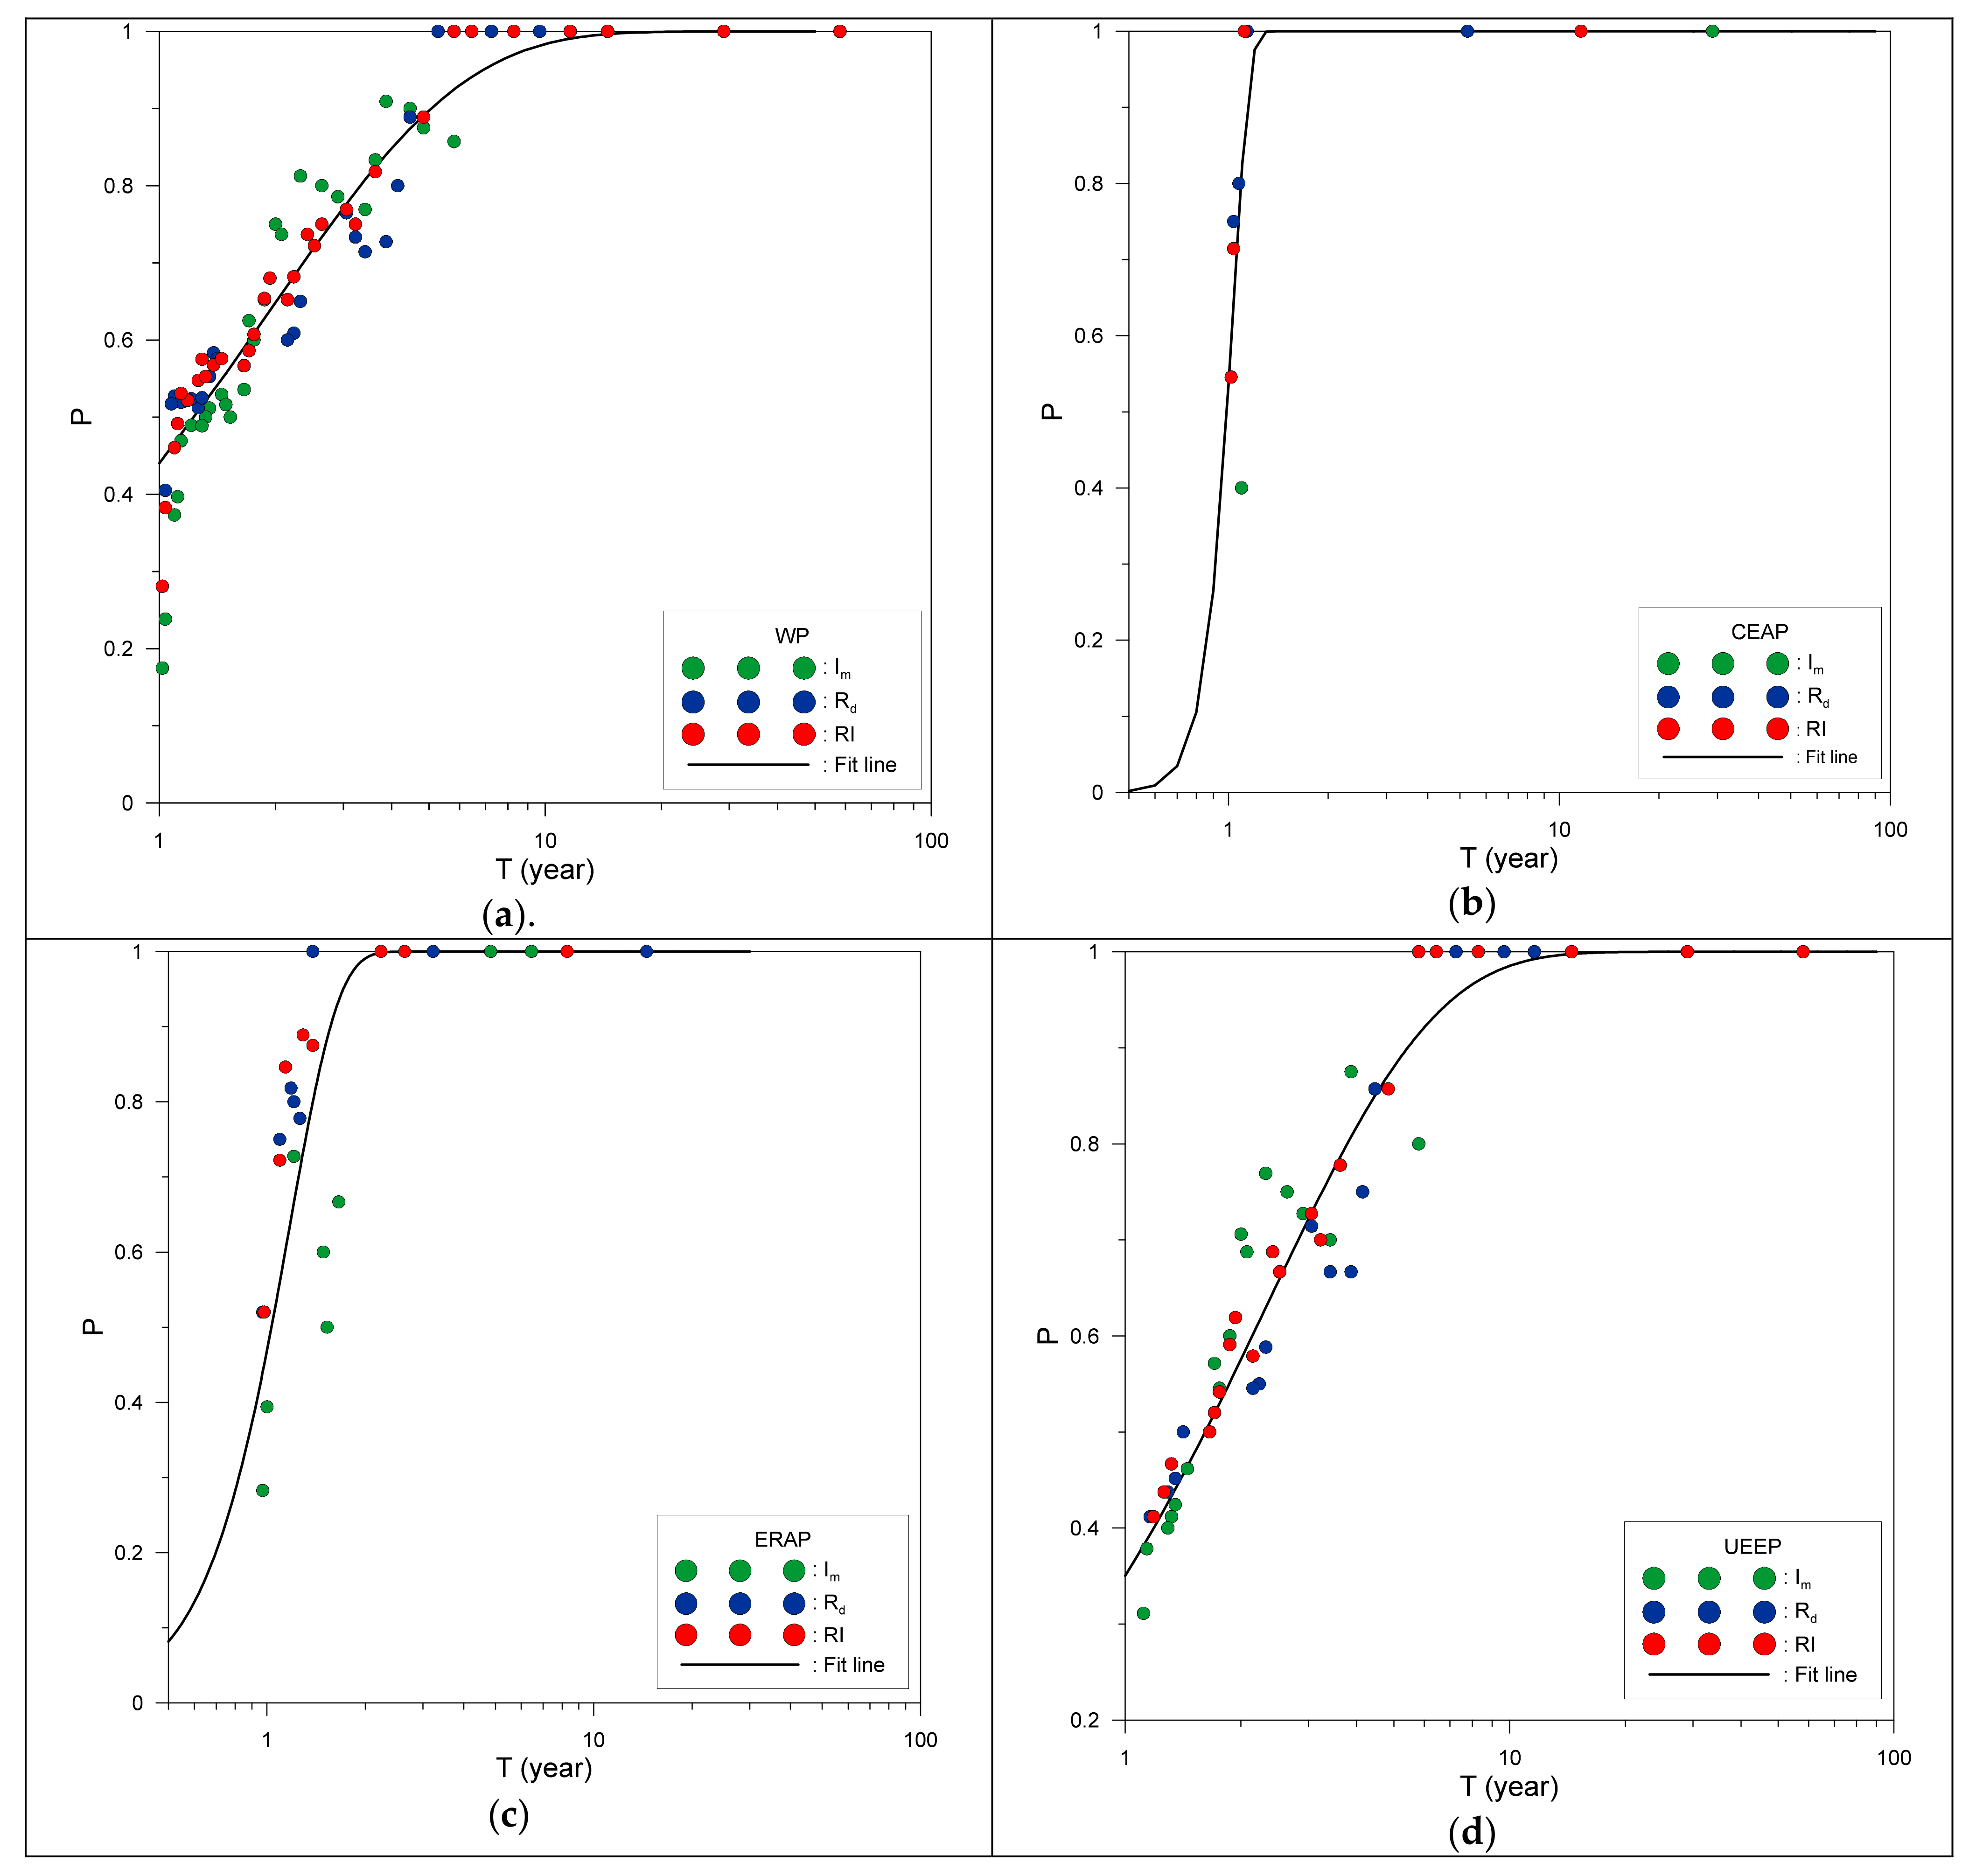
Furthermore, the relationship between P and T for the whole period (WP) between 1985–2017 and the unaffected by extreme events period (UEEP) (i.e., the WP excluding CEAP and ERAP) can also be developed. The four periods (i.e., WP, CEAP, ERAP, and UEAP) and their analysis range of rainfall events are summarized and listed in Table 2. Figure 4 shows the relationships between P and T during WP, CEAP, ERAP, and UEEP. Whether using Im, Rd, or RI indices, the data describing the relationship between P and T showed a similar distribution in all periods. The P‒T relationship can be expressed in the form of a Weibull distribution, i.e.;
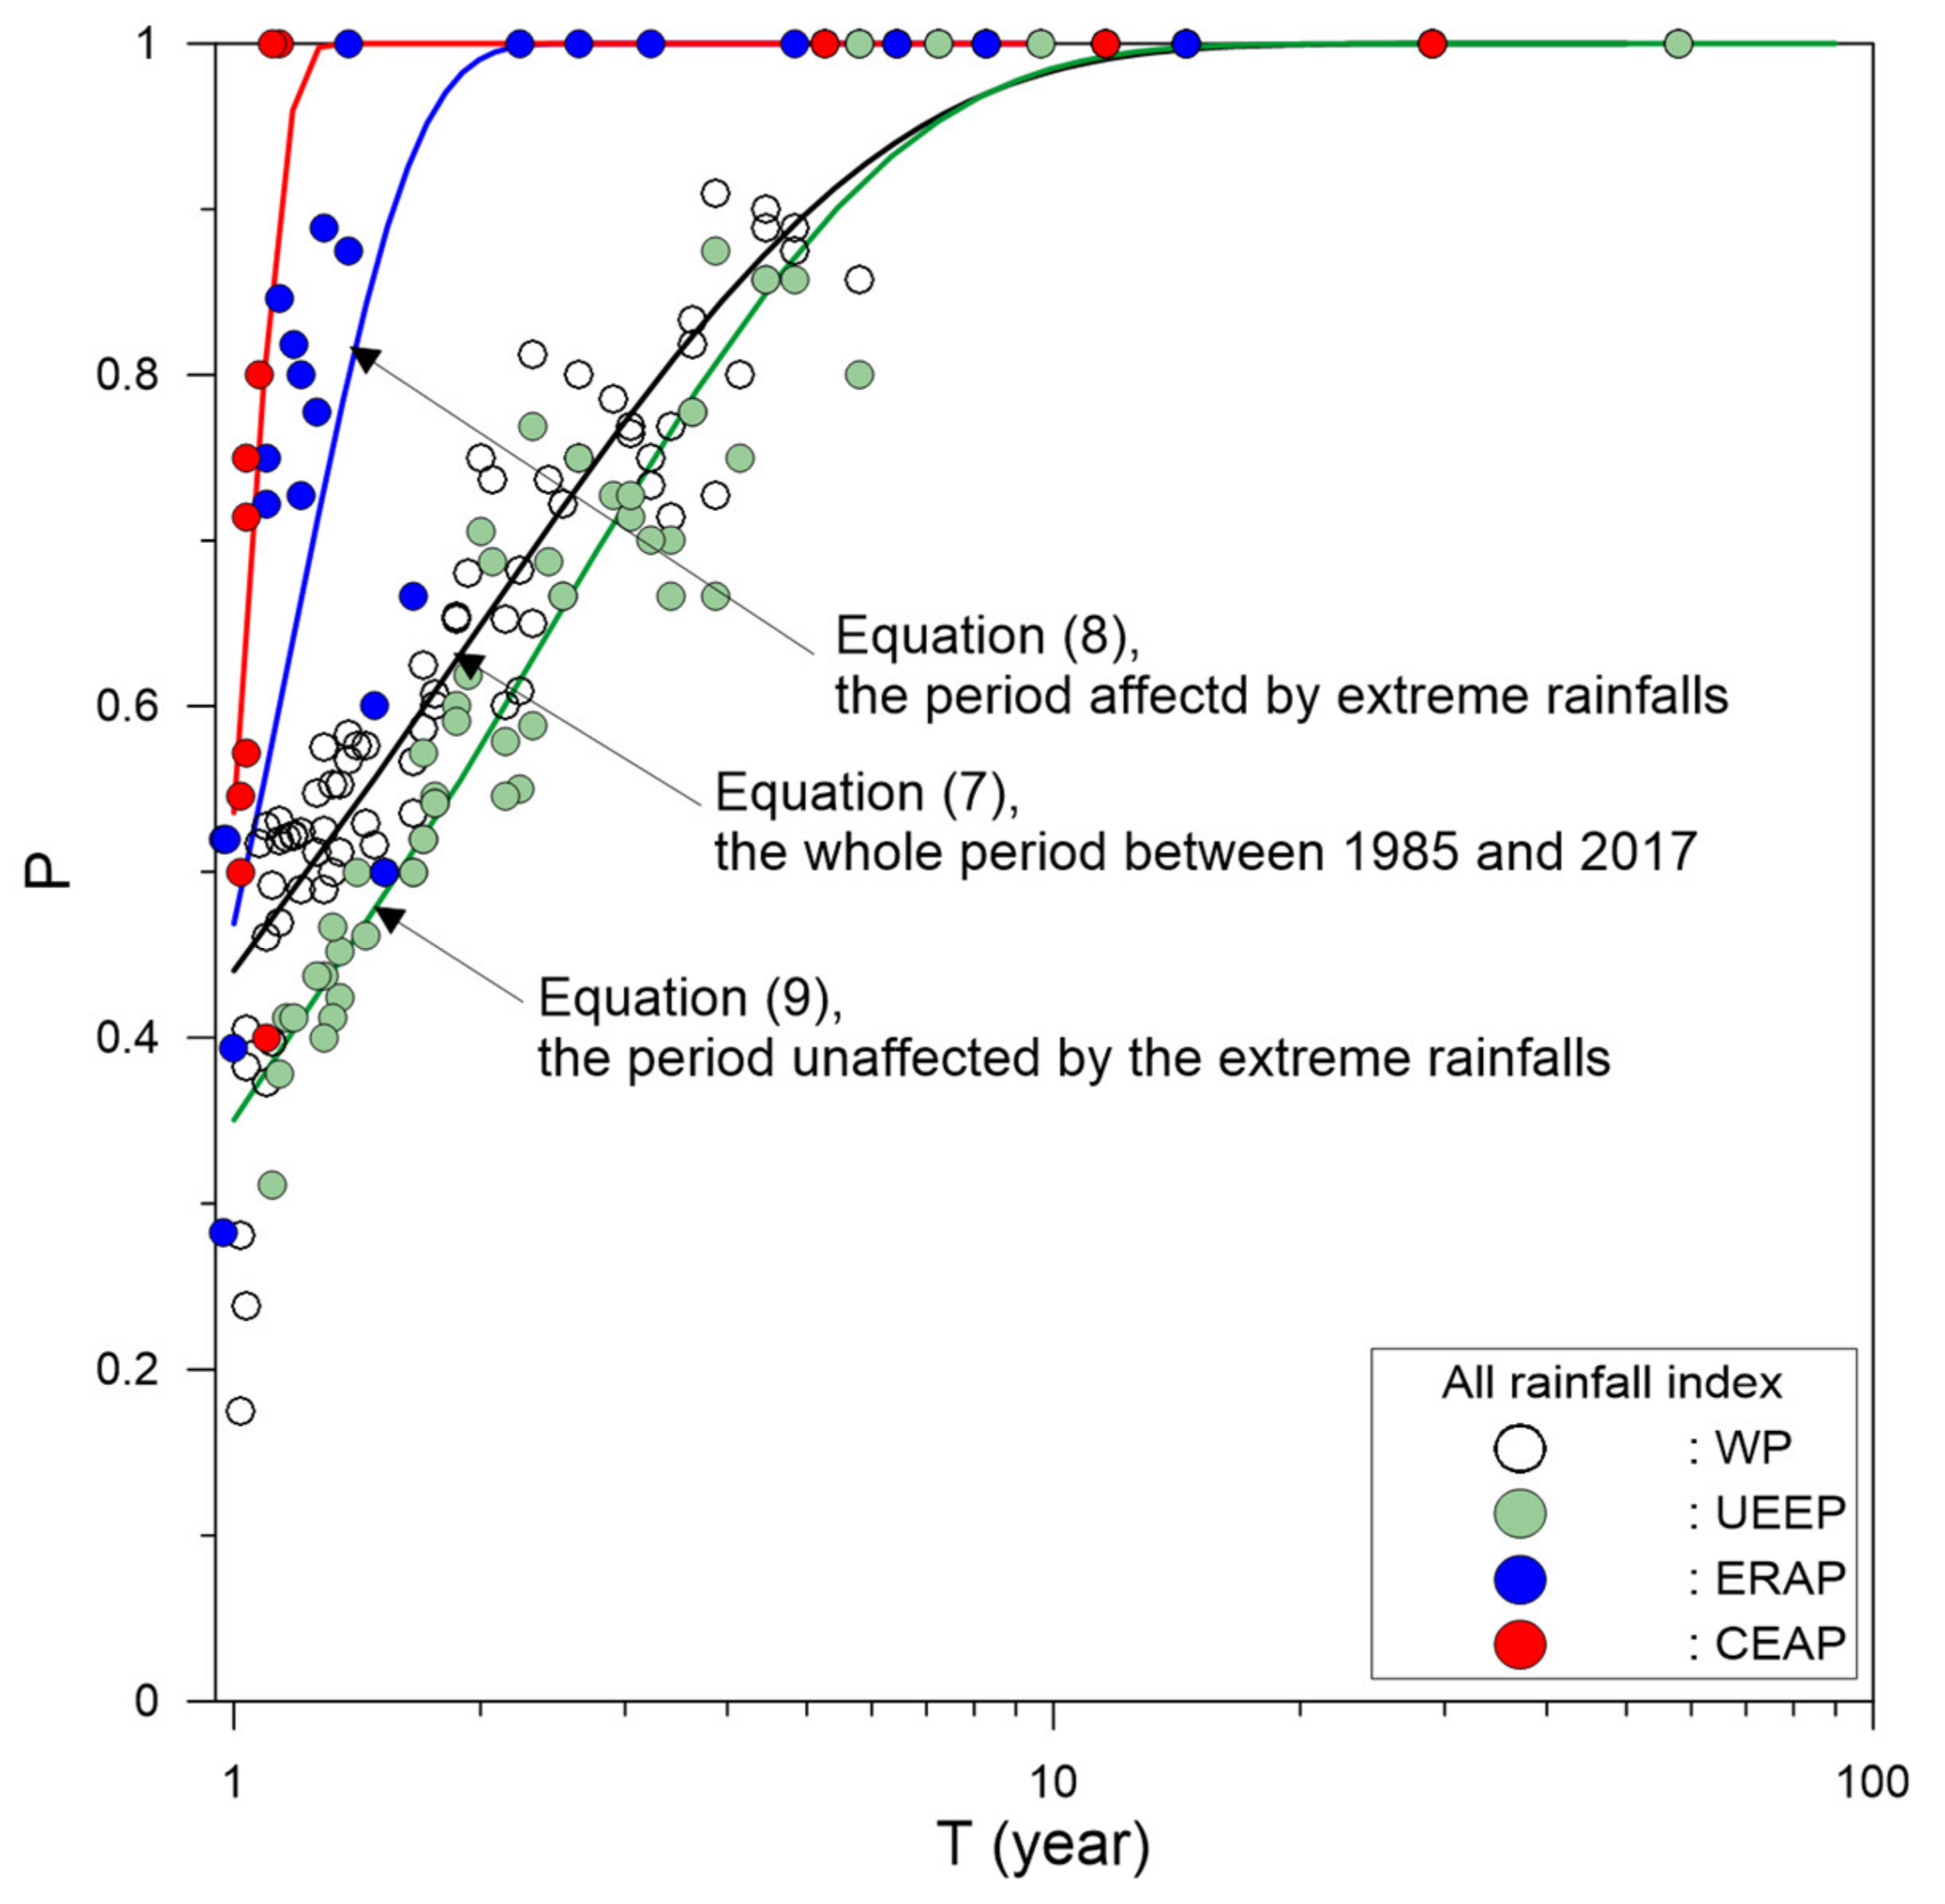
The empirical coefficients , and for the four periods were determined by fitting the given data and are listed in Table 2. The P–T relationship models of the four periods are compared in Figure 5. The WP model used long-term data between 1985–2017, and also included data that were affected by extreme events, that is, five extreme rainfall events and the CCE. The UEEP model excluded the influence of extreme events, and the P value predicted by the UEEP model was slightly smaller than that predicted by the WP model at the same T. Compared to the UEEP model, P increased significantly after an extreme rainfall event or the CCE, under the same rainfall conditions or at the same T. In particular, the P value affected by the CCE was markedly higher than that affected by extreme rainfall.
The benefits of determining the P–T relationship (Figure 5) are as follows: (1) all rainfall indexes can be integrated by the P–T relationship, and (2) the P values during periods affected by the CCE or extreme rainfall can be evaluated at various T values (or different rainfall conditions). For example, P is 48% at T = 1.5, when the area of the Chenyulan watershed is unaffected by extreme events (see light green curve in Figure 5), whereas P increases to 87% after an extreme rainfall event (see blue curve in Figure 5), and P = 100% after the CCE (see red curve in Figure 5). When affected by the CCE, the P value can reach up to approximately twice that of a period unaffected by extreme events, and P during a period affected by the extreme rainfall events can be approximately 80% higher than during a period unaffected by extreme events at the same T.
5. Discussion
The heavy rainfall caused by Typhoon Morakot in August 2009 was one of the extreme rainfall events in the Chenyulan watershed and had an Im of 85.5 mm, Rd of 1192.6 mm, and RI = 1019.7 cm2/h. It caused numerous debris flows that buried more than 20 houses in Shenmu, Tongfu, and Xinyi villages. After Typhoon Morakot, there were seven debris flow events triggered by rainstorms or typhoons between 2009–2020, as shown in Table 3. The relationship between P and T was used to evaluate P after the rainfall events of Typhoon Morakot.
5.1. Procedures
The empirical model for evaluating P was applied through the following steps:
- The hourly rainfall data from three metrological stations was input and the regional hourly rainfall was evaluated using Equation (1).
- Im, Rd, and RI were determined from regional rainfall data.
- T was determined using Equation (4) with Im, Rd, or RI.
- P was determined using the P–T relationship. There are three P–T relationships with different empirical coefficients based on various periods (Equation (6) and Table 2).
That is, the P–T relationship of the WP is:
the P–T relationship of the ERAP is:
and the P–T relationship of the UEEP is:
where T can be determined using Equation (4). The coefficients in Equation (4) depend on the parameters Im, Rd, or RI, i.e., T = (Im/40)4.35 + 0.94, T = (Rd/410)3.85 + 0.96, and T = (RI/180)2.38 + 0.97. P can be determined when Im, Rd, or RI is given according to Equations (7), (8) or (9).
However, the three equations were developed based on different periods and datasets, and the valid conditions for the three equations may not be identical.
Equation (7) predominantly reflects the long-term characteristics of debris flow occurrence and may not reflect the short-term characteristics caused by extreme events. In contrast, Equation (8) focuses on the influence of extreme rainfall events. Equation (9) reflects P during periods that are unaffected by extreme events, such as significant earthquakes and extreme rainfall. Hence, field data of debris flow occurrence and rainfall events between 2009‒2017 were used to assess the suitability of the proposed equations and their adopted rainfall parameters (Im, Rd, or RI).
5.2. Results
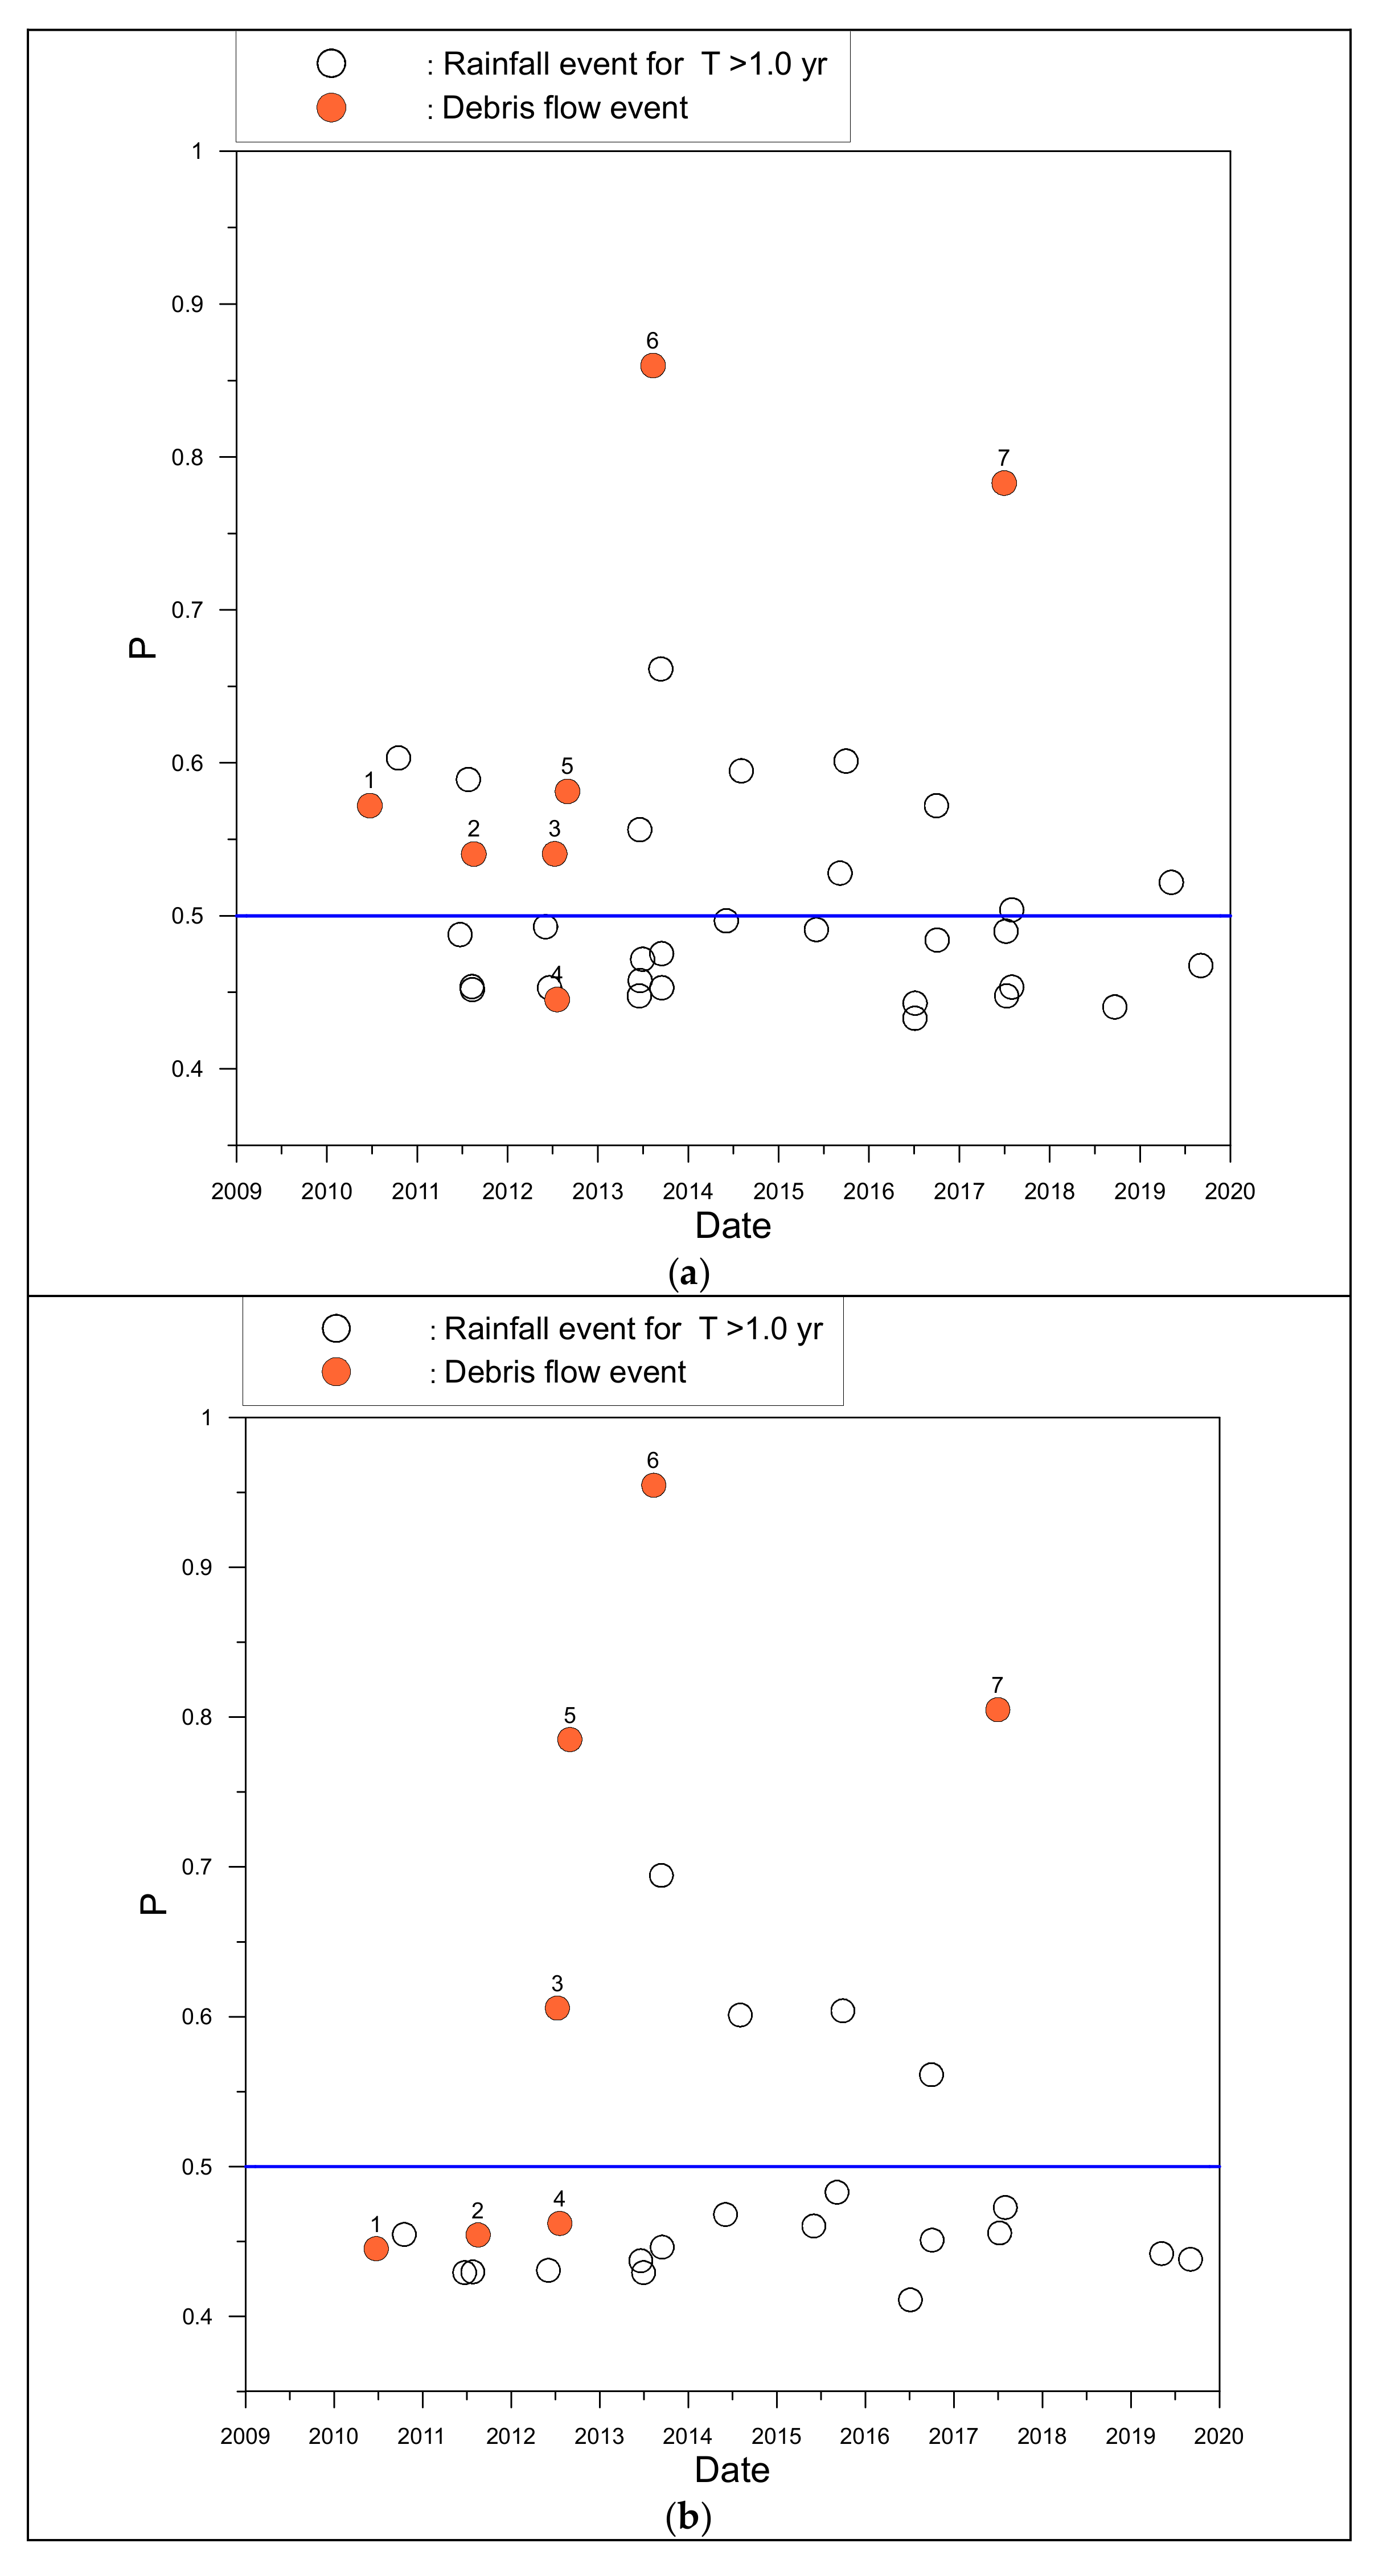
The model for the WP based on the return period of different rainfall indices was used to evaluate P. Figure 6 shows the variation in the predicted P derived from Equation (7) for rainfall events with return periods greater than 1 year (T > 1 year) from 2012‒2020, and the associated debris flow events are labelled (note: red dots and those labeled No. 1‒7 correspond to the events shown in Table 3).
In Figure 6a, using the T of Im to evaluate P, 10 rainfall events that did not trigger debris flows were predicted with P ≥ 0.5, although most of the debris flow events (i.e., six of seven) were reasonably predicted by P values > 0.5. In Figure 6b,c, using the return periods of Rd and RI to evaluate P, respectively, only four of the seven debris flow events were predicted with occurrence probabilities of P ≥ 0.5. The occurrence probability P for the four rainfall events that did not trigger debris flows was overestimated with values of P ≥ 0.5.
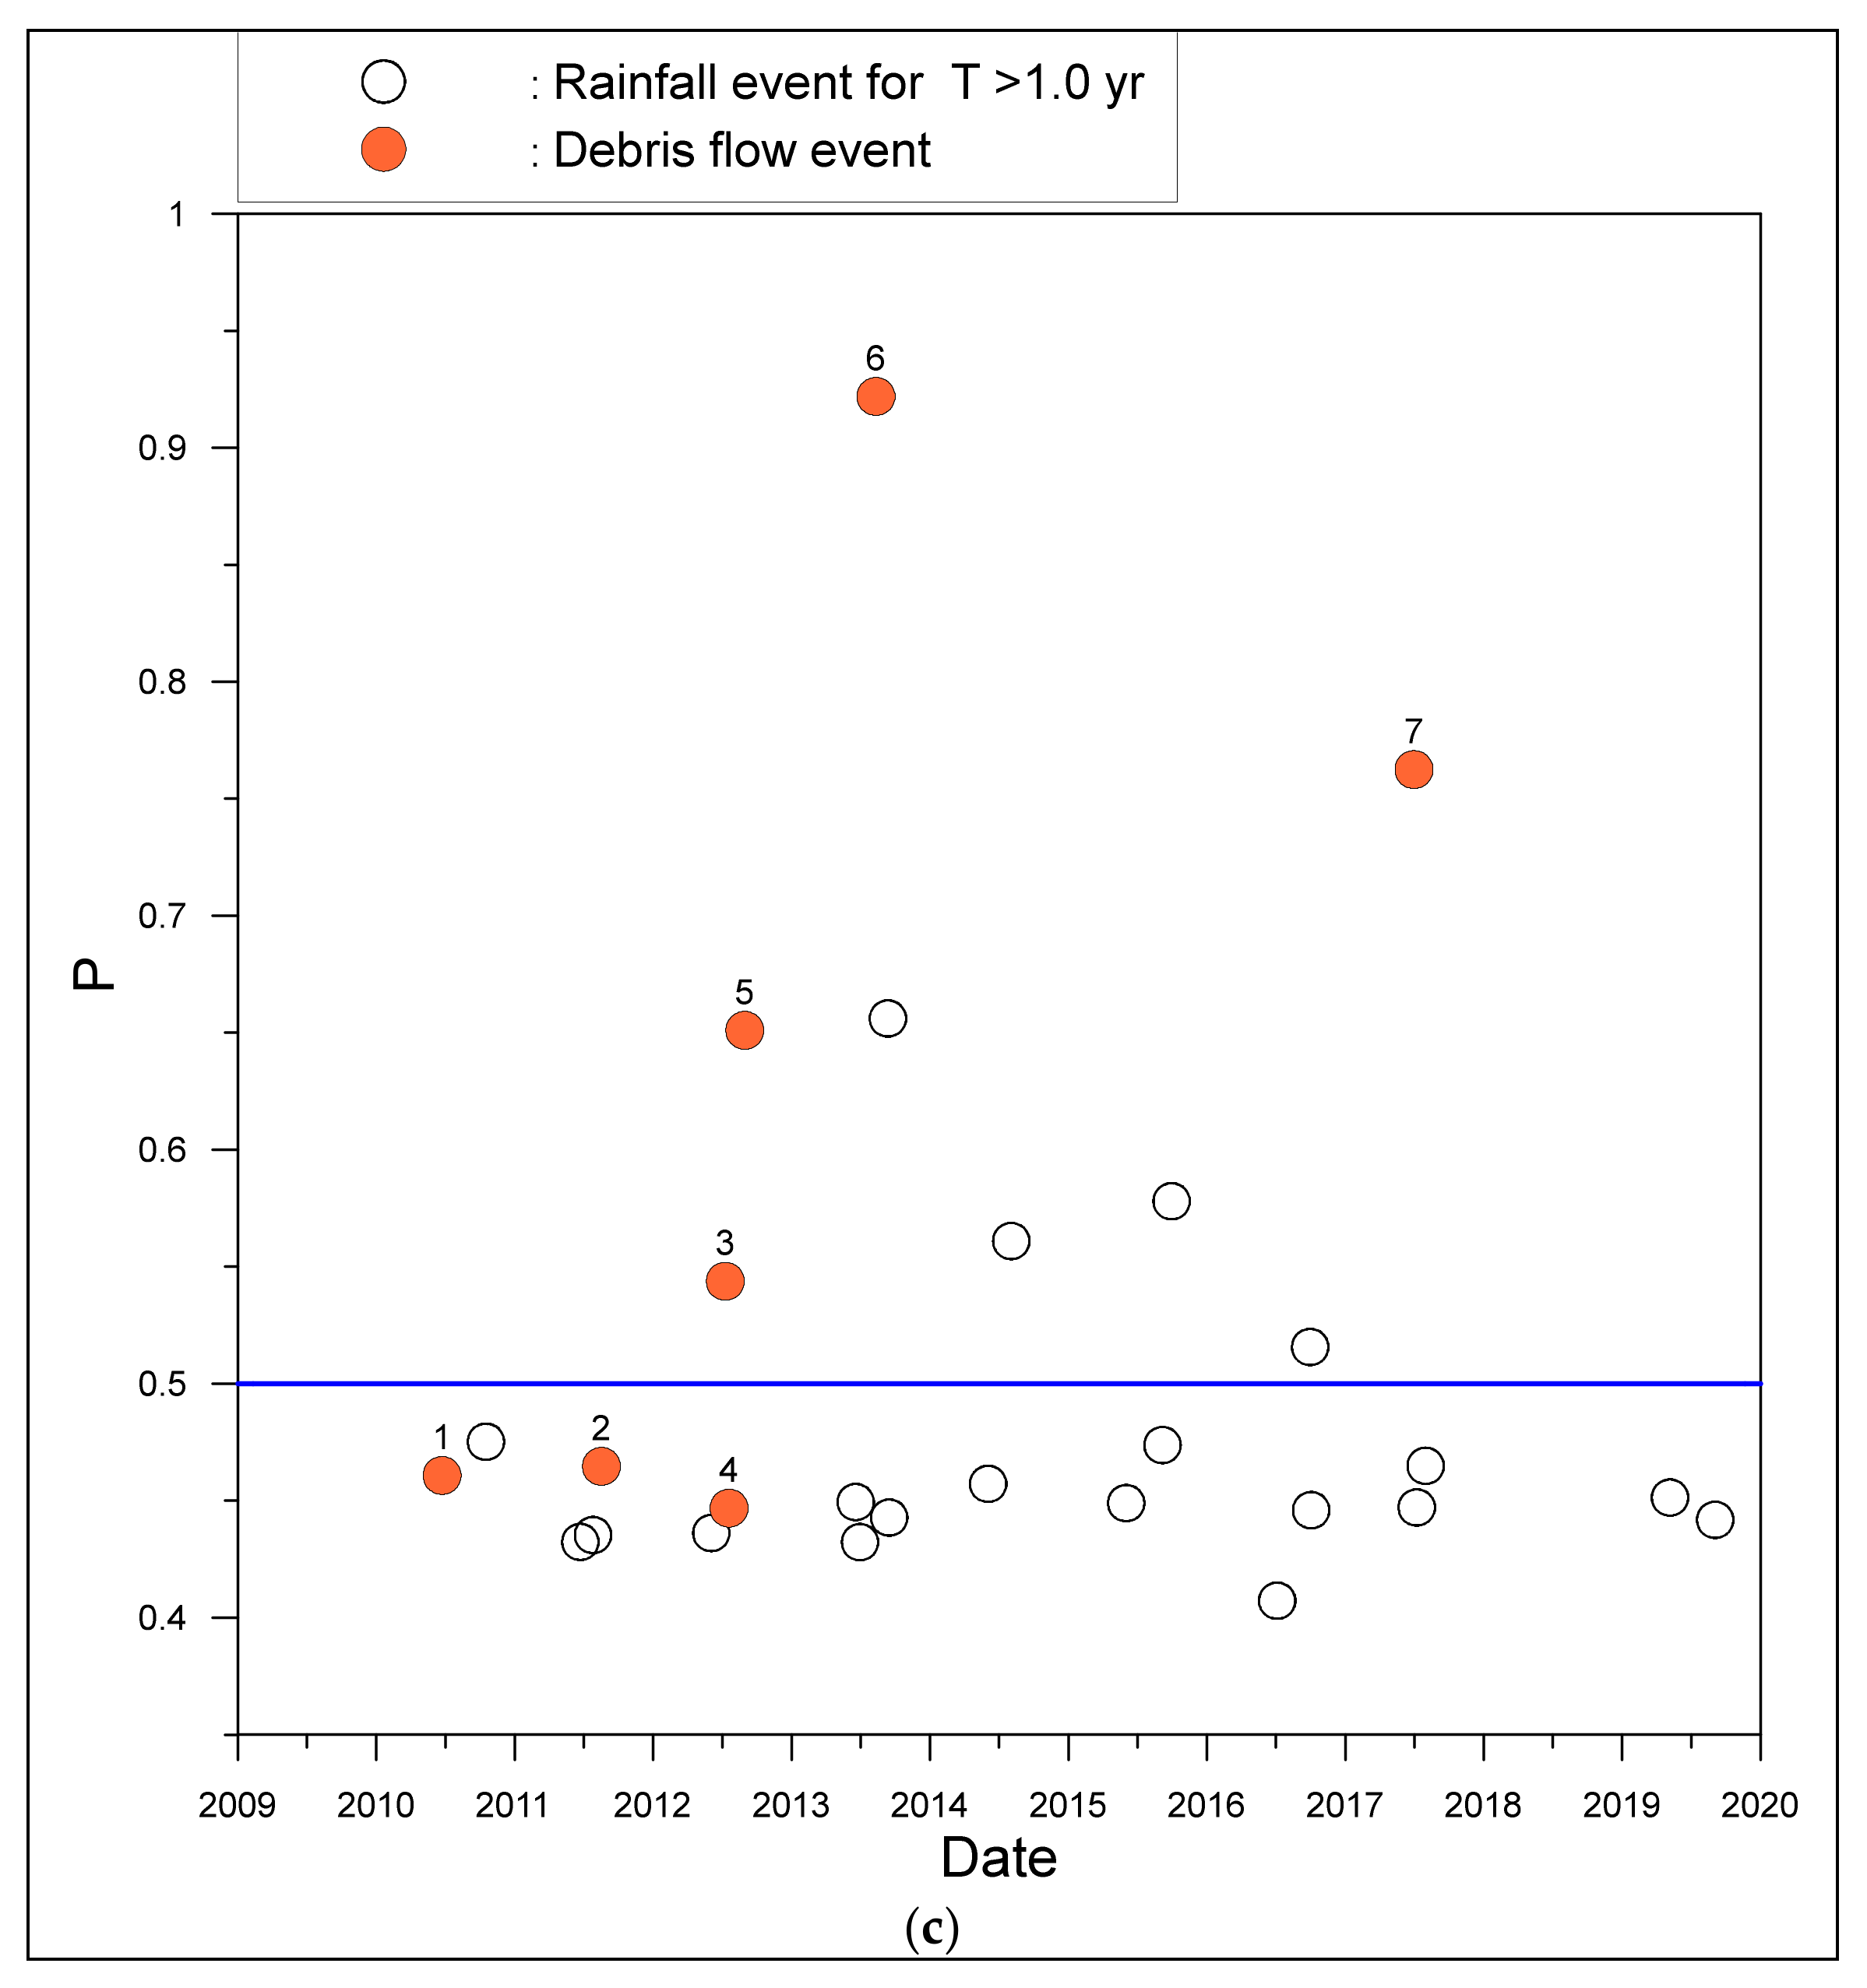
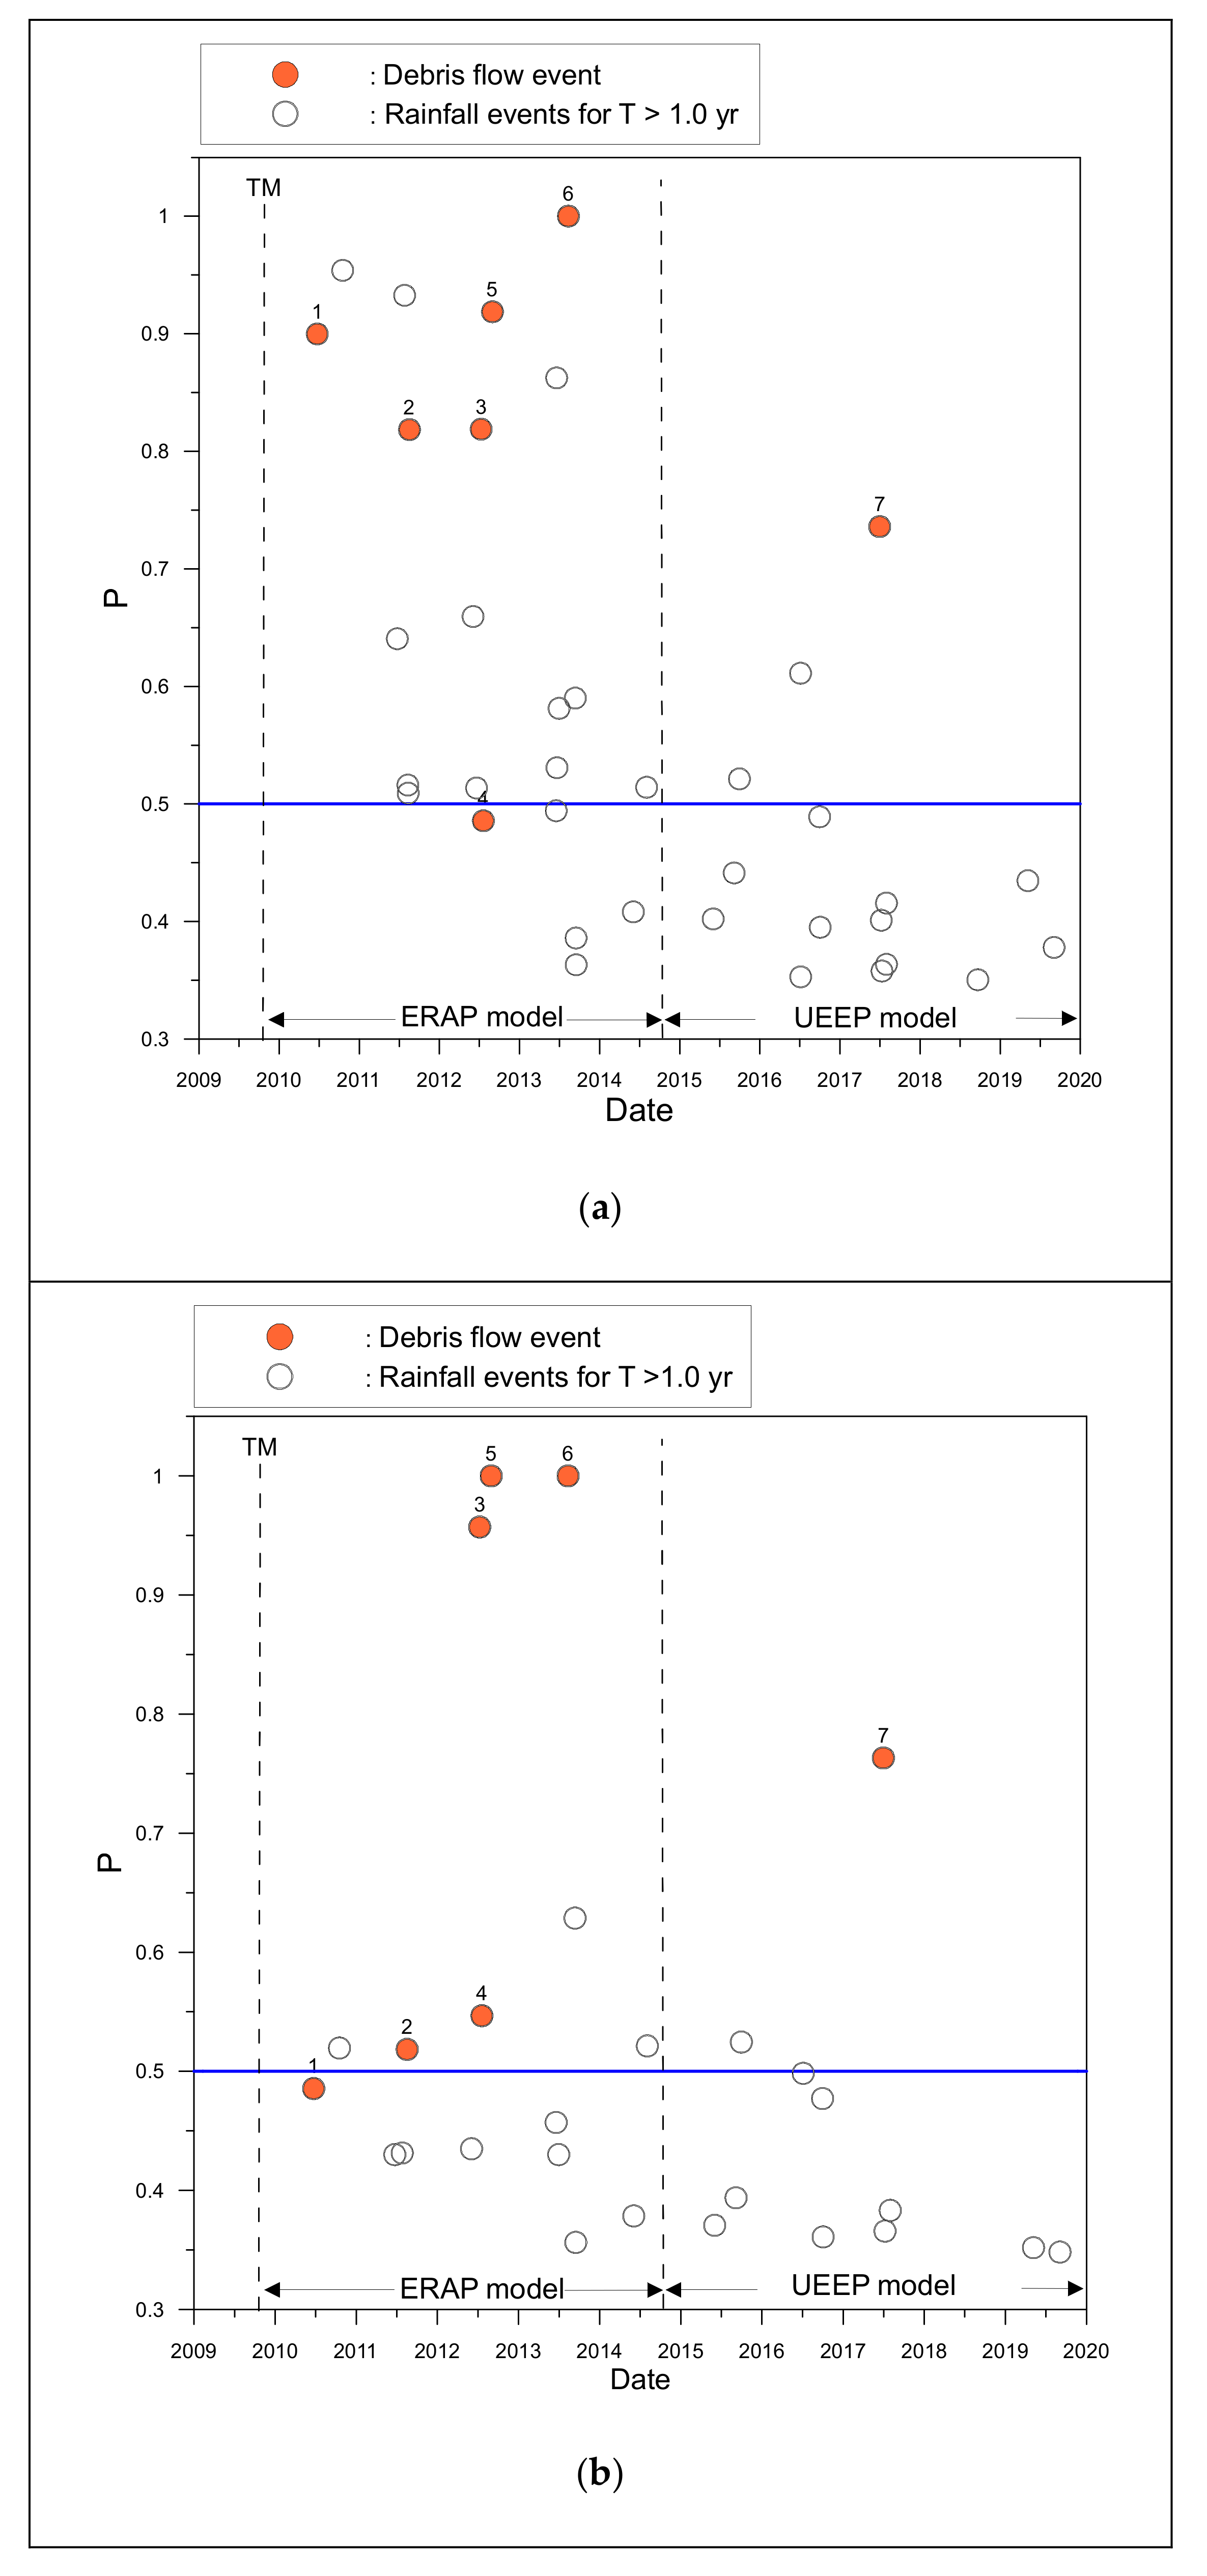
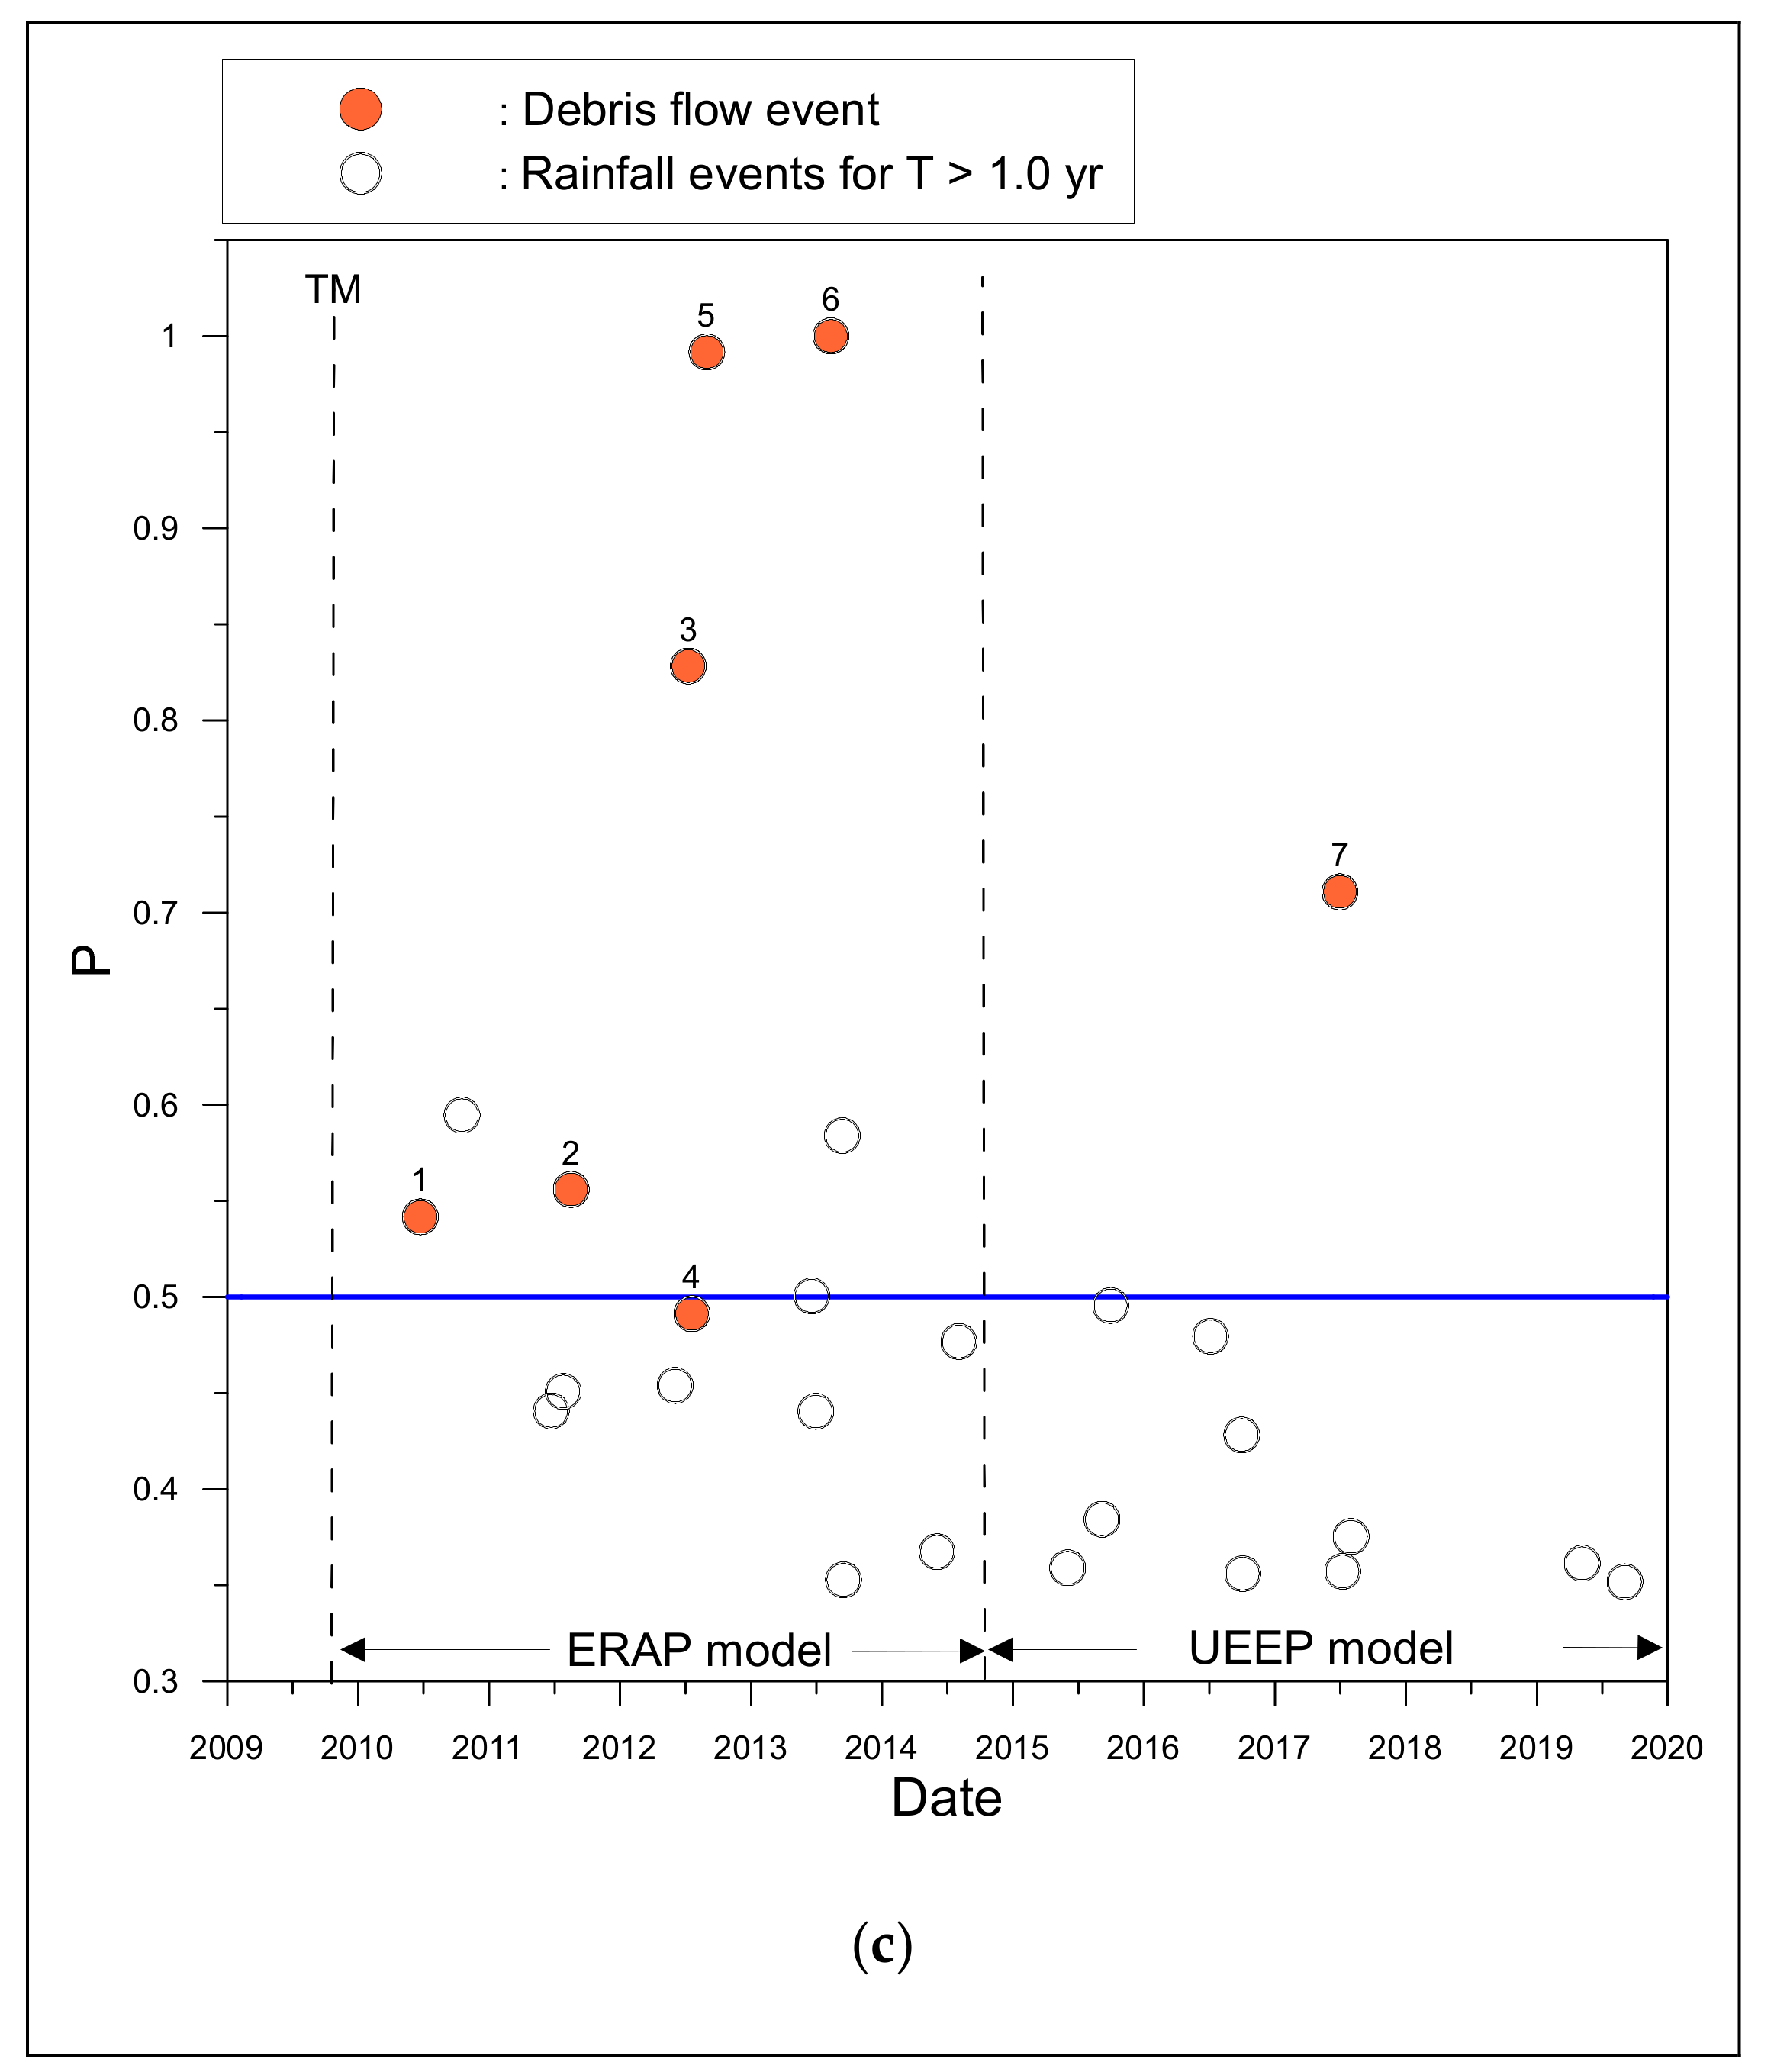
The model for the WP mainly presents the long-term characteristics for P and is unable to respond to the occurrence of a debris flow that is affected or unaffected by extreme events. Thus, the predicted P for the period of 3 years after Typhoon Morakot was determined using the ERAP model (Equation (8)), and the predicted P after the ERAP was determined using the UEEP model (Equation (9)). As shown in Figure 7, three rainfall indexes (Im, Rd, and RI) were used to evaluate the T values that were associated with the ERAP and UEEP models.
Using the return period T of Im, Rd, and RI (Figure 7a–c), six of the seven debris flow events were predicted with P ≥ 0.5. One debris flow event occurred at P ≥ 0.5. Most rainfall events that did not trigger debris flows were predicted with P ≥ 0.5. There were six debris flows within a total of ten rainfall events for T of Im, six debris flows within eight rainfall events for T of Rd, and six debris flows within eight rainfall events for T of RI when P ≥ 0.5. Figure 7 shows that 30% (Figure 7a), 60% (Figure 7b), and 75% (Figure 7c) of rainfall events triggered debris flows for T of Im, Rd, and RI, respectively, when predicted with P ≥ 0.5. That is, the predicted P using the T of RI and Rd would be more accurate than that using T of Im. Furthermore, [25] examined the period affected by extreme rainfall that triggers debris flow and the modification of critical rainfall for debris flows after extreme events in the Chenyulan watershed. Three rainfall indices, Im, Rd, and RI, were used. The modifications of critical rainfall and recovery period have higher correlations with RI driven by extreme rainfall than with Im and Rd. Thus, the RI index was suggested for convenience. When applying the model, one must initially check whether extreme rainfall (i.e., with RI > 365 cm2/h) has occurred in the Chenyulan watershed within 3 years. If so, the model that responded to the critical reduction RI (Equation (8)) is suggested; if not, Equation (9) should be used.
6. Conclusions
This study investigated the occurrence of debris flows after extreme events such as the CCE and extreme rainfall in a 449 km2 region of the Chenyulan watershed. The probability of debris flow occurrence was analyzed to determine the uncertainty of the hydrogeological conditions in the study area. The innovation of this study was the combining of the concepts of T and P to establish a probabilistic model of debris flow occurrence that can be adjusted following extreme events. The findings of this study are as follows:
- The rainfall indices of Im, Rd, and RI associated with T were analyzed. The advantages of using T are as follows: (1) it can reflect the long-term rainfall variation characteristics of a region and adjust with rainfall variability, and (2) the concept of T can be easily combined with hydrological analysis to facilitate the subsequent engineering design. Most debris flow events occurred with T > 1 year, excluding debris flow events affected by the CCE, while the T of extreme events triggering numerous debris flows could exceed approximately 5 years. T affected by the CCE for debris-flow-triggering rainfall was < 1 year, (i.e., much smaller than that affected by other extreme rainfall events).
- The rainfall indices of Im, Rd, and RI can be used to determine the relationship between P and T. Four empirical models of the P‒T relationship were developed (i.e., CEAP, ERAP, WP, and UEEP models). The P values, affected or unaffected by extreme events (such as the CCE or extreme rainfall), can be evaluated at various T values (or different rainfall conditions) using the P‒T relationship.
- P increased significantly after extreme rainfall events or the CCE, with the same T. In particular, the P value of periods influenced by CCE was higher than that during periods influenced by extreme rainfall events. The P during a period affected by the CCE can reach up to approximately twice that of a period that is unaffected by extreme events, while P of periods affected by extreme rainfall events can be approximately 80% higher than the P of a period that is unaffected by extreme events at the same T.
- A model relating P and T was applied to estimate P during recent rainfall events (2009–2020) after the extreme rainfall of Typhoon Morakot, which showed that a model using the Rd or RI index was reasonably accurate at predicting debris flow occurrence.
- An empirical model for evaluating P was developed based on the regional characteristics of the Chenyulan watershed, and may not be applicable to areas with different hydrogeological properties. The suitability of this model must be assessed, and empirical coefficients will most likely be required for calibration if the model is applied to other areas. In addition, the RI index was derived empirically, and further studies on the association of the RI index with physical mechanisms are needed.
Author Contributions
Conceptualization, J.-C.C. and W.-S.H.; methodology, J.-C.C.; software, J.-C.C. and W.-S.H.; validation, J.-C.C. and W.-S.H.; formal analysis, J.-C.C. and W.-S.H.; investigation, J.-C.C. and W.-S.H.; resources, J.-C.C. and W.-S.H.; data curation, J.-C.C. and W.-S.H.; writing—original draft preparation, J.-C.C.; writing—review and editing, J.-C.C.; supervision, J.-C.C.; project administration, J.-C.C.; funding acquisition, J.-C.C. All authors have read and agreed to the published version of the manuscript.
Funding
This study received financial support from the Ministry of Science and Technology, Taiwan (MOST 104-2625-M-211-001 and MOST 107-2625-M-211-001).
Acknowledgments
We appreciate the data analysis assistance of graduate student, C. K. Jiang, at Huafan University, Taiwan.
Conflicts of Interest
The authors declare no conflict of interest. The funders had no role in the design of the study; in the collection, analyses, or interpretation of data; in the writing of the manuscript, or in the decision to publish the results.
Abbreviations
| CCE | Chi-Chi earthquake |
| CEAP | Chi-Chi earthquake-affected period |
| ERAP | Extreme rainfall-affected period |
| HR | Heavy rainstorm in 2006 |
| TH | Typhoon Herb |
| TM | Typhoon Morakot |
| TMi | Typhoon Mindulle |
| TT | Typhoon Toraji |
| UEEP | Unaffected by extreme events period |
| WP | Whole period, 1985–2017 |
| List of symbols | |
| a, b, and c | Empirical coefficients in Equations (3) and (4). |
| I | Region hourly rainfall. |
| I1, I2, and I3 | Hourly rainfall record from the Sun Moon Lake, Yushan, and Alisan meteorological stations, respectively. |
| Im | Maximum hourly rainfall during each rainfall event. |
| MW | Moment magnitude. |
| m | Rank of a value in a list ordered by descending magnitude. |
| ND | Number of rainfall events that have triggered debris flows. |
| NR | Number of rainfall events. |
| n | Number of years in the record. |
| P | Probability of debris flow occurrence. |
| Rd | Maximum 24-h rainfall amount during each rainfall event. |
| R2 | Determination coefficient. |
| RI | Rainfall index, RI = Rd Im. |
| T | Return period of rainfall. |
| , and | Empirical coefficients in Equation (6). |
References
- Evans, S.G.; Clague, J.J. Recent climatic change and catastrophic geomorphic processes in mountain environments. Geomorphology 1994, 10, 107–128. [Google Scholar] [CrossRef]
- Clarke, M.; Rendell, H. Climate, Extreme Events and Land Degradation. In Climate and Land Degradation, Environmental Science and Engineering; Springer: Berlin/Heidelberg, Germany, 2007; pp. 137–152. [Google Scholar]
- Petley, D.N.; Hearn, G.J.; Hart, A.; Rosser, N.J.; Dunning, S.A.; Oven, K.; Mitchell, W.A. Trends in landslide occurrence in Nepal. Nat. Hazards 2007, 43, 23–44. [Google Scholar] [CrossRef]
- Hilker, N.; Badoux, A.; Hegg, C. The Swiss flood and landslide damage database 1972–2007. Nat. Hazards Earth Syst. Sci. 2009, 9, 913–925. [Google Scholar] [CrossRef] [Green Version]
- Djalante, R.; Thomalla, F. Disaster risk reduction and climate change adaptation in Indonesia: Institutional challenges and opportunities for integration. Int. J. Disaster Resil. Built Environ. 2012, 3, 166–180. [Google Scholar] [CrossRef]
- Chen, J.C.; Huang, W.S.; Jan, C.D.; Yang, Y.H. Recent changes in the number of rainfall events related to debris flow occurrence in the Chenyulan Stream Watershed, Taiwan. Nat. Hazards Earth Syst. Sci. 2012, 12, 1539–1549. [Google Scholar] [CrossRef]
- Mechler, R.; Bouwer, L.M.; Linnerooth-Bayer, J.; Hochrainer-Stigler, S.; Aerts, J.C.J.H.; Surminski, S.; Williges, K. Managing unnatural disaster risk from climate extremes. Nat. Clim. Chang. 2014, 4, 235–237. [Google Scholar] [CrossRef]
- Joshi, V.; Kumar, K. Extreme rainfall events and associated natural hazards in Alaknanda Valley, Indian Himalayan Region. J. Mt. Sci. 2006, 3, 228–236. [Google Scholar] [CrossRef]
- Borga, M.; Stoffel, M.; Marchi, L.; Marra, F.; Jakob, M. Hydrogeomorphic response to extreme rainfall in headwater systems: Flash floods and debris flows. J. Hydrol. 2014, 518, 194–205. [Google Scholar] [CrossRef]
- Wang, F.; Wu, Y.H.; Yang, H.; Tanida, Y.; Kamei, A. Preliminary investigation of the 20 August 2014 debris flows triggered by a severe rainstorm in Hiroshima City, Japan. Geoenviron. Disasters 2015, 2, 17. [Google Scholar] [CrossRef] [Green Version]
- Joe, E.J.; Tongkul, F.; Roslee, R. Relationship Between Rainfall and Debris Flow Occurrence in the Crocker Range of Sabah, Malaysia. Malays. J. Geosci. 2018, 2, 18–29. [Google Scholar] [CrossRef]
- Nam, D.H.; Lee, S.H.; Kim, B.S. Development of Nomogram for Debris Flow Forecasting Based on Critical Accumulated Rainfall in South Korea. Water 2019, 11, 2181. [Google Scholar] [CrossRef] [Green Version]
- Gong, X.L.; Chen, K.T.; Chen, X.Q.; You, Y.; Chen, J.G.; Zhao, W.Y.; Lang, J. Characteristics of a Debris Flow Disaster and Its Mitigation Countermeasures in Zechawa Gully, Jiuzhaigou Valley, China. Water 2020, 12, 1256. [Google Scholar] [CrossRef]
- Chen, J.C.; Chuang, M.R. Discharge of landslide-induced debris flows: Case studies of Typhoon Morakot in southern Taiwan. Nat. Hazards Earth Syst. Sci. 2014, 14, 1719–1730. [Google Scholar] [CrossRef] [Green Version]
- Destro, E.; Marra, F.; Nikolopoulos, E.I.; Zoccatelli, D.; Creutin, J.D.; Borga, M. Spatial estimation of debris flows-triggering rainfall and its dependence on rainfall return period. Geomorphology 2017, 278, 269–279. [Google Scholar] [CrossRef]
- Caine, N. The rainfall intensity-duration control of shallow landslides and debris flow. Geogr. Ann. Ser. A Phys. Geogr. 1980, 62A, 23–27. [Google Scholar]
- Wieczorek, G.F. Effect of rainfall intensity and during in debris flows in central Santa Cruz Mountain, California. Eng. Geol. 1987, 7, 93–104. [Google Scholar]
- Jan, C.D.; Chen, C.L. Debris flow caused by Typhoon Herb in Taiwan. In Chapter 21, Debris-Flow Hazards and Related Phenomena; Jakob, M., Hungr, O., Eds.; Praxis: Chichester, UK, 2005; pp. 539–563. [Google Scholar]
- Shieh, C.L.; Chen, Y.S.; Tsai, Y.J.; Wu, J.H. Variability in rainfall threshold for debris flow after the Chi-Chi earthquake in central Taiwan, China. Int. J. Sediment Res. 2009, 24, 177–188. [Google Scholar] [CrossRef]
- Chen, J.C.; Huang, W.S.; Jan, C.D.; Tsai, Y.F. Rainfall conditions for the initiation of debris flows during Typhoon Morakot in the Chen-Yu-Lan watershed in central Taiwan. In Proceedings of the 5th International Conference on Debris-Flow Hazards Mitigation: Mechanics, Prediction, and Assessment, Padua, Italy, 14–17 June 2011; pp. 31–36. [Google Scholar]
- Guzzetti, F.; Peruccacci, S.; Rossi, M.; Stark, C.P. Rainfall thresholds for the initiation of landslides in central and southern Europe. Meteorog. Atmos. Phys. 2007, 98, 239–267. [Google Scholar] [CrossRef]
- Chen, J.C.; Jan, C.D. Probabilistic Analysis of Landslide Potential of an Inclined Uniform Soil Layer of Infinite Length—Application. Environ. Geol. 2008, 54, 1175–1183. [Google Scholar] [CrossRef]
- Chen, N.S.; Yang, C.L.; Zhou, W.; Hu, G.S.; Li, H.; Hand, D. The Critical Rainfall Characteristics for Torrents and Debris Flows in the Wenchuan Earthquake Stricken Area. J. Mt. Sci. 2009, 6, 362–372. [Google Scholar] [CrossRef]
- Tang, C.; Zhu, J.; Li, W.L. Rainfall-triggered debris flows following the Wenchuan earthquake. Bull. Eng. Geol. Environ. 2009, 68, 187–194. [Google Scholar] [CrossRef]
- Chen, J.C. Variability of impact of earthquake on debris flow triggering conditions: Case study of Chen-Yu-Lan Watershed, Taiwan. Environ. Earth Sci. 2011, 64, 1787–1794. [Google Scholar] [CrossRef]
- Chen, J.C.; Jan, C.D.; Huang, W.S. Characteristics of rainfall triggering of debris flows in the Chenyulan watershed, Taiwan. Nat. Hazards Earth Syst. Sci. 2013, 13, 1015–1023. [Google Scholar] [CrossRef]
- Pan, H.L.; Jiang, Y.J.; Wang, J.; Ou, G.Q. Rainfall threshold calculation for debris flow early warning in areas with scarcity of data. Nat. Hazards Earth Syst. Sci. 2018, 18, 1395–1409. [Google Scholar] [CrossRef] [Green Version]
- Chen, J.C.; Huang, W.S.; Tsai, Y.F. Variability in the characteristics of extreme rainfall events triggering debris flows: A case study in the Chenyulan watershed, Taiwan. Nat. Hazards 2020, 102, 887–908. [Google Scholar] [CrossRef]
- Guzzetti, F.; Peruccacci, S.; Rossi, M.; Stark, C.P. The rainfall intensity–duration control of shallow landslides and debris flows: An update. Landslides 2008, 5, 3–17. [Google Scholar] [CrossRef]
- Nikolopoulos, E.I.; Crema, S.; Marchi, L.; Marra, F.; Guzzetti, F.; Borga, M. Impact of uncertainty in rainfall estimation on the identification of rainfall thresholds for debris flow occurrence. Geomorphology 2014, 221, 286–297. [Google Scholar] [CrossRef]
- Lin, M.L.; Jeng, F.S. Characteristics of hazards induced by extremely heavy rainfall in central Taiwan—Typhoon Herb. Eng. Geol. 2000, 58, 191–207. [Google Scholar] [CrossRef]
- Lin, C.W.; Shieh, C.L.; Yuan, B.D.; Shieh, Y.C.; Liu, S.H.; Lee, S.Y. Impact of Chi-Chi earthquake on the occurrence of landslides and debris flows: Example from the Chenyulan River watershed, Nantou, Taiwan. Eng. Geol. 2013, 71, 49–61. [Google Scholar] [CrossRef]
- NCDR (National Science and Technology Center for Disaster Reduction). The Rank of Extreme Rainfall Events over Taiwan; NCDR: Taipei, Taiwan, 2015. (In Chinese) [Google Scholar]
- Chow, V.T.; Maidment, D.R.; Mays, L.W. Applied Hydrology; McGraw-Hill Inc.: Singapore, 1988. [Google Scholar]
- Jan, C.D.; Lee, M.H. A debris-flow rainfall-based warning model. J. Chin. Soil Water Conserv. 2004, 35, 273–283. (In Chinese) [Google Scholar]
- Viessman, W.; Lewis, G.L.; Knapp, J.W. Introduction to Hydrology, 3rd ed.; Harper & Row: New York, NY, USA, 1989. [Google Scholar]
- Makkonen, L. Plotting positions in extreme value analysis. J. Appl. Meteorol. Climatol. 2006, 45, 334–340. [Google Scholar] [CrossRef]
Figure 1.
Map showing the study area in the Chenyulan watershed in central Taiwan, and locations of debris flows triggered by five extreme rainfall events (green circles), as well as recent debris flows (crosses) that occurred between 2009–2020 after the extreme event of Typhoon Morakot (TT) in 2009. The Chenyulan stream is a tributary of the Choushui River. The river is approximately 42 km long, the average stream bed gradient is 4°, and the watershed area is 449 km2 with an elevation of 310–3952 m [6].

Figure 2.
Return period (T) of rainfall index in the Chenyulan watershed. Three rainfall indexes, Im, Rd, and RI, were used. (a) Annual maximum hourly rainfall depth (Im) between 1963–2017; (b) annual maximum 24-h rainfall amount (Rd) between 1963–2017; and (c) annual maximum RI (Im × Rd) between 1963–2017.

Figure 3.
Rainfall events, using rainfall index of: (a) Im, (b) Rd, and (c) RI, and rainfall-triggered debris flow events between 1985–2017. Data points show debris flow events triggering after the five extreme rainfall events TMi, TT, HR, TH, and TM, Chi-Chi earthquake (CCE), and during the CCE-affected period (CEAP).


Figure 4.
Four models describing the relationship between the probability of debris flow occurrence (P) and the rainfall return period (T). Data for T were determined from historical maximum annual hourly rainfall (Im), maximum 24-h rainfall (Rd), or Rd × Im (RI). (a) Whole period (WP); (b) Chi-Chi earthquake-affected period (CEAP); (c) extreme rainfall-affected period (ERAP); and (d) unaffected by extreme events period (UEEP).

Figure 5.
Comparison of the four models describing the relationship between the rainfall return period (T) and the probability of debris flow occurrence (P), i.e., the P–T relationship. The four models are for the Chi-Chi earthquake-affected period (CEAP), the extreme rainfall-affected period (ERAP), the whole period (WP), and the unaffected by extreme events period (UEEP).

Figure 6.
Probability of debris flow occurrence (P) evaluated using the model representing the whole period (WP) and Equation (7) after Typhon Morakot. The rainfall return period (T) in Equation (7) was determined using three rainfall indexes: Im, Rd, or RI. (a) T determined by Im: six of seven debris flow events were predicted with P ≥ 0.5. Ten rainfall events that did not trigger debris flows were predicted with P ≥ 0.5; (b) T determined by Rd: four of seven debris flow events were predicted with P ≥ 0.5. Four rainfall events that did not trigger debris flows were predicted with P ≥ 0.5; and (c) T determined by RI: four of seven debris flow events were predicted with P ≥ 0.5. Four rainfall events with no triggering of debris flows were predicted with P ≥ 0.5.


Figure 7.
Probability of debris flow occurrence (P) evaluated using the model for the extreme rainfall-affected period (ERAP) within the 3 years after Typhoon Morakot (Equation (8)), and the model for the unaffected by extreme events period (UEEP) after the ERAP (Equation (9)). The rainfall return period (T in Equation (8) or ((9)) was determined using three rainfall indexes: Im, Rd, or RI. (a) T determined by Im: six debris flows were predicted within twenty rainfall events when P ≥ 0.5 and one debris flow events with P ≥ 0.5; (b) T determined by Rd: six debris flows were predicted within ten rainfall events when P ≥ 0.5 and one debris flow events within P ≥ 0.5; and (c) T determined by RI: Six debris flows were predicted within a total of eight rainfall events when P ≥ 0.5, and one debris flow event when P ≥ 0.5.


Table 1.
Empirical coefficients a, b, and c for the rainfall indices: maximum hourly rainfall depth (Im), maximum 24-h rainfall amount (Rd), and RI (Im × Rd).
Table 1.
Empirical coefficients a, b, and c for the rainfall indices: maximum hourly rainfall depth (Im), maximum 24-h rainfall amount (Rd), and RI (Im × Rd).
| xi | a | b | c | R2 |
|---|---|---|---|---|
| Im | 40 | 0.94 | 0.23 | 0.91 |
| Rd | 410 | 0.96 | 0.26 | 0.95 |
| RI | 180 | 0.97 | 0.42 | 0.93 |
Table 2.
Empirical coefficients , and, of Equation (6) during the four periods.
| Period | Range of Analyzed Rainfall Events | γ | R2 | ||
|---|---|---|---|---|---|
| I. Whole period (WP) | Between 1985–2017 | 0.47 | 0.78 | 0.85 | 0.89 |
| II. Chi-Chi earthquake-affected period (CEAP) | Between CCE and TMi (the period of approximately 5 years after the CCE) | 0.23 | 0.87 | 8.65 | 0.56 |
| III. Extreme rainfall-affected period (ERAP) | 3 years after TH and TM, 2 years after HR, and 1 year after TMi | 0.32 | 0.79 | 2.89 | 0.84 |
| IV. Unaffected by extreme events period (UEEP) | WP excluding CEAP and ERAP | 0.20 | 0.46 | 0.99 | 0.82 |
Notes: R2 = coefficient of determination.
Table 3.
Debris flow event and related rainfall characteristics in the Chenyulan watershed between 2009–2020, after the extreme rainfall events of Typhoon Morakot (TM).
Table 3.
Debris flow event and related rainfall characteristics in the Chenyulan watershed between 2009–2020, after the extreme rainfall events of Typhoon Morakot (TM).
| No. | Year | Date | Name of Event | Im (mm/h) | Rd (mm) | RI (cm2/h) | Remark |
|---|---|---|---|---|---|---|---|
| 0 | 2009 | 6–11 August | Typhoon Morakot (TM) | 85.5 | 1192.6 | 1019.7 | Extreme rainfall event |
| 1 | 2010 | 23–24 May | Rainstorm | 35.8 | 227.2 | 81.3 | Events within the period affected by extreme rainfall TM |
| 2 | 2011 | 17–20 July | Rainstorm | 33.6 | 256.2 | 86.1 | |
| 3 | 2012 | 9–12 June | Rainstorm | 33.6 | 384.6 | 129.2 | |
| 4 | 2012 | 18–21 June | Typhoon Talim | 22.2 | 243.4 | 54.0 | |
| 5 | 2012 | 1–3 August | Typhoon Saola | 36.4 | 502.2 | 182.8 | |
| 6 | 2013 | 12–13 July | Typhoon Soulik | 52.4 | 661.7 | 346.7 | Events unaffected by TM |
| 7 | 2017 | 1–4 June | Rainstorm | 46.1 | 515.7 | 237.7 |
Notes: Im (mm/h), maximum hourly rainfall in each rainfall event; Rd (mm), maximum 24-h rainfall in each rainfall event; RI, rainfall index for each rainfall event, which can be determined using the equation RI, Rd × Im.
Publisher’s Note: MDPI stays neutral with regard to jurisdictional claims in published maps and institutional affiliations. |
© 2021 by the authors. Licensee MDPI, Basel, Switzerland. This article is an open access article distributed under the terms and conditions of the Creative Commons Attribution (CC BY) license (https://creativecommons.org/licenses/by/4.0/).
Share and Cite
MDPI and ACS Style
Chen, J.-C.; Huang, W.-S. Evaluation of Rainfall-Triggered Debris Flows under the Impact of Extreme Events: A Chenyulan Watershed Case Study, Taiwan. Water 2021, 13, 2201. https://doi.org/10.3390/w13162201
AMA Style
Chen J-C, Huang W-S. Evaluation of Rainfall-Triggered Debris Flows under the Impact of Extreme Events: A Chenyulan Watershed Case Study, Taiwan. Water. 2021; 13(16):2201. https://doi.org/10.3390/w13162201
Chicago/Turabian StyleChen, Jinn-Chyi, and Wen-Shun Huang. 2021. "Evaluation of Rainfall-Triggered Debris Flows under the Impact of Extreme Events: A Chenyulan Watershed Case Study, Taiwan" Water 13, no. 16: 2201. https://doi.org/10.3390/w13162201
Note that from the first issue of 2016, this journal uses article numbers instead of page numbers. See further details here.