3.1. Physical Hydrology
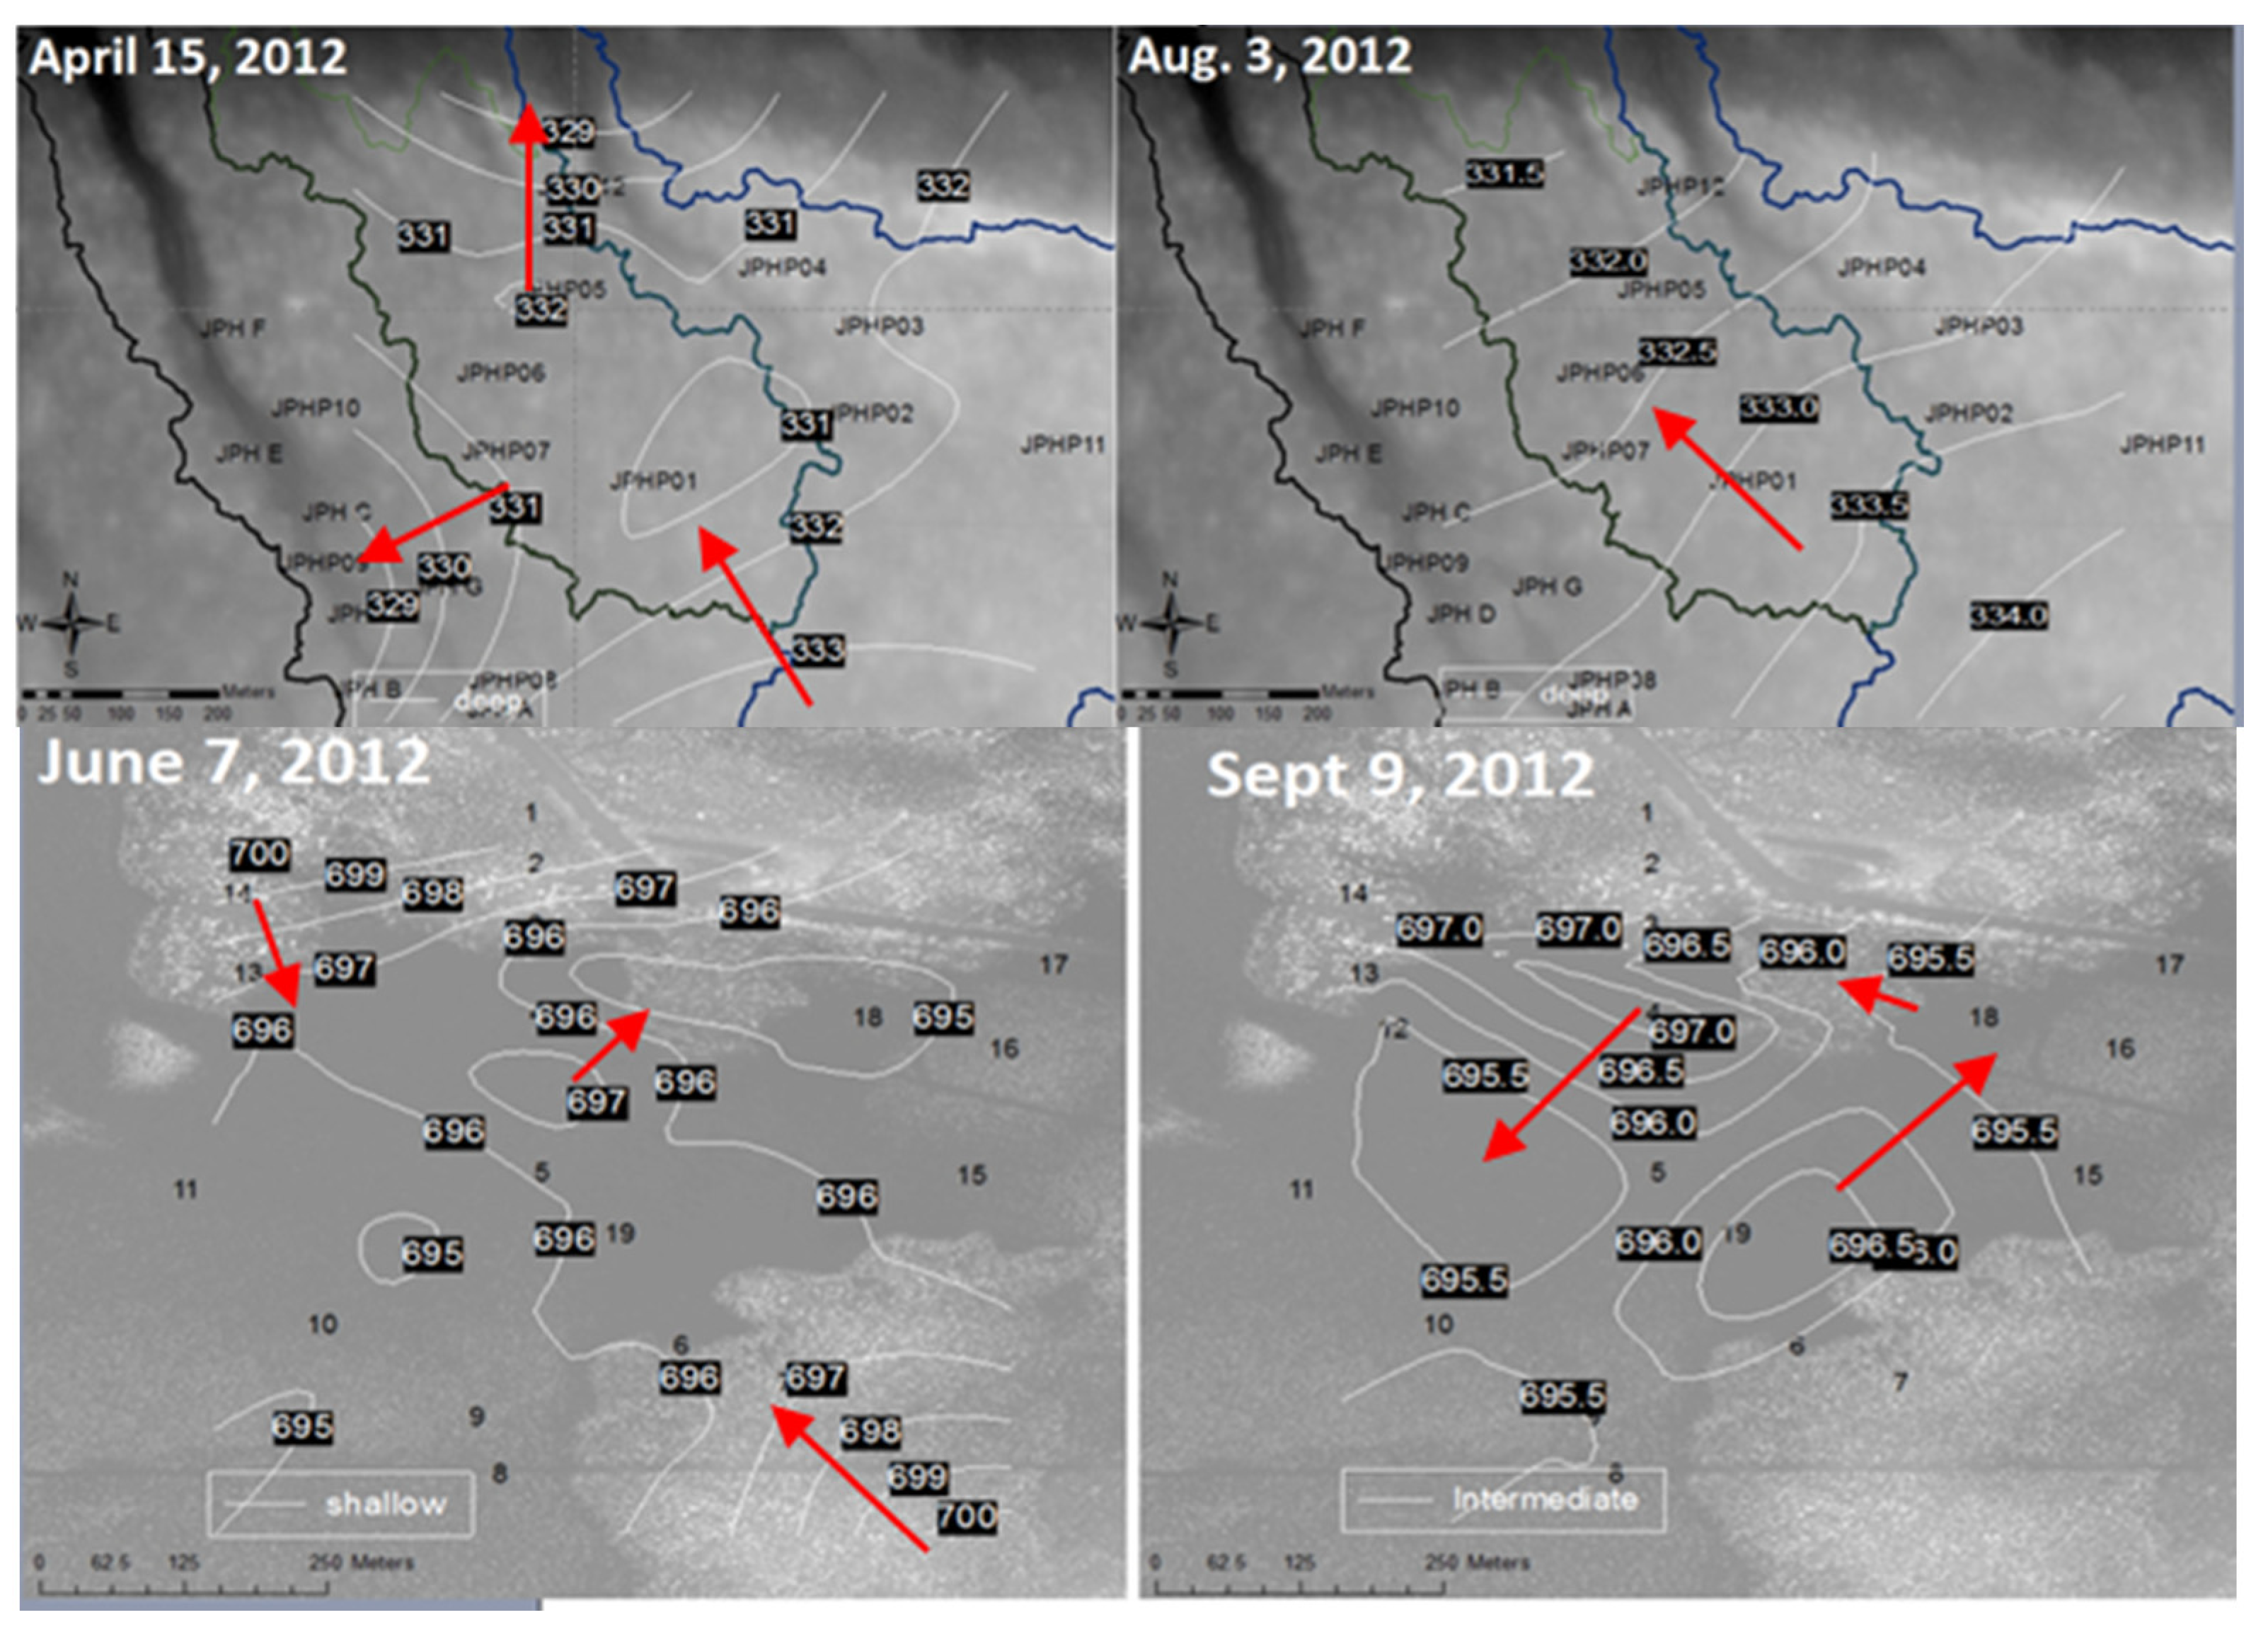
Surface and subsurface flow pathways were mapped at both sites based on LiDAR elevations, water table elevations, and piezometric head data. Spatial flow patterns were constructed from hydraulic heads at different times of the year for both JPH and ML (
Figure 3). For JPH, similar trends were seen in shallow, intermediate and deep piezometers, and suggest flow generally towards the northwest or west, depending on the season and antecedent moisture conditions. Major drainage controls include incised channels infilled with rich fen vegetation, evident as dark strands trending to the northwest in
Figure 3. For ML, seasonal trends in the flow pattern are also evident. After the spring melt period, shallow groundwater flows from uplands into the peatland complex and feeds the interior of the fen, which then flows toward the northeast. Complex flow patterns with seasonal reversals of flow towards the southwest are also noted for some late summer intervals when hydraulic gradients are reduced and the uplands are poorly connected.
However, water still continues to flow towards the northeast to the natural basin outlet; however, this exit is largely blocked due to the AltaGas road, which results in significant ponding of water in the roadside culvert.
Overall, the flow mapping was used to better understand where potential down gradient impacts from nitrogen additions might occur. As noted previously, no nitrogen amendment N is believed to have migrated from the plots to influence the natural background chemistry as monitored at either site.
Due to the inability to effectively gauge runoff using weirs, a vertical water balance approach as developed by Tattrie [
14] was used. The method relies on daily total measurements of precipitation, evaporation, change in storage, and estimates of peat porosity to predict the amount of potential runoff over time. Note that depression storage is accounted for by subtracting a 15 mm threshold, which was determined based on the depression storage capacity for wetland terrain in the area. This method allowed the temporal tracking of runoff. As shown in
Figure 4, more frequent and stronger runoff events occurred in a relatively wet year, 2012, as compared to a relatively dry year, 2011 (
Figure 4). At ML, on average, bogs were found to have more variable water levels than poor (wet or dry) fens. The rich fen (JPH) was subjected to higher fluctuations in water levels due to antecedent moisture conditions and/or beaver activity. The role of antecedent moisture in controlling water level fluctuations and in determining runoff was discussed in more detail by Vallarino [
12].
Runoff potential for the study years was found to range from −380 to 271 mm·yr−1 for rich fen, −266 to 60 mm·yr−1 for bog, −213 to 60 mm·yr−1 for wet fen, and −197 to 67 mm·yr−1 for dry fen. Higher values were observed for wet years such as 2012, whereas lower values were found for dry years (2011, 2013 to 2015).
3.2. Stable Isotopes
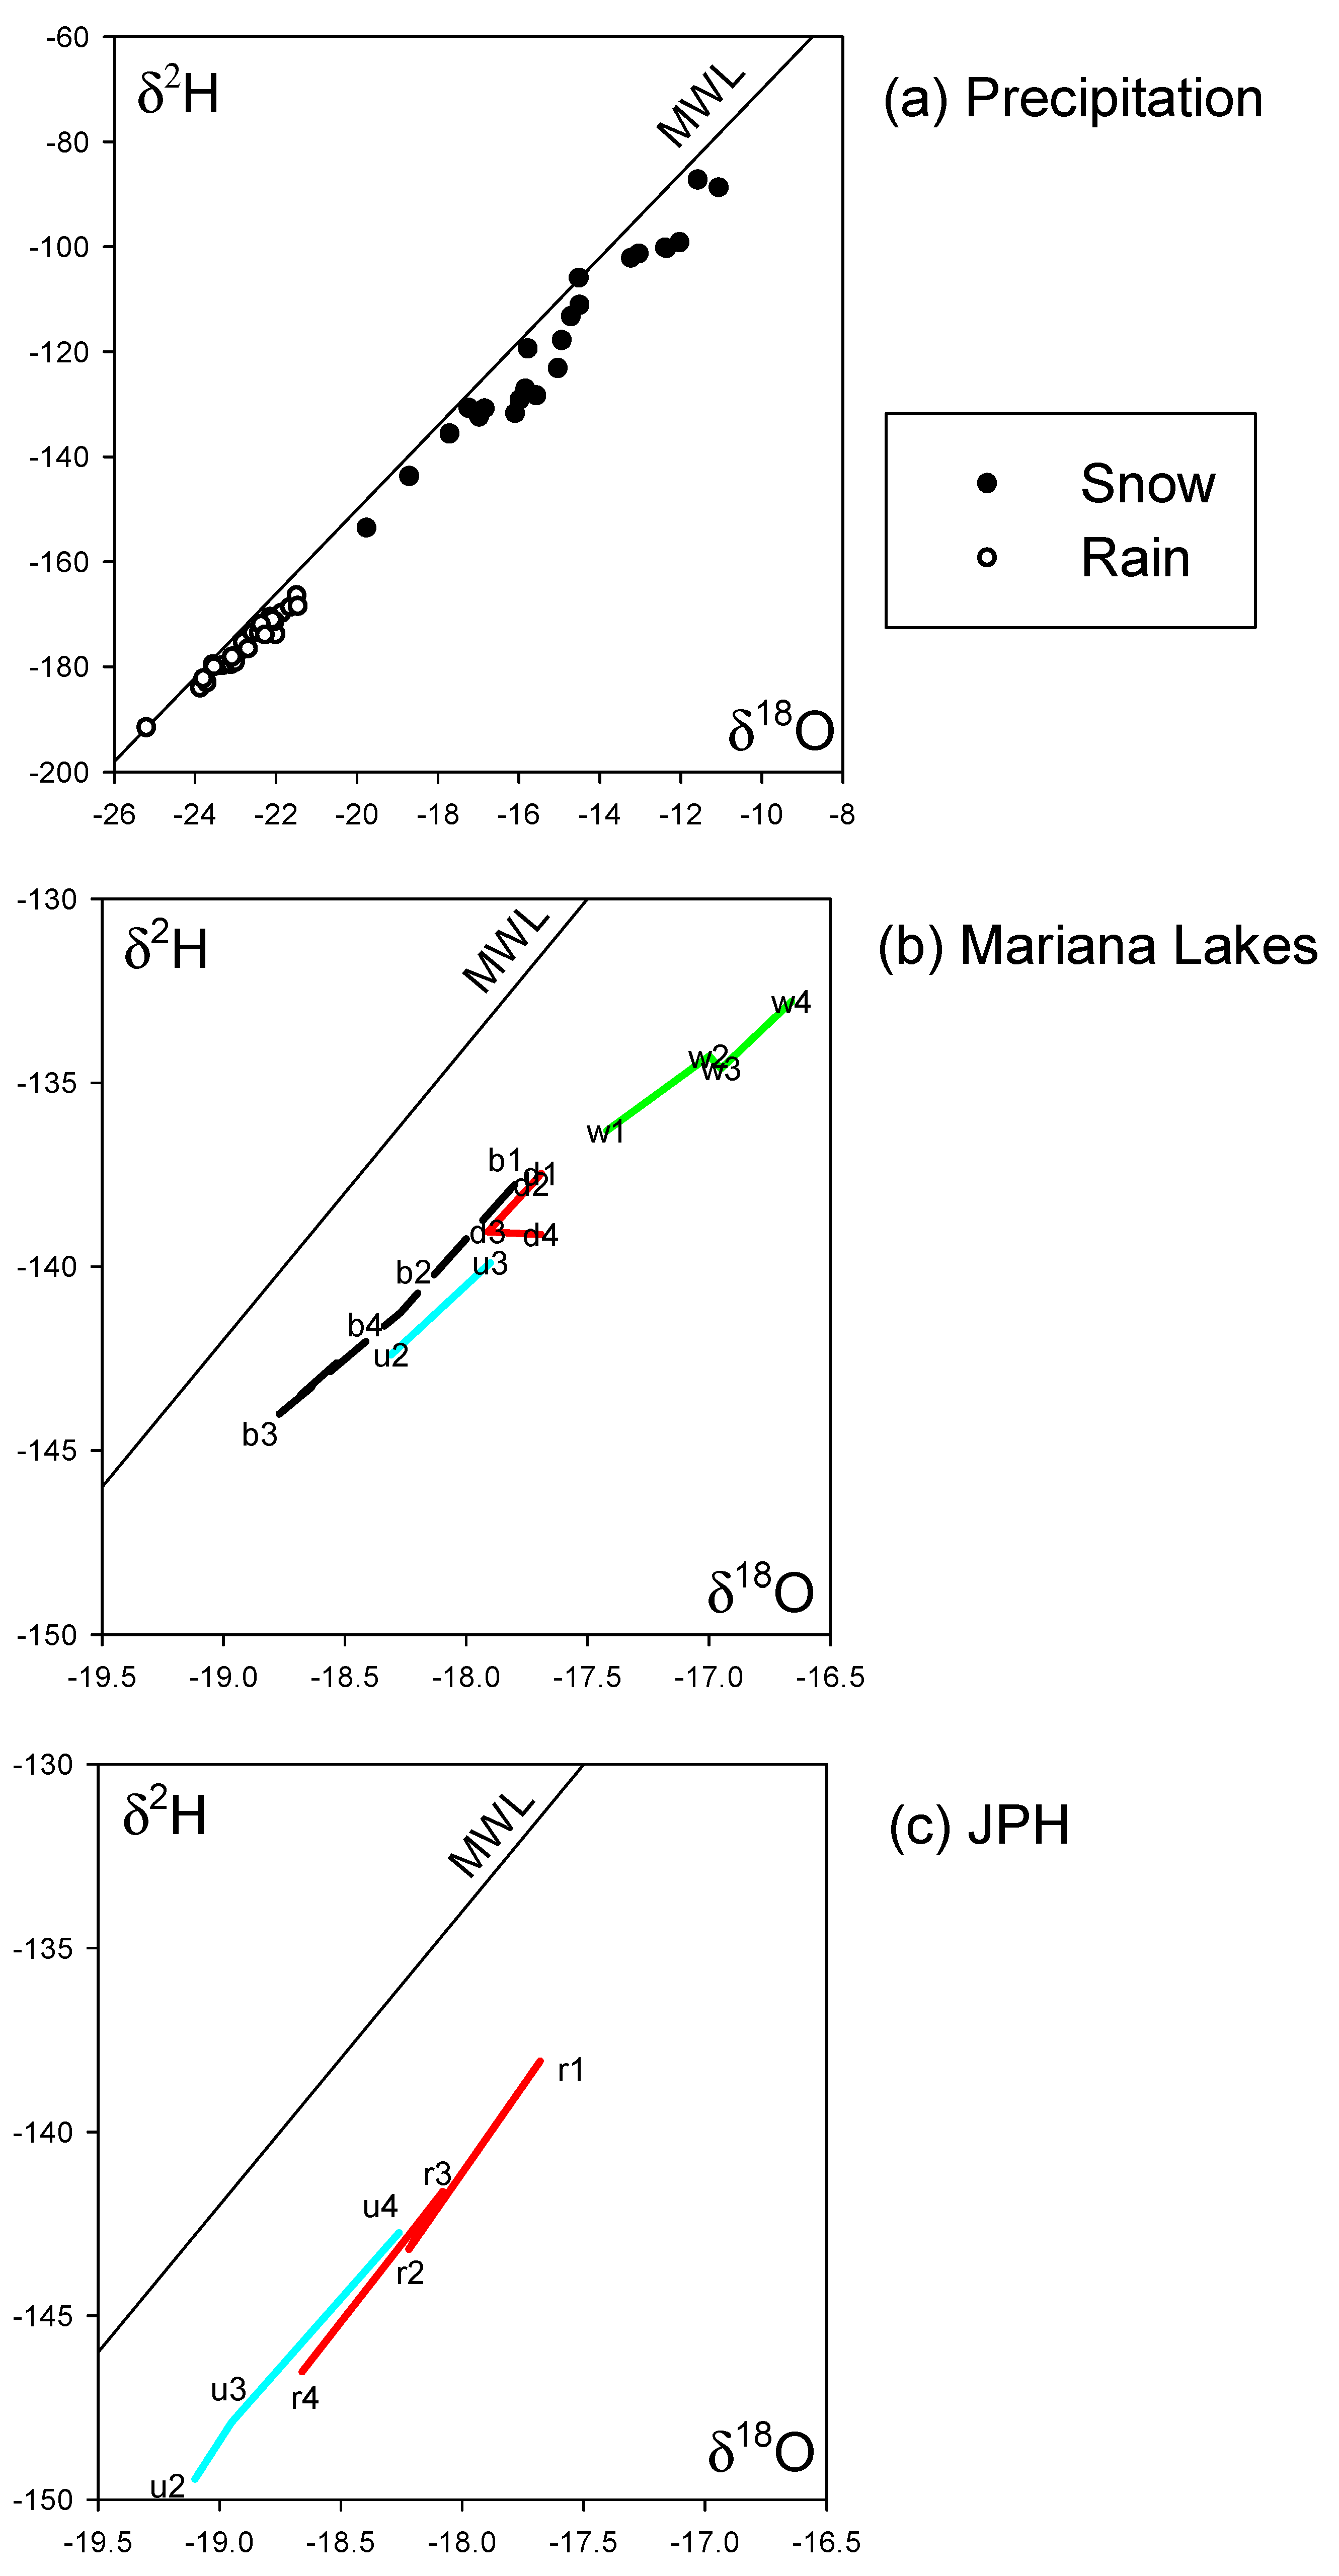
The stable isotope composition of surface water, groundwater, and precipitation was measured at JPH and ML as a method for gaining better understanding of the water cycle at the sites including the connectivity of various terrain units. A total of 792 samples were analyzed for oxygen-18 and deuterium. In general, the isotopic composition of waters was found to be useful in labelling the origin and mixing of various waters, for determining the influence of evaporative enrichment, and for assessing upward, downward, or lateral hydraulic gradients. The isotopic composition of snow and rain were found to plot close to the global meteoric water line (GMWL;
Figure 5a) with rain being enriched relative to snow. Similar patterns have been described previously in the region [
2,
22]. The isotopic composition of wetlands and uplands were found to plot below the GMWL, along linear trends that reveal differential influences of evaporation. Graphs showing a collection of individual isotopic data sorted by terrain type are provided in
Figure S1. Average δ
18O and δ
2H measured in porewater for different terrain units at discrete depth-intervals is provided in
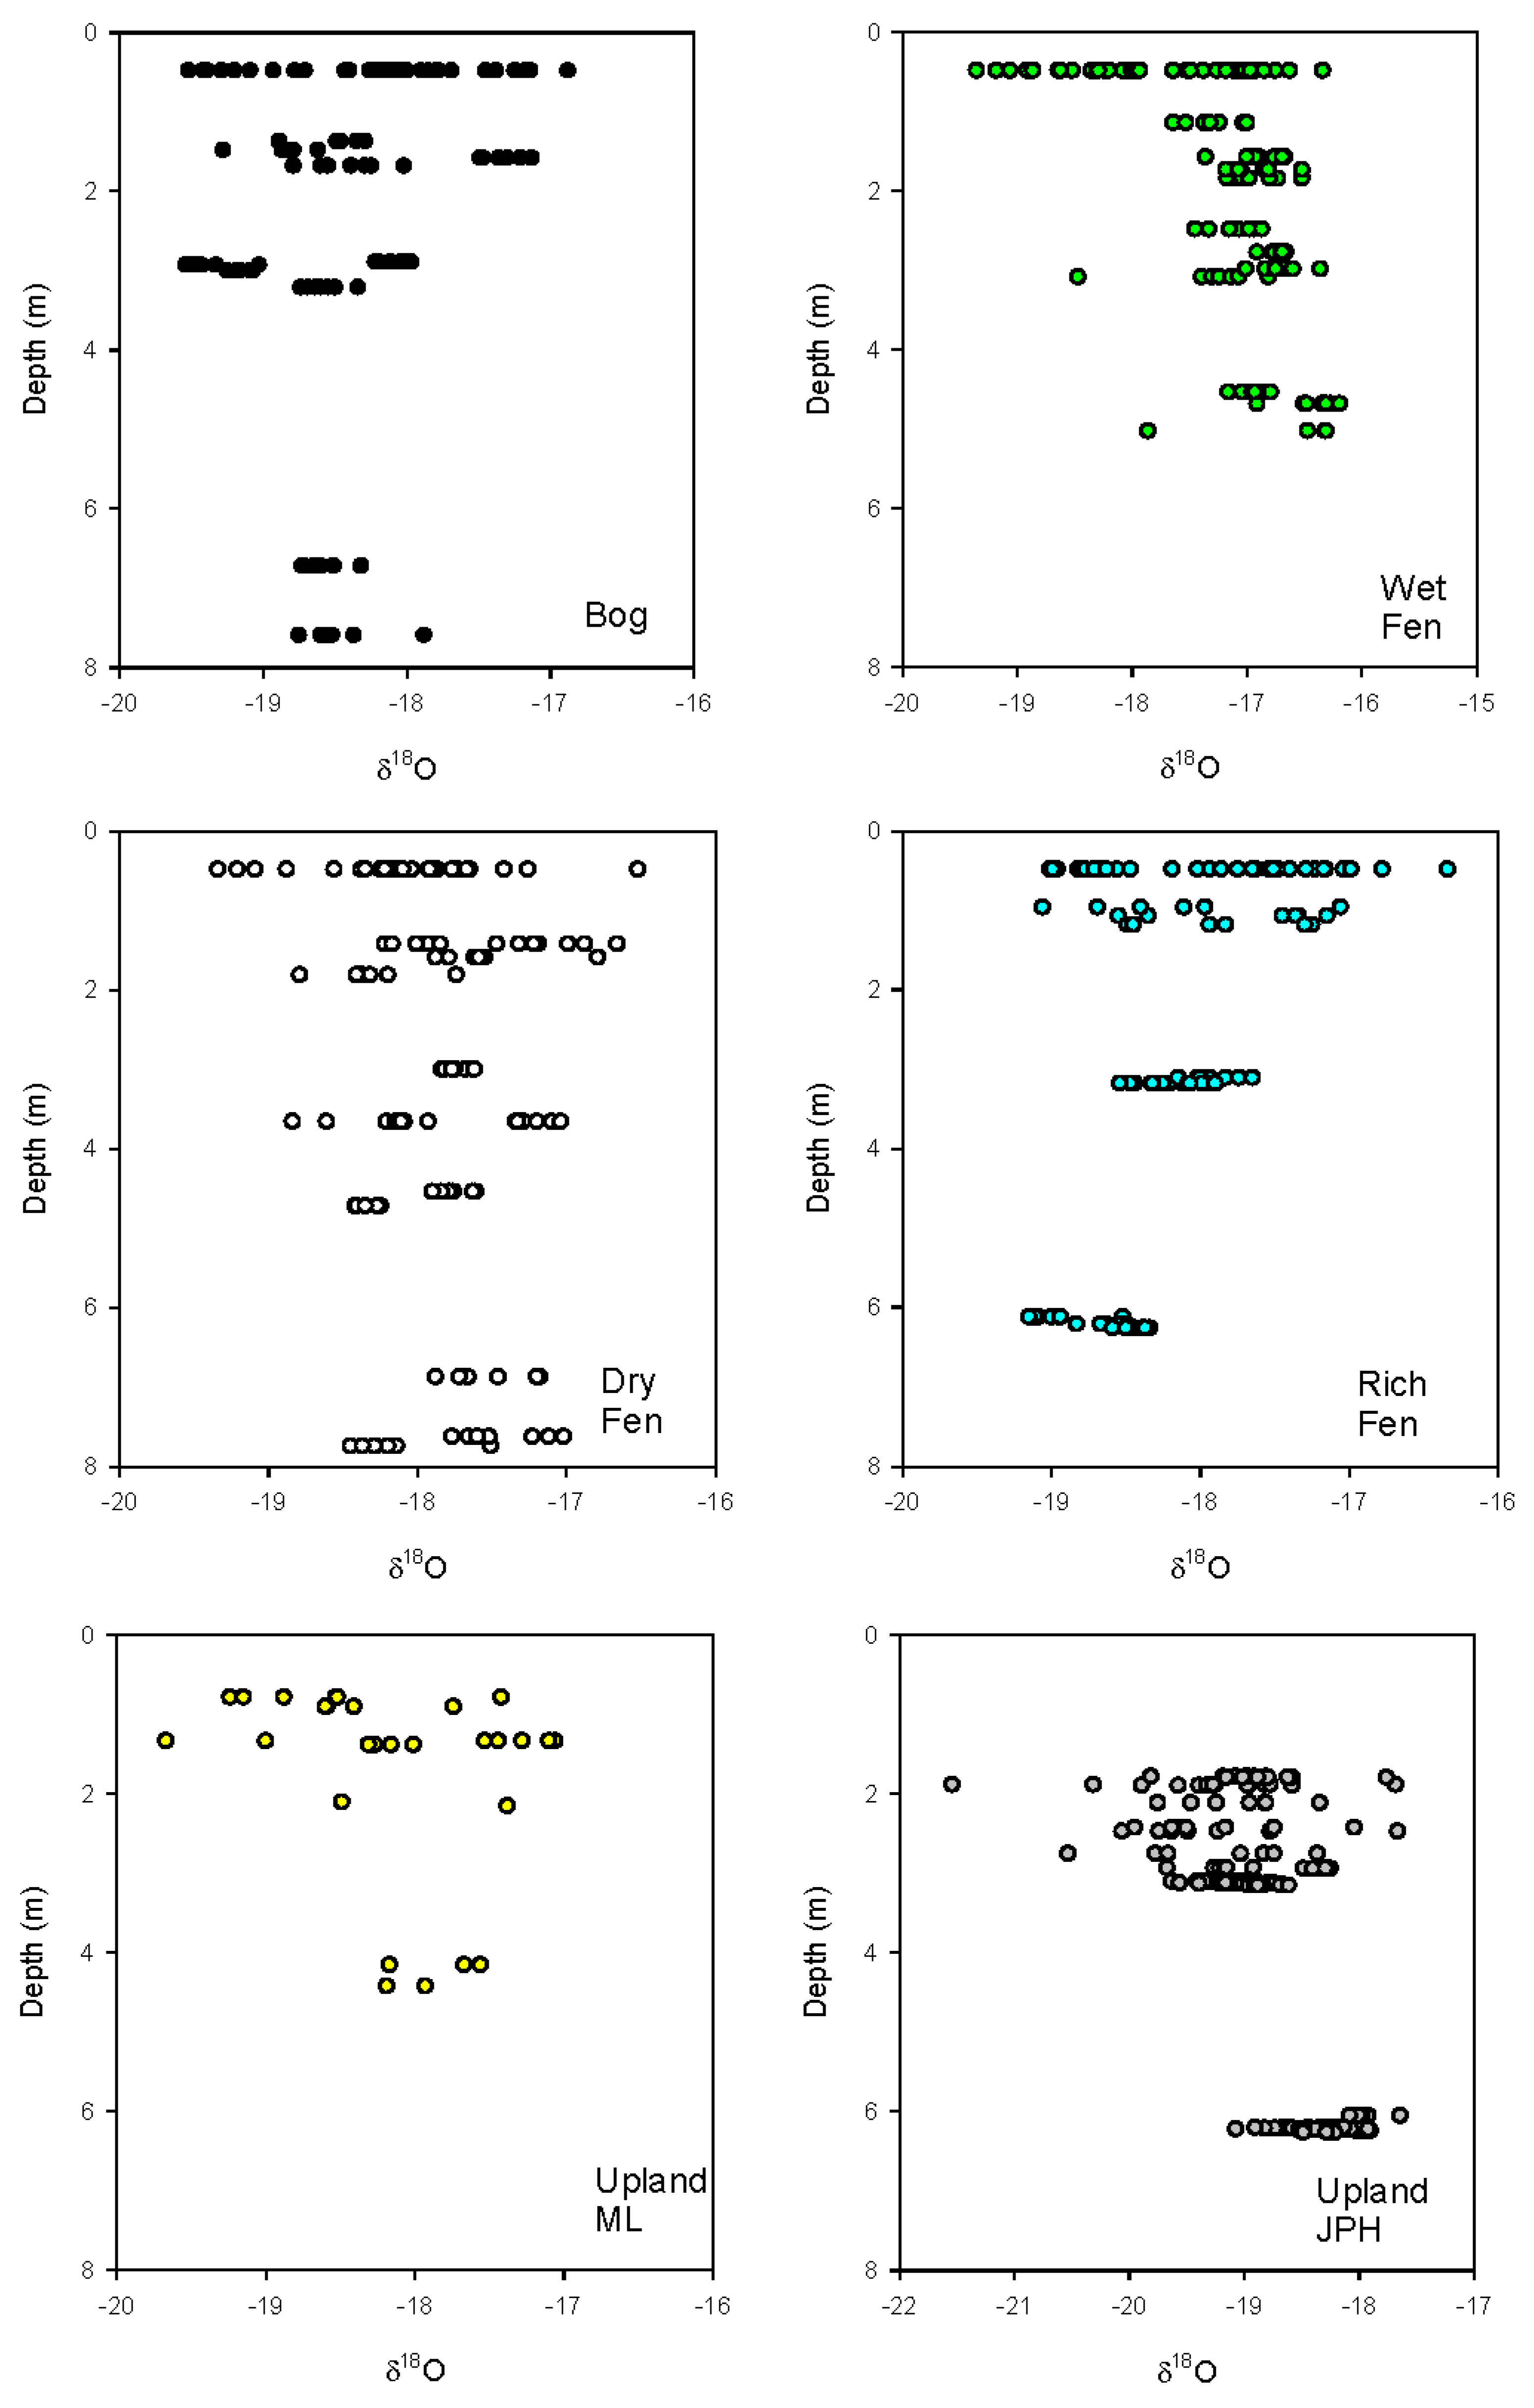
Figure 5b,c. Depth-wise variations in δ
18O for individual water samples in various terrain types are shown in
Figure 6. In general, depth-wise variations show wider variations in the water table and near-surface piezometers due to seasonal variations in the isotopic composition of precipitation (rain versus snow). Deeper layers in the soil are more uniform due to longer residence times and mixing and consequently are more reflective of long-term inputs. In general, downward gradients are inferred where isotopic gradients are positive (i.e., enriching with depth), whereas upward flow is inferred where isotopic gradients are negative (i.e., depleting with depth). Stagnant or lateral flow is inferred where gradients are neutral. Due to the very low hydraulic conductivity of peat it is possible that deeper layers may also inherit signals from recharge under different climatic conditions. The following specific observations are noted for the various terrain units:
Bogs have negative or neutral isotopic profiles suggesting upward gradients (possibly driven by evaporation) or stagnancy;
Dry fens have neutral isotopic profiles suggesting weaker flow dynamics or stagnancy;
Wet fens have positive isotopic profiles suggesting downward gradients;
Fen edge sites (not shown) have a negative isotopic profile suggesting upward gradients;
Rich fens have negative isotopic profiles suggesting upward gradients;
Uplands have positive isotopic profiles suggesting downward gradients.
δ
18O versus δ
2H plots (
Figure 5), showing average values for different terrain units/depths, confirm that ML waters plot along a local evaporation line with a slope close to 6.0, suggesting that evaporation loss is a major driver of enrichment. While JPH waters are offset below the GMWL and therefore record some evaporative losses, isotopic variations at the site occur predominantly along a trend subparallel to the GMWL, indicating higher rates of vertical flushing. At both sites, depth-wise trends for uplands (2) and wet fen are shown to be enriching with depth (i.e., downward gradients), whereas rich fen becomes more depleted with depth (i.e., upward gradient). Dry fen is found to be varying only slightly, whereas bog is depleting from surface to intermediate levels and then is enriching, suggesting more complex behaviour.
Hydrologic connections (groundwater flow) between adjacent upland and rich fen at JPH are consistent with observed hydraulic and isotopic gradients, and isotopic signature of deep piezometers in the rich fen are consistent with intermediate to deep sources from the upland.
Hydrologic connections (groundwater flow) from adjacent uplands to the fen edge at Mariana Lakes are consistent with observed hydraulic and isotopic gradients, and isotopic signature of the fen edge is consistent with intermediate sources from the upland. Based on the similarity in isotopic signature, hydrologic interaction between bogs and dry fens appears to occur near surface, but at intermediate to deeper levels shifts in isotopic composition may suggest that dry fens also interact with upland-type waters.
It is apparent from examining the isotopic data that the hydrologic differences in the bog—dry fen—wet fen continuum are preserved in the porewater isotopic signatures (
Figure 5).
3.4. Hydrogeochemistry
The average pH of groundwater increased with depth and along the bog—poor fen—rich fen gradient (
Table S2). At the near surface (WT depth), the average pH of samples was 4.28 for bog, 4.43 for poor fen (dry), 4.45 for poor fen (wet), and 5.81 for rich fen. In the deepest piezometers, bog, dry fen, wet fen, and rich fen water samples were near neutral (7.05, 7.94, 6.65 and 6.92 respectively), and slightly basic near the fen edge (8.75). In upland landscape units the average pH of groundwater also increased with depth, from 7.06 to 10.75 at ML and from 5.96 to 6.19 at JPH.
Eh was typically positive near surface in the fens, indicating oxidizing conditions, and approached more negative values with depth, indicating more reducing conditions. Bogs tended to be less reducing overall than fens, and uplands displayed more variable conditions: reducing at depth at JPH and oxidizing at depth at ML.
The average conductivity of wetland water samples at ML (
Table S2) increased with depth, from 29 to 576 μS·cm
−1 for bog, from 26 to 2025 μS·cm
−1 for dry fen, and 23 to 421 μS·cm
−1 for wet fen. Note that the deepest wetland piezometers may be in contact with mineral substrates. Conductivity representative of the bottom of the peat is more likely in the range of 93 to 199 μS·cm
−1, as noted for medium depth piezometers. The average conductivity of near surface wetland samples was higher for the rich fen at JPH fen (74 μS·cm
−1) than poor fen or bog and increased with depth (to 203 μS·cm
−1). Conductivity for uplands at JPH ranged from 41 μS·cm
−1 at surface to 93 μS·cm
−1 at depth. Although gradients were not measured at ML uplands, conductivity for the near-surface piezometers averaged 176 μS·cm
−1.
Both the alkalinity and dissolved inorganic carbon (DIC) showed systematic increases from surface to depth across the bog to rich fen continuum, and as anticipated, were highly correlated. DIC was found to range from 114 to 872 mg·L−1 for bog, 146 to 1059 mg·L−1 for dry fen, 149 to 492 mg·L−1 for wet fen, and 70 to 234 mg·L−1 for rich fen. Uplands at ML and JPH had DIC in the range of 57 to 101 mg·L−1 and 36 to 168 mg·L−1, respectively.
Dissolved organic carbon (DOC) concentrations were generally higher at ML (29–73 mg·L−1) than at JPH (7.2–22 mg·L−1). In the near surface zone (WT depth), DOC average concentrations of samples decreased along the bog—rich fen gradient: 73 mg·L−1, 63 mg·L−1, 54 mg·L−1 and 22 mg·L−1 for bog, dry fen, wet fen, and rich fen, respectively. Compared to near surface samples, DOC concentrations of ML bogs decreased slightly in shallow and mid-depth piezometers and then increased to 111 mg·L−1 in the deepest piezometers. For ML fens, DOC was higher in shallow and mid-depth piezometers (62–77 mg·L−1) than in WT (43–50 mg·L−1) or deepest piezometers (45–57 mg·L−1). At JPH, a systematic decrease in DOC was noted between shallow (32 mg·L−1) and deep (9 mg·L−1) piezometers located in the rich fens. DOC at upland sites also increased with depth; for JPH (1.8 to 18 mg·L−1) and ML (7 to 20 mg·L−1). DOC was strongly correlated with dissolved organic nitrogen (DON), which is attributed to similar controlling mechanisms (i.e., peat decomposition and pH).
Trends for major ion concentrations were consistent with those noted for conductivity (
Table S2). Whereas wetland, near-surface ion concentrations of waters were lower at ML than JPH, increases with depth were greater at ML than JPH. For example, calcium average concentrations increased with depth from 1.3 to 118 mg·L
−1 for bog, 1.5 to 142 mg·L
−1 for dry fen, 1.2 to 24 mg·L
−1 for wet fen, and 7.4 to 26 mg·L
−1 for rich fen. Throughout the porewater profile at JPH, cation concentrations followed the pattern: Ca
2+ > Na
+ ≈ Mg
2+ > K
+ > NH
4+. At ML, different patterns were noted at surface versus at depth and for different terrain units. Near surface cations in bog and fen units followed the pattern: Ca
2+ > Na
+ ≥ K
+ > Mg
2+ > NH
4+ whereas for uplands Mg
2+ and K
+ were reversed. At depth, the pattern for bog and fen units was Ca
2+ > Mg
2+ > NH
4+ > Na
+ > K
+. For uplands, Na+ was more abundant than NH4+. The average concentrations of sulfate were lower for ML than JPH. Sulfate concentrations typically decreased with depth in uplands, from 3.1 to 1.5 mg·L
−1 for ML and 8.3 to 2.5 mg·L
−1 for JPH. Sulfate tended to peak at shallow to intermediate depths in the wetlands, ranging from 0.07 to 0.53 mg·L
−1 for poor fen (both dry and wet), 0.18 to 0.31 mg·L
−1 for bog, and 0.95 to 7.3 mg·L
−1 for rich fen. While uplands and rich fen sites tend to be dominated by SO
42−, particularly at surface, poor fens and bogs have NO
3− > SO
42− at surface and along the fen edges and SO
42− > NO
3− at depth. Hydrogen sulfide was also measured, and average concentrations were generally <0.04 mg·L
−1, except at a 6.5 m depth at the JPH upland (0.14 ± 0.11 mg·L
−1) and at the JPH fen (0.38 ± 0.25 mg·L
−1 at a 1.5 m depth, and 0.20 ± 0.09 mg·L
−1 at a 3 m depth).
Mean stable isotope signatures of δ
13C
DIC at wetland landscape units increased with depth (
Table S2). The average δ
13C values in DIC increased with depth from −14.60‰ to +6.84‰ for bog, and similarly though within smaller ranges for poor fen at ML; from −11.37‰ to +9.92‰ for dry fen and −6.50 to 4.29‰ for wet fen. In contrast, the average δ
13C values of DIC were relatively depleted for rich fen at JPH, also increasing with depth, from −18.49‰ to −13.98‰. Uplands at JPH showed similar depth-wise trends in δ
13C, ranging from −19.41 to −13.00‰, although profiles for upland at ML were relatively constant (−17.57 to −20.86‰). In general, δ
13C in DIC closely follows the changes noted in the alkalinity and DIC concentrations.
The average signatures of stable isotopes of water from peatland near surface waters (WT depth) were similar: average δ
18O values ranged from −17.42‰ to −17.92‰. At depth δ
18O was ranged from −18.08‰ to −18.66‰ for rich fen, −17.69‰ to −17.91‰ for dry fen, and −17.80‰ to −18.77‰ for bog. Wet fens are enriched at depth compared to other wetland types, ranging from −16.66‰ to −17.0‰. Ranges in δ
13C
PM, reflecting particulate sources of carbon in the porewater of the wetlands and soils, are also shown (
Table S2) and confirm that most particulates are organic in origin. Ranges in δ
15N
PM likewise, reflect variations in the sources of nitrogen to the wetland.
Ammonium (NH4+) in porewaters increased with depth in bog, dry fen and upland units, but peaked at shallow or mid-depth in wet fens. The steepest gradients are noted for bog and dry fen, with average ammonium concentrations increasing from 0.07 to 23 mg·L−1 and 0.04 to 24 mg·L−1, respectively. Weaker gradients were noted for uplands: 0.02 to 0.14 mg·L−1 for JPH and 0.22 to 0.42 mg·L−1 for ML. The rich fen had a near-constant depth profile. Overall, similar trends were noted for DON, with highest concentrations reaching 21.2 mg·L−1 at depth in dry fen areas.
Nitrates (NO
3−) ranged from 0.82 to 2.62 mg·L
−1 at JPH, peaking in mid-depth piezometers in the rich fen and deep piezometers in the upland. At ML, NO
3− peaked at surface in bog and dry fen units, ranging from 1.03 to 1.35 mg·L
−1 near surface to 0 to 0.18 mg·L
−1 at depth. Wet fens and upland were generally in the same range but showed NO
3− peaks at mid-depth (
Table S2).
Nitrites (NO
2−) are not included in
Table S2 as they were either absent or present in very low concentrations. At JPH, upland sites were found to have NO
2− in porewaters which decreased with depth from 0.24 to 0.07 mg·L
−1 [
25,
26]. NO
2− was absent in the rich fen. At ML trace quantities of NO
2− were observed in fen and bog with highest concentrations at surface and in the wet fen [
25,
26]. Extremely low concentrations of nitrite are found throughout the rest of the peatland and uplands.
Overall, one of the main processes that controls geochemistry of the wetlands is methanogenesis, which is associated with reducing conditions and leads to the consumption of DOC and production of DIC. The characteristic pattern observed is for an increase in pH, conductivity, and alkalinity and a decrease in redox potential with depth. The other major geochemical process is mineral soil weathering which leads to higher conductivity and major ion concentrations in uplands, as well as in the bottom-most piezometers in wetlands that were driven to refusal at the mineral soil interface.
Temperature gradients in the bogs were also found to be steeper than in fens with coldest average temperatures (8.3 °C) noted for deep bog piezometers. Bogs in the area are well insulated, often raised above groundwater influence and therefore relatively cool, and have been known to contain permafrost in some cases. Enhanced groundwater exchange in fens and uplands is likely responsible for higher temperatures in these terrain units.
3.5. Nitrogen Inventory and Cycling
Based on the geochemical analysis of 889 water samples at the two sites we have developed an understanding of nitrogen species distributions within the upland and wetland systems at JPH and ML. Quantitative summaries of NO
3−, NH
4+, and DON concentrations are provided in
Table S2. Limited results available for NO
2− were described previously [
25,
26]. A summary of the speciation results is provided in
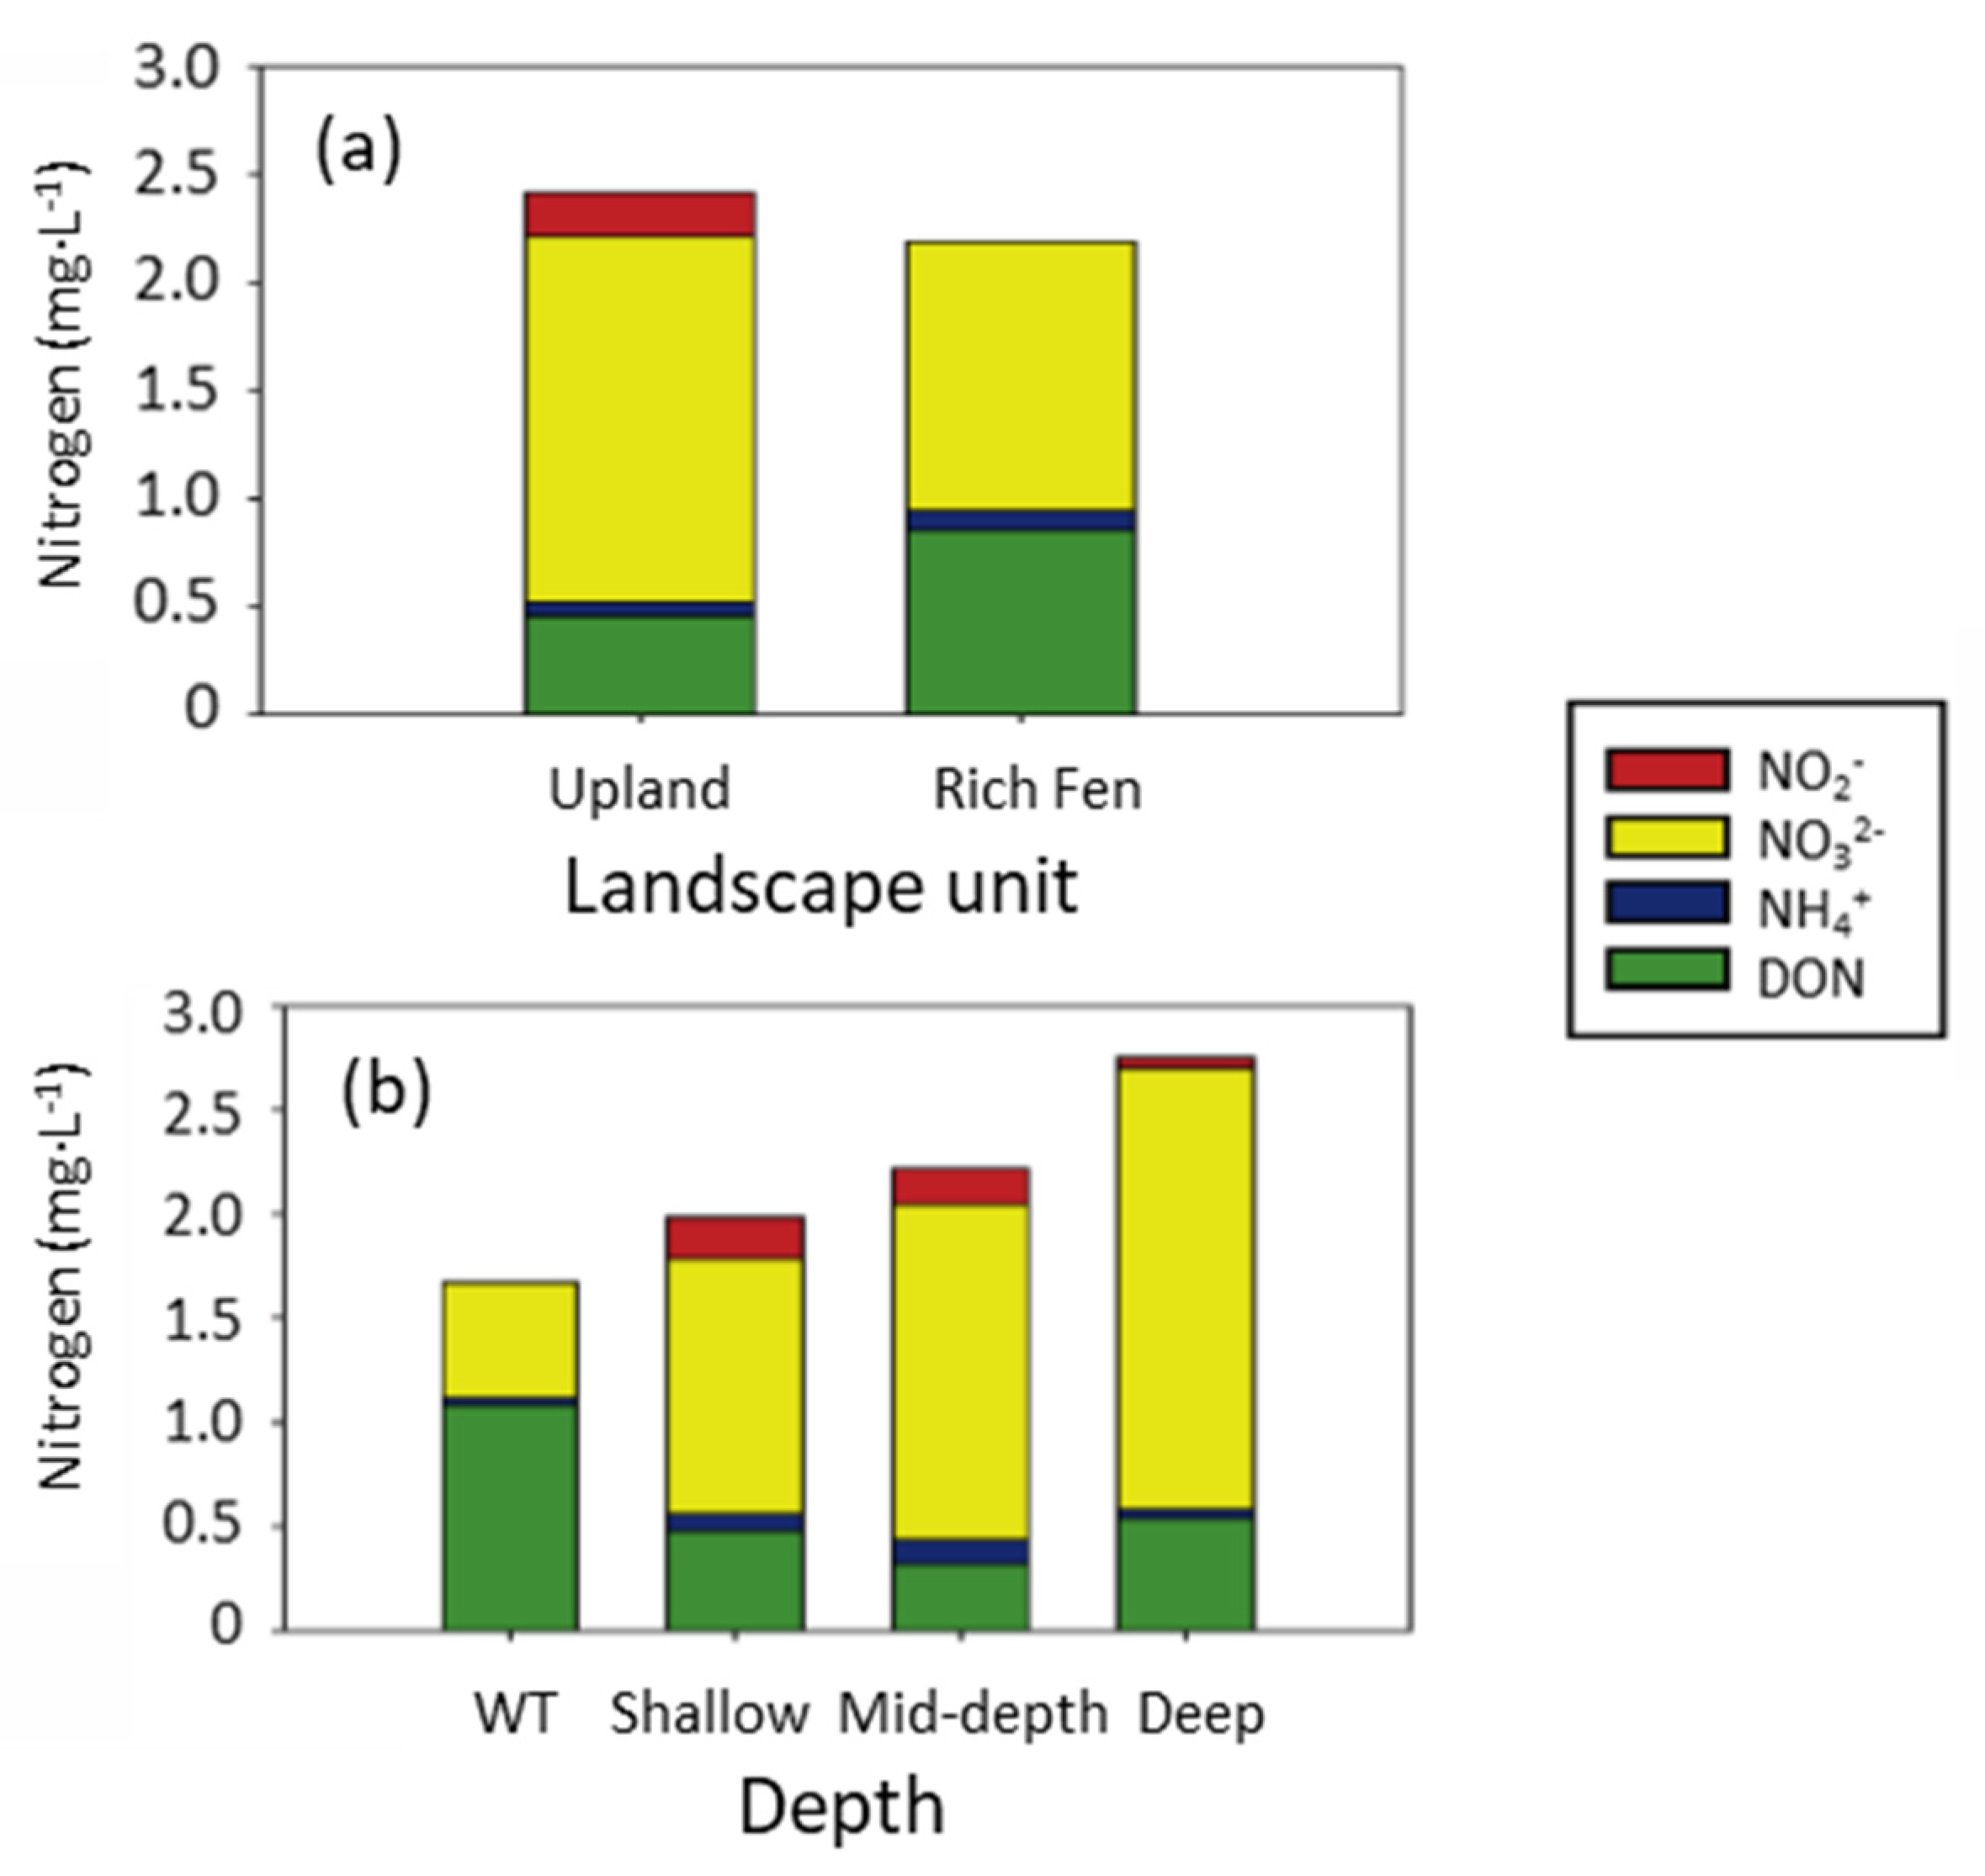
Figure 8 (JPH) and
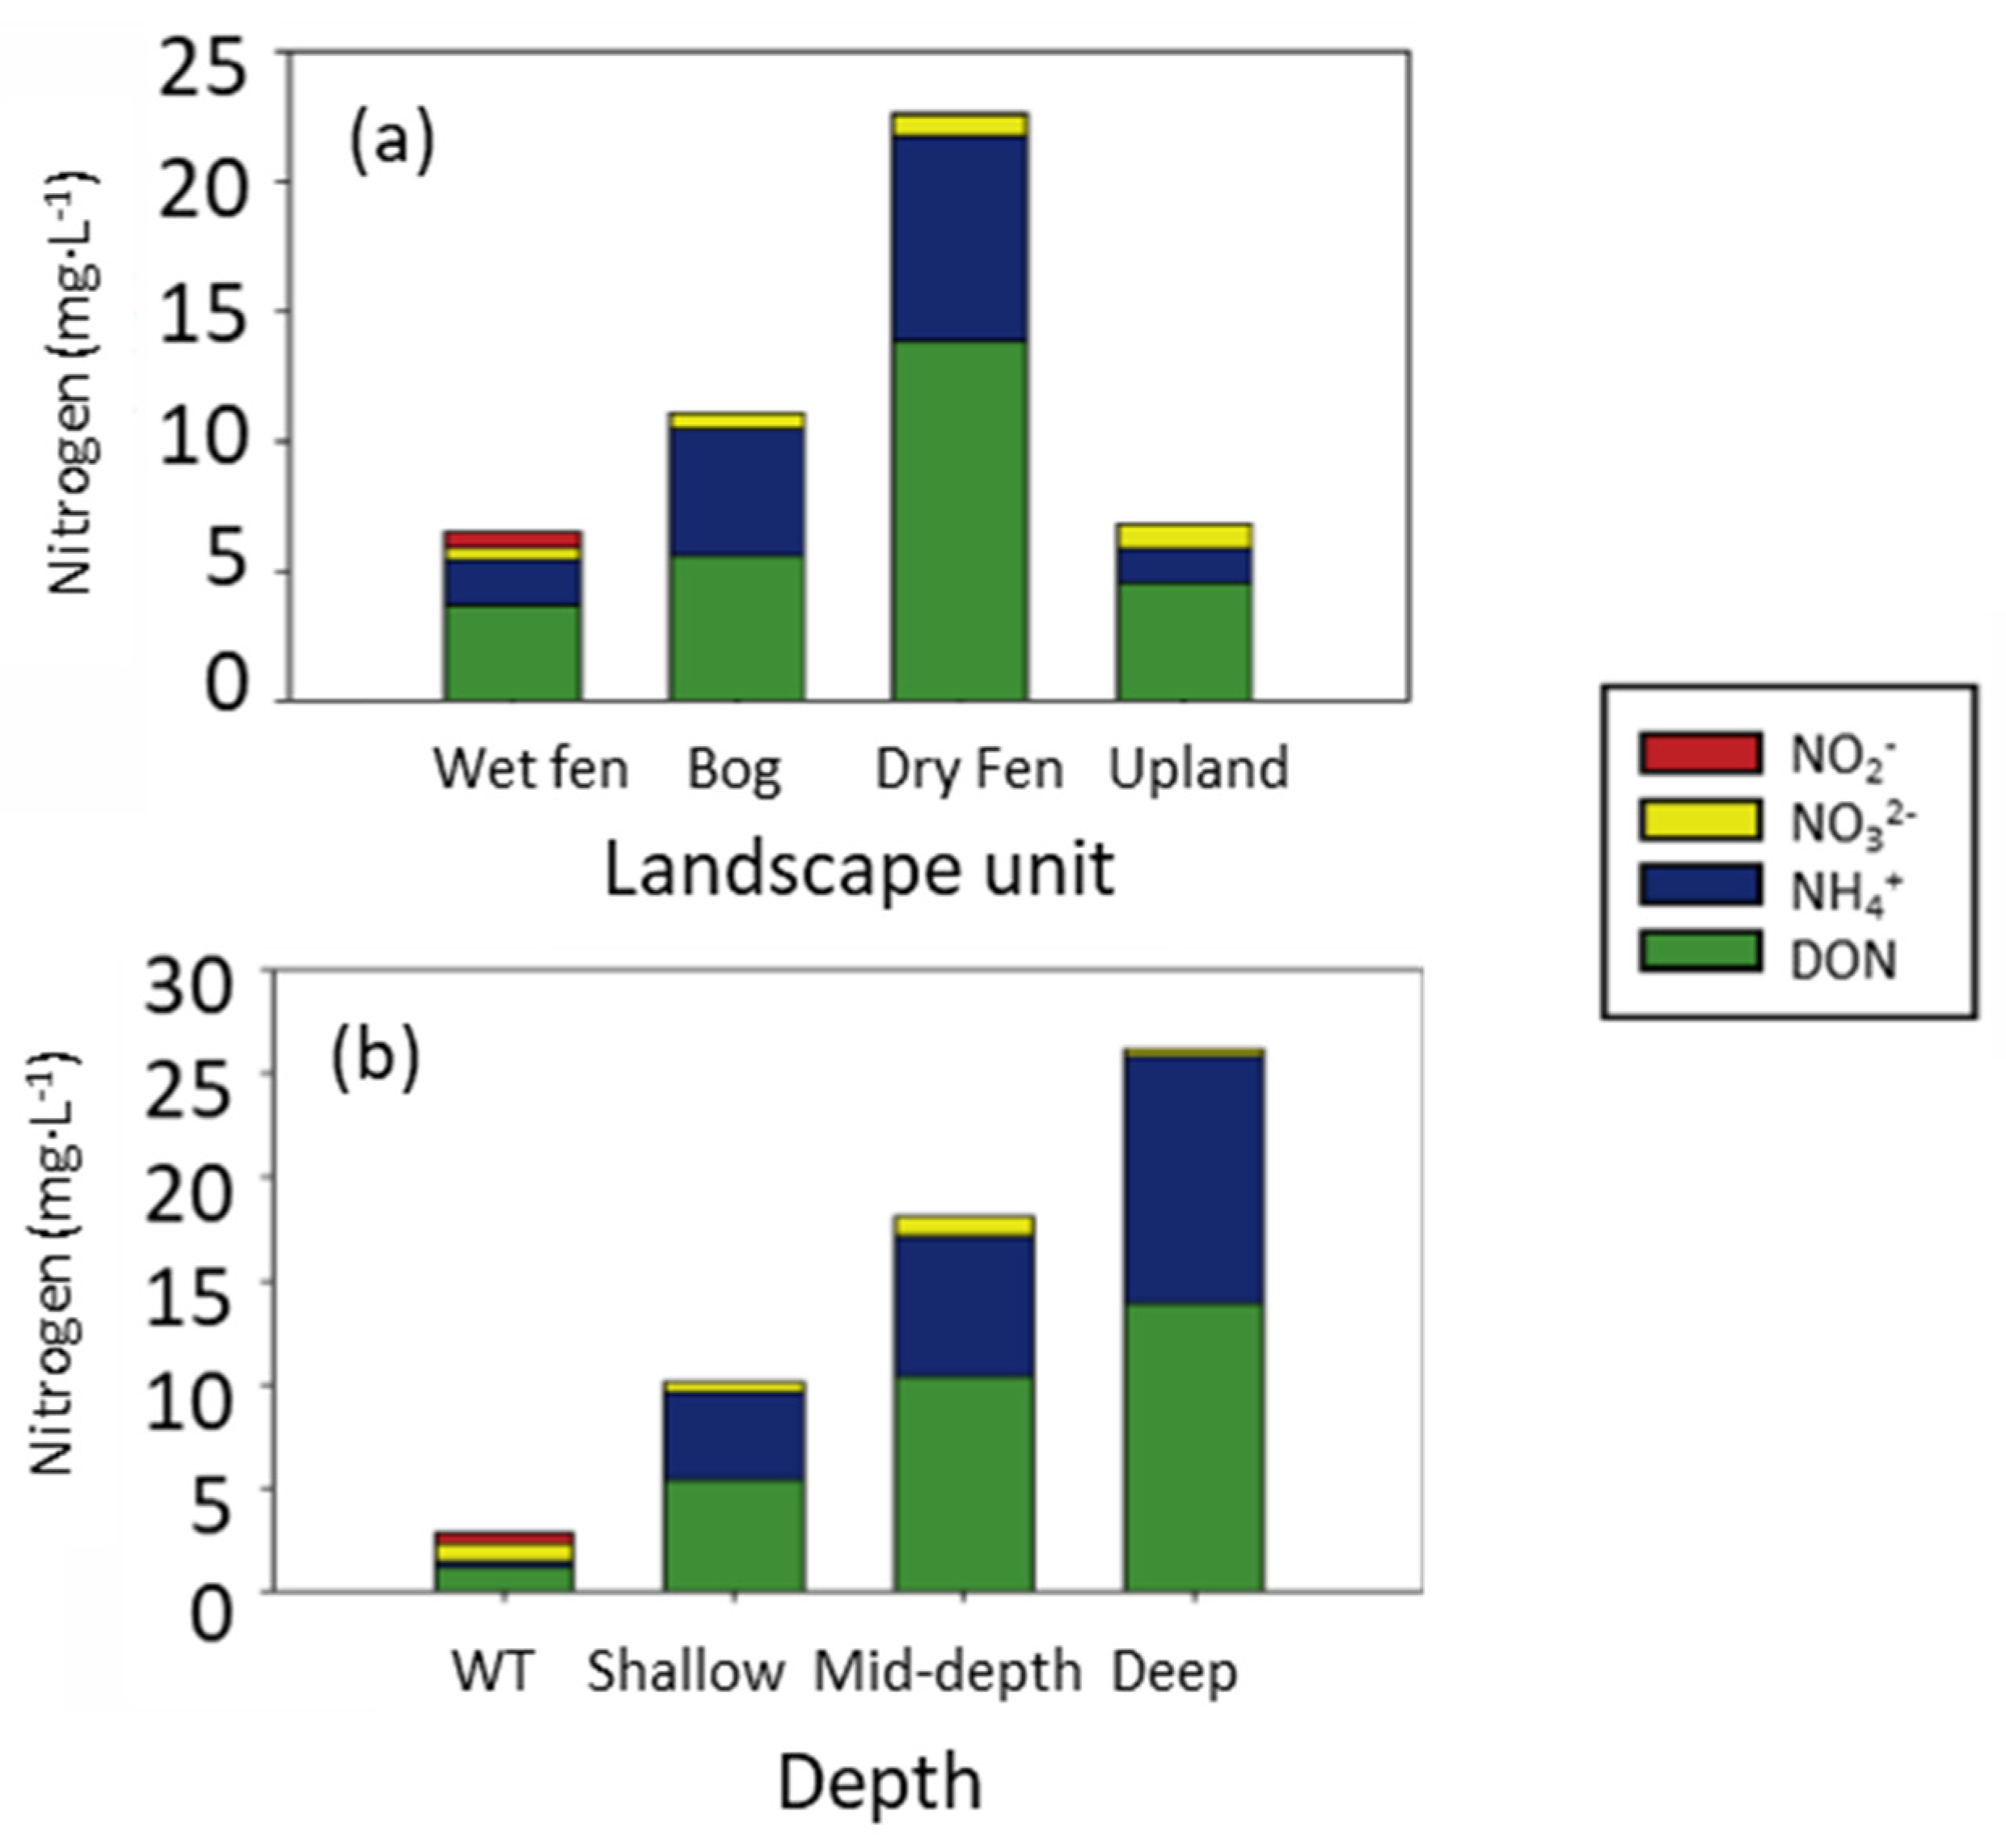
Figure 9 (ML).
Overall, it is evident that NO
3− is the dominant form of nitrogen at the JPH site, while DON and NH
4+ dominate at the ML site, with overall nitrogen concentrations approximately 10-fold higher at the ML site. Nitrogen is more abundant in upland soils than wetland soils at JPH, whereas at ML the nitrogen is distributed according to: dry fen > bog> wet fen ≈ upland. At JPH, NO
2− and NH
4+ show weak variations with depth, whereas DON tends to decrease slightly and NO
3− tends to increase slightly in upland soils. The nitrogen distribution reflects the production of DON (and DOC) in shallow forest soils, and the accumulation of NO
3− due to downward hydraulic gradients. At ML, nitrogen speciation appears to be strongly controlled by redox conditions, with NO
3− (and lesser NO
2−) being dominant at the water table and less important at depth. Reduced forms of nitrogen (NH
4+), as well as organic nitrogen in the form of DON, increase significantly with depth, especially in the ML wetland (
Figure 10). Due to the extremely low vertical hydraulic conductivity, these deeper stores are thought to be relatively immobile.
3.5.1. Nitrogen Storage Estimates at ML
The total inventories of NH
4+ and DON throughout the ML peatland were calculated using a simple linear regression approach based on observed correlation of average nitrogen concentrations measured at depth (
Table S3). While both species were found to generally increase in concentration with depth, the DON correlation was somewhat weaker. Note that our estimates did not consider peat stratigraphy or species-specific development and productivity [
27]. A porosity of 0.9 was used in accordance with Turcheneck [
28]. Nitrate and nitrite storage calculations were excluded due to their low concentrations throughout the peat. Units are expressed as kg·N·ha
−1. In general, ammonium concentration increases with depth and varies across landscape units. The bog has the highest ammonium storage of 512 kg·N·ha
−1 over the 7 m depth, while the wet fen shows the lowest storage of 313 kg·N·ha
−1. The dry fen lies between the two at 448 kg·N·ha
−1. From 0–3 m the bog and the dry fen show a similar storage of ammonium with 239 and 237 kg·N·ha
−1, respectively. The dry fen also shows the highest ammonium storage from 0–3 m (913 kg·N·ha
−1). The wet fen has the lowest storage throughout all depths. Overall the correlation between the DON concentrations and depth are weaker than with ammonium. The bog and wet fen show similar DON storage throughout all depths and increasing with depth ranging from 82 kg·N·ha
−1 from 0–3 m to 472 kg·N·ha
−1 from 0–7 m. The dry fen has DON storage values twice that of the bog and wet fen for all depths ranging from 219 kg·N·ha
−1 at 0–3 m to 1070 kg·N·ha
−1 from 0–7 m. Total N storage for the wetland is estimated at 963 kg·N·ha
−1, with total N storage following the general pattern: dry fen > bog > wet fen.
3.5.2. Mobility of Nitrogen Species in Groundwater and Surface Water
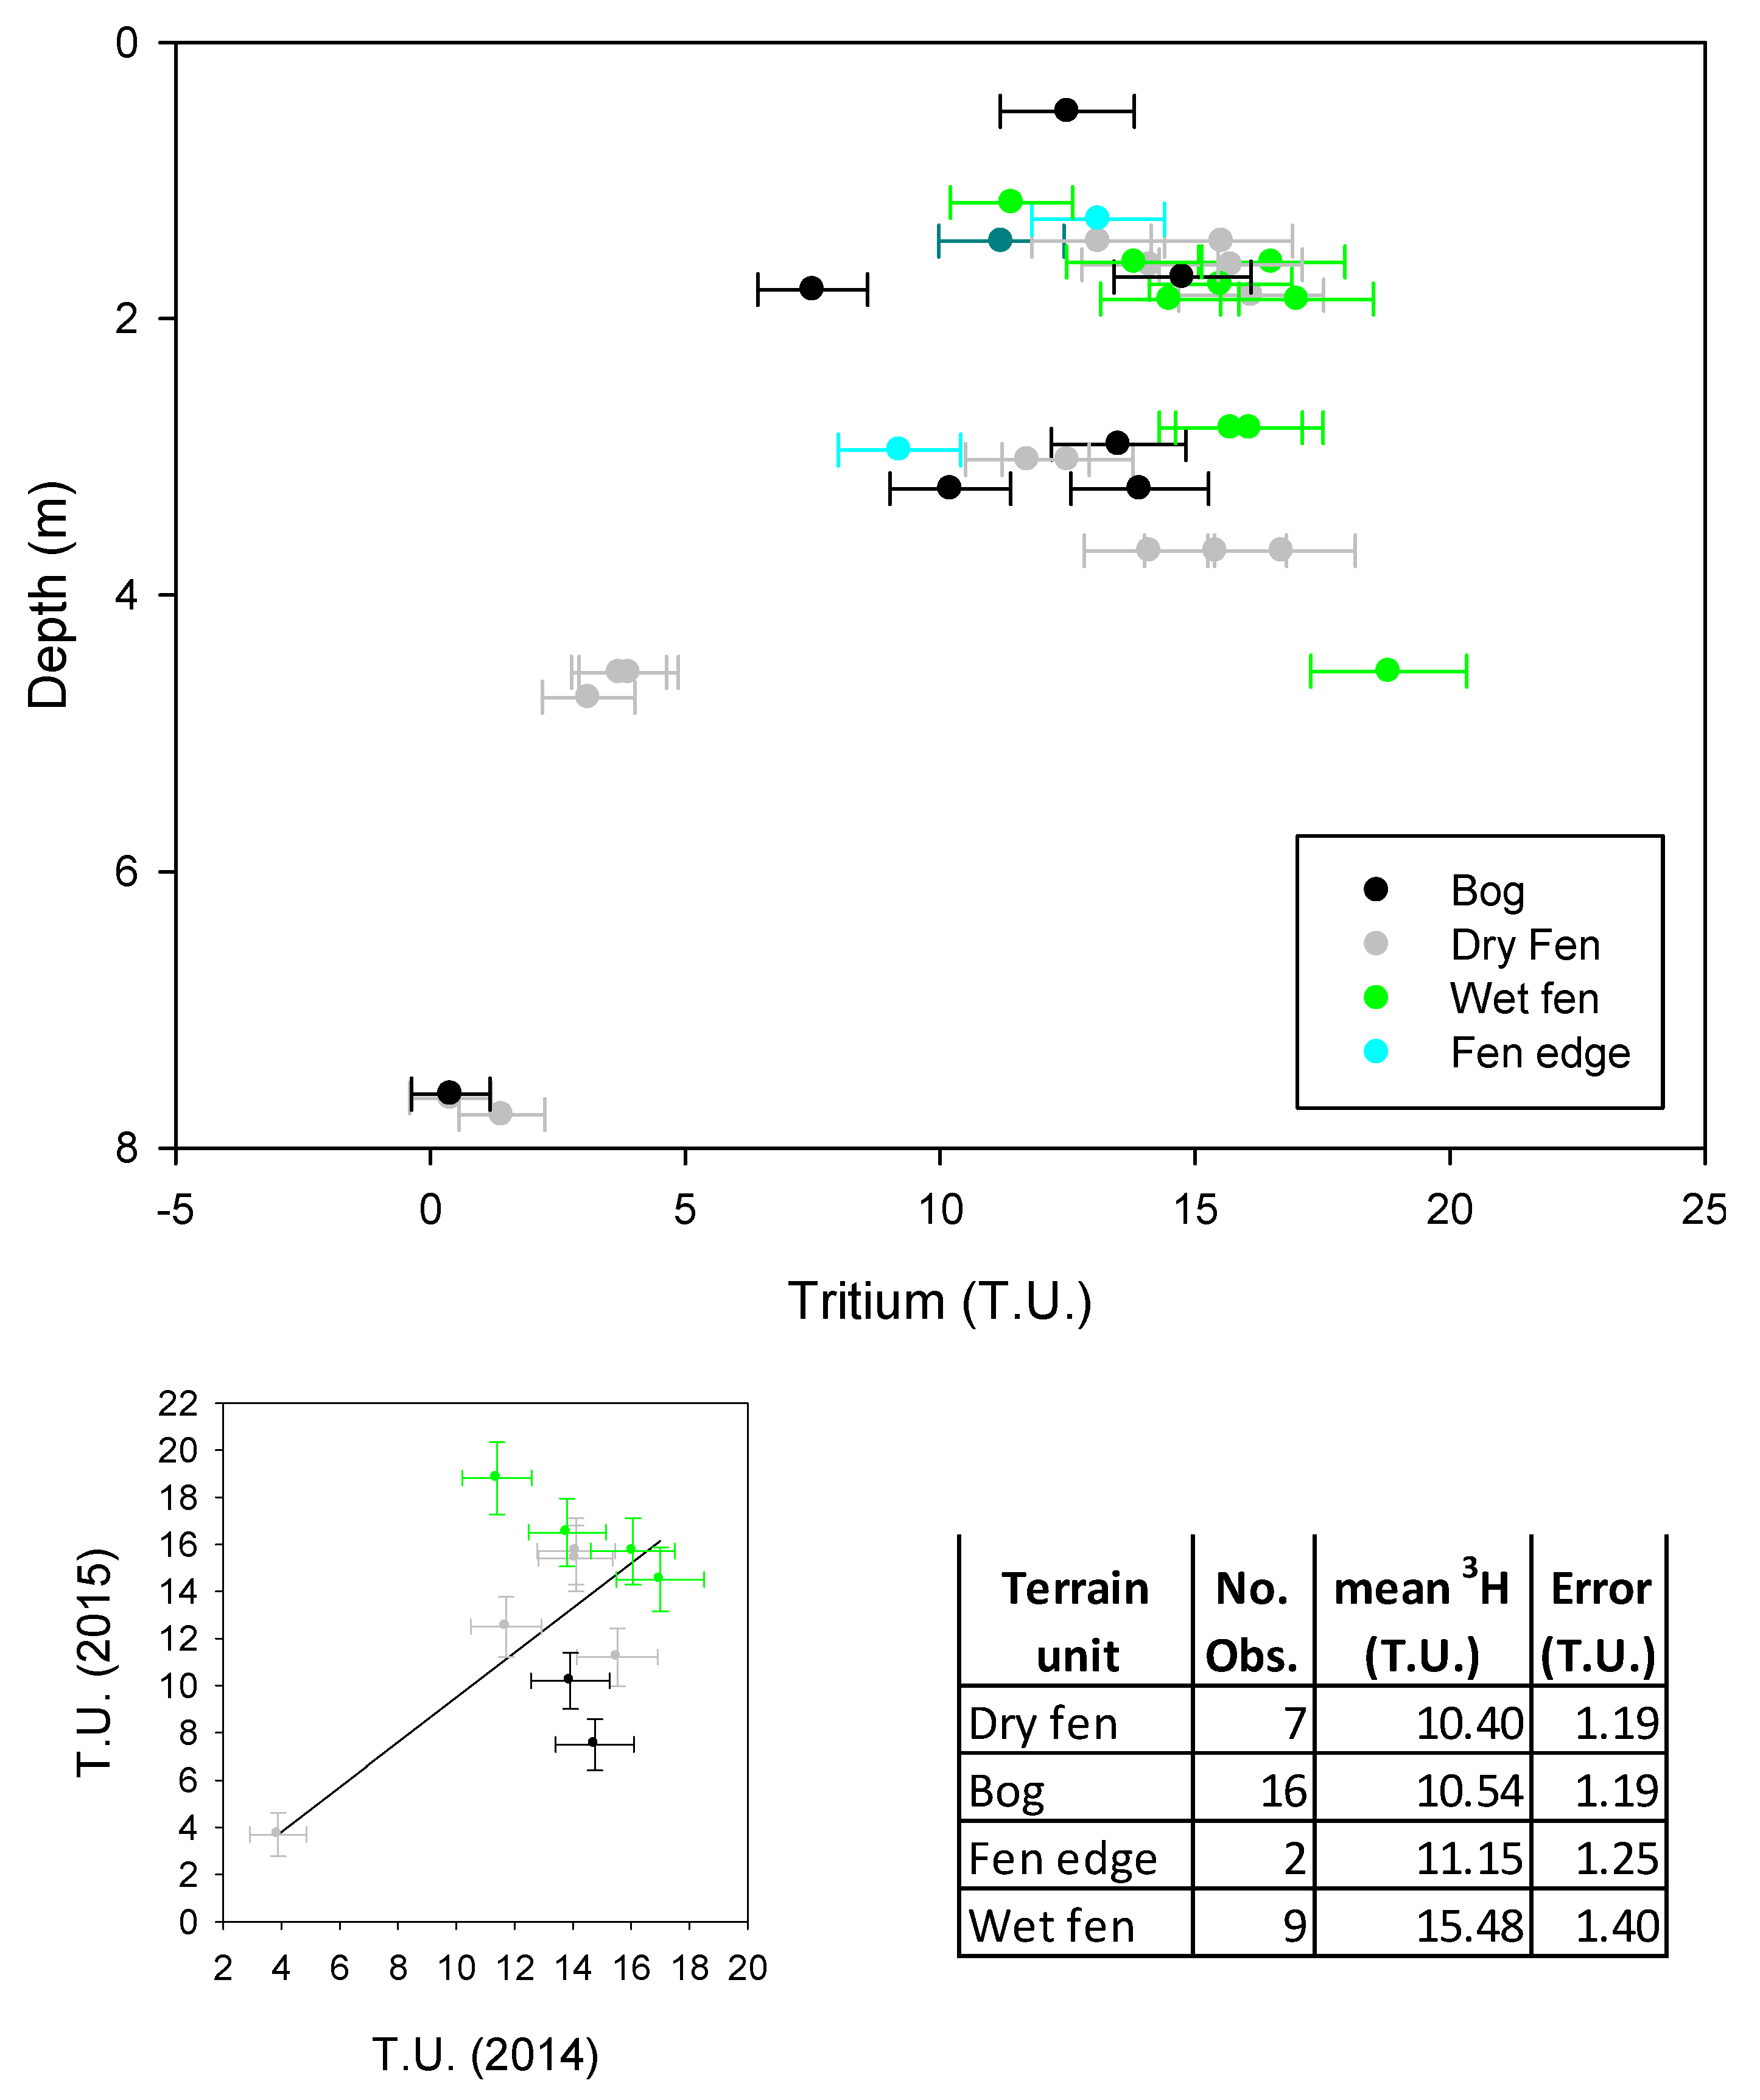
Correlations between the various nitrogen species and indicators of movement, such as depth, hydraulic conductivity, and tritium concentration, were used to gain insight into the zones of mobility for the various species. Depths for the various wells and piezometers were measured at the time of installation. Hydraulic conductivity was estimated based on a series of bail and slug tests carried out in 2011 and 2012, as noted previously. Tritium was measured on water sampled in 2014 and 2015, whereas the various nitrogen species were measured on water samples collected during 2011 to 2015.
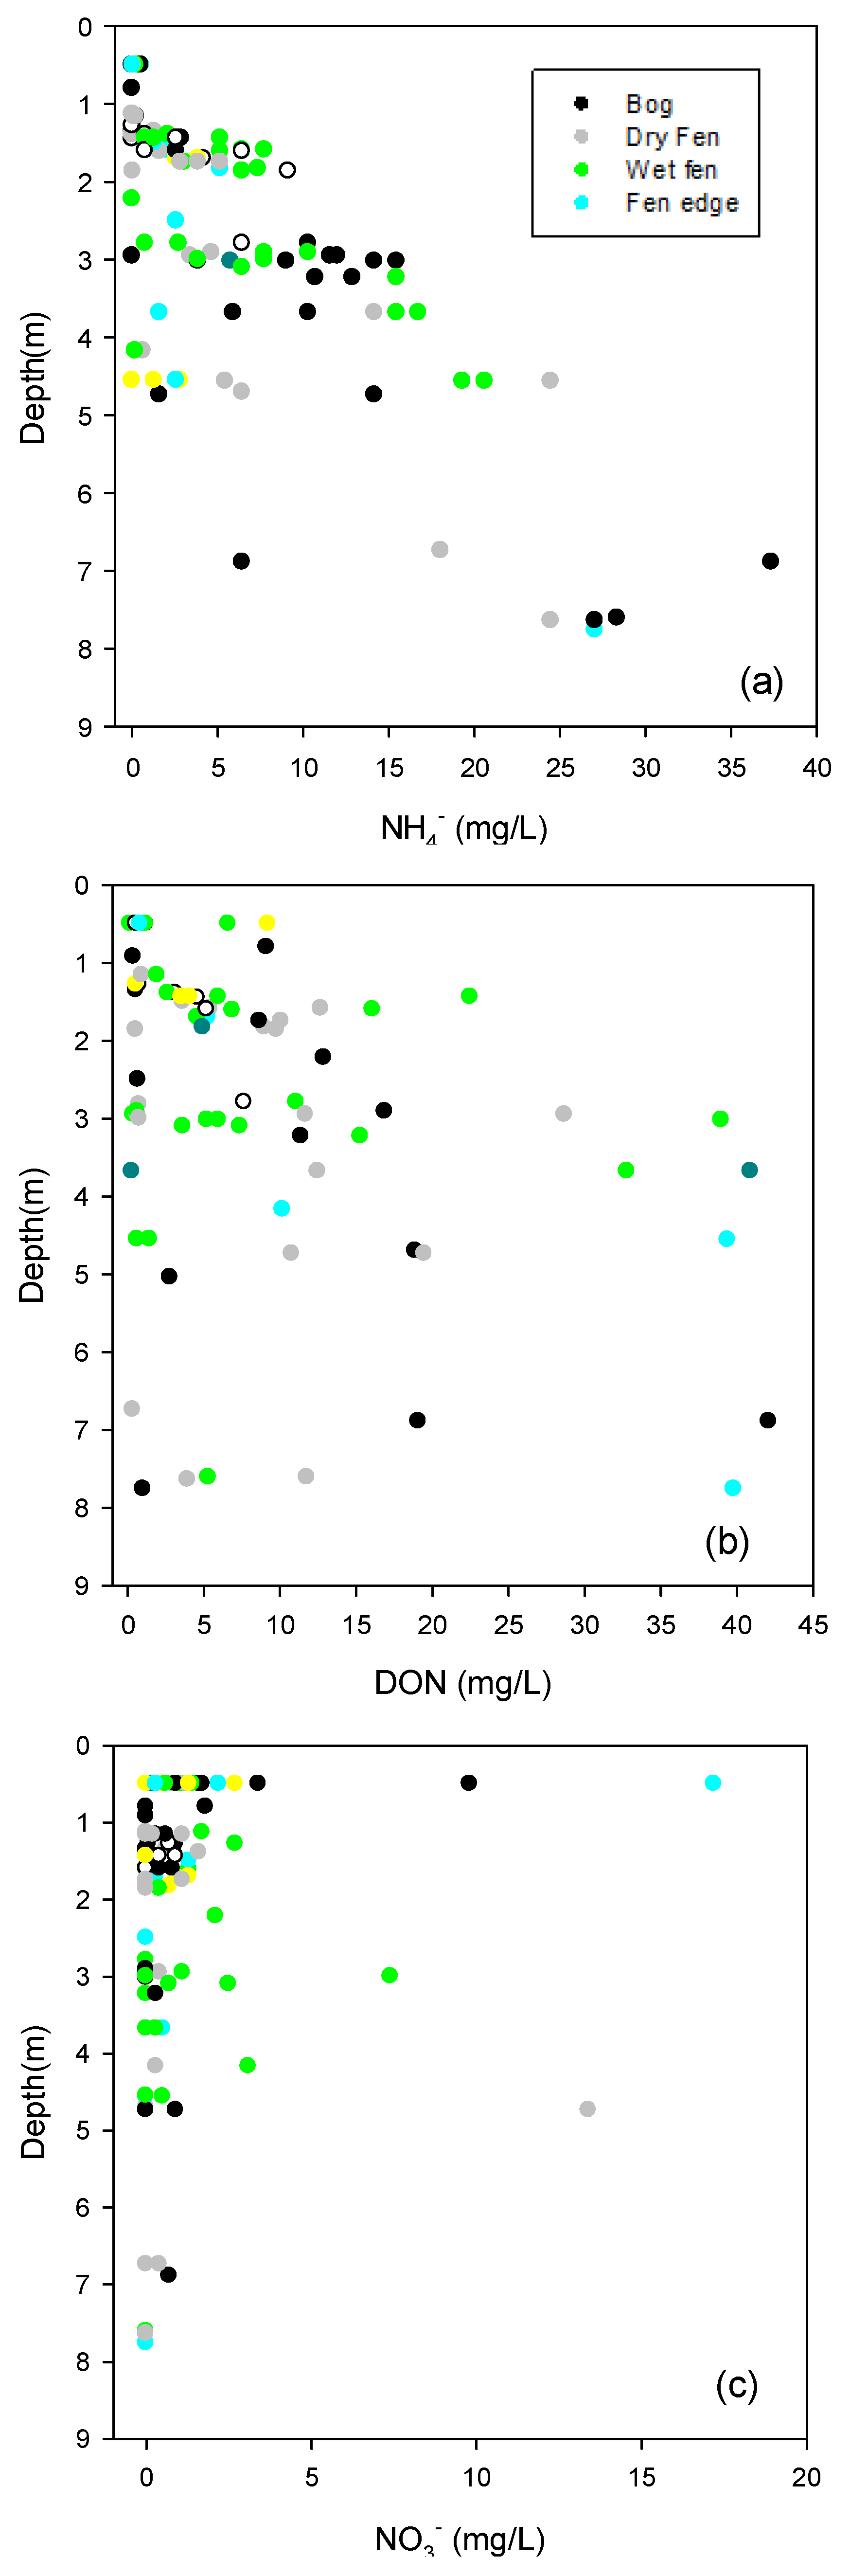
Depth-wise trends are shown in
Figure 10. For peatlands, depth is a surrogate for degree of compaction or peat permeability, and so increased concentrations of NH
4+ and DON at depth suggest that these species are concentrated mainly in the less mobile zone. In contrast, NO
3− is found to occur at higher concentrations in porewaters in the upper 4 m where higher mobility is expected.
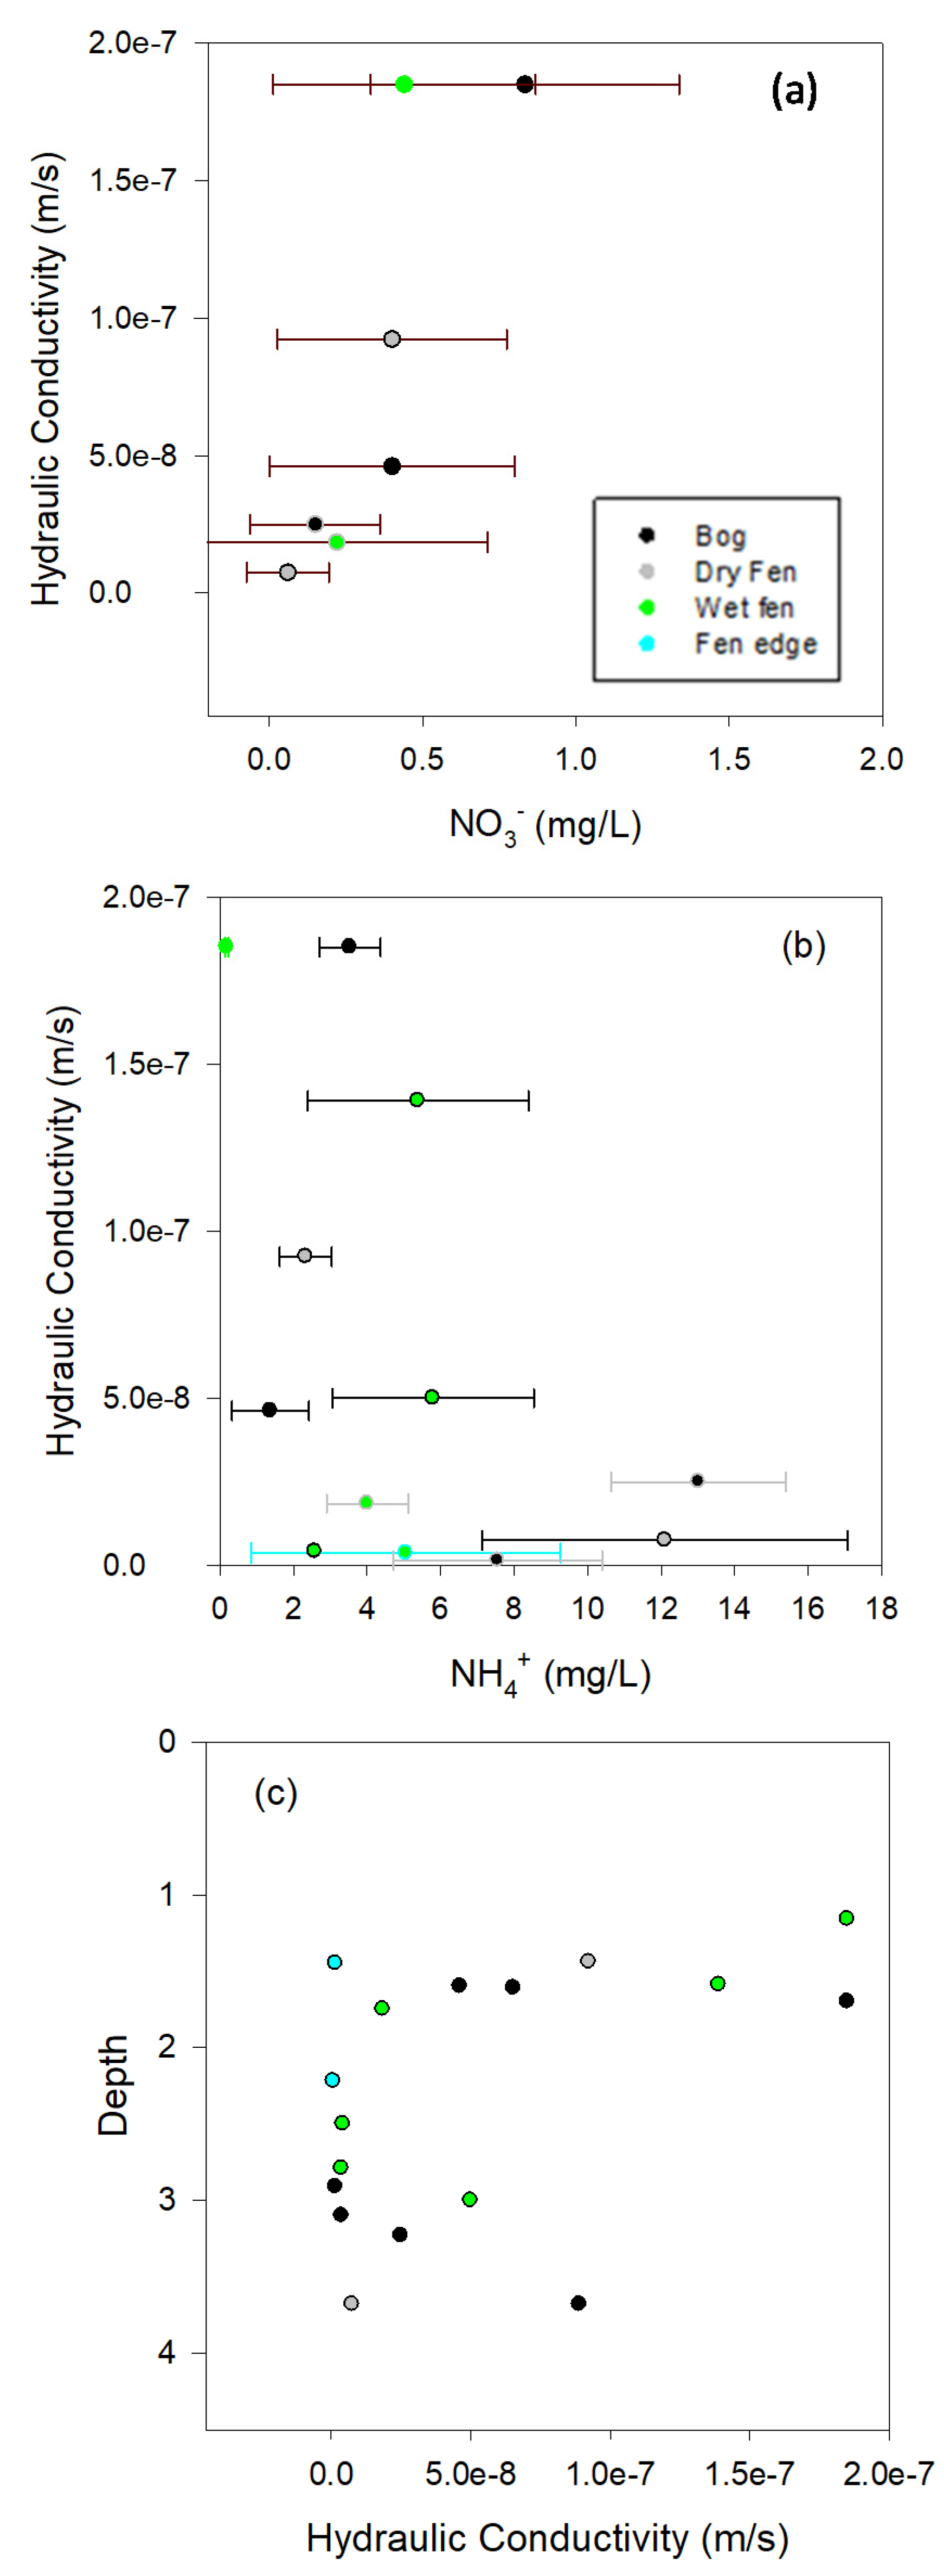
Plots of hydraulic conductivity versus NO
3− and hydraulic conductivity versus NH
4+ (
Figure 11a,b) confirm, based on more direct hydraulic measurements, that zones of the highest potential for water movement are dominated by NO
3−,whereas zones of NH
4+ concentration have the lowest potential for water movement. A depth versus hydraulic conductivity plot (
Figure 11c) establishes a more limited range of hydraulic conductivity below a 2 m depth. While quantifiable readings below 4 m were not obtained due to lack of response of the wells to bailing and injection, we anticipate that this zone has extremely low values in the range of 10
−9 m·s
−1 and below.
3.5.3. Conceptual Model
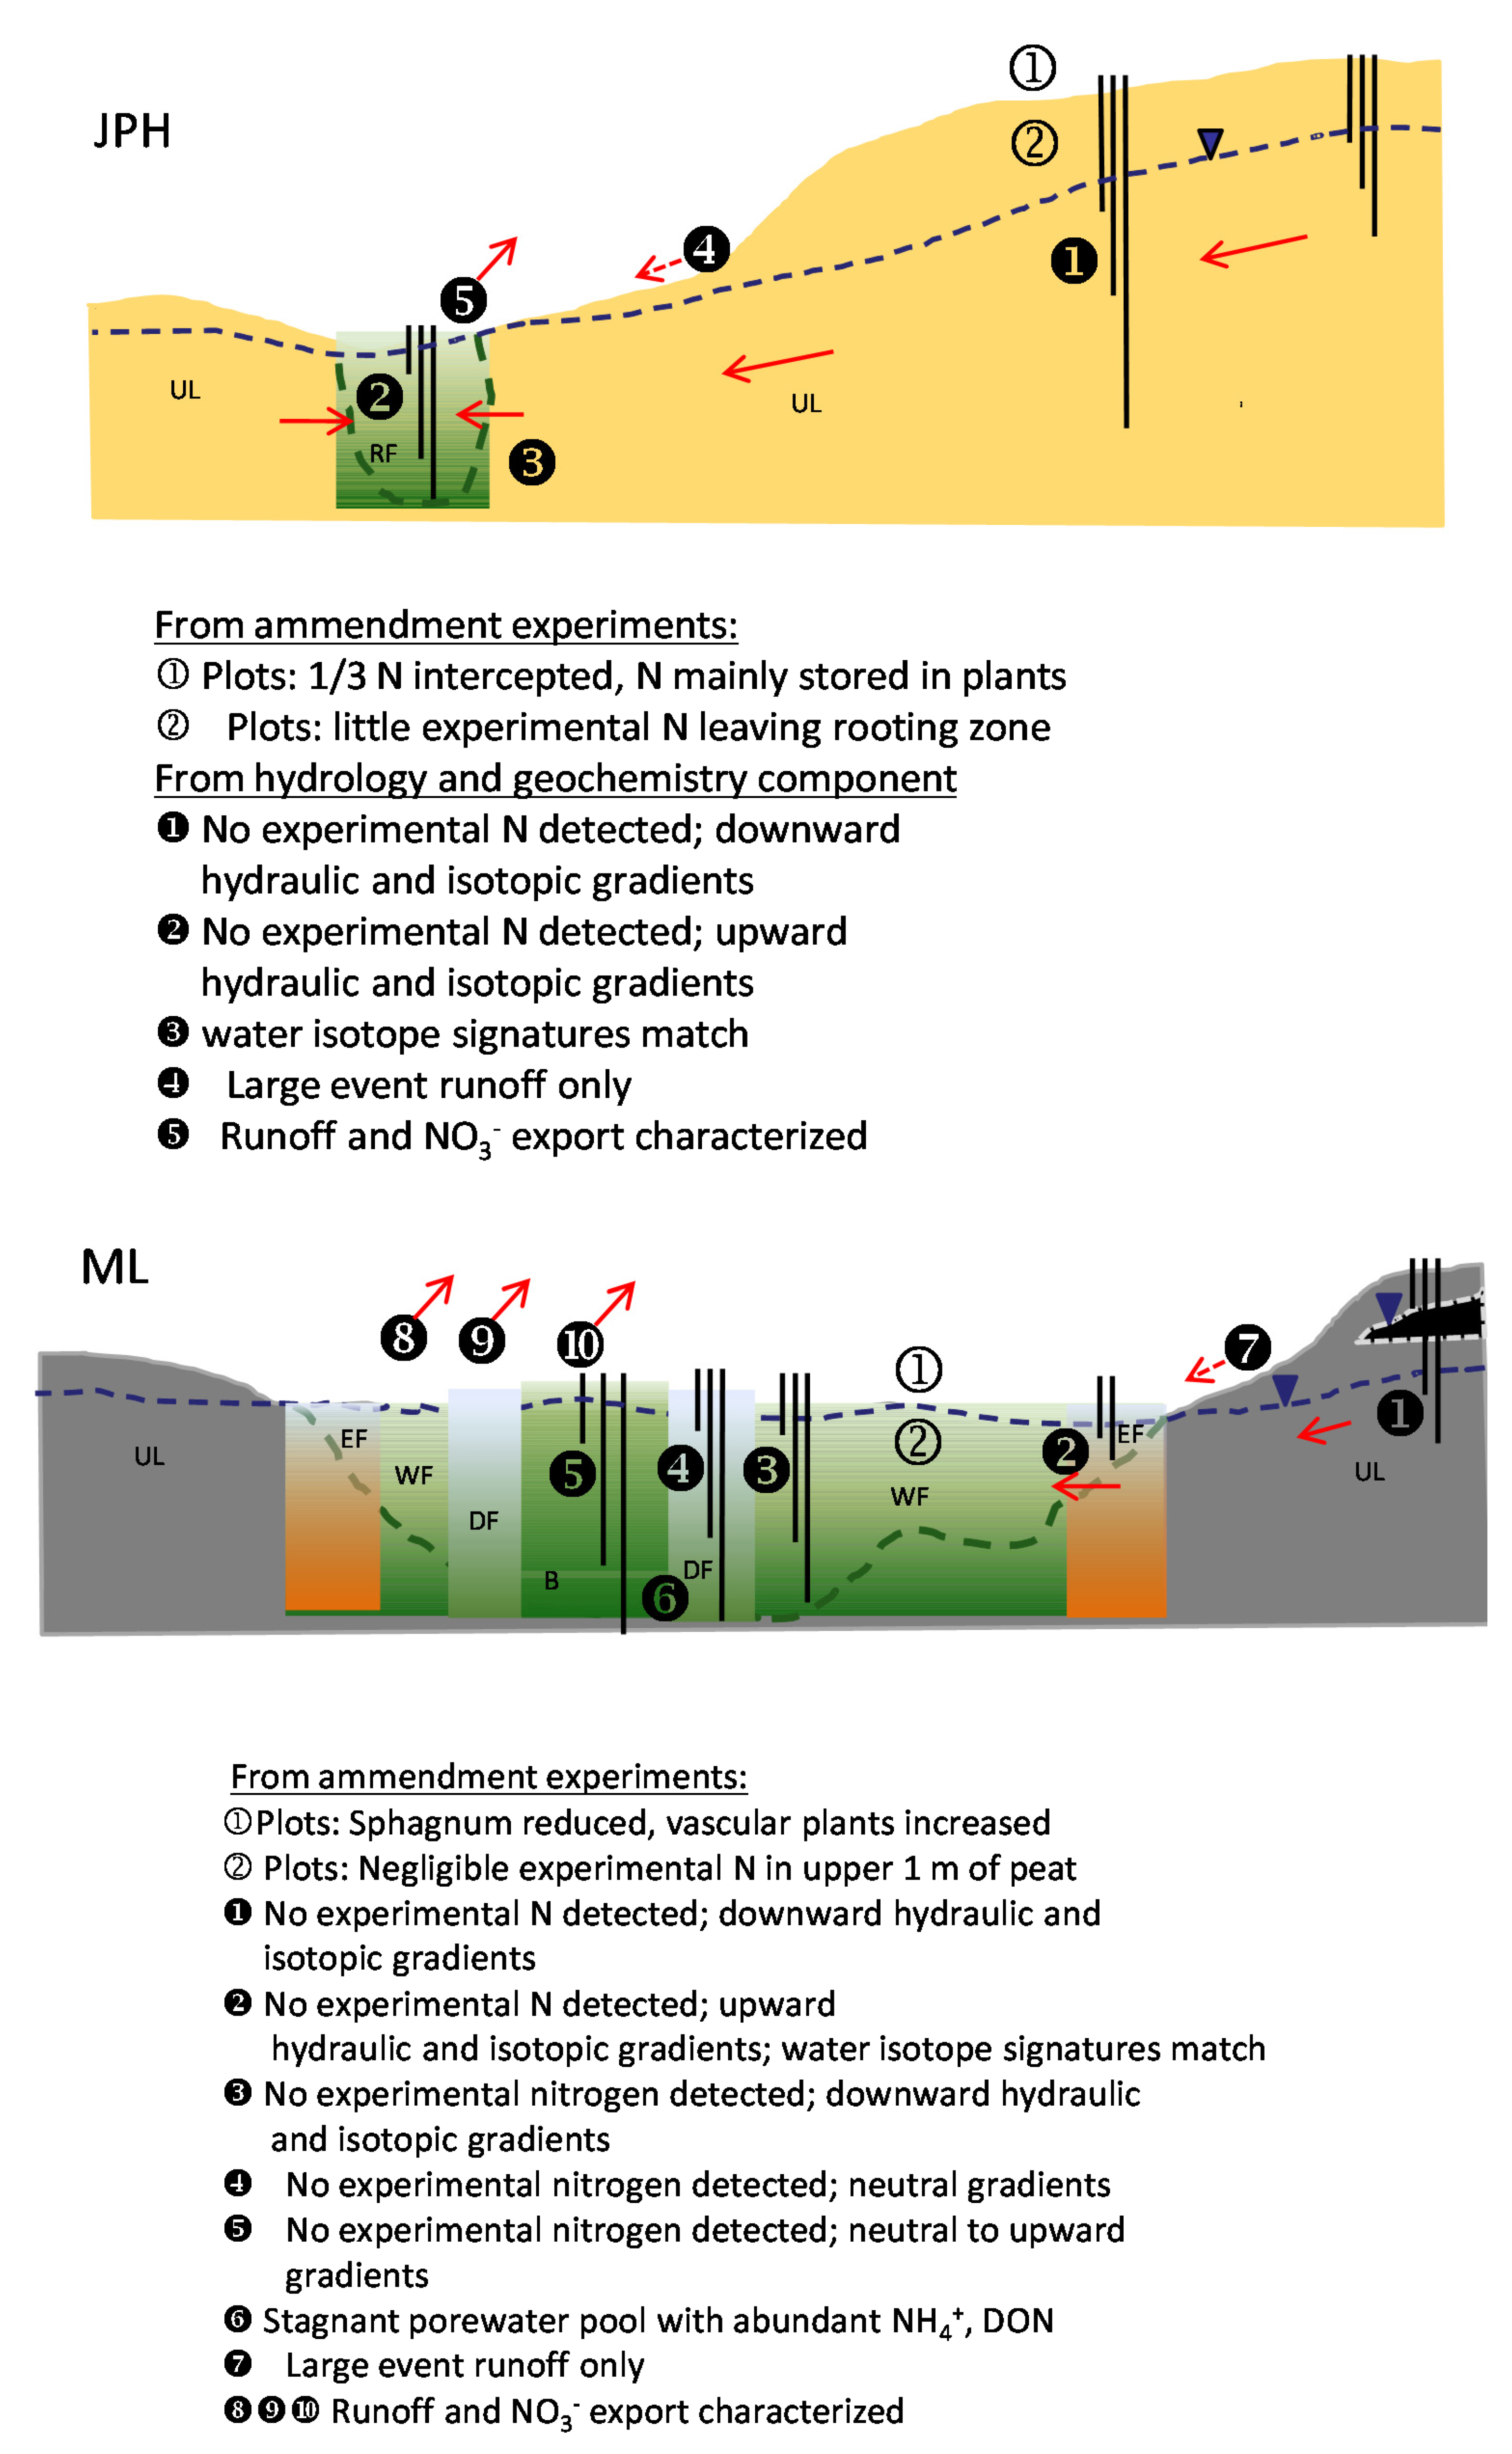
Based on the hydrologic and geochemical evidence collected during this study, a conceptual model of water and nitrogen flows was constructed (
Figure 12). Various lines of evidence are shown.
At JPH, nitrogen flows, mainly in the form of NO3− and DON, are directed downward to the water table in uplands, followed by a lateral transfer by saturated groundwater flow to adjacent lowlands or the rich fen. Only brief, intermittent pulses of nitrogen may be carried by rill flow on upland hillslopes during high runoff events. Saturated flows containing NO3− and DON within rich fens are directed upwards and feed persistent outflows which occur from the rich fen. Storage of reducing species such as NH4+ is significantly less important than at ML due to regular flushing and oxidation of the rich fen.
At ML, nitrogen flows in the uplands, mainly in the form of NO3−, are similarly directed downward to the water table and then laterally by saturated groundwater flow to the fen margins, where the nitrogen is then carried upward into the wetland. Adjacent areas of wet fen may interact with the fen margins and typically support very slow downward flows of water and nitrogen. Dry fen and bog represent increasingly isolated terrain units with neutral and/or evaporative (upward) gradients, respectively. Surface flows of water and nitrogen from fen and bog units, mainly in the form of NO3-,are prevalent at ML. The slow decomposition of organic matter leads to the production of large storages of NH4+ and DON at depth that are relatively immobile.
3.5.4. Net Nitrogen Exchanges Due to Terrain Connectivity
Hydrology and geochemistry studies have indicated that the dominant water fluxes from wetlands are via surface flow pathways, which was quantified for the various wetland terrain types over multiple years during the course of the amendment experiments (
Table S1). Nitrate was also confirmed as the most abundant and mobile species of nitrogen that is available for transport via surface flow pathways [
25,
26]. The major challenge of the hydrology and geochemistry studies was to quantify the exchange rates of nitrogen between the various terrain units, to evaluate whether critical loads of nitrogen could be assessed based on the response in individual isolated units or whether interaction between terrain units needed to be assessed and accounted for. In order to estimate the net exchanges that were comparable to the amendment loads, runoff potentials (in mm· yr
−1) and nitrate concentrations (mg·L
−1), both for individual water table wells, were used to calculate the annual exchange of nitrogen (in kg·N·ha
−1·yr
−1), as well as inter-annual variability.
The results (
Table S1) reveal that the wetland terrain units were net sinks for nitrogen during most of the 2011–2015 study period. On average, wet fen appears to receive the least nitrate on an annual basis (−0.12 ± 0.25 kg·N·ha
−1·yr
−1), while dry fen receives the highest amount of nitrate (−0.93 ± 1.66 kg·N·ha
−1·yr
−1). Intermediate amounts are predicted for rich fen (−0.22 ± 2.17 kg·N·ha
−1·yr
−1) and bog (−0.66 ± 1.42 kg·N·ha
−1·yr
−1). However, note that the rich fen site was strongly influenced by beaver activity during 2012–2015, and so variability is enhanced for this reason. Unfortunately, we were less successful at constraining net fluxes for uplands, although based on less continuous groundwater monitoring, we confirm that they are positive (i.e., net sources), on the order of <1 kg·N·ha
−1·yr
−1 and directed to wetlands at both sites.
Based on the magnitude of the potential exchanges between terrain units and the range of critical loads of nitrogen being tested (i.e., control, 0, 5, 10, 15, 20, and 25 kg·N·ha−1·yr−1), we anticipate that connectivity is largely a minor issue and only creates significant interference at lower loading levels (i.e., control, 0 kg·N·ha−1·yr−1 and possibly for the 5 kg·N·ha−1·yr−1 experiments). We expect the influence of nitrogen exchanges between terrain units at the sites evaluated to be less important than issues with characterizing current spatial variability in the atmospheric loadings of nitrogen.


 ,
, 


