
Numerical Investigation of Turbine Blades with Leading-Edge Tubercles in Uniform Current


1
School of Naval Architecture and Ocean Engineering, Jiangsu University of Science and Technology, Zhenjiang 212100, China
2
School of Mathematics, Computer Science and Engineering, City University of London, London EC1V 0HB, UK
*
Author to whom correspondence should be addressed.
Water 2021, 13(16), 2205; https://doi.org/10.3390/w13162205
Submission received: 9 June 2021
/
Revised: 8 August 2021
/
Accepted: 9 August 2021
/
Published: 13 August 2021
(This article belongs to the Section Oceans and Coastal Zones)
Abstract
:Inspired by the tubercles on humpback whale flippers, leading-edge tubercles have been incorporated into the design of wings and turbine blades in an attempt to improve their hydrodynamic performance. Although promising improvements, especially in terms of the stall performance, have been demonstrated in the limited research that exists to date, the effectiveness of the leading-edge tubercles seems to be influenced by the base blade. This paper focuses on the introduction of sinusoidal leading-edge tubercles to a base blade developed from the classic NACA0018 airfoil, and numerically investigates the effectiveness of leading-edge tubercles on the hydrodynamics associated with the blade in uniform current with different attack angles. Both the macroscopic parameters, such as the lift and drag forces, and the micro-scale flow characteristics, including the vortex and flow separation, are analyzed. The results indicate that the leading-edge tubercles brings a significant influence on the hydrodynamic forces acting on the blade when subjected to an attack angle greater than 15°. This study also reveals the important role of the turbulence and flow separation on hydrodynamic loading on the blade and the considerable influence of the tubercles on such micro-scale flow characteristics. Although the conditions applied in this work are relatively ideal (e.g., the blade is fixed in a uniform flow and the end effect is ignored), the satisfactory agreement between the numerical and corresponding experimental data implies that the results are acceptable. This work builds a good reference for our future work on the hydrodynamic performance of tidal turbines which adopt this kind of blade for operating in both uniform and shearing currents.
1. Introduction
Inspired by the tubercles on the humpback whale flippers, leading-edge tubercles have been developed and utilized in airfoils and wings (e.g., [1,2,3,4,5,6,7,8,9]), hydrofoils (e.g., [10]), turbine blades (e.g., [11,12,13,14]) and propellers (e.g., [15]) in order to improve their aerodynamic and hydrodynamic performance, especially in terms of stall performances. Different shapes of the tubercles, including sinusoidal, semi-circular and wavy, with different amounts and heights of the tubercles have been attempted. As confirmed by both experimental and numerical investigations, the tubercles alter local flow characteristics (vortex structure and flow separation) [3], leading to a flow separation occurrence in a higher attack angle and thus a delayed stall (e.g., [9,12,16]), compared with the corresponding foil/blade without tubercles. In some research (e.g., [11]), despite the fact that the stall is not delayed by the tubercles, a more stable and higher lift beyond the stall point is observed. Generally speaking, the drag is not considerably affected by the tubercles, and therefore, the aforementioned improvement on the lift performance by the tubercles often results in a better lift-to-drag ratio, especially in cases with larger attack angles. A detailed review can be found in [14].
Although the potential and capacity of the leading-edge tubercles to improve the stall performance and the lift-to-drag ratio have been confirmed by existing research, their effectiveness largely depends on local vortex shedding and flow separation which is influenced by the tubercles. In fact, not only the leading-edge tubercles, but also the trailing-edge tubercles, may lead to a similar improvement. This is evident in the study by Nedic et al. [17], in which they investigated the hydrodynamics associated with the NACA0012 air foil with trailing-edge tubercles and concluded that the tubercles weaken the vortex shedding in the wake area of the air foil and, thus, improve the lift-to-drag ratio. Such local flow characteristics are at a similar scale to the tubercle size; therefore, the arrangement and design of the tubercles, as well as the base foil/bade, are critical in order to secure an expected improvement in hydro- and aerodynamic performance. As observed by Shi et al. [11], who modified the base blade NREL (National Renewable Energy Laboratory) S814 by introducing leading-edge tubercles, the lift with high attack angles (especially beyond the stall point) is sensitive to the height and wavelength of the sinusoidal tubercles. It has also been found from some studies, in which a S809 airfoil is fitted with wavy tubercles (e.g., [13]), that an inappropriate design may result in a worse stall performance compared with the original airfoil. Therefore, in order to design a leading-edge tubercle using base foils/blades other than what has already been investigated in the existing literature, a systematic investigation on the hydrodynamic performance (e.g., the lift and drag with different attack angles) is needed, together with an exploration of the associated micro-scale physics, including the vortex shedding and flow separation.
In this paper, sinusoidal tubercles are introduced to the blade of a horizontal shaft turbine, which is the most widely used turbine for the purpose of harvesting tidal energy, due to its good underwater adaptability, steady environmental load, power output and ability to be less influenced by the surrounding flow. The hydrodynamic performance of the blade, which is a key component of the turbine, is critical in order to secure satisfactory energy acquisition. NACA0018 airfoil, as sketched in Figure 1, is taken to be the base blade and different numbers of sinusoidal tubercles with different heights are attempted, following the approach by Shi et al. [11]. A systematic numerical investigation using StarCCM+ (CD-adapco company, Melville, NY, USA) is carried out. Although the blade undergoes a rotational motion about the axis of the turbine in the real scenario, this paper only focuses on the hydrodynamics associated with a fixed blade with different attack angles to the uniform current flow. Both the macroscopic parameters (e.g., the lift and drag coefficients), and micro-scale flow characteristics, including the vortex structures and flow separations, are examined to reveal the effect of the tubercles on the hydrodynamic performance of the blade. This provides a good reference for investigating the hydrodynamic performance of the tidal turbine adopting the present blades and operating in both uniform and shearing currents, which will be the focus of the next stage of our research.
2. Blade Model
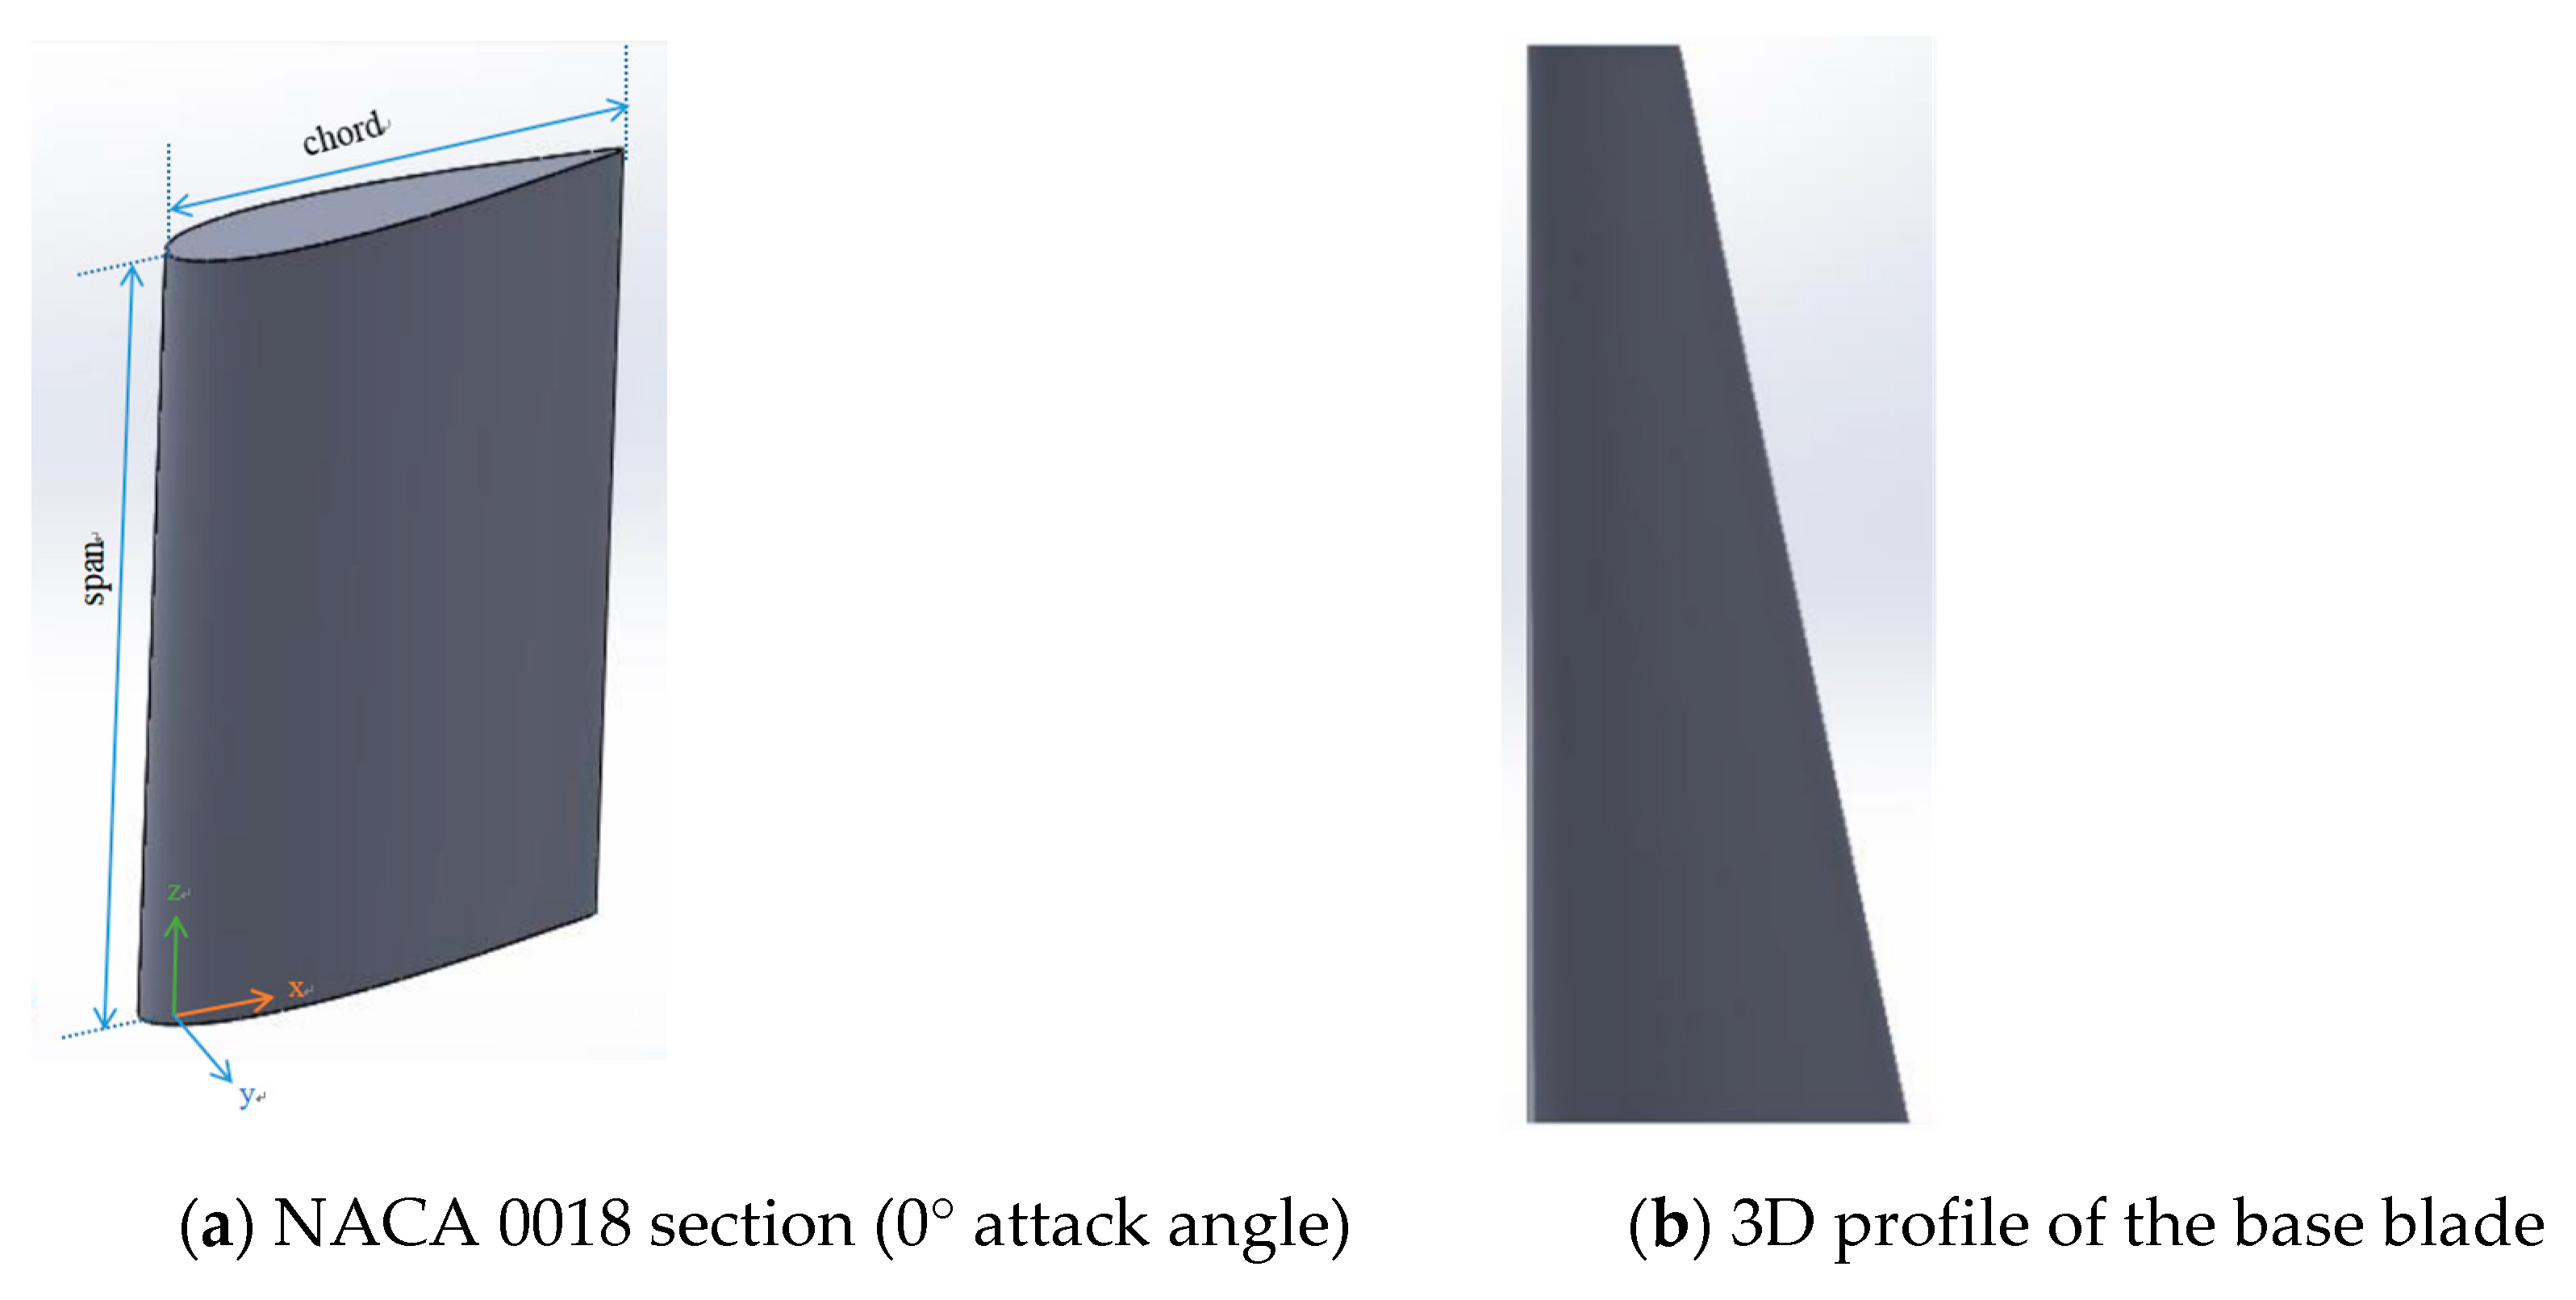
As indicated above, NACA 0018, which is symmetric in section, is selected as the base blade. Figure 1a illustrates a uniform section of NACA 0018 foil along the span direction. In this work, the leading edge of the blade is a straight line, as illustrated in Figure 1b. The span length s0 is 0.63 m. At different locations along the span direction s, the chord length varies from 0.225 m (s = 0) to 0.09 m at the end of the blade (s = 0.63 m), yielding a span-to-chord ratio of 4.2. In this work, the blade will be placed in a Cartesian coordinate with z pointing upwards. The leading edge of the blade is parallel to the z-axis and the chord direction is in line with the x-axis when the attack angle is zero, as illustrated in Figure 1a. For a non-zero attack angle, the blade is rotated about its leading edge.
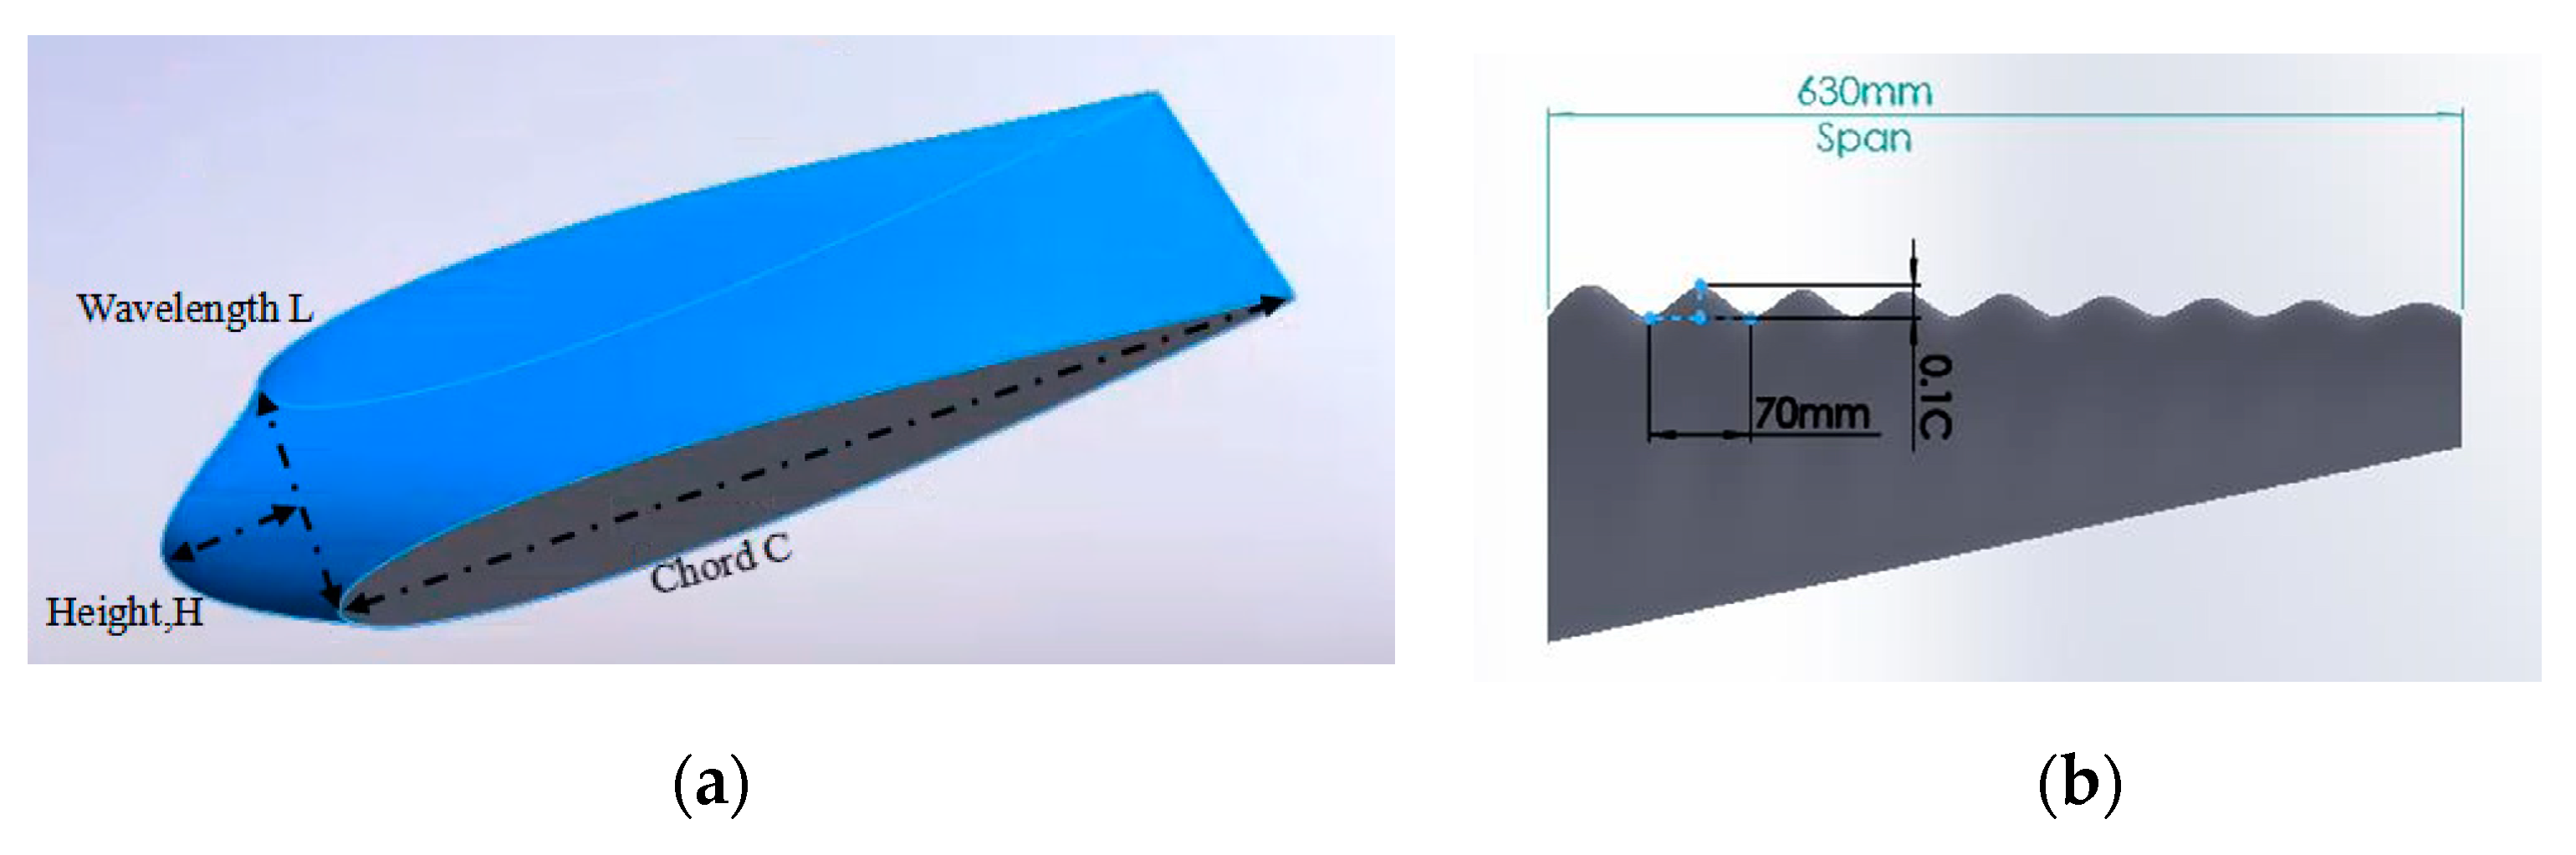
The sinusoidal profile of the tubercle is defined by
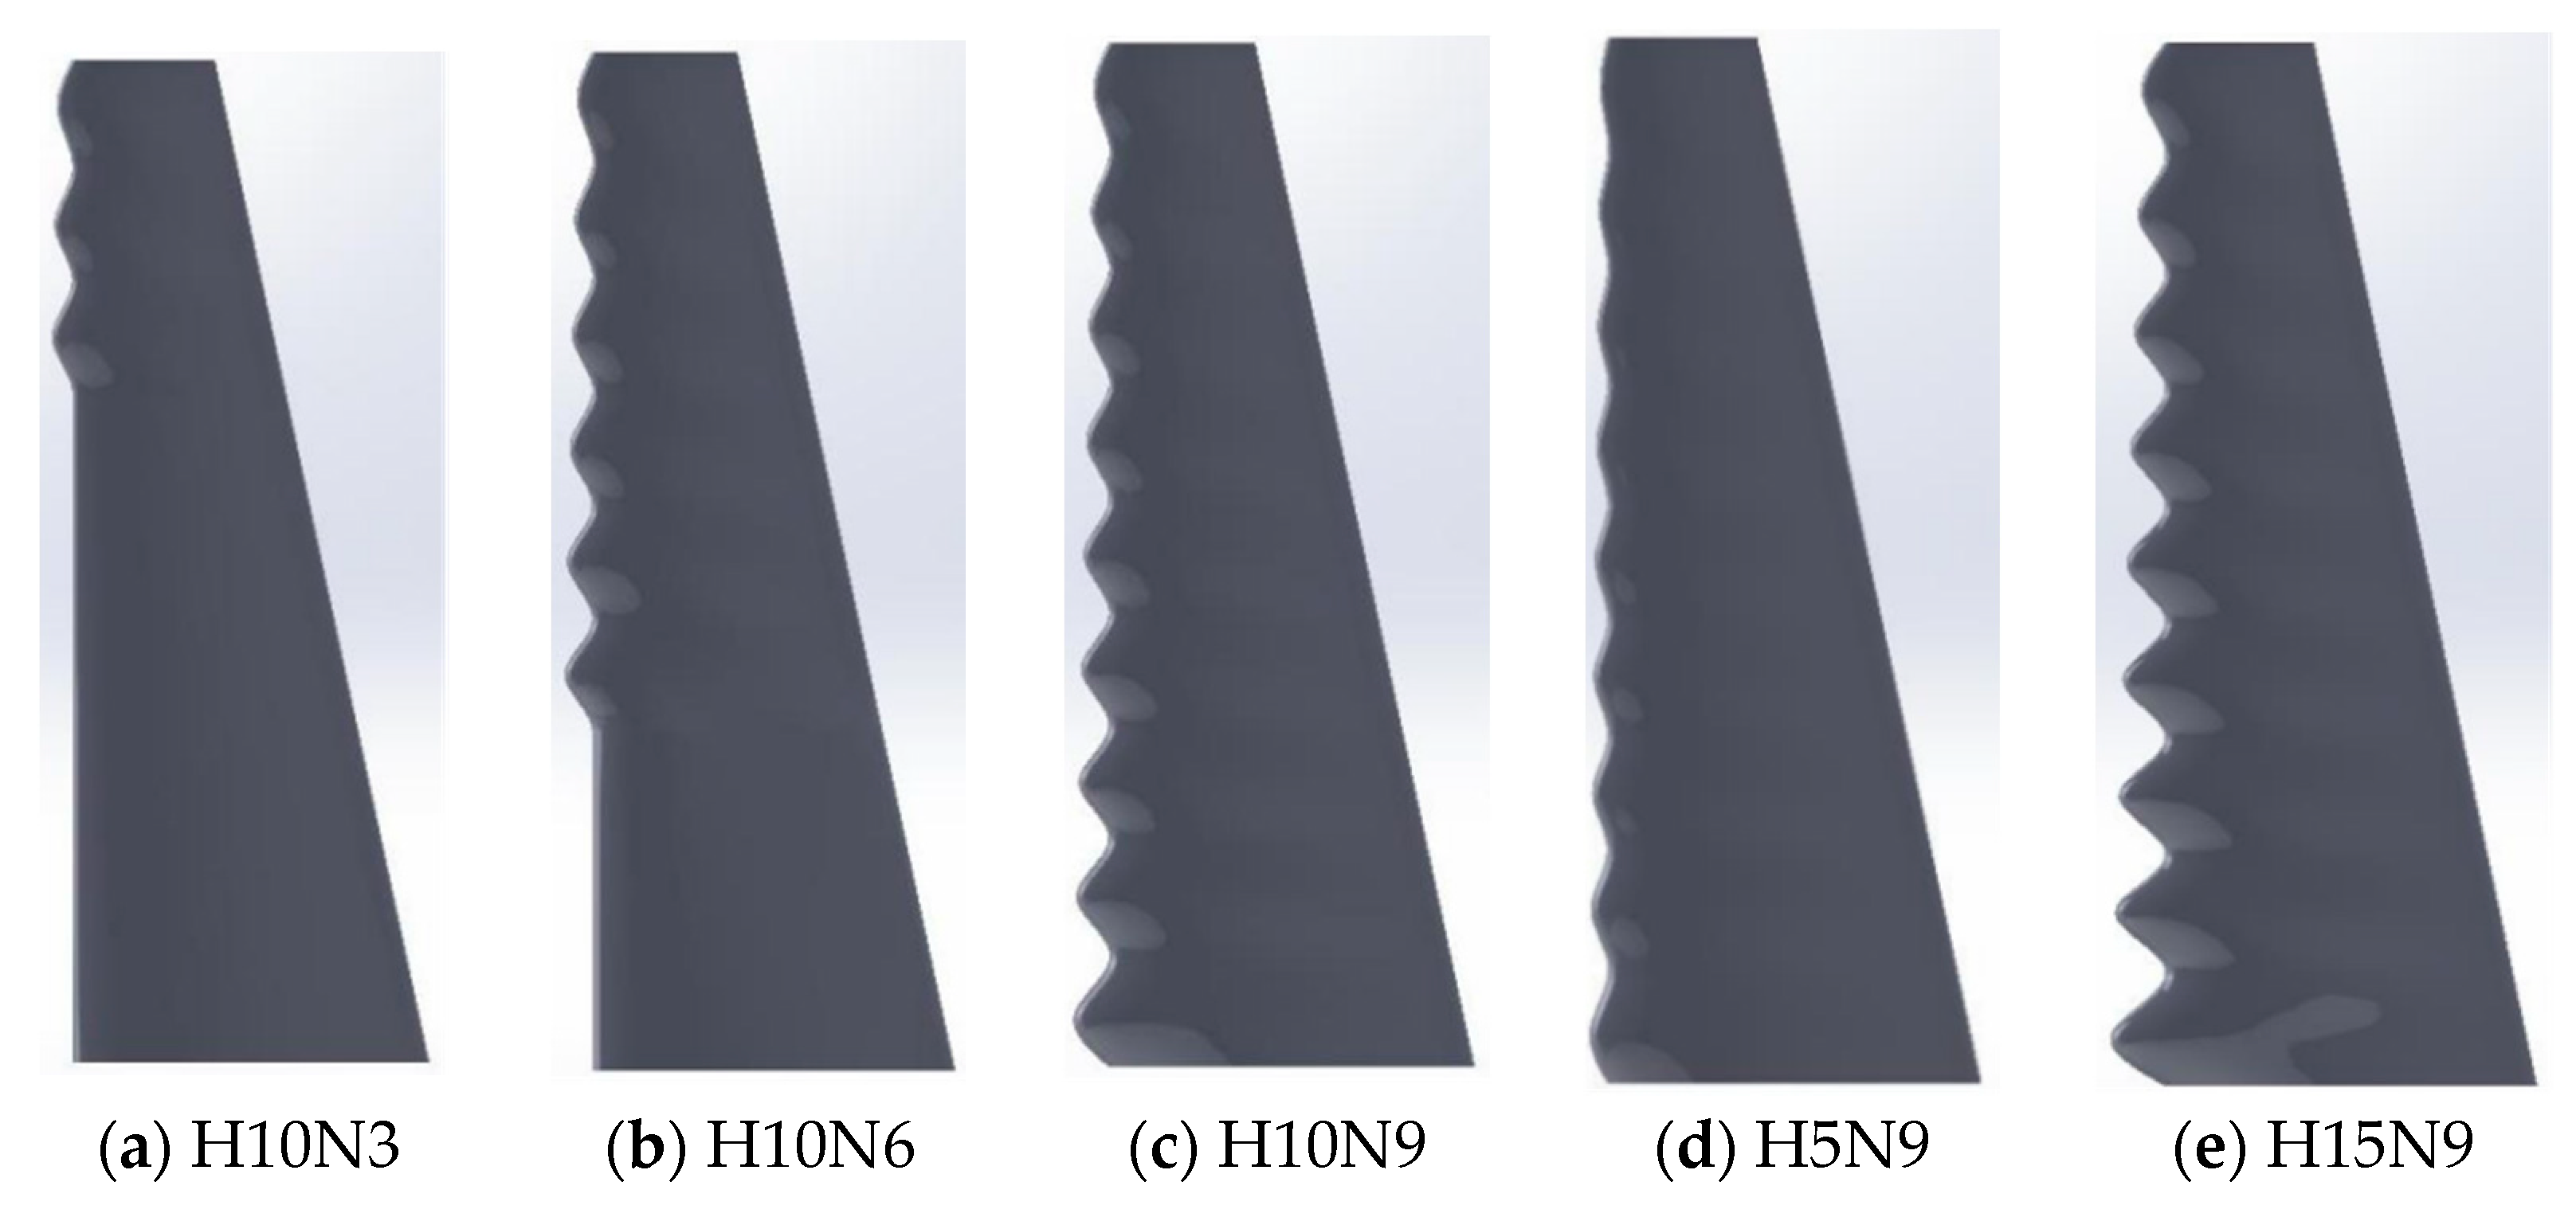
where h is the local height of the tubercle surface relative to the profile of the base blade; H and W are the height and the wavelength of the sinusoidal tubercle, respectively, as illustrated in Figure 2a. For simplification, the wavelength is W = s0/9 (i.e., 0.07 m), the height is H = , where is a coefficient ranging from 0.05 to 0.15 in this paper and is the chord length of the base blade. In order to maintain the thickness of the blade, the tubercles are extended forward from the point of the maximum thickness at all sections (i.e., 29.7% chord length from the leading edge). Different numbers of tubercles (i.e., 3, 6 and 9), are implemented from the end of the blade (s = 0.63 m) and investigated in this paper. For convenience, blade models with tubercles are referred to as ‘HXNY’, where X indicates the value of (X = ) and Y refers to the number of tubercles. A sketch of the blade model with 9 tubercles and (H10N9) is illustrated in Figure 2b, whereas the corresponding chord lengths at different positions along the span direction are summarized in Table 1, where C is the chord length of the blade with tubercles at different span positions. More illustrations can be found in Figure 3 for different combinations of heights and numbers of tubercles.
3. Numerical Configuration and Validation
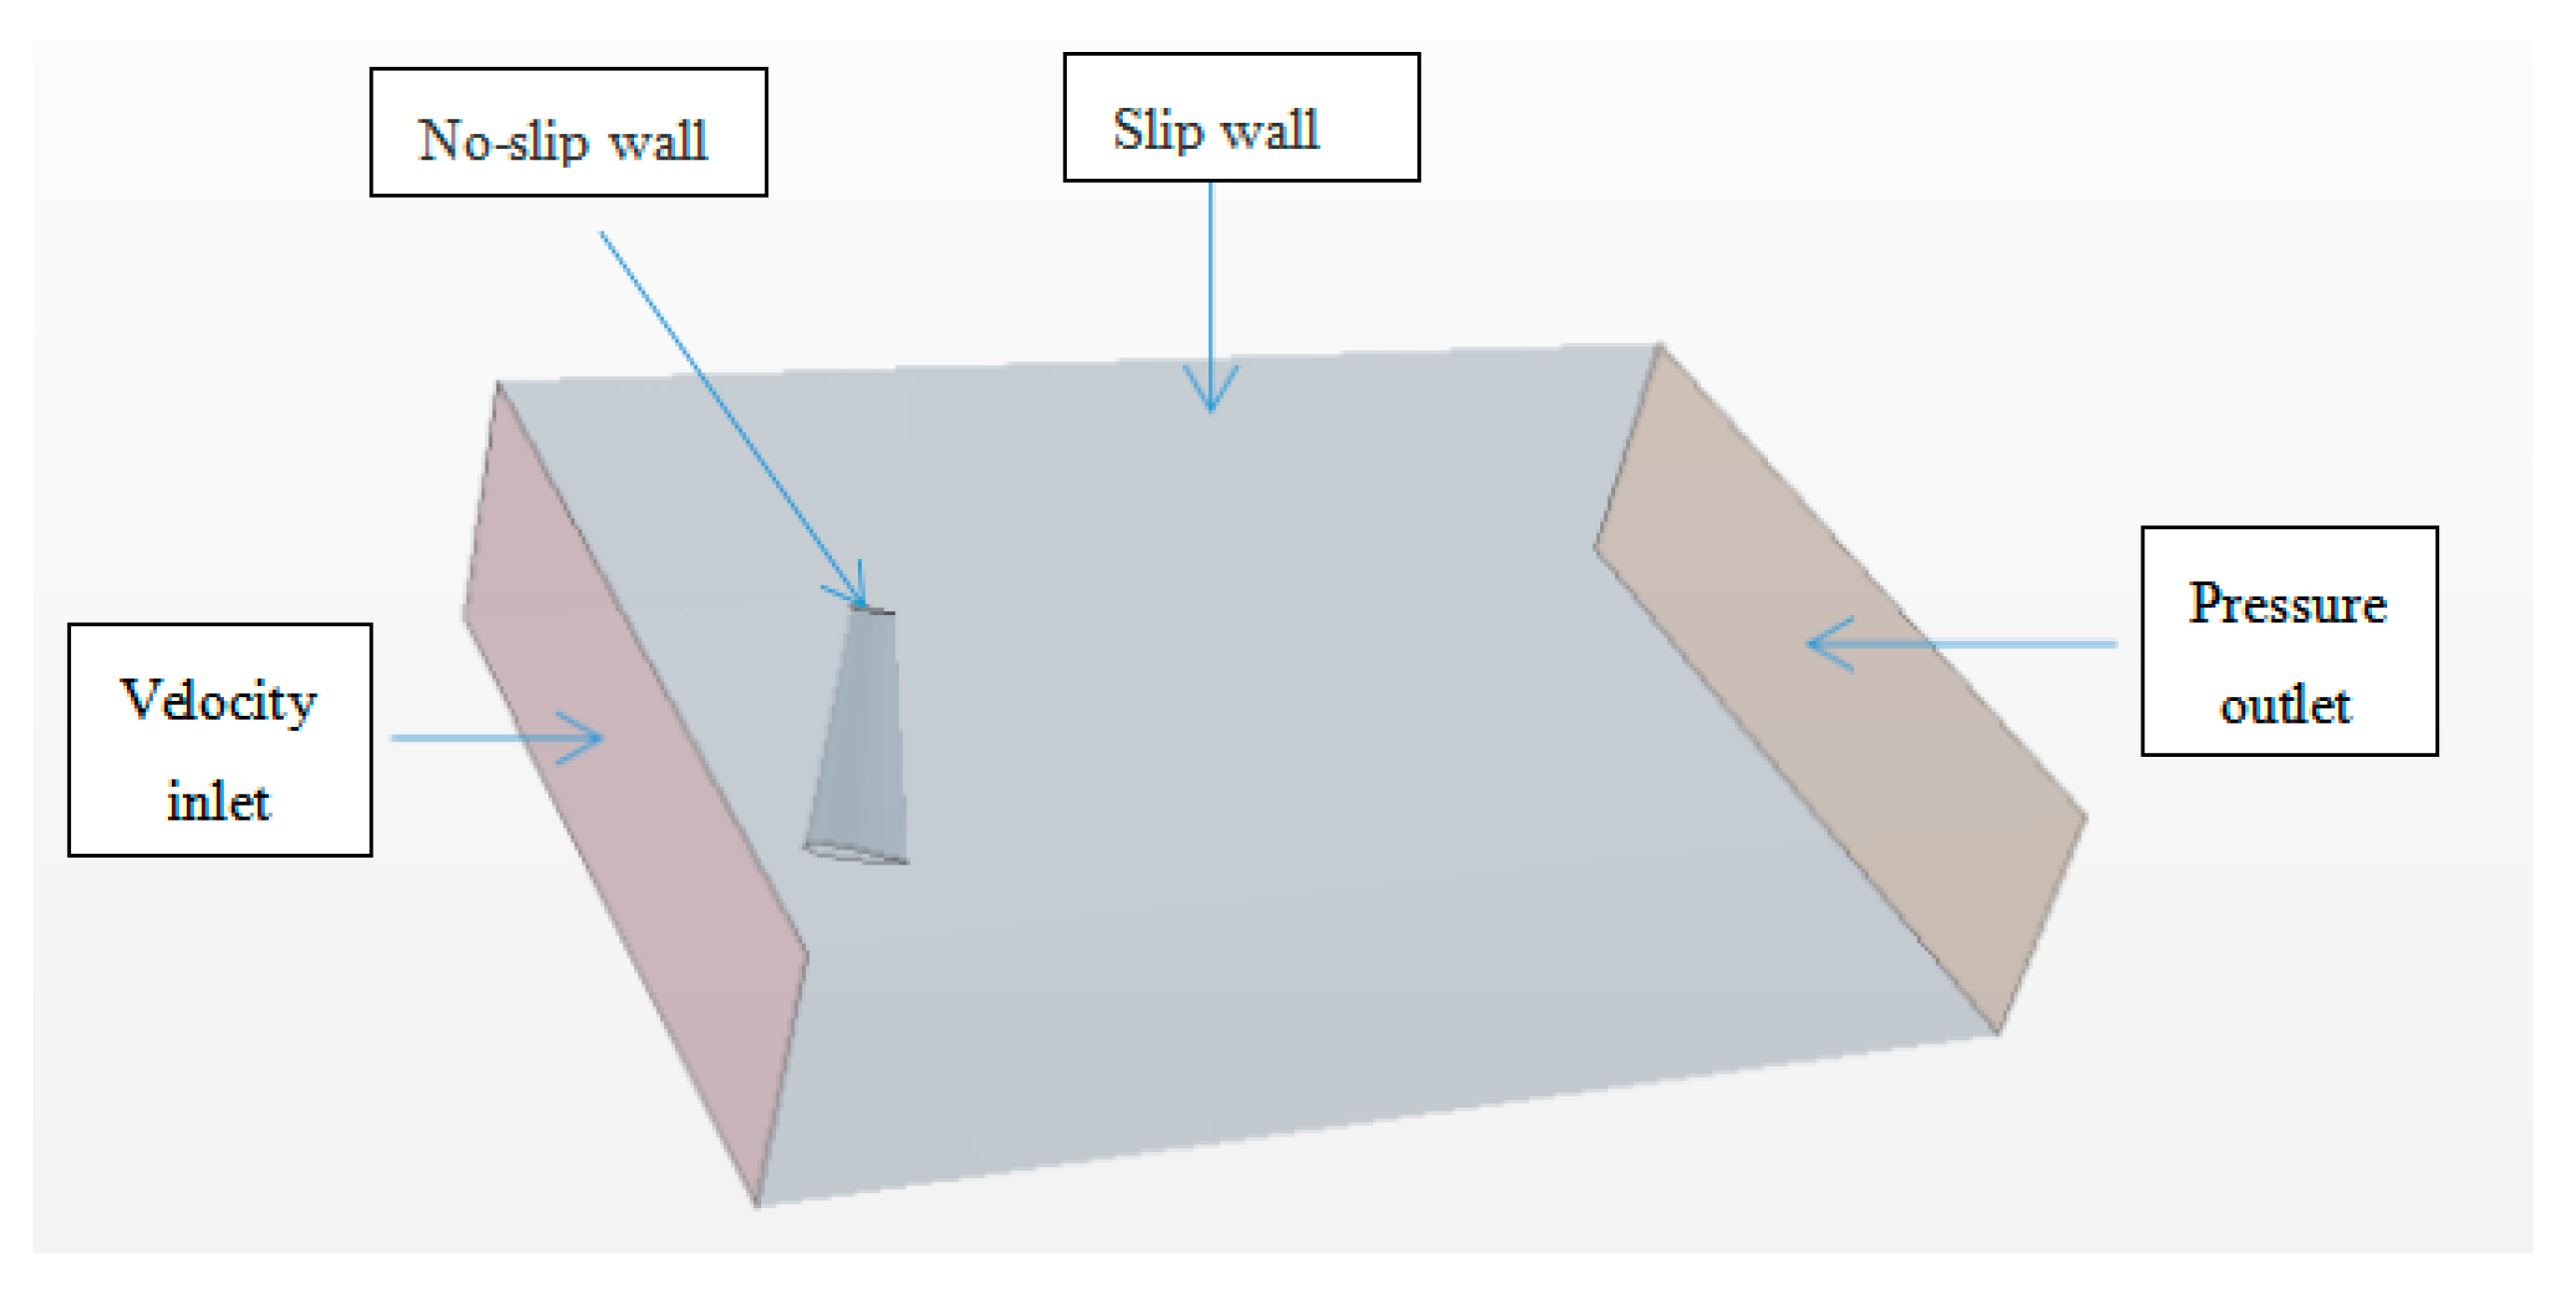
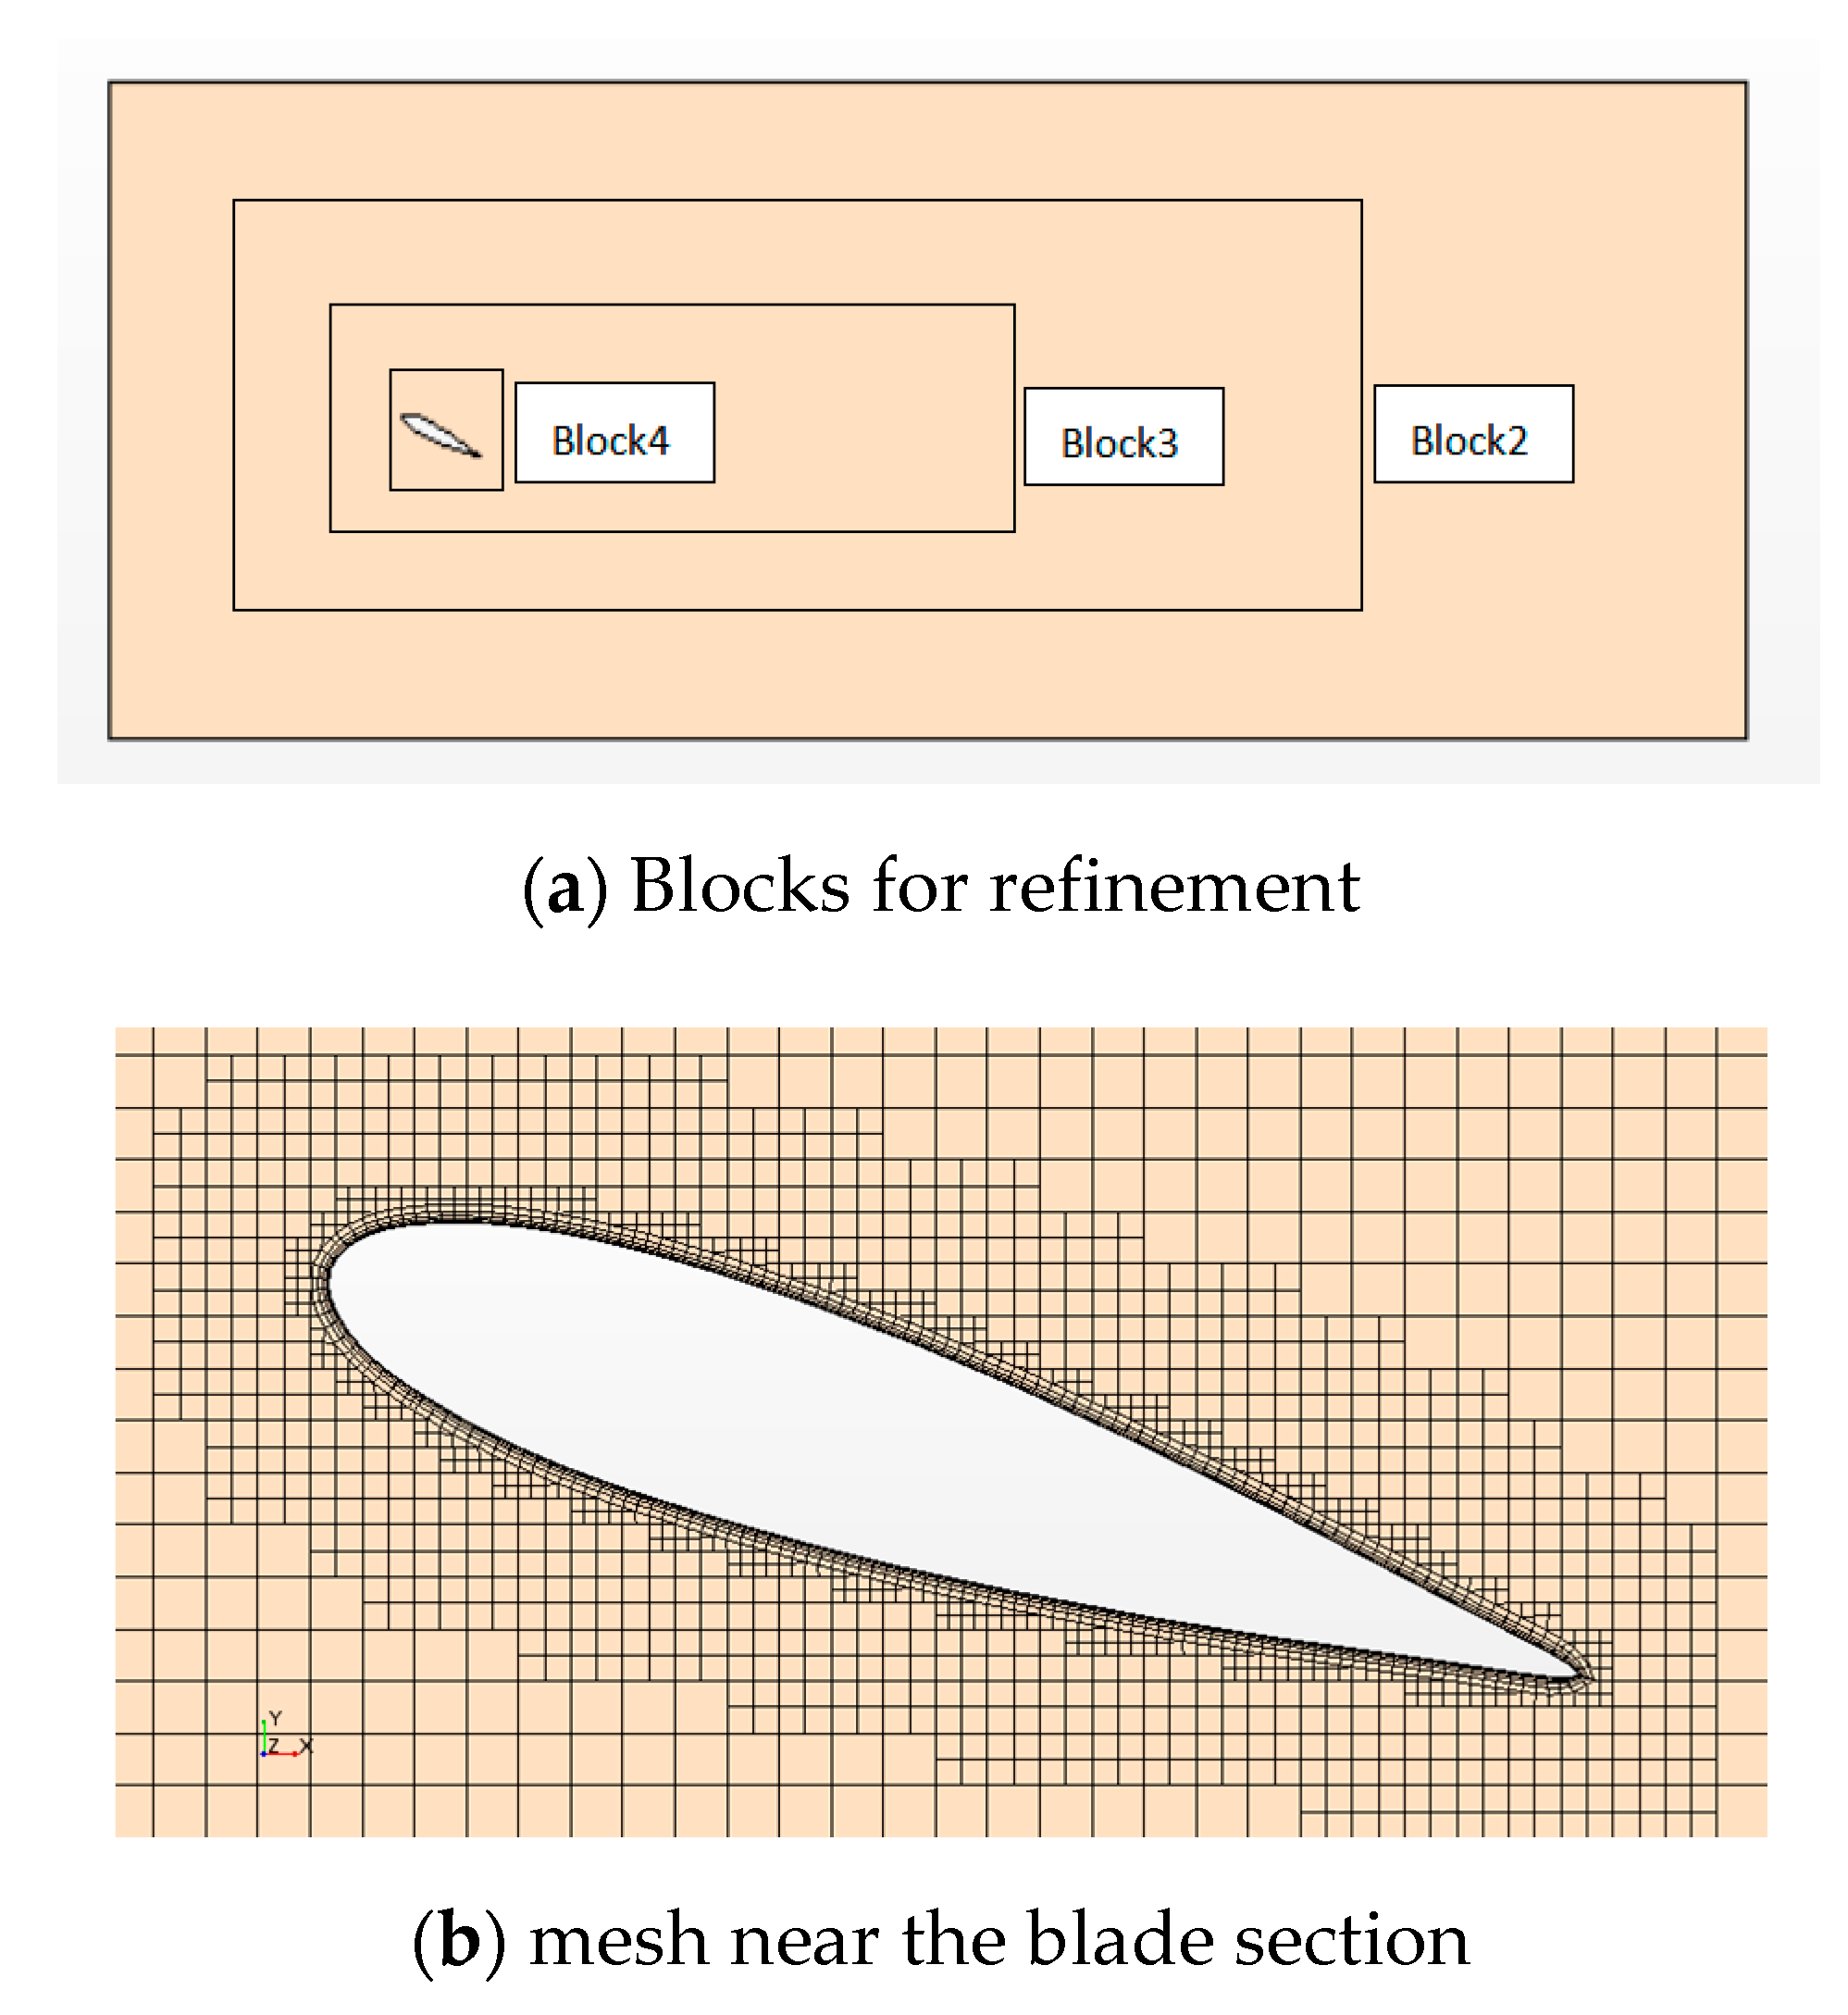
As indicated above, this work uses StarCCM+ code, which is a general computational fluid dynamics (CFD) software, to numerically model the turbine blades in uniform flow. The StarCCM+ embedded CAD module allows for easy inputting of the computational domain, as StarCCM+ solves the Navier-Stokes model using the finite volume method. This has been well documented and validated using wide range of cases. In conventional simulations of turbine performances, the rotational motion of the turbine is critical and, therefore, a cylindrical domain along the axial direction of the turbine is commonly used in these problems without considering the free surface effect due to its convenience on dealing with rotational motion. This work is a departure from conventional simulations, as here, fixed turbine blades with different attack angles to a uniform inflow are focused, aiming to reveal the effect of the leading-edge tubercles and to assist in the design of the bio-inspired turbine. As such, a parallelepipedal computational domain (Figure 4) is chosen. The length, width and height of the domain are 4 m, 1.2 m and 0.63 m, respectively. The leading edge of the blade is located in the middle of the transverse direction and is 1.125 m (5 chord length) from the inlet in the longitudinal direction. In the case involving different attack angles, the blade is rotated about its leading edge. In the inlet (left end) and outlet (right end) of the domain, a velocity inlet and the pressure outlet boundary conditions are considered, respectively. A non-slip wall condition is imposed on the blade surface, whereas slip wall conditions are imposed on other boundaries. All of these walls are considered to be smoothed (i.e., the wall roughness is zero). The simulation adopts the Reynolds Averaged Navier-Stokes (RANS) approach. In order to resolve the turbulent effect, which is critical to the problem considered in this paper, a SST (shear stress transport) model [18] is used, according to the numerical investigation in the literature (e.g., [19]). It should be noted that the top and bottom edges of the blade are in line with two horizontal slip walls using the present computational configuration. This means that the edge effect on the fluid field may not be accurately captured in this study. Such a simplification may be acceptable for long-span structures, in particular for investigating the loading on the structures. This will be assessed in the validation study below. It is also noted that the accuracy of the StarCCM+ with SST largely relies on a mesh resolution. In this work, the computational mesh is generated and is refined gradually from the domain boundaries towards the blade surface. In order to make the mesh transition uniform, 4 blocks, as illustrated in Figure 5a, have been defined. The grid size of block2 is 50% of the base size, block3 is 25% of the base size, and block4 is 12.5% of the base size. Such growth ratios between consecutive blocks are kept unchanged in the mesh independent study and the base size can be changed in order to adjust the global mesh resolution. To secure a satisfactory mesh resolution near the blade surface, where vortex structure and flow separation need to be resolved in a small scale, ten prism layers with gradually growing mesh size are added to the blade surface. An example of the mesh near the blade surface at a span position is illustrated in Figure 5b. The growth rate of the surface mesh is 1.3, the height of the first layer of mesh is 0.012 mm (the corresponding y+ value of 1) and the Reynolds number is 585,000.
Results of the grid independence test are shown in Table 2. Taking the experimental value at the angle of attack of 12° as a reference, three different sets of grids were established, with M1 grids of 2.18 million (base size of 0.028 m), M2 grids of 4.6 million (base size of 0.02 m) and M3 grids of 5.24 million (base size of 0.014 m). As shown in Table 2, both the lift and drag coefficients seem to be insensitive to the mesh sizes. The relative difference between the result using M2 and that using M3 is 0.4% and 0.44% for the lift and drag, respectively. Thus, M2 is selected for the subsequent simulation. The convergence investigation is also considered for other cases with tubercles in different attack angles. All cases suggested that the present mesh configuration with a base size of 0.02 is sufficient to achieve convergent results.
The model is validated by comparing the lift and drag on a NACA 0018 air foil. The experimental data is available in the literature [20], in which a NACA 0018 air foil with a span length of 0.462 m and a chord length of 0.3022 m was tested. The lift (CL) and drag (CD) coefficients are defined as
where the lift and drag forces are the force components perpendicular and in line with the incoming flow, respectively; V is the free stream velocity and A is the reference area of the foil; ρ is the density of the fluid. In the validation case, ρ = 998.2 kg/m3, V = 2 m/s and A = 0.11 m2.
In this work, a steady model is applied. The hydrodynamic force is relatively stable in the cases with small attack angles (which are typically smaller than the stall point), where the stationary force at the steady state (which is determined by the criteria that the force residual reduces to 10−5) is taken to calculate the coefficients using Equations (2) and (3). When the attack angle is close to or greater than the stall point, the force is expected to be unstable (typically exhibiting a periodic oscillation) due to the vortex shedding. In such cases, a transient model—instead of the steady model—may be more suitable. Nevertheless, a similar periodic oscillation at different iterations was also observed in the present steady simulation. When the amplitude of such oscillation trends to be constant, the simulation runs for a further five periods. The lift and drag in Equations (2) and (3) are taken as the corresponding mean values over the last five periods. Comparison between the present results with the corresponding transient simulation did not find a considerable difference. For this reason, we use the steady simulation for all the cases presented in this paper. The comparison with the experimental data presented below further justifies the use of the steady simulation.
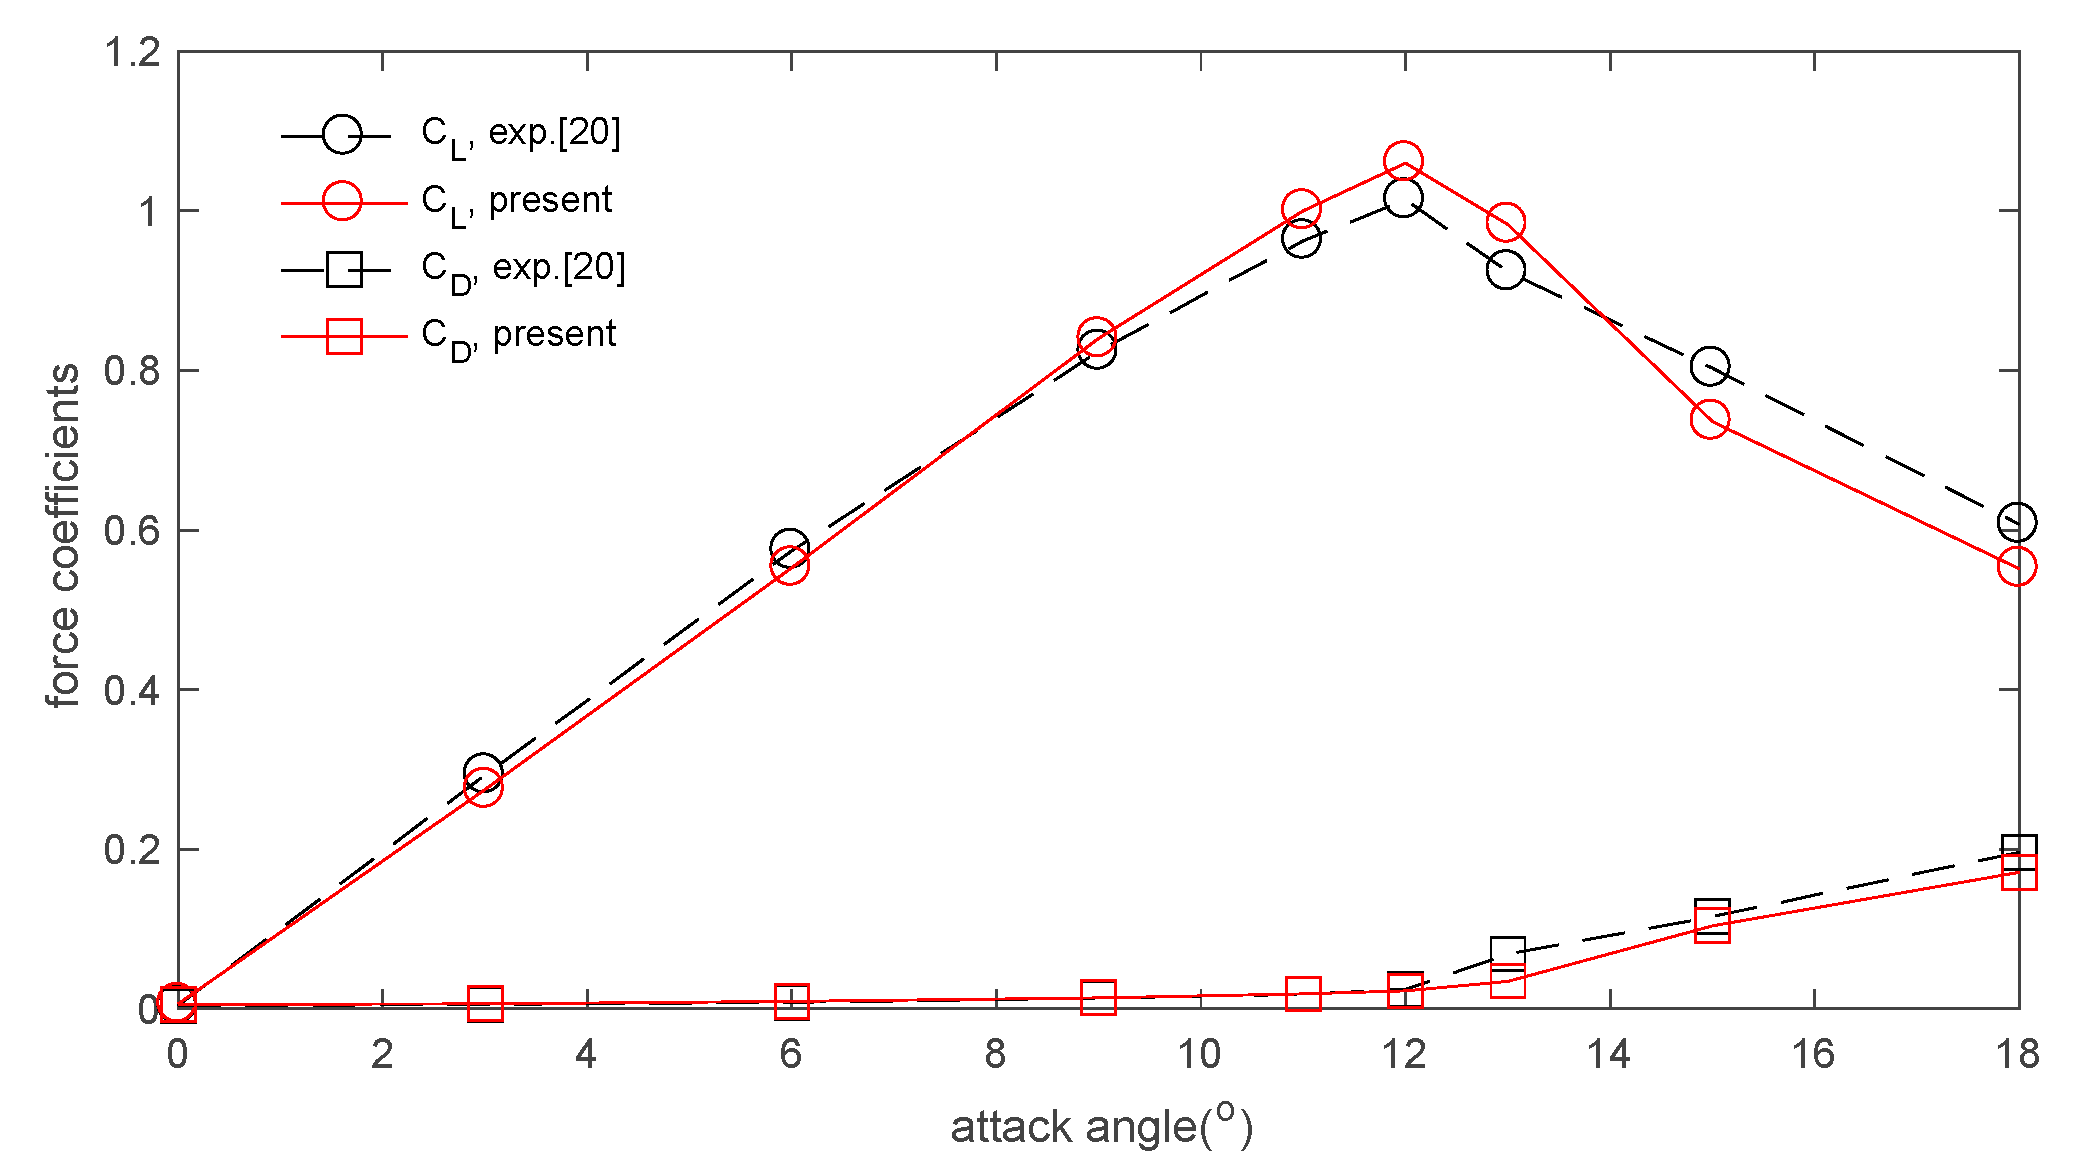
Figure 6 compares the present numerical results with the experimental data in [20], in terms of lift and drag coefficients subjected to different attack angles ranging from 0° to 18°. It is observed that the agreement between the present numerical results with the experimental data is generally acceptable. One may worry about the issue with the edge effect in the present numerical configuration, as indicated above. Some observation may clarify that such an arrangement is acceptable in this work. The first issue is about the prediction of the stall point, which is one of the critical parameters for blade, airfoil or hydrofoil. Figure 6 clearly shows that the stall point at an attack angle of 12° is correctly resolved by the present numerical approaches. It is admitted that the present numerical error becomes larger when the attack angle is around or higher than the stall point (Figure 6). Nevertheless, the maximum relative errors of the present results are 10% and 15% for the lift and drag, respectively, which can be considered to be acceptable.
4. Results and Discussion
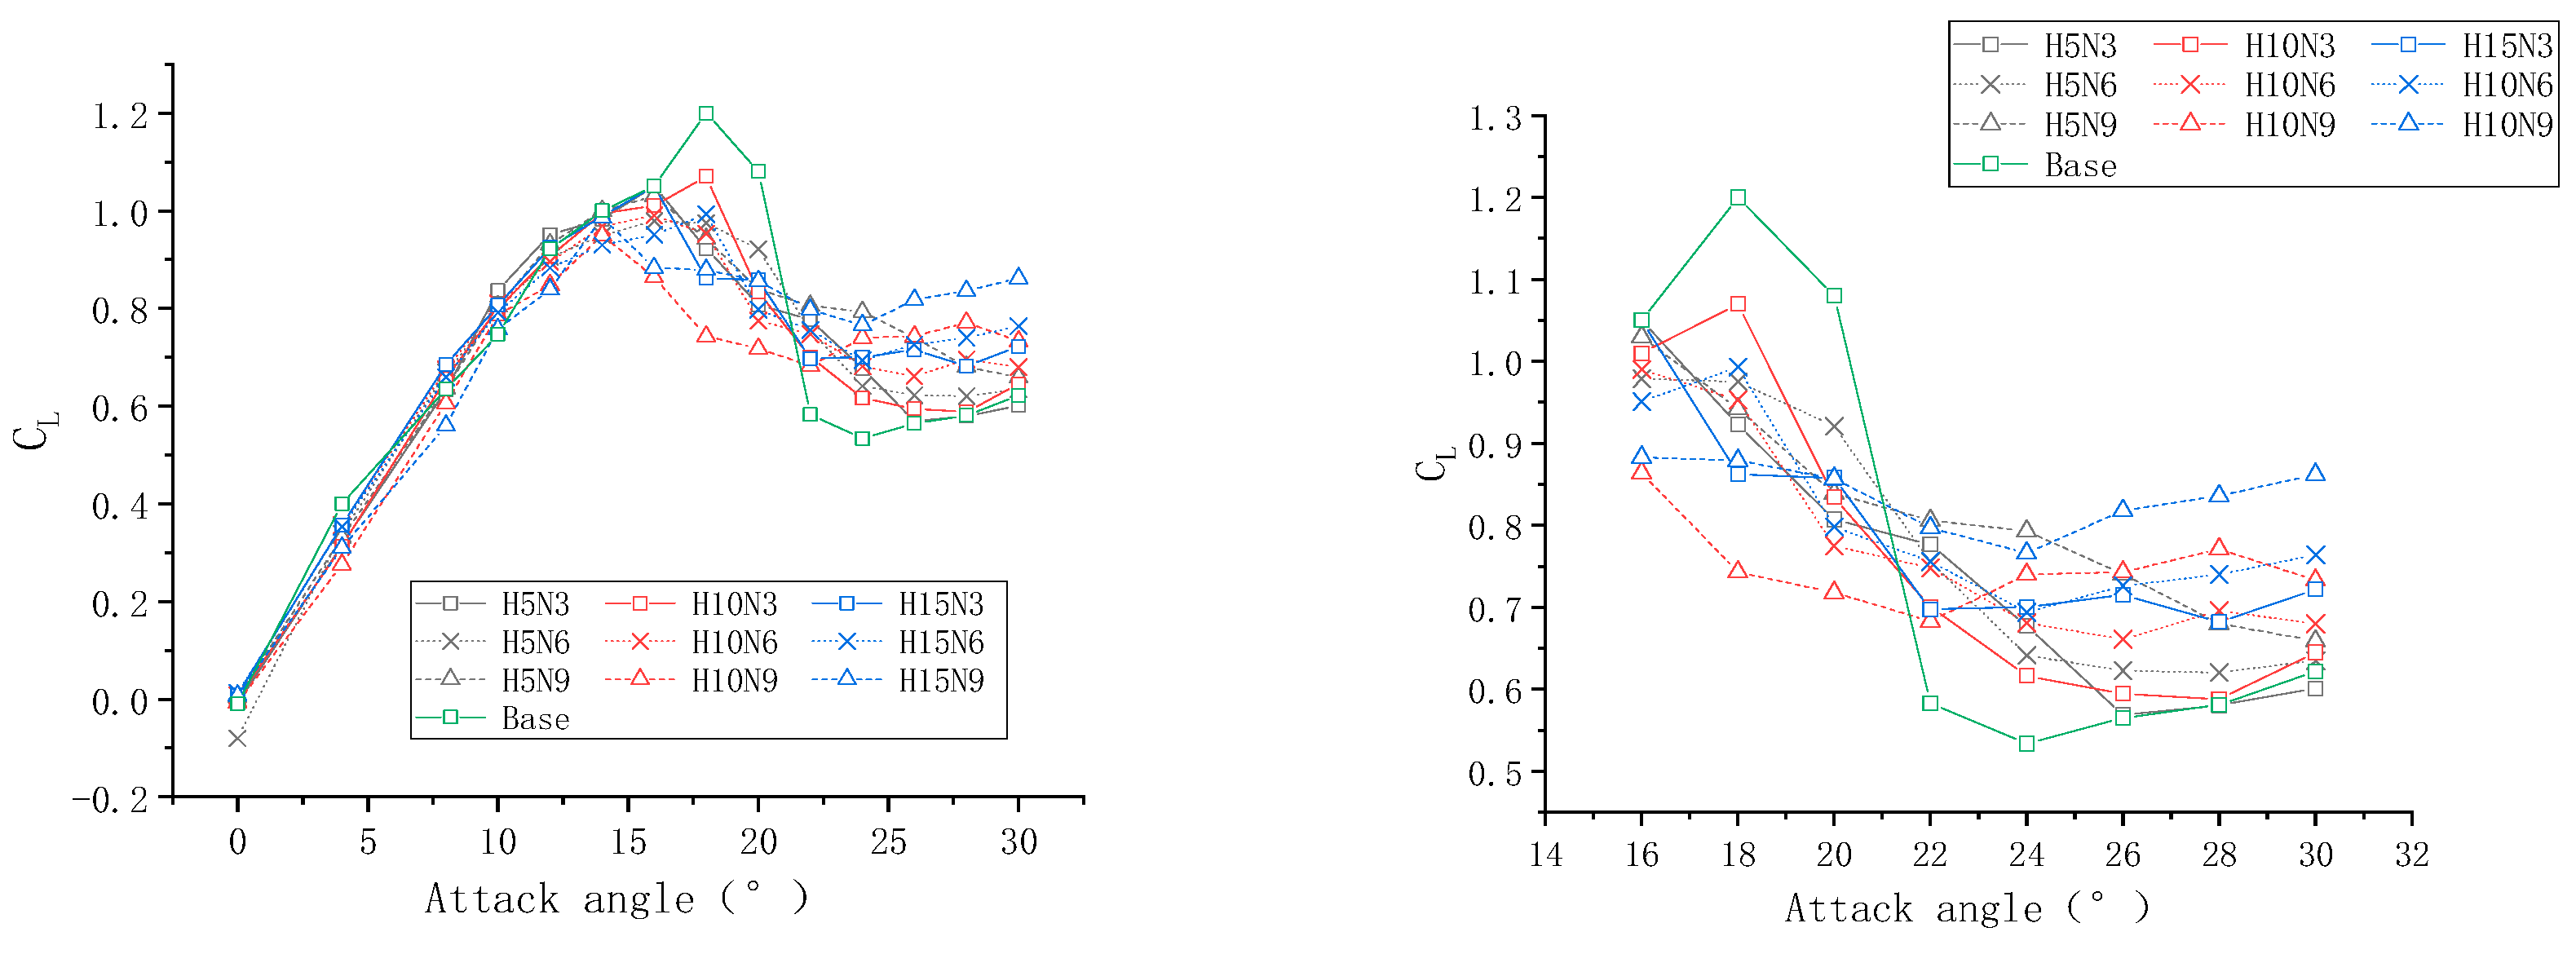
Based on the numerical validation shown in Section 3 and the convergent test shown prior, the present numerical approach is applied in order to investigate the effects of leading-edge tubercles on the hydrodynamic loading on the blade. As discussed in the Introduction, the changes of the loading due to the tubercles are largely due to their role in changing the local micro-scale flow characteristics, such as the vortex structure and the flow separation. These are also examined and discussed. In this investigation, the density and viscosity of the fluid are taken as ρ = 998.2 kg/m3 and μ = 1.003 × 10⁻³ kg/m·s, respectively. The design current speed is 2 m/s. The lift and drag coefficients for the base blade and those for the blades with different tubercle arrangements are estimated using Equations (2) and (3), respectively, in which the reference area A is taken as 0.1 m2. Some results are illustrated in Figure 7 and Figure 8 for the lift and drag coefficients, respectively. For clarity, the subplots in the right columns of these pictures are zoomed-in in order to show the high attack angles when the base blade shows a significant stall phenomenon.
For the base blade, it’s lift coefficient reaches the peak value of approximately 1.2 when the attack angle is 18°. Afterwards, a sharp drop (45.7% drop to 0.583) of the lift is observed as the attack angle is beyond 18°, suggesting a clear stall state. Consistent with the literature, the tubercles seem not to result in a considerable change to the lift and drag when the attack angle is small (<12°). For number of tubercles n = 3 (squared mark in Figure 7), the tubercles do not show a benefit on delaying the stall to a higher attack angle (in fact, H5N3 and H15N3 have an earlier occurrence of the stall at 16°) compared with the base blade. Nevertheless, the lift drops after the stall point at a considerably slower rate (14.3%, 27.7% and 24.3% for H5N3, H10N3 and H15N3, respectively), and consequently, the lift maintains in a relatively steady state for the blades with tubercles. For n = 6 (circular mark in Figure 7), similar variations to the cases with n = 3 are observed. H5N6 and H15N6 reach the maximum lift coefficients (approximately 1.0) when the attack angle is 18°, whereas H10N6 shows an earlier appearance of the peak value at 16°. The maximum rates of the lift drop in the cases with tubercles are 21.9%, 22.9% and 24.4%, respectively, for H5N6, H10N6 and H15N6. It is further observed that the lift coefficients of the blades with six tubercles are all higher than the base blade when subjected to high attack angle (>22°), where the average increments of the lift are 16.7%, 20.4% and 27.7% for H5N6, H10N6 and H15N6, respectively. Further increase in the number of tubercles seems to not cause a delay of the stall to a higher attack angle (e.g., n = 9, star mark in Figure 7). H5N9 reaches its peak lift of 1.03 when the attack angle is 16°, whereas both H10N9 and H15N9 have a stall point at 14°. Nevertheless, the lift drops beyond the stall point at a much lower rate (i.e., 6.7%, 5.8% and 3.6% for H5N9, H10N9 and H15N9, respectively). At a high attack angle, a more significant improvement in terms of lift is observed in the cases with tubercles (i.e., 28.2%, 27.6% and 41.5% for H5N9, H10N9 and H15N9, respectively). Overall, the introducing of the leading-edge tubercles in the present study does not always delay the stall point but makes the lift beyond the stall point steadier due to a much slower dropping rate. More importantly, the leading-edge tubercles improve the lift when the blade is subjected to a high attack angle (i.e., >22°). For clarity, Table 3 summarizes the relevant parameters for the base blade and the blades with leading-edge tubercles. One can observe from Table 3 that the average improvement of the lift by the tubercles when the blade subjected to high attack angles increases as the number of tubercles increases, providing the same height of the tubercles.
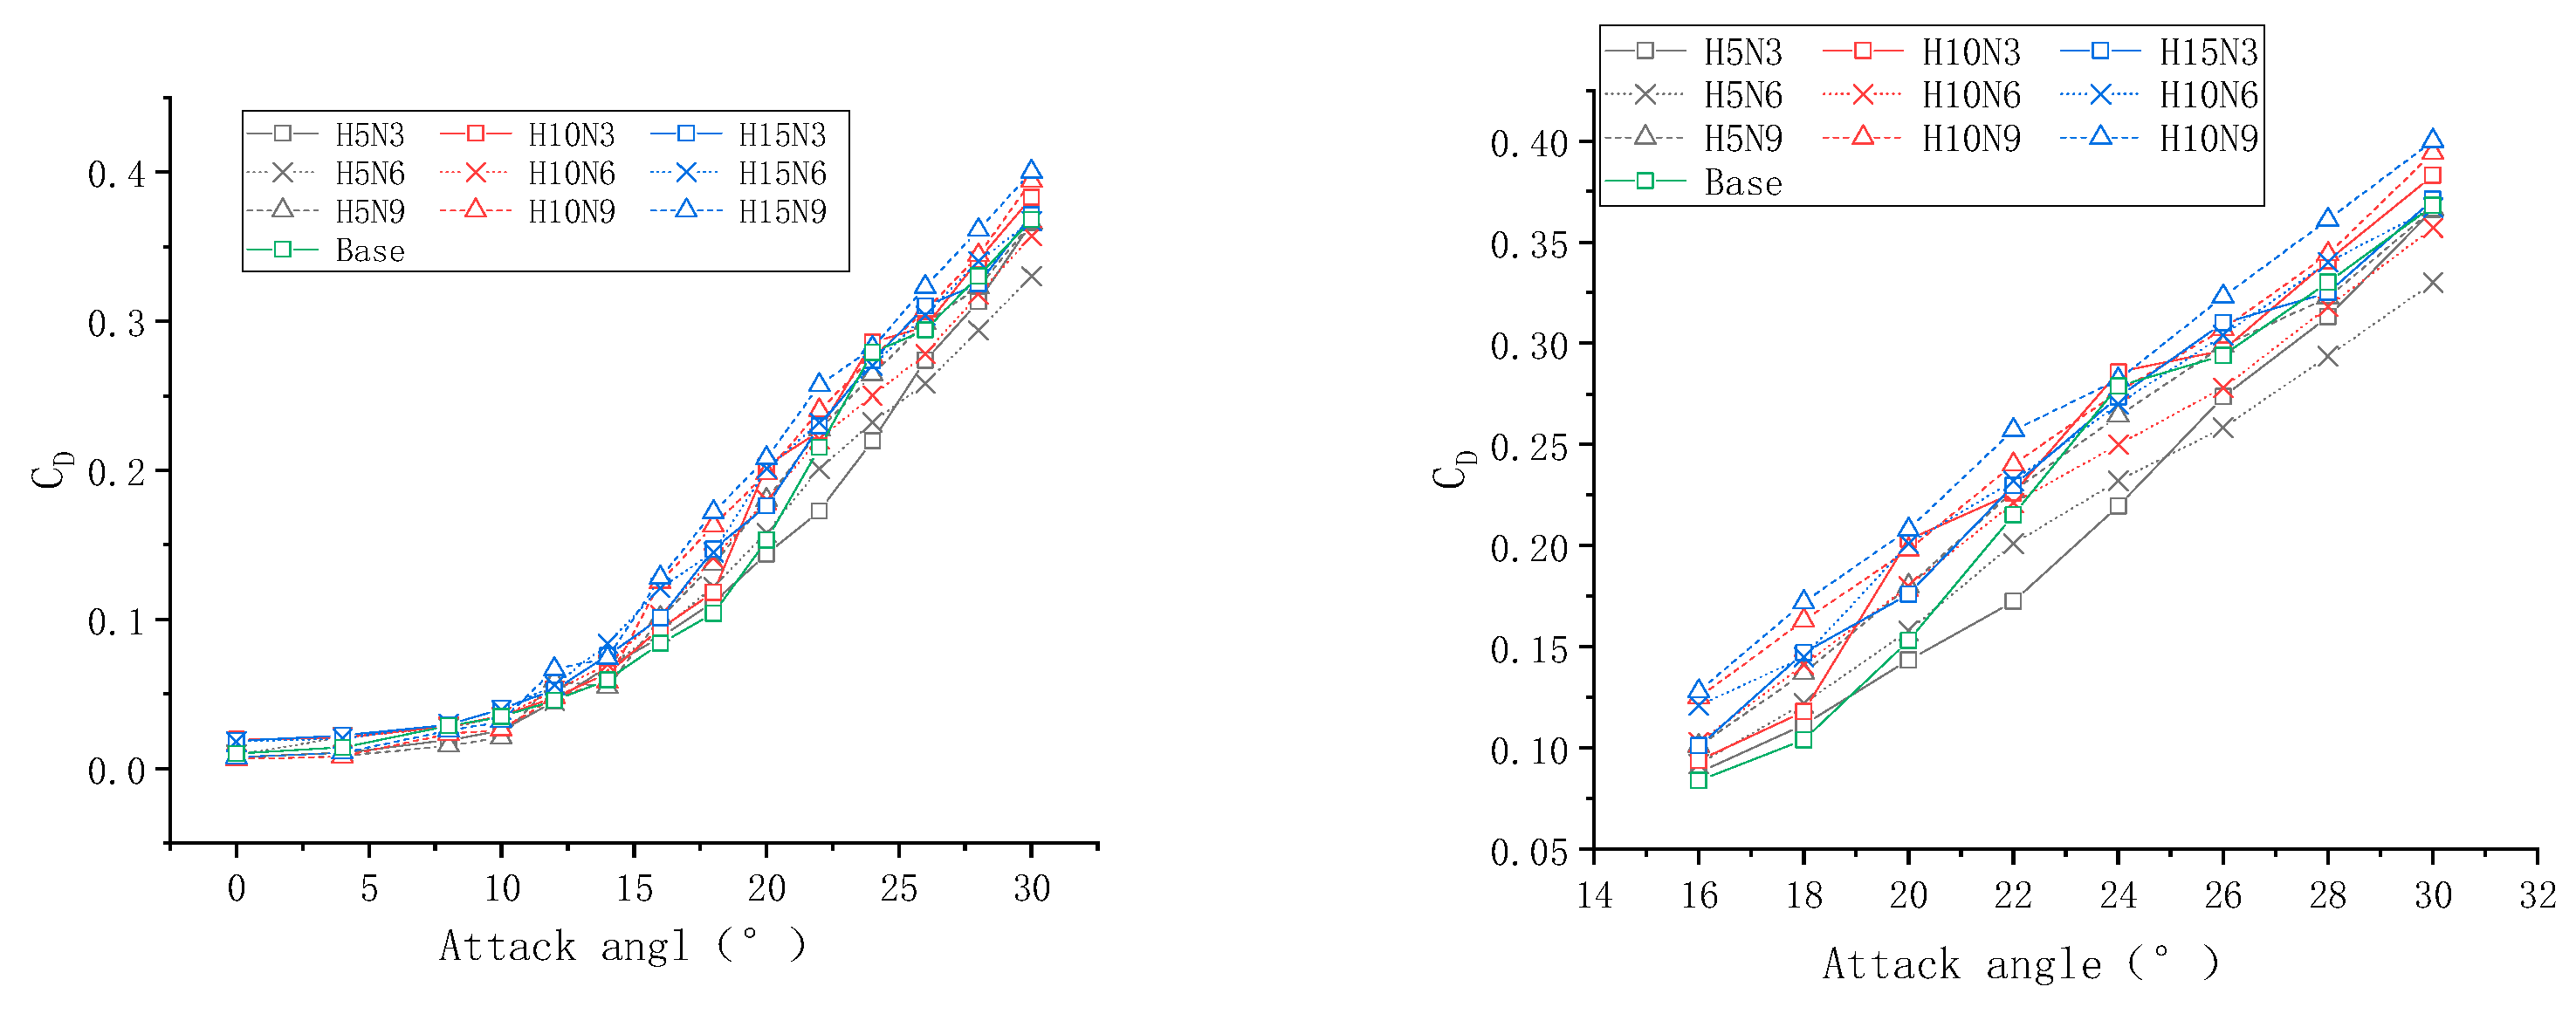
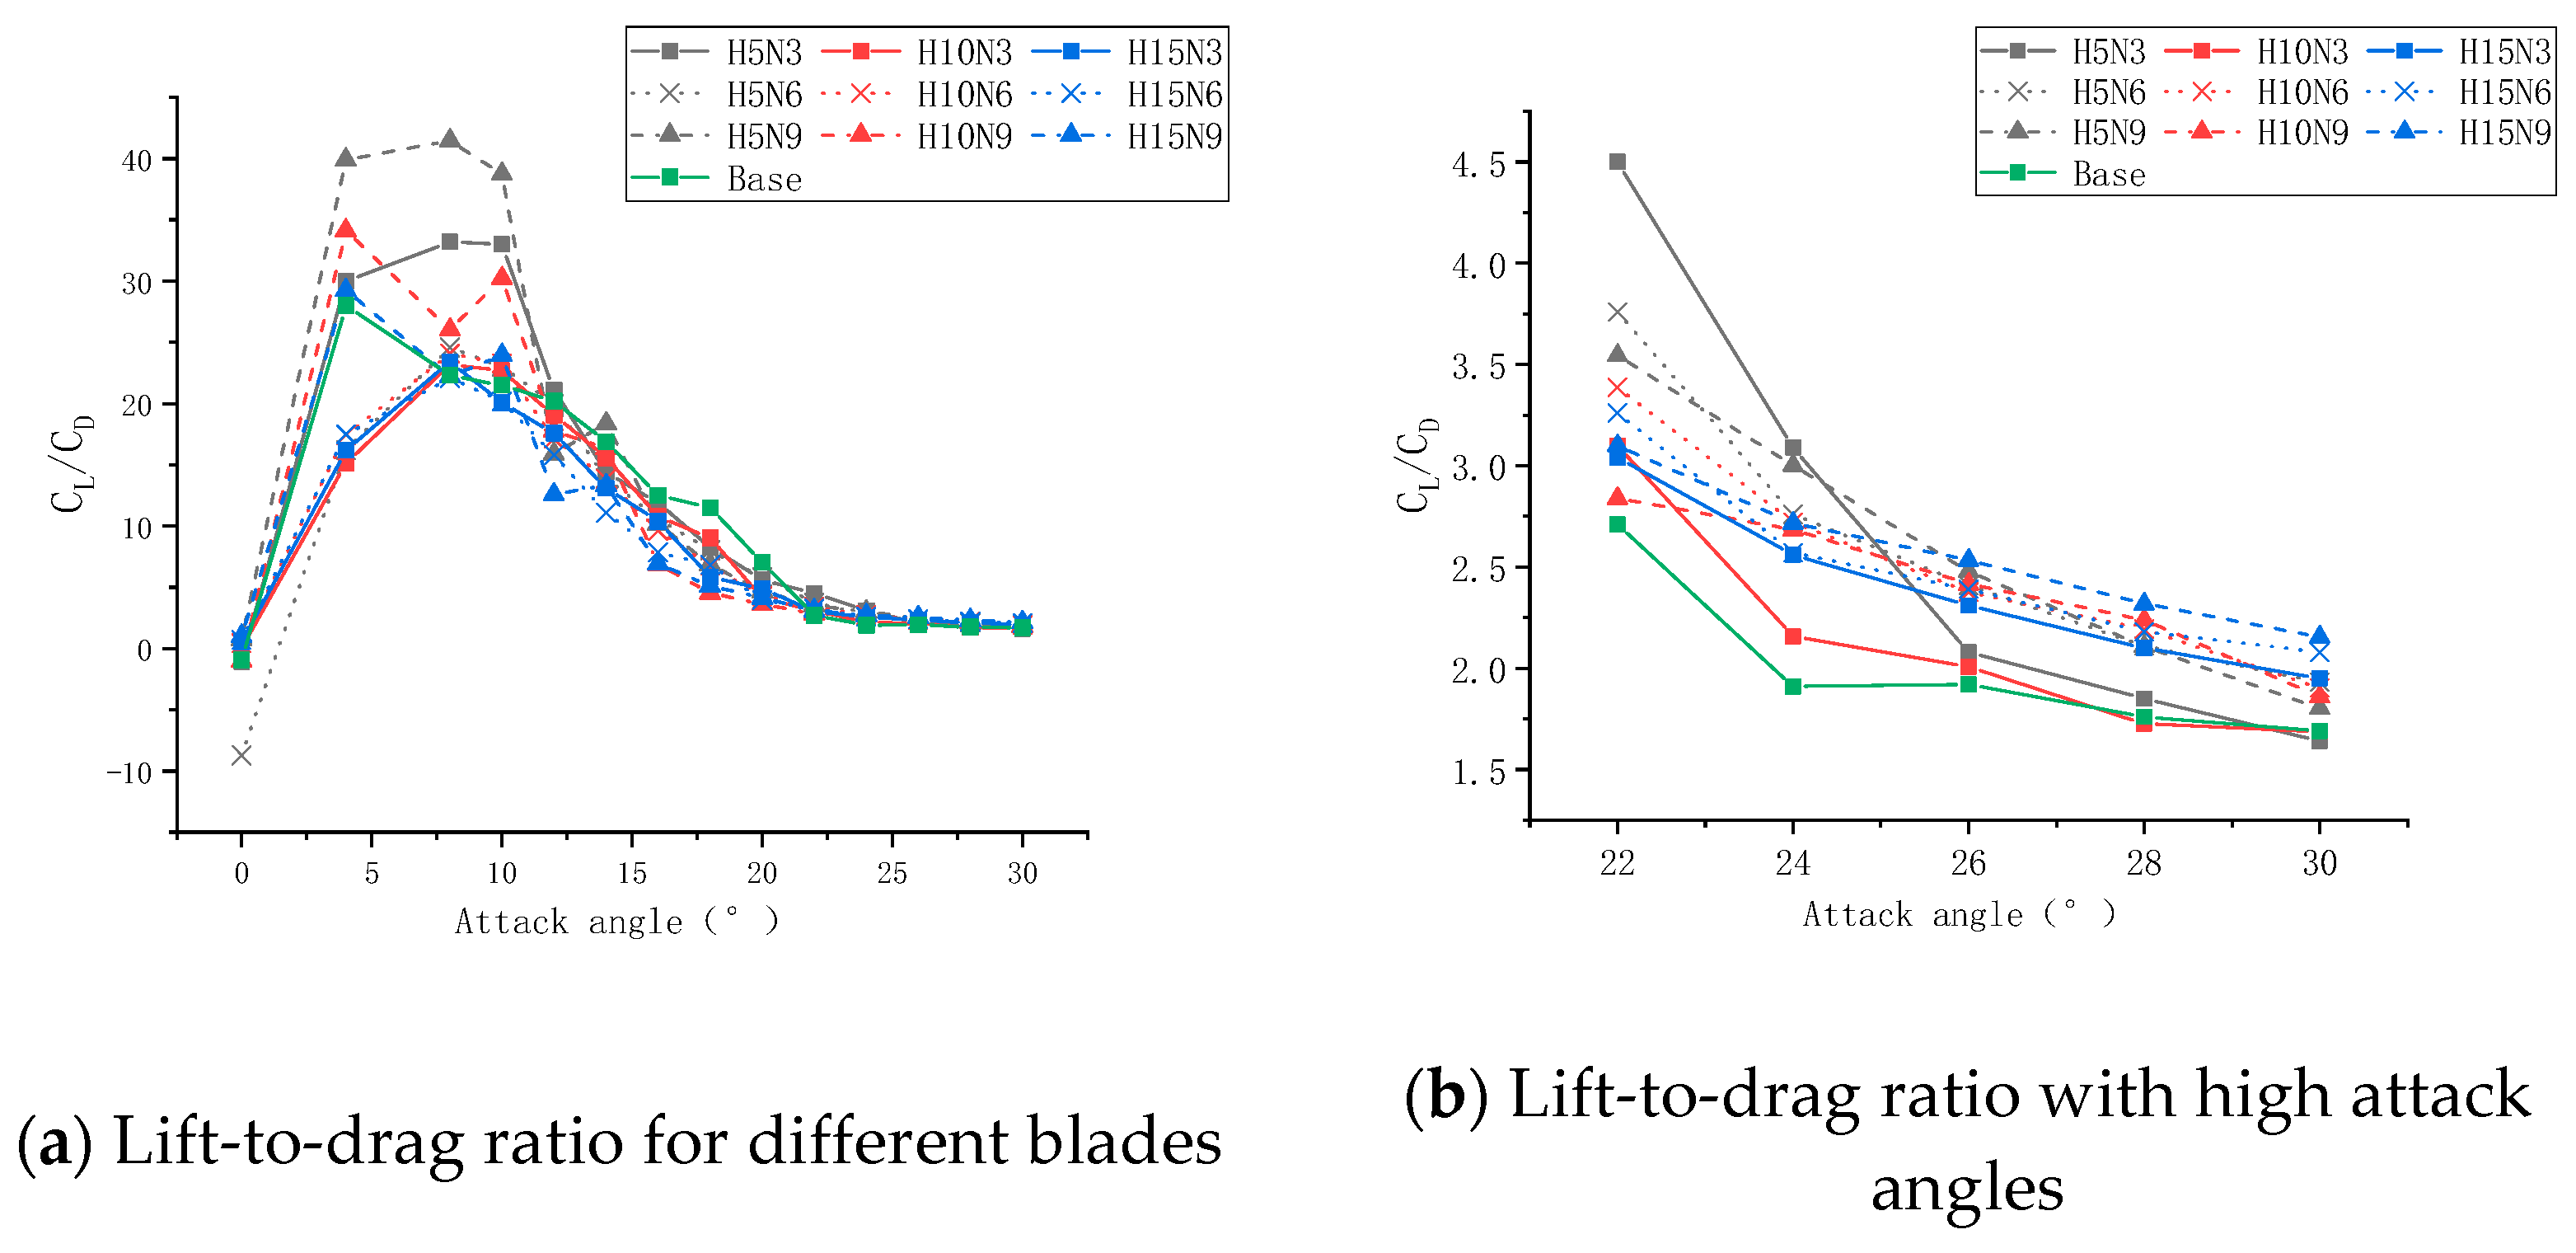
The drag on the base blade increases as the attack angle increases (Figure 8). The same trend is observed for all other blade models. The leading-edge tubercles may produce a difference in the drag coefficients within a range of . The corresponding lift-to-drag ratio is plotted in Figure 9. Figure 9b is the zoomed-in plot for the cases with high attack angles. Similar to [12], a better lift-to-drag ratio may be achieved for low attack angles by introducing the tubercles. It is also not surprising to find a considerably improved lift-to-drag ratio caused by the tubercles when the blades are subjected to high attack angles (Figure 9b).
As indicated in the Introduction, the vortex structure and flow separation play critical roles on the hydrodynamic performance of the blade. To further examine such small-scale phenomenon, the iso-surface of the Q-criteria, which is defined as
where Ω and S are the vorticity tensor and the rate of strain tensor, respectively, and the distribution of the streamline near the blades are illustrated. Figure 10 plots the corresponding values for the base blade with attack angles smaller than the stall point (18°). It is clear that the flow is attached to the majority of the base blade surface, although the flow separation begins to initiate at the lower section of the blade close to the smallest chord when the attack angle is 14° (Figure 10a,b) and becomes more significant as the attack angle increases to 16°. Such a change in the flow characteristics may explain the change in the gradient of the lift of the base blade between 14° and 16° and 16° and 18° in Figure 7.
Q = 0.5(||Ω||2−||S||2)
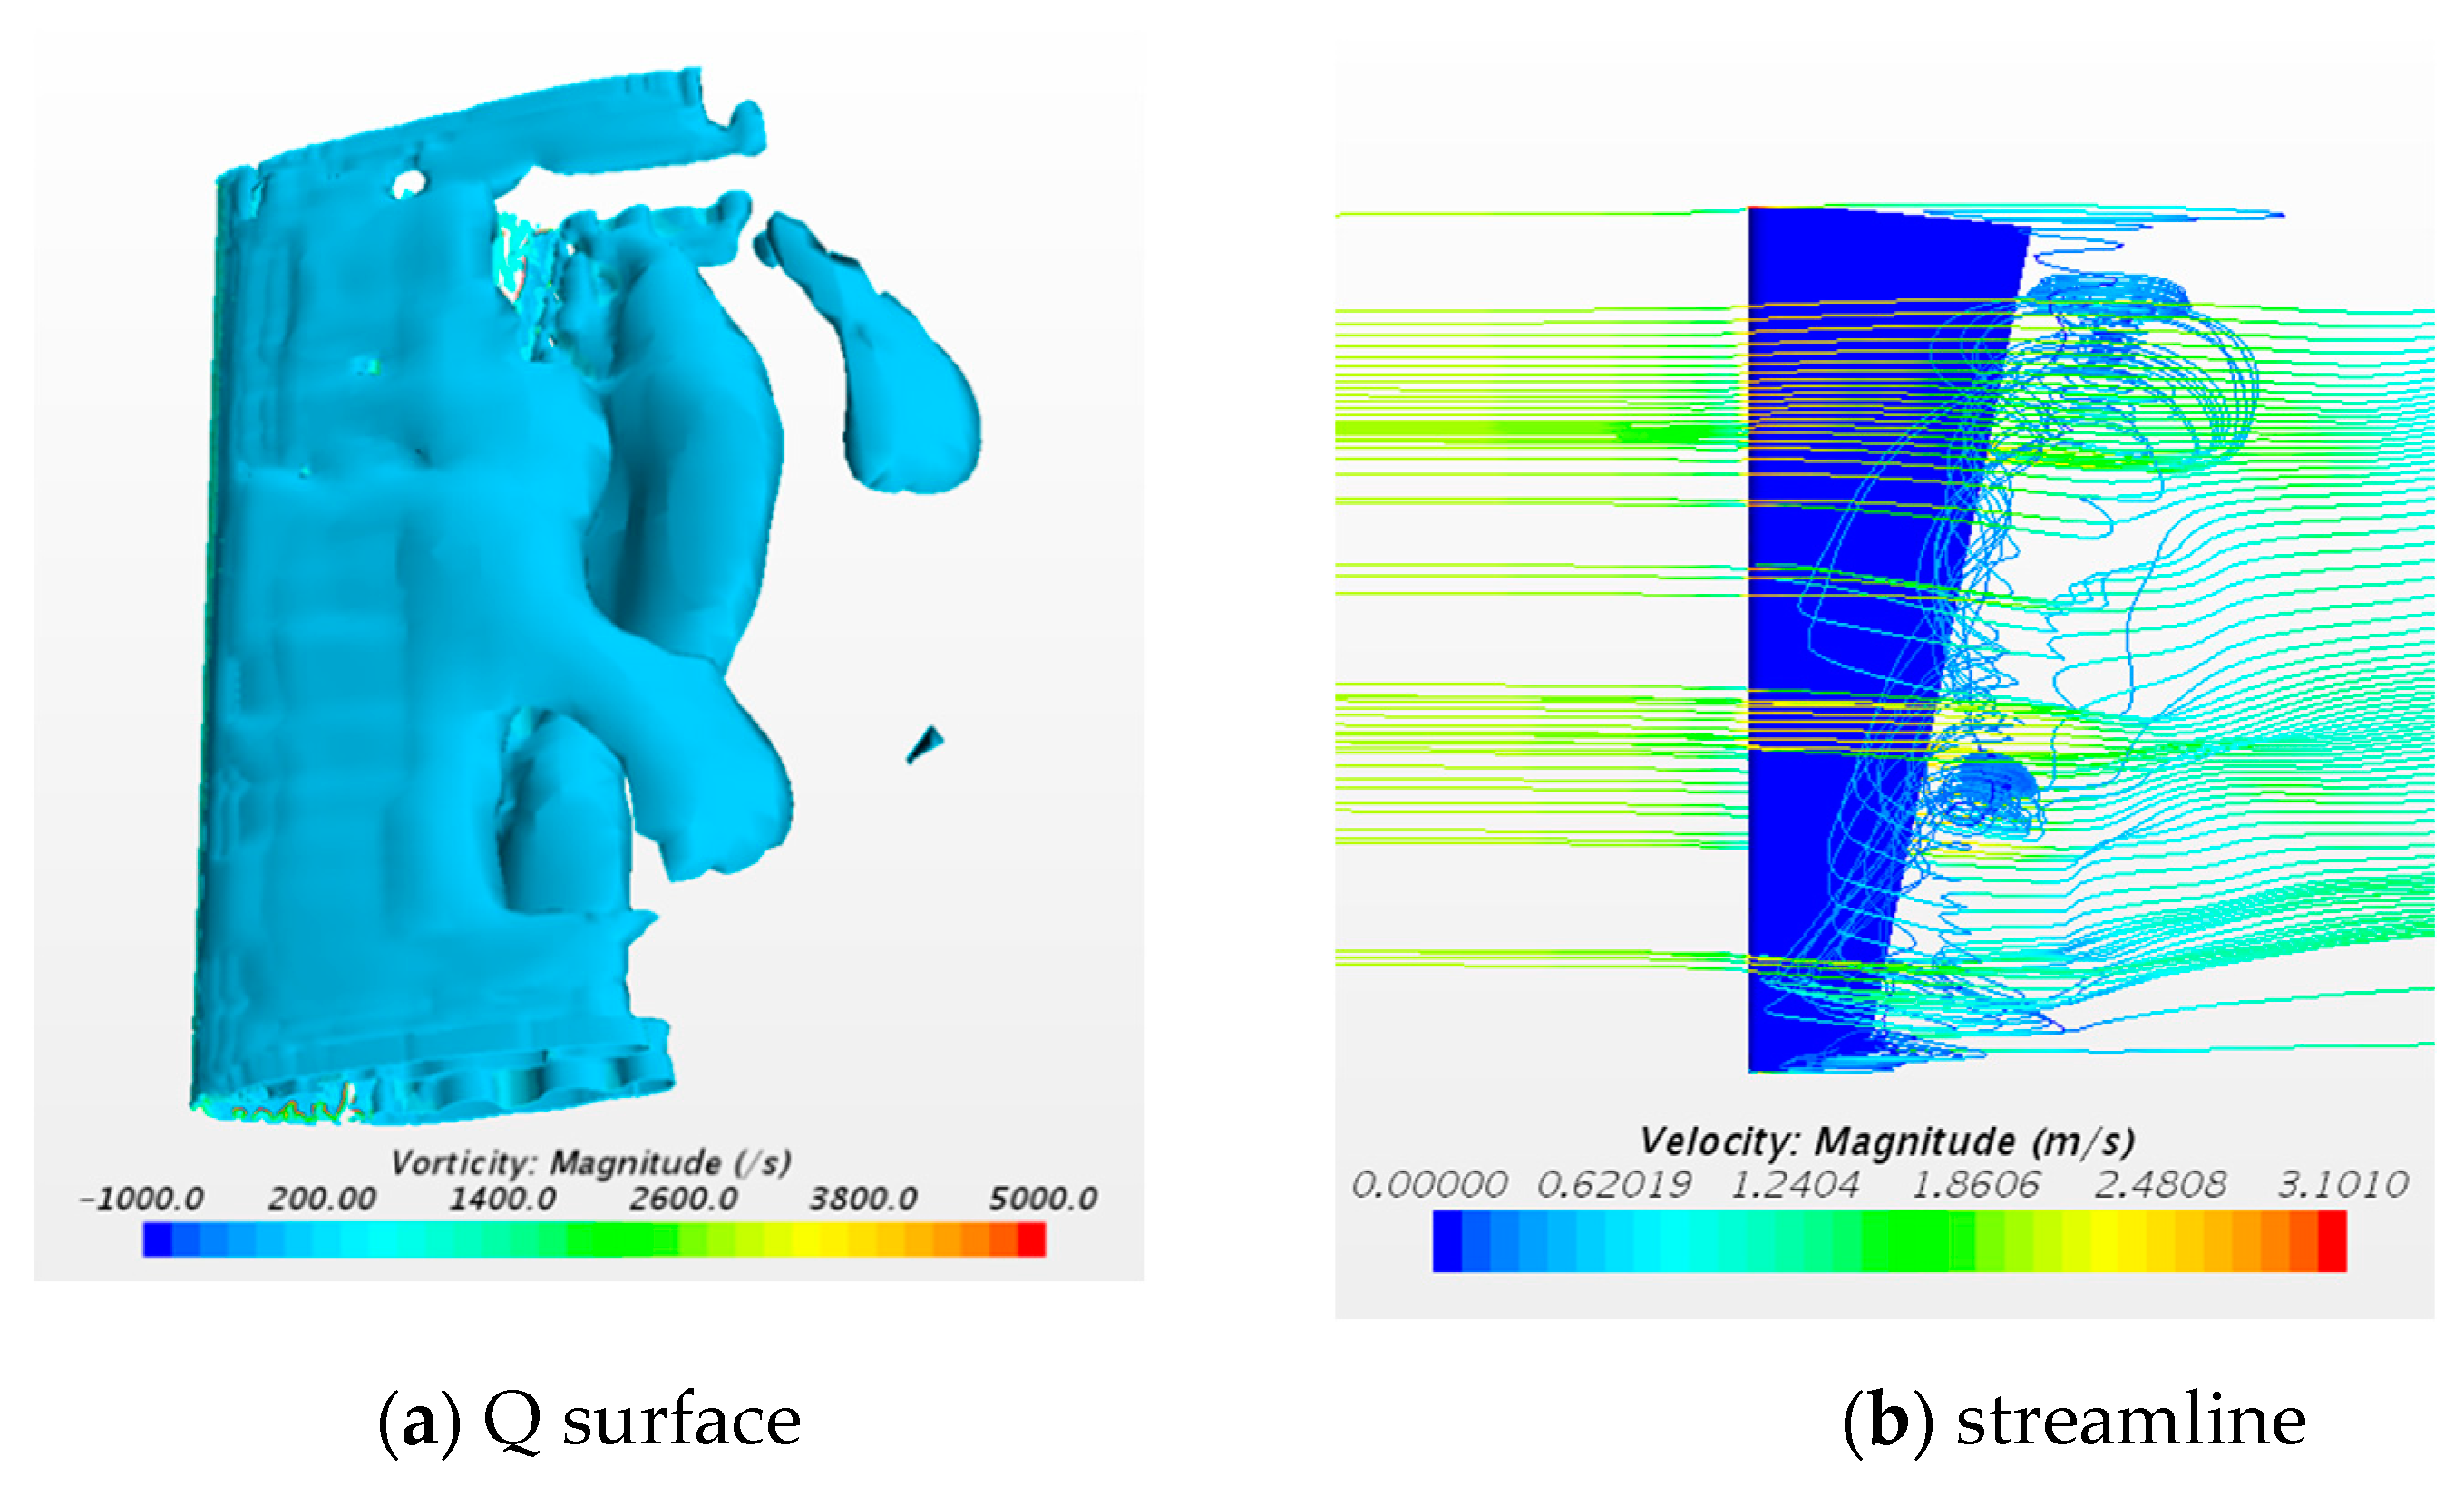
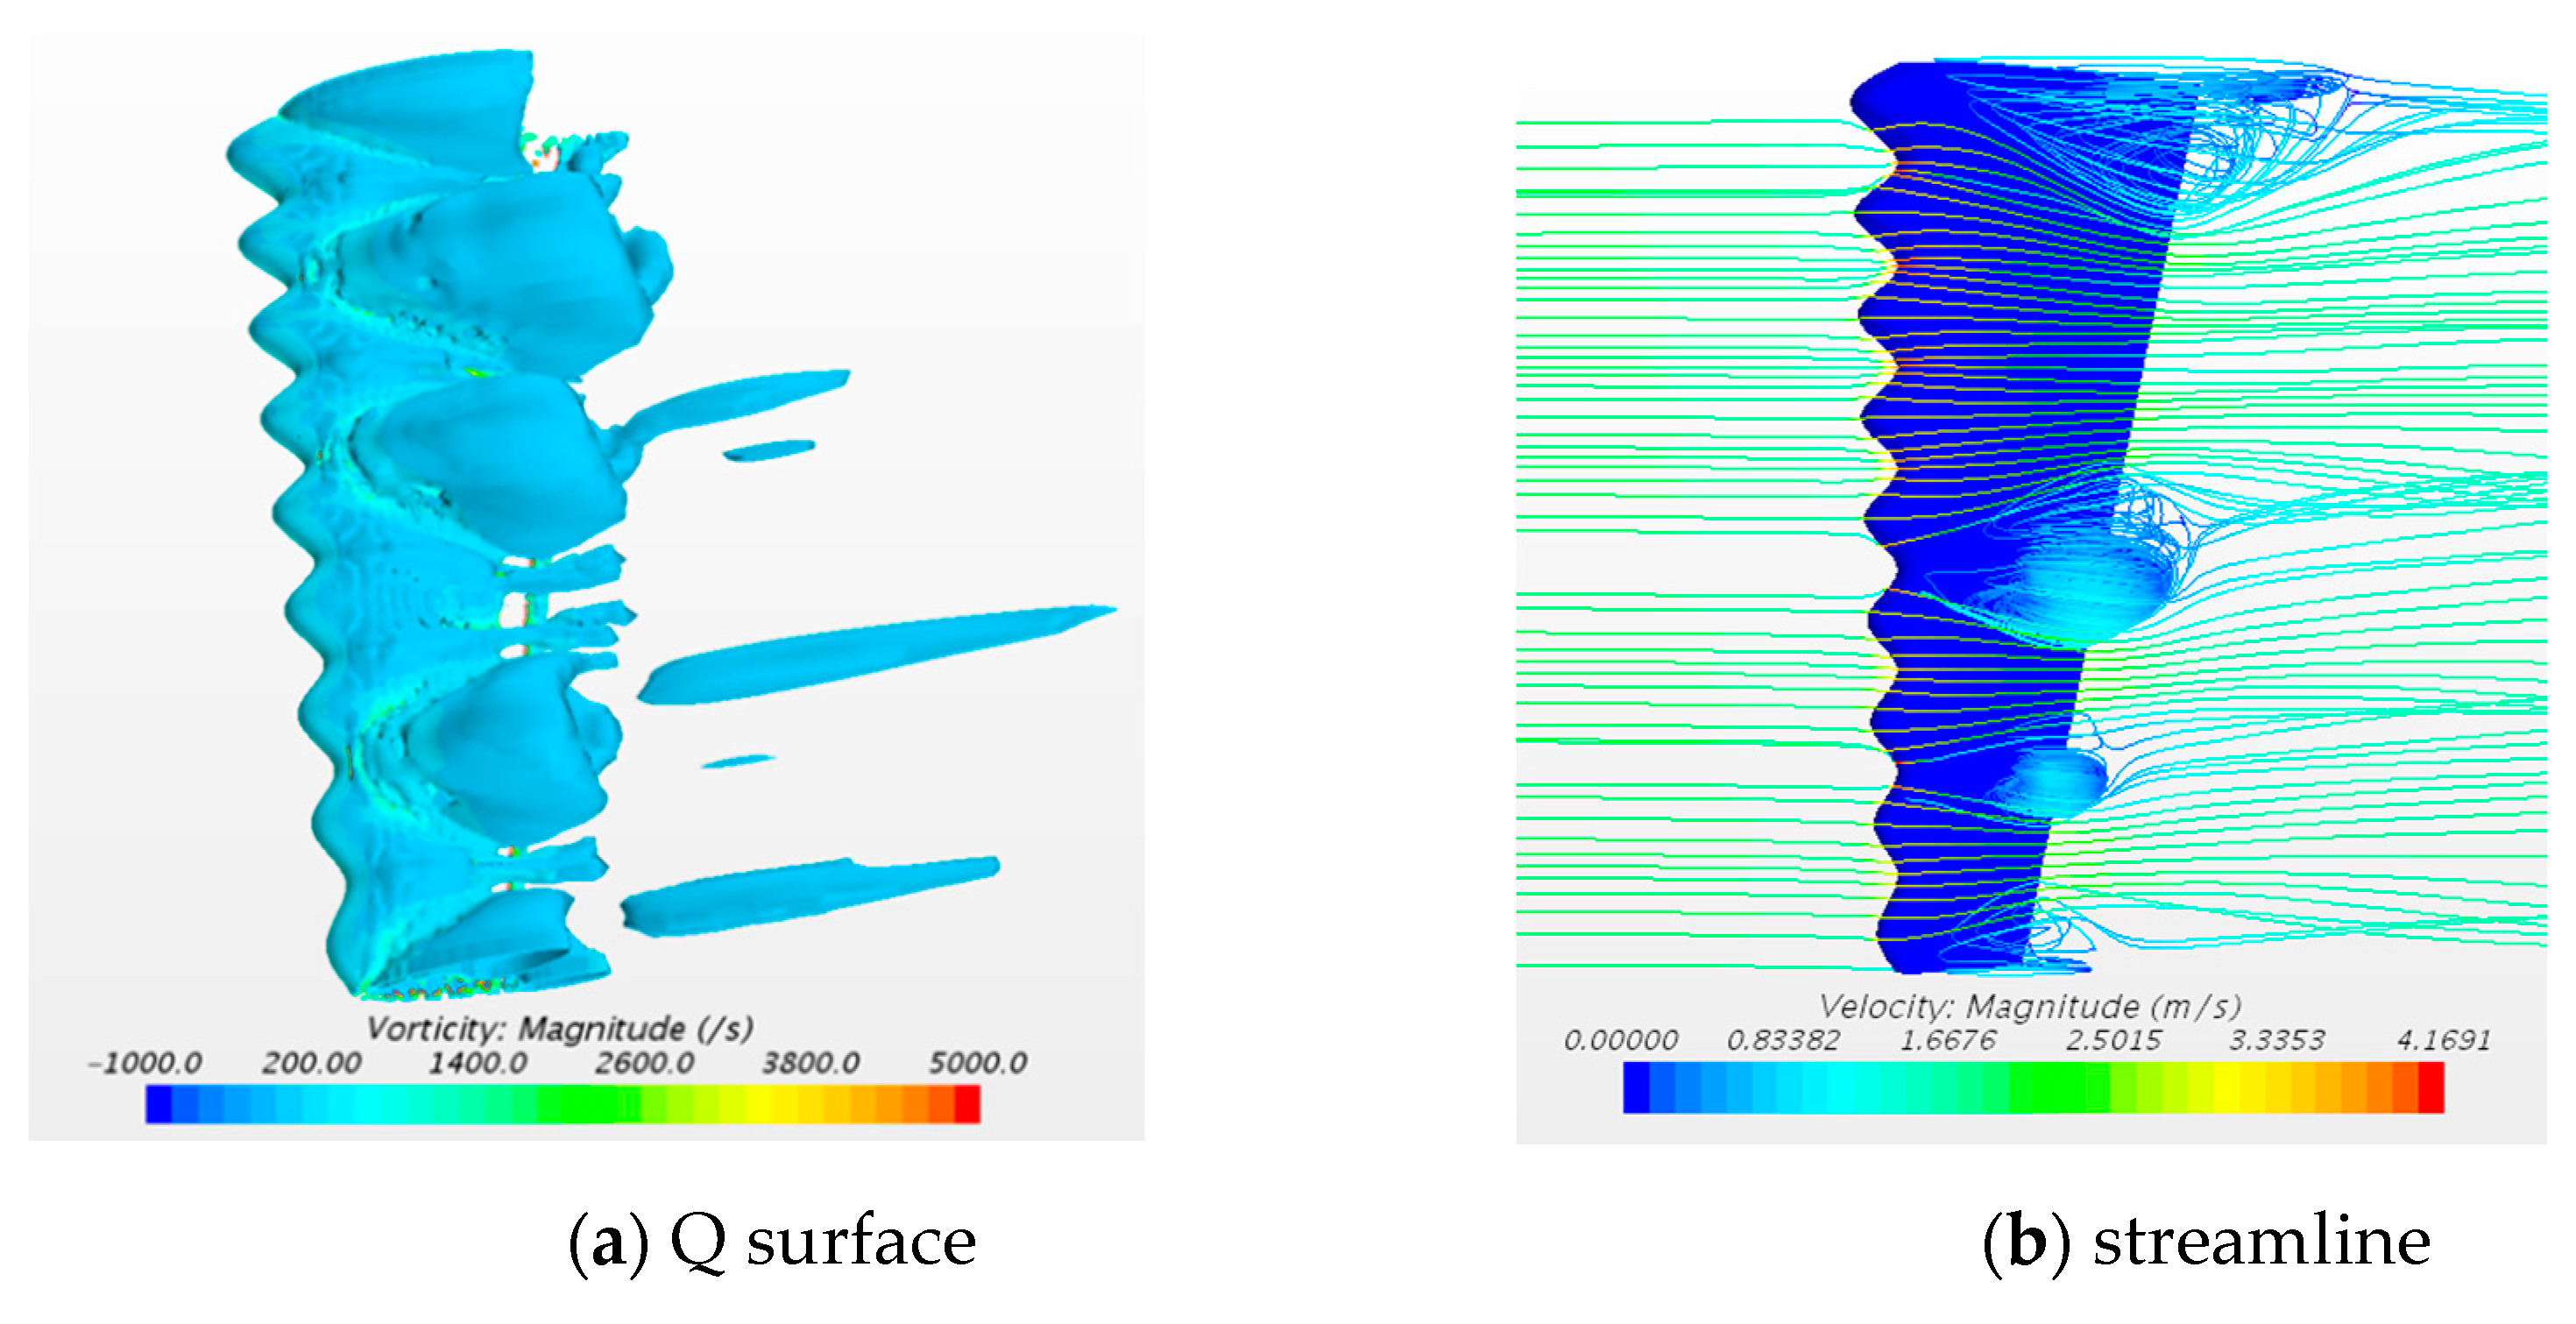
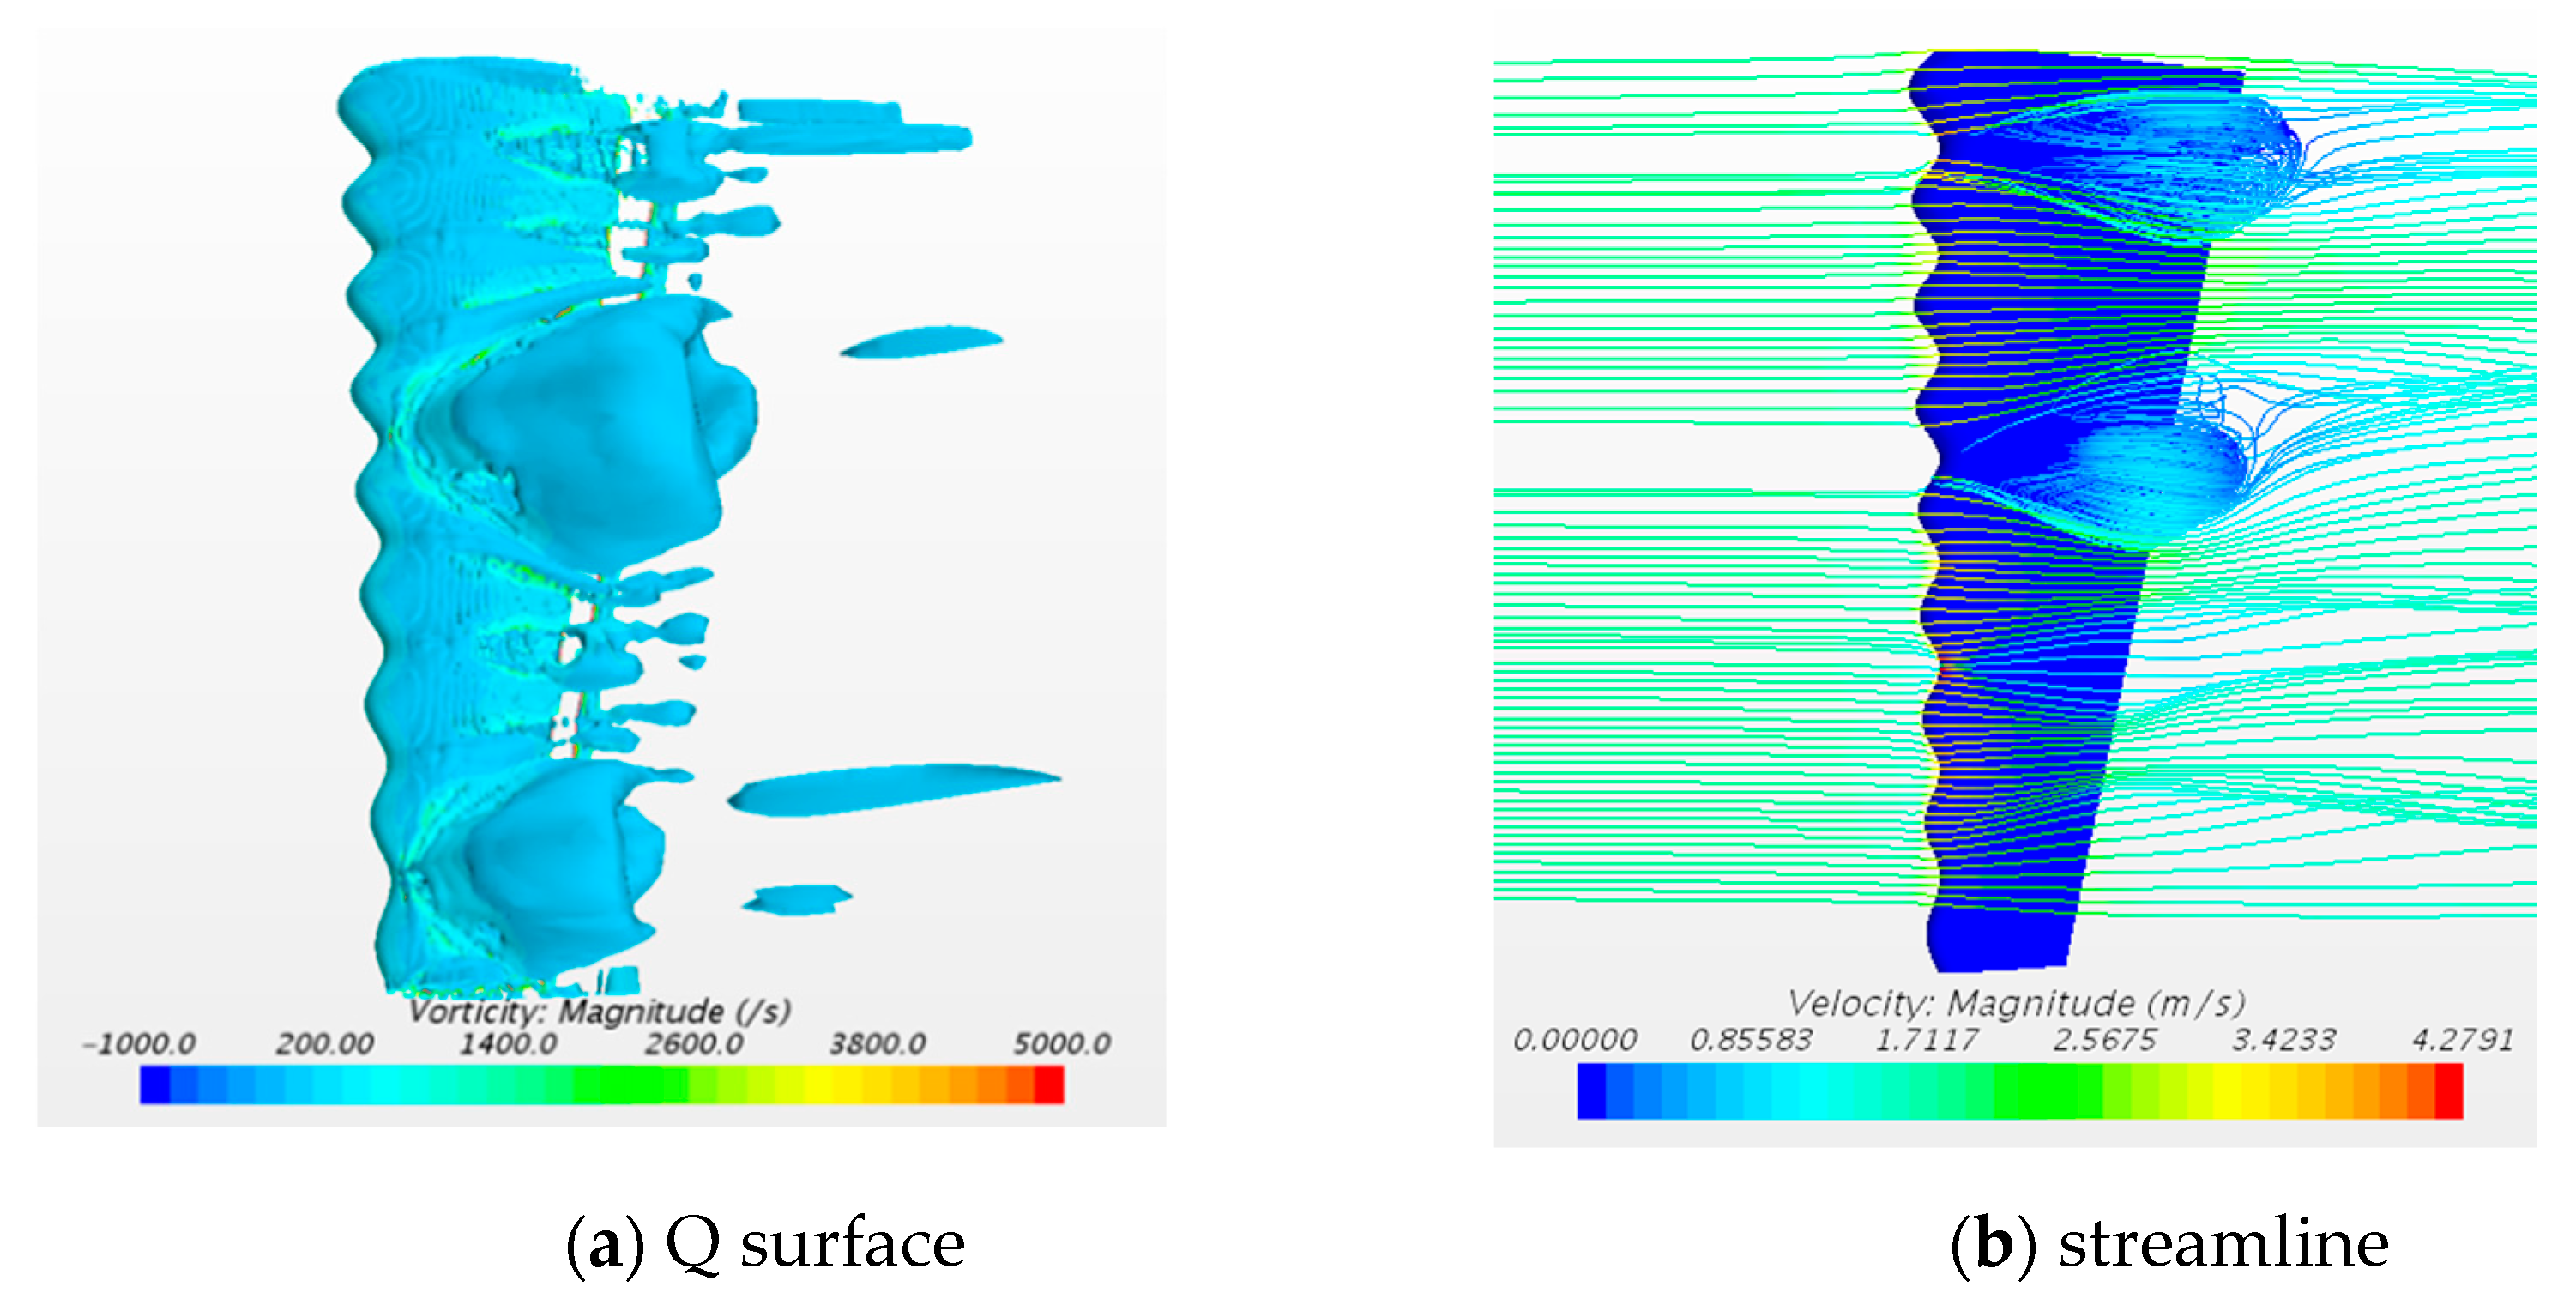
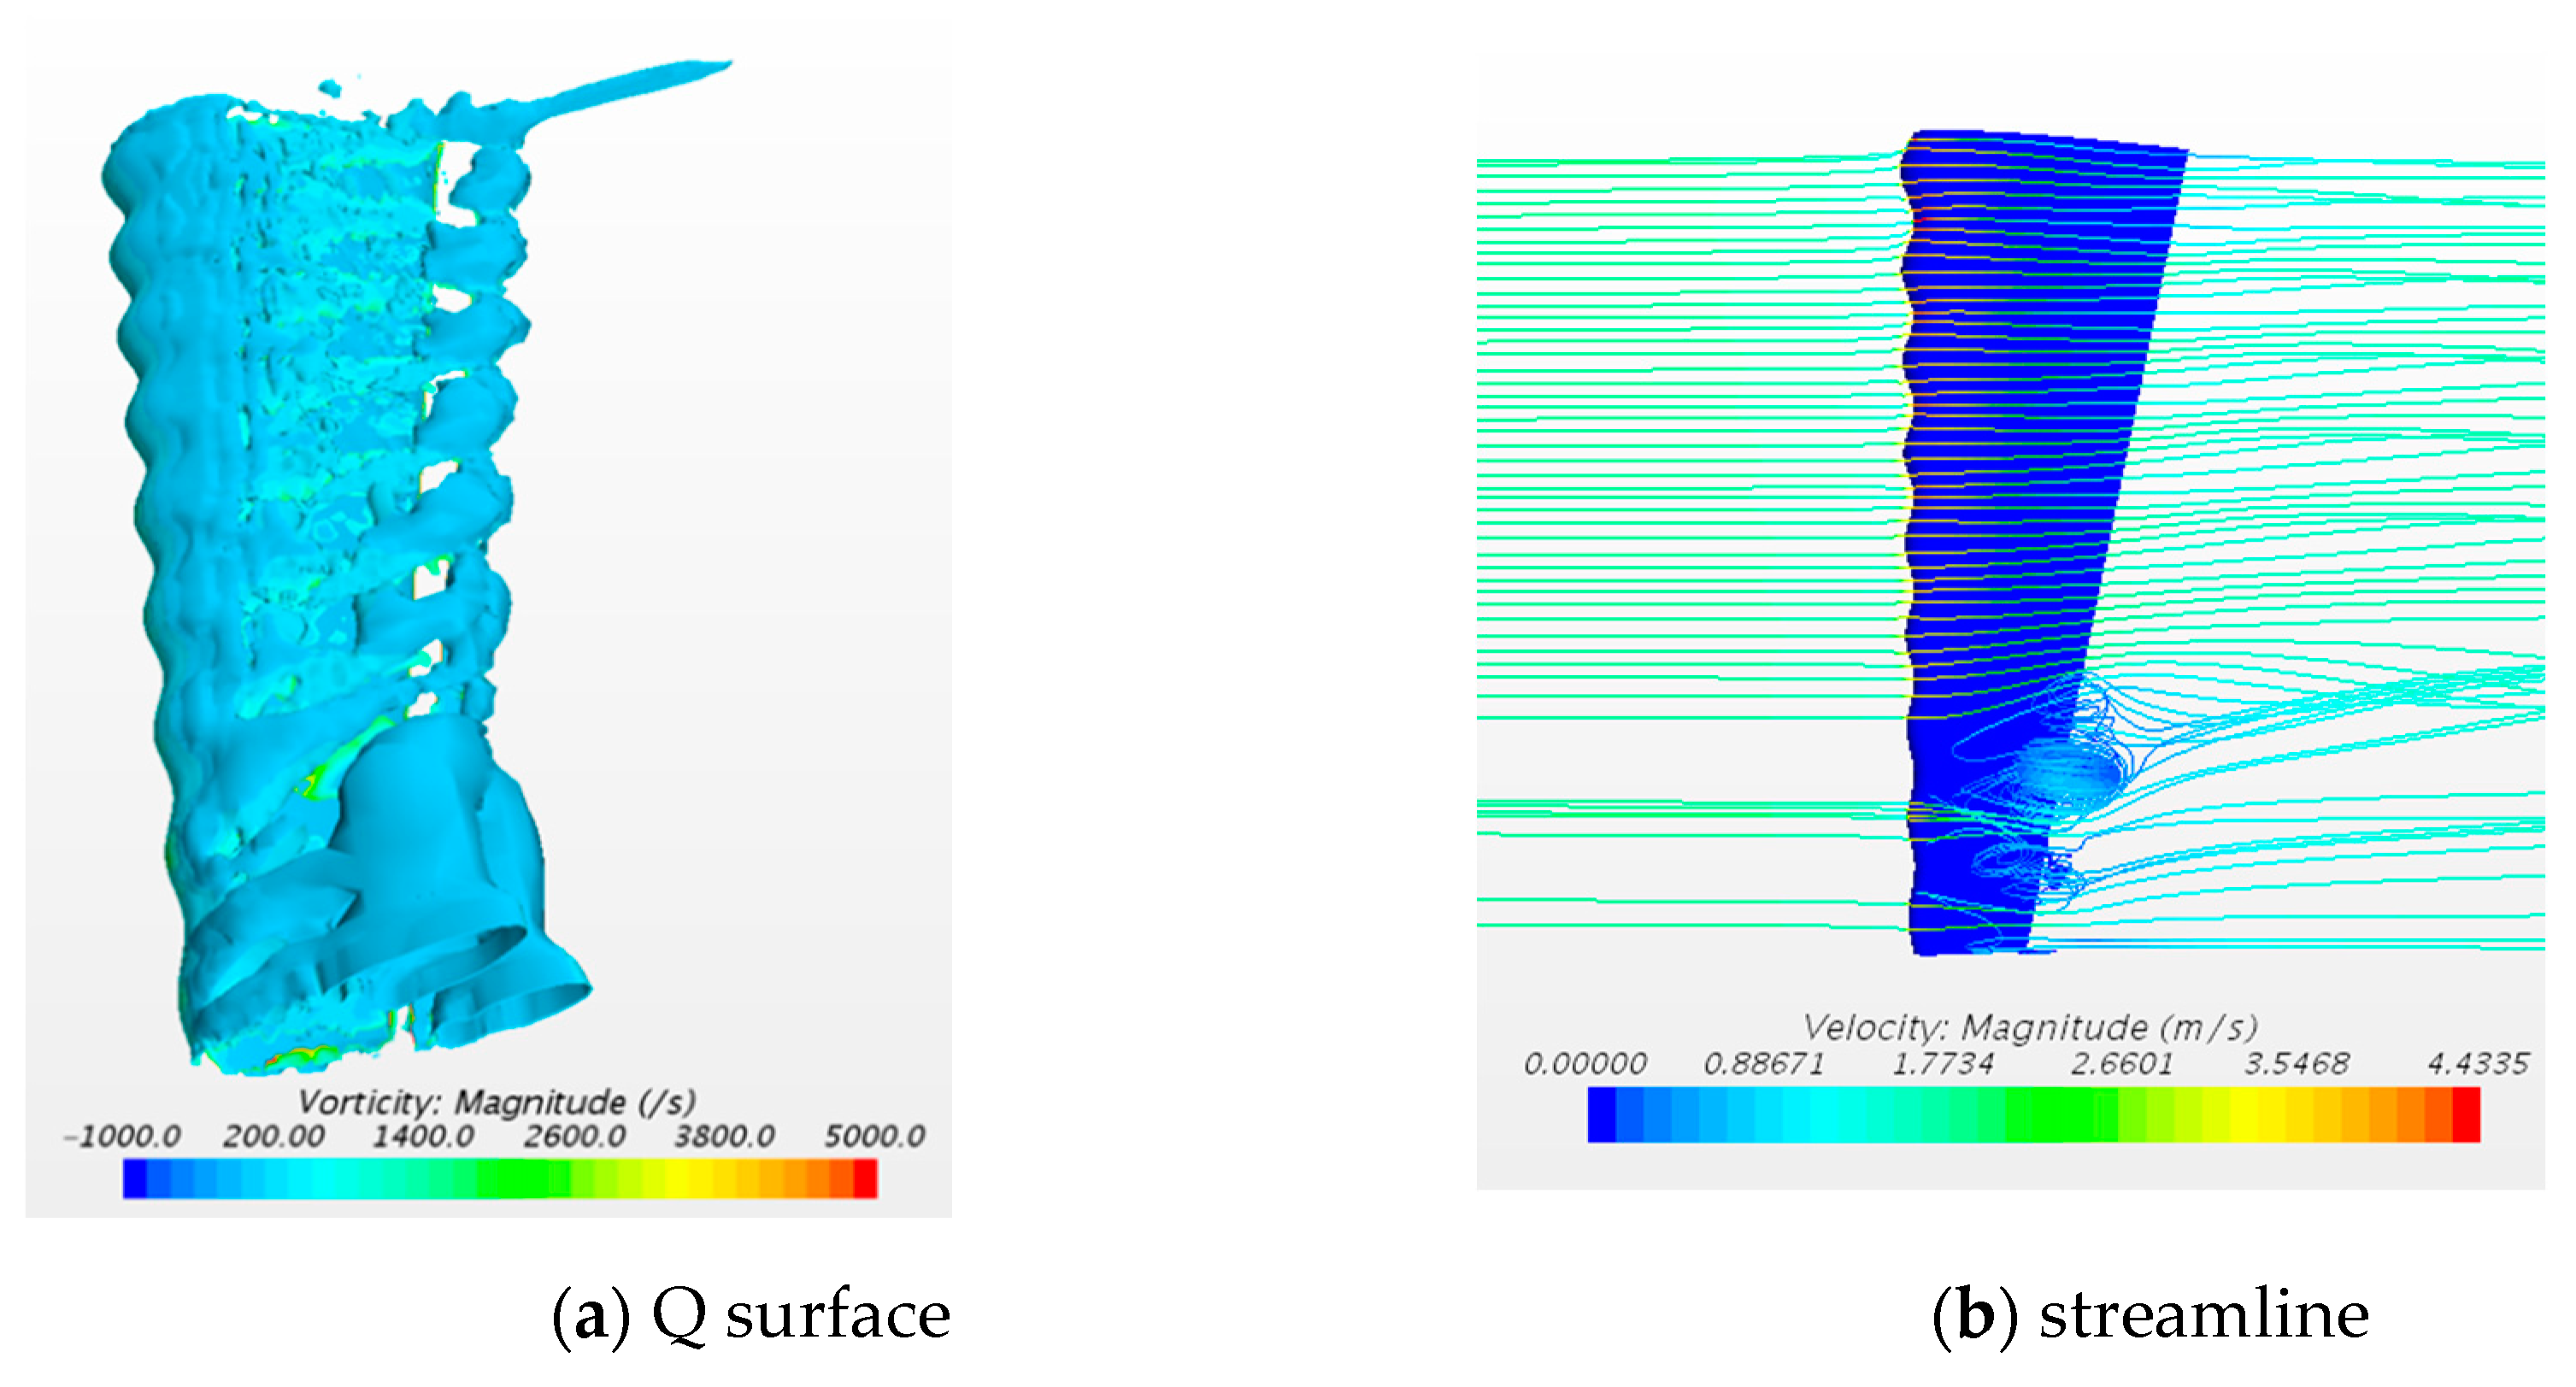
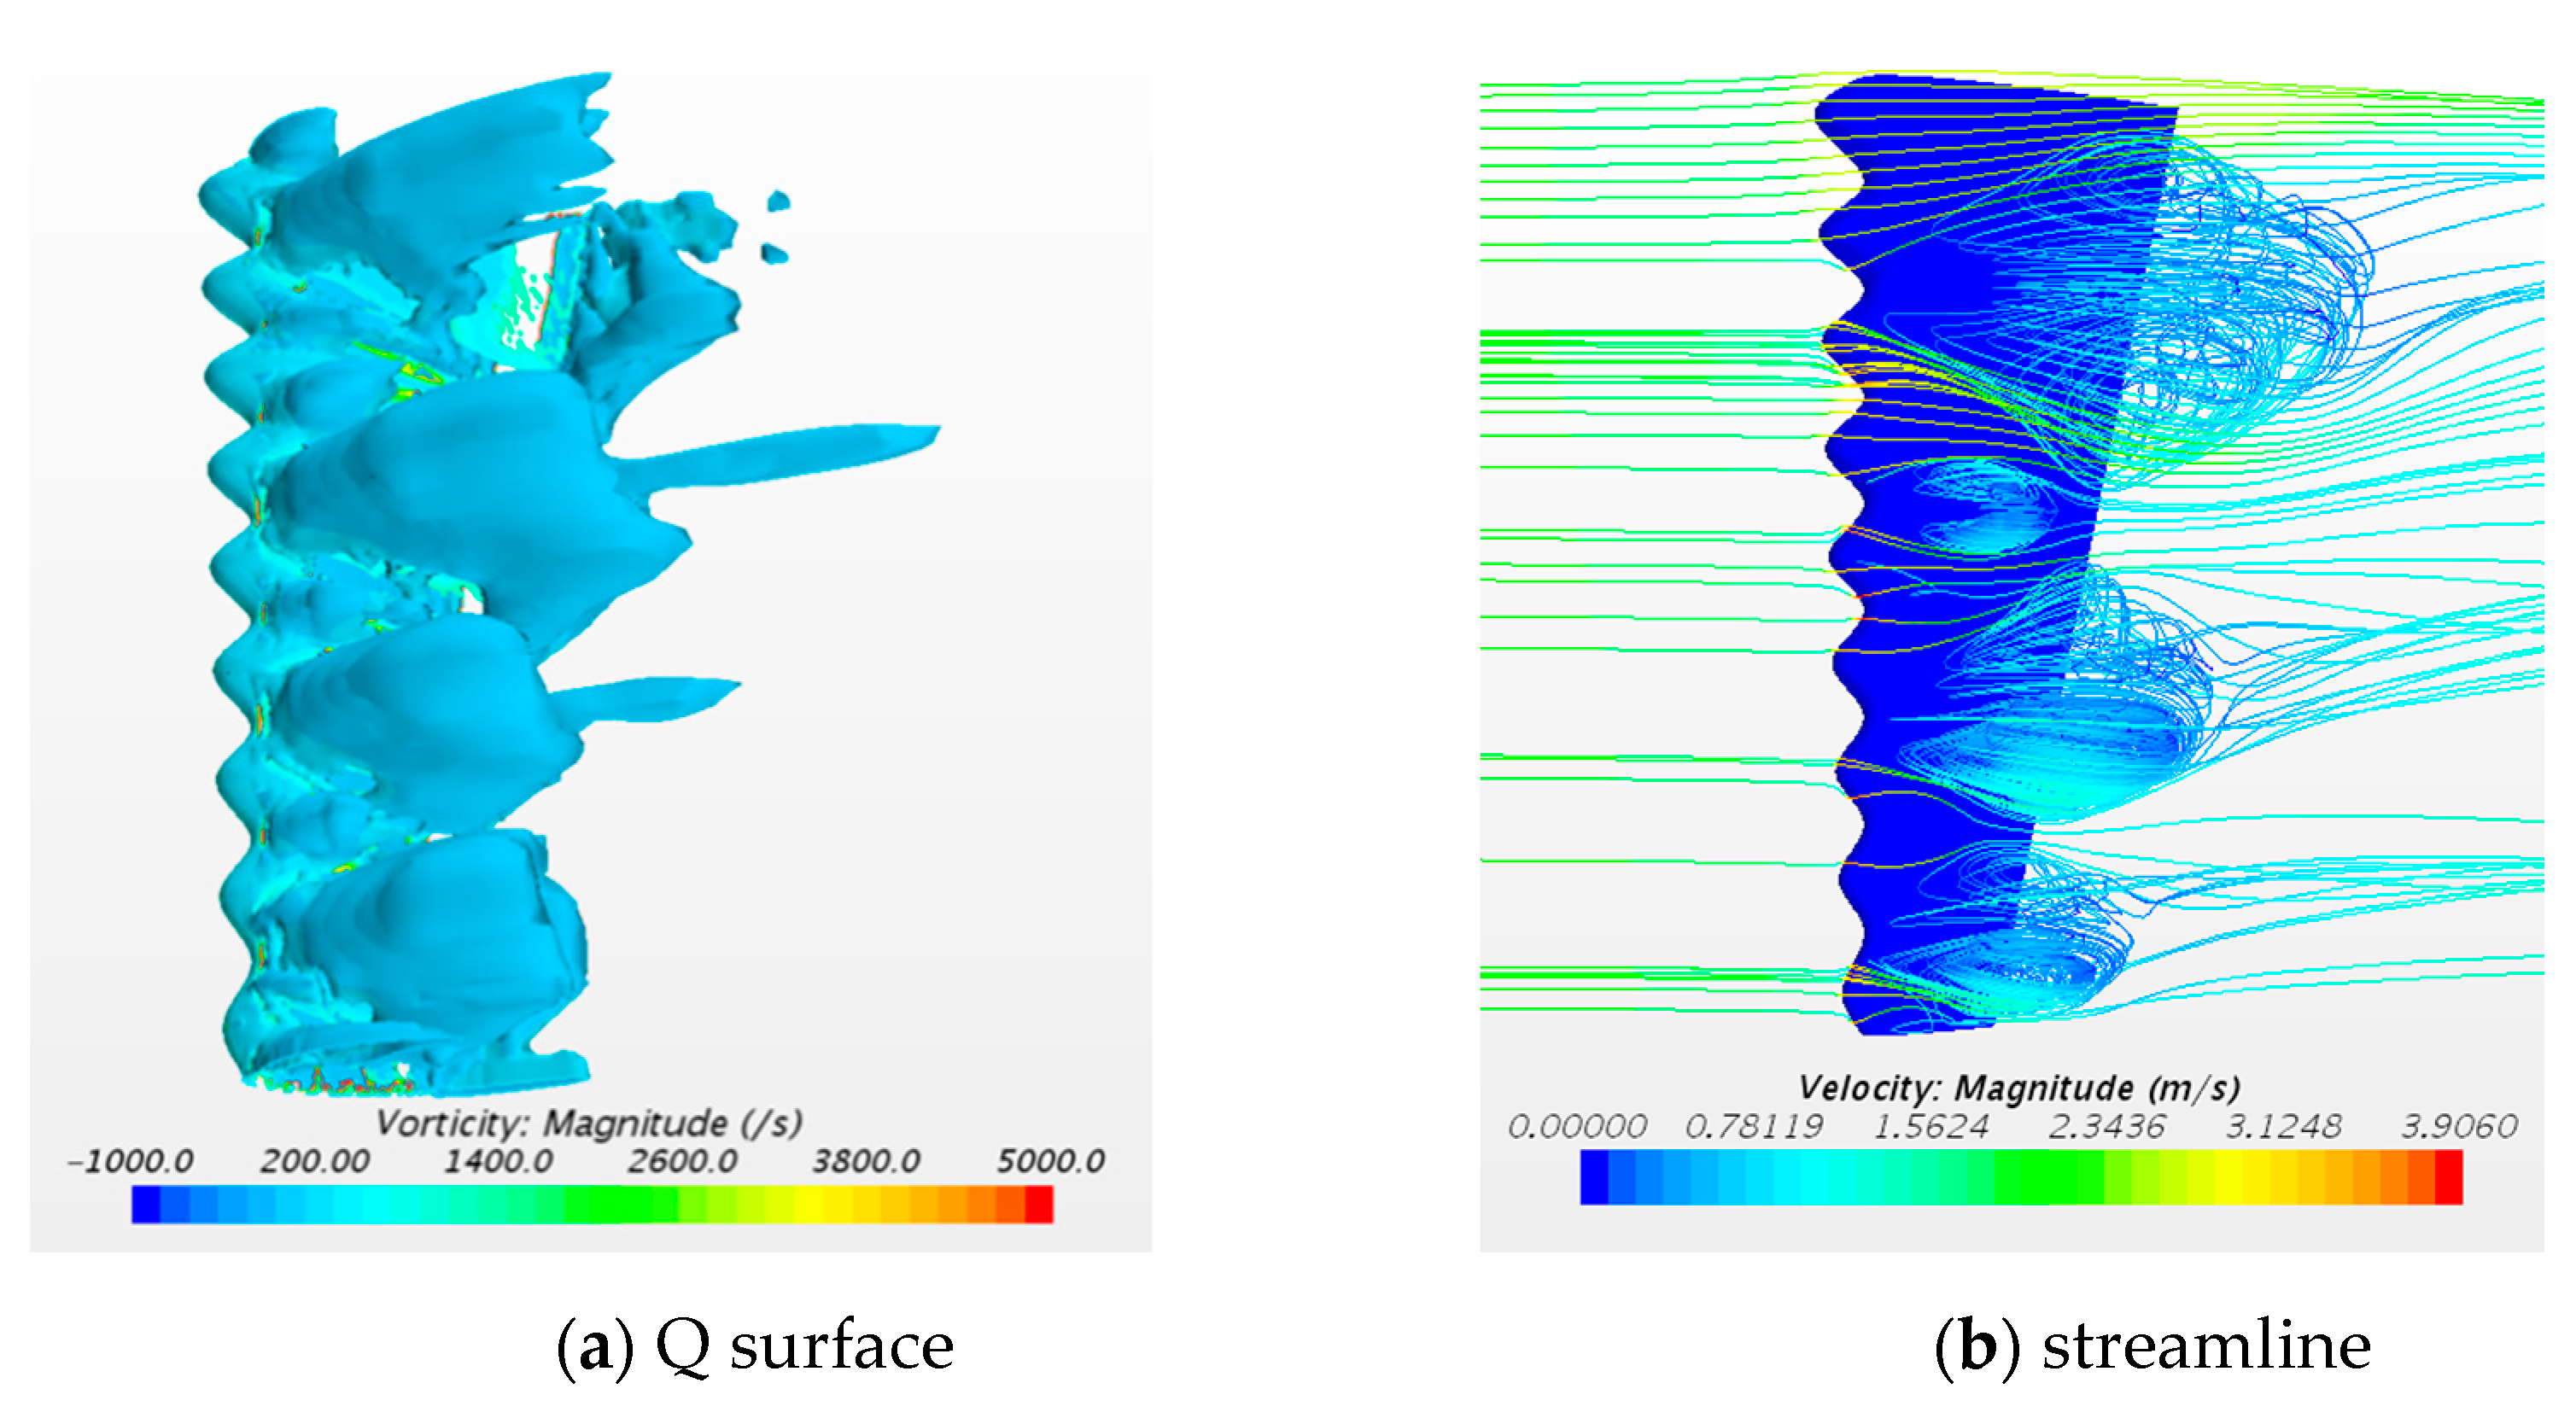
When the attack angle increases to 24°, a more significant flow separation (as implied by the chaotic streamlines in Figure 11b) and vortex shedding (Figure 11a) occur. These explain the stall phenomenon associated with the base blade. However, in the cases with tubercles, the leading edge diverts the flow from the crest to the trough, where the detachment of vortices is more likely to occur, compared with the smoothed surface of the base blade. Figure 12, Figure 13 and Figure 14 illustrate the iso-surface of the Q-criteria and the distribution of the streamline near the blades in the cases with H15N9, H15N6 and H15N3, respectively, and an attack angle of 16°. From these figures, one may observe significant vortices attached to the trough area of the tubercles near the trailing edge. It is therefore understandable that the base blade performs better than the blades with tubercles when the attack angle is small (e.g., 16°).
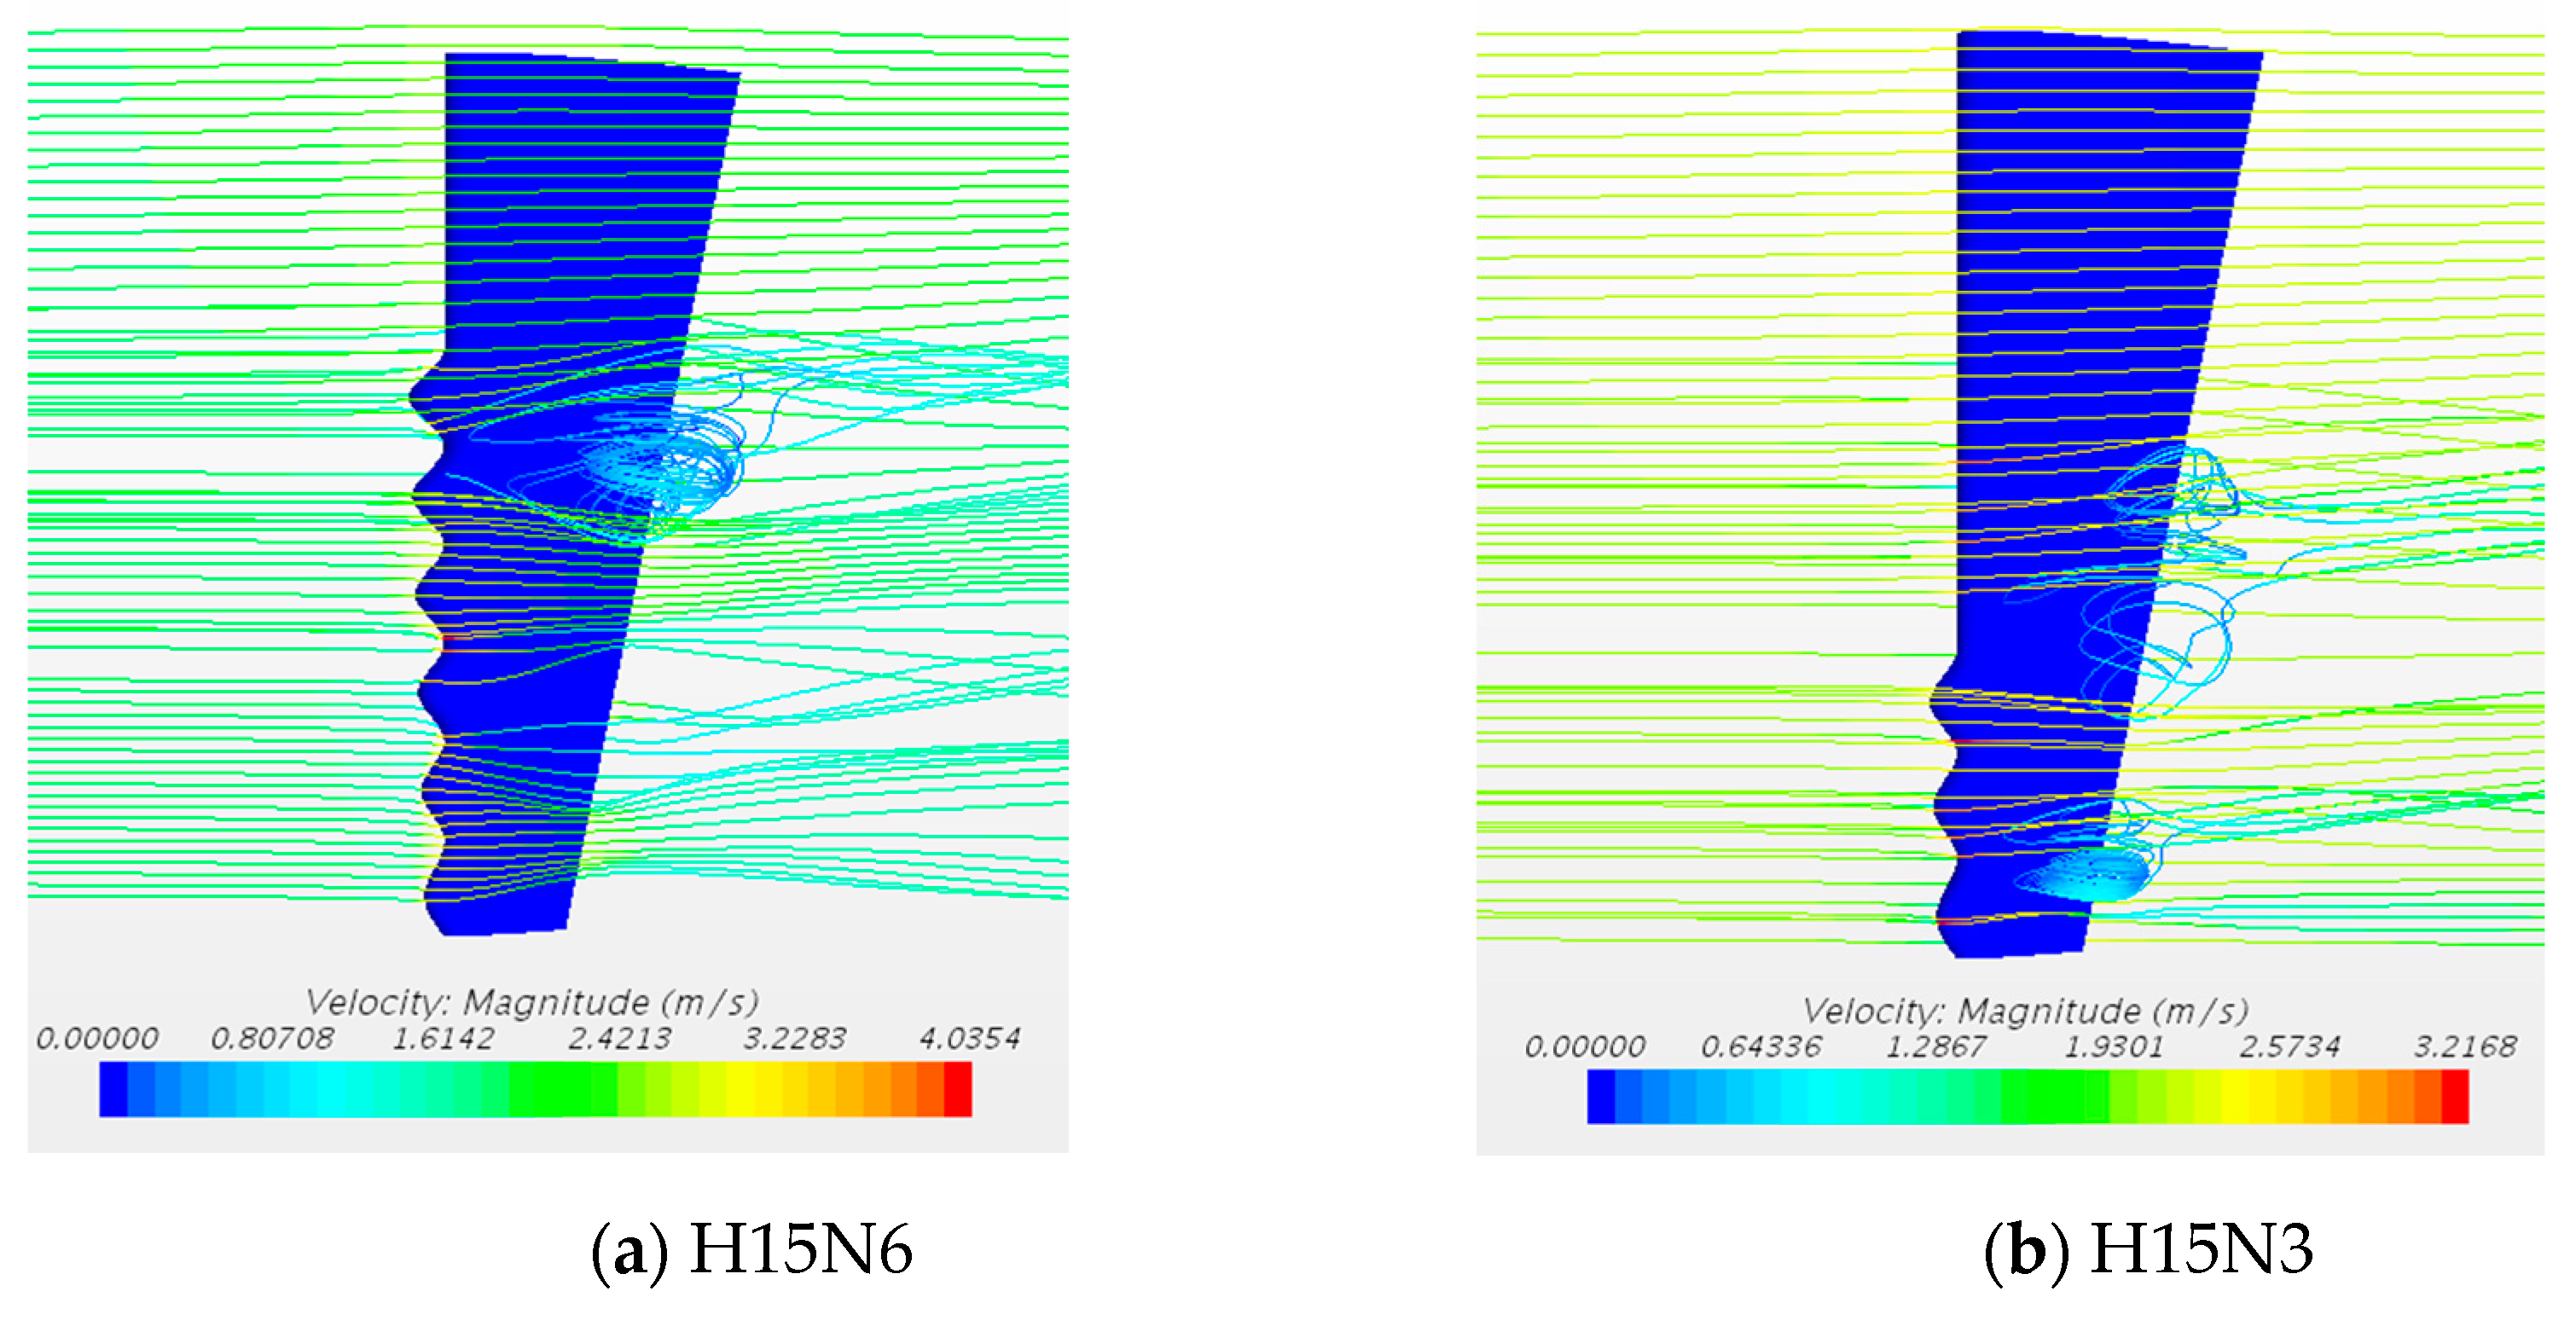
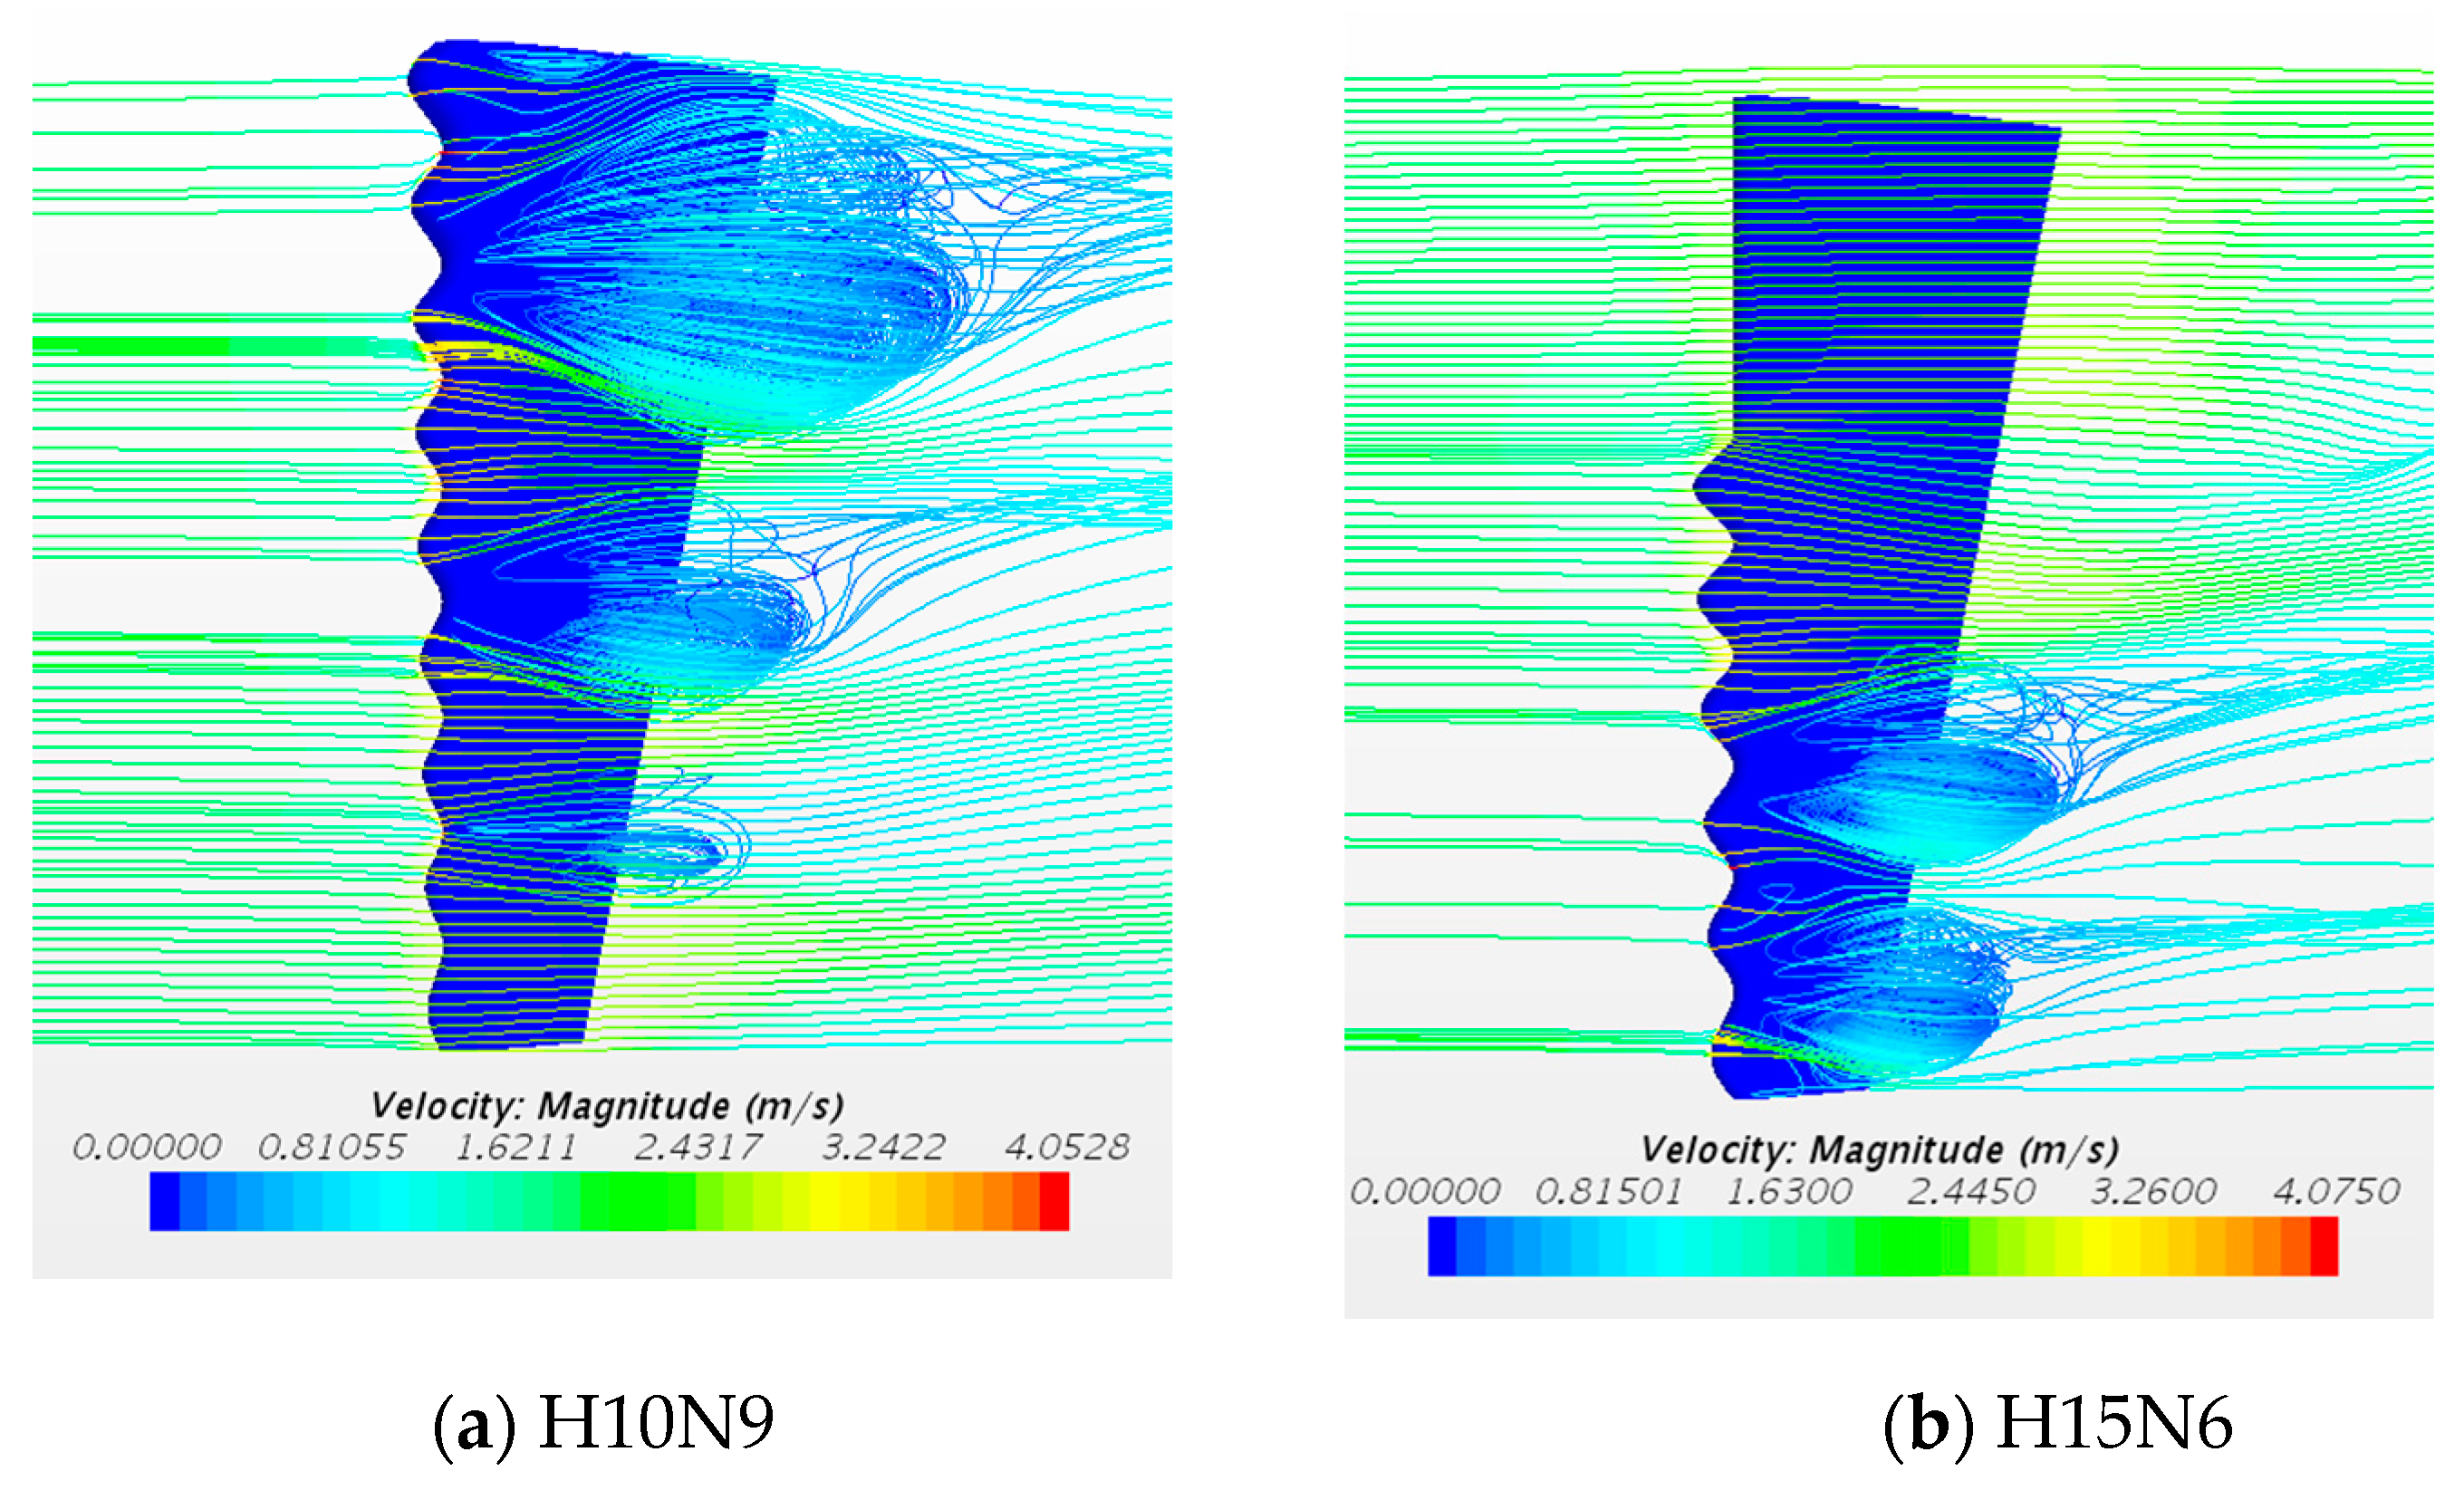
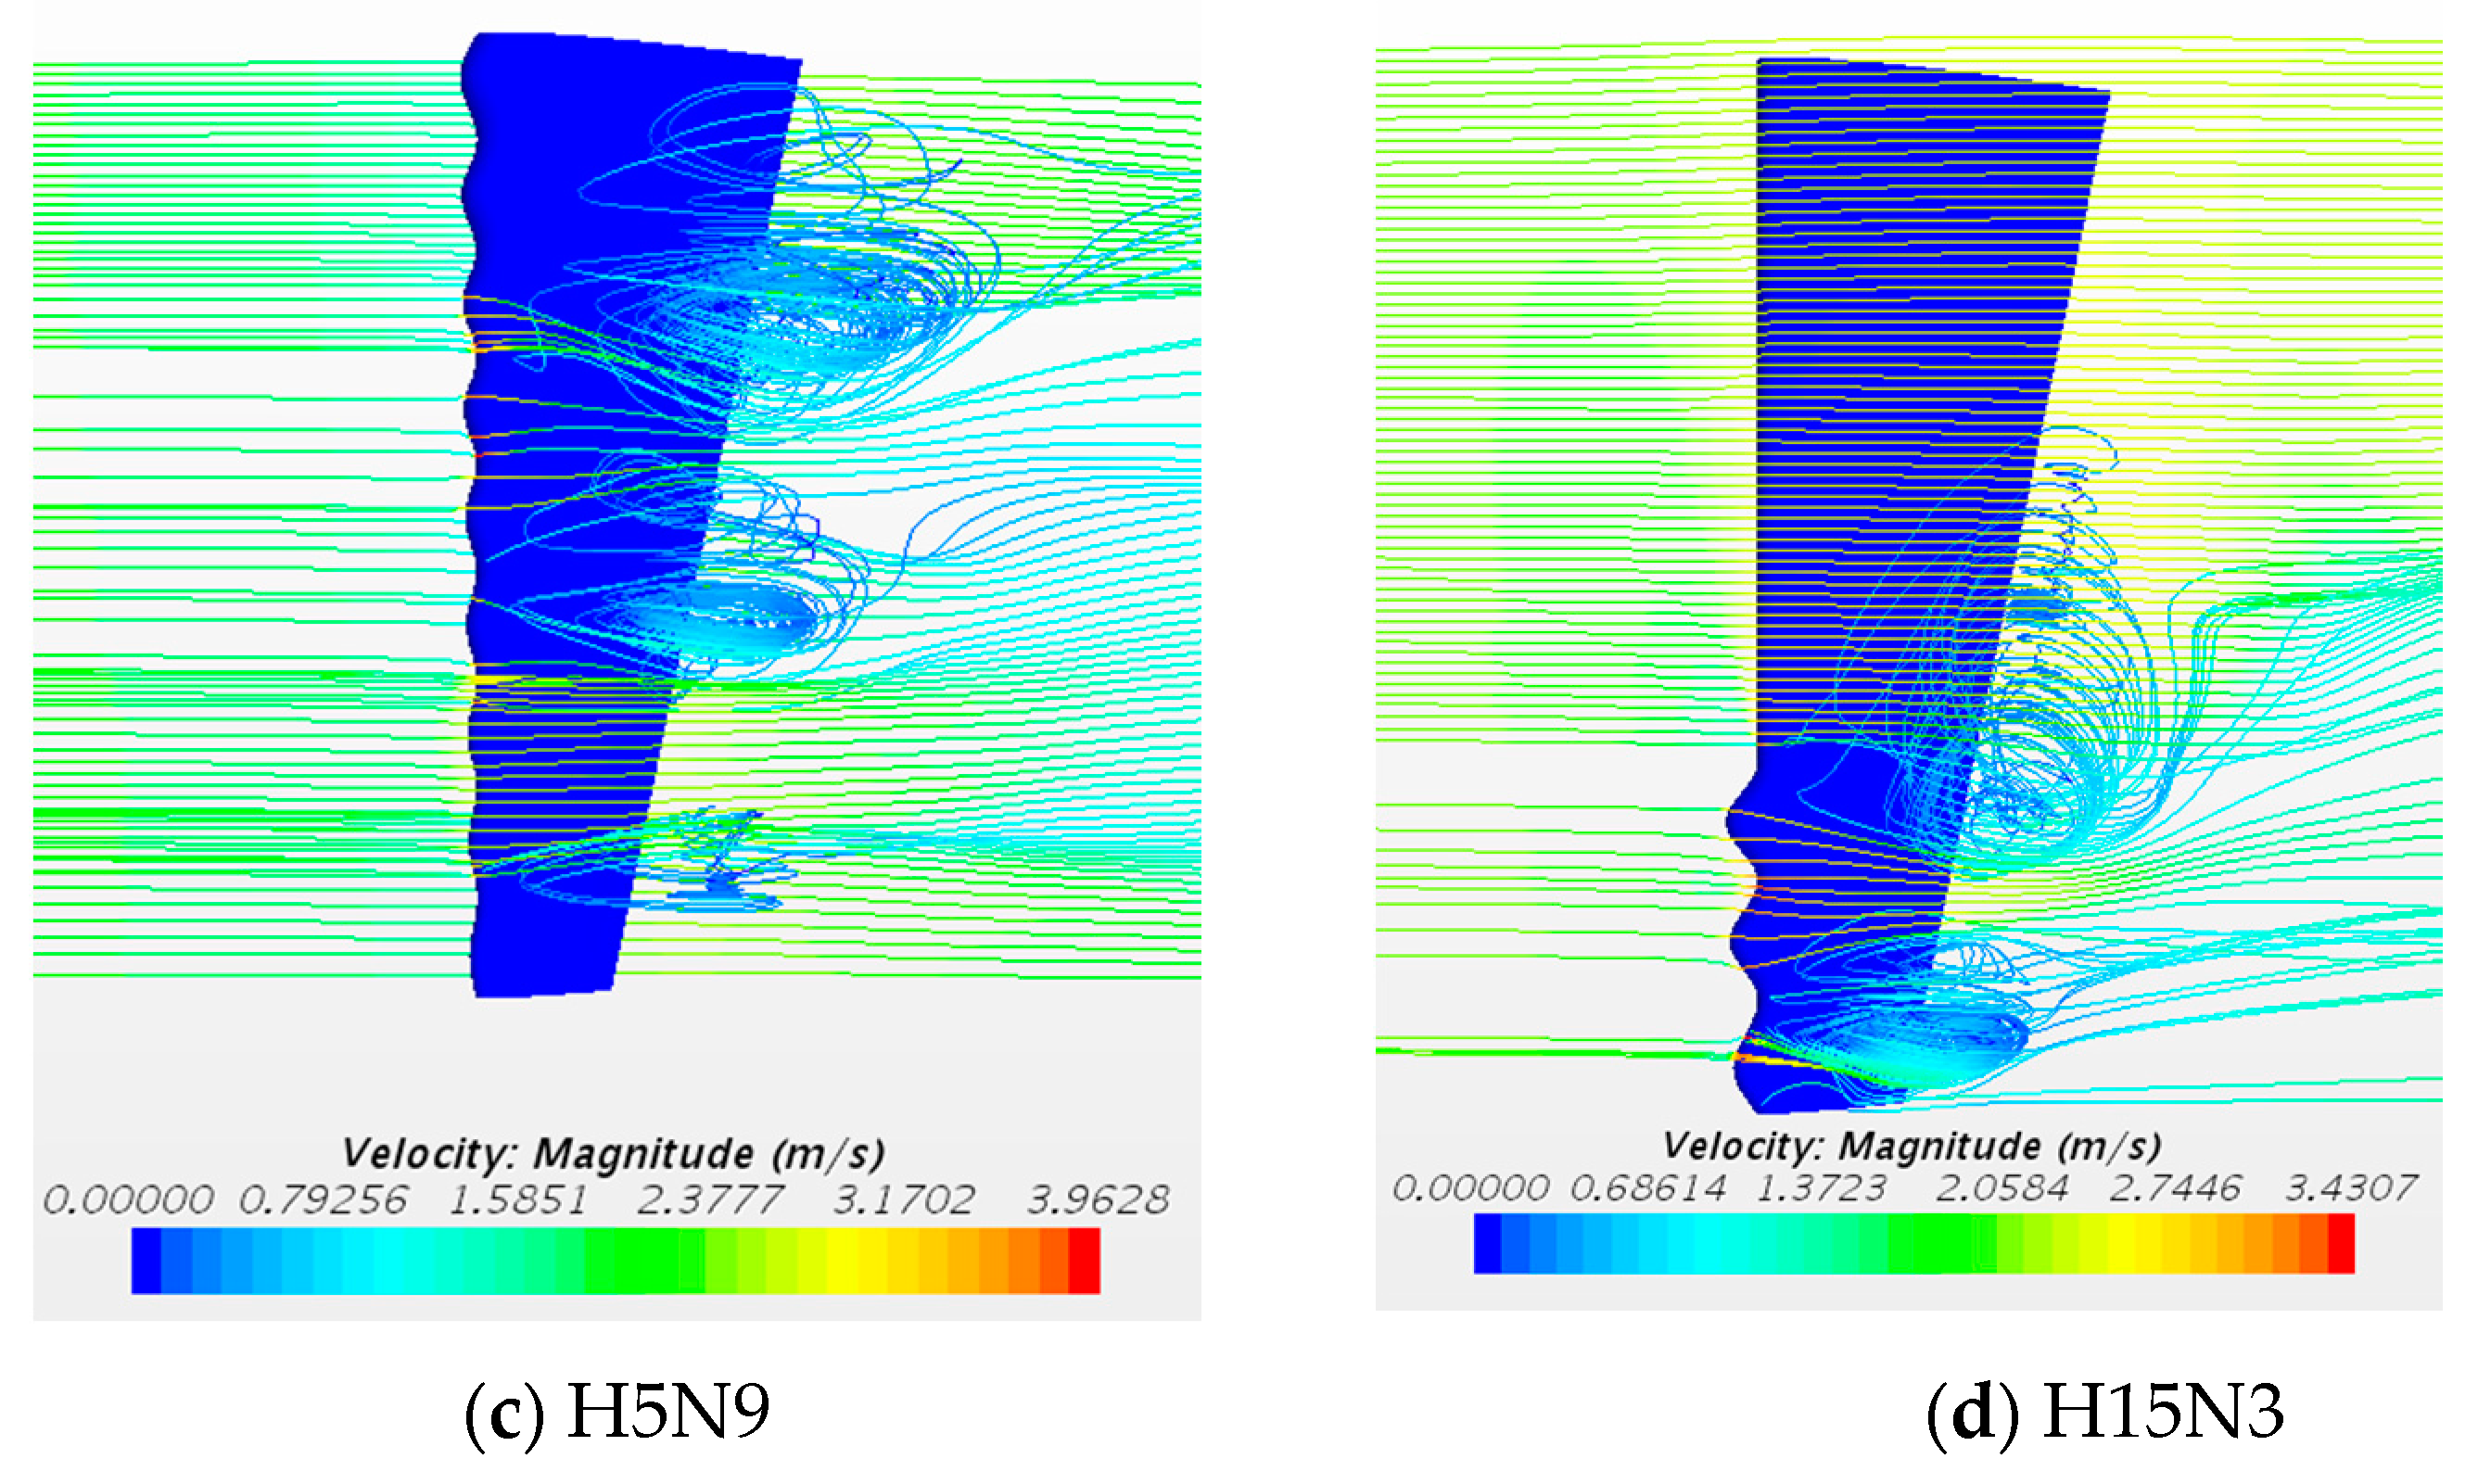
One may also find from these figures that the vortices near the leading edge of the blade with tubercles become more significant when the height of the tubercle increases. In addition to the height of the tubercle, different numbers of tubercles are also considered in the investigation. Figure 15 displays the streamline distributions near the blade in the cases with three and six tubercles, where the heights of the tubercles are 0.15 m (corresponding to H15N9 shown in Figure 12). As expected, the vortices become more significant as the number of tubercles increases. When the attack angle increases to 24°, those vortices become more significant, as illustrated in Figure 16 and Figure 17, from which, violent flow separations were observed. For the blades with tubercles, the detached vortices generated from two successive tubercle crests exhibit different directions. These vortices diverge toward the trough area and interact with others, yielding a suppression of the vorticity and thus the flow separation in the trough area. The suppression becomes more significant as the number of tubercles increases. These can explain a better hydrodynamic performance of the blade with tubercles (especially H15N9) than the base blade.
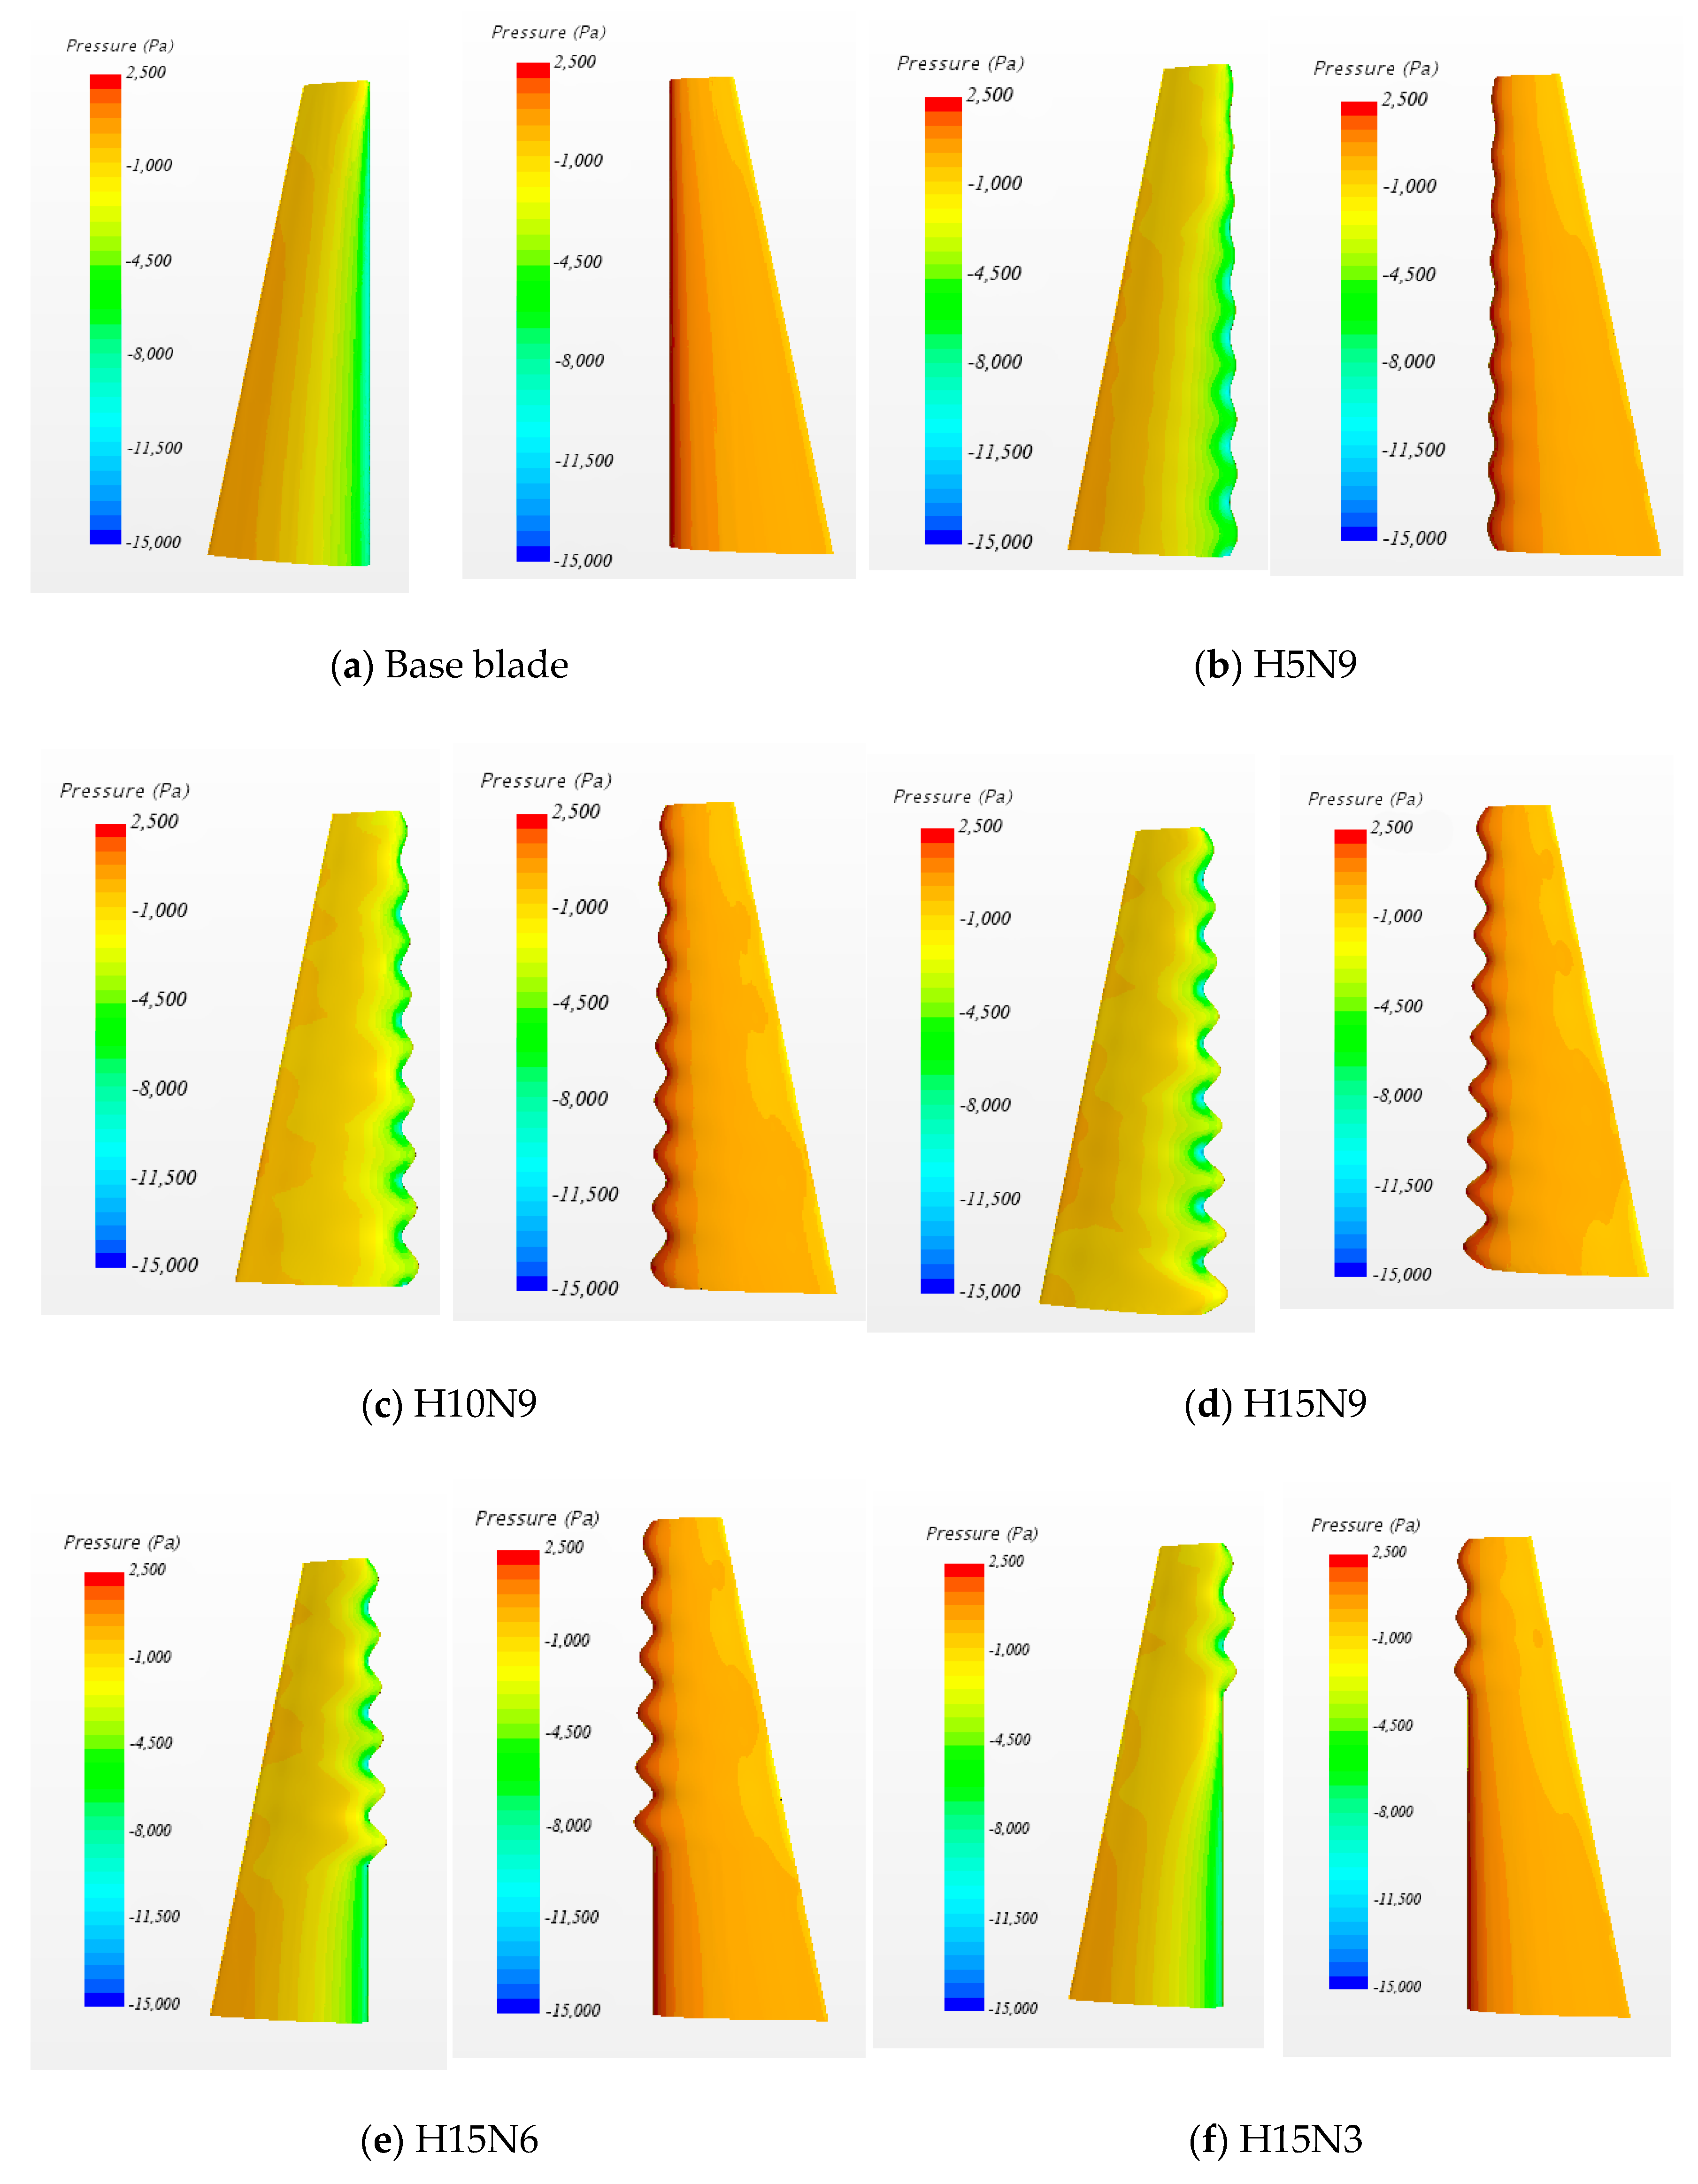
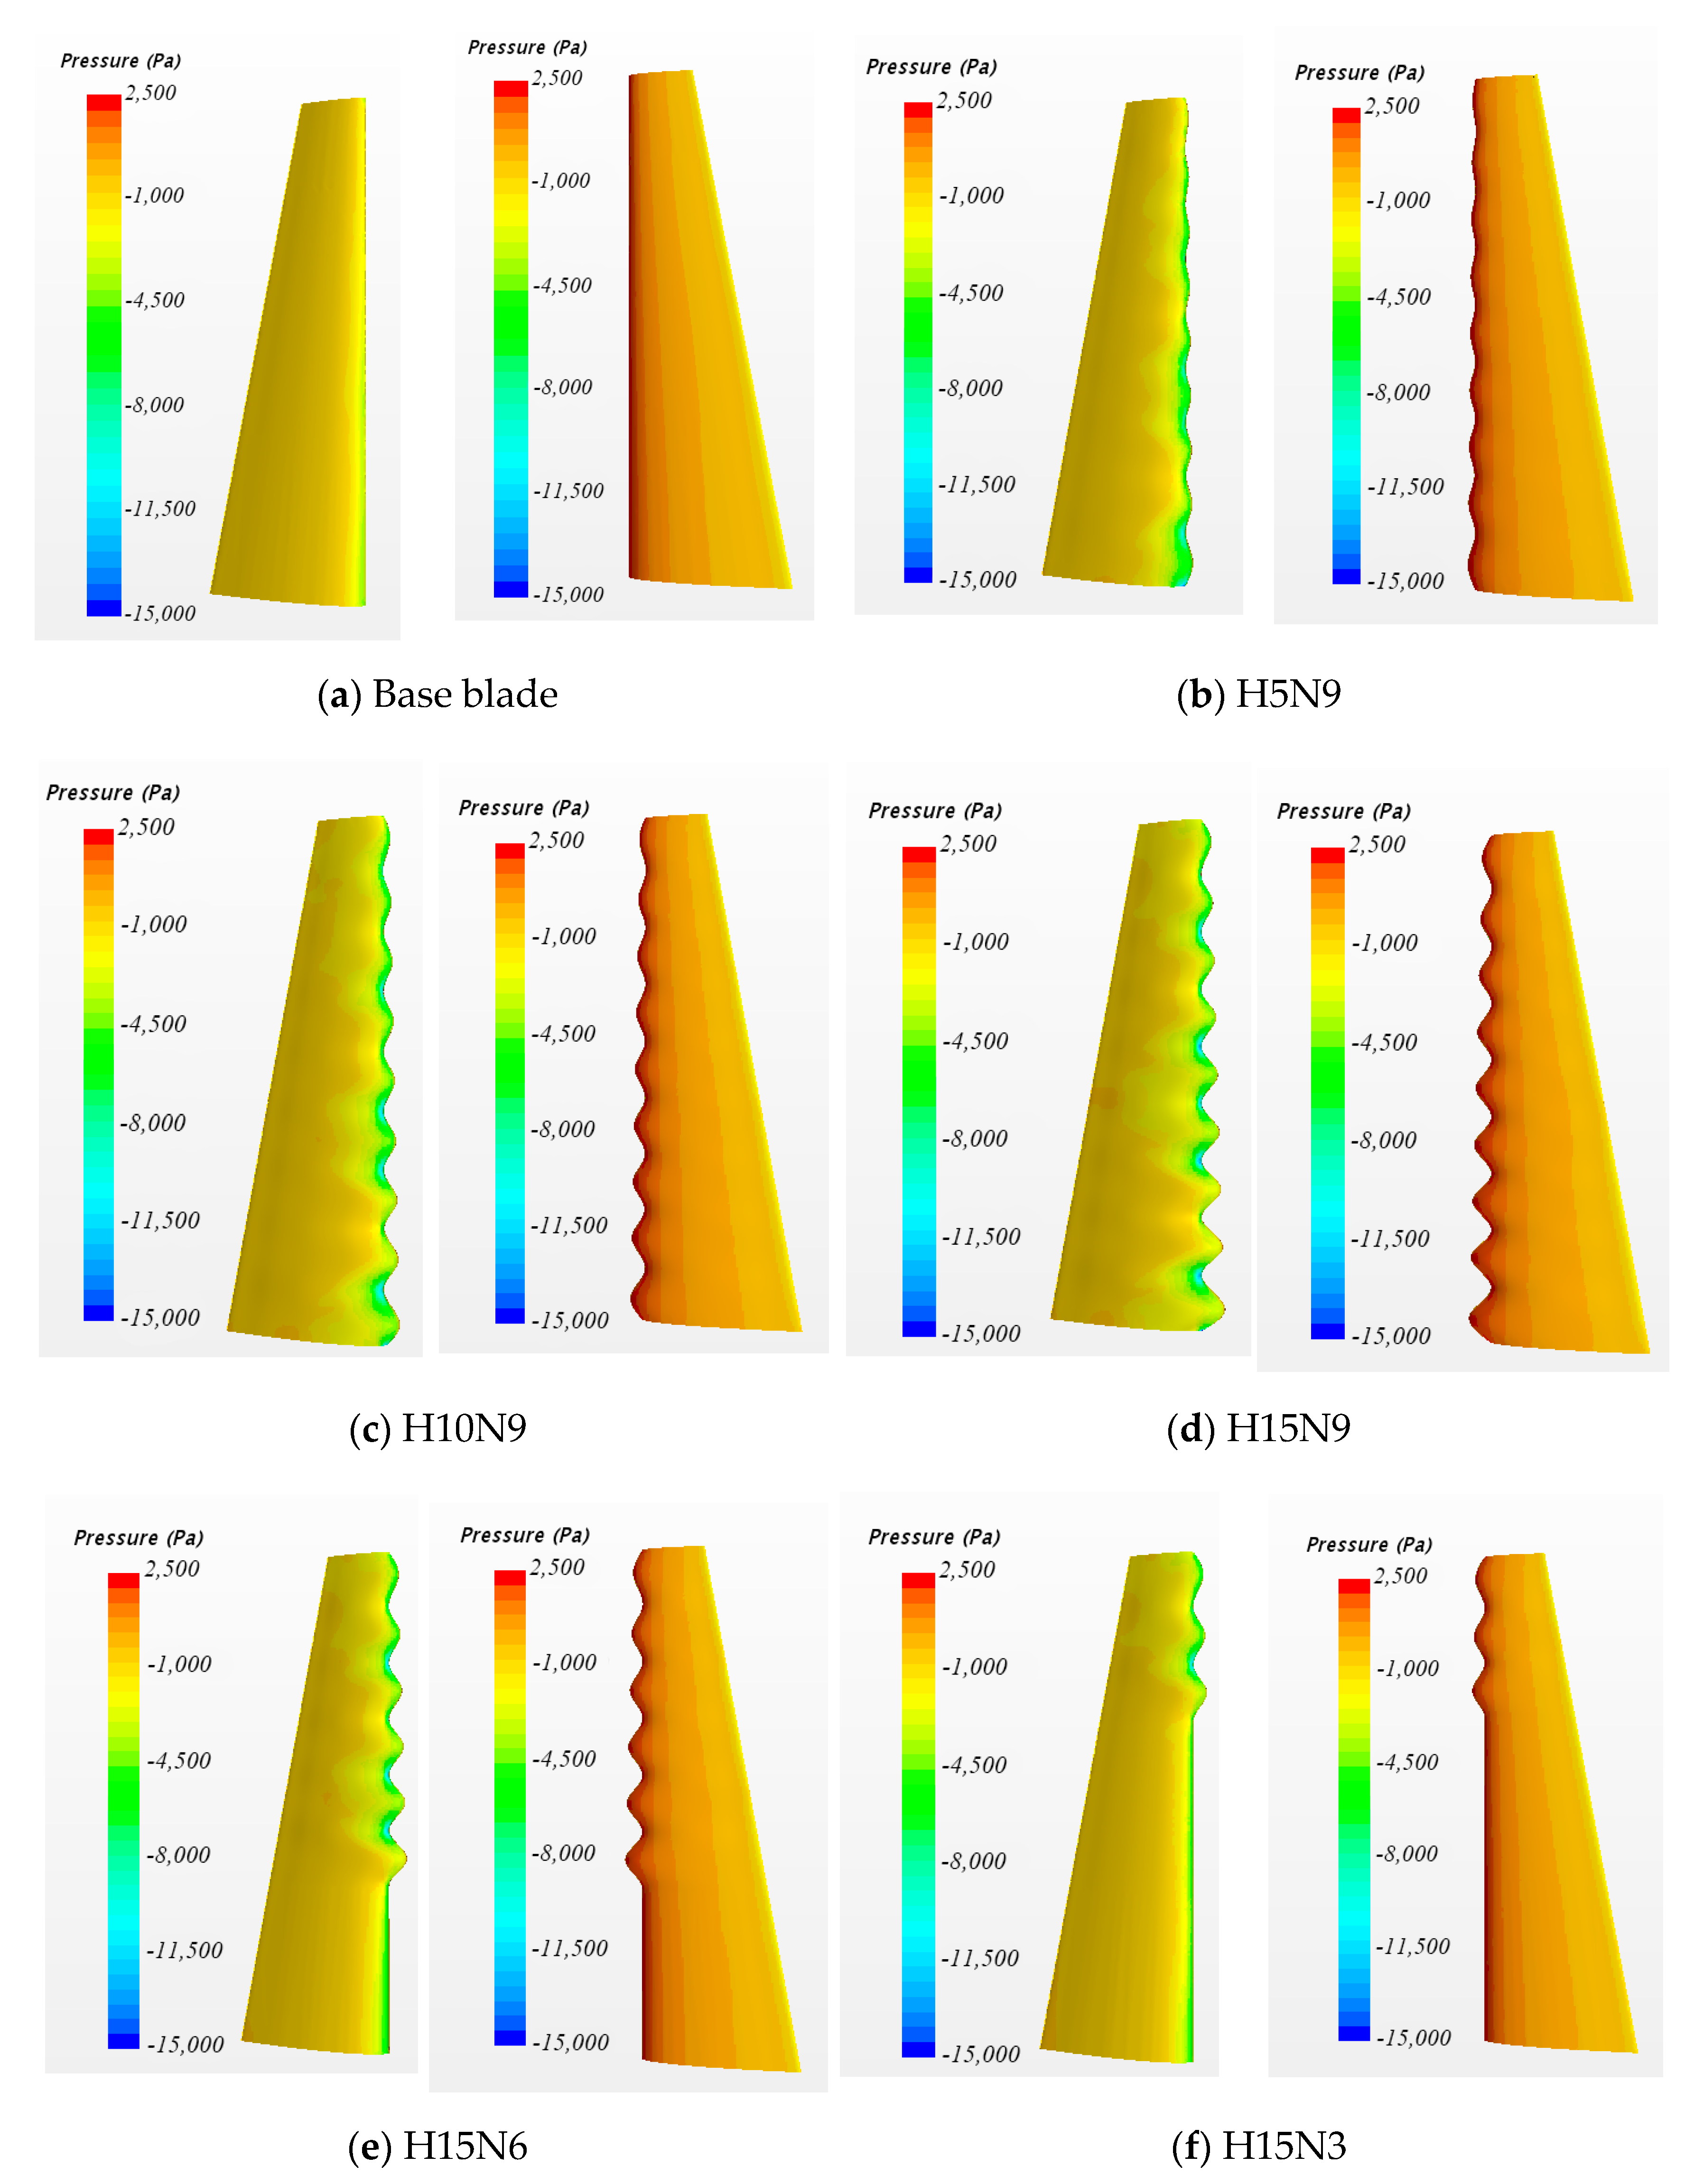
In addition to the vorticity and streamlines discussed above, the pressure distribution on the upper and lower surfaces along the chord at different attack angles are also carefully checked. The pressure used in the paper is the relative pressure, which is calculated with the atmospheric pressure being the reference point. Some results are plotted in Figure 18 and Figure 19. From Figure 18, it can be observed that the pressure difference between the upper and lower surface of the base blade is more significant than the other blade models in the cases with a smaller attack angle (16°). With an increase in the height of tubercles, the pressure on the suction surface of the convex peak decreases. Smaller numbers of tubercles results in a smaller low-pressure area, yielding a smaller lift. As the attack angle increases to 24° (Figure 19), the pressure distributions on the upper surface are significantly affected by the occurrence of the vortices and violent flow separations. Local high pressure is formed near the convex peak and concave valley. The larger the height of the tubercles, the lower the pressure; the more tubercles, and the greater the area of low pressure. Near the convex peak, in the larger area of the suction front edge, the pressure drops along the flow direction, indicating that the concave and convex front edge increases the ability of the airfoil to resist the adverse pressure gradient to a certain extent. Because of the convex and concave leading edge, the pressure gradient of the airfoil is increased to some extent. The greater the amplitude, the higher the nodular coverage ratio, and the stronger the ability. Thus, at a high angle of attack, the lift coefficient of the base blade is less than that of the blades with tubercles; a greater number of tubercles leads to a greater lift coefficient.
5. Conclusions
In this paper, the effectiveness of the leading-edge tubercles on hydrodynamic loading on a turbine blade is numerically investigated using the StarCCM+ with RANS k- SST turbulence model. The blade model is based on the NACA 0018 airfoil and a sinusoidal profile is used to define the tubercle geometry. The findings of this paper are as follows:
- (1)
- The application of leading-edge tubercles may not always cause the delayed stall. For the blades with tubercles, the lift coefficient drops slowly following the increase of attack angles beyond the stall point, although a certain amount of lift is lost before the stall point, compared with the base blade.
- (2)
- When subjected to high attack angles (i.e., >22°), the leading-edge tubercles not only bring a higher lift coefficient but also a better lift-to-drag ratio when compared with the base blade, implying a improvement in the hydrodynamic performance.
- (3)
- The small-scale flow characteristics, including the vortex structure and the flow separation, play an important role in the hydrodynamic performance of the blades with leading-edge tubercle.
- (4)
- Although this paper considers ideal conditions to conduct the numerical investigation, this is the first paper to introduce the tubercles into NACA 0018 airfoil. The results and observation can provide a good reference for investigating the hydrodynamic performance of the tidal turbine adopting the present blade.
Author Contributions
Conceptualization, S.C. and Y.L.; software, Y.L.; validation, Y.L. and C.H.; investigation, Z.H.; data curation, Z.H.; writing—original draft preparation, S.C. and Y.L.; writing—review and editing, S.Y.; visualization, Y.L.; project administration, S.C.; funding acquisition, S.C. All authors have read and agreed to the published version of the manuscript.
Funding
This research was funded by “National Natural Science Foundation of China, 51409130”.
Institutional Review Board Statement
Not applicable.
Informed Consent Statement
Not applicable.
Data Availability Statement
The data presented in this study are available on request from the corresponding author.
Conflicts of Interest
The authors declare no conflict of interest.
References
- Fish, F.E.; Battle, J.M. Hydrodynamic design of the humpback whale flipper. J. Morghol. 1995, 225, 51–60. [Google Scholar] [CrossRef] [PubMed]
- Miklosovic, D.S.; Howle, L.E.; Murray, M.M.; Fish, F.E. Leading-Edge Tubercles Delay Stall on Humpback Whale (Megaptera Novaeangliae) Flippers. Phys. Fluids 2004, 16, 39–42. [Google Scholar] [CrossRef] [Green Version]
- Fish, F.E.; Lauder, G.V. Passive and Active Flow Control by Swimming Fishes and Mammals. Annu. Rev. Fluid Mech. 2006, 38, 193–224. [Google Scholar] [CrossRef] [Green Version]
- Fish, F.E.; Weber, P.W.; Murray, M.M.; Howle, L.E. The Tubercles on Humpback Whales’ Flippers: Application of Bio-Inspired Technology. Integr. Comp. Biol. 2011, 51, 203–213. [Google Scholar] [CrossRef] [PubMed] [Green Version]
- Weber, P.W.; Howle, L.E.; Murray, M.M.; Miklosovic, D.S. Computational Evaluation of the Performance of Lifting Surfaces with Leading-Edge Protuberances. J. Aircr. 2011, 48, 591–600. [Google Scholar] [CrossRef]
- Yoon, H.S.; Hung, P.A.; Jung, J.H.; Kim, M.C. Effect of the wavy leading edge on hydrodynamic characteristics for flow around low aspect ratio wing. Comput. Fluids 2011, 49, 276–289. [Google Scholar] [CrossRef]
- Hansen, K.L.; Kelso, R.M.; Dally, B.B. Performance Variations of Leading-Edge Tubercles for Distinct Airfoil Profiles. AIAA J. 2011, 49, 185–194. [Google Scholar] [CrossRef]
- Rostamzadeh, N.; Hansen, K.L.; Kelso, R.M.; Dally, B.B. The Formation Mechanism and Impact of Streamwise Vortices on NACA 0021 Airfoil’s Performance with Undulating Leading Edge Modification. Phys. Fluids 2014, 26, 107101. [Google Scholar] [CrossRef]
- Chang, X.; Wang, X.N.; Cheng, X.R. Research on Hydrodynamic Performance of Three-Dimensional Airfoil with Tubercles on Leading-Edge. Appl. Mech. Mater. 2014, 575, 405–413. [Google Scholar] [CrossRef]
- Wei, Z.; New, T.H.; Cui, Y.D. An experimental study on flow separation control of hydrofoils with leading-edge tubercles at low Reynolds number. Ocean. Eng. 2015, 108, 336–349. [Google Scholar] [CrossRef]
- Shi, W.; Atlar, M.; Norman, R.; Aktas, B.; Turkmen, S. Numerical Optimization and Experimental Validation for a Tidal Turbine Blade with Leading-Edge Tubercles. Renew. Energy 2016, 96, 42–55. [Google Scholar] [CrossRef] [Green Version]
- Shi, W.; Rosli, R.; Atlar, M.; Norman, R.; Wang, D.; Yang, W. Hydrodynamic Performance of a tidal turbine with leading-edge tubercles. Ocean. Eng. 2016, 117, 246–253. [Google Scholar] [CrossRef] [Green Version]
- Kobak, C.M.; Hansen, H.O.L. Numerical Study of Wavy Blade Section for Wind Turbines. J. Phys. Conf. Ser. 2016, 753, 022039. [Google Scholar] [CrossRef]
- Abate, G. A Numerical Investigation into the Aerodynamic Effects of Tubercles in Wind Turbine Blades. Ph.D. Thesis, Georgia Institute of Technology, Atlanta, GA, USA, 2019. [Google Scholar]
- Butt, F.R.; Talha, T. Numerical Investigation of the Effect of Leading-Edge Tubercles on Propeller Performance. J. Aircr. 2019, 56, 1014–1028. [Google Scholar] [CrossRef]
- Tian, S.; Li, D.W.; Qi, W. Analysis on aerodynamic Performance of fin Blades of humpback whale under high attack Angle. J. Shenyang Aerosp. Univ. 2012, 35, 47–56. [Google Scholar]
- Nedic, J.; Vassilicos, J.C. Vortex shedding and aerodynamic performance of an airfoil with multi-scale trailing edge modifications. AIAA J. 2015, 53, 3240–3250. [Google Scholar] [CrossRef]
- Menter, F.R. Two-equation Eddy-viscosity Turbulence Models for Engineering Applications. AIAA J. 1994, 32, 1598–1605. [Google Scholar] [CrossRef] [Green Version]
- Guerri, O.; Sakout, A.; Bouhadef, K. Simulations of the Fluid Flow around a Rotating Vertical Axis Wind Turbine. Wind Eng. 2007, 31, 149–163. [Google Scholar] [CrossRef]
- Liu, Q. Research on the Hydrodynamics of Bionic Blade of Tidal Turbine. Master’s Thesis, Dalian University of Technology, Dalian, China, 2018. [Google Scholar]
Figure 1.
Sketch of the base blade.

Figure 2.
Sketch of (a) one leading-edge sinusoidal tubercle and (b) 3D blade with 9 tubercles (H = 0.1 , model H10N9).
Figure 2.
Sketch of (a) one leading-edge sinusoidal tubercle and (b) 3D blade with 9 tubercles (H = 0.1 , model H10N9).

Figure 3.
Illustrations of blade models with leading-edge tubercles.

Figure 4.
Computational domain and boundary conditions.

Figure 5.
Illustration of computational mesh for (a) blocks used for mesh refinement and (b) local mesh near the blade section.
Figure 5.
Illustration of computational mesh for (a) blocks used for mesh refinement and (b) local mesh near the blade section.

Figure 6.
Comparison of force coefficients between the present numerical results and the experimental data in [20] (NACA0018 air foil with chord length of 0.3022 m and span length of 0.462 m).
Figure 6.
Comparison of force coefficients between the present numerical results and the experimental data in [20] (NACA0018 air foil with chord length of 0.3022 m and span length of 0.462 m).

Figure 7.
Comparison of lift coefficients between the base blade and blades with tubercles.

Figure 8.
Comparison of Drag coefficients between the base blade and blades with tubercles.

Figure 9.
Comparison of lift-to-drag ratio between the base blade and blades with tubercles.

Figure 10.
Vortex structures and streamlines near the surface of the base blade at small attack angles (the iso-surfaces in (a) corresponds to Q = 150, the streamline with the attack angle 14° in (b) and the streamline with the attack angle 16° in (c)).
Figure 10.
Vortex structures and streamlines near the surface of the base blade at small attack angles (the iso-surfaces in (a) corresponds to Q = 150, the streamline with the attack angle 14° in (b) and the streamline with the attack angle 16° in (c)).

Figure 11.
Vortex structures and streamlines near the surface of the base blade when attack angle is 24° (the iso-surfaces in (a) corresponds to Q = 150 and velocity magnitude contour of streamline in (b)).
Figure 11.
Vortex structures and streamlines near the surface of the base blade when attack angle is 24° (the iso-surfaces in (a) corresponds to Q = 150 and velocity magnitude contour of streamline in (b)).

Figure 12.
Vortex structures and streamlines near the surface of H15N9 when attack angle is 16° (the iso-surfaces in (a) corresponds to Q = 150 and velocity magnitude contour of streamline in (b)).
Figure 12.
Vortex structures and streamlines near the surface of H15N9 when attack angle is 16° (the iso-surfaces in (a) corresponds to Q = 150 and velocity magnitude contour of streamline in (b)).

Figure 13.
Vortex structures and streamlines near the surface of H10N9 when attack angle is 16° (the iso-surfaces in (a) corresponds to Q = 150 and velocity magnitude contour of streamline in (b)).
Figure 13.
Vortex structures and streamlines near the surface of H10N9 when attack angle is 16° (the iso-surfaces in (a) corresponds to Q = 150 and velocity magnitude contour of streamline in (b)).

Figure 14.
Vortex structures and streamlines near the surface of H5N9 when attack angle is 16° (the iso-surfaces in (a) corresponds to Q = 150 and velocity magnitude contour of streamline in (b)).
Figure 14.
Vortex structures and streamlines near the surface of H5N9 when attack angle is 16° (the iso-surfaces in (a) corresponds to Q = 150 and velocity magnitude contour of streamline in (b)).

Figure 15.
Streamlines near the surface of (a) H15N6 and (b) H15N3 when attack angle is 16°.

Figure 16.
Vortex structures and streamlines near the surface of H15N9 when attack angle is 24° (the iso-surfaces in (a) corresponds to Q = 150 and velocity magnitude contour of streamline in (b)).
Figure 16.
Vortex structures and streamlines near the surface of H15N9 when attack angle is 24° (the iso-surfaces in (a) corresponds to Q = 150 and velocity magnitude contour of streamline in (b)).

Figure 17.
Streamlines near the surface of (a) H15N6, (b) H15N3, (c) H5N9 and (d) H15N3 when attack angle is 24°.
Figure 17.
Streamlines near the surface of (a) H15N6, (b) H15N3, (c) H5N9 and (d) H15N3 when attack angle is 24°.


Figure 18.
Relative pressure distributions on the upper (left) and lower (right) surfaces of (a) base blade, (b) H5N9, (c) H10N9, (d) H15N9, (e) H15N6 and (f) H15N3 when attack angle is 16°.
Figure 18.
Relative pressure distributions on the upper (left) and lower (right) surfaces of (a) base blade, (b) H5N9, (c) H10N9, (d) H15N9, (e) H15N6 and (f) H15N3 when attack angle is 16°.

Figure 19.
Pressure distributions on the upper (left) and lower (right) surfaces of (a) base blade, (b) H5N9, (c) H10N9, (d) H15N9, (e) H15N6 and (f) H15N3 when attack angle is 24°.
Figure 19.
Pressure distributions on the upper (left) and lower (right) surfaces of (a) base blade, (b) H5N9, (c) H10N9, (d) H15N9, (e) H15N6 and (f) H15N3 when attack angle is 24°.


Table 1.
Chord distribution of the base blade and bio-inspired blade H10N9.
| S (mm) | C0 (mm, Base) | C (mm, H10N9) | S (mm) | C0 (mm, Base) | C (mm, H10N9) |
|---|---|---|---|---|---|
| 0 | 225 | 225 | 35 | 217.5 | 239.25 |
| 70 | 210 | 210 | 105 | 202.5 | 222.75 |
| 140 | 195 | 195 | 175 | 187.5 | 206.25 |
| 210 | 180 | 180 | 245 | 172.5 | 189.75 |
| 280 | 165 | 165 | 315 | 157.5 | 173.25 |
| 350 | 150 | 150 | 385 | 142.5 | 156.75 |
| 420 | 135 | 135 | 455 | 127.5 | 140.25 |
| 490 | 120 | 120 | 525 | 112.5 | 123.75 |
| 560 | 105 | 105 | 595 | 97.5 | 107.25 |
| 630 | 90 | 90 |
Table 2.
Mesh independence study.
| Mesh | Base Size | No. of Cells | CL | Relative Error | CD | Relative Error |
|---|---|---|---|---|---|---|
| Exp. data [20] | 1.01 | 0.0245 | ||||
| M1 | 0.028 m | 2.14 M | 1.059 | 4.9% | 0.0266 | 8.6% |
| M2 | 0.02 m | 4.6 M | 1.053 | 4.3% | 0.0224 | 8.6% |
| M3 | 0.014 m | 5.24 M | 1.047 | 3.7% | 0.0225 | 8.2% |
Table 3.
Summaries of hydrodynamic parameters.
| Max. CL | Stall Point (°) | Max. Rate of Dropping beyond the Stall Point (%) | Average Lift Increments Attack Angles > 22° | |
|---|---|---|---|---|
| Base | 1.2 | 18 | 45.7 | |
| H5N3 | 1.05 | 16 | 14.3 | 11.5 |
| H10N3 | 1.07 | 18 | 27.7 | 9.2 |
| H15N3 | 1.05 | 16 | 23 | 22.2 |
| H5N6 | 0.97 | 18 | 21.9 | 16.7 |
| H10N6 | 0.99 | 16 | 22.9 | 20.4 |
| H15N6 | 0.99 | 18 | 24.4 | 27.7 |
| H5N9 | 1.03 | 16 | 12.2 | 28.2 |
| H10N9 | 0.95 | 14 | 16.3 | 27.6 |
| N15N9 | 0.98 | 14 | 11.8 | 41.5 |
Publisher’s Note: MDPI stays neutral with regard to jurisdictional claims in published maps and institutional affiliations. |
© 2021 by the authors. Licensee MDPI, Basel, Switzerland. This article is an open access article distributed under the terms and conditions of the Creative Commons Attribution (CC BY) license (https://creativecommons.org/licenses/by/4.0/).
Share and Cite
MDPI and ACS Style
Chen, S.; Liu, Y.; Han, C.; Yan, S.; Hong, Z. Numerical Investigation of Turbine Blades with Leading-Edge Tubercles in Uniform Current. Water 2021, 13, 2205. https://doi.org/10.3390/w13162205
AMA Style
Chen S, Liu Y, Han C, Yan S, Hong Z. Numerical Investigation of Turbine Blades with Leading-Edge Tubercles in Uniform Current. Water. 2021; 13(16):2205. https://doi.org/10.3390/w13162205
Chicago/Turabian StyleChen, Shuling, Yan Liu, Changzhi Han, Shiqiang Yan, and Zhichao Hong. 2021. "Numerical Investigation of Turbine Blades with Leading-Edge Tubercles in Uniform Current" Water 13, no. 16: 2205. https://doi.org/10.3390/w13162205
Note that from the first issue of 2016, this journal uses article numbers instead of page numbers. See further details here.