
Glacial Change and Its Hydrological Response in Three Inland River Basins in the Qilian Mountains, Western China


1
Qilian Alpine Ecology & Hydrology Research Station, Northwest Institute of Eco-Environment and Resources, Chinese Academy of Sciences, Lanzhou 730000, China
2
University of Chinese Academy of Sciences, Beijing 100049, China
3
College of Urban and Environmental Sciences, Northwest University, Xi’an 710000, China
*
Author to whom correspondence should be addressed.
Water 2021, 13(16), 2213; https://doi.org/10.3390/w13162213
Submission received: 21 July 2021
/
Revised: 9 August 2021
/
Accepted: 10 August 2021
/
Published: 14 August 2021
(This article belongs to the Section Hydrology)
Abstract
:Glacial changes have great effects on regional water security because they are an important component of glacierized basin runoff. However, these impacts have not yet been integrated and evaluated in the arid/semiarid inland river basins of western China. Based on the degree-day glacier model, glacier changes and their hydrologic effects were studied in 12 subbasins in the Shiyang River basin (SYRB), Heihe River basin (HHRB) and Shule River basin (SLRB). The results showed that the glacier area of each subbasin decreased by 16.7–61.7% from 1965 to 2020. By the end of this century, the glacier areas in the three basins will be reduced by 64.4%, 72.0% and 83.4% under the three climate scenarios, and subbasin glaciers will disappear completely after the 2070s even under RCP2.6. Glacial runoff in all subbasins showed a decreasing–increasing–decreasing trend, with peak runoff experienced in 11 subbasins during 1965~2020. The contribution of glacial meltwater to total runoff in the basin ranged from 1.3% to 46.8% in the past, and it will decrease in the future due to increasing precipitation and decreasing glacial meltwater. However, the scale differences in glacier runoff are significant when aggregated over the region/basin/subbasin. This suggests that the results of large-scale generalization may be misleading for subbasin glacier water resource evaluations. Therefore, the hydrological effects of glaciers should be studied more in subbasins to provide an accurate reference for practical water resource management.
1. Introduction
Glacial shrinkage under global warming is releasing large amounts of freshwater resources from global glaciers, which has significant impacts on the regional and global hydrological cycles [1,2,3,4,5]. On a global scale, glacier mass loss contributed 27 ± 22 mm to the global sea level rise from 1961 to 2016 [6], and this flow of freshwater potentially affected the current ocean system [7,8]. On regional and local scales, glaciers are significant contributors to seasonal river flows, serving as frozen reservoirs of water that supplement runoff during warm and dry periods of low river flows [3,4,9,10,11,12]. In High Mountain Asia, glacial meltwater is critical to the water security of 800 million downstream residents [13,14,15]. In other regions where glacial runoff plays a key role in regional water source supplements, such as the Pan-arctic [16,17], Gulf of Alaska [9,18], and around the Alps [10] and Andes [19], ongoing glacier changes also raise concerns about the sustainability of water supplies and the resulting impacts on water management and climate adaptation [3,20,21,22].
Glacial runoff in almost all major basins worldwide was increasing until the 21st century due to a continuous increase in the negative mass balance of glaciers as a result of warming [1,3,21,23]. At the same time, the glacier area is undergoing accelerated retreat [24]. In theory, the meltwater of a single glacier would increase at the start of ablation and then decrease [4]. However, the glacier runoff trend in different catchments varies and depends on the glaciated proportion, glacier size and climatic characteristics of the catchments [10,21]. Bliss and others assessed the global-scale response of glacier runoff to climate change in 18 glacierized regions, and the results indicated that most regions showed decreasing runoff trends, only three regions showed steady increases and two regions showed increases followed by decreases in the 21st century [21]. Huss and Hock modeled that glacier runoff will reach the “peak point” during 2017–2100 in more than half of the 56 investigated large glacierized basins in the world, and in the remaining basins, the maximum glacier runoff was reached before 2017 [3]. In Southeast Asia, the peak water was already experienced before 2000, while in other basins in High Mountain Asia, the peak water level will arrive during 2020–2100 [23]. A large number of studies in small basins have also demonstrated the variability of glacial runoff trends and the timing of their “peak point” [25,26]; however, systematic studies of the differences in glacial meltwater trends between these large basins and subbasins are still lacking.
Water resources management also involves understanding the proportion of glacier runoff to total basin runoff, which determines the magnitude of the effects of glacier change on regional water resources. In Schaner and others’ summary of the results of existing studies, the mean proportion of glacial meltwater to total runoff ranged from 0.4% to 82.8% in some basins in high Asian mountains and the Americas [11]. Similar studies showed that the mean proportion ranged from 0.2% to 40.3% in four basins in northern Europe [10], from 14% to 85% around the Gulf of Alaska [9] and from 3.5% to 67.5% around Tienshan [27]. The contribution of glacier runoff to basin runoff also varies throughout the year and is dominated by interannual changes in precipitation and temperature [28]. In some basins in West Asia and South America, the contribution of glacier runoff will be reduced by more than 25% [3] by the end of this century. For basins where glacier runoff has already passed its peak, the proportion decline is more accelerated [29]. However, the contribution of glacial runoff will be negligible if the glacier does not reach a new equilibrium but disappears completely in a lightly glacierized basin.
Studies have investigated glacier area magnitude and ice cover as the main factors for the potential impact of glacial runoff on regional water resources. With high glacier cover and a high proportion of large glaciers, glacier runoff is greater, and peak water will occur later. There were also differences in the altitudinal distribution of glacial contributions. In central Asia, the “critical zone” controlled 82% of the variability in the change in total runoff at the catchment scale [30]. Precipitation is another factor influencing the contribution of glacial meltwater [31]. In watersheds where precipitation increases more than glacial meltwater, the contribution of glacial meltwater may be reduced even though the total amount of meltwater increases due to the increase in total runoff in the watershed [22]. However, studies are typically focused on individual highly glacierized regions or large watersheds [3,11,28,31], and it remains unclear how representative these results are in lightly glacierized watersheds or subbasins, especially for arid regions, where even though glacier runoff is relatively small, it is still meaningful for the sustainability of water supplies.
In this study, we integrated a degree-day model to explore past and future trends in glacier runoff in three arid inland basins in the Qilian Mountains, Western China. In each basin, there were four subbasins with variable characteristics in glacier distribution and hydrological properties. This study has two objectives. First, we investigate the characteristics of glacier runoff in 12 subbasins, including trends, peak points, contributions (proportion of glacial meltwater to total watershed runoff) and the glaciers and climate change that affected them. Second, we analyze the scale differences in the results when the study subjects were subbasins/basins/regions and changes in the role of glacial runoff. The results of this study provide the perspective that large-scale glacial runoff studies may provide misleading results for water resource management in small watersheds, and therefore, the details of glacier-associated hydrological impacts should be more considered in the smallest hydrological unit.
2. Methods and Data
2.1. Study Area
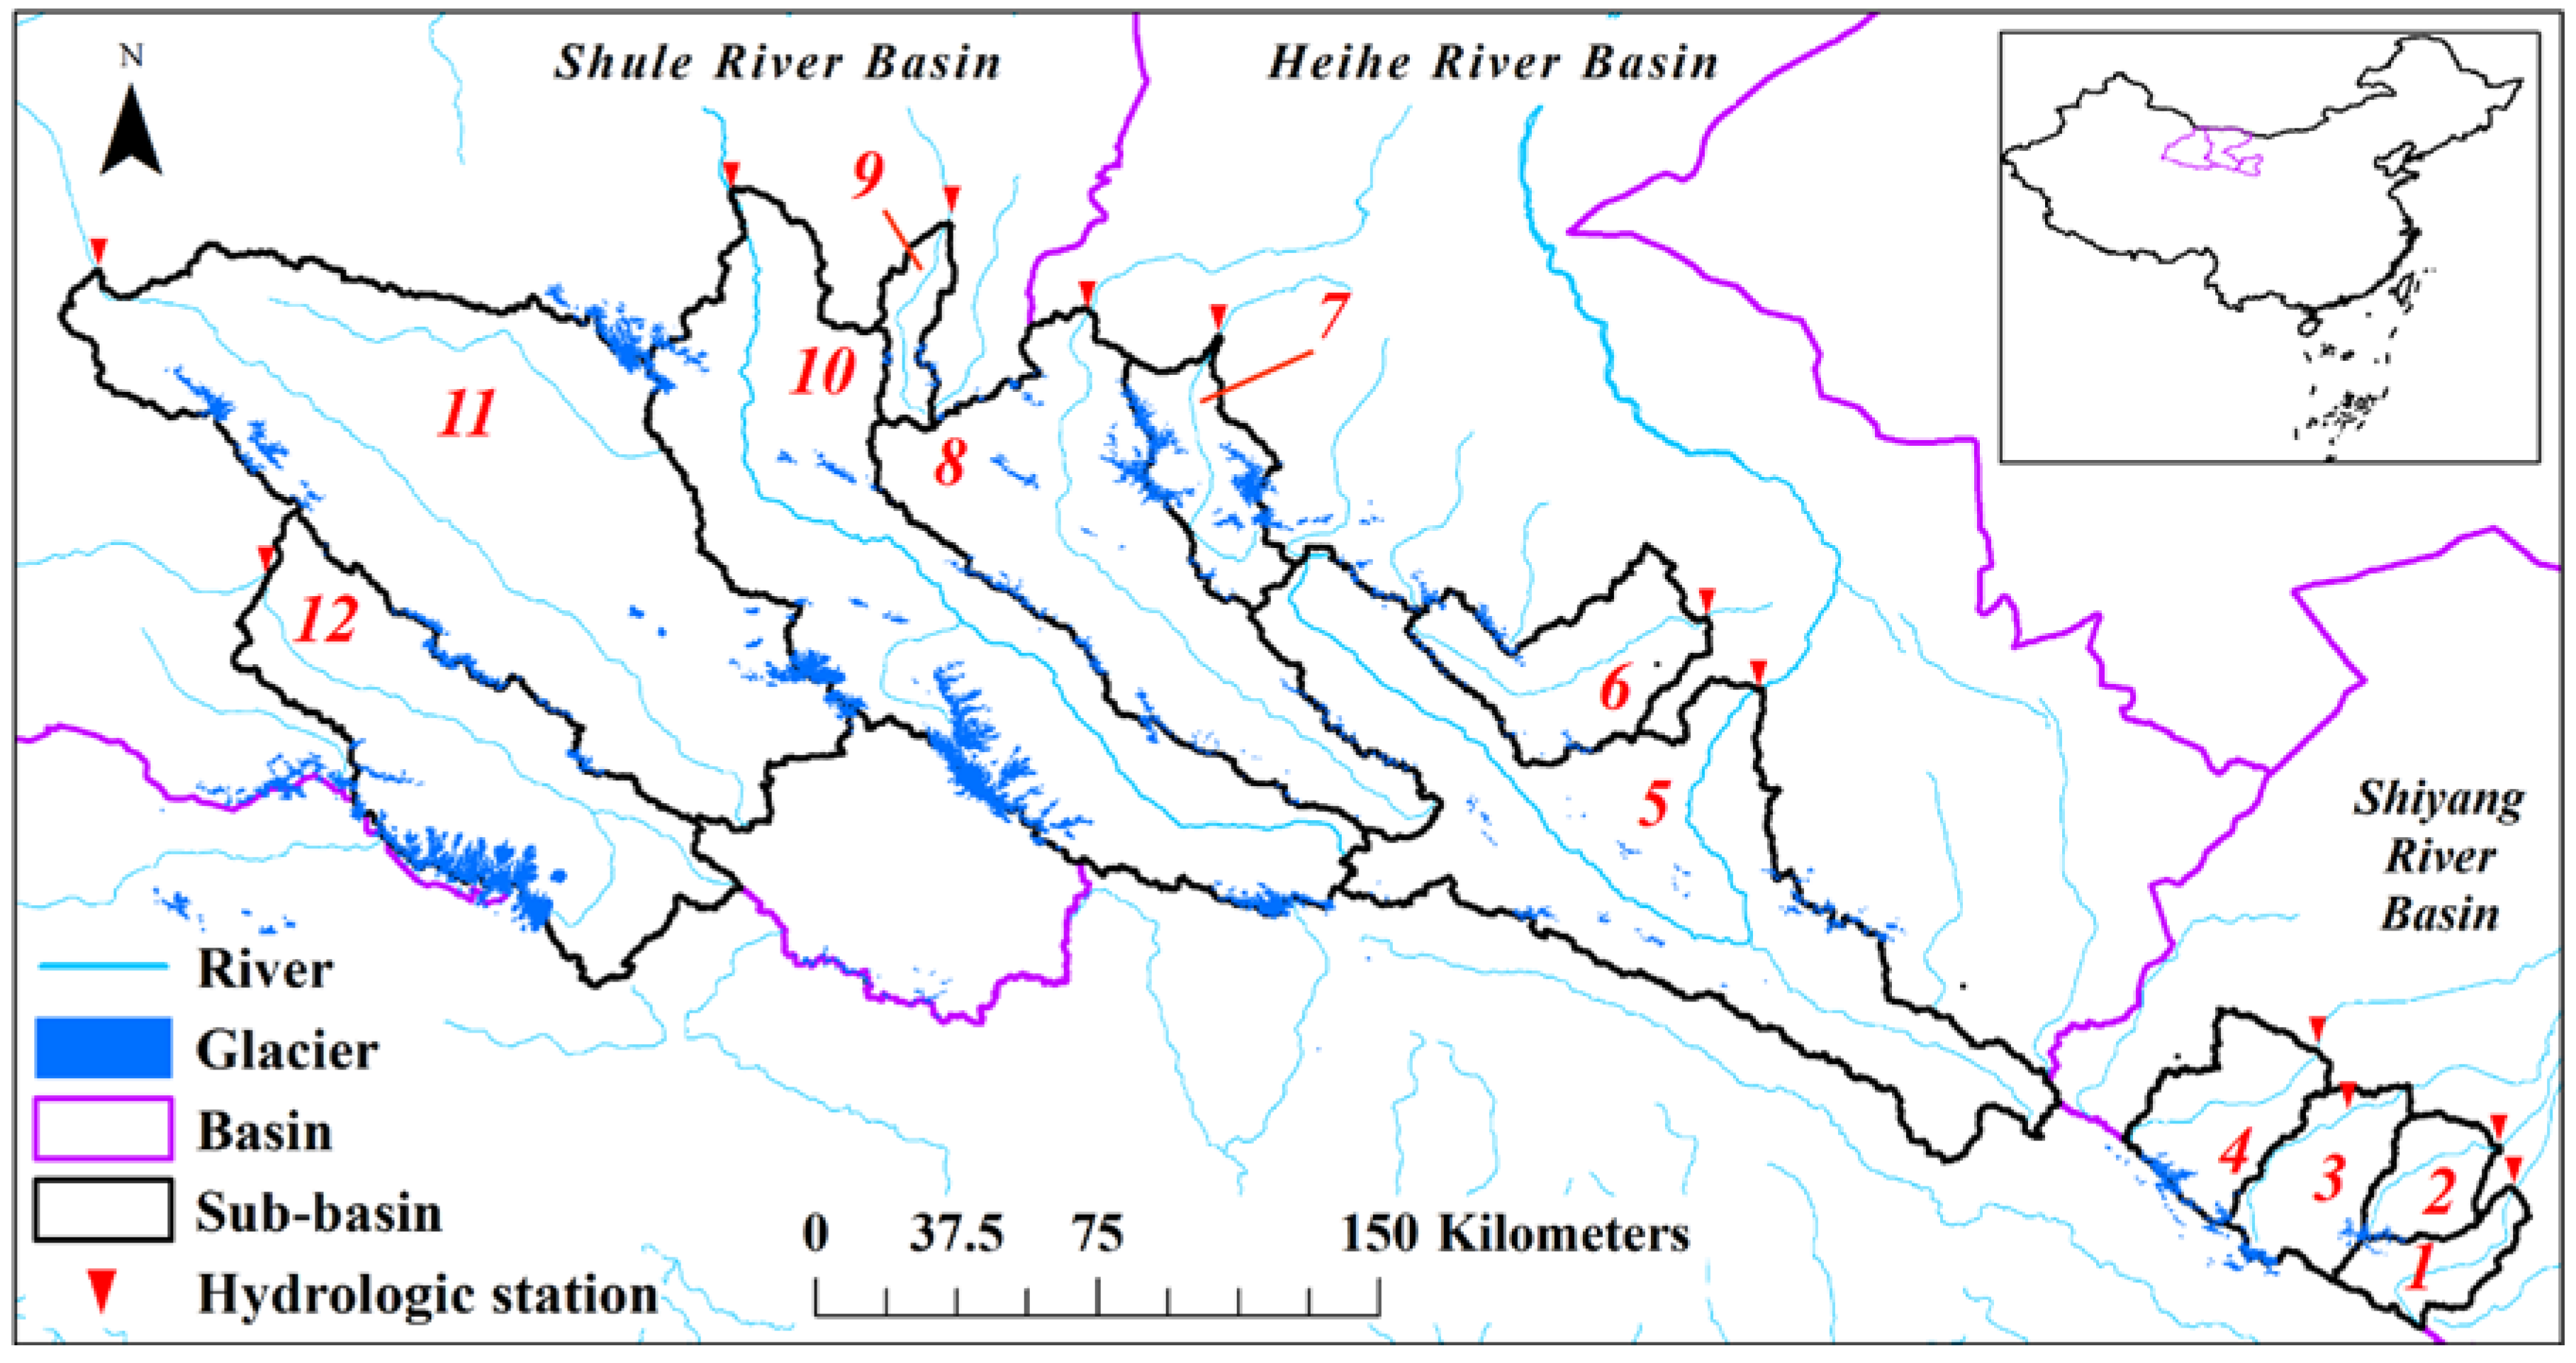
The Qilian Mountains are an important area for glacier distribution in China. A total of three inland river basins in the northern Qilian Mountains, including the Shiyang River Basin (SYRB), the Heihe River Basin (HHRB) and the Shule River Basin (SLRB), are recharged by glacial meltwater [32]. Within each basin, four sub-basins were selected for the study area because of common characteristics of their runoff: originating in the Qilian Mountains; recharged by glacial meltwater; having an upper catchment of the basin virtually unaffected by human activities; and the basin outlet runoff being monitored by long-term hydrological stations (Figure 1). For 12 sub-basins, the catchment areas were between 656 km2 and 14325 km2, and the annual average runoff was between 0.29 × 10⁸ m3 a−1 and 16.62 × 10⁸ m3 a−1. The glaciers in each sub-basin are also distinguished by the total glacier area, and the average glacier areas are between 3.75~469.52 km2 and 0.27~2.25 km2, respectively. However, due to the difference in glacier numbers, the sub-basin with the largest total glacier area (Shule) and with the largest average glacier area (Dahaerteng) are inconsistent (Table 1). By comparison, the ratio of total glacier area to catchment area in the 12 sub-basin area was also notably different; from 0.44% in Zamu to 7.95% in Hongshui.
Since the 20th century, the climate in the study area has been dominated by a “warm and dry” trend, but after the 1980s, the trend has gradually changed to “warm and wet” [33]. Nevertheless, the temperature and precipitation vary in the 12 subbasins because the SYRB is more affected by the East Asian monsoon climate and the HHRB and SLRB are more controlled by westerly wind circulation [34]. Therefore, the precipitation decreases from east to west, while the temperature increases in the whole study region.
2.2. Glacier Degree-Day Model
The degree-day model uses temperature, precipitation and details of glacial features to simulate and project the changes in glacier runoff in the past and future [35,36]. The time scale of the simulation is monthly and the simulation year runs from October to the following September. In each month, the glacier runoff is calculated at each glacier elevation band (GEB) that is divided according to the altitude gradient of the glacier. The principal degree-day model is:
In Equation (1), M is the equivalent of meltwater (mm), DDF is the degree-day factor of snow and ice (mm °C−1 day−1), which is usually assumed to not change over time, and PDD is the accumulation of positive temperature during a period. The monthly PDD can be calculated by a Gaussian distribution centered on the mean monthly temperature (Tm) and its standard deviation () by
The PDDs are set to first melt the snow on the surface of the glacier. The glacier itself does not melt until all snow has melted and there is remanent PDD. For each glacier, we assumed that the total glacier area (S, m2) did not change in a year. The annual mass balance can be calculated by
where Ps is liquid precipitation, f is the rate of refreezing, and Si is the glacier area (m2) for GEB i. Bahr and others [37] gave a glacier area (S, km2) versus volume (V, km3) relationship that was also used by the second Chinese glacier inventory [38].
Thus, after one simulation year, the glacier area is
According to observations in the Western Himalayas [39], glacier area change (Sy+1 − Sy) only occurs in the lowest GEB. Therefore, after a glacier shrinks, the initial glacier tongue may change to an exposed area. Radić and Hock listed three concepts of glacier runoff [1]; however, in the most general sense, glacier runoff is defined as runoff from the glacierized area, and hence, it includes all runoff, such as melted ice, melted snow, rain or other inflows at the surface. According to this concept, the runoff-producing area is the initial glacier area (A, km2) even though the glacier at the terminus has completely disappeared, but the snowmelt and rainfall runoff in the exposed area were also included in the total glacier meltwater. For each GEB, Ai is constant and equal to the initial Si; thus, the annual glacier runoff in one glacier is simulated by
The front section of Equation (6) represents runoff from the glacier surface, and the latter section represents runoff from the exposed glacierized area. PL is the liquid precipitation (mm), Ai is the initial area of the GEB (km2) and F is runoff coefficient in reduced glacier area. Han [40] observed that the runoff coefficient is 0.72 in cold alpine deserts, in which geomorphic characteristics are similar to those of exposed glacierized areas after glacier retreats; hence we set F = 0.72. There is no need to count the refreezing of liquid precipitation in the front section of Equation (6) because liquid precipitation promotes glacier melting by dynamic and thermal erosion, and it can be considered that the effects of refreezing and erosion cancel each other out.
In the general model, the DDF of snow and ice were set to constant in a region [41]. However, the DDF is affected by various topographic and climatic features, even among adjacent glaciers. Huss and Hock established a validation program to approach individual DDFs for each single glacier worldwide [42]. In this study, similar processes are used to validate the DDF of snow and ice.
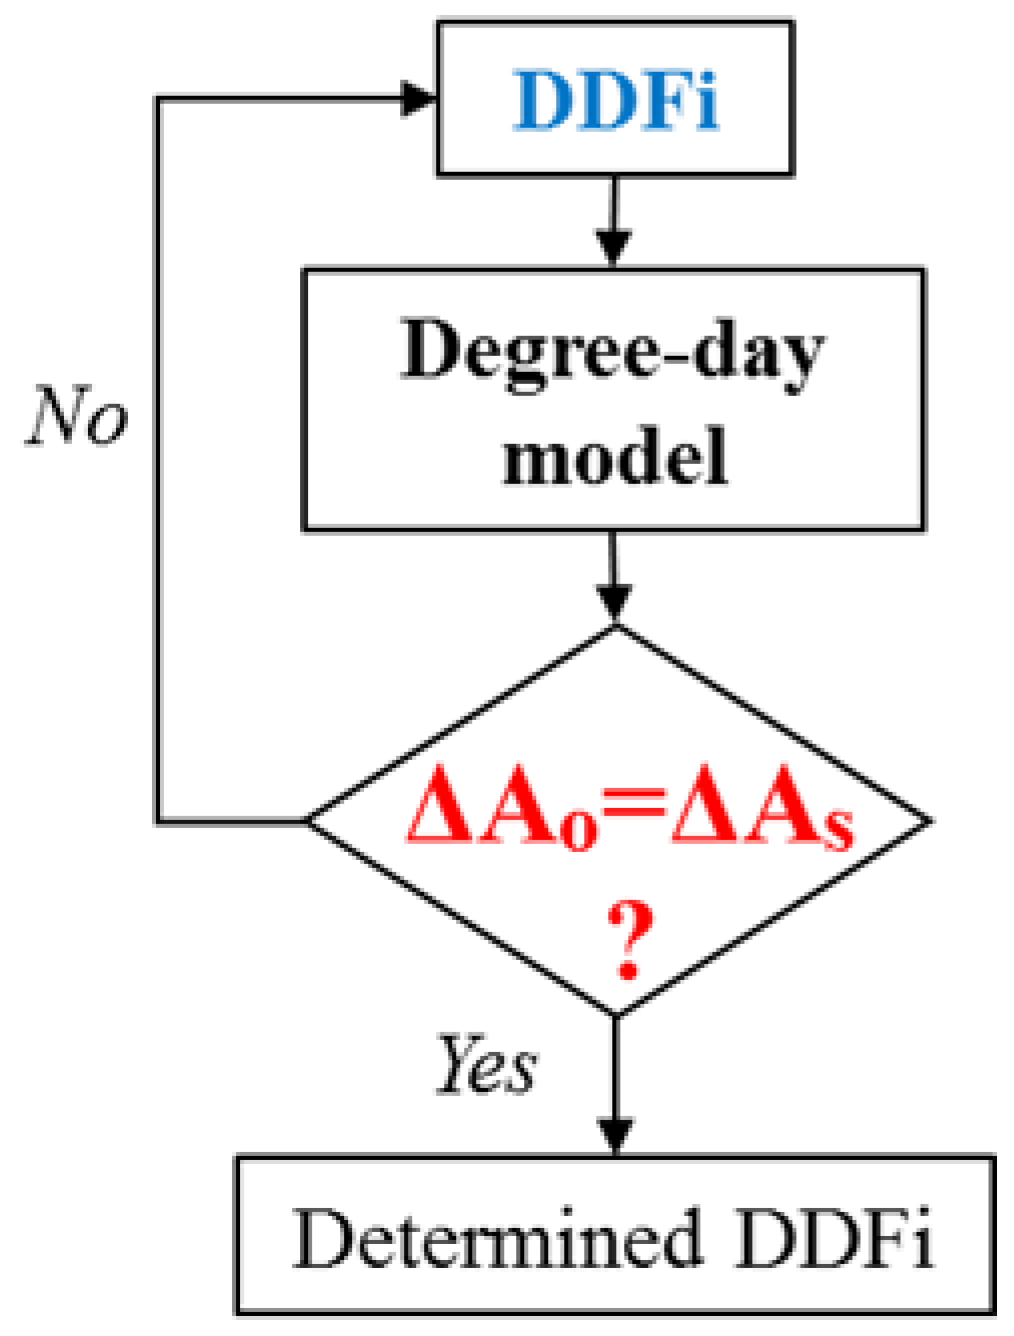
It is commonly believed that the ratio of the DDF for snow (DDFs) and the DDF for ice (DDFi) is constant. The study indicates that the ratio is approximately 0.6 in Western China [43]. In the model, after replacing DDFs with DDFi and the ratio for every single glacier, the DDFi value is the only crucial parameter that determines glacier changes under the same path of climate change. This means that during a fixed period, the glacier area change (ΔAo) depends on the DDFi value. In China, the actual ΔA can be calculated by twice using the Glacier Inventory of China (GIC)
where AGIC-I and AGIC-II are glacier areas recorded in GIC-I and GIC-II, respectively. Meanwhile, the simulated glacier area change (ΔAs) can be simulated by a degree-day model with any given DDFi. Thus, by adjusting the DDFi until agreement between the glacier’s simulated and actual area change is equivalent during the same period, the final input DDFi is determined and will be used in either simulation of past or projection of future glacier and melt runoff changes (Figure 2).
After the model is established and the DDFi/DDFs of each glacier is calibrated, the prediction of future glacier and melt runoff changes only needs to input the temperature and precipitation data under future climate scenarios into the model. In this study, the historical time is 1960–2016, and the future time is 2016–2099.
2.3. Data and Parameters
- Meteorological Data: There are a total of 26 national meteorological stations in and around the study area, and the records are used to interpolate the temperature and precipitation by the method of Chen Rensheng [41]. After separation of solid and liquid precipitation, the snow and rain are calibrated separately, taking into account the systematic errors in the observations of the original data, and the calibration parameter is the same as Chen Rensheng [44].
- Data for calibration and validation: The DDFi of each glacier is calibrated by the area change between CGI-I and CGI-II. The model is validated by five long-term observed glaciers which include Ningchan River Glacier No.3, Shuiguan River Glacier No.4, Qiyi Glacier, Bayi Glacier and Laohugou Glacier No.1 in the study region. Data from six stations and CHOICE [46] were used to verify estimated temperature, PDD and precipitation (including separated rain and snow).
- Data for Projection: The future meteorological data grid is 0.5° × 0.5°, and the bias was corrected by the China National Climate Center including five GCMs from the CMIP5 archive: HadGEM2-ES, IPSL-CM5A-LR, MIROC-ESM-CHEM, GFDL-ESM2 M and NorESM1-M under three RCP scenarios: RCP2.6, 4.5 and 8.5 [47,48]. Climate projection data were downscaled by SDSM with the method of Khadka [49].
2.4. Model Validation
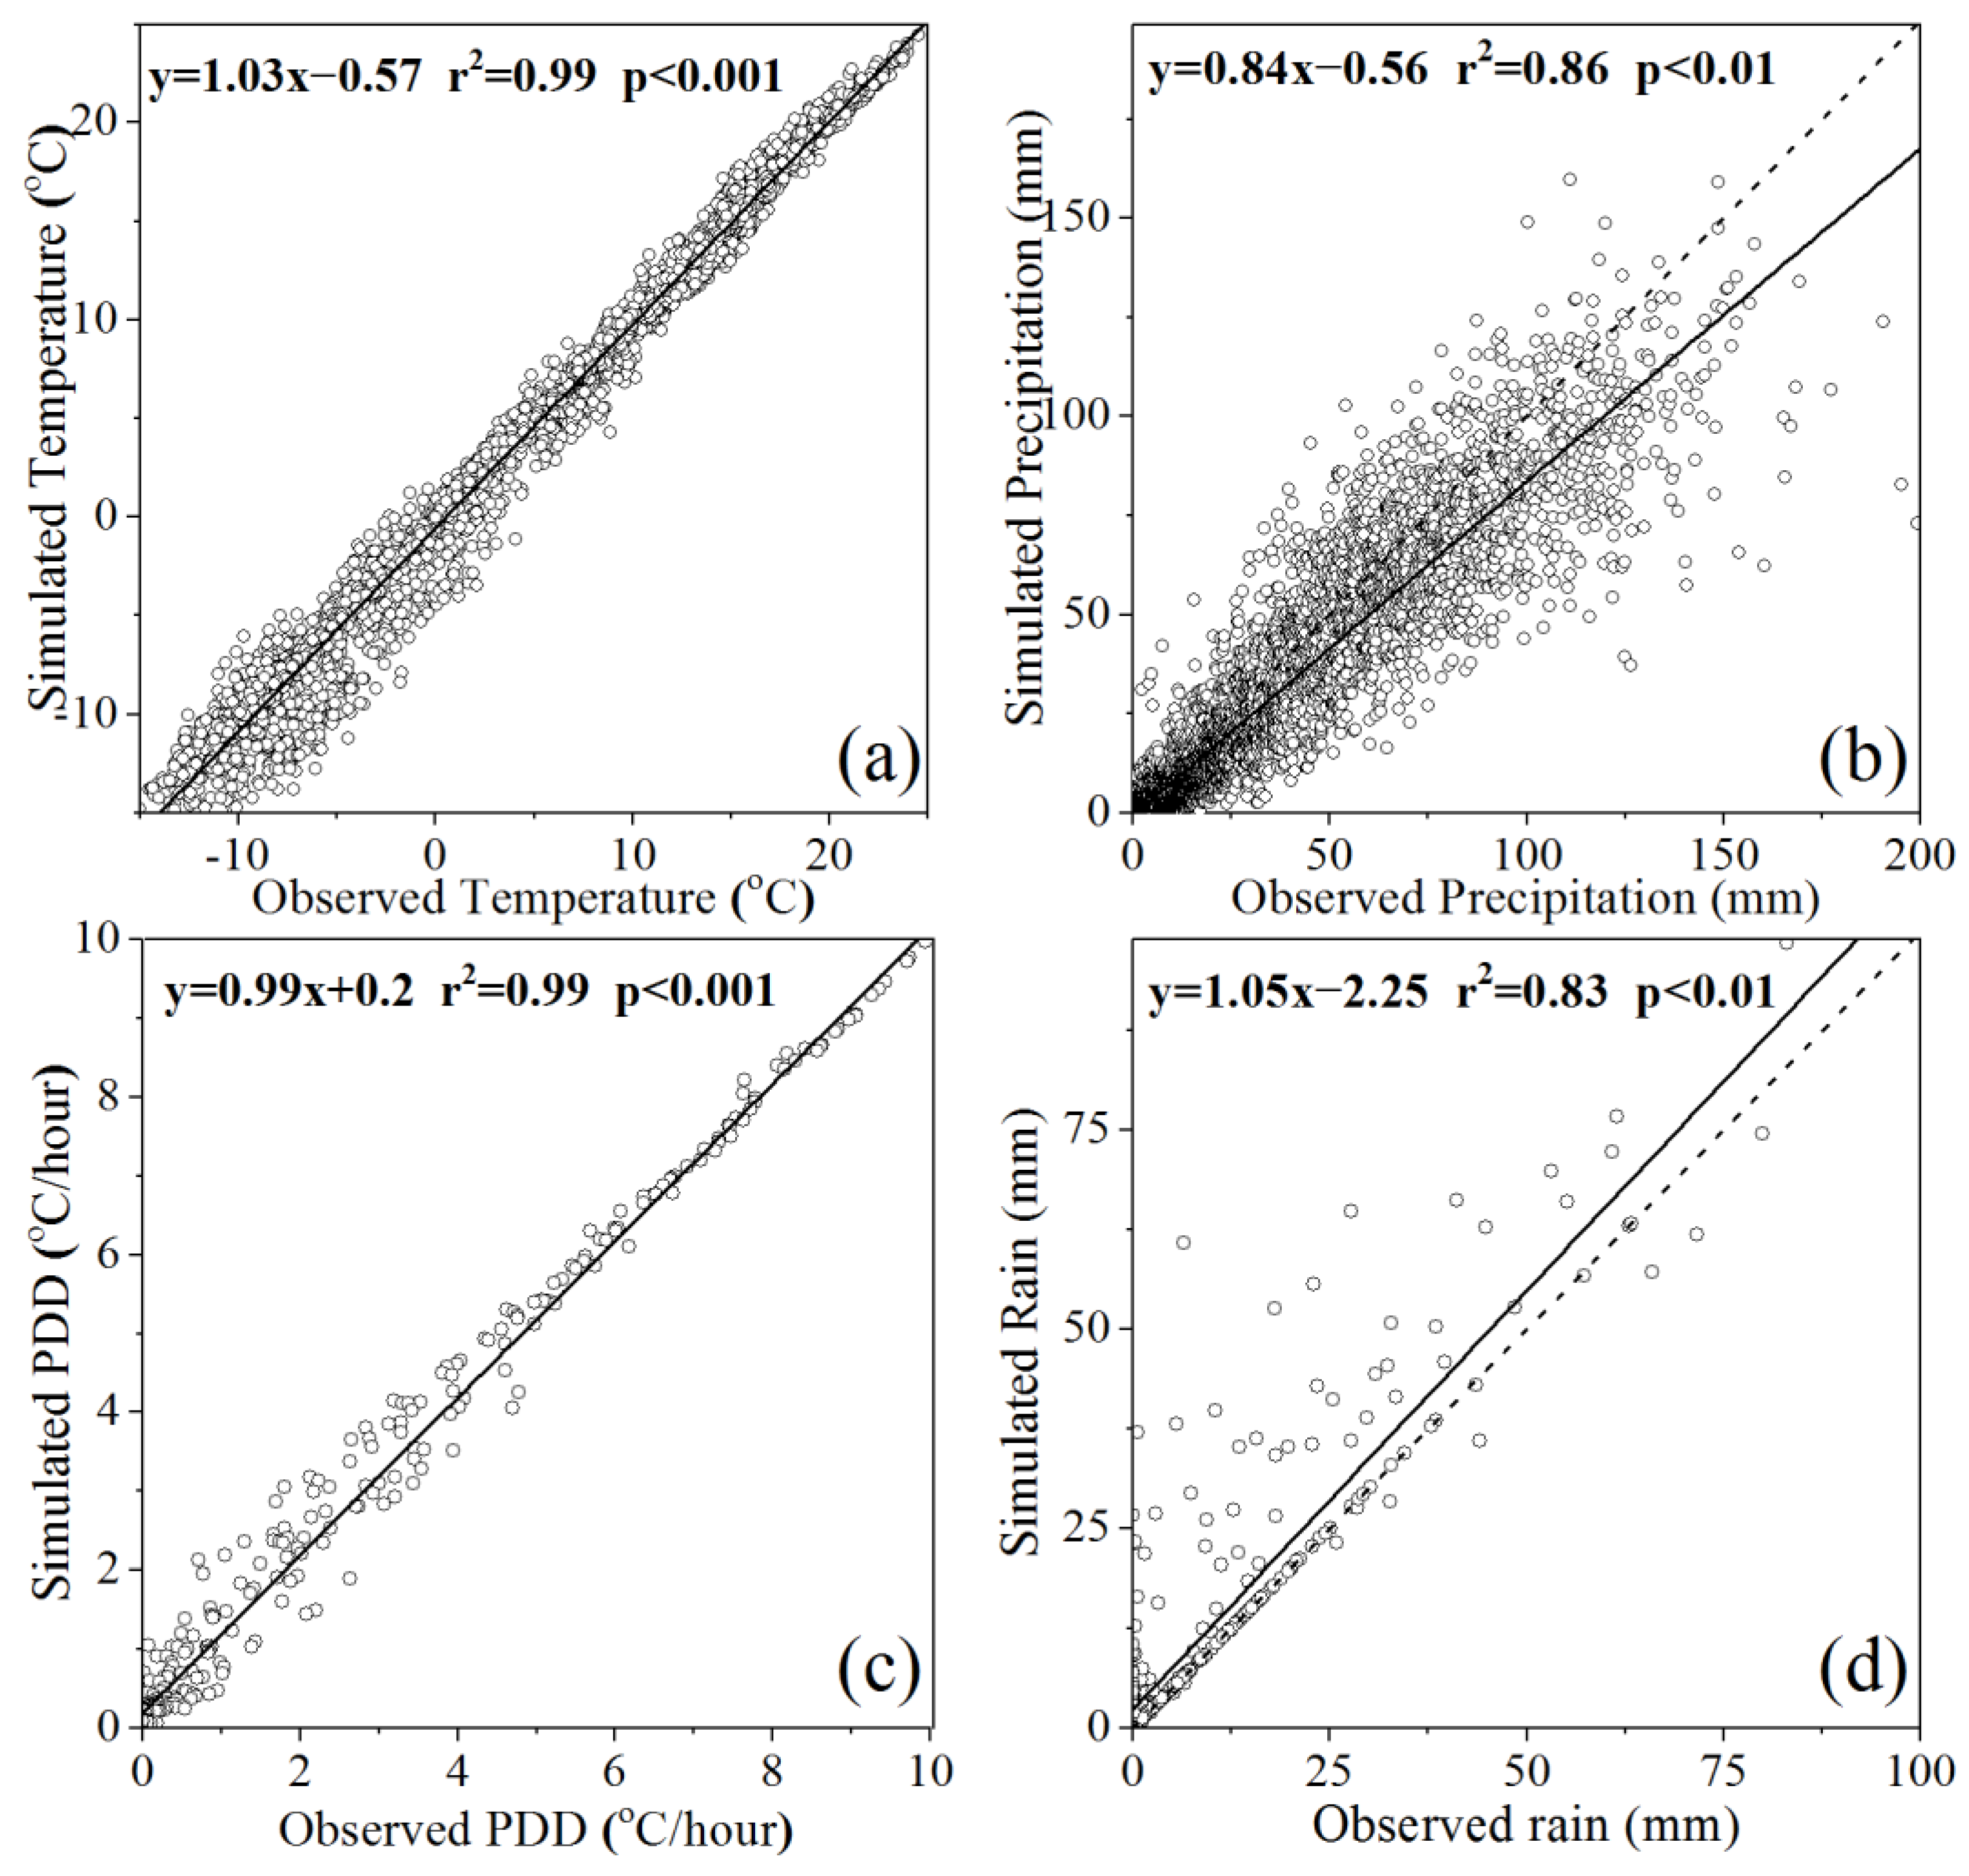
The estimated yearly temperature and precipitation were 4.84 °C and 417.72 mm, respectively, and both were in good agreement with the observed values of 4.43 °C and 401.25 mm from 1960–2016. The R2 between observation and simulation was 0.86 (p < 0.001) and 0.99 (p < 0.01) respectively (Figure 3a,b). The slightly lower precision of precipitation interpolation was mainly due to uneven distribution of precipitation during the year, but it remains reliable compared to other precipitation products. The R2 between the calculated and observed PDD was 0.99 (p < 0.001) (Figure 3c). The R2 between the calculated and observed rainfall was 0.83 (p < 0.01) (Figure 3d), with a small amount of the calculated rainfall slightly higher than the observed (this was also true for simulated and observed snow); this was partly due to the higher interpolation of total precipitation, and partly to the methods used in this paper which were inevitably ineffective for extremely low precipitation amounts. These deviations did not significantly impact the final results of the model because they occurred only in individual months.
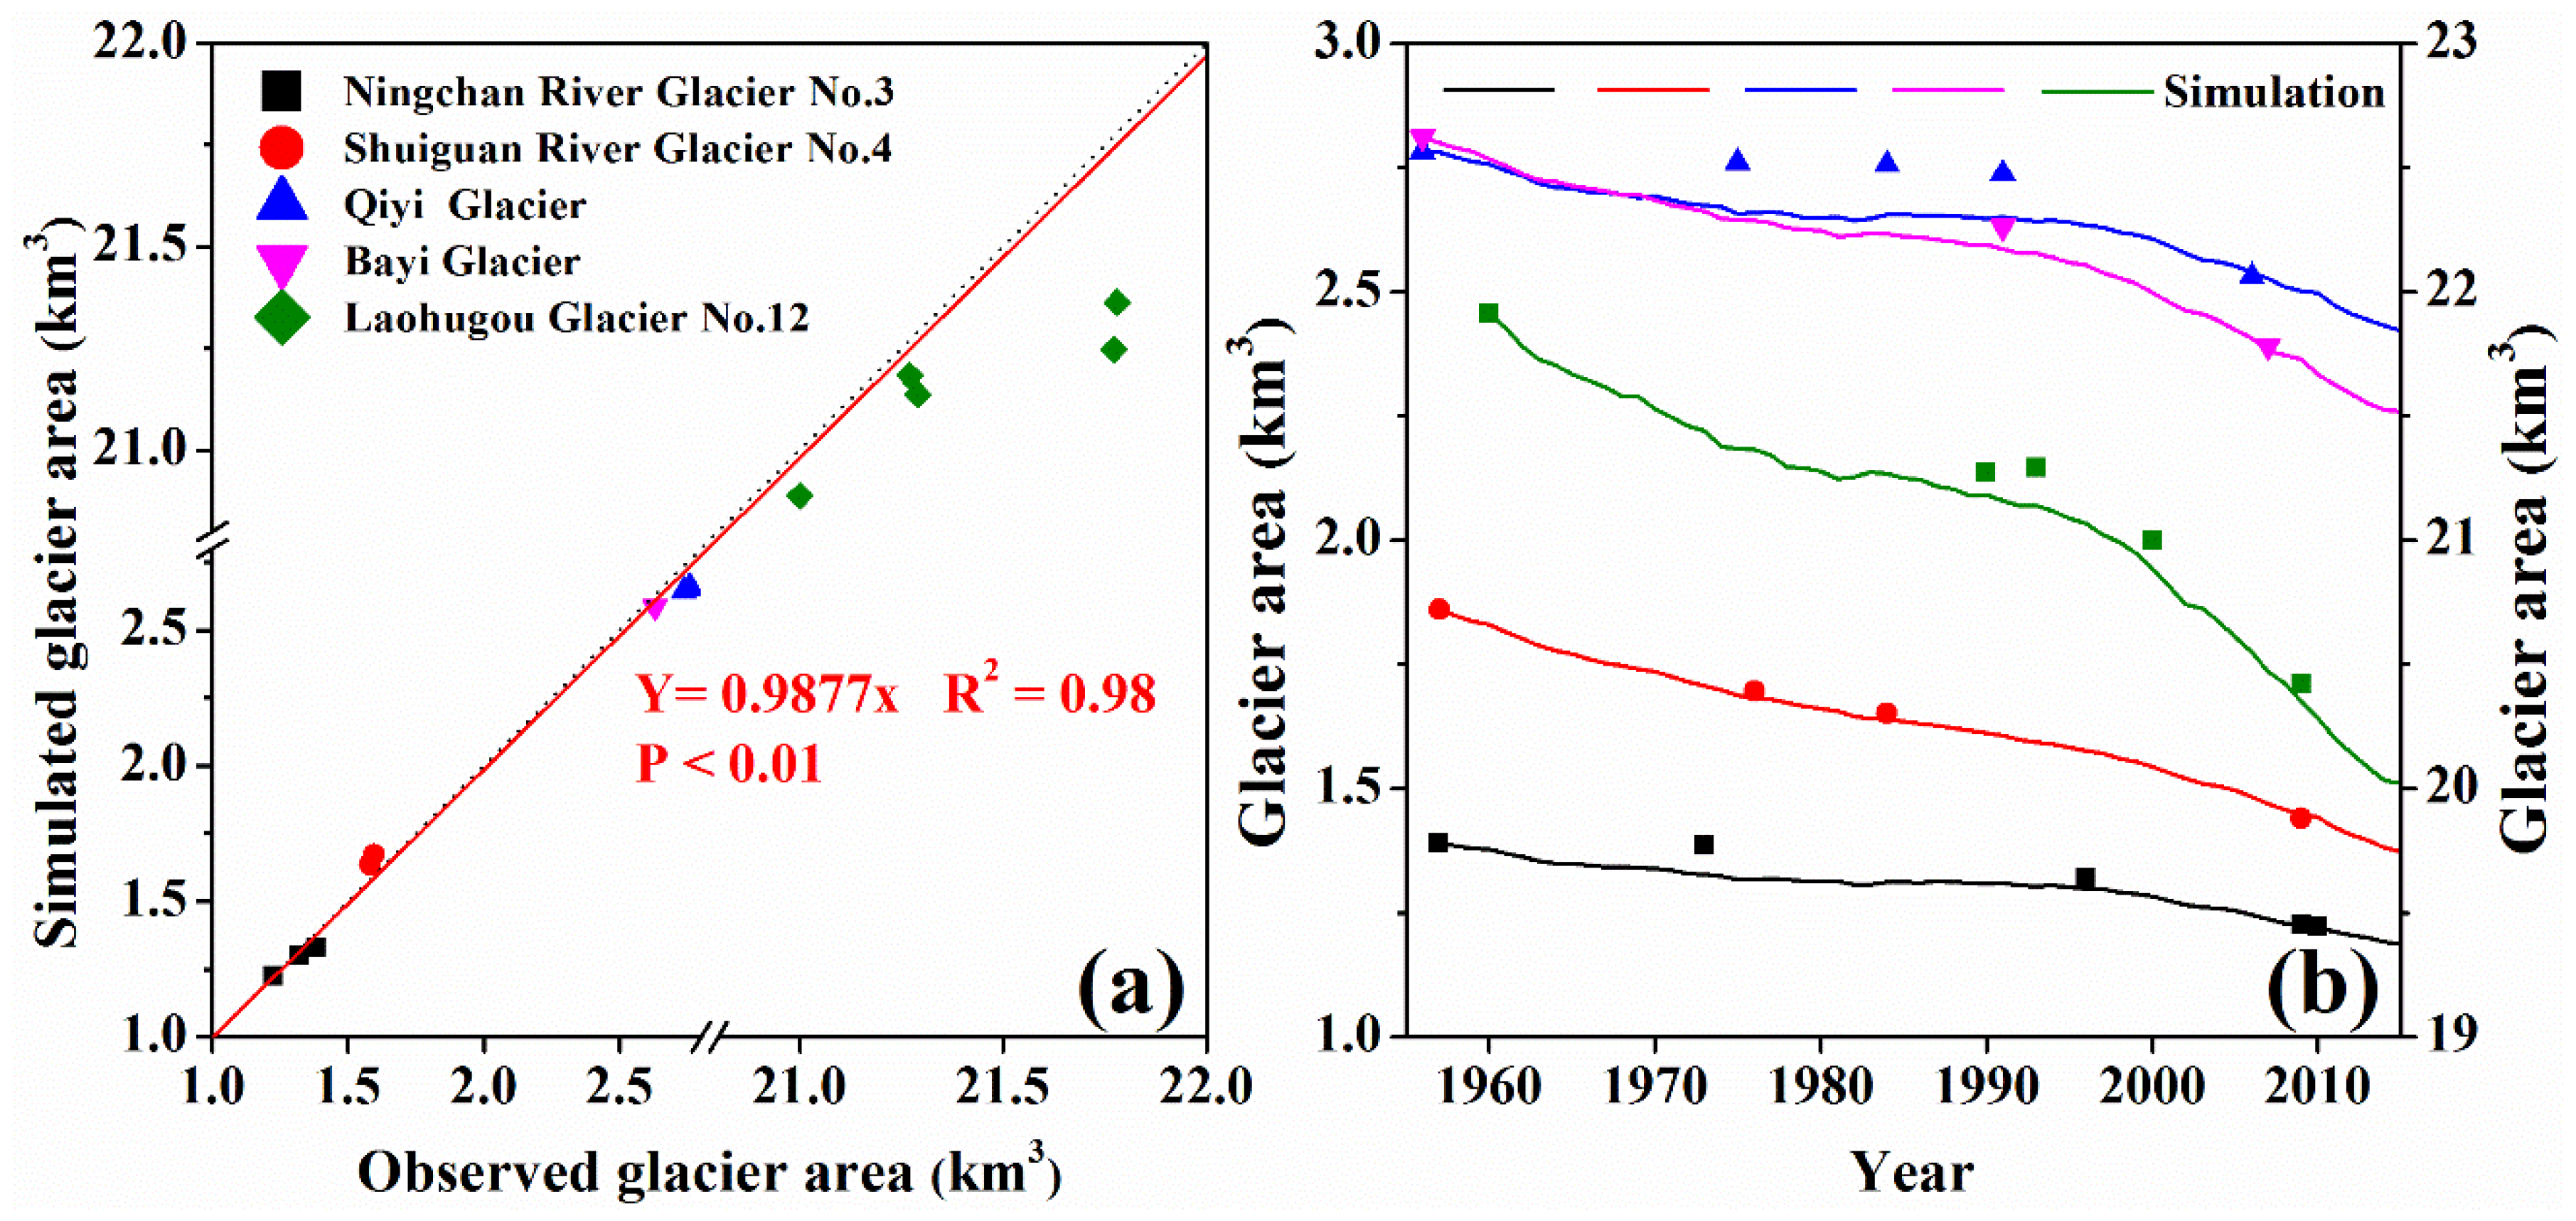
Model results were mainly validated against glacier area. Figure 4a shows the comparison between simulated and observed glacier area from five glaciers: Ningchan River Glacier No.3 [50], Shuiguan River Glacier No.4 [51], Qiyi Glacier [52], Bayi Glacier (observed in this study) and Laohugou Glacier No.12 [53]. The results indicate that the simulated and the measured area are significantly correlated with R2 and NSE reaching 0.98. Figure 4b shows that the trajectories of glacier area change are also coincident with the observed values.
3. Results
3.1. Regional Climate Change
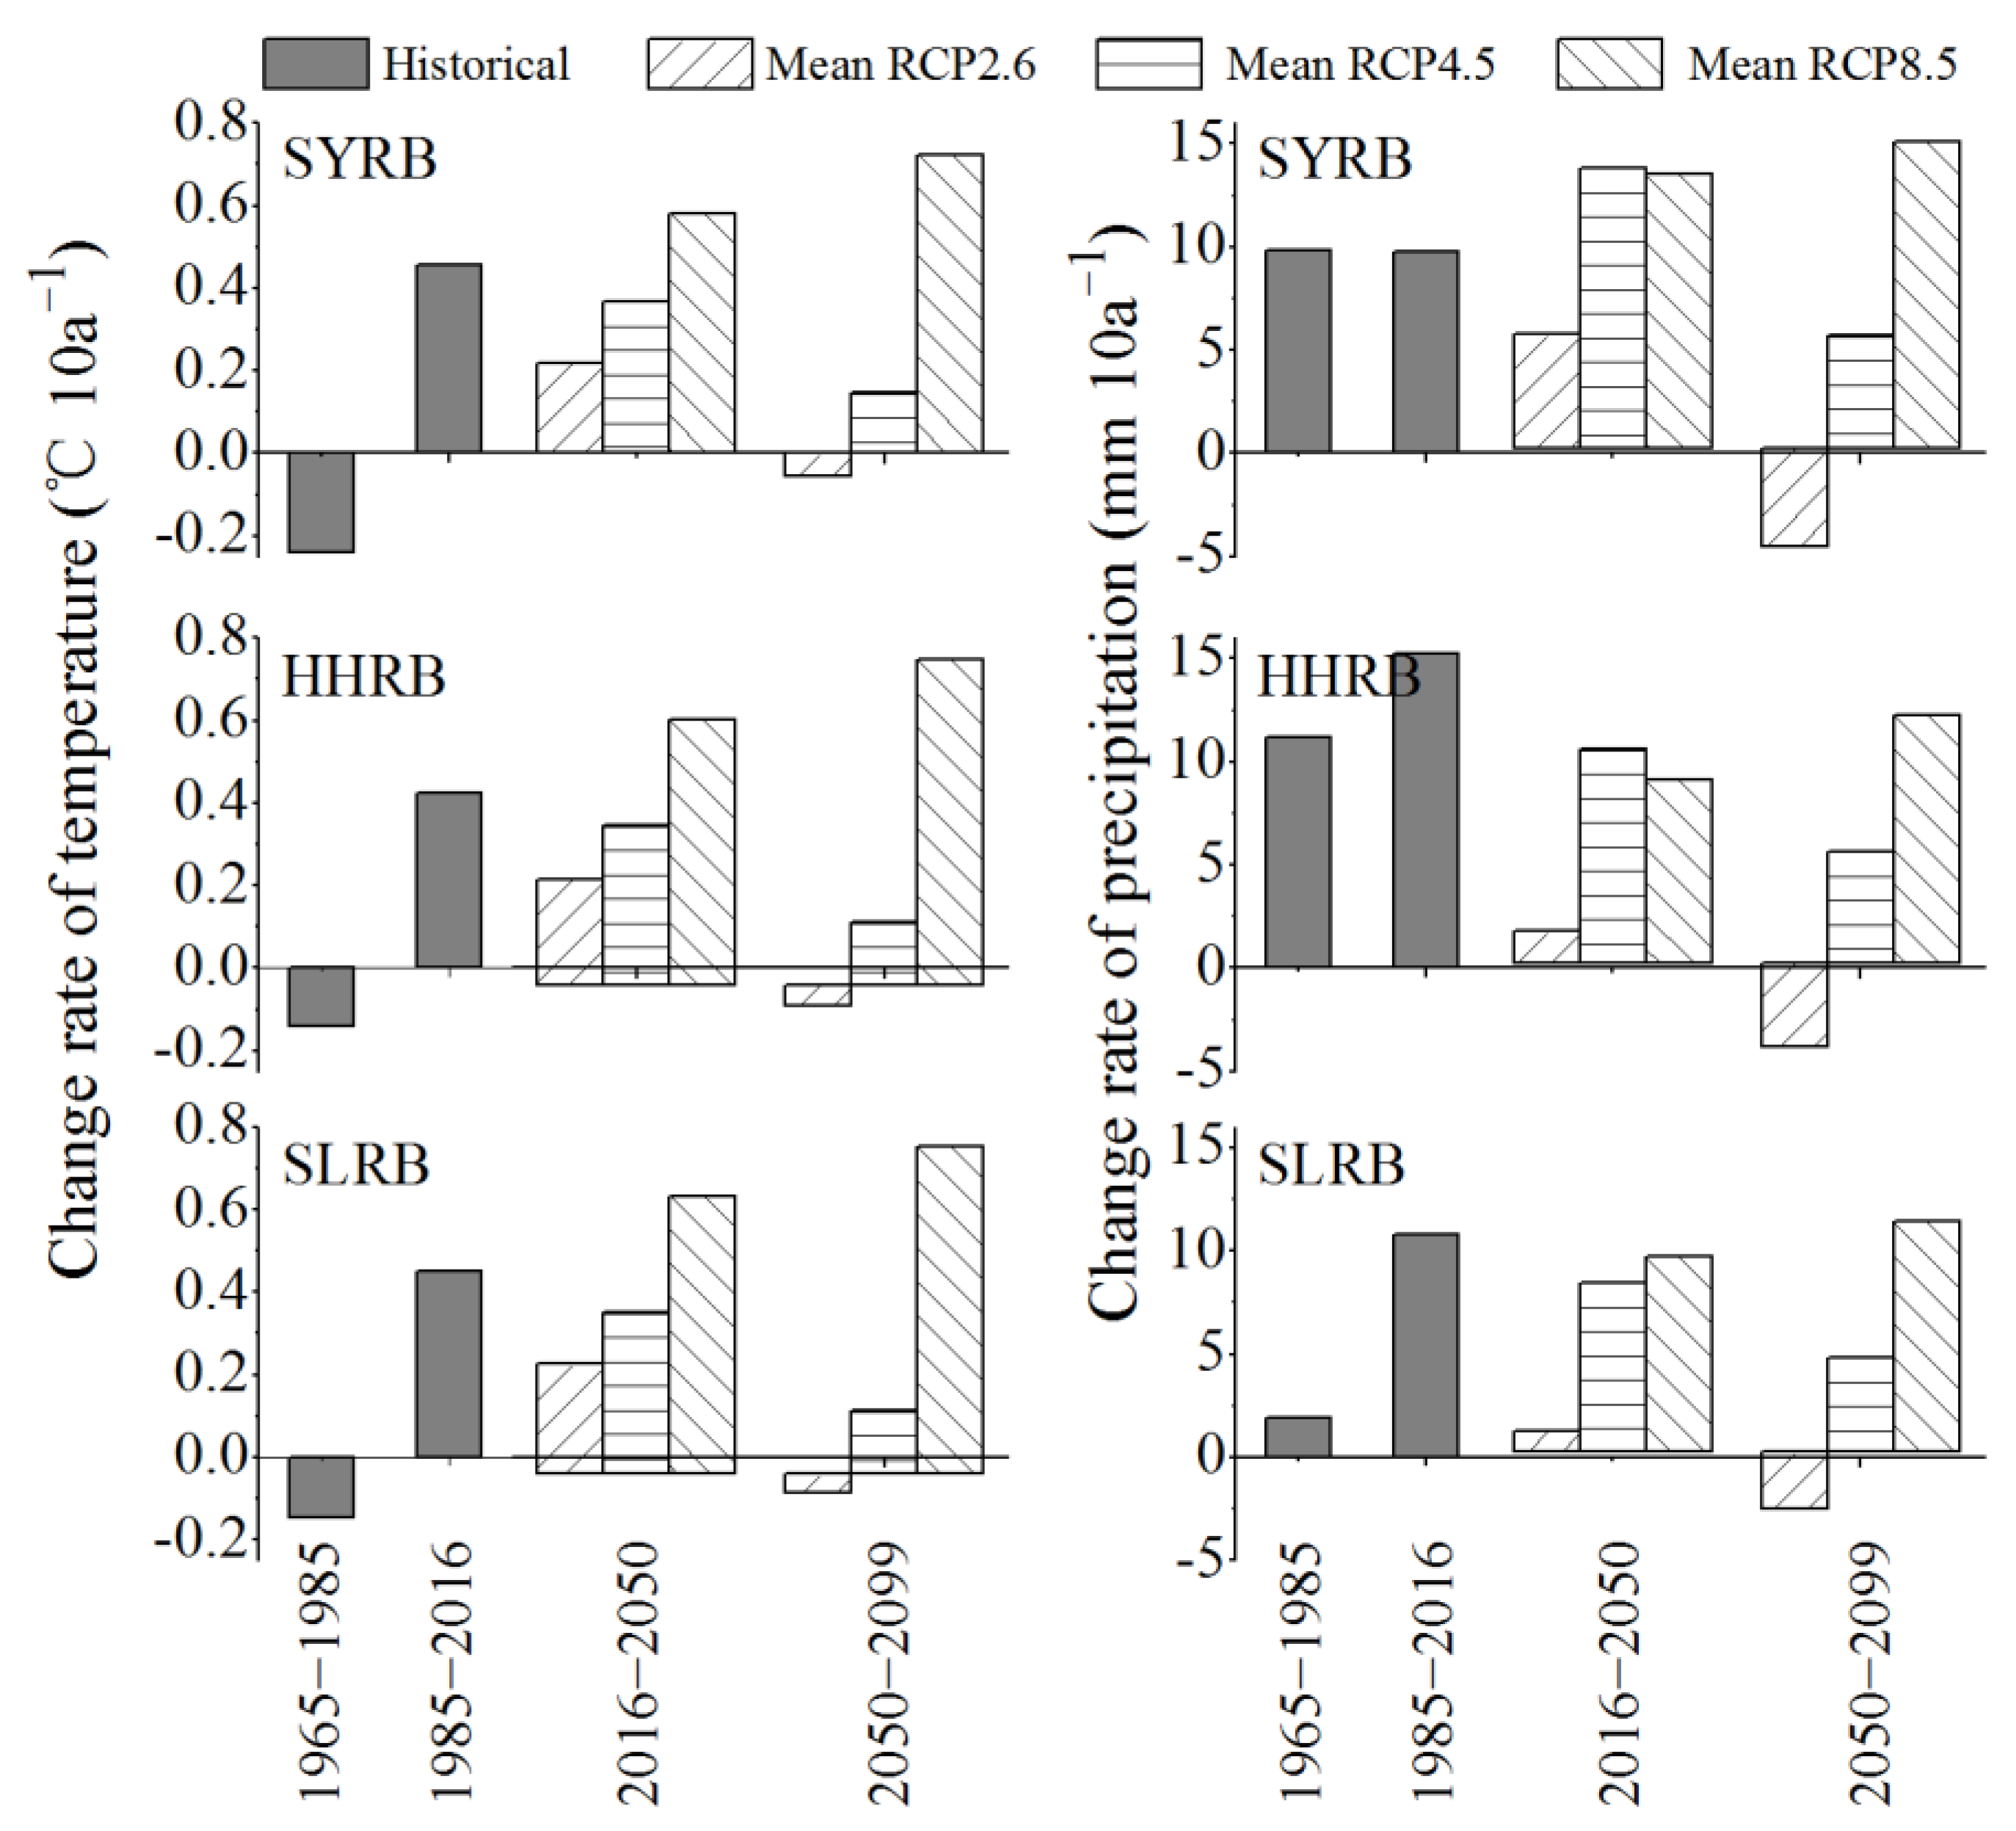
The historical and future mean temperatures on glaciers of three inland river basins generally decreased from east to west (from Zamu to Dahaerteng in Table 1) and were affected by elevation; the warmest and coldest subbasins were Dongda and Hongshui, respectively. The mean temperature in 2016–2099 will be higher than that in 1965–2016 by approximately 1.65, 2.27 and 3.53 °C under RCP2.6, RCP4.5 and RCP8.5, respectively. In contrast, the precipitation increased from east to west, and the mean precipitation in the future was also larger than that in the historical period by 33.08, 44.24 and 65.77 mm under the three climate scenarios. Overall, the climate in the 12 subbasins has changed to “warm and wet”, as has the whole region of northwestern China, and that trend will continue in the future [33].
In detail, the change in regional climate can be divided into four periods (Figure 5). The glaciers first experienced a cold period in 1965–1985. The temperature and precipitation then both increased in 1985–2016, with temperature increasing especially rapidly after the mid-1990s. In the future, the temperature and precipitation trends will both decrease after 2050 under RCP2.6; for RCP4.5, the change rate of temperature and precipitation will decrease after 2050; and for RCP8.5, the change rate of temperature will keep rising through the full future period. Precipitation will continue to increase in 2016–2099, but in HHRB and SLRB, the change rate will be less than 1985–2016.
3.2. Changes of Glacier Area
From 1965 to 2016, the glacier area in the SYRB, HHRB and SLRB retreated by approximately 45.8%, 38.2% and 22.0%, respectively, and the total glacier area in the study basins shrank from 1192.4 km2 to 920.6 km2, with 22.8% of the area disappearing. Among the 12 subbasins, glacier area retreat depends on the distribution of temperature and the size of individual glacier areas, which proved that the stability is poorer for smaller glaciers than for larger glaciers. Therefore, the historical changes in the study glacier area decreased from east to west (Figure 6). Zamu and Dahaerteng are the basins with the most and least glaciers disappearing, and the corresponding change rates are 61.7% and 16.7%, respectively. In historical durations, the glacier area retreat in SYRB, HHRB and SLRB slowed from 1980 to the mid-1990s with rates of −0.63 km2 10a−1, −1.45 km2 10a−1 and −3.52 km2 10a−1 as the climate experienced a cold period. Compared with the mean change rates of all historical time of −1.01 km2 10a−1, −3.13 km2 10a−1 and −8.09 km2 10a−1, the retreat rate slowed by 63%, 45% and 43%.
In the future, glaciers will almost disappear in the Zamu Basin in the 2070s under RCP2.6, 4.5 or 8.5. In five other basins, including Jinta, Heihe, Liyuan, Hongshui and Shiyou, glaciers will potentially disappear after the 2080s under RCP4.5 or 8.5. However, glaciers will still exist in Xiyin, Dongda, Taolai, Shule, Danghe and Dahaerteng until the end of this century. Statistics indicate that glacier areas will retreat to 9.2 km2, 6.2 km2 and 2.9 km2, with 83.6%, 88.8% and 94.8% losses in the SYRB in 2099 under RCP2.6, RCP4.5 and RCP8.5, respectively, compared with 1965. In the HHRB, the corresponding area will be 27.7 km2, 17.2 km2 and 6.0 km2 in 2099 with 86.1%, 91.4% and 97.0% retreat, respectively. In the SLRB, the area will be 387.2 km2, 310.4 km2 and 188.7 km2 in 2099, with 58.8%, 67.0% and 79.9% retreat, respectively. In total, the glacier area in all basins will decrease by 64.4%, 72.0% and 83.4% from 1965 to 2099 under the three climate scenarios.
3.3. Changes of Glacier Runoff
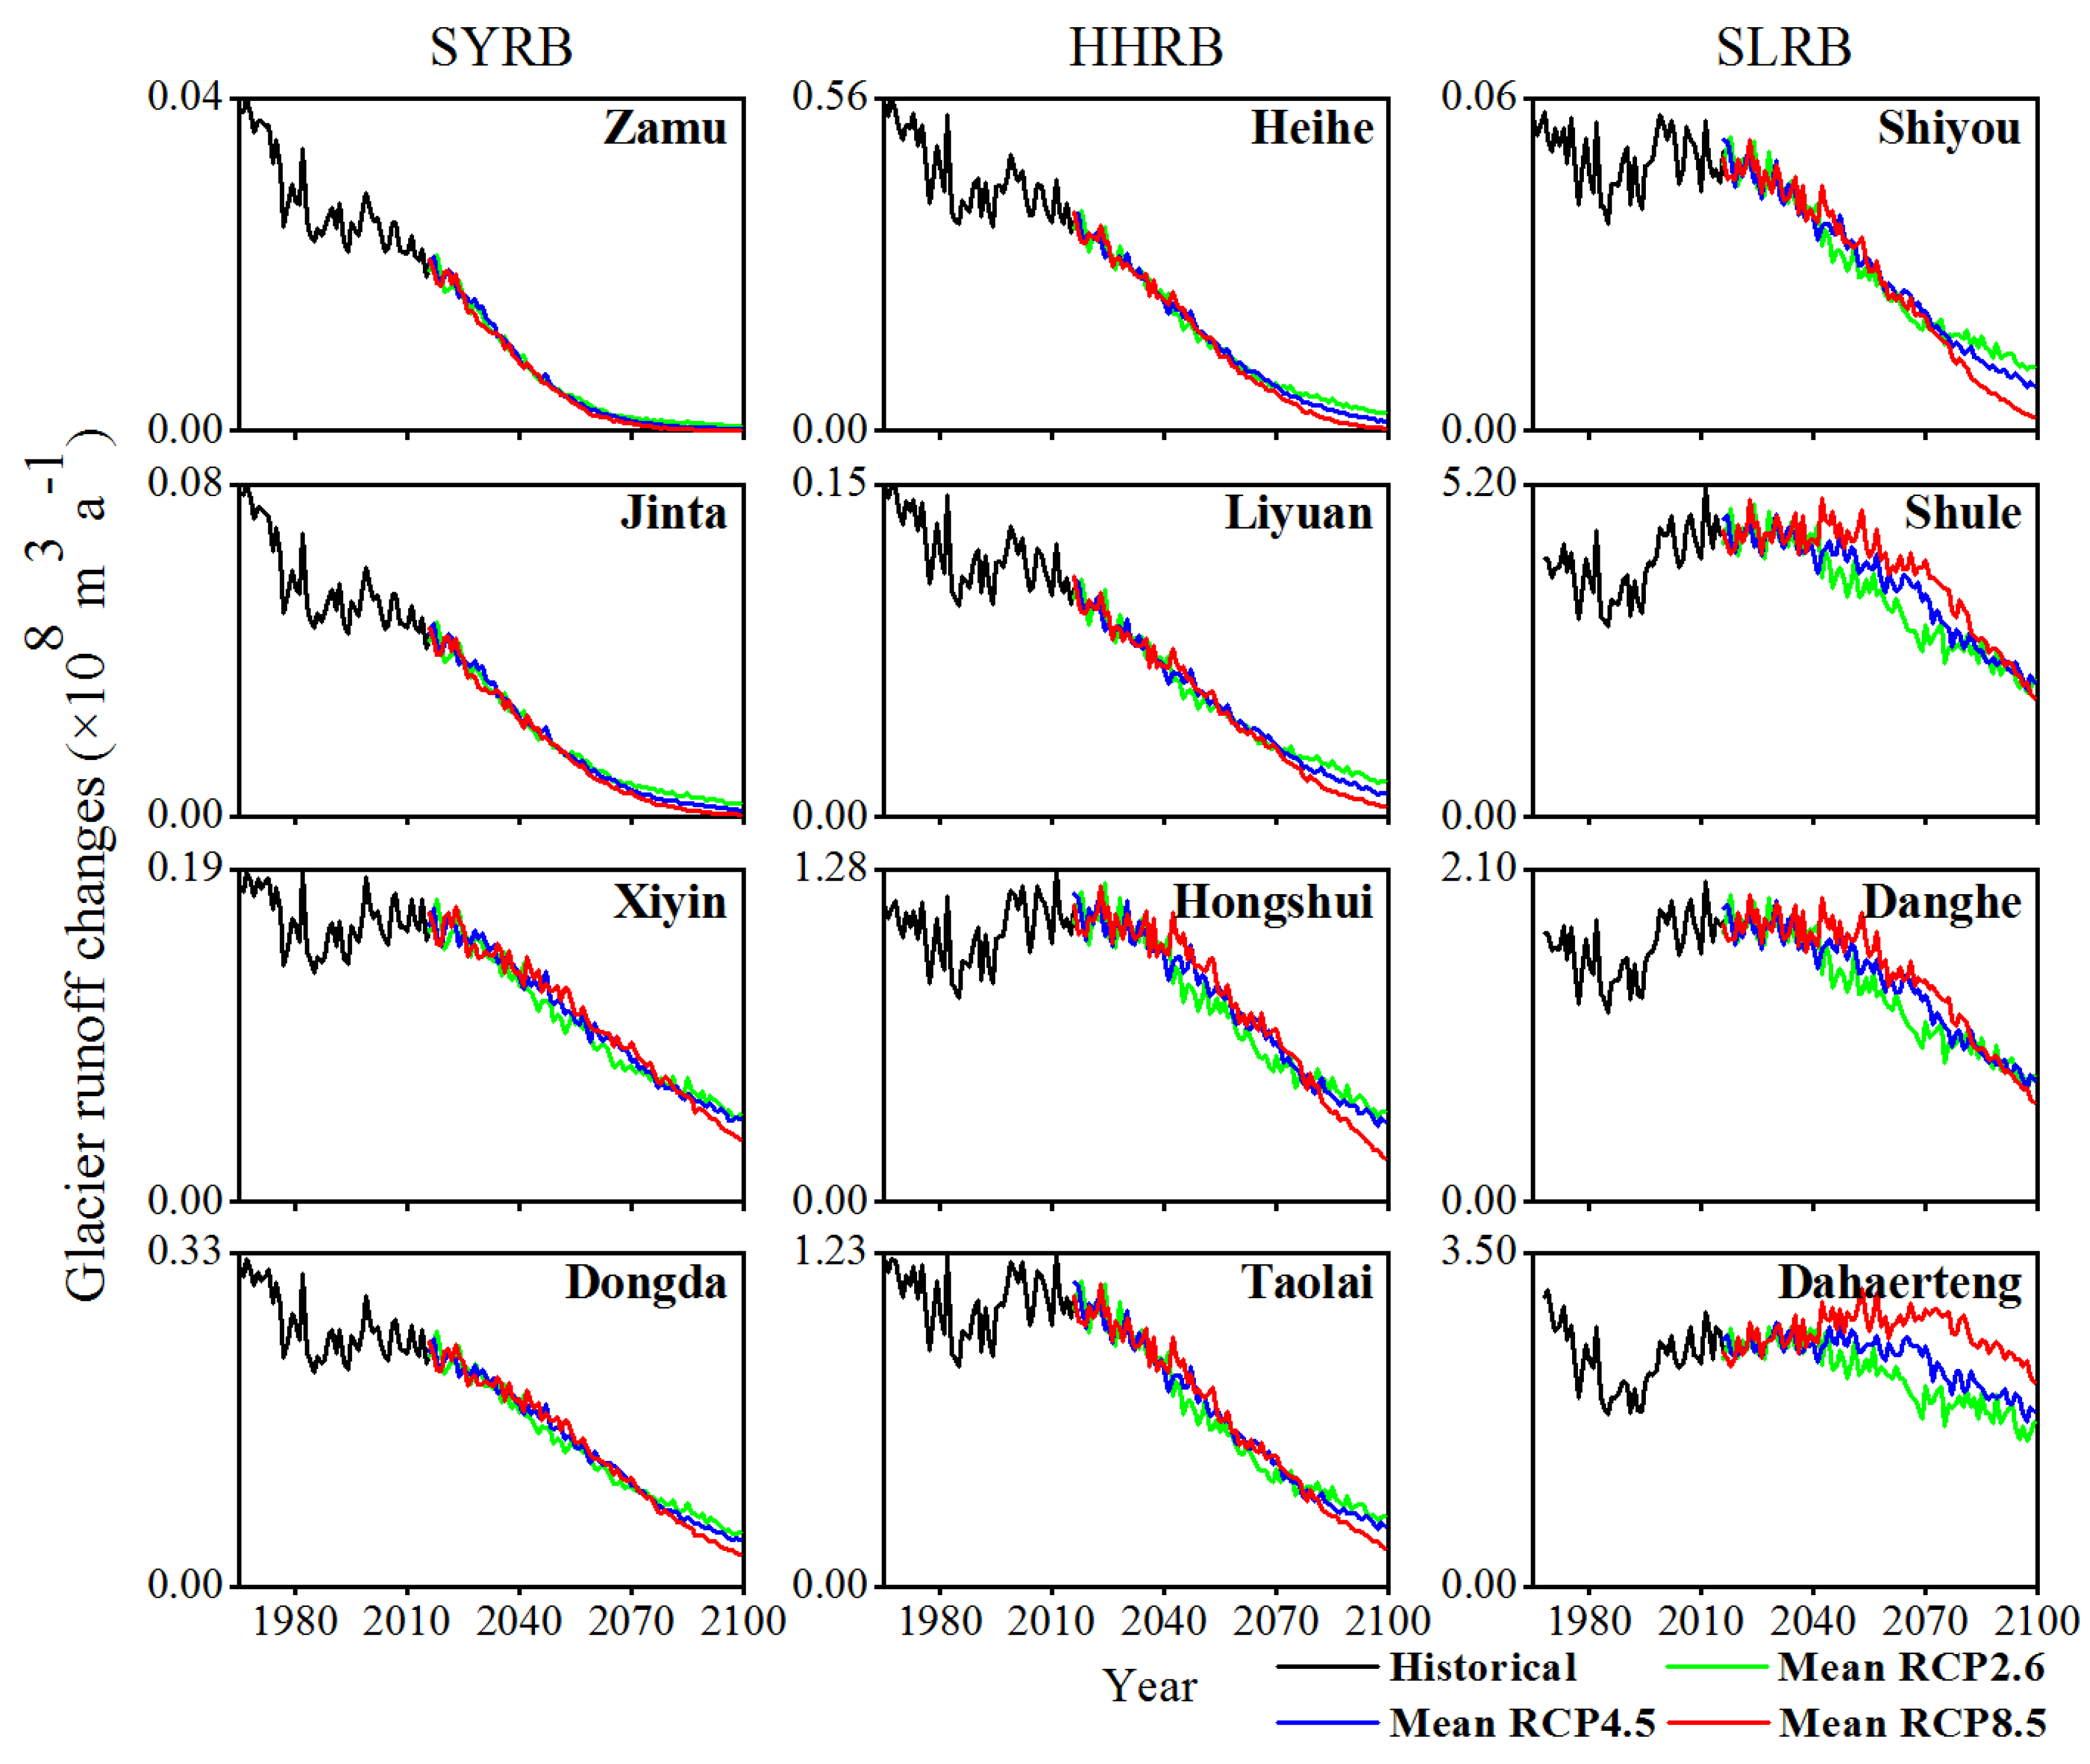
Glacier runoff is influenced by changes in glaciers (both mass balance and area change) and precipitation because it is defined as runoff that includes meltwater of ice and snow as well as rainfall on the glacier surface. Figure 7 shows glacier runoff in different regions. Combining the distribution characteristics of glaciers in Table 1, it can be found that the mean glacier runoff is tightly related to the total glacier area in each subbasin because their coefficient of determination R2 is 0.99 (p < 0.01). From 1965 to 1985, all glacier runoff experienced a decrease due to the temperature drop during that period. After 1985, the glacier runoff tended to increase with the increase in ablation and enhancement of precipitation. Although the area of glaciers shrinks rapidly at the same time, it can be inferred that the glacier shrinkage rate is much lower than the increase rate of meltwater and precipitation. For each individual glacier, the consequences of continuous melting, such as decreasing area and increasing mean elevation, will finally result in a decrease in glacier runoff; thus, there must be a “peak point” in the trajectory of glacier runoff [4]. However, the regional glacier runoff shows the synthesized chart of a single glacier, while the results indicate that the “peak point” exists in all subbasins. After the “peak point”, the runoff will decrease until 2099. In the last 10 years of the 21st century, glacier runoff will nearly disappear in Zamu, Jinta and Heihe, without differences between the three scenarios. In Xiyin, Dongda, Liyuan, Hongshui, Taolai and Shiyou, differences between climate scenarios will appear after 2070, showing RCP2.6 > RCP4.5 > RCP8.5, and the mean glacier runoff in the 2090s will account for 10%–20% of that in the 2010s. Shule, Danghe and Dahaerteng show obvious distinctions in glacier runoff from other subbasins: first, the difference between the three scenarios emerges after 2040; second, the “peak points” are different under RCP4.5 and RCP8.5; third, the glacier runoff in the 2090s accounts for more than 20% of that in the 2010s, especially in Dahaerteng. The glacier runoff is largest under RCP8.5 and then under RCP4.5 and 2.6, and the runoff at the end of this century accounts for 34–47% of that in the 2010s.
3.4. “Peak Point” of Glacier Runoff
The time of the “peak point” is one of the hotspots in glacial hydrology because it may be a critical moment for regional water resource management strategies, particularly in arid or semiarid basins where glacier runoff is the main component of total runoff. Among the 12 subbasins in this study, Figure 7 indicates that the “peak point” appeared in the historical period; in Zamu and Jinta, the “peak point” appeared in the 1980s. In Xiyin, Dongda, Heihe, Liyuan, Hongshui, Taolai and Shiyou, the “peak point” appeared in approximately 2000. In Shule and Danghe, the peak glacier runoff has potentially already passed under RCP2.6 and RCP4.5, but if the climate changes to RCP8.5, the “peak point” in these two basins will delay to the 2020s–2040s because the increase in precipitation and glacier melting is greater than those under RCP2.6 and RCP4.5, although the glacier area is barely distinguished before 2040 under the three climate scenarios. For the same reason, the “peak point” of glacier runoff in Dahaerteng will appear at approximately 2030, 2045 and 2050 under RCP2.6, RCP4.5 and RCP8.5.
Studies indicate that the “peak point” depends on the warming rate and glacier area. In this study, Figure 3 shows that the change rate of temperature is approximately the same in each basin. Therefore, we analyzed the relationship between the “peak point” and glacier features in all subbasins. The results show that the time of the “peak point” is positively correlated with the mean glacier area, with an R2 of 0.86 (p < 0.01). This result agrees with the conclusions in other regions that regional peak glacier runoff depends on large glaciers. Furthermore, the time of the “peak point” was also positively correlated with the total glacier area (R2 0.75, p < 0.01) and the coverage of glaciers (R2 0.51, p > 0.05) because most of the glaciers were clustered together in the study region, and the clustered small glaciers had the same performance as the large glaciers against climate change.
3.5. Contribution of Glacier Runoff
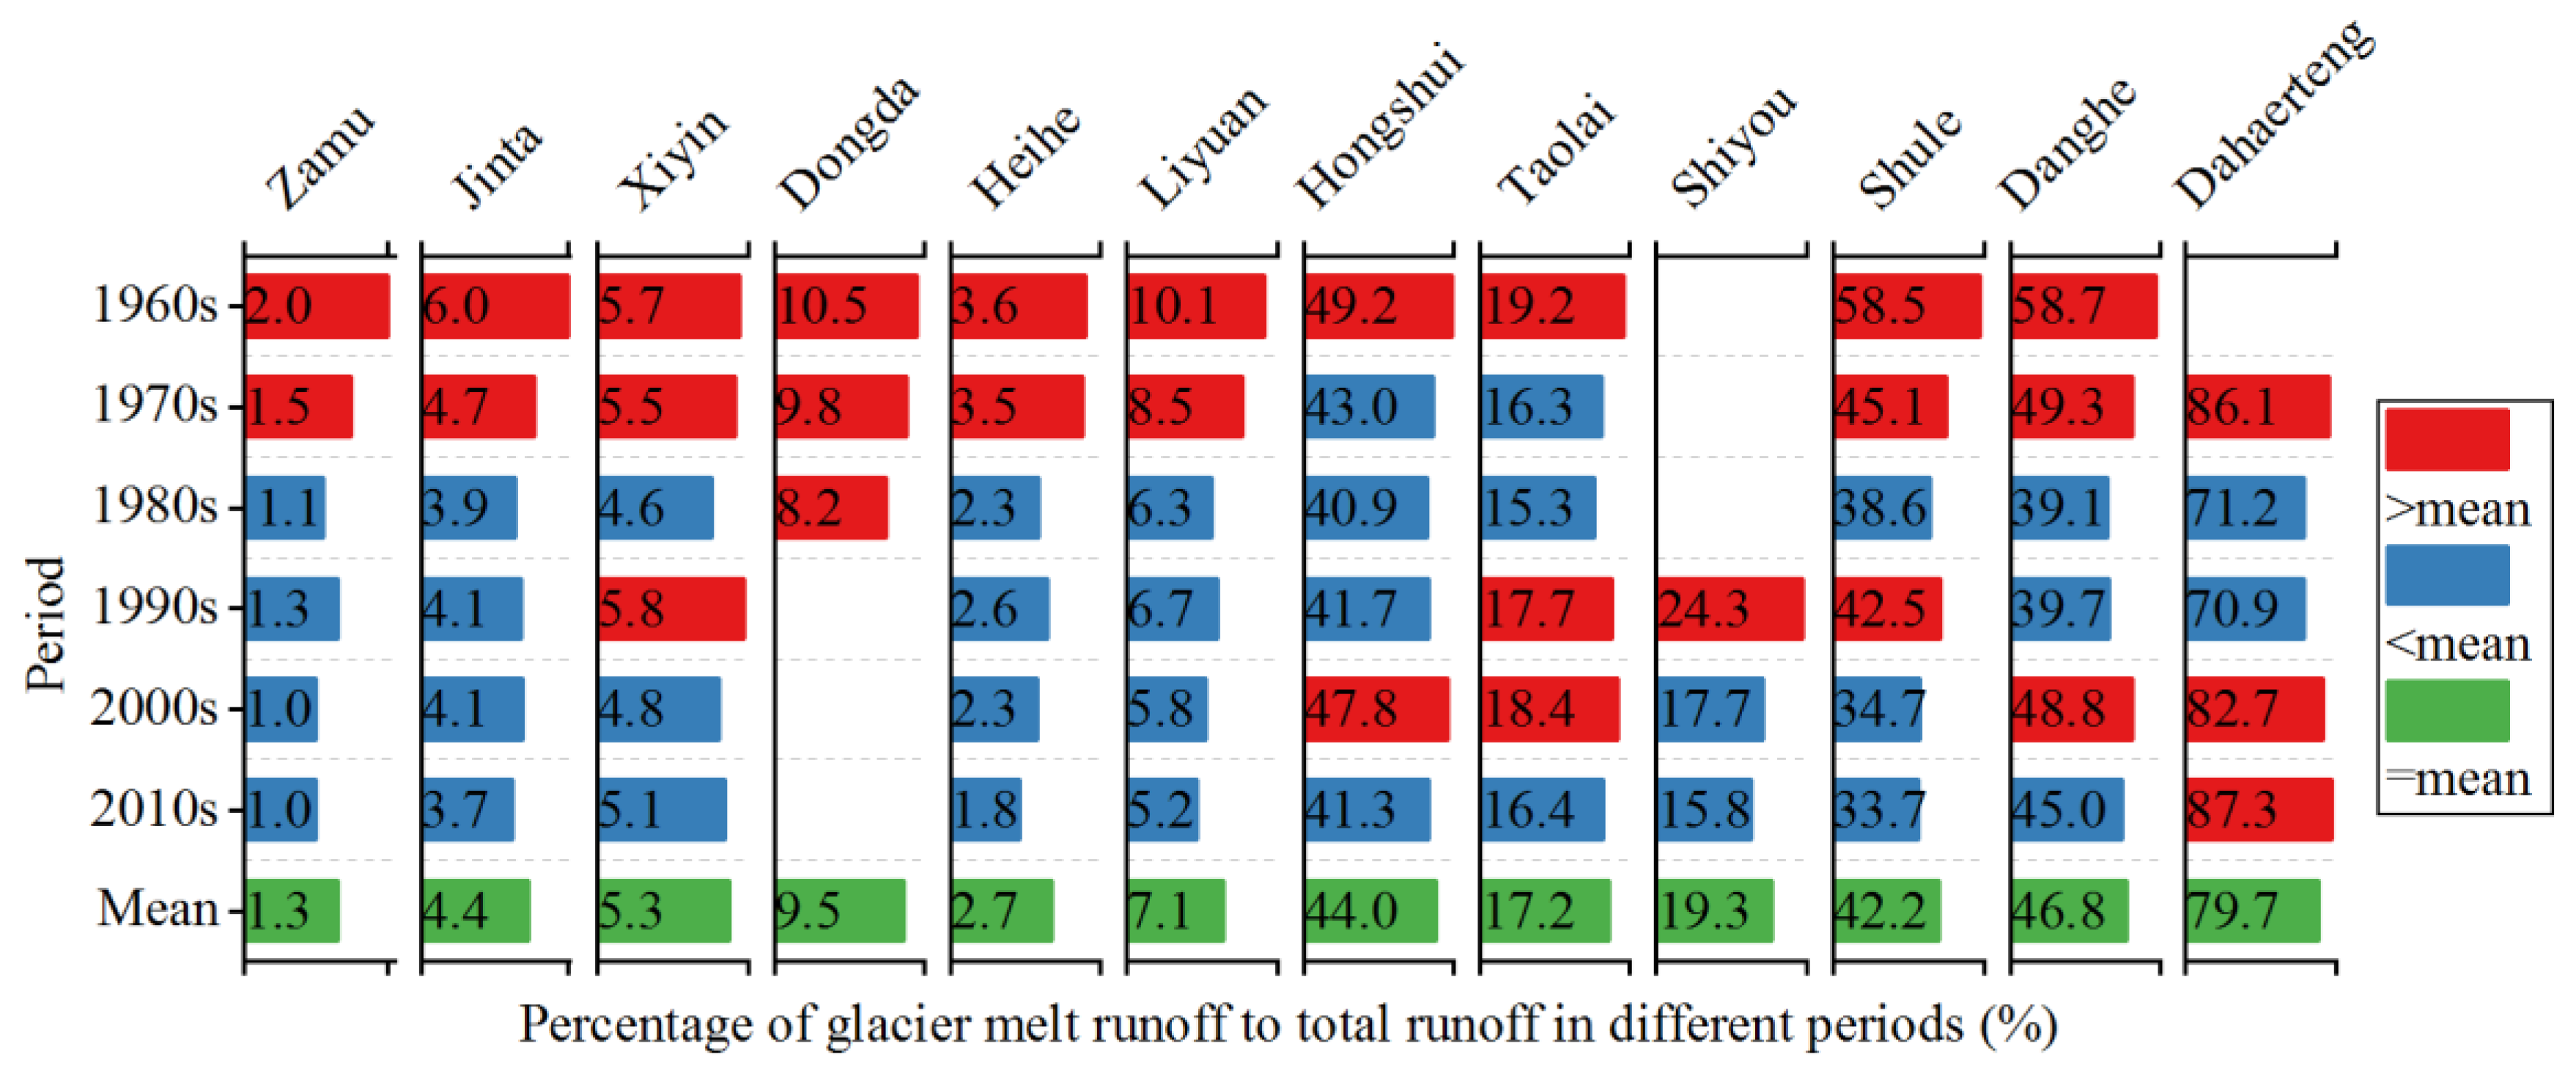
The total runoff of the three inland basins has increased in the past 50 a, but in each subbasin, the glacier runoff contribution was inconsistent with the total runoff. By records of mountain exit hydrologic stations, the total runoff decreased in Jinta, Dongda and Taolai but increased in other subbasins during 1965–2016 (1965–1985 for Dongda; 1990–2016 for Shiyou), except Dahaerteng, in which hydrological stations were removed and there is only a record of average runoff. In the cryosphere, increasing total runoff in the basin is not only due to increased precipitation but is also affected by cryospheric elements such as glaciers and snow cover melting. Here, we analyzed the dynamic contribution of glacier runoff to total runoff in 12 subbasins (Figure 8). For all four subbasins in the SYRB and Heihe and Liyuan in the HHRB, the glacier runoff contribution rate roughly decreased from 1965–2016, although it was slightly higher in the 1990s, and, except for Xiyin, the rates of other basins were reduced by almost 50% from 1965–1969 to 2011–2016. In Hongshui, Taolai, Shiyou, Shule and Dongda, the trend of the glacier runoff contribution rate is similar to that of the abovementioned subbasins, but the difference is that the rates of these basins in the 1990s and 2020s are higher or close to the mean value of multiple years. In Dahaerteng, because the available river flow is the mean value, the glacier runoff contribution rate only represented the change in glacier runoff.
Overall, the results show that the mean contribution rate of glacier runoff varies and ranges from 1.3% (Zamu) to 79.7% (Dahaerteng) in all subbasins. The details in Figure 8 show that the percent of glacier runoff relative to stream discharge is larger from east to west. To explore the reasons for the spatial difference in the contribution of glacier runoff, we analyzed the R2 between the percent of glacier runoff to river flow and total glacier area as 0.56 (p < 0.01), and the R2 between glacier runoff percentage and area percentage was 0.50 (p < 0.01). In addition, the analysis results also show that the R2 between glacier runoff contribution and the average glacier area is 0.84. The upper results show that the contribution of glaciers was determined by glacierization in each subbasin, and large glaciers played a key role in releasing more water than small glaciers with the same area reduction by the principle of glacier area-volume. Furthermore, the contribution of more runoff was also affected by regional precipitation. In this study, the contribution was larger in the basin with less precipitation. Fang Gonghuan [54] came to opposite results in the study of glacier runoff in the Tarim Basin, which shows that the contribution of glacier runoff is higher in southern subbasins with more precipitation; however, they ignored that glacierization is also higher in southern than northern subbasins, and precipitation may be a secondary factor.
4. Discussion
4.1. Glacial Runoff Features Shaped by Climate
Numerous studies have demonstrated that basin-scale glacier meltwater trends are related to total glacier area and to large glaciers [1]. The contribution of glacier meltwater is higher, and the inflection point occurs later in watersheds with larger total glacier areas and a larger proportion of large glaciers in the watershed [3]. In the last few decades, glacial meltwater has been on the rise because most of the regions have not yet reached the inflection point, which has led to an increasing contribution of glacial meltwater [21]. In basins where glacial meltwater has peaked and started to decline, the contribution of glacial meltwater has gradually decreased [3]. In contrast to these flows, the climate of the Qilian Mountains studied in this paper experienced a cooling trend around the 1980s, so there was also a short-term downward trend in glacial meltwater, with an overall increasing–decreasing–increasing trend rather than a more general increasing–decreasing or continuous decreasing trend.
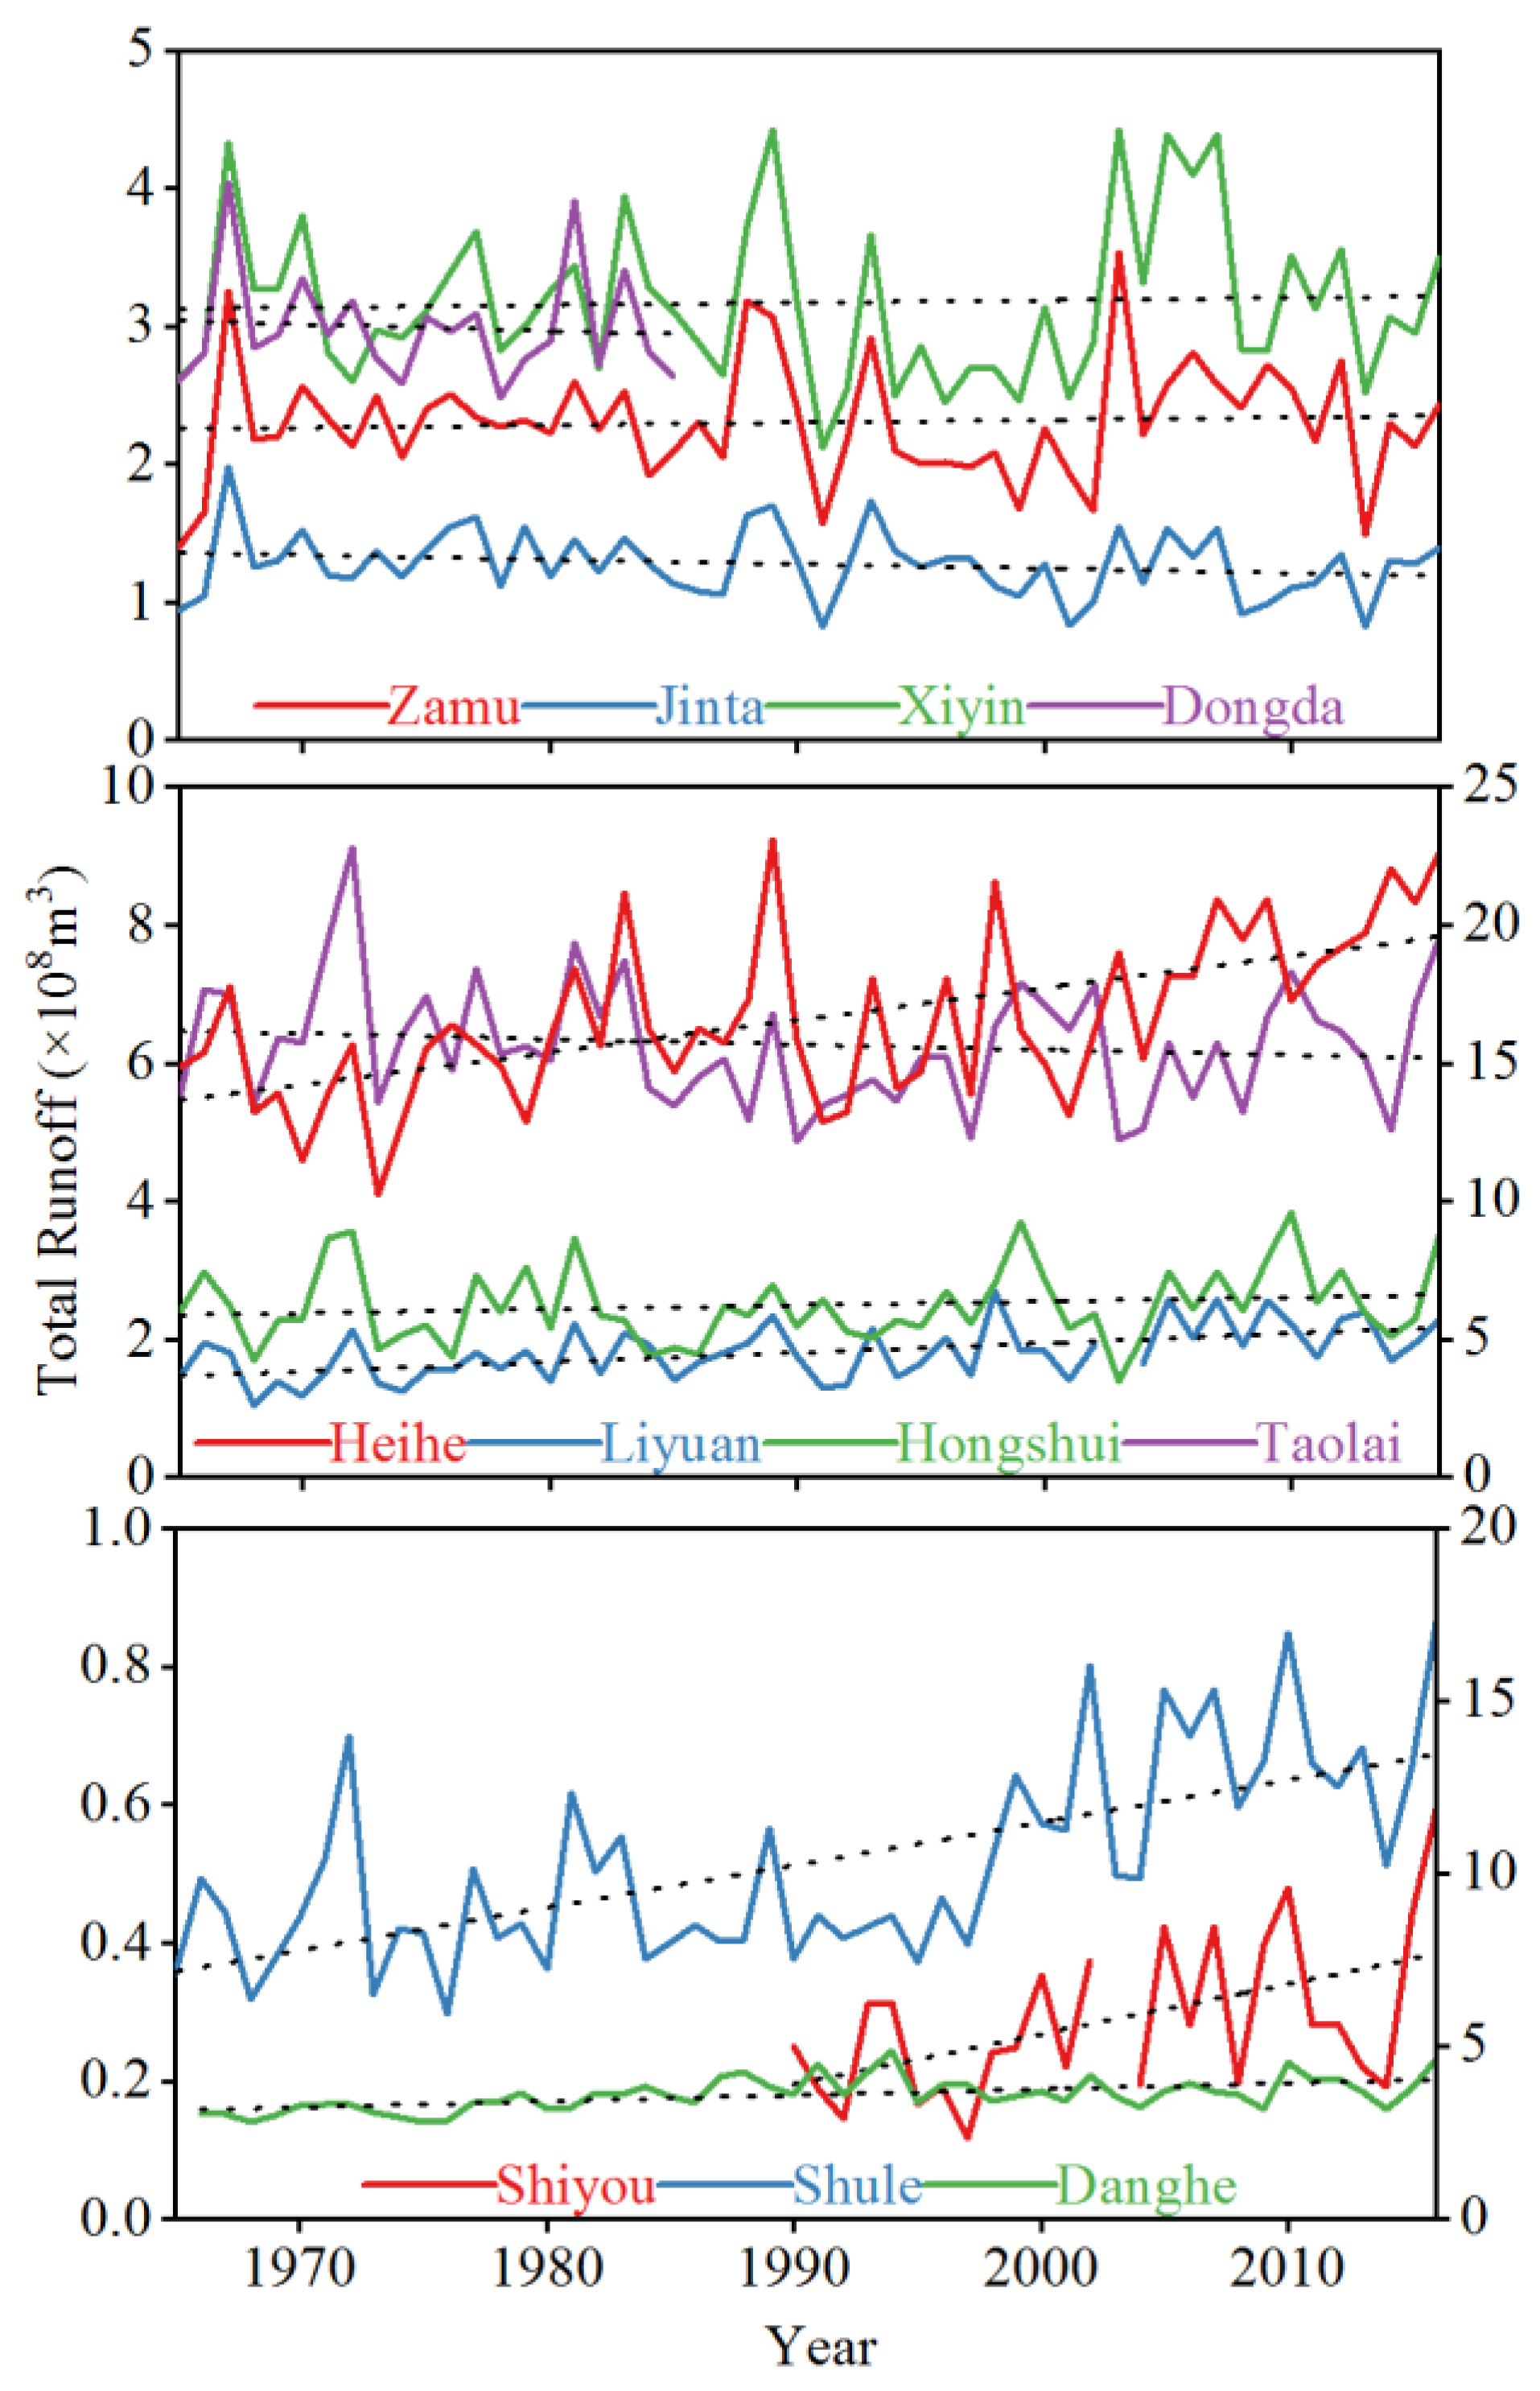
All 12 watersheds studied in this paper originate in the Qilian Mountains and precipitation is a major component of the watershed water resources. Therefore, changes in the total water resources of the basins due to changes in precipitation are also a major influence on the contribution of glacial runoff. Figure 9 shows the total runoff of each subbasin. In particular, in the east-central basins, where glacial meltwater is a lower component, the increase in basin runoff due to increased precipitation is greater than the increase in glacial meltwater, e.g., the runoff in the Heihe and Liyuan river basins has increased by 44% and 46%, respectively, over the past 50 a. Therefore, in these basins, the contribution of glacial meltwater is still smaller than the multiyear average, even during the peak water stage. In the western Hongshui and Taolai basins, the contribution of glacial meltwater only increases slightly when the meltwater is at its peak and the basin runoff is in a relatively dry period. Chen Rensheng [41] and Li Kailu [55] estimated the water resources in the study area by a model which indicates that runoff will continue to increase in the future, and more glaciers will pass the meltwater inflection point, so it is expected that the contribution of glacial meltwater will continue to decrease in these basins.
4.2. Scale Differences in the Representation of Glacial Runoff Results
The glaciers in this study area belong to Central Asia in the RGI Glacier Division. A Bliss study showed that the total glacial meltwater in this region decreased after 2000 [21]. In China, the three basins are collectively referred to as the Hexi Inland River, and if glacier runoff is aggregated for the whole region, it can be found that the regional total glacier meltwater trends are similar to those in the Hongshui, Taolai, Shiyou, Shule and Danghe basins. This is due to the consistent trends in these basins and the fact that glacier runoff accounts for 65–72% of the total glacier meltwater (sum of 12 subbasins), so the glacier runoff characteristics of other subbasins are not at all visible in the regional results. The same conclusion can be drawn from the aggregated results at the basin scale: the basin glacier runoff characteristics depend only on the subbasin with the highest glacier runoff volume. SYRB depends on Dongdahe, HHRB on Hongshui and Taolai, and SLRB on Shule and Dahaerteng.
The scale differences in the resulting expressions are more pronounced in the glacial meltwater contribution. For the entire Hexi Inland River (sum of 11 subbasins except Dahaerteng), the proportion of glacial runoff to total runoff for the last 50 a is 17.6%. The results of the three basins individually show that the contributions of glacial meltwater to total runoff in the SYRB, HHRB and SLRB basins are 4.2%, 9.9% and 40.7%, respectively. There are thus significant differences in glacier contributions from subbasins to basins and regions, and the large-scale results are not dominated by the single subunit results.
In watershed water management, subbasins are usually the most basic management units. The above results suggest that large-scale glacier runoff results should not be used directly to determine subbasin glacier runoff characteristics. Even within the same subbasin, the role of glacial meltwater in water resources varies from upstream to downstream due to the presence of continuous tributary inflows or outflows. Therefore, studies of glacier meltwater should focus more on specific subbasins or some critical hydrological stations. Accordingly, the glacier model should essentially have the ability to simulate glaciers and their meltwater changes on each single glacier.
5. Conclusions
Assessment of the impact of glacial change runoff on watershed water resources can help water managers respond to potential water crises under climate change. Especially for arid and semiarid regions, glacial meltwater may have an important influence on the sustainability of regional water resources. Herein, we simulated glacial changes and meltwater runoff in three inland river basins and 12 subbasins in the northern Qilian Mountains from 1965 to 2099 using the degree-day model. The model results show that glacier meltwater changes in the study area are mainly influenced by temperature changes, showing a decreasing–increasing–decreasing trend, and most of the basins have already experienced the “peak point”. The contribution of glacial meltwater was evaluated using hydrological station runoff series. The results showed that the average contribution of the 12 subbasins over the past 50 years ranged from 1.3% to 46.8% and the contribution of glacial meltwater decreased due to the increase in precipitation, which led to the total runoff growth rate of the basin being higher than the glacial runoff growth rate. Furthermore, the decreasing trend will be more obvious in the future.
We also discuss the scale differences in glacial meltwater trends, the timing of peak points and contribution rates. The results show that there are large differences in the aggregated results by region, basin and subbasin. The regional and basin meltwater trends and peak points are mainly controlled by subbasins with high glacier meltwater volumes. In contrast, the contribution of glacial meltwater at large scales is not directly related to each subbasin. In conclusion, this paper suggests that glacier-hydrological studies should focus more on basic hydrological units because the results of large-scale studies may be misleading for local water resource management.
Author Contributions
G.L. built the model and simulated the glacier change, and wrote the paper; R.C.: Writing—review and editing; K.L.: Data collection. All authors have read and agreed to the published version of the manuscript.
Funding
This study was supported primarily by the National Key Research and Development Program of China (2019YFC1510500) and National Natural Science Foundation of China (NSFC) (41690141).
Institutional Review Board Statement
Not applicable.
Informed Consent Statement
Not applicable.
Data Availability Statement
Data sharing not applicable.
Acknowledgments
The authors thank all team members in Qilian Alpine Ecology and Hydrology Research Station.
Conflicts of Interest
The authors declare no conflict of interest.
References
- Radić, V.; Hock, R. Glaciers in the Earth’s hydrological cycle: Assessments of glacier mass and runoff changes on global and regional scales. Surv. Geophys. 2014, 35, 813–837. [Google Scholar] [CrossRef]
- Milner, A.M.; Khamis, K.; Battin, T.J.; Brittain, J.E.; Barrand, N.E.; Füredere, L.; Cauvy-Fraunie’, S.; Gislason, G.M.; Jacobsen, D.; Hannah, D.M.; et al. Glacier shrinkage driving global changes in downstream systems. Proc. Natl. Acad. Sci. USA 2017, 114, 9770–9778. [Google Scholar] [CrossRef] [Green Version]
- Huss, M.; Hock, R. Global-scale hydrological response to future glacier mass loss. Nat. Clim. Chang. 2018, 8, 135–140. [Google Scholar] [CrossRef] [Green Version]
- Ding, Y.; Zhan, Q.; Wu, J.; Zhang, S.; Wang, S.; Chang, Y.; Li, X.; Shangguan, D.; Han, H.; Qin, J.; et al. The future changes of Chinese cryospheric hydrology and their impacts on water security in arid areas. J. Glacio. Geocryo. 2020, 42, 23–32. (In Chinese) [Google Scholar]
- Hugonnet, R.; McNabb, R.; Berthier, E.; Menounos, B.; Nuth, C.; Girod, L.; Kääb, A. Accelerated global glacier mass loss in the early twenty-first century. Nature 2021, 592, 726–731. [Google Scholar] [CrossRef] [PubMed]
- Zemp, M.; Huss, M.; Thibert, E.; Eckert, N.; McNabb, R.; Huber, J.; Barandun, M.; Machguth, H.; Nussbaumer, S.U.; Gärtner-Roer, I.; et al. Global glacier mass changes and their contributions to sea-level rise from 1961 to 2016. Nature 2019, 568, 382–386. [Google Scholar] [CrossRef]
- Dyurgerov, M.; Bring, A.; Destouni, G. Integrated assessment of changes in freshwater inflow to the Arctic Ocean. J. Geophys. Res. Atmos. 2010, 115, D12. [Google Scholar] [CrossRef]
- Nummelin, A.; Ilicak, M.; Li, C.; Smedsrud, L.H. Consequences of future increased Arctic runoff on Arctic Ocean stratification, circulation, and sea ice cover. J. Geophys. Res. Oceans 2016, 121, 617–637. [Google Scholar] [CrossRef] [Green Version]
- Neal, E.G.; Hood, E.; Smikrud, K. Contribution of glacier runoff to freshwater discharge into the Gulf of Alaska. Geophys. Res. Lett. 2010, 37, L06404. [Google Scholar] [CrossRef] [Green Version]
- Huss, M. Present and future contribution of glacier storage change to runoff from macroscale drainage basins in Europe. Water Resour. Res. 2011, 47, W07511. [Google Scholar] [CrossRef] [Green Version]
- Schaner, N.; Voisin, N.; Nijssen, B.; Lettenmaier, D.P. The contribution of glacier melt to streamflow. Environ. Res. Lett. 2012, 7, 034029. [Google Scholar] [CrossRef]
- Jones, D.B.; Harrison, S.; Anderson, K.; Whalley, W.B. Rock glaciers and mountain hydrology: A review. Earth-Sci. Rev. 2019, 193, 66–90. [Google Scholar] [CrossRef]
- Pritchard, H.D. Asia’s glaciers are a regionally important buffer against drought. Nature 2017, 545, 169–174. [Google Scholar] [CrossRef] [PubMed]
- Pritchard, H.D. Asia’s shrinking glaciers protect large populations from drought stress. Nature 2019, 569, 649–654. [Google Scholar] [CrossRef] [PubMed]
- Shean, D.E.; Bhushan, S.; Montesano, P.; Rounce, D.R.; Arendt, A.; Osumanoglu, B. A systematic, regional assessment of high mountain Asia glacier mass balance. Front. Earth Sci. 2020, 7, 363. [Google Scholar] [CrossRef] [Green Version]
- Hodson, A.J.; Gurnell, A.M.; Washington, R.; Tranter, M.; Clark, M.J.; Hagen, J.O. Meteorological and runoff time-series characteristics in a small, high-Arctic Glaciated Basin, Svalbard. Hydrol. Process. 1998, 12, 509–526. [Google Scholar] [CrossRef]
- Takahashi, S.; Sugiura, K.; Kameda, T.; Enomoto, H.; Kononov, Y.; Aranicheva, M.D.; Kapistin, G. Response of glaciers in the Suntar-Khayata range, eastern Siberia, to climate change. Ann. Glaciol. 2011, 52, 185–192. [Google Scholar] [CrossRef] [Green Version]
- Liljedahl, A.K.; Gädeke, A.; O’Neel, S.; Gatesman, T.A.; Douglas, T.A. Glacierized headwater streams as aquifer recharge corridors, subarctic Alaska. Geophys. Res. Lett. 2017, 44, 6876–6885. [Google Scholar] [CrossRef] [Green Version]
- Ayala, Á.; Farías-Barahona, D.; Huss, M.; Pellicciotti, F.; McPhee, J.; Farinotti, D. Glacier runoff variations since 1955 in the Maipo River basin, in the semiarid Andes of central Chile. Cryosphere 2020, 14, 2005–2027. [Google Scholar] [CrossRef]
- Salzmann, N.; Huggel, C.; Rohrer, M.; Stoffel, M. Data and knowledge gaps in glacier, snow and related runoff research-A climate change adaptation perspective. J. Hydrol. 2014, 518, 225–234. [Google Scholar] [CrossRef] [Green Version]
- Bliss, A.; Hock, R.; Radić, V. Global response of glacier runoff to twenty-first century climate change. J. Geophys. Res. Earth 2014, 119, 717–730. [Google Scholar] [CrossRef]
- Brunner, M.I.; Farinotti, D.; Zekollari, H.; Huss, M.; Zappa, M. Future shifts in extreme flow regimes in Alpine regions. Hydrol. Earth Syst. Sci. 2019, 23, 4471–4489. [Google Scholar] [CrossRef] [Green Version]
- Miles, E.; McCarthy, M.; Dehecq, A.; Marin, K.; Fugger, S.; Pellicciotti, F. Health and sustainability of glaciers in High Mountain Asia. Nat. Commun. 2021, 12, 1–10. [Google Scholar] [CrossRef] [PubMed]
- Zemp, M. Global Glacier Changes: Facts and Figures; UNEP/Earthprint: Nairobi, Kenya, 2008. [Google Scholar]
- Kogutenko, L.; Severskiy, I.; Shahgedanova, M.; Lin, B. Change in the extent of glaciers and glacier runoff in the chinese Sector of the Ile River Basin between 1962 and 2012. Water 2019, 11, 1668. [Google Scholar] [CrossRef] [Green Version]
- Van Pelt, W.J.J.; Pohjola, V.A.; Pettersson, R.; Ehwald, L.E.; Reijmer, G.H.; Boot, W.; Jakobs, C.L. Dynamic response of a High Arctic glacier to melt and runoff variations. Geophys. Res. Lett. 2018, 45, 4917–4926. [Google Scholar] [CrossRef] [Green Version]
- Luo, Y.; Wang, X.; Piao, S.; Sun, L.; Ciais, P.; Zhang, Y.; Ma, C.; Gan, R.; He, C. Contrasting streamflow regimes induced by melting glaciers across the Tien Shan-Pamir-North Karakoram. Sci. Rep. 2018, 8, 1–9. [Google Scholar] [CrossRef] [PubMed]
- Zhang, Y.; Xu, C.; Hao, Z.; Zhang, L.; Ju, Q.; Lai, X. Variation of melt water and rainfall runoff and their impacts on streamflow changes during recent decades in two Tibetan Plateau Basins. Water 2020, 12, 3112. [Google Scholar] [CrossRef]
- Zhang, S.; Gao, X.; Zhang, X. Glacial runoff likely reached peak in the mountainous areas of the Shiyang River Basin, China. J. Mt. Sci. 2015, 12, 382–395. [Google Scholar] [CrossRef]
- Shafeeque, M.; Luo, Y.; Wang, X.; Sun, L. Altitudinal distribution of meltwater and its effects on glacio-hydrology in glacierized catchments, central Asia. J. Am. Water. Resour. As. 2020, 56, 30–52. [Google Scholar] [CrossRef]
- Engelhardt, M.; Schuler, T.V.; Andreassen, L.M. Contribution of snow and glacier melt to discharge for highly glacierised catchments in Norway. Hydrol. Earth Syst. Sci. 2014, 18, 511–523. [Google Scholar] [CrossRef] [Green Version]
- Annual Hydrolocgical Report, China. Hydrological Data of Inland Rivers. Inland Rivers of Hexi Region in Gansu Province; Department of Hydrology, Ministry of Water Resources: Beijing, China, 2019; Volume 10, No. 5.
- Shi, Y.; Shen, Y.; Hu, R. Preliminary study on signal, impact and foreground of climatic shift from warm-dry to warm-humid in Northwest China. J. Glaciol. Geocryol. 2002, 24, 219–226. (In Chinese) [Google Scholar]
- Wang, L.; Chen, R.; Han, C.; Wang, X.; Liu, G.; Song, Y.; Yang, Y.; Liu, J.; Liu, Z.; Liu, X.; et al. Change characteristics of precipitation and temperature in the Qilian Mountains and Hexi Oasis, Northwestern China. Environ. Earth Sci. 2019, 78, 1–13. [Google Scholar] [CrossRef]
- Hock, R. Temperature index melt modelling in mountain areas. J. Hydrol. 2003, 282, 104–115. [Google Scholar] [CrossRef]
- Hock, R. Glacier melt: A review of processes and their modelling. Prog. Phys. Geog. 2005, 29, 362–391. [Google Scholar] [CrossRef]
- Bahr, D.B.; Meier, M.F.; Peckham, S.D. The physical basis of glacier volume-area scaling. J. Geophys. Res. Solid Earth 1997, 102, 20355–20362. [Google Scholar] [CrossRef]
- Guo, W.; Liu, S.; Xu, J.; Wu, L.; Shangguan, D.; Yao, X.; Jiang, Z. The second Chinese glacier inventory: Data, methods and results. J. Glaciol. 2015, 61, 357–372. [Google Scholar] [CrossRef] [Green Version]
- Berthier, E.; Arnaud, Y.; Kumar, R.; Ahmad, S.; Wagnon, P.; Chevallier, P. Remote sensing estimates of glacier mass balances in the Himachal Pradesh (Western Himalaya, India). Remote. Sens. Environ. 2007, 108, 327–338. [Google Scholar] [CrossRef] [Green Version]
- Han, C. Preliminary Study of Hydroligical Process in Alpine Cold Desert. Master’s Thesis, Cold and Arid Regions Environmental and Engineering Research Institute, Chinese Academy of Sciences, Lanzhou, China, 2010. (In Chinese). [Google Scholar]
- Chen, R.; Wang, G.; Yang, Y.; Liu, J.; Han, C.; Song, Y.; Kang, E. Effects of cryospheric change on alpine hydrology: Combining a model with observations in the upper reaches of the Hei River, China. J. Geophys. Res. Atmo. 2018, 123, 3414–3442. [Google Scholar] [CrossRef]
- Huss, M.; Hock, R. A new model for global glacier change and sea-level rise. Front. Earth Sci. 2015, 3, 1–22. [Google Scholar] [CrossRef] [Green Version]
- Zhang, Y.; Liu, S.; Ding, Y. Observed degree-day factors and their spatial variation on glaciers in western China. Ann. Glaciol. 2006, 43, 301–306. (In Chinese) [Google Scholar] [CrossRef] [Green Version]
- Chen, R.; Kang, E.; Ding, Y. Some knowledge on and parameters of China’s alpine hydrology. Adv. Water Sci. 2014, 25, 307–317. (In Chinese) [Google Scholar]
- Shi, Y.; Liu, C.; Kang, E. The glacier inventory of China. Ann. Glaciol. 2009, 50, 1–4. [Google Scholar] [CrossRef] [Green Version]
- Han, C.; Chen, R.; Liu, Z.; Yang, Y.; Liu, J.; Song, Y.; Wang, L.; Liu, G.; Guo, S.; Wang, X. Cryospheric hydrometeorology observation in the Hulu catchment (CHOICE), Qilian Mountains, China. Vadose Zone J. 2018, 17, 1–18. [Google Scholar] [CrossRef]
- Hempel, S.; Frieler, K.; Warszawski, L.; Pointek, F. A trend-preserving bias correction–the ISI-MIP approach. Earth Syst. Dynam. 2013, 4, 219–236. [Google Scholar] [CrossRef] [Green Version]
- Su, B.; Huang, J.; Zeng, X.; Gao, C.; Jiang, T. Impacts of climate change on streamflow in the upper Yangtze River Basin. Climatic Change 2017, 141, 533–546. [Google Scholar] [CrossRef]
- Khadka, D.; Babel, M.S.; Shrestha, S.; Tripathi, N.K. Climate change impact on glacier and snow melt and runoff in Tamakoshi Basin in the Hindu Kush Himalayan (HKH) region. J. Hydrol. 2014, 511, 49–60. [Google Scholar] [CrossRef]
- Liu, Y.; Qin, X.; Zhang, T.; Zhang, M.; Du, W. Variation of the Niqngchan River Glacier No.3 in the Lenglongling range, east Qilian Mountains. J. Glaciol. Geocryol. 2012, 34, 1031–1036. (In Chinese) [Google Scholar]
- Cao, B. Glacier Changes in the Lenglongling Mountain, Eastern Qilian Mountain; Lanzhou University: Lanzhou, China, 2013. (In Chinese) [Google Scholar]
- Wang, S.; Yao, T.; Pu, J. Spatial and temporal variations in mass balance of Qiyi Glacier in Qilian Mountains. J. Nat. Resour. 2020, 35, 399–412. (In Chinese) [Google Scholar]
- Liu, Y.; Qin, X.; Chen, J.; Li, Z.; Wang, J.; Du, W.; Guo, W. Variations of Laohugou Glacier No. 12 in the western Qilian Mountains, China, from 1957 to 2015. J. Mt. Sci. 2018, 15, 25–33. [Google Scholar] [CrossRef]
- Fang, G.; Yang, J.; Chen, Y.; Li, Z.; Ji, H.; Maeyer, P.D. How hydrologic processes differ spatially in a large basin: Multisite and multiobjective modeling in the Tarim River Basin. J. Geophys. Res. Atmos. 2018, 123, 7089–7113. [Google Scholar] [CrossRef]
- Li, K.; Chen, R.; Liu, G. Cryosphere water resources simulation and service function evaluation in the Shiyang River Basin of Northwest China. Water 2021, 13, 114. [Google Scholar] [CrossRef]
Figure 1.
The distribution of three inland river basins, Shule river basin, Heihe river basin, Shiyang river basin, and 12 subbasins includes: 1. Zamu River; 2. Jinta River; 3. Xiyin River; 4. Dongda River; 5. Heihe River; 6. Liyuan River; 7. Hongshui River; 8. Taolai River; 9. Shiyou River; 10. Shule River; 11. Danghe River; 12. Dahaerteng River. The blue speckles and lines represent the glaciers and rivers, the red inverted triangles are the first control gauging station along each river.

Figure 2.
The calibration scheme.

Figure 3.
Validation of meteorological data for model input. (a) interpolated temperature, (b) calculated PDD, (c) interpolated precipitation, (d) separated rain; solid and dashed lines are the fitted and the 1:1 line, respectively.
Figure 3.
Validation of meteorological data for model input. (a) interpolated temperature, (b) calculated PDD, (c) interpolated precipitation, (d) separated rain; solid and dashed lines are the fitted and the 1:1 line, respectively.

Figure 4.
Validation of modelled glacier area. The observed glacier area includes 5 glaciers randomly selected in the QLM. In figure (a,b), the geometrical symbol represents the intermittently observed glacier area. In figure (b), the line represents a simulated trajectory of glacier area change. Among them, the Laohugou Glacier No.12 is referenced to the right axis.

Figure 5.
Change rate of temperature and precipitation during 1965~2055 in three basins.

Figure 6.
The area changes of total glaciers in each subbasin from 1965~2100. Each column shows four subbasins from each of the three main basins (SYRB, HHRB and SLRB). In each subplot, the black line represents the historical changes in glacier area from 1965~2016 and the colored lines represent the future changes in glacier area under different GCMs from 2016~2099. For the latter, the green, blue and red lines show the changes under RCP2.6, RCP4.5 and RCP8.5, respectively.

Figure 7.
The area changes of total glacier melt runoff in each subbasin from 1965–2100. The four pictures in each column show subbasins in the same basin, including the SYRB, HHRB and SLRB. In each subbasin, the black line represents the historical changes in glacier runoff from 1965~2016; the colored lines represent the future changes in glacier runoff under different GCMs from 2016~2099; among them, the red line shows the changes in the mean value under RCP2.6, the blue line shows the changes in the mean value under RCP4.5 and the red line shows the changes in the mean value under RCP8.5.

Figure 8.
The contribution of glacier melt runoff in each subbasin at different periods. Note: The bar plot and numbers in each column indicate the ratio changes of each subbasin during 1965–2016. The red bar indicates that the ratio in the corresponding period is larger than the mean ratio (green bar) at all times; additionally, the blue bar means that the ratio is smaller than the mean value. The total runoff of the Dongda River was missed after the 1990s, and the hydrological station of the Shiyou River was first measured in the 1990s. This situation is showed as blank in the Figure.

Figure 9.
Total runoff of subbasins in 3 basins.


Table 1.
Features of 12 subbasins and the glaciers in each basin.
| Basin | Subbasin | Average Glacier Area (km2) | Total Glacier Area (km2) | Basin Area (km2) | Mean Runoff (×108 m3 a−1) |
|---|---|---|---|---|---|
| SYRB | Zamu | 0.27 | 3.75 | 851 | 2.30 |
| Jinta | 0.31 | 6.72 | 841 | 1.28 | |
| Xiyin | 0.49 | 19.77 | 1454 | 3.17 | |
| Dongda | 0.55 | 34.4 | 1546 | 2.99 | |
| HHRB | Heihe | 0.28 | 58.9 | 10,009 | 16.62 |
| Liyuan | 0.28 | 16.28 | 1080 | 1.81 | |
| Hongshui | 0.65 | 125.62 | 1581 | 2.50 | |
| Taolai | 0.42 | 137.89 | 7480 | 6.27 | |
| SLRB | Shiyou | 0.38 | 6.38 | 656 | 0.29 |
| Shule | 1.07 | 469.52 | 10,961 | 10.32 | |
| Danghe | 0.78 | 233.83 | 14,325 | 3.60 | |
| Dahaerteng | 2.25 | 301.44 | 6112 | 2.98 |
Publisher’s Note: MDPI stays neutral with regard to jurisdictional claims in published maps and institutional affiliations. |
© 2021 by the authors. Licensee MDPI, Basel, Switzerland. This article is an open access article distributed under the terms and conditions of the Creative Commons Attribution (CC BY) license (https://creativecommons.org/licenses/by/4.0/).
Share and Cite
MDPI and ACS Style
Liu, G.; Chen, R.; Li, K. Glacial Change and Its Hydrological Response in Three Inland River Basins in the Qilian Mountains, Western China. Water 2021, 13, 2213. https://doi.org/10.3390/w13162213
AMA Style
Liu G, Chen R, Li K. Glacial Change and Its Hydrological Response in Three Inland River Basins in the Qilian Mountains, Western China. Water. 2021; 13(16):2213. https://doi.org/10.3390/w13162213
Chicago/Turabian StyleLiu, Guohua, Rensheng Chen, and Kailu Li. 2021. "Glacial Change and Its Hydrological Response in Three Inland River Basins in the Qilian Mountains, Western China" Water 13, no. 16: 2213. https://doi.org/10.3390/w13162213
Note that from the first issue of 2016, this journal uses article numbers instead of page numbers. See further details here.