
Regional and Seasonal Precipitation and Drought Trends in Ganga–Brahmaputra Basin


1
State Key Laboratory of Information Engineering in Surveying, Mapping, and Remote Sensing, Wuhan University, Wuhan 430079, China
2
National Engineering Research Center of Geographic Information System, China University of Geosciences (Wuhan), Wuhan 430074, China
3
School of Geography and Information Engineering, China University of Geosciences (Wuhan), Wuhan 430074, China
*
Author to whom correspondence should be addressed.
Water 2021, 13(16), 2218; https://doi.org/10.3390/w13162218
Submission received: 1 July 2021
/
Revised: 6 August 2021
/
Accepted: 12 August 2021
/
Published: 14 August 2021
(This article belongs to the Special Issue Hydrological Extremes under Climate Change and Socioeconomic Developments in Developing Countries)
Abstract
:Satellite-based precipitation products can be a better alternative of rain gauges for hydro-meteorological studies in data-poor regions. This study aimed to evaluate how regional and seasonal precipitation and drought patterns had changed in the Ganga–Brahmaputra Basin between 1983 and 2020 with PERSIANN-CDR precipitation data. The spatial pattern of winter drought, monsoon drought, and Standardized Precipitation Index (SPI) calculated for different time scales were evaluated using principal component analysis. Ganga–Brahmaputra is one of the most populated river basins that flows through different geographical regions. Rain gauges are heterogeneously distributed in the basin due to its complex orography, highlighting the significance of gridded precipitation products over gauge observations for climate studies. Annual and monthly precipitation trends between 1983 and 2020 were evaluated using the original and modified Mann–Kendall trend test, and annual precipitation in the basin was found to be declining at a rate of 5.8 mm/year. An increasing trend was observed in pre-monsoon rainfall, whereas precipitation exhibited a decreasing trend for other months. Results of the Pettitt test showed precipitation time series was inhomogeneous and changepoint occurred around 2000. Decreasing trends of SPI indicated increasing frequency and intensity of drought events. Winter drought showed a clear spatial pattern in the basin; however, SPIs calculated for different time scales and monsoon drought had complex spatial patterns. This study demonstrates the applicability of satellite-based PERSIANN-CDR precipitation data in climate research in the Ganga–Brahmaputra Basin.
1. Introduction
Precipitation has a significant impact on the environment; vegetation health; crop choices; and, eventually, the economy of an area. Droughts and floods caused by extreme meteorological occurrences account for a substantial share of natural catastrophes; drought-related risks are more devastating than other natural disasters. Accurate prediction of precipitation trends can be useful in disaster management and future economic development [1]. Natural disasters such as droughts, floods, and landslides occur due to change in precipitation patterns [2]. Gauge measurements and gauge-based products are mainly used for meteorological and climate studies worldwide. Even though in situ observation of climate variables such as precipitation, temperature, and soil moisture are considered the most accurate, such products are not efficient for climate studies in data-poor regions such as the Himalayas [3]. Rain gauge measurements are also susceptible to errors due to evaporation, wind, geographical coverage, and other factors. Since the past few decades, gridded precipitation products like satellite-based and reanalysis precipitation products have become available [4,5,6,7,8]. Satellite observations have more complete coverage, especially across seas, high altitudes, and isolated locations where gauge data are few or unavailable [4]. Spatio-temporal coverage of reanalysis and remote sensing-based precipitation estimates make them better alternatives of rain gauges [4,5,9,10,11,12]. Most satellite-based precipitation products such as TRMM [12], IMERG [5], and PERSIANN are available for a short period of time, questioning their significance in climate studies. Although precipitation products such as GPCP and CMAP have been available for a longer time period and they have made significant contributions to climate studies, their capacity to capture geographical details of precipitation events is limited due to their poor spatial and temporal resolution. PERSIANN-CDR was created to offer long-term satellite-based precipitation data with the rigorous spatio-temporal resolution, facilitating meteorological and trend studies [4].
Precipitation patterns around the world are changing as a result of both climate instability and change; such patterns are different across different regions [13]. The presence of a temporal pattern in the precipitation time series can be identified using both parametric and non-parametric tests, but for using parametric trend tests, series must follow a normal distribution [13]. Mann–Kendall (MK) is a nonparametric test used to determine patterns within time-series data [14]. Sen’s slope is also a non-parametric test used to determine the magnitude of trend in hydro-meteorological time-series data [1,15,16]. The non-normality of the data has no effect on the non-parametric tests [17]. MK trend tests have also been used in detecting trends in Standardized Precipitation Index (SPI) [18], Vegetation Condition Index (VCI) [19,20,21], groundwater [22], and other time series data. It determines whether time series data follow a certain increasing or decreasing trend or are random. MK trend test and Sen’s slope have been used to characterize trends in series of precipitation and other climatological data [13,18,23]. After 1970, there were falling trends in seasonal and annual precipitation in India, although precipitation extremes are increasing [13]. Ahmad et al. [1] used the MK trend test and Spearman’s rho test to calculate precipitation trends in Swat Basin, Pakistan. No significant precipitation trends were observed for most of the stations along the Swat River Basin [1]. Sa et al. [24] studied patterns of precipitation extremes in Malaysia with the MK and modified MK trend test. Increasing patterns in precipitation were observed during the northeast monsoon and a declining pattern during the southwest monsoon. Findings indicated that significant increasing trends in 1 h maximum rainfall is increasing the risk of flash floods over time [24]. Bera [25] studied precipitation trends within the Ganga basin using gauge-based products. Curtis et al. [26] studied precipitation variability in the Ganga–Brahmaputra Basin with PERSIANN-CDR data using principal component analysis. Drought is an abnormal deficiency of water [27]; although there are other factors such as increasing temperature and low humidity that exacerbate the effects of drought, precipitation is the major factor that controls its occurrence. The SPI is a versatile and easy-to-calculate drought index [28]; rainfall amount is the only required input parameter to calculate SPI. Furthermore, it is equally useful in analyzing both wet periods/cycles and dry periods/cycles, and it has been used in a myriad of studies to characterize meteorological droughts [18,21,22,29,30].
Individuals and communities relying on farming and agriculture are more vulnerable to changes in precipitation. Such vulnerable communities also need long recovery periods from extreme climate events such as droughts and floods. Altering precipitation patterns can have a direct impact on food production and availability, vegetation health, groundwater storage, etc. Ganga–Brahmaputra is one of the most populated river basins, and agriculture is the main occupation of the people living there. Climate extremes such as floods and droughts are common in this region [31]. Understanding the precipitation trends in Ganga–Brahmaputra Basin is critical for the long-term water management.
This research aims to study annual and seasonal precipitation trends in the Ganga–Brahmaputra Basin with the original and modified MK test. Standardized Precipitation Index (SPI) was calculated with PERSIANN-CDR precipitation data, and MK trend test was used to evaluate the trend of droughts in the basin. Spatial patterns of winter, monsoon, and SPIs calculated at four time scales were studied with principal component analysis. This is the first analysis using PERSIANN-CDR precipitation data to study monthly precipitation trends, drought trends, and spatial patterns of drought in the Ganga–Brahmaputra Basin. The next section of this article provides background information on the Ganga–Brahmaputra Basin, PERSIANN-CDR precipitation data, and methods. The third section presents the findings, which are further discussed in the next section. This paper ends with a conclusion and potential future research directions.
2. Materials and Methods
2.1. Study Area
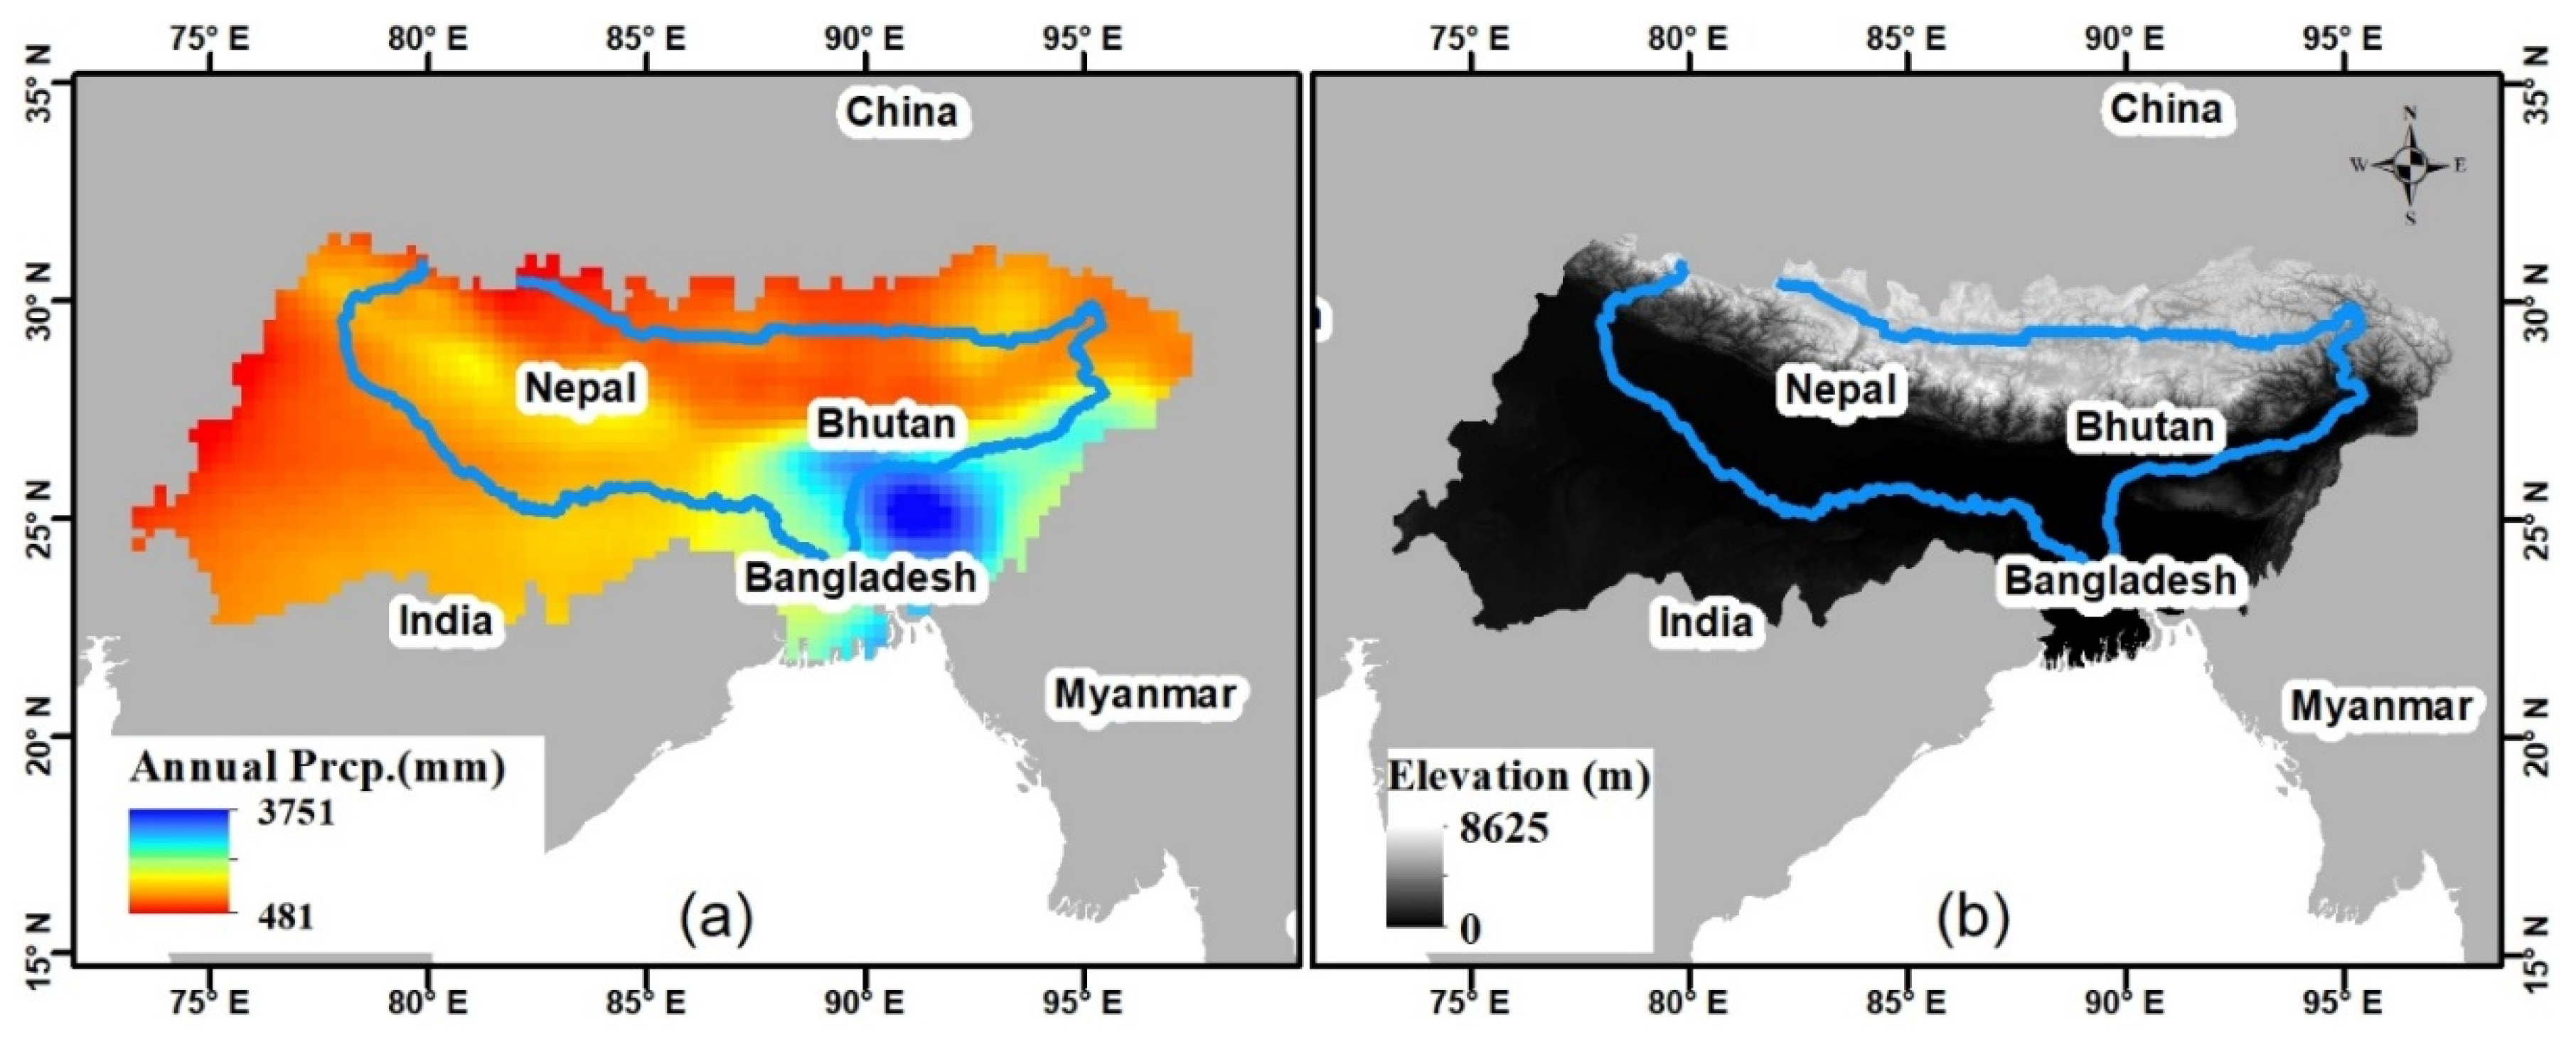
Ganga–Brahmaputra (GB) is considered to be one of the largest trans-boundary river basins flowing through different geographical regions. It is located in the subtropical region from 10 °N to 30 °N. The elevation ranges from sea level (0 m) to Everest (8848 m). Both Ganga and Brahmaputra rivers originate from the Himalayas. After following their due course, the rivers flow through China, Bangladesh, Bhutan, India, and Nepal. Heavy rainfall from June to September is the main source of water in the GB basin, which accounts for more than 80% of annual precipitation [29,31]. The upper mountainous region is less populated, whereas the lower region is relatively populated because of relatively plain agricultural land. In monsoon Asia, moisture flows from the Bay of Bengal and the Arabian sea to the Indian subcontinent because of the temperature difference between land and sea. Deforestation in the Brahmaputra watershed has resulted in increased siltation levels, flash floods, and soil erosion in critical downstream habitat [32]. The Brahmaputra (Yarlung Tsangpo) originates from Northern China and flows to Bangladesh through India, whereas the Ganga originates from Southern India. Major tributaries of the Ganga River are Kosi, Gandaki, Yamuna, Ghagra, Kali, etc., whereas Lhasa, Nyang, Parlung Zangbo, Teesta, etc. are some major tributaries of the Brahmaputra River. The southeastern basin receives more annual rainfall as compared to other regions. Location, along with average annual precipitation and elevation of GB basin, are shown in Figure 1.
Precipitation deficiencies have affected crop yields [33], hydroelectricity generation [34], groundwater storage [35], etc. in the Ganga–Brahmaputra Basin and its tributaries. The effects of change in precipitation patterns on water supplies and farming can differ throughout the basin [34]. The 2008 winter drought in western Nepal affected winter crops, and the impact of the drought was worsened by the late arrival of the 2009 monsoon [36]; wheat and barley yields decreased by nearly half as compared to previous years. 2006 and 2009 droughts had a significant detrimental impact on the groundwater storage in the Ganga–Brahmaputra Basin [35].
2.2. Precipitation Data
Precipitation is one of the key components of the hydrological cycle. The Precipitation Estimation from Remotely Sensed Information using Artificial Neural Networks—Climate Data Record (PERSIANN-CDR) provides daily rainfall estimates at a spatial resolution of 0.25 degrees in the latitude band 60S–60N from 1983 to the near-present and is also prepared and distributed by the Center for Hydrometeorology and Remote Sensing [4,37]. This dataset provides a high-quality climate data record (CDR) of precipitation. PERSIANN-CDR is prepared using the PERSIANN algorithm and is adjusted with GPCP products [4]. PERSIANN-CDR is generated from the PERSIANN algorithm using GridSat-B1 infrared data. It is adjusted using the Global Precipitation Climatology Project (GPCP) monthly product to maintain consistency of the two datasets at 2.5° monthly scale throughout the entire record [4]. More than three decades of precipitation data is required for climate studies as suggested by WMO. PERSIANN-CDR was developed so that a long-term satellite-based precipitation product with robust spatiotemporal resolution can be used in climate studies. This product is generated to ease and facilitate climate change and trend research, having been used in different drought monitoring studies [4]: it depicts a similar drought pattern as derived with gauge precipitation products in China [38]. PERSIANN-CDR precipitation data can be downloaded and visualized from the CHRS data portal.
2.3. Methods
2.3.1. Mann–Kendall Trend Test
Mann–Kendall (MK) is a rank-based nonparametric test to detect trends in time series data [14]. MK test statistics is mathematically defined as
where n is the size of time series data, and and are data in ith and jth times, respectively (i < j). can have three different values: −1 if < 0, 0 if = 0, and +1 if > 0. For large datasets, S statistics is normally distributed with zero mean. If E(S) is the mean and V(S) is the variance of S, standard normal test statistics are defined as [13]
Positive value of a Z-score indicates an increasing trend and vice versa. There can be autocorrelation and seasonality in most of the time-series data such as precipitation. The original MK test does not account for autocorrelation. Various modified MK tests have been developed that account for serial autocorrelation and seasonality in trend analysis, one being the pre_whitening_modification_test [39,40]. Yue and Wang [39] proposed a modified MK test that used pre-whitening to account for and eliminate the effects of serial autocorrelation in time series data. Effect of autocorrelation in precipitation time series is studied with the MMK test. MK and MMK trend is implemented in python package pyMannKendall [40].
2.3.2. Sen’s Slope
The Theil–Sen approach is commonly used to determine the gradient or rate of transition of climate time series data [24,39]. Slopes between all data points are calculated in a time series data as
where and are data in ith and jth times, respectively. A positive slope indicates an increasing trend and vice versa. For x numbers of data in time series, N = x (x − 1)/2 estimates of the slope are obtained. Sen’s slope is the median value of slope estimates.
2.3.3. Pettitt’s Test
Pettitt’s test is applied to detect change point in time series data [41]. It can detect a significant change in the time series without knowing the exact time of occurrence of change [42,43]. Test statistics for Pettitt’s test is described as
where
For significant statistic, the change point of series is at . Pettitt test in python is implemented with package pyHomogeneity [44].
2.3.4. Standardized Precipitation Index (SPI)
Standardized Precipitation Index is a simple, statistically relevant, and meaningful drought index as SPI can be related to groundwater and reservoir storage [45]. The SPI has been recognized as the standard index that should be available worldwide for quantifying and reporting meteorological drought. The SPI can be created for differing periods of 1 to 48 months, using monthly input data. SPI calculated for shorter time scales is used to study drought events impacting vegetation and soil moisture, and SPI calculated for longer time scales is more useful in studying impacts of droughts in surface and groundwater [46]. McKee [28] proposed the definition of drought based upon standardized precipitation, known as SPI. It has been used worldwide with different drought studies [11,18,30,47,48]. Precipitation at the desired location is fitted to probability distribution and transformed to normal distribution while calculating SPI, thus average SPI is zero [28]. The probability density function for Gamma distribution is defined as
where x is precipitation amount, α > 0 is a shape parameter, β > 0 is a scale parameter, x > 0 is the amount of precipitation, and Γ(α) is the gamma function. The maximum likelihood estimation is one of the most commonly used approaches to estimate parameters in probability distribution functions [29]. Maximum likelihood function is defined as
where , and n is the number of months [29].
2.3.5. Principal Component Analysis
In order to study the spatial pattern of drought, we used principal component analysis of SPI (PCA) for different time scales. PCA is essentially a data-reducing technique that generates linearly independent and uncorrelated variables that explain the majority of variance of original variables; it aims to explain majority of variance in data with relatively fewer variables than those in the original dataset [47,49,50]. PCA is used in a number of meteorological and climatological studies. When working with a multidimensional dataset, the user desires to reduce its dimension while minimizing knowledge loss for better explaining, analyzing, and interpreting the data and their structure [46,49]. PCA can be used in identifying spatial patterns of drought. PCA projects original data to a new space and reduces the dimensionality of data. Spatial pattern of drought is identified and studied by different researchers [18,29,42]. Kaiser–Meyer–Olkin Measure Sampling Adequacy and Bartlett’s test of sphericity are performed to identify whether PCA is applicable for SPI values or not [51]. Principal components and loadings are extracted using SPSS software.
3. Results
3.1. Precipitation Trends
3.1.1. Annual Precipitation Trends and Change Points
Annual precipitation trend was analyzed with MK and modified MK trend test for the whole basin and in three different elevation regions: 0–200 m, 200–2000 m, and 2000+ m. Precipitation exhibited decreasing trend in the basin with both MK and MMK trend tests with an approximate slope of −5.08 mm/year, which is about 0.45% of total average annual precipitation in the basin. A large negative slope of −11.6 mm/year was observed in the low elevation region, wherein average annual precipitation was also higher as compared to other regions. Average annual precipitation below 200 m was declining at the rate of 0.67% per year. Proportional to average precipitation amount, the average annual precipitation in the region above 2000 m was declining at the lower rate of 2.21 mm per year, which was about 0.25 percent of the average annual precipitation in that region. Annual precipitation in region with an elevation between 200 to 2000 m was declining at the rate of 4.45 mm per year (0.37%).
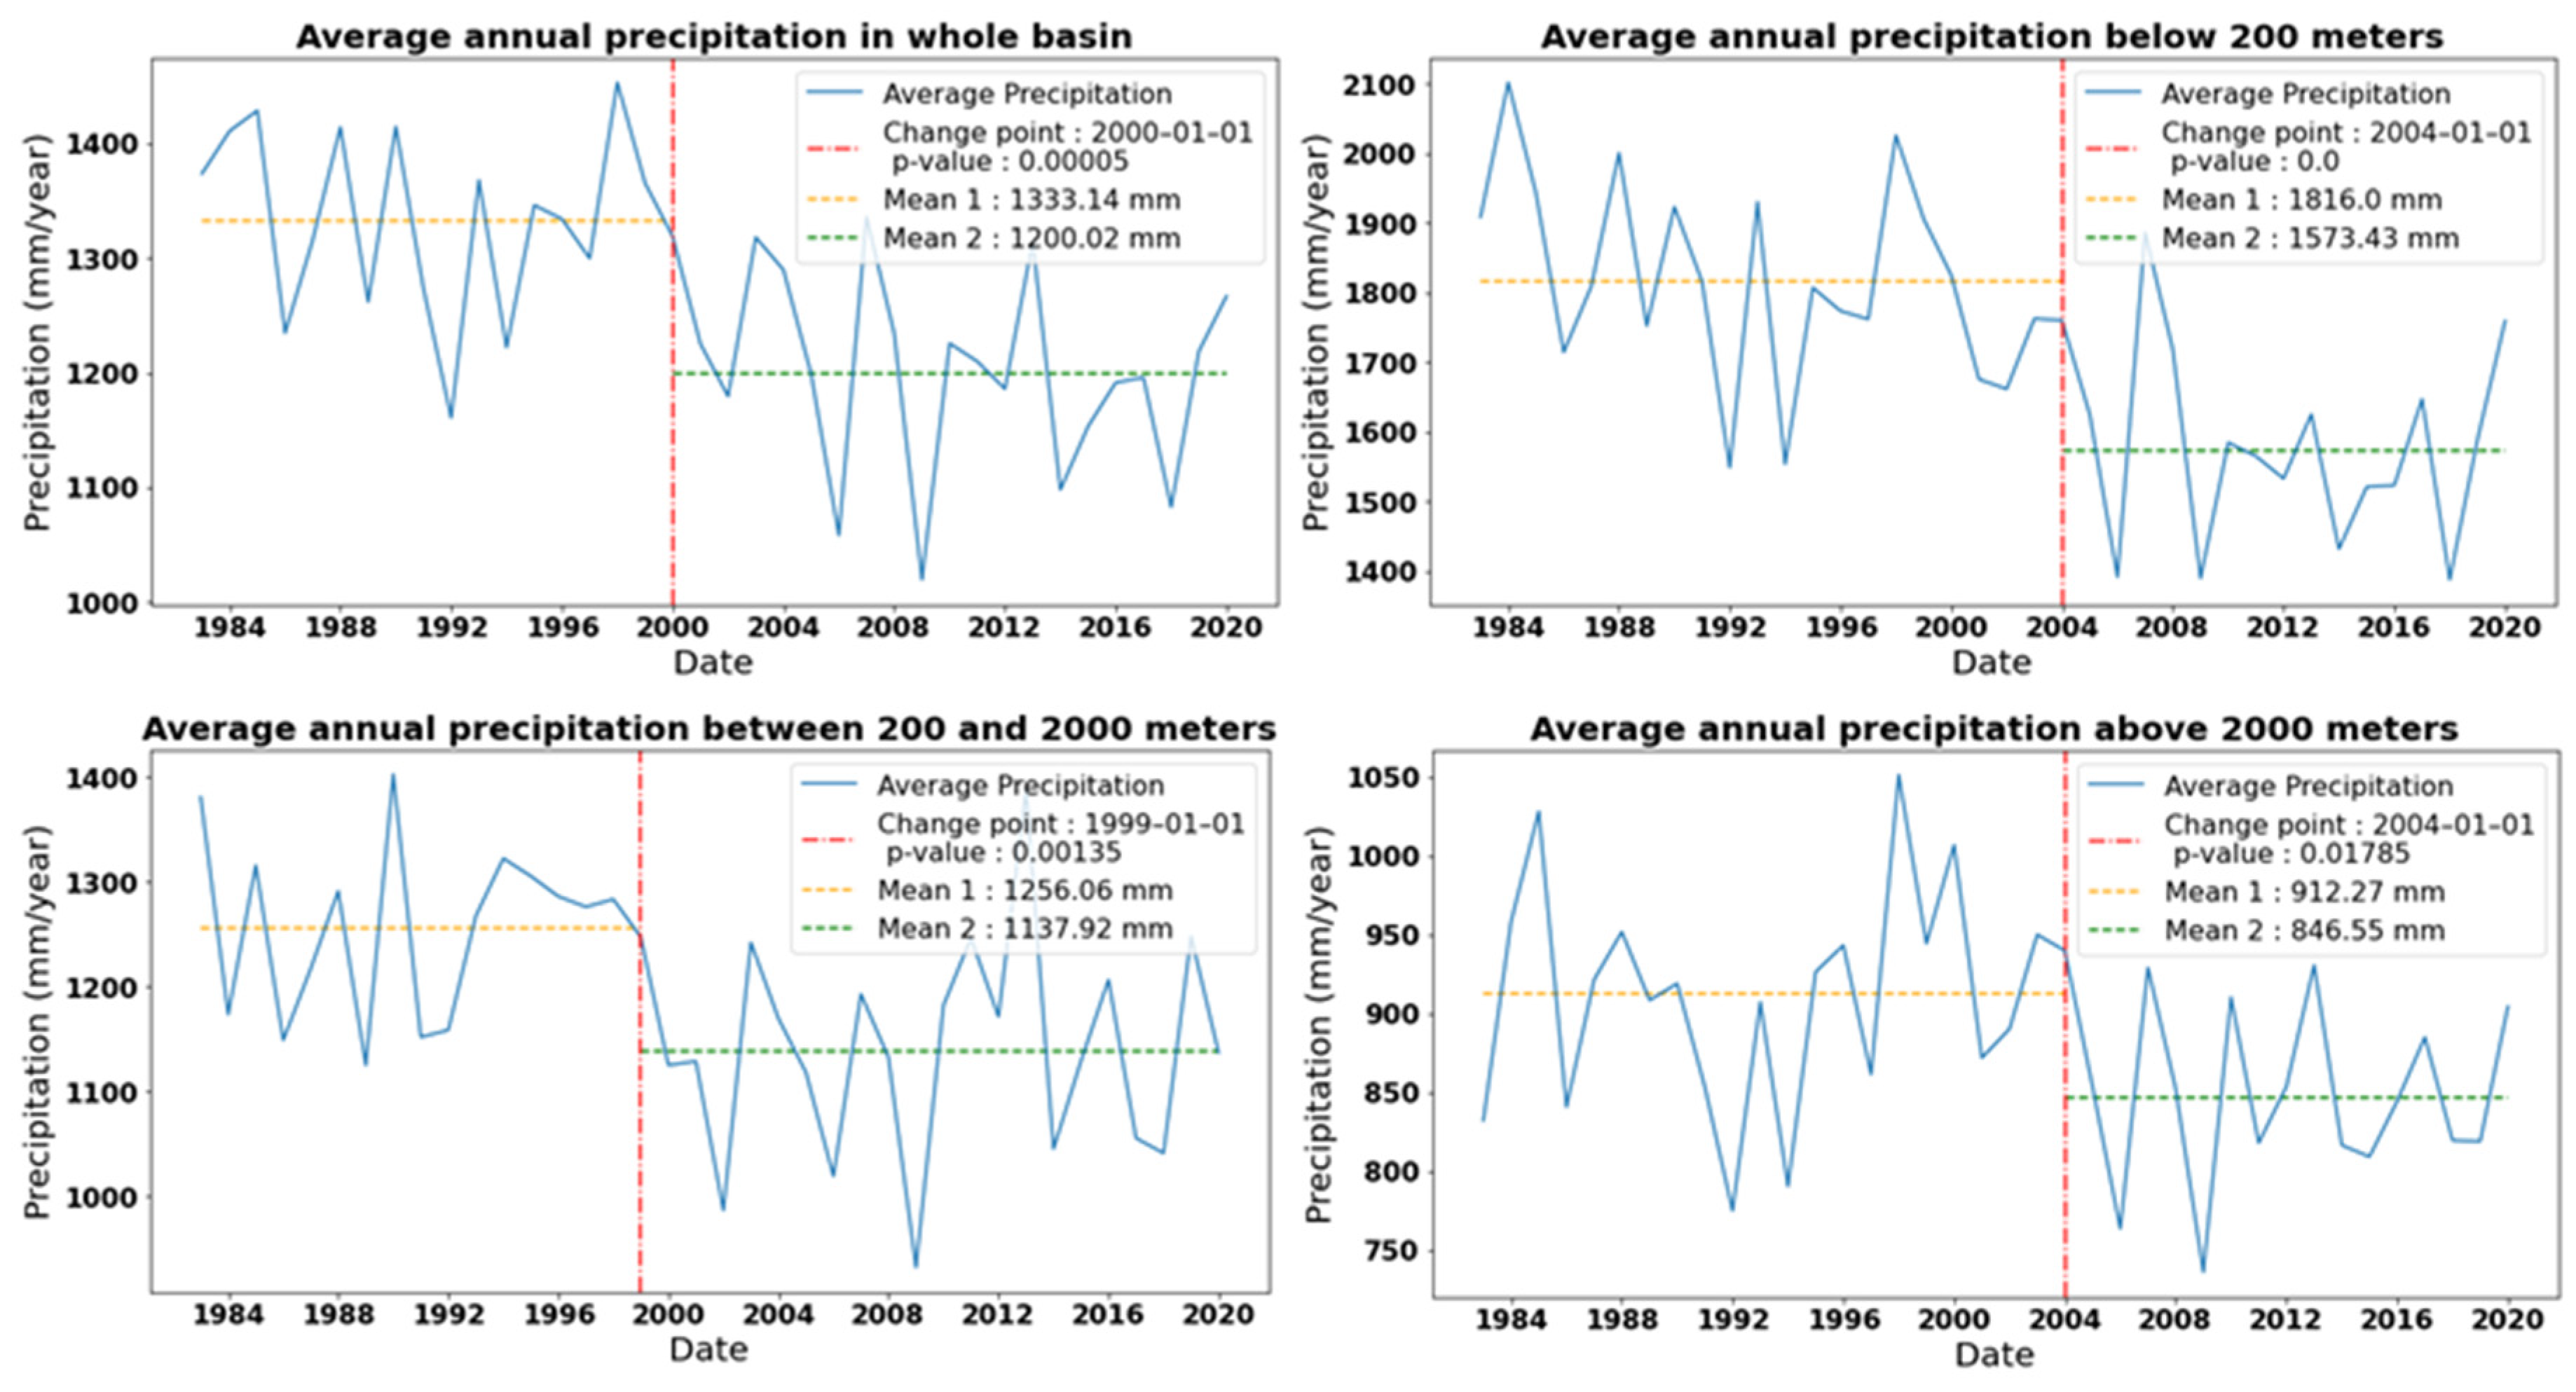
Precipitation trend was studied for all 2416 pixels of GB basin with both MK and MMK trend test. With the original MK test, the significant increasing trend was observed in only 82 out of 2416 pixels, while decreasing trend was significant in 1109 pixels. With the modified MK test, increasing and decreasing trends were significant in 44 and 841 pixels, respectively. After accounting for autocorrelation in precipitation time series, the smaller number of pixels showed a significant trend. Results of the Pettitt’s test showed the occurrence of change point in time series data, indicating the series was inhomogeneous. Change point for low elevation region occurred after 2004; average annual precipitation decreased from 1816 to 1573 mm. Change point for region with elevation 200−2000 m occurred at around 1999, and mean annual precipitation dropped from 1256 to 1137 mm. In higher altitude region, the change point occurred at around 2004, and mean annual precipitation decreased from 912 to 846 mm. When average precipitation for the whole basin was considered, change point occurred at around 2000, and the average annual precipitation decreased from 1333 to 1200 mm. Wang et al. [36] studied the cause of winter drought in western Nepal; frequent drought events after 2000 in this region are related to the decadal variation of Arctic Oscillation, warming of the Indian Ocean, and increased loading of anthropogenic aerosols. According to Wang and Gillies [52], during warm QDO (quasi-decadal oscillation) phases in the central Pacific, regions along Nepal receive below average monsoon precipitation. The severity of 2008 winter drought was exacerbated due to below normal 2009 monsoon. These aforementioned factors can be reasons for the decrease in annual average precipitation in the basin and the occurrence of change point around 2000. Change points in average annual precipitation in the whole basin and in different elevation regions are shown in Figure 2.
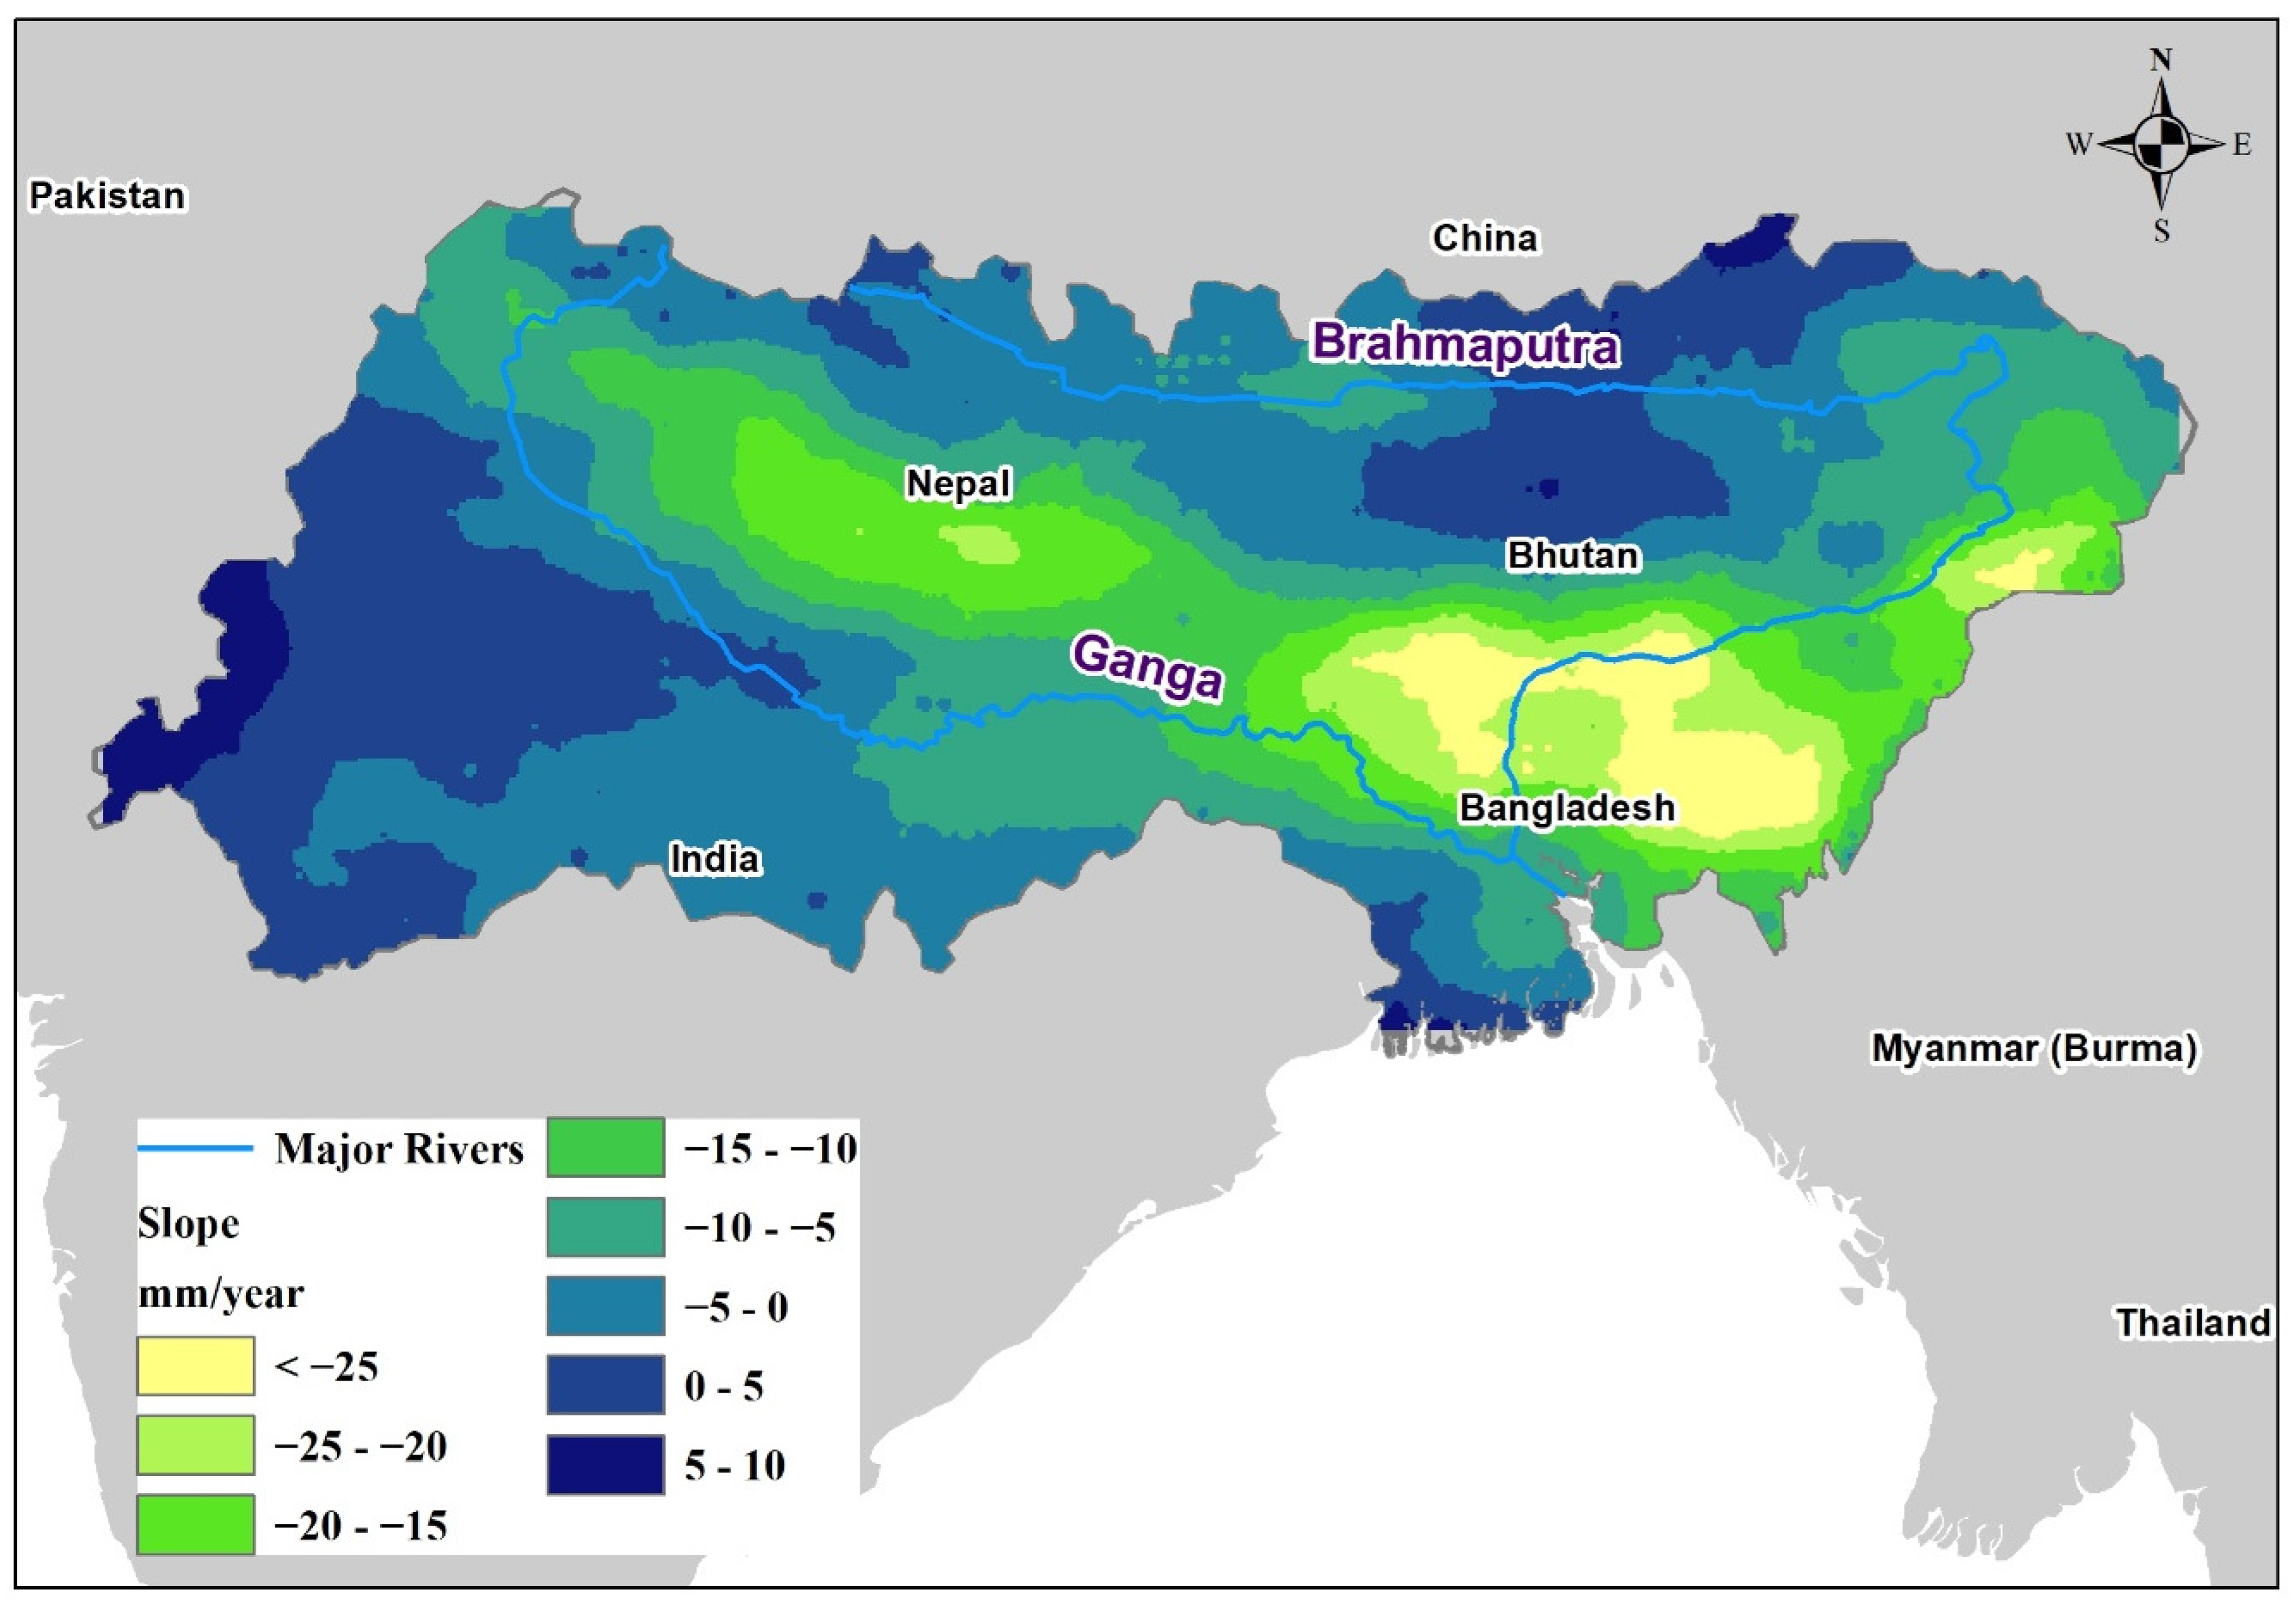
Results of MK and MMK in the whole basin and different elevation regions are shown in Table 1. Slope of the annual precipitation trend is shown in Figure 3. Eastern and central regions of the basin along the Ganga River are dominated by decreasing trends, and no significant trends in precipitation were observed in the southwestern and northern regions of the basin. Significant increasing trends were observed in a small region of the western basin. A rapid decline of more than 25 mm of precipitation per year was observed around Bangladesh.
3.1.2. Monthly Precipitation Trends
After observing significant decreasing trends in average annual precipitation in most of the basin, we studied precipitation trends for each month using the MK trend test. Precipitation trends were different for all months. MK trend test was used to study trends in precipitation for all 2416 pixels of PERSIANN-CDR precipitation data. For January, a significant decreasing trend was observed in 201 pixels with decreasing trend in 1760 pixels. On the other hand, a significant increasing trend was observed in only six pixels. Similar is the precipitation trend in February, wherein a decreasing trend was observed in 1438 pixels, out of which a significant decreasing trend was observed in 151 pixels, whereas a significant increasing trend was observed in only 1 out of 2416 pixels. For December, a significant decreasing trend was observed in 242 of the 138 locations and an increasing trend was observed in only five pixels. For these three months of winter, we can say from the MK trend test that precipitation was in a decreasing trend in the majority of locations, whereas the trend was significant in only few of the locations. The scenario in trends was somewhat different for the month of March than that of winter. A significant increasing trend was observed in 314 pixels, and significant decreasing trend was observed in 68 pixels. Overall, around 67 percent of the basin exhibited an increasing trend. In April, a significant decreasing trend was observed in 59 locations, whereas a significant increasing trend was observed in 364 pixels. The basin is dominated by an increasing trend, with positive trends in more than 80 percent of pixels. Similarly, for the month of May, significant decreasing and increasing trends were observed in 70 and 161 pixels, respectively. No significant trends in precipitation were observed for other locations. Positive trend was observed in more than 60% of pixels. From trends in these three months, spring/pre-monsoon precipitation was increasing in the Ganga–Brahmaputra Basin.
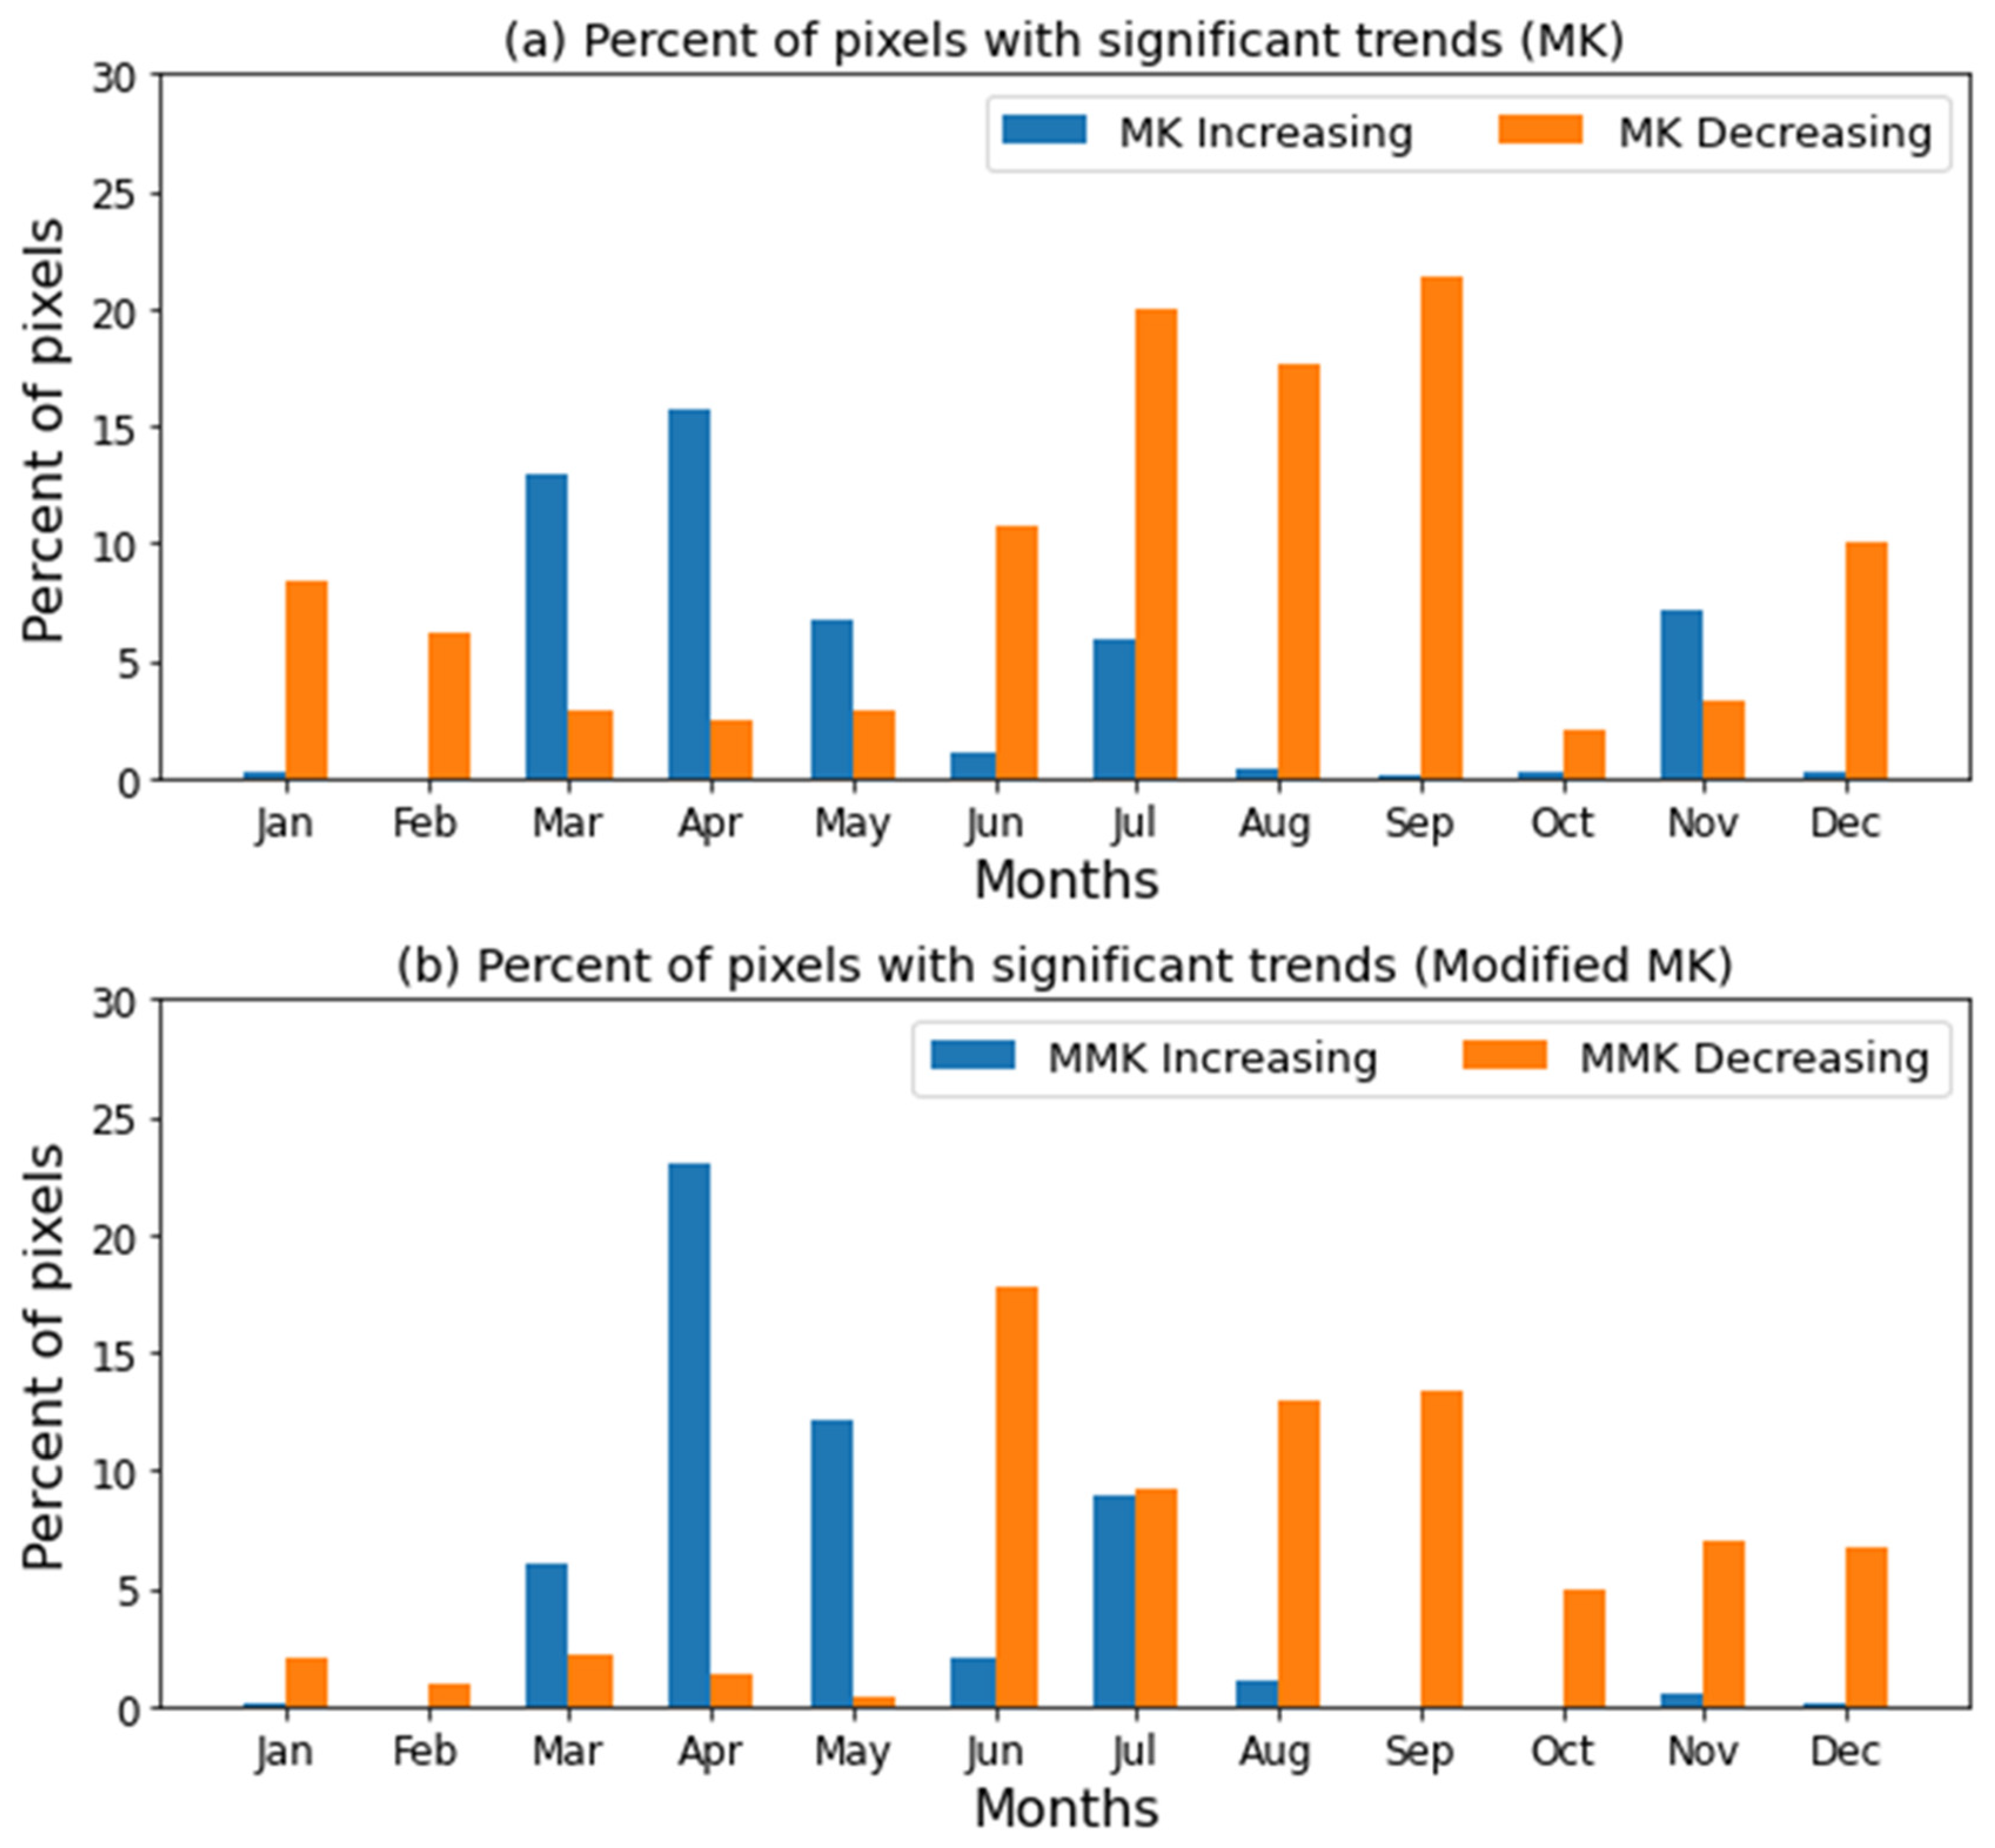
Monsoon precipitation accounts for a large amount of annual precipitation in the Ganga–Brahmaputra Basin. The monsoon starts in June lasts until September. Most of the agricultural activities depend upon monsoon precipitation in this basin. For the first month of monsoon, 262 pixels exhibited a significant decreasing trend, whereas a significant increasing trend was observed in only 27 pixels. A decreasing trend was observed in 63 percent of locations. A total of 484 pixels exhibited a significant decreasing trend for the month of July. A significant increasing trend was observed in 143 pixels. Although not significant, a decreasing trend was observed for more than half the pixels. A significant decreasing trend was observed for 426 of 2416 pixels for the month of August, with very few significant increasing trends in only 11 pixels. More than 75 percent of pixels exhibited decreasing trends. Monsoon precipitation was dominated by decreasing trends in the basin, which can cause adverse effects on farming and the livelihood of people. In September, a significant decreasing trend was observed in 515 pixels, and the increasing trend was significant for only two pixels. In October, only 51 pixels exhibited a significant decreasing trend, and a significant increasing trend was observed in only six pixels. No significant trend was observed in most regions of the basin. Similarly, for November, significant increasing and decreasing trends were observed in 173 and 78 pixels, respectively. Thus, from monthly trend tests, we observed a decrease in monsoon precipitation, whereas an increasing trend was observed in spring. For winter, a significant decreasing trend was observed in fewer locations, even if a decreasing trend prevailed in the majority of the region. The percentage of pixels exhibiting significant increasing and decreasing trends with both MK and MMK trend tests is shown in Figure 4.
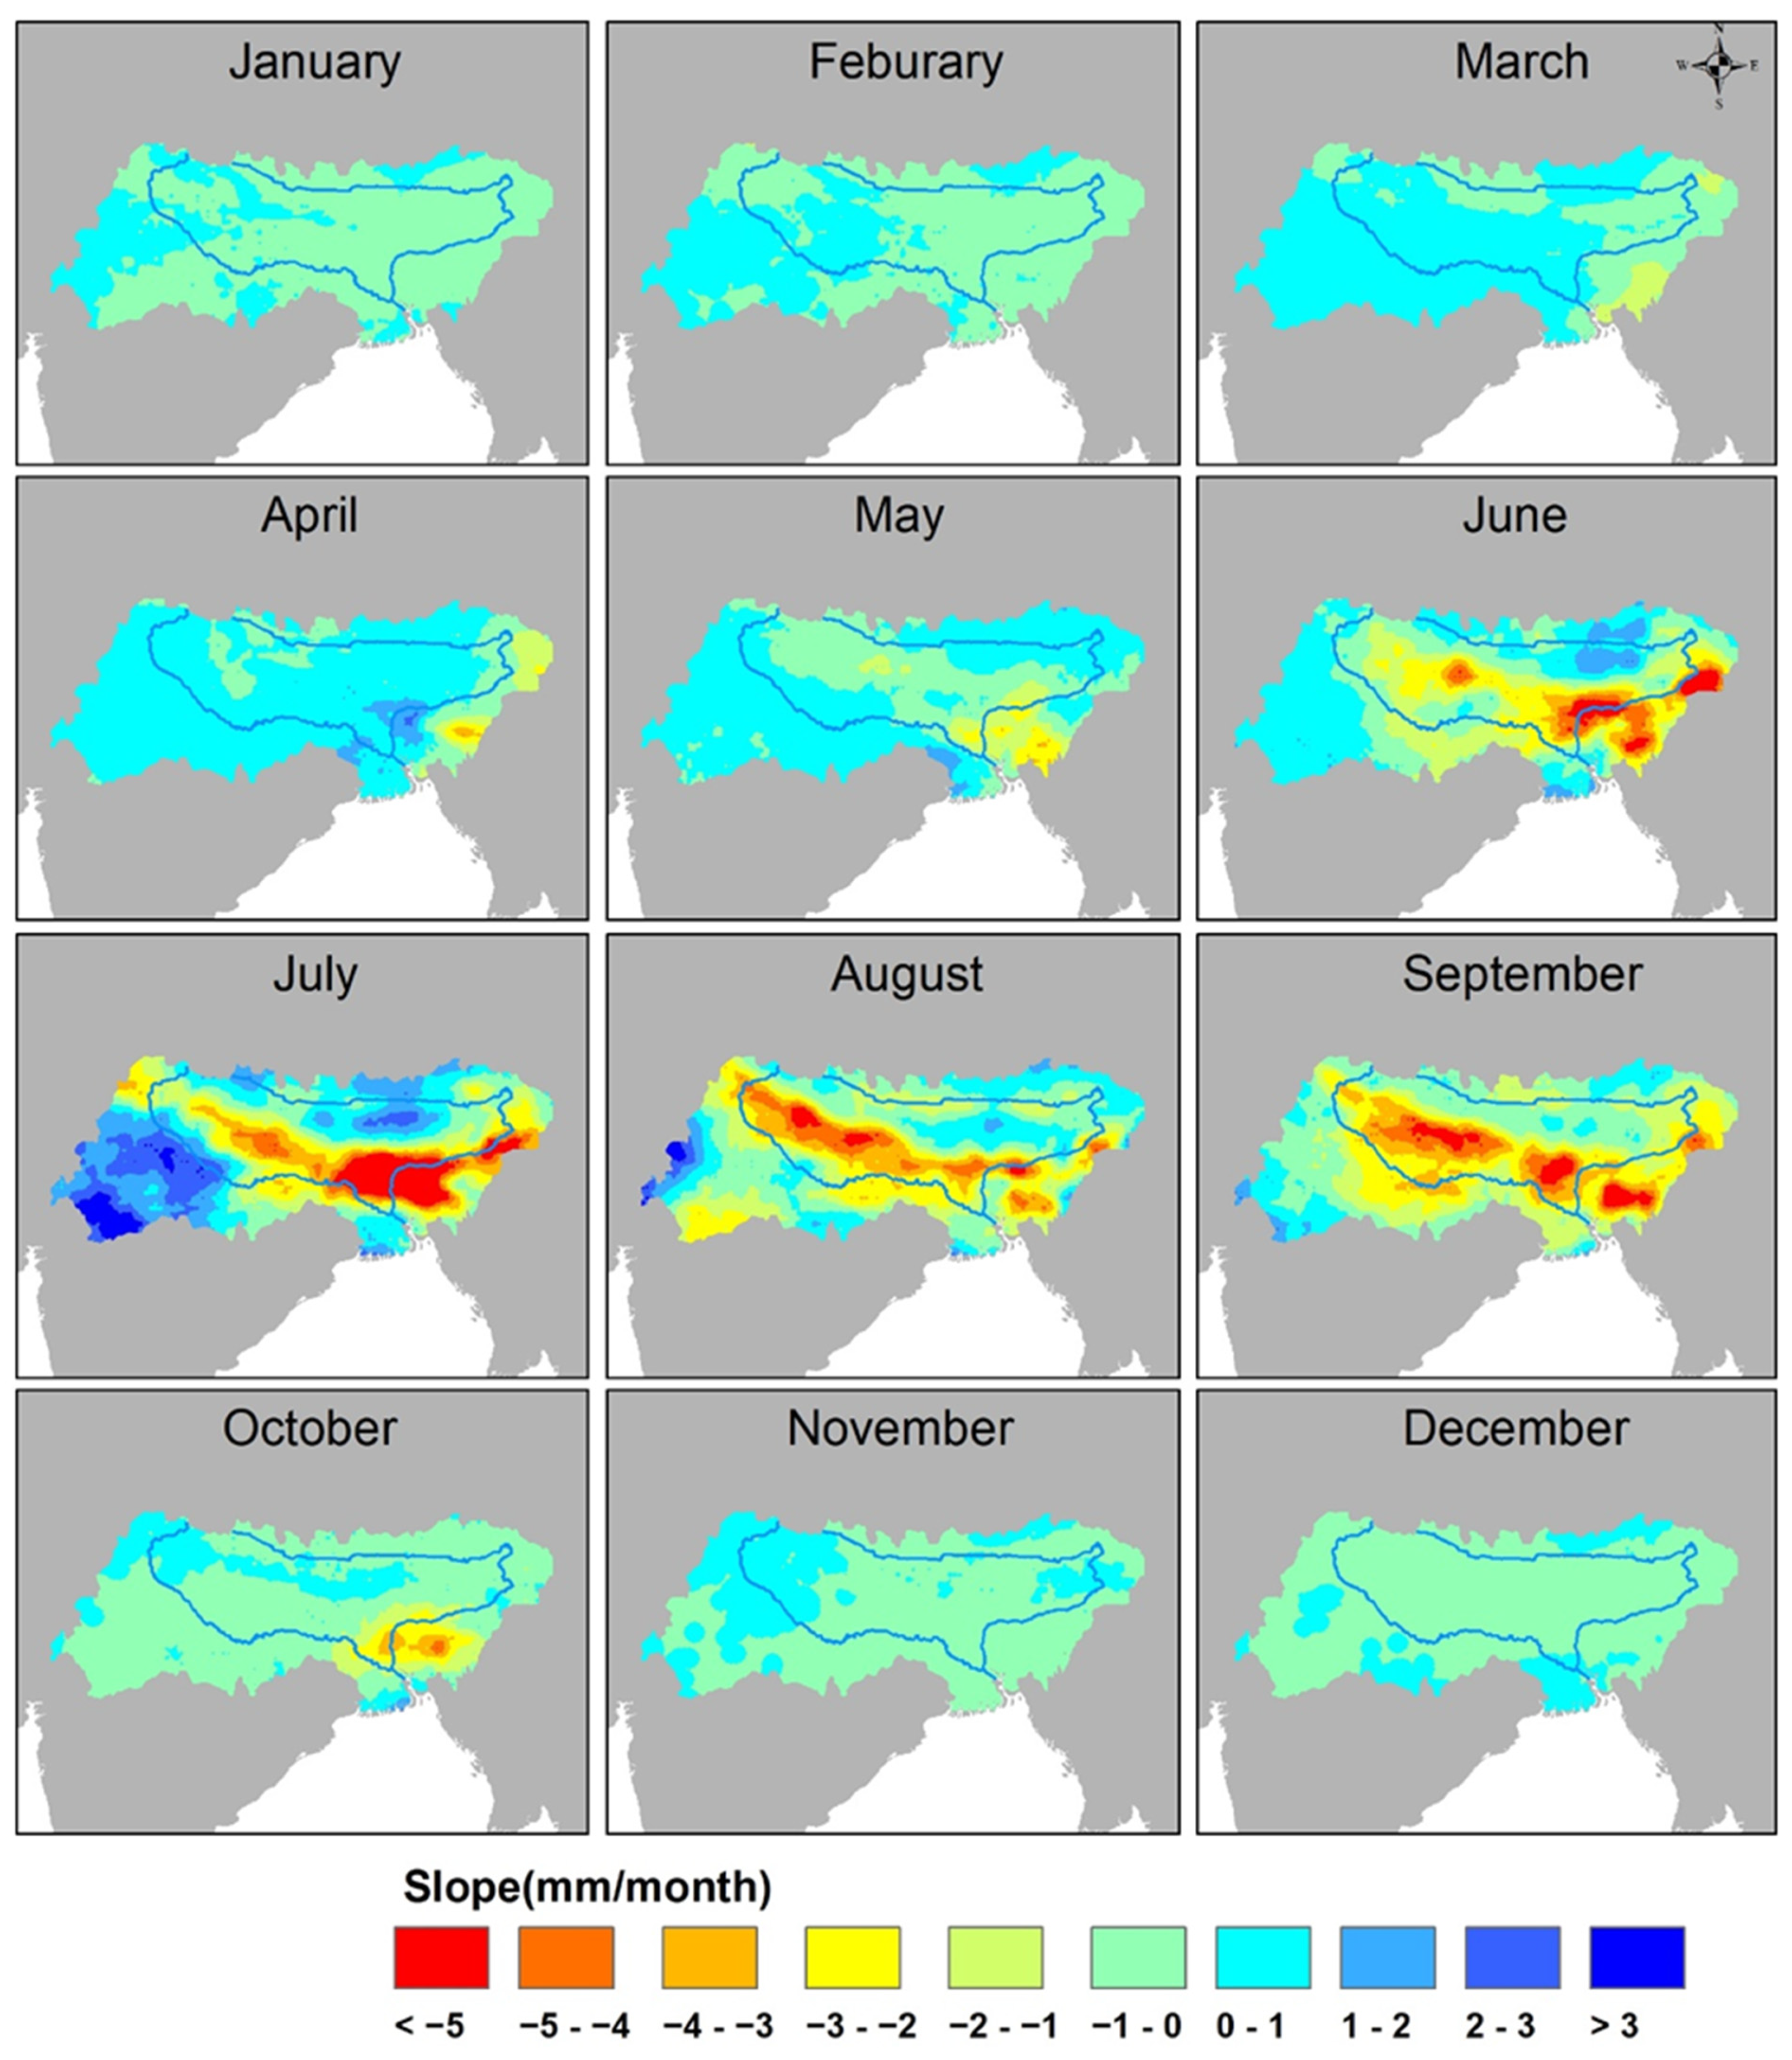
Figure 5 shows the slope of the monthly precipitation trend across the basin. In January, a high negative slope was observed in the northeastern region of the basin. The case was similar for February, wherein a significant decreasing trend was observed in the eastern basin. For March and April, pre-monsoon months, a positive trend was observed in the majority of the basin, except for the eastern region and some parts of the upper basin. Positive slope was observed in the western and northeastern parts of the basin for the months of May and June, whereas the central basin was dominated by negative slope. A mixed pattern of positive and negative slopes was seen throughout the basin for July, with significant decreasing trends. High negative slope and significant decreasing trends were observed in the central basin, along the Ganga River for the month of August. This was similar for the month of September, wherein the whole basin was dominated by negative slope, with higher negative slopes in the central and lower basins. Positive slope was seen in the northwestern part of the basin and high negative slope in the southeastern region of basin for the month of October. The overall basin was dominated by the negative slope. For November, positive slope was observed in the western basin and a high negative slope in the southeastern region. December was dominated by a negative slope, with a strong negative slope in the northwestern basin. Changes in precipitation patterns had a direct influence on cropping patterns and crop yields. Managing agriculture according to precipitation variation is a significant social problem [53]. Although most of the southern basin has the potential to be irrigated, a large portion of the basin does not have irrigation facilities [34]; moreover, droughts and changes in precipitation patterns make agriculture in unirrigated areas more vulnerable. According to Ahmad et al. [33], precipitation fluctuations can cause up to 39 percent variations in wheat production and up to 75 percent variations in rice production in regions with no artificial irrigation facilities in the Ganga–Brahmaputra Basin [33].
3.2. Standardized Precipitation Index
3.2.1. Trend Analysis of SPI/Drought
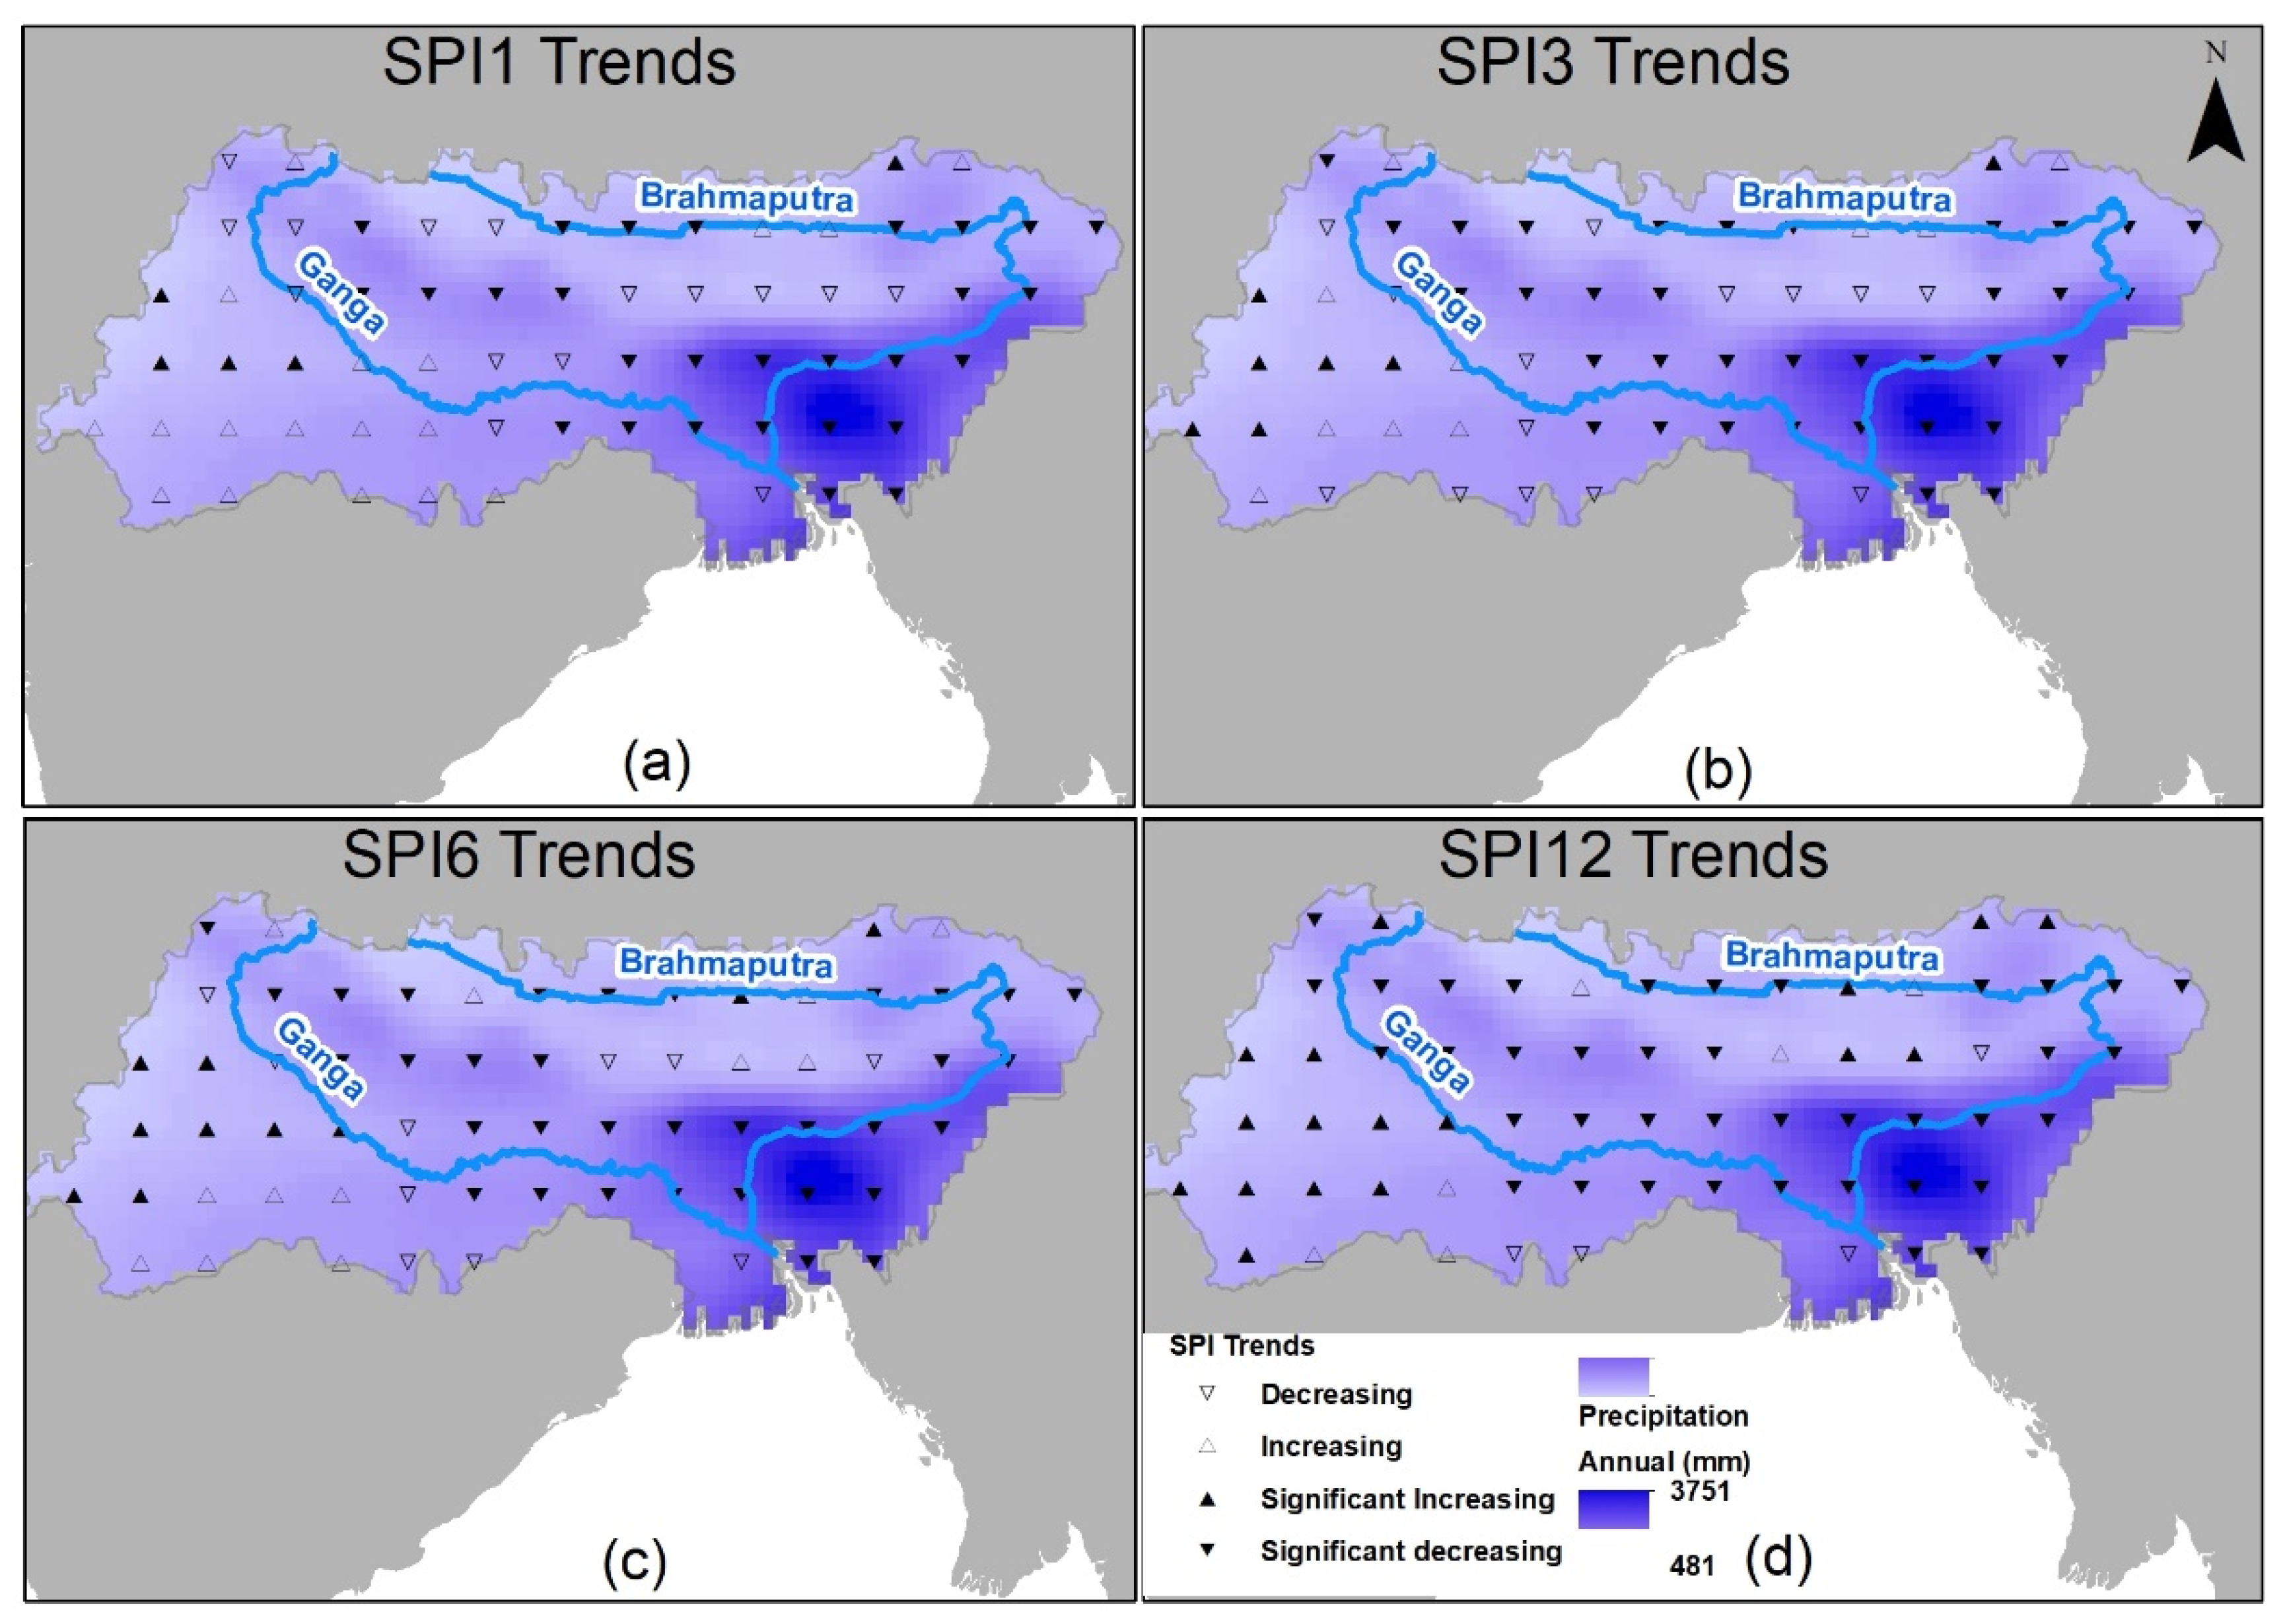
Standardized precipitation index was calculated for the Ganga–Brahmaputra Basin with PERSIANN-CDR precipitation at four time scales. To analyze the trends of drought in the basin, we performed the MK test and modified MMK test with the SPI at different time scales. Decreasing trend in SPI was observed at majority locations, which implies an increase in drought events throughout the basin. Figure 6 shows trends in SPI for different time scales: 1, 3, 6, and 12 months. Triangles facing upward show an increasing trend, and those facing on the side show a decreasing trend in SPI. Solid triangles indicate significant trends. For 1 month SPI, 43 out of 66 locations exhibited decreasing trend, out of which a significant trend was observed in 33 locations. On the other hand, a significant increasing trend was observed in only five locations. Short-term droughts were increasing in the eastern and northern basin, whereas increasing trends in SPI were observed in the southwestern basin, which indicated decreasing drought events in that region. For 3 month SPI, 74% of locations, 49 out of 66, had decreasing trend in SPI. The spatial distribution of trend showed a similar pattern as that of 1 month SPI. A significant decreasing trend was observed in 35 locations, and a significant increasing trend in seven locations. A total of 44 out of 66 locations had a decreasing trend for 6 month SPI, out of which a significant trend was observed in 34 locations. A significant increasing trend was observed in 10 locations, which mostly lay in the southwestern basin. A significant decreasing trend was observed at 39 locations for SPI 12 and a significant increasing trend at 17 locations. From the MK test, decreasing trend of drought was observed in the southwestern region of the basin, which lies in India. On the other hand, an increasing trend of drought was observed in the Himalayas, southern China, Bhutan, Bangladesh, and northeastern India.
3.2.2. Monsoon and Winter Droughts
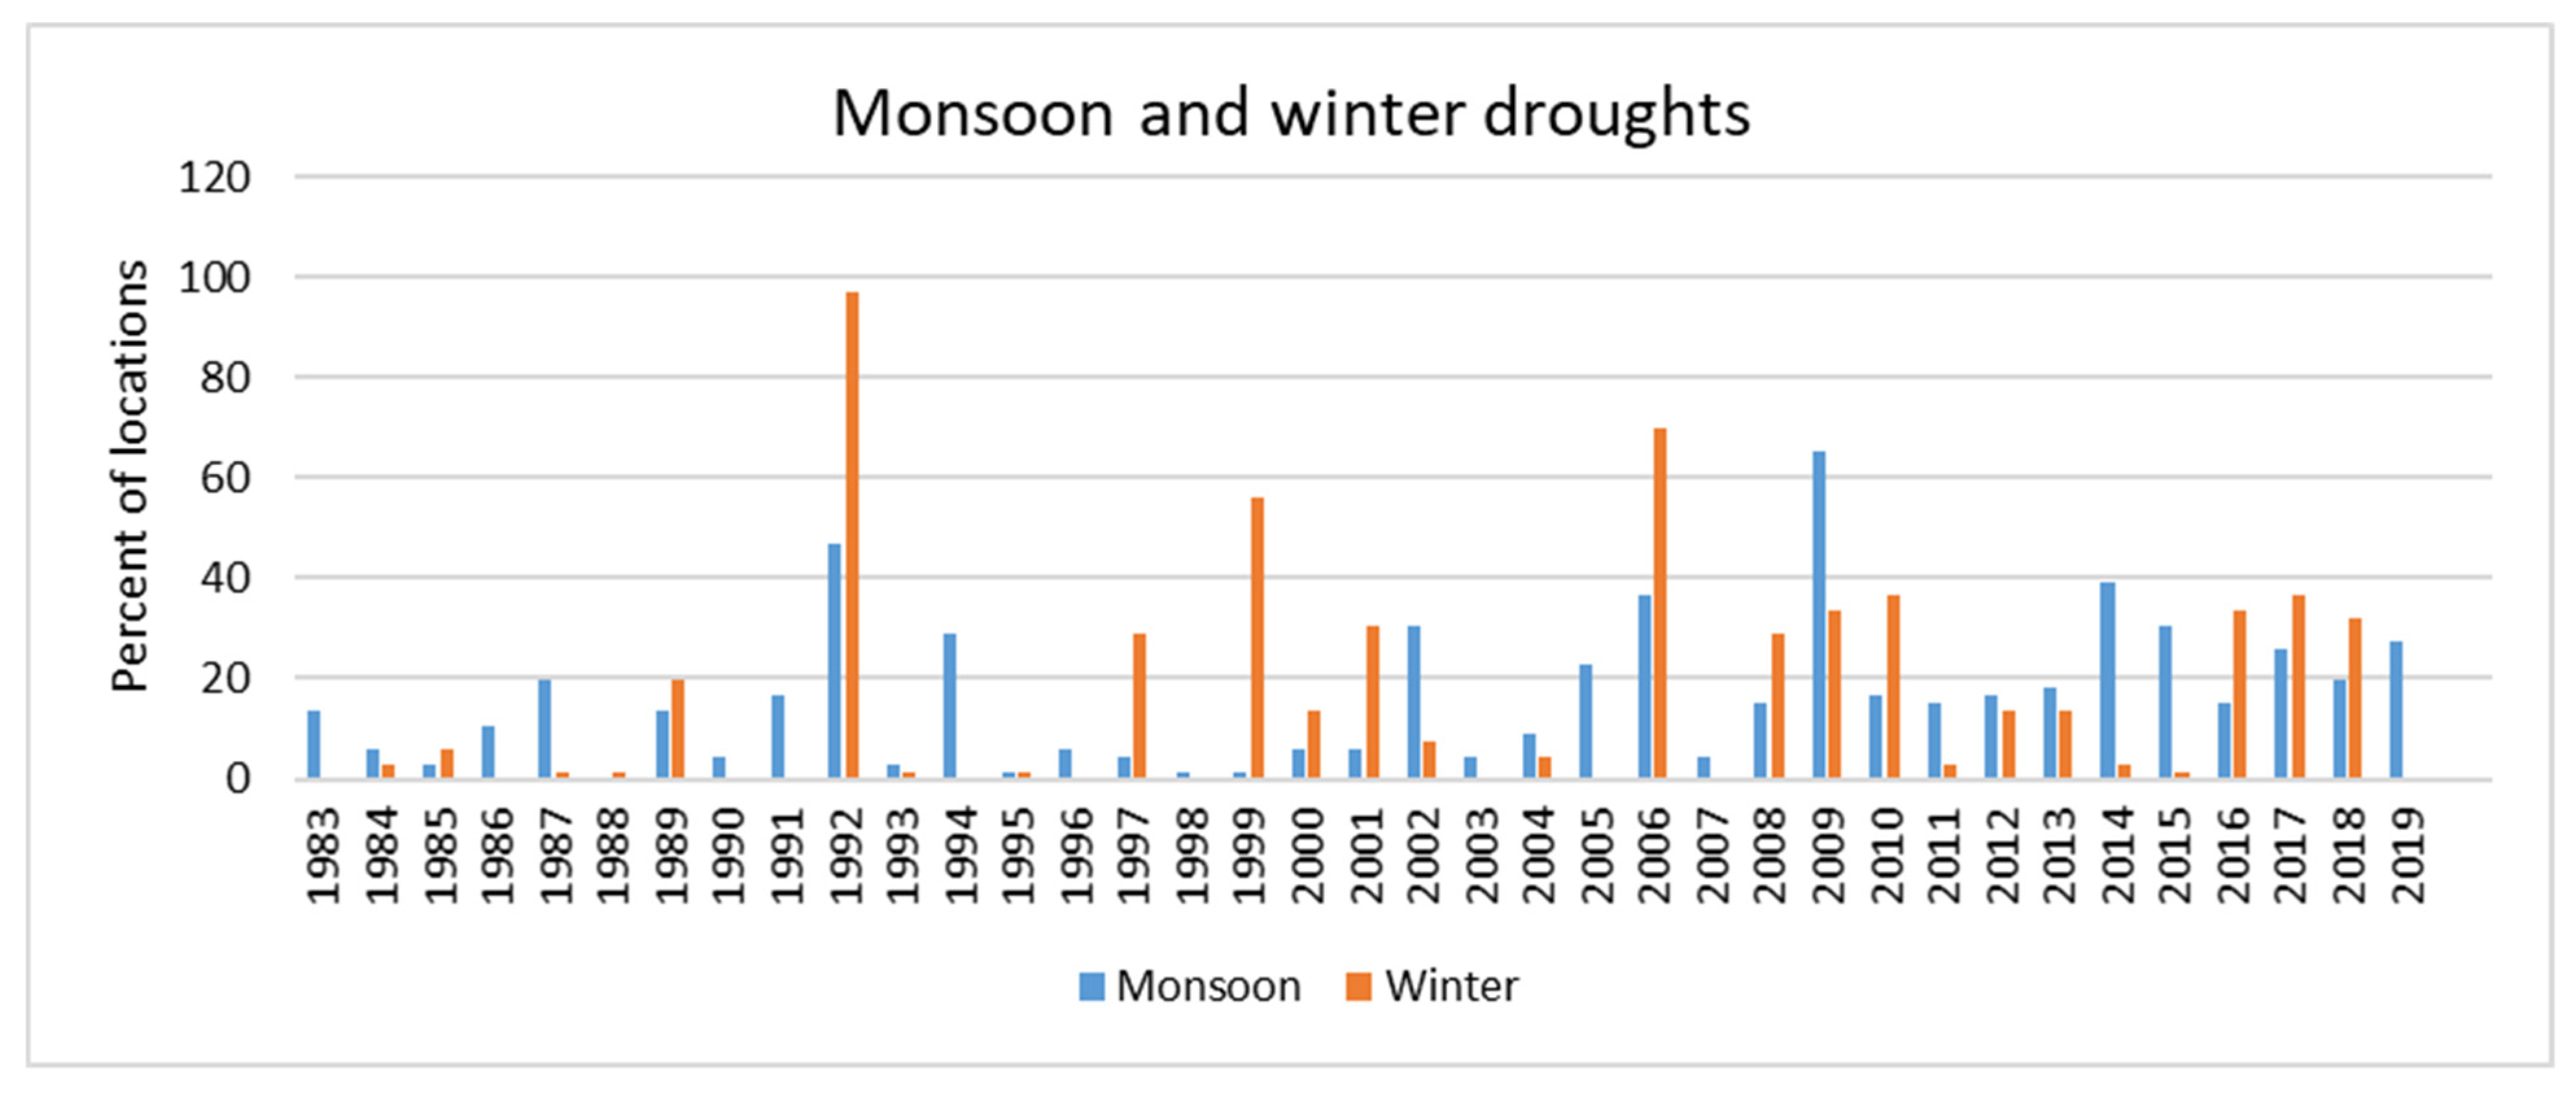
Monsoon usually starts in April and lasts up to September. Thus, 6 months SPI in September was considered to observe monsoon drought and 3 months SPI in February was considered to observe winter drought. Figure 7 shows frequency and spatial extent of winter and monsoon droughts in the Ganga–Brahmaputra Basin over the study period. From the figure, it is evident that droughts increased in spatial extent and in frequency. Severe winter drought occurred in 1992, when 97% of the region was under drought (SPI < −1). Severe winter droughts occurred in 2006 and 1999, when 70% and 56% of the basin were under drought, respectively. Other significant winter droughts occurred in 2001, 2018, 2009, 2016, 2010, and 2017, when more than 30% of region was under drought. Monsoon droughts have increased significantly in recent years. In the 2009 drought, over 65% of the entire basin was under drought. Another severe monsoon drought occurred in 1992, when 47% of the region was under drought. Other monsoon drought years were 2002, 2006, 2014, and 2015.
3.2.3. Spatial Patterns of Drought
To study the spatial patterns of drought, we extracted principal components for SPIs at different time scales. Variance explained by principal components of SPI for each time scale are summarized in the Table 2 and Table 3. For all time scales, 8–10 components explained 75 percent of the total variance of the SPI time series. Variance was distributed to number of principal components, showing complex drought pattern in GB basin. For spatial patterns of winter and monsoon drought in the GB basin, 3 months SPI in February and 6 months SPI in September were used to perform principal component analysis. Variance distribution for monsoon drought was similar to 12 months SPI as a large proportion of annual rainfall occurs in monsoon.
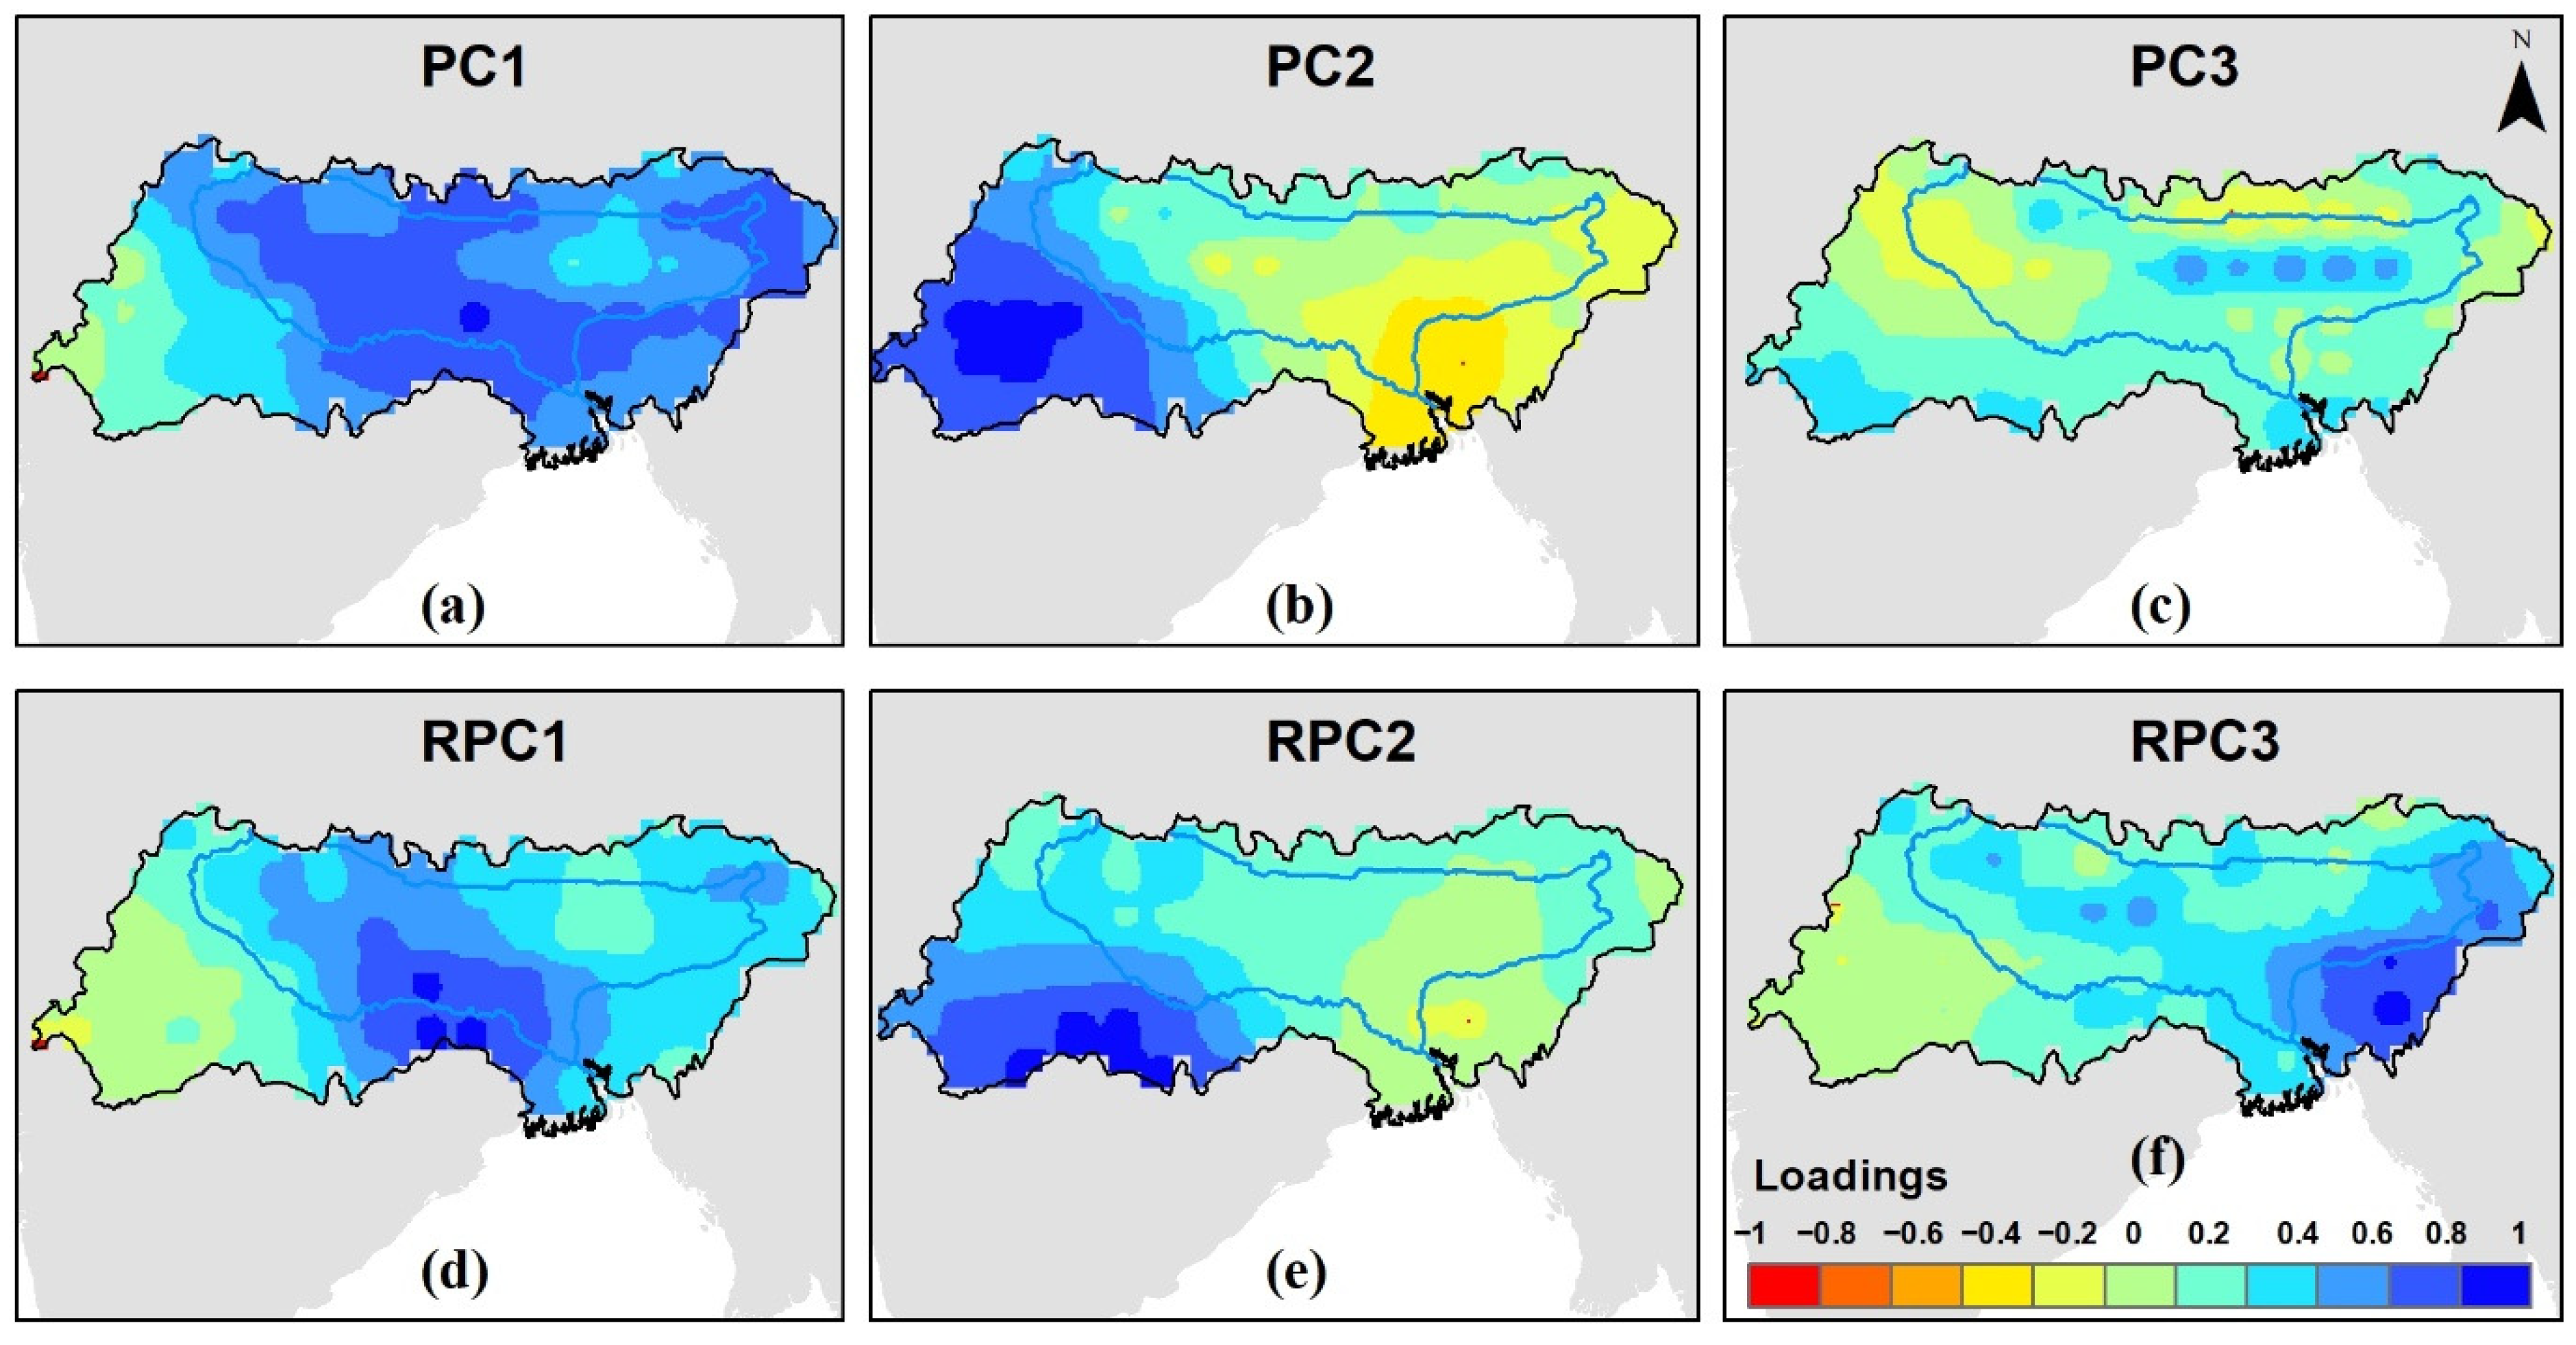
Spatial patterns of loadings for 12 months SPI are shown in Figure 8. PC1 explains 30.64% of total variance for SPI 12. It had good correlation for the majority of basin with high positive loadings in the central region. The second principal component had positive loadings in the western basin. Loadings were heterogeneously distributed for the third principal component with significantly less positive loadings. Rotated loadings provided further localized areas of drought variability (Raziei et al., 2009). First rotated loading also had positive values over the central basin and had negative values over the western basin. The second and third rotated components had positive loadings in southwestern and southeastern basins, respectively. Overall, SPI calculated for a 12 month time scale exhibited a complex spatial pattern.
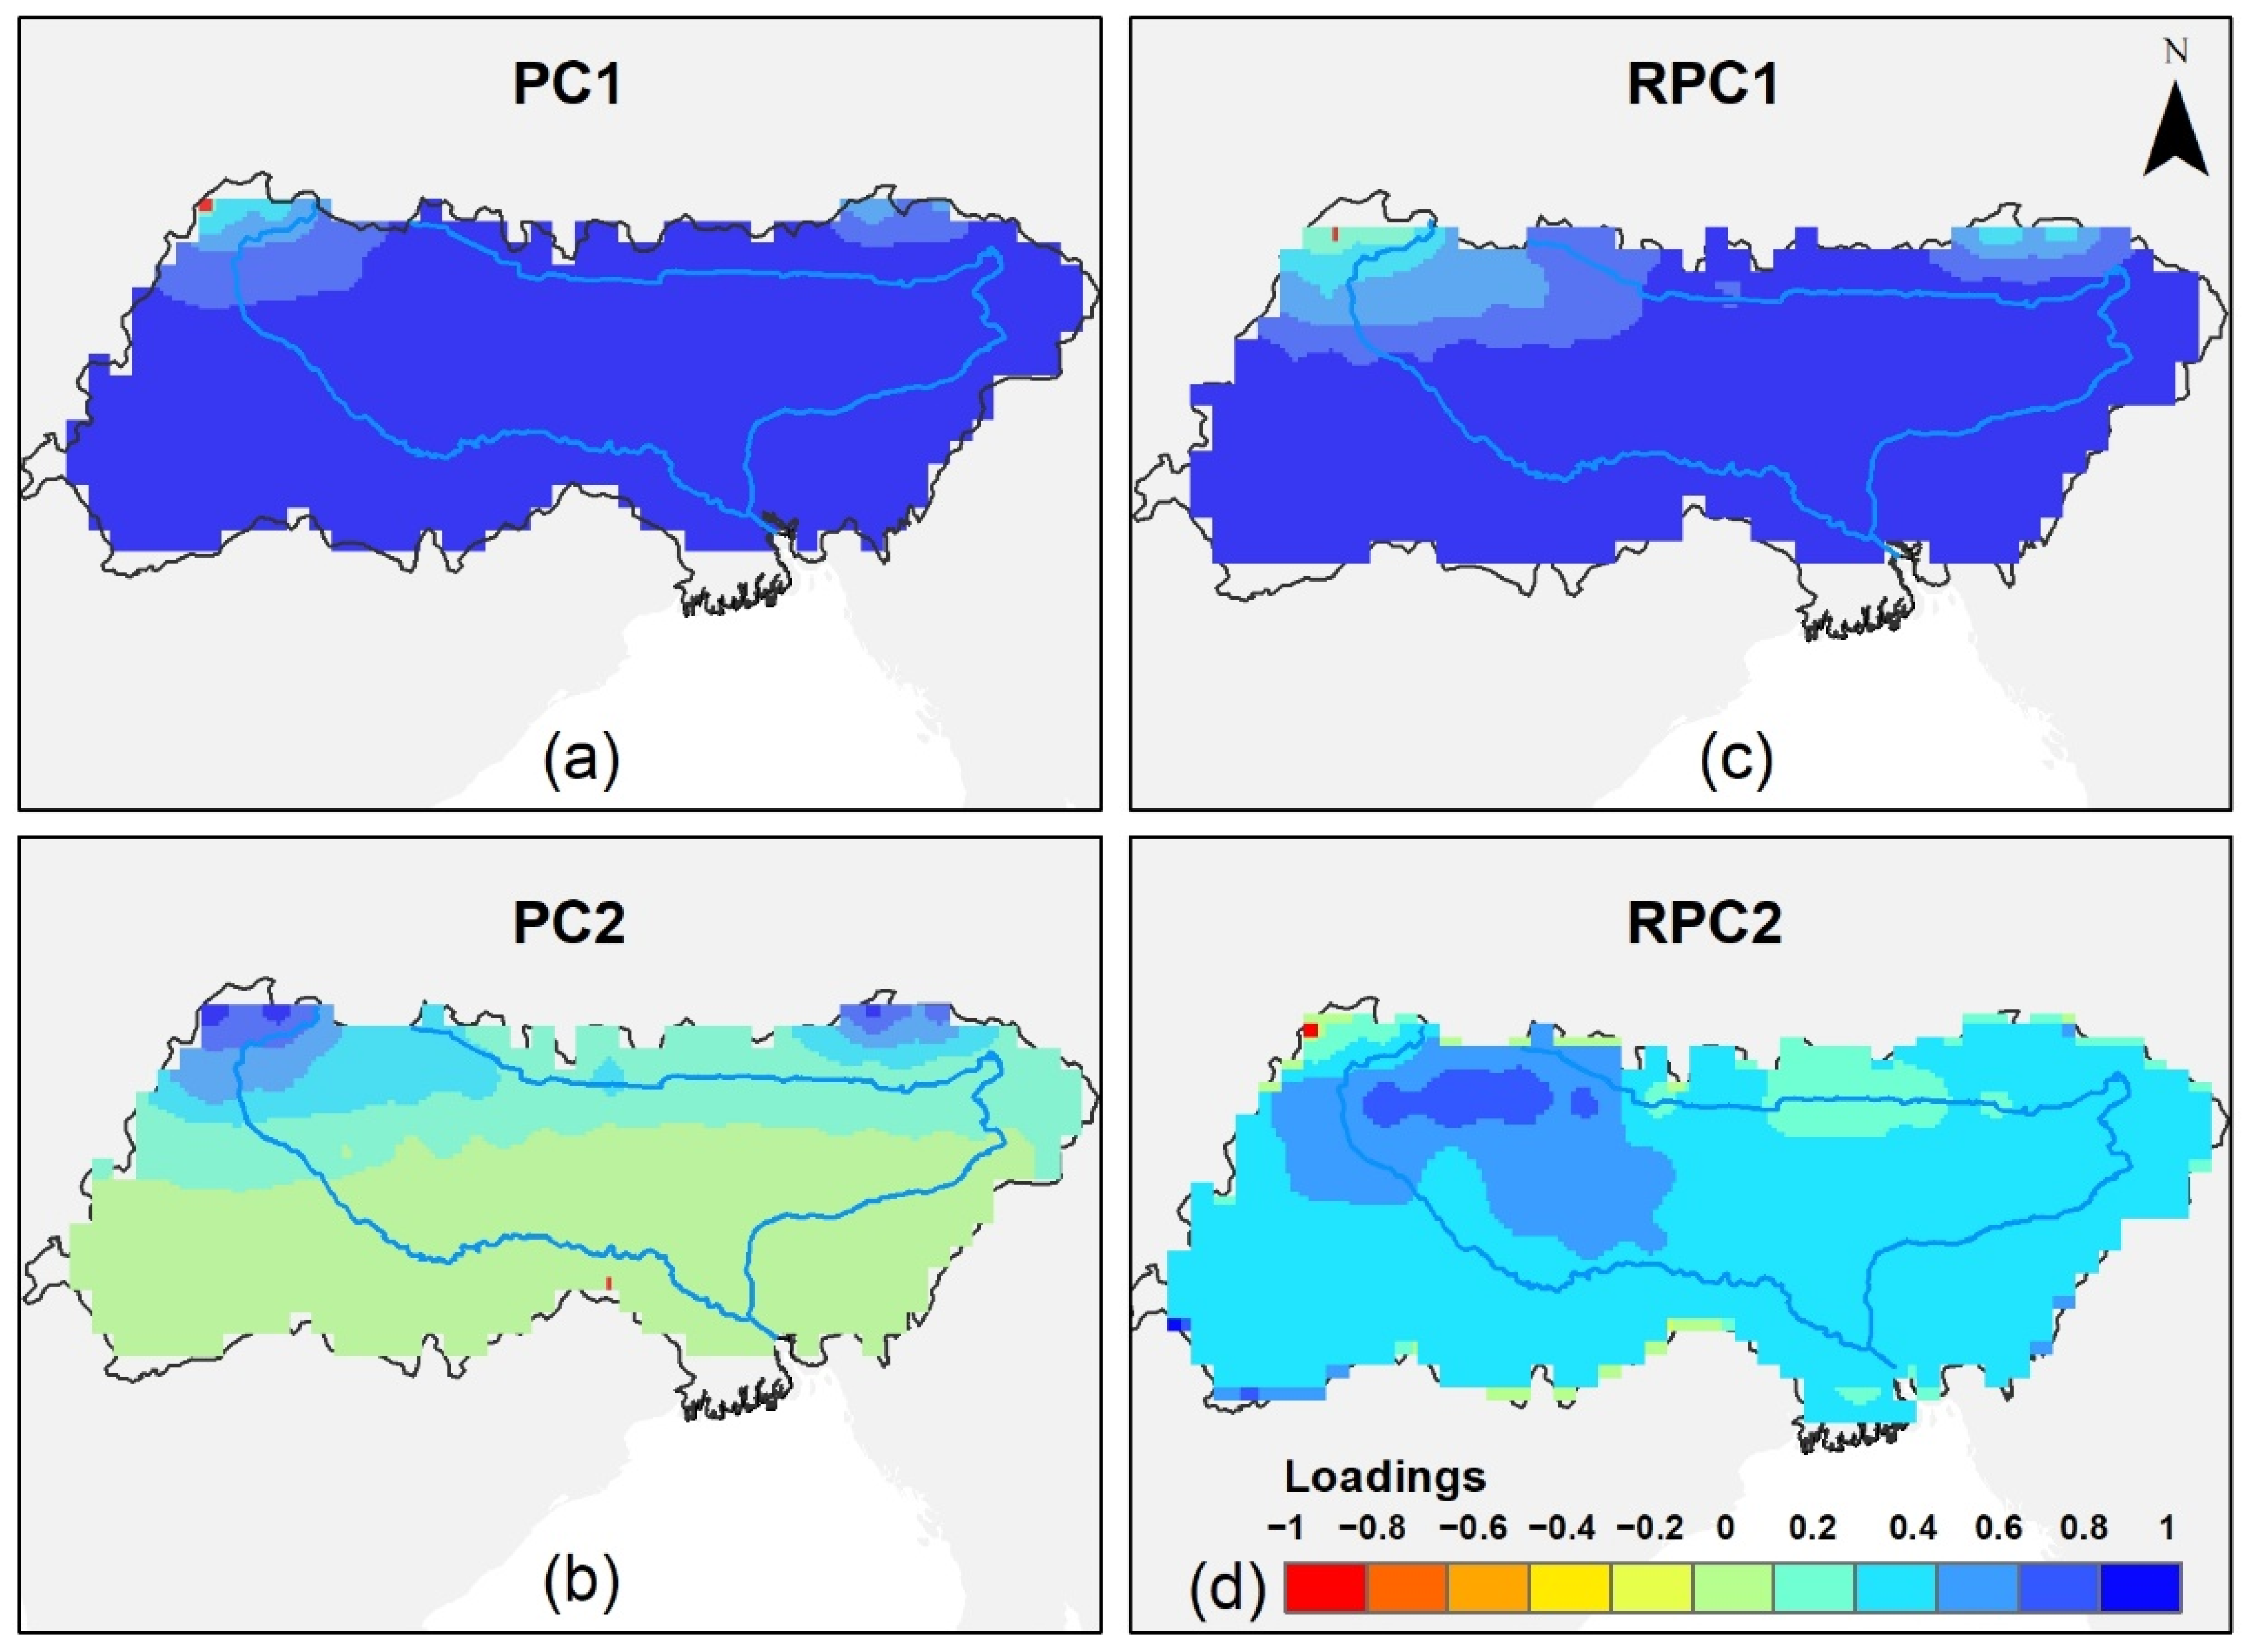
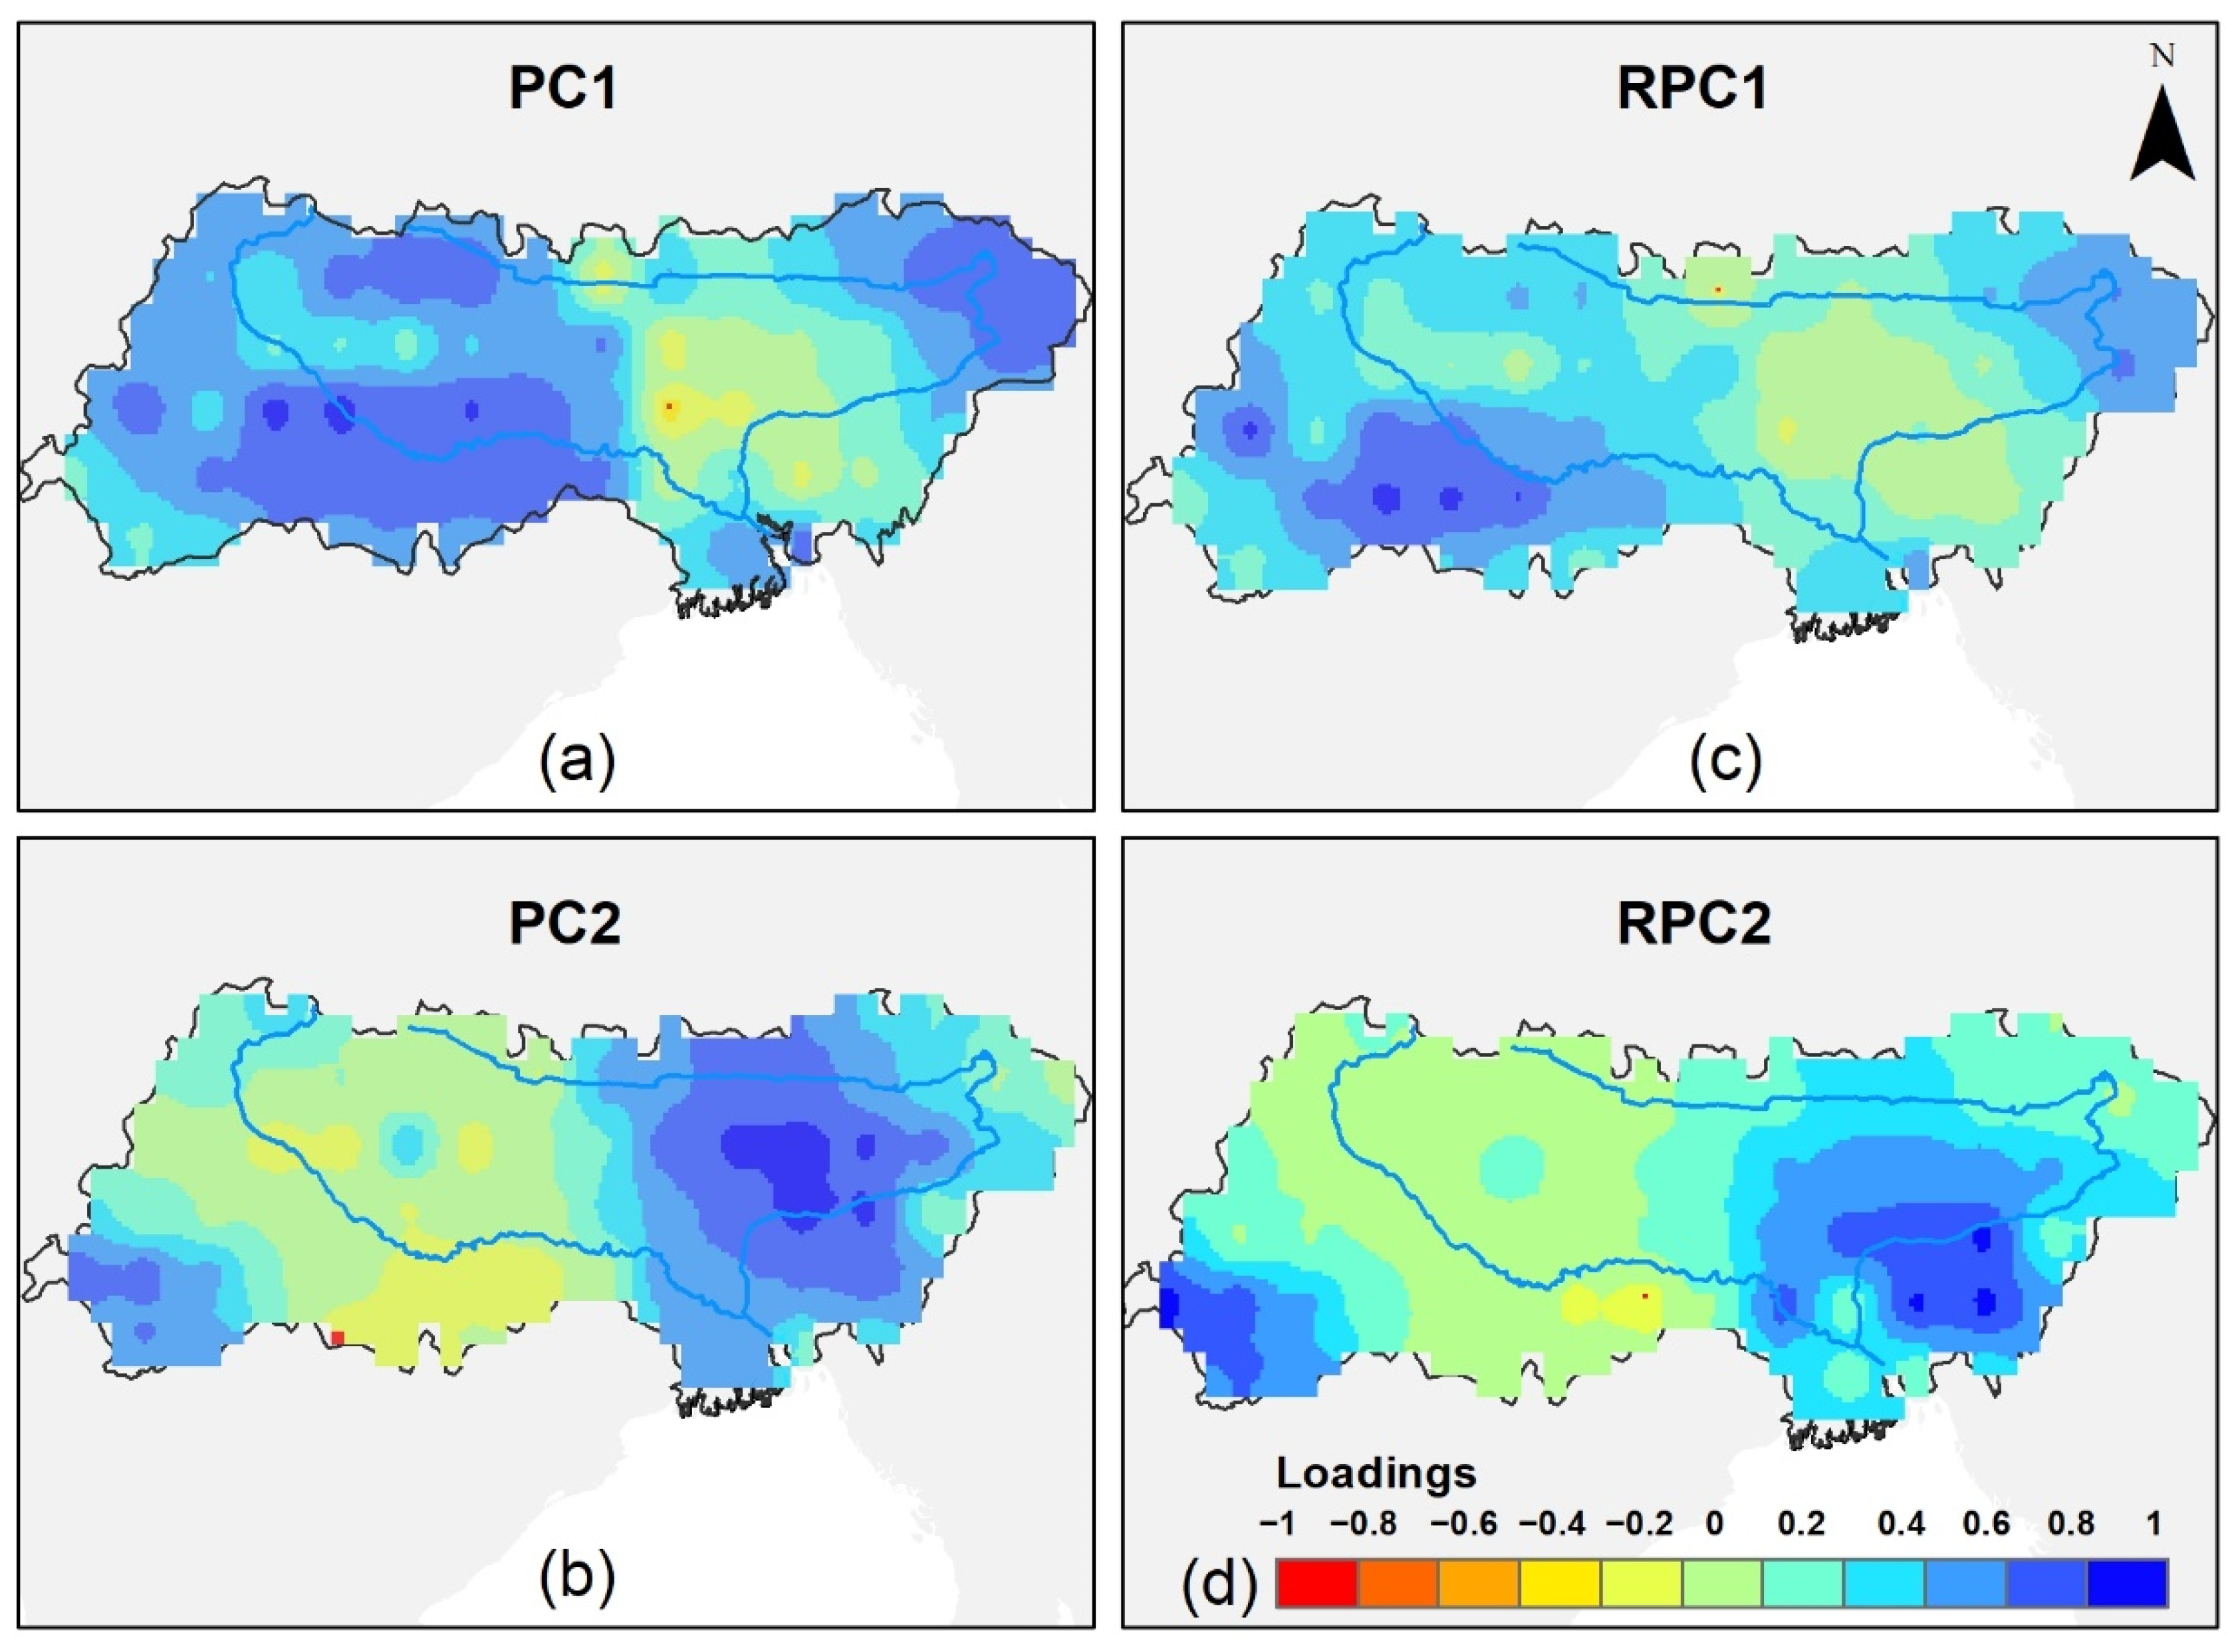
For winter drought, first two principal components explained 95 percent of total variance. It was shown that the winter drought, characterized by 3 months SPI in February, had clear spatial patterns, while for monsoon and other time scales, drought pattern was more complicated. Figure 9 shows spatial patterns of loadings of winter drought. For monsoon drought, PC1 explained 15.46 percent of total variance. It had high positive loadings in the western and northeastern basins and small negative loadings in the central basin. The second principal component, PC2, had positive loadings in the central basin along Bangladesh, whereas loadings in the western and northeastern basins were negative. Rotated loading patterns of the first two principal components are shown in Figure 10c,d. Rotated PC1 had positive loadings in the southwestern and northwestern basins and small negative loadings in the central basin. In contrast to this, the second rotated principal component had positive loadings in the southeastern basin and small negative loadings in the western basin. A different pattern of loadings was observed for the winter drought. The first principal component that explained 88.85 percent of total variance had positive loadings throughout the basin, with high loadings in the southern basin and somewhat smaller loadings in the northern basin. On the other hand, the second component had small negative loadings in most of the region and some positive loadings in the northern basin. Rotated first principal component had positive loadings throughout the basin with larger positive loadings in the southern region. Rotated second component had slightly smaller positive loadings throughout the basin.
4. Discussion
Trends in annual and monthly precipitation within the Ganga–Brahmaputra Basin were evaluated with satellite-based PERSIANN-CDR precipitation data. Drought trends and spatial patterns of drought were also studied with the same precipitation data. From 1983 to 2020, annual precipitation in the basin exhibited a decreasing trend. The rate of decline was higher in the low-elevation region, wherein average annual precipitation was also higher as compared to other regions. A positive trend in annual precipitation was observed only around Bhutan and the southwestern basin. Annual precipitation was rapidly declining along the southeastern basin and in the central basin. The number of pixels exhibiting significant trends were different for original and modified MK trend tests. The lower number of stations exhibited a significant trend with modified MK test, after accounting for autocorrelation in time series data; a number of studies such as those of Kumar et al. [54] and Sa et al. [24] have presented similar findings. Wang et al. [36] evaluated the causes of winter droughts in western Nepal, mentioning that drought events were increasing after 2000 due to warming of the Indian ocean, decadal variation of Arctic oscillation, and human-induced aerosols. These might be the reasons of the reduction in average annual precipitation after 2000; however, thorough research to determine the causes of the changepoint is recommended.
Monthly trends showed decreasing monsoon and post-monsoon precipitation, whereas pre-monsoon precipitation was increasing in this basin; monsoons started early as compared to past years. Monsoon precipitation was decreasing significantly along the Ganga River as compared to other regions of the basin. For pre-monsoon months, March and April, a positive trend was observed in the majority of region along the basin. The basin was dominated by a negative slope for the month of January, February, May, June, and August. The number of pixels exhibiting significant trends in monthly precipitation was also different with the MK and MMK trend tests; prewhitening time series precipitation to remove the effect of serial correlation resulted in different trend results. The way in which serial correlation and prewhitening influence positive and negative trends is an important question, but it is outside the scope of this article. Rice and wheat are major crops cultivated in the Ganga–Brahmaputra Basin. Change in precipitation patterns and climate variability affect crop yields, and impact is more intense in regions with no irrigation facilities [33]. The development of appropriate adaptation measures is necessary to mitigate the impacts of climate variation in crop yield. Flexibility in land use can be an essential technique to reduce the effects of precipitation variation in crop yields, as mentioned by Siderius et al. [53].
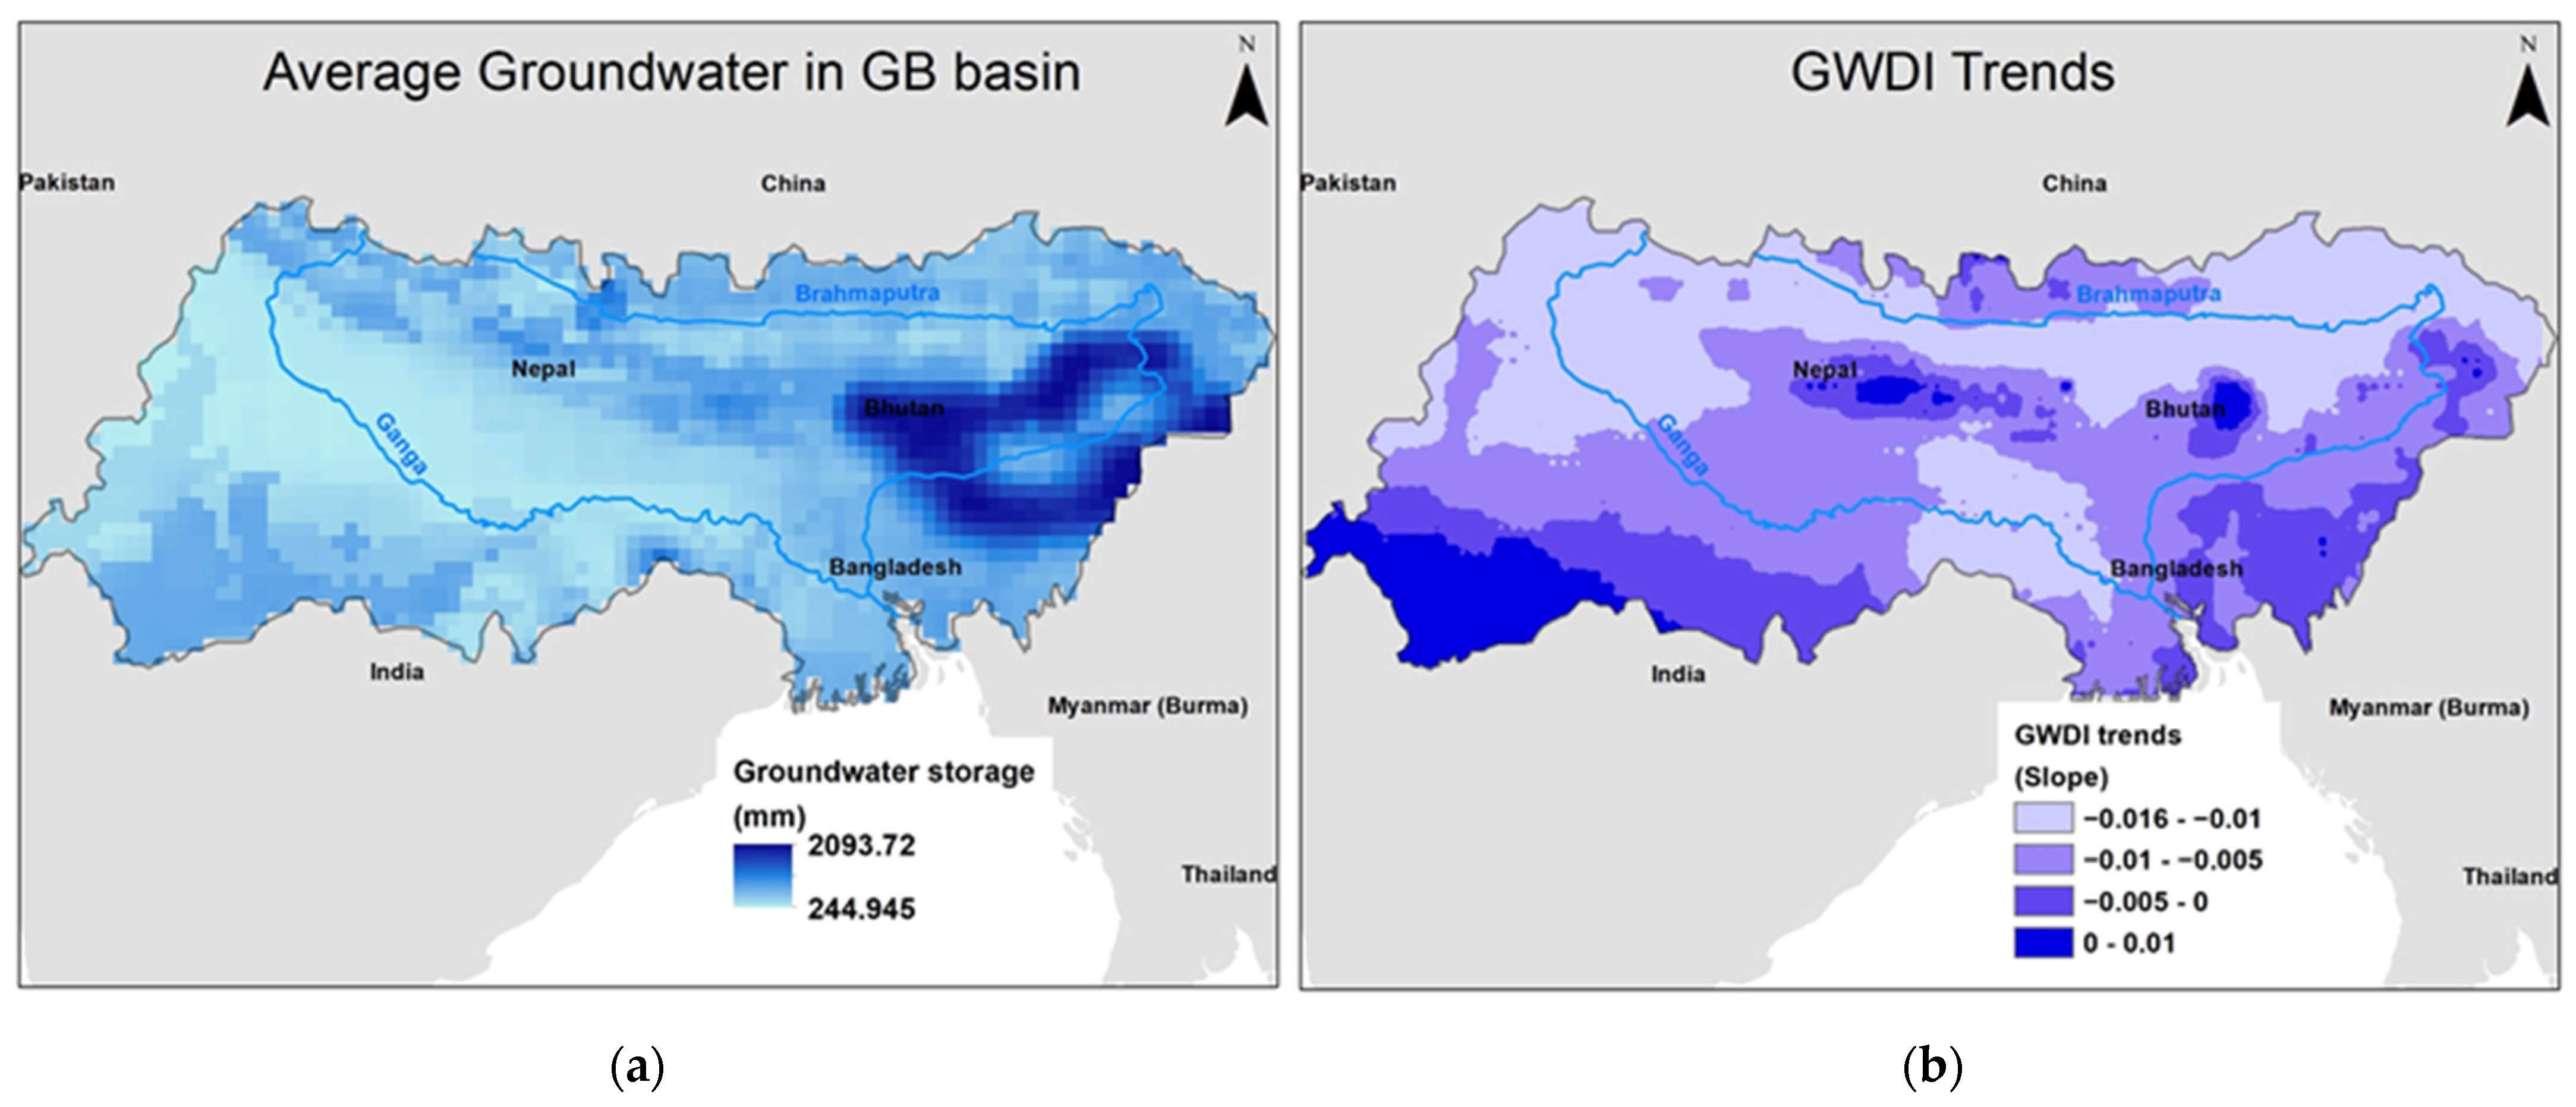
SPI calculated at different time scales also showed decreasing trend, indicating increase in drought events for the basin. Significant decreasing trends of SPI were observed in the central and eastern basins, and more significant trends were observed in SPI calculated for longer time scales. Increasing trends in SPI were observed in the southwestern basin. Drought events increased in frequency and severity over the past two decades. The winter drought in 1992 affected 97% of the whole basin, and other winter droughts occurred in 1999 and 2006. The 2009 monsoon received significantly low precipitation as compared to other years; more than half of the basin was under drought. As groundwater is mainly extracted and used for irrigation, more intense droughts and declining precipitation over the past years have exacerbated groundwater depletion in the basin. Figure 11a shows spatial distribution of groundwater along the basin. Groundwater Drought Index was calculated with GRACE-assimilated CLSM groundwater data between 2003 and 2020 [55], and trends in groundwater drought were studied with the MK trend test. Details about GWDI is presented in Appendix A. Consistent with SPI trends, GWDI exhibited a decreasing trend in about 86% of pixels, and positive slope was observed in a small region along the southwestern basin. Due to decrease in precipitation, the rate of groundwater extraction was higher than the rate of groundwater replenishment. Multipurpose reservoirs to collect monsoon water for winter and dry season irrigation and electricity production would be a big step in order to cope with increasing droughts and water deficiency [34].
Principal components were extracted for SPIs at different time scales. Variance was distributed over a number of principal components, except for 3 months SPI in February, i.e., winter drought. Drought pattern was complex for Ganga–Brahmaputra Basin for all other periods except for winter, similar to the drought pattern in Gandaki River Basin, one of the sub-basins of Ganga–Brahmaputra, as studied by Dahal et al. using gauge precipitation [18]. As 95% of the variance was explained by the first two PCs, winter drought was characterized by clear spatial patterns. Satellite-based precipitation estimate, PERSIANN-CDR, can detect drought events, the spatial patterns of drought, and precipitation trends similar to gauge observations [18,25,29].
The obtained results provide information that can be used to improve water resources and drought monitoring and management in the GB basin. Further research should be conducted to thoroughly investigate the impacts of serial correlation and prewhitening in trend analysis. Because of global warming, precipitation patterns are expected to be altered differently in different climate regions, with more extreme precipitation events occurring [56]; the relationship between precipitation patterns and climate can be investigated. Additional studies can be conducted to analyze and forecast extreme precipitation events in future.
5. Conclusions
The annual precipitation in the GB basin was found to be decreasing at the rate of 5.08 mm per year. Change point in basin averaged precipitation occurred around the year 2000, and average precipitation declined from 1333 mm/year to 1200 mm/year. Change point occurred in average precipitation in all elevation regions, indicating precipitation time series is inhomogeneous. A positive trend was observed in March and April precipitation, whereas the basin was dominated by negative trends for other months. Increasing frequency and intensity of drought was indicated by decreasing trend of SPI. There was a clear spatial pattern for winter drought. A complex pattern was observed for monsoon drought and SPI calculated at different time scales. Crop yields and groundwater storage were directly affected by changing precipitation patterns. Satellite precipitation estimates such as PERSIANN-CDR can be more beneficial than gauge precipitation data for climate studies in regions with low gauge density, such as the Himalayas.
Author Contributions
Conceptualization, B.P. and X.Z.; methodology, B.P. and X.Z.; software, B.P.; writing—original draft preparation, B.P.; writing—review and editing, B.P., X.Z., S.D. and Y.L.; visualization, B.P. and S.D.; supervision, X.Z.; project administration, X.Z. and Y.L.; funding acquisition, X.Z. and Y.L. All authors have read and agreed to the published version of the manuscript.
Funding
This work was supported by the National Natural Science Foundation of China program (41801339) and Natural Science Foundation of Hubei Province (2020CFB615).
Institutional Review Board Statement
Not applicable.
Informed Consent Statement
Not applicable.
Data Availability Statement
PERSIANN-CDR precipitation data can be downloaded from (https://chrsdata.eng.uci.edu; accessed on 13 April 2021).
Acknowledgments
We are grateful to the producer of PERSIANN-CDR and CHRS data portal (https://chrsdata.eng.uci.edu; accessed on 13 April 2021), which made precipitation data freely available for public use.
Conflicts of Interest
The authors declare no conflict of interest.
Appendix A
Standardized groundwater index (SGI)/Groundwater Drought Index (GWDI) is calculated as
where is groundwater for ith month of jth year, is average groundwater for ith month over the entire study period, and is the standard deviation of groundwater.
References
- Ahmad, I.; Tang, D.; Wang, T.; Wang, M.; Wagan, B. Precipitation Trends over Time Using Mann-Kendall and Spearman’s rho Tests in Swat River Basin, Pakistan. Adv. Meteorol. 2015, 1–15. [Google Scholar] [CrossRef] [Green Version]
- Marino, P.; Peres, D.J.; Cancelliere, A.; Greco, R.; Bogaard, T.A. Soil moisture information can improve shallow landslide forecasting using the hydrometeorological threshold approach. Landslides 2020, 17, 2041–2054. [Google Scholar] [CrossRef]
- Hosseinzadehtalaei, P.; Tabari, H.; Willems, P. Climate change impact on short-duration extreme precipitation and intensity–duration–frequency curves over Europe. J. Hydrol. 2020, 590, 125249. [Google Scholar] [CrossRef]
- Ashouri, H.; Hsu, K.-L.; Sorooshian, S.; Braithwaite, D.K.; Knapp, K.; Cecil, L.D.; Nelson, B.R.; Prat, O. PERSIANN-CDR: Daily Precipitation Climate Data Record from Multisatellite Observations for Hydrological and Climate Studies. Bull. Am. Meteorol. Soc. 2015, 96, 69–83. [Google Scholar] [CrossRef] [Green Version]
- Huffman, G.J.; Bolvin, D.T.; Braithwaite, D.; Hsu, K.; Joyce, R.; Xie, P.; Yoo, S.H. NASA global precipitation measurement (GPM) integrated multi-satellite retrievals for GPM (IMERG). Algorithm Theor. Basis Doc. (ATBD) Version 2015, 4, 26. [Google Scholar]
- Ostrenga Dana. README Document for MERRA-2 Data Products; Goddard Earth Sciences Data and Information Services Center (GES DISC): Maryland, MD, USA, 2020; pp. 1–65. [Google Scholar]
- MacRitchie, K. README Document for the Tropical Rainfall Measurement Mission (TRMM) Version 7; Goddard Earth Sciences Data and Information Services Center (GES DISC): Maryland, MD, USA, 2017. [Google Scholar]
- Wei, L.; Jiang, S.; Ren, L.; Yuan, F.; Zhang, L. Performance of Two Long-Term Satellite-Based and GPCC 8.0 Precipitation Products for Drought Monitoring over the Yellow River Basin in China. Sustainability 2019, 11, 4969. [Google Scholar] [CrossRef] [Green Version]
- Sadeghi, M.; Nguyen, P.; Naeini, M.R.; Hsu, K.; Braithwaite, D.; Sorooshian, S. PERSIANN-CCS-CDR, a 3-hourly 0.04◦ global precipitation climate data record for heavy precipitation studies. Sci. Data 2021, 8, 157. [Google Scholar] [CrossRef] [PubMed]
- Li, C.; Tang, G.; Hong, Y. Cross-evaluation of ground-based, multi-satellite and reanalysis precipitation products: Applicability of the Triple Collocation method across Mainland China. J. Hydrol. 2018, 562, 71–83. [Google Scholar] [CrossRef]
- Golian, S.; Javadian, M.; Behrangi, A. On the use of satellite, gauge, and reanalysis precipitation products for drought studies. Environ. Res. Lett. 2019, 14, 075005. [Google Scholar] [CrossRef]
- Liu, Z.; Ostrenga, D.; Teng, W.; Kempler, S. Tropical Rainfall Measuring Mission (TRMM) Precipitation Data and Services for Research and Applications. Bull. Am. Meteorol. Soc. 2012, 93, 1317–1325. [Google Scholar] [CrossRef] [Green Version]
- Bisht, D.S.; Chatterjee, C.; Raghuwanshi, N.S.; Sridhar, V. Spatio-temporal trends of rainfall across Indian river basins. Theor. Appl. Clim. 2018, 132, 419–436. [Google Scholar] [CrossRef]
- Mann, H.B. Nonparametric tests against trend. Econometrica 1945, 13, 245–259. [Google Scholar] [CrossRef]
- Da Silva, R.M.; Santos, C.A.; Moreira, M.; Corte-Real, J.; Silva, V.C.; Medeiros, I.C. Rainfall and river flow trends using Mann—Kendall and Sen ’ s slope estimator statistical tests in the Cobres River basin. Nat. Hazards 2015, 77, 1205–1221. [Google Scholar] [CrossRef]
- Halder, S.; Roy, M.B.; Roy, P.K. Analysis of groundwater level trend and groundwater drought using Standard Groundwater Level Index: A case study of an eastern river basin of West Bengal, India. SN Appl. Sci. 2020, 2, 1–24. [Google Scholar] [CrossRef] [Green Version]
- Cengiz, T.M.; Tabari, H.; Onyutha, C.; Kisi, O. Combined Use of Graphical and Statistical Approaches for Analyzing Historical Precipitation Changes in the Black Sea Region of Turkey. Water 2020, 12, 705. [Google Scholar] [CrossRef] [Green Version]
- Dahal, P.; Shrestha, N.S.; Shrestha, M.L.; Krakauer, N.Y.; Panthi, J.; Pradhanang, S.M.; Jha, A.; Lakhankar, T. Drought risk assessment in central Nepal: Temporal and spatial analysis. Nat. Hazards 2016, 80, 1913–1932. [Google Scholar] [CrossRef] [Green Version]
- Liang, L.; Sun, Q.; Luo, X.; Wang, J.; Zhang, L.; Deng, M.; Di, L.; Liu, Z. Long-term spatial and temporal variations of vegetative drought based on vegetation condition index in China. Ecosphere 2017, 8, e01919. [Google Scholar] [CrossRef]
- Liang, L.; Geng, D.; Huang, T.; Di, L.; Lin, L.; Sun, Z. VCI-based Analysis of Spatio-temporal Variations of Spring Drought in China from 1981 to 2015. In Proceedings of the 2019 8th International Conference on Agro-Geoinformatics (Agro-Geoinformatics), Istanbul, Turkey, 16–19 July 2019; pp. 1–6. [Google Scholar]
- Qian, X.; Liang, L.; Shen, Q.; Sun, Q.; Zhang, L.; Liu, Z.; Zhao, S.; Qin, Z. Drought trends based on the VCI and its correlation with climate factors in the agricultural areas of China from 1982 to 2010. Environ. Monit. Assess. 2016, 188, 639. [Google Scholar] [CrossRef]
- Vissa, N.K.; Anandh, P.; Behera, M.M.; Mishra, S. ENSO-induced groundwater changes in India derived from GRACE and GLDAS. J. Earth Syst. Sci. 2019, 128, 115. [Google Scholar] [CrossRef] [Green Version]
- Sobral, B.S.; de Oliveira-Júnior, J.F.; Alecrim, F.; Gois, G.; Muniz-Júnior, J.G.; de Bodas Terassi, P.M.; Pereira-Júnior, E.R.; Lyra, G.B.; Zeri, M. PERSIANN-CDR based characterization and trend analysis of annual rainfall in Rio De Janeiro State, Brazil. Atmos. Res. 2020, 238, 104873. [Google Scholar] [CrossRef]
- Sa’adi, Z.; Shahid, S.; Ismail, T.; Chung, E.S.; Wang, X.J. Trends analysis of rainfall and rainfall extremes in Sarawak, Malaysia using modified Mann—Kendall test. Meteorol. Atmos. Phys. 2019, 131, 263–277. [Google Scholar] [CrossRef]
- Bera, S. Trend Analysis of Rainfall in Ganga Basin, India during 1901–2000. Am. J. Clim. Chang. 2017, 6, 116–131. [Google Scholar] [CrossRef] [Green Version]
- Curtis, S.; Crawford, T.; Rahman, M.; Paul, B.; Miah, M.G.; Islam, M.R.; Patel, M. A Hydroclimatological Analysis of Precipitation in the Ganges—Brahmaputra—Meghna River Basin. Water 2018, 10, 1359. [Google Scholar] [CrossRef] [Green Version]
- Ebi, K.L.; Bowen, K. Extreme events as sources of health vulnerability: Drought as an example. Weather. Clim. Extremes 2016, 11, 95–102. [Google Scholar] [CrossRef] [Green Version]
- McKee, T.B.; Doesken, N.J.; Kleist, J. The relationship of drought frequency and duration to time scales. In Proceedings of the 8th Conference on Applied Climatology, Boston, MA, USA, 17–22 January 1993; Volume 17, pp. 179–183. [Google Scholar]
- Sigdel, M.; Ikeda, M. Spatial and Temporal Analysis of Drought in Nepal using Standardized Precipitation Index and its Relationship with Climate Indices. J. Hydrol. Meteorol. 2010, 7, 59–74. [Google Scholar] [CrossRef]
- Diaz, V.; Corzo, G.; Van Lanen, H.A.; Solomatine, D.P. Spatiotemporal Drought Analysis at Country Scale Through the Application of the STAND Toolbox; Spatiotemporal Analysis of Extreme Hydrological Events; Corzo, G., Varouchakis, E.A., Eds.; Elsevier, BV: Amsterdam, The Netherlands, 2019; pp. 77–93. [Google Scholar]
- Krakauer, N.Y. Year-ahead predictability of South Asian Summer Monsoon precipitation. Environ. Res. Lett. 2019, 14, 044006. [Google Scholar] [CrossRef]
- Masood, M.; Takeuchi, K. Persistence Characteristics of Floods and Droughts of the Ganges-Brahmaputra-Meghna Basins Using Flood Duration Curve and Drought Duration Curve. J. Water Resour. Hydraul. Eng. 2015, 413–421. [Google Scholar] [CrossRef]
- Ahmad, Q.-U.-A.; Biemans, H.; Moors, E.; Shaheen, N.; Masih, I. The Impacts of Climate Variability on Crop Yields and Irrigation Water Demand in South Asia. Water 2020, 13, 50. [Google Scholar] [CrossRef]
- Rasul, G. Water for growth and development in the Ganges, Brahmaputra, and Meghna basins: An economic perspective. Int. J. River Basin Manag. 2015, 13, 387–400. [Google Scholar] [CrossRef] [Green Version]
- Forootan, E.; Schumacher, M.; Awange, J.L.; Schmied, H.M. Exploring the influence of precipitation extremes and human water use on total water storage (TWS) changes in the Ganges-Brahmaputra-Meghna River Basin. Water Resour. Res. 2016, 52, 2240–2258. [Google Scholar] [CrossRef] [Green Version]
- Wang, S.-Y.; Yoon, J.-H.; Gillies, R.R.; Cho, C. What Caused the Winter Drought in Western Nepal during Recent Years? J. Clim. 2013, 26, 8241–8256. [Google Scholar] [CrossRef]
- Nguyen, P.; Shearer, E.J.; Tran, H.; Ombadi, M.; Hayatbini, N.; Palacios, T.; Huynh, P.; Braithwaite, D.; Updegraff, G.; Hsu, K.; et al. The CHRS Data Portal, an easily accessible public repository for PERSIANN global satellite precipitation data. Sci. Data 2019, 6, 180296. [Google Scholar] [CrossRef] [PubMed] [Green Version]
- Guo, H.; Bao, A.; Liu, T.; Chen, S.; Ndayisaba, F. Evaluation of PERSIANN-CDR for Meteorological Drought Monitoring over China. Remote. Sens. 2016, 8, 379. [Google Scholar] [CrossRef] [Green Version]
- Yue, S.; Wang, C.Y. Applicability of prewhitening to eliminate the influence of serial correlation on the Mann-Kendall test. Water Resour. Res. 2002, 38, 1–7. [Google Scholar] [CrossRef]
- Mahmud, I. pyMannKendall: A python package for non parametric Mann Kendall family of trend tests. J. Open Source Softw. 2019, 4. [Google Scholar] [CrossRef]
- Pettitt, A.N. A Non-Parametric Approach to the Change-Point Problem. J. R. Stat. Soc. Ser. C Appl. Stat. 1979, 28, 126. [Google Scholar] [CrossRef]
- Jaiswal, R.K.; Lohani, A.K.; Tiwari, H.L. Statistical Analysis for Change Detection and Trend Assessment in Climatological Parameters. Environ. Process. 2015, 2, 729–749. [Google Scholar] [CrossRef] [Green Version]
- Alexandersson, H. A homogeneity test applied to precipitation data. J. Clim. 1986, 6, 661–675. [Google Scholar] [CrossRef]
- Pyhomogeneity—PyPI. Available online: https://pypi.org/project/pyhomogeneity/ (accessed on 22 June 2021).
- World Meteorological Organization (WMO). Standardized Precipitation Index User Guide (WMO-No. 1090); Wood World Meteorological Organization: Geneva, Switzerland, 2012. [Google Scholar]
- Raziei, T.; Saghafian, B.; Paulo, A.; Pereira, L.S.; Bordi, I. Spatial Patterns and Temporal Variability of Drought in Western Iran. Water Resour. Manag. 2008, 23, 439–455. [Google Scholar] [CrossRef] [Green Version]
- Werner, P.C.; Sutera, A.; Bordi, I.; Fraedrich, K.; Gerstengarbe, F.-W. Potential predictability of dry and wet periods: Sicily and Elbe-Basin (Germany). Theor. Appl. Clim. 2004, 77, 125–138. [Google Scholar] [CrossRef]
- Vicente-Serrano, S.M. Differences in Spatial Patterns of Drought on Different Time Scales: An Analysis of the Iberian Peninsula. Water Resour. Manag. 2006, 20, 37–60. [Google Scholar] [CrossRef]
- Jolliffe, I.T. PRINCIPAL COMPONENT ANALYSIS: A BEGINNER’S GUIDE—I. Introduction and application. Weather 1990, 45, 375–382. [Google Scholar] [CrossRef]
- Zou, L.; Xia, J.; She, D. Drought Characteristic Analysis Based on an Improved PDSI in the Wei River Basin of China. Water 2017, 9, 178. [Google Scholar] [CrossRef] [Green Version]
- Cai, W.; Zhang, Y.; Chen, Q.; Yao, Y. Spatial Patterns and Temporal Variability of Drought in Beijing-Tianjin-Hebei Metropolitan Areas in China. Adv. Meteorol. 2015, 2015, 1–14. [Google Scholar] [CrossRef]
- Wang, S.Y.; Gillies, R.R. Influence of the Pacific quasi-decadal oscillation on the monsoon precipitation in Nepal. Clim. Dyn. 2013, 40, 95–107. [Google Scholar] [CrossRef]
- Siderius, C.; Biemans, H.; Van Walsum, P.E.V.; Van Ierland, E.C.; Kabat, P.; Hellegers, P.J.G.J. Flexible Strategies for Coping with Rainfall Variability: Seasonal Adjustments in Cropped Area in the Ganges Basin. PLoS ONE 2016, 11, e0149397. [Google Scholar] [CrossRef] [PubMed] [Green Version]
- Kumar, S.; Merwade, V.; Kam, J.; Thurner, K. Streamflow trends in Indiana: Effects of long term persistence, precipitation and subsurface drains. J. Hydrol. 2009, 374, 171–183. [Google Scholar] [CrossRef]
- Li, B.; Rodell, M.; Kumar, S.; Beaudoing, H.K.; Getirana, A.; Zaitchik, B.F.; De Goncalves, L.G.; Cossetin, C.; Bhanja, S.; Mukherjee, A.; et al. Global GRACE Data Assimilation for Groundwater and Drought Monitoring: Advances and Challenges. Water Resour. Res. 2019, 55, 7564–7586. [Google Scholar] [CrossRef] [Green Version]
- Tabari, H. Climate change impact on flood and extreme precipitation increases with water availability. Sci. Rep. 2020, 10, 1–10. [Google Scholar] [CrossRef]
Figure 1.
Location of Ganga–Brahmaputra River Basin with average annual precipitation (a) and elevation (b).
Figure 1.
Location of Ganga–Brahmaputra River Basin with average annual precipitation (a) and elevation (b).

Figure 2.
Change points in annual precipitation time series in whole basin and in three elevation regions.
Figure 2.
Change points in annual precipitation time series in whole basin and in three elevation regions.

Figure 3.
Trend of annual precipitation in GB basin.

Figure 4.
Percentage of pixels with significant increasing and decreasing trends.

Figure 5.
Monthly precipitation trends across the Ganga–Brahmaputra Basin.

Figure 6.
(a) Trends of 1 month SPI, (b) trends of 3 month SPI, (c) trends of 6 month SPI, (d) trends of 12 month SPI.
Figure 6.
(a) Trends of 1 month SPI, (b) trends of 3 month SPI, (c) trends of 6 month SPI, (d) trends of 12 month SPI.

Figure 7.
Winter and monsoon droughts in the Ganga–Brahmaputra Basin.

Figure 8.
Loading patterns of three principal components of 12 month SPI (a–c) and rotated loadings (d–f).
Figure 8.
Loading patterns of three principal components of 12 month SPI (a–c) and rotated loadings (d–f).

Figure 9.
Loading patterns of two principal components of winter drought (a,b) and rotated loadings (c,d).
Figure 9.
Loading patterns of two principal components of winter drought (a,b) and rotated loadings (c,d).

Figure 10.
Loading patterns of two principal components of monsoon drought (a,b) and rotated loadings (c,d).
Figure 10.
Loading patterns of two principal components of monsoon drought (a,b) and rotated loadings (c,d).

Figure 11.
(a) Average groundwater and (b) GWDI trends in Ganga–Brahmaputra Basin.


Table 1.
Average annual precipitation trends in Ganga–Brahmaputra Basin (p < 0.05).
| Region | Original MK Test | Modified MK Test | Pettitt’s Test | ||||
|---|---|---|---|---|---|---|---|
| Trend | Z | Slope | Trend | Z | Slope | Change Year | |
| Whole Basin | Decreasing | −3.847 | −5.807 | Decreasing | −2.2 | −5.80 | 2000 |
| 0–200 m | Decreasing | −4.32 | −11.63 | Decreasing | −2.5 | −11.6 | 2004 |
| 200–2000 m | Decreasing | −2.51 | −4.45 | Decreasing | −2.0 | −4.45 | 1999 |
| 2000+ m | Decreasing | −2.06 | −2.21 | Decreasing | −2.1 | −2.21 | 2004 |
Table 2.
Percentage of variance explained by loadings without rotation.
| PCs | PC1 | PC2 | PC3 | PC4 | PC5 | PC6 | PC7 | PC8 | PC9 | PC10 |
|---|---|---|---|---|---|---|---|---|---|---|
| SPI 12 | 30.64 | 21.33 | 7.265 | 5.93 | 5.102 | 3.963 | 2.425 | 2.285 | 2.033 | 1.833 |
| SPI6 | 31.383 | 20.086 | 5.755 | 5.405 | 4.409 | 3.980 | 2.523 | 2.361 | 1.925 | 1.809 |
| SPI3 | 32.844 | 19.466 | 5.642 | 4.725 | 3.981 | 3.693 | 2.637 | 2.299 | 2.130 | 1.780 |
| SPI1 | 32.679 | 19.899 | 5.897 | 4.531 | 3.788 | 3.249 | 2.641 | 2.319 | 1.916 | 1.664 |
| SPI winter | 88.855 | 6.352 | 2.117 | |||||||
| SPI monsoon | 28.268 | 20.730 | 8.296 | 6.512 | 5.161 | 4.093 | 3.139 | 2.826 | 2.491 | 2.101 |
Table 3.
Percentage of variance explained by loadings with varimax rotation.
| PCs | PC1 | PC2 | PC3 | PC4 | PC5 | PC6 | PC7 | PC8 | PC9 | PC10 |
|---|---|---|---|---|---|---|---|---|---|---|
| SPI 12 | 16.342 | 14.524 | 12.429 | 11.531 | 6.760 | 6.402 | 3.617 | 3.238 | 3.052 | 2.891 |
| SPI6 | 15.016 | 13.277 | 12.618 | 11.838 | 6.527 | 5.890 | 4.009 | 3.555 | 3.360 | 2.584 |
| SPI3 | 15.406 | 12.980 | 11.461 | 9.748 | 7.362 | 5.324 | 5.139 | 4.030 | 3.528 | 3.469 |
| SPI1 | 14.886 | 11.552 | 11.213 | 9.881 | 8.619 | 6.745 | 4.944 | 4.553 | 4.166 | 2.025 |
| SPI winter | 74.324 | 12.191 | 10.809 | |||||||
| SPI monsoon | 15.469 | 13.261 | 11.785 | 11.383 | 7.059 | 6.836 | 4.885 | 4.774 | 4.029 | 3.149 |
Publisher’s Note: MDPI stays neutral with regard to jurisdictional claims in published maps and institutional affiliations. |
© 2021 by the authors. Licensee MDPI, Basel, Switzerland. This article is an open access article distributed under the terms and conditions of the Creative Commons Attribution (CC BY) license (https://creativecommons.org/licenses/by/4.0/).
Share and Cite
MDPI and ACS Style
Parajuli, B.; Zhang, X.; Deuja, S.; Liu, Y. Regional and Seasonal Precipitation and Drought Trends in Ganga–Brahmaputra Basin. Water 2021, 13, 2218. https://doi.org/10.3390/w13162218
AMA Style
Parajuli B, Zhang X, Deuja S, Liu Y. Regional and Seasonal Precipitation and Drought Trends in Ganga–Brahmaputra Basin. Water. 2021; 13(16):2218. https://doi.org/10.3390/w13162218
Chicago/Turabian StyleParajuli, Bikram, Xiang Zhang, Sudip Deuja, and Yingbing Liu. 2021. "Regional and Seasonal Precipitation and Drought Trends in Ganga–Brahmaputra Basin" Water 13, no. 16: 2218. https://doi.org/10.3390/w13162218
Note that from the first issue of 2016, this journal uses article numbers instead of page numbers. See further details here.