
Laboratory Analysis of Debris Flow Characteristics and Berm Performance


School of Civil Engineering, Chungbuk National University, Cheongju 28644, Korea
*
Author to whom correspondence should be addressed.
Water 2021, 13(16), 2223; https://doi.org/10.3390/w13162223
Submission received: 16 June 2021
/
Revised: 24 July 2021
/
Accepted: 14 August 2021
/
Published: 16 August 2021
(This article belongs to the Special Issue Mechanism and Prevention of Debris Flow Disaster)
Abstract
:In this study, laboratory tests were used to determine the deposition characteristics (runout distance, lateral width, and deposition area) of debris flow and their relationships with the flow characteristics (flow velocity and flow depth) according to the presence of a berm. An experimental flume 1.3 to 1.9 m long, 0.15 m wide, and 0.3 m high was employed to investigate the effects of channel slope and volumetric concentration of sediment with and without the berm. The runout distance (0.201–1.423 m), lateral width (0.045–0.519 m), and deposition area (0.008–0.519 m2) increased as the channel slope increased and as the volumetric concentration of sediment decreased. These quantities also increased with the flow velocity and flow depth. In addition, the maximum reductions in the runout distance, lateral width, and deposition area were 69.1%, 65.9%, and 93%, respectively, upon berm installation. The results of this study illustrate general debris flow characteristics according to berm installation; the reported relationship magnitudes are specific to the experimental conditions described herein. However, the results of this study contribute to the design of site-specific berms in the future by providing data describing the utility and function of berms in mitigating debris flow.
1. Introduction
In recent years, the frequency of torrential rainfall in Korea has increased due to climate change caused by global warming and human activities, increasing the frequency of slope disasters, including landslides and debris flow [1]. Debris flow, a type of slope disaster that occurs in mountainous areas, has often occurred over the last few decades in Korea, where mountainous areas represent more than 60% of the total area. In particular, ongoing urbanization has significantly increased the risk of debris flow in urban areas adjacent to mountainous areas [2]. In 2011, a large-scale debris flow occurred on Mt. Woomyeon, adjacent to an urban area in Seoul, resulting in 49 deaths [3,4]. Including this incident, 824 ha of debris flow damage occurred during that year. In 2020, heavy rainfall caused 1343 ha of debris flow damage under the influence of typhoons Jangmi, Bavi, Maysak, and Haishen. Indeed, debris flow has recently been classified as a kind of natural disaster with high risk and frequency in Korea [5,6], and the potential damage caused by debris flows in the future could be much larger due to urbanization [7].
Debris flow is a mass movement toward downstream areas along a flow path under the influence of gravity, and can be a mixture of water, clay, soil, gravel, rock, boulder, and timber [3,5,8]. It can be caused by various factors, such as heavy rainfall, typhoons, snowmelt, earthquakes, volcanoes, and human activities [9,10]. Most of the debris flow in Korea occurs owing to typhoons and heavy rainfall [2,11]. The sediment–water mixture, whose density is approximately twice that of water, may cause serious human casualties and property damage in downstream areas owing to transport and deposition within a short period of time, a result of its high mobility [12,13]. The high mobility of debris flow results from the momentum exchange through interactions between the sediment and fluid via particle friction, particle collision, and the viscosity of the pore fluid [8,14,15,16]. In general, it is difficult to predict a debris flow because it may occur without a clear warning despite preceding torrential rainfall [10]. Risk estimation and proper response may also be difficult because debris flow can significantly increase in magnitude through the absorption of sediment and water from riverbeds owing to its instability and erosive force [17,18]. Therefore, it is necessary to conduct relevant research and prepare efficient mitigation measures to reduce the potential damage caused by debris flows.
Debris flow mitigation measures can be divided into structural and non-structural measures. Structural measures reduce the damage caused by debris flow by installing structures in the generation, transport, or deposition path of debris flow. They include check dams (open and closed types), flexible debris flow barriers, baffles, and berms. Non-structural measures do not consider direct structure installation and instead include land use regulations, risk maps, education, and forecasting and warning systems. Other non-structural measures considered for debris flow mitigation include the assessment of the frictional resistance and shear strength of the ground in a potential debris flow area and the improvement of ground strength using straw fibers [19,20,21]. These latter approaches are based on an advancing understanding of the interaction between ground and subsurface objects to improve the stability of the ground.
The applicability of debris flow mitigation measures varies depending on the magnitude of the debris flow, risk factors, topography, and budget [17]. Debris flow risk overestimation may cause unnecessary expenses, whereas underestimation may increase the scale of human casualties and property damage because debris flow damage cannot be sufficiently reduced [22]. For areas in which the precipitation and channel slope that cause debris flow are known based on forecasting and warning systems, evacuation and relocation are the most appropriate methods of reducing debris flow damage [10]. Otherwise, measures that partially reduce debris flow damage are mainly applied because the implementation of measures that completely prevent debris flow damage may incur excessive costs [23]. Check dams, which are frequently considered to be debris flow mitigation measures, are suitable for controlling channelized debris flow, and their use in major facilities is generally limited because they entail considerable construction costs [10]. In addition, check dams constitute the primary form of debris flow mitigation measure implemented in Korea, and as a result, there has been a great deal of research on debris flow mitigation focusing on check dams. However, debris flow in urban areas is often limited to a small scale without full development because of its relatively short travel distance, and studies on the mitigation of this type of debris flow, which cannot justify the cost of a check dam, are presently insufficient.
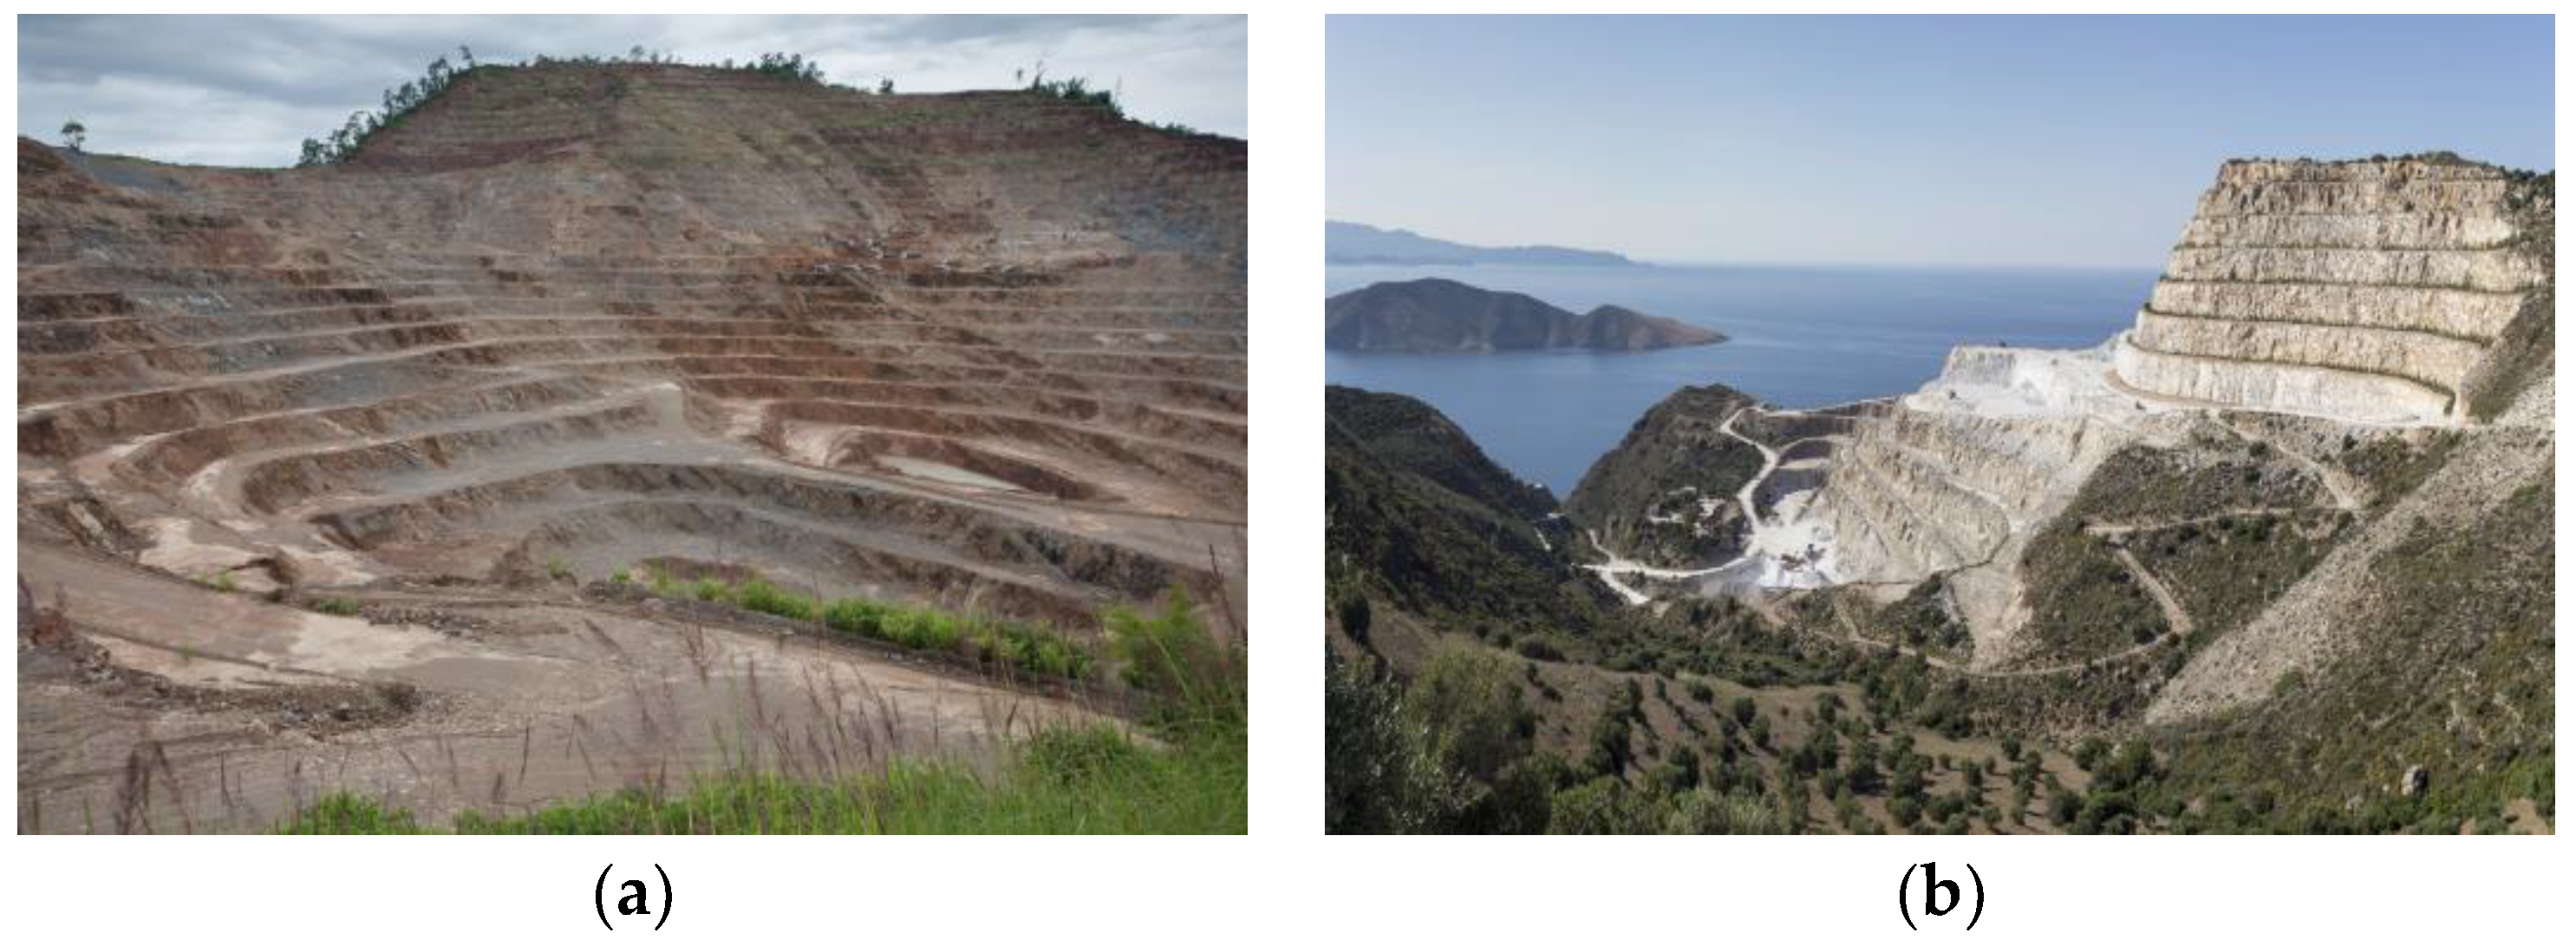
Therefore, in this study, berms were considered to be mitigation measures considering the recent sharp increase in the occurrence of debris flow in urban areas in Korea. Figure 1 shows examples of berms installed on actual slopes. Berms are stepped structures that divide slopes into several sections, disperse rainwater, and reduce debris flow velocity [4,24]. They also reduce riverbed erosion by increasing the resistance of each section and dissipating the energy of the debris flow [25]. Berms are judged to be particularly suitable for debris flow mitigation in urban areas because they require relatively low construction costs compared to other debris flow mitigation measures and exhibit high efficiency on short slopes [10,25].
Recently, studies have been conducted to analyze the performance of various debris flow mitigation measures through numerical analyses and laboratory tests. Lin et al. [26] examined the blocking effect of slit dams and their interaction with debris flow through a laboratory test based on the characteristics of the Yanmen gully. Wang et al. [27] investigated the velocity reduction and energy dissipation of debris flow through laboratory tests considering cubic, trapezoidal, and triangular prism-shaped baffles. Chen et al. [28] analyzed the roughness coefficient of the energy dissipation structure section installed in a channel through laboratory tests and prototype observations. Jiang et al. [29] studied the deformation mechanism of a flexible net barrier during the debris flow impact process through laboratory tests and numerical simulations. Tan et al. [30] assessed the interaction between debris flow and a flexible barrier by conducting a physical modeling test.
Studies have also been conducted to elucidate the effects of channel topography considering berms or stepped channels as debris flow mitigation measures. Kim and Lee [31] evaluated the behavior and mechanism of debris flow in a single-berm channel according to the channel slope and the amount of debris supply using the finite difference method based on the mass and momentum conservation equations. In analyzing the results, they compared the debris flow discharge, volumetric concentration of sediment, and flow depth in a single-berm channel with those in a straight channel. De Stefano et al. [32] proposed the use of single and multiple soil berms to control the mobility of debris flow and reduce the slope failure risk. They reproduced the behavior of debris flow using the dynamic landslide analysis model, Voellmy flow model, and DAN-W model. Chen et al. [33] conducted laboratory tests and theoretical analyses to identify the structural characteristics, debris flow reduction effect, and design considerations of stepped channels. They determined the structure shape, slope of the stairway section, and total length as design conditions for stepped channels using theoretical approaches. Jiang et al. [34] analyzed the failure mechanism and safety factor of a geotextile-reinforced berm through finite element analysis to determine its stability. Li et al. [35] conducted a three-dimensional smoothed particle hydrodynamics (SPH) study using the normalized Bingham model to analyze the effects of debris flow on a stepped channel with baffles. The performance of the SPH model was confirmed through laboratory tests that considered triangular and rectangular baffles, and the impact force of the debris flow was analyzed for three baffle shapes (square, trapezoid, and triangle) by applying the calibrated SPH model.
Field observations, numerical analyses, and laboratory tests have been widely used to investigate the characteristics and mechanisms of debris flow. Debris flow is difficult to predict because it occurs irregularly and locally, and field observation is also very difficult owing to its non–uniform spatiotemporal behavior [13,36]. Numerical analysis provides relatively high accuracy; however, it is difficult to select parameters through field observations and to secure the observation data required for model verification [6]. Laboratory tests provide useful information for analyzing the relationships among physical variables and developing debris flow mitigation measures [12,37], despite some limitations due to small scaling [38,39]. In addition, laboratory tests are suitable for analyzing debris flow characteristics because various experimental conditions can be evaluated with high repeatability and reproducibility under limited conditions [36,40,41].
Therefore, we performed laboratory tests in this study to assess the deposition characteristics of debris flow according to the channel slope, volumetric concentration of sediment, and presence of a berm. To analyze the influence of the berm, we compared the experimental results for a straight channel without a berm with those of a single-berm channel. Finally, we elucidated the relationships between the debris flow deposition characteristics observed in this study (runout distance, lateral width, and deposition area) and the flow characteristics (flow velocity and flow depth) reported by Chang et al. [4].
2. Materials and Methods
2.1. Experimental Setup
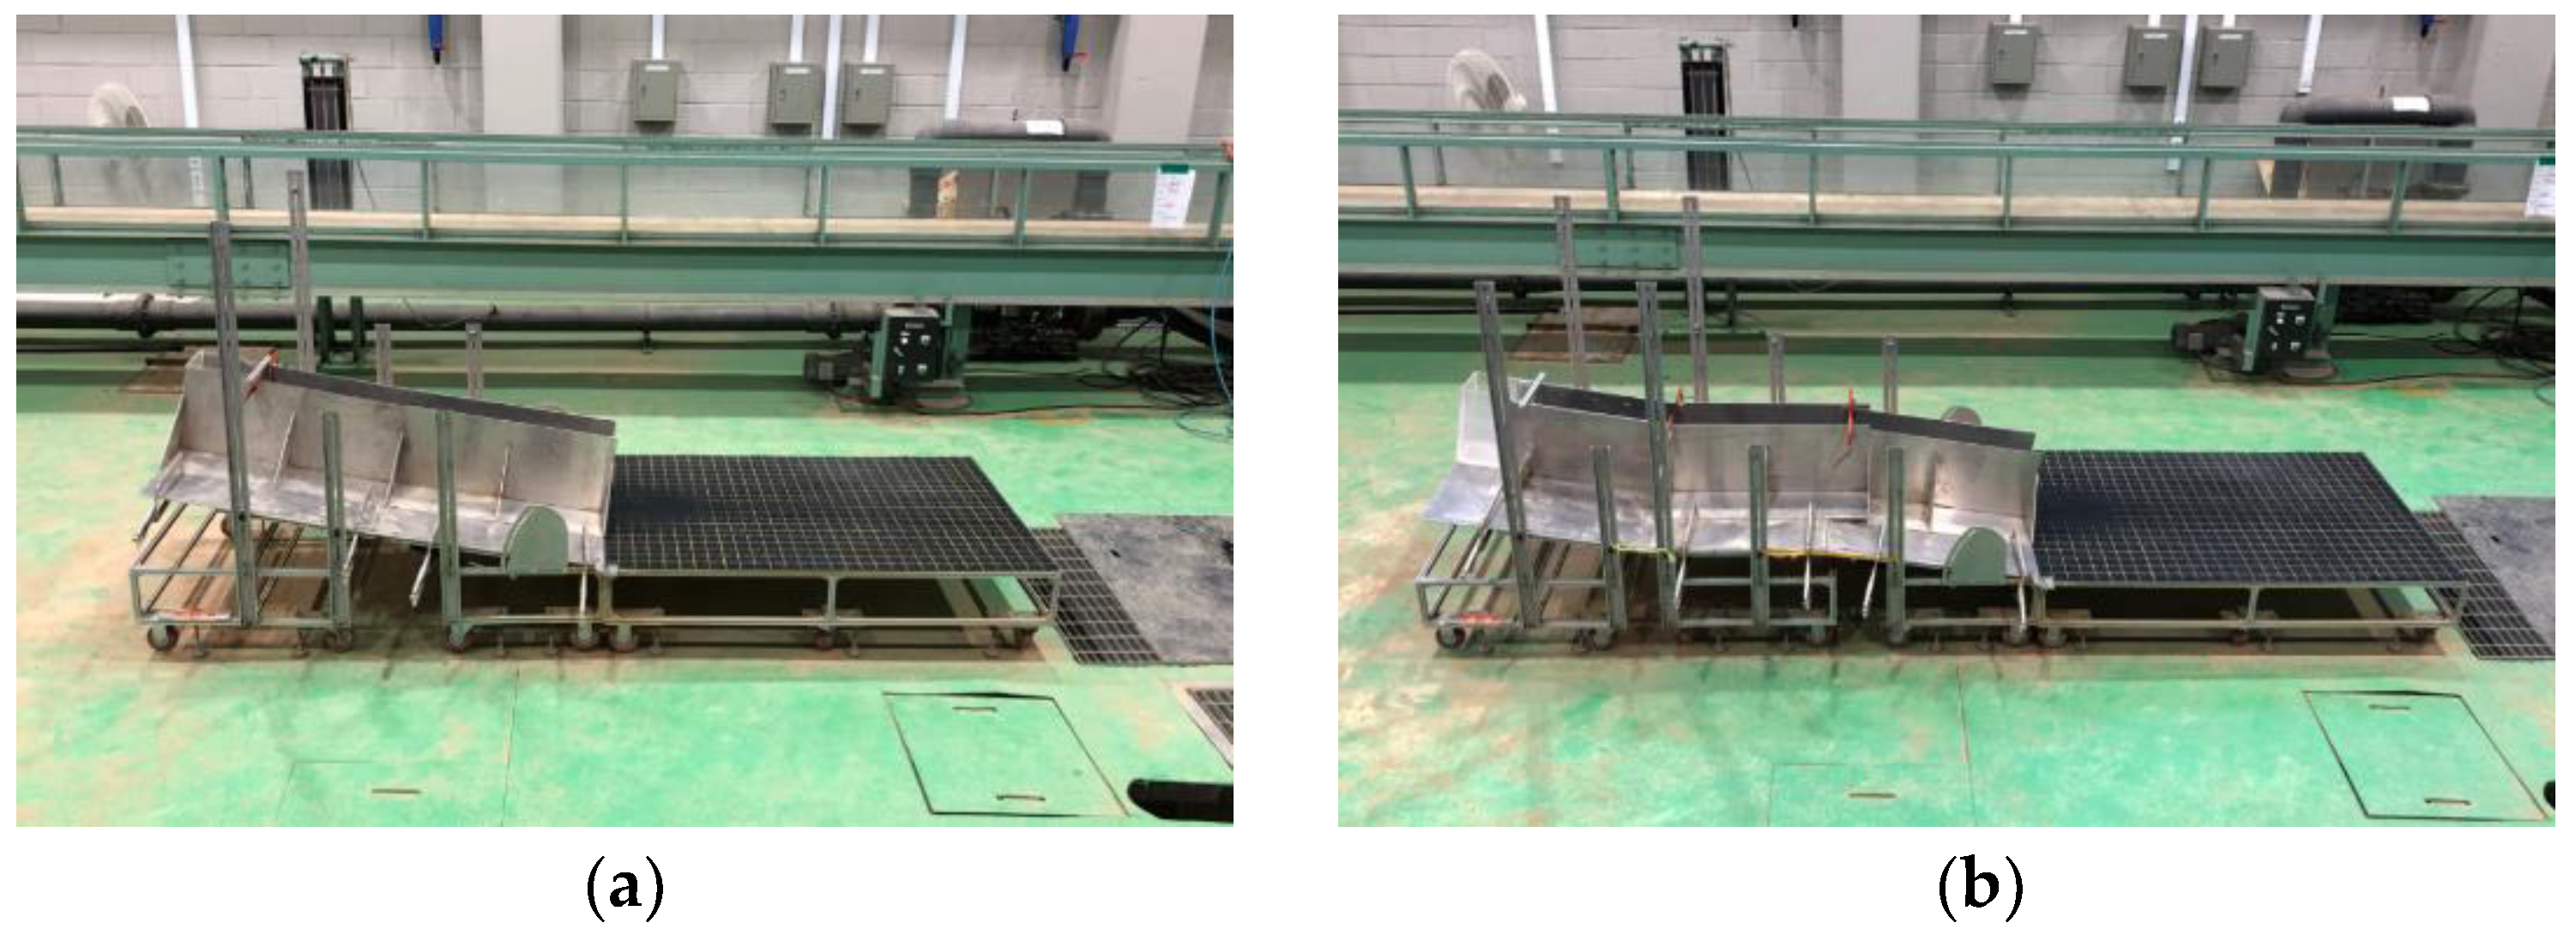
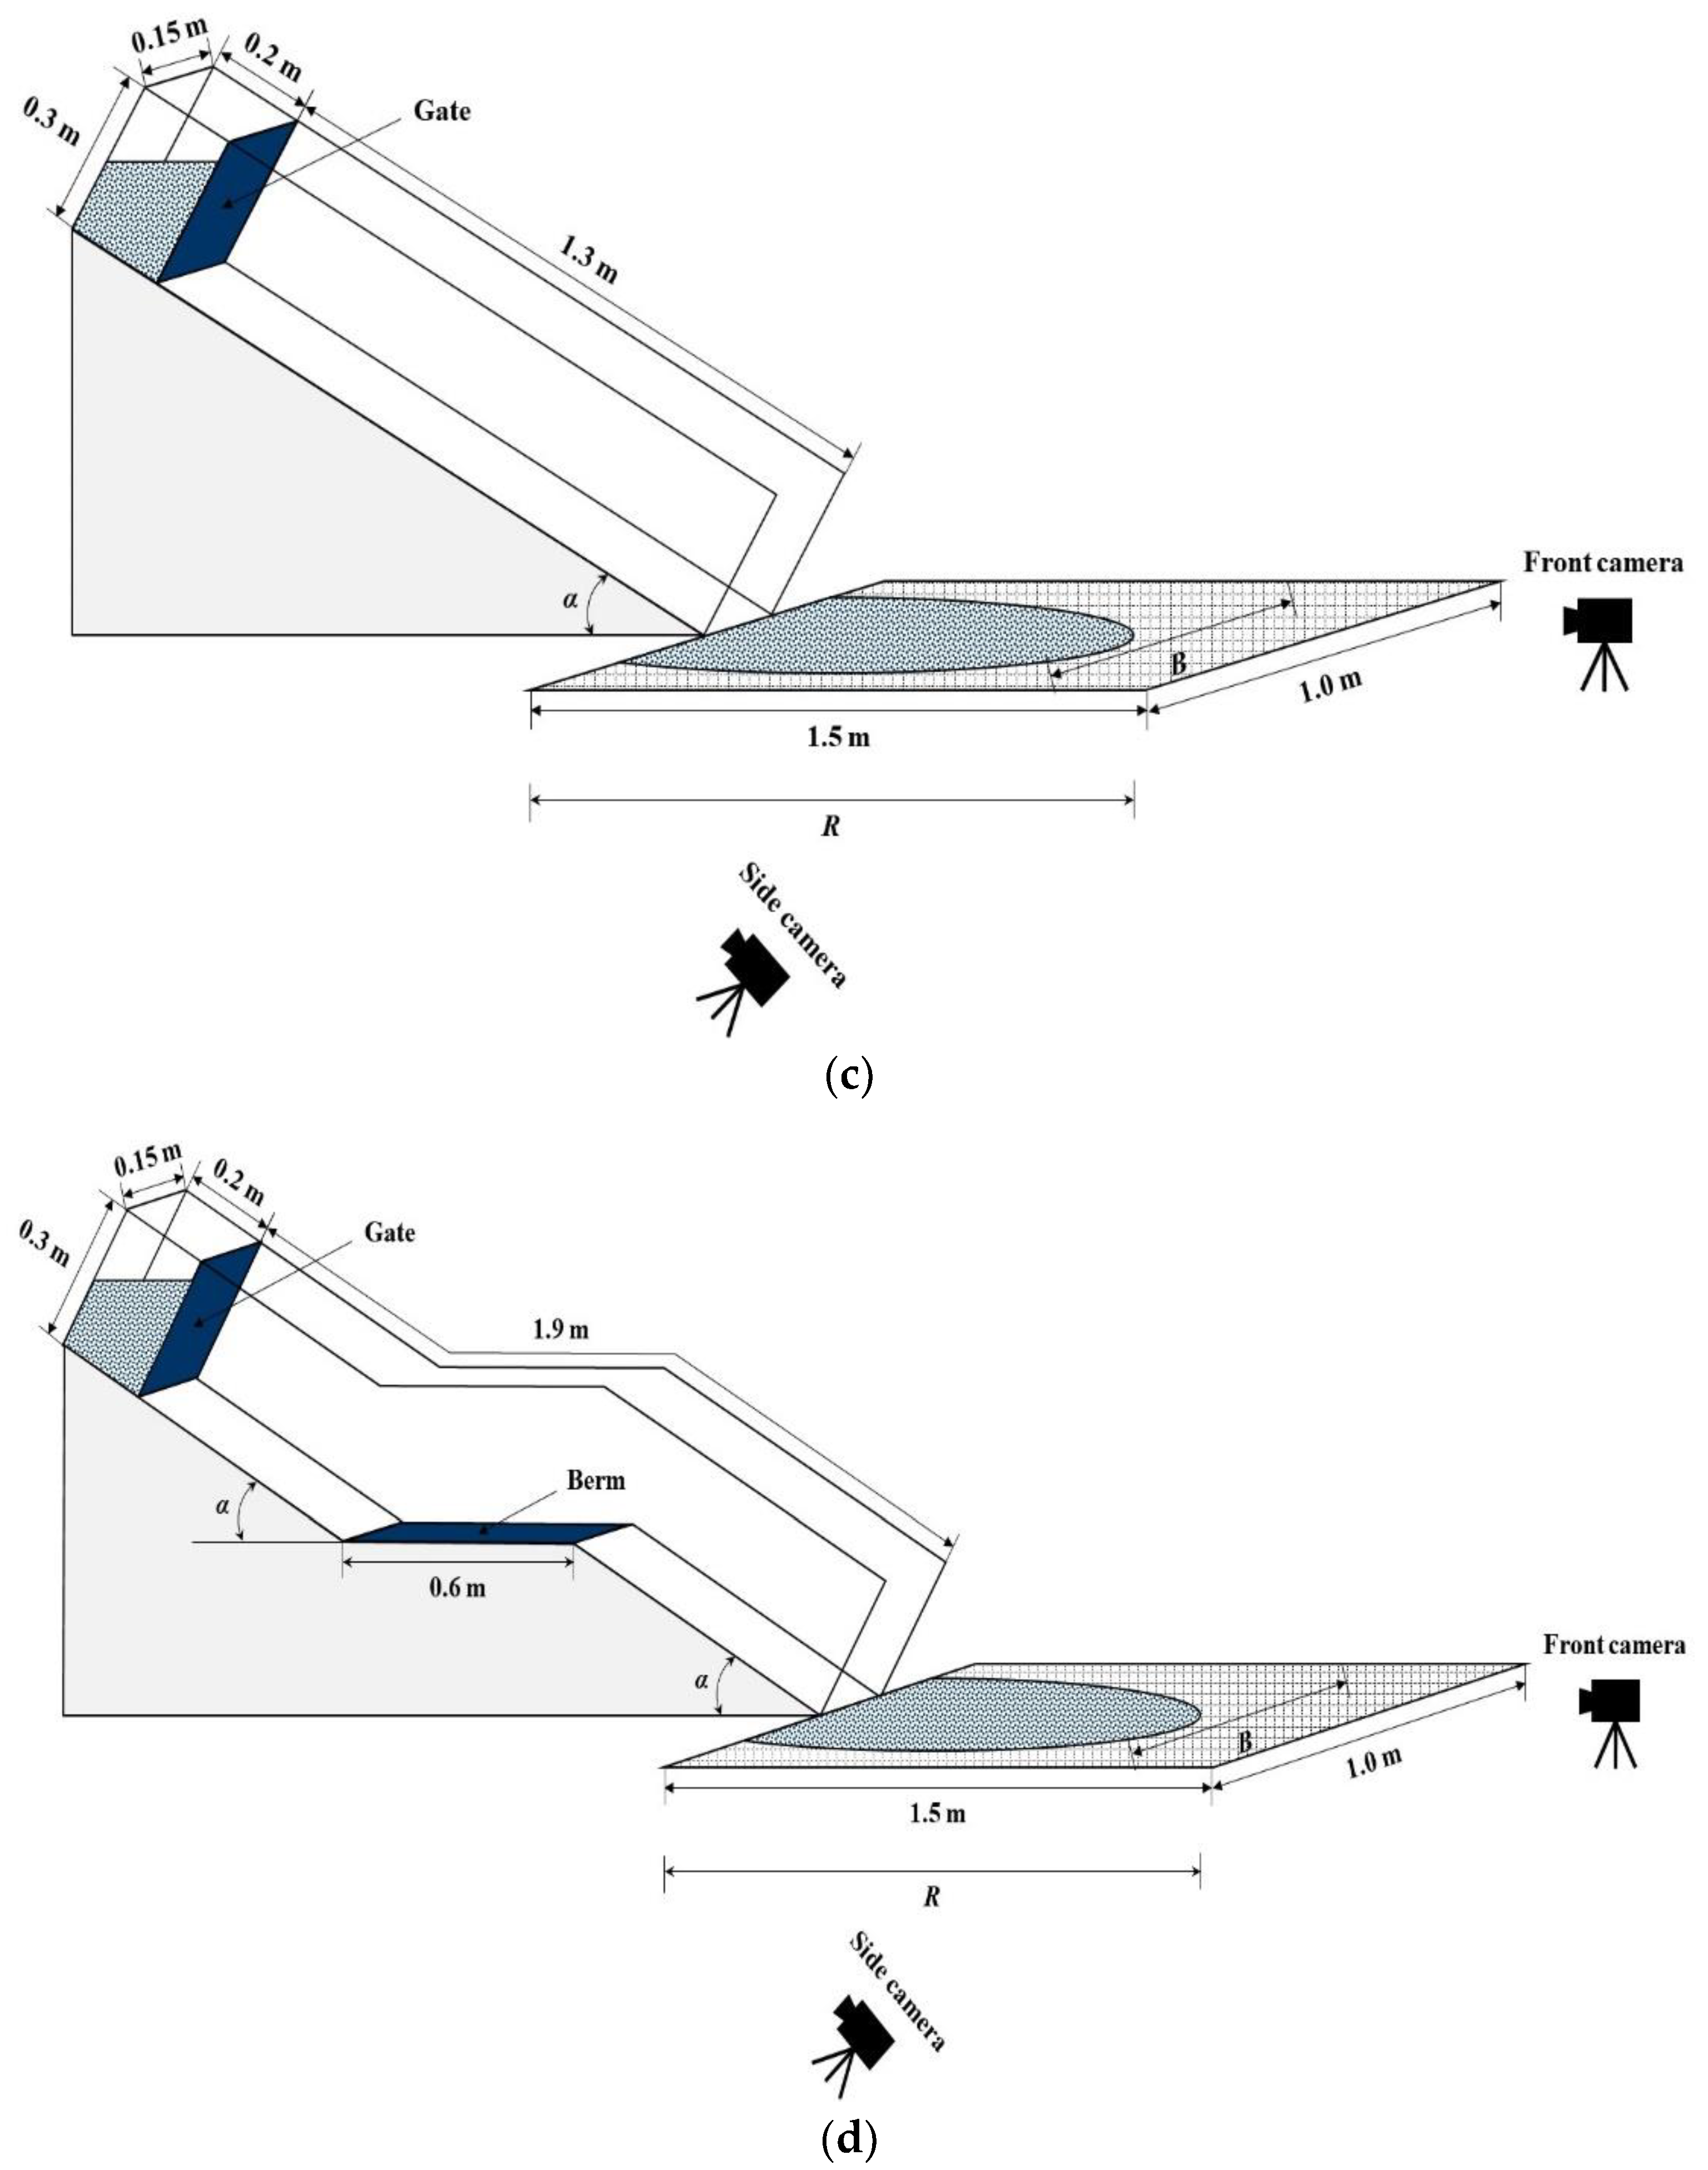
Figure 2 depicts the experimental setups of and the observation parameters (runout distance and lateral width) investigated in the laboratory tests conducted in this study, where R is the runout distance, B is the lateral width, and α is the channel slope. The runout distance was taken to be the distance between the start and end points of debris flow deposition. The maximum lateral width of the debris flow deposit was measured as the lateral width. The experimental setup included a storage tank, an experimental flume, and a deposition plane. The storage tank, which was located at the top of the experimental flume, was fabricated with a length of 0.2 m, width of 0.15 m, and height of 0.3 m. The tank was equipped with a gate that could be opened and closed to supply a mixed sample to the experimental flume. The upper and lower channel sections of the experimental flume could be separated to install a 0.6-m-long berm in between. The experimental flume thus had a width of 0.15 m, a height of 0.3 m, and a length of either 1.3 or 1.9 m, depending on the test type. The outlet of the experimental flume was connected to a horizontal deposition plane with a length of 1.5 m and width of 1 m. The deposition plane was composed of grid lines with longitudinal and lateral spacing of 5 cm to facilitate the observation of debris flow deposition.
To observe the test process, cameras capable of capturing images at 60 fps were installed in front and on the side of the experimental setup. The front camera observed the average velocity of the head of the debris flow as it moved along the channel, and the side camera observed the maximum depth of the debris flow at a point 10 cm upstream from the channel outlet [4]. In each test, the runout distance and maximum lateral width were measured upon the completion of deposition, and an image of the deposition geometry was captured. The deposition area was measured by analyzing the deposition geometry using ImageJ software. Because the flow velocity and flow depth were previously calculated by Chang et al. [4] for the same parameters evaluated in this study, only the runout distance, lateral width, and deposition area were calculated in this study.
2.2. Experimental Conditions
The characteristics and mechanisms of debris flow are generally affected by the channel slope, volumetric concentration of sediment, particle size distribution, material composition, clay content, debris flow magnitude, topography of the channel, and sinuosity. Previous studies have focused on the effects of the channel slope and volumetric concentration of sediment on debris flow [36,40,42]. The volumetric concentration of sediment plays an important role in indirectly estimating the viscosity of debris flow. Because debris flow is not a single fluid, but rather a sediment–water mixture, it is necessary to estimate the viscosity of the debris flow using the concept of the volumetric concentration of sediment proposed by Takahashi [43] as the ratio of the volume of sediment to the total volume of the mixed sample, which can be expressed as follows:
where CV is the volumetric concentration of sediment, VS is the volume of sediment, VW is the volume of water, and Vtotal is the total volume of the mixed sample.
In this study, experimental conditions were set to analyze the deposition characteristics of debris flow according to the channel slope, volumetric concentration of sediment, and presence of a berm, as shown in Table 1. Straight channel and single-berm channel tests were conducted to elucidate the effects of the presence of a berm. The channel slope increased from 10° to 25° in 5° increments, and the volumetric concentration of sediment increased from 0.40 to 0.60 in 0.05 increments. In total, 40 sets of experimental conditions were considered, and each set of conditions was evaluated five times to ensure accuracy.
2.3. Sample Properties
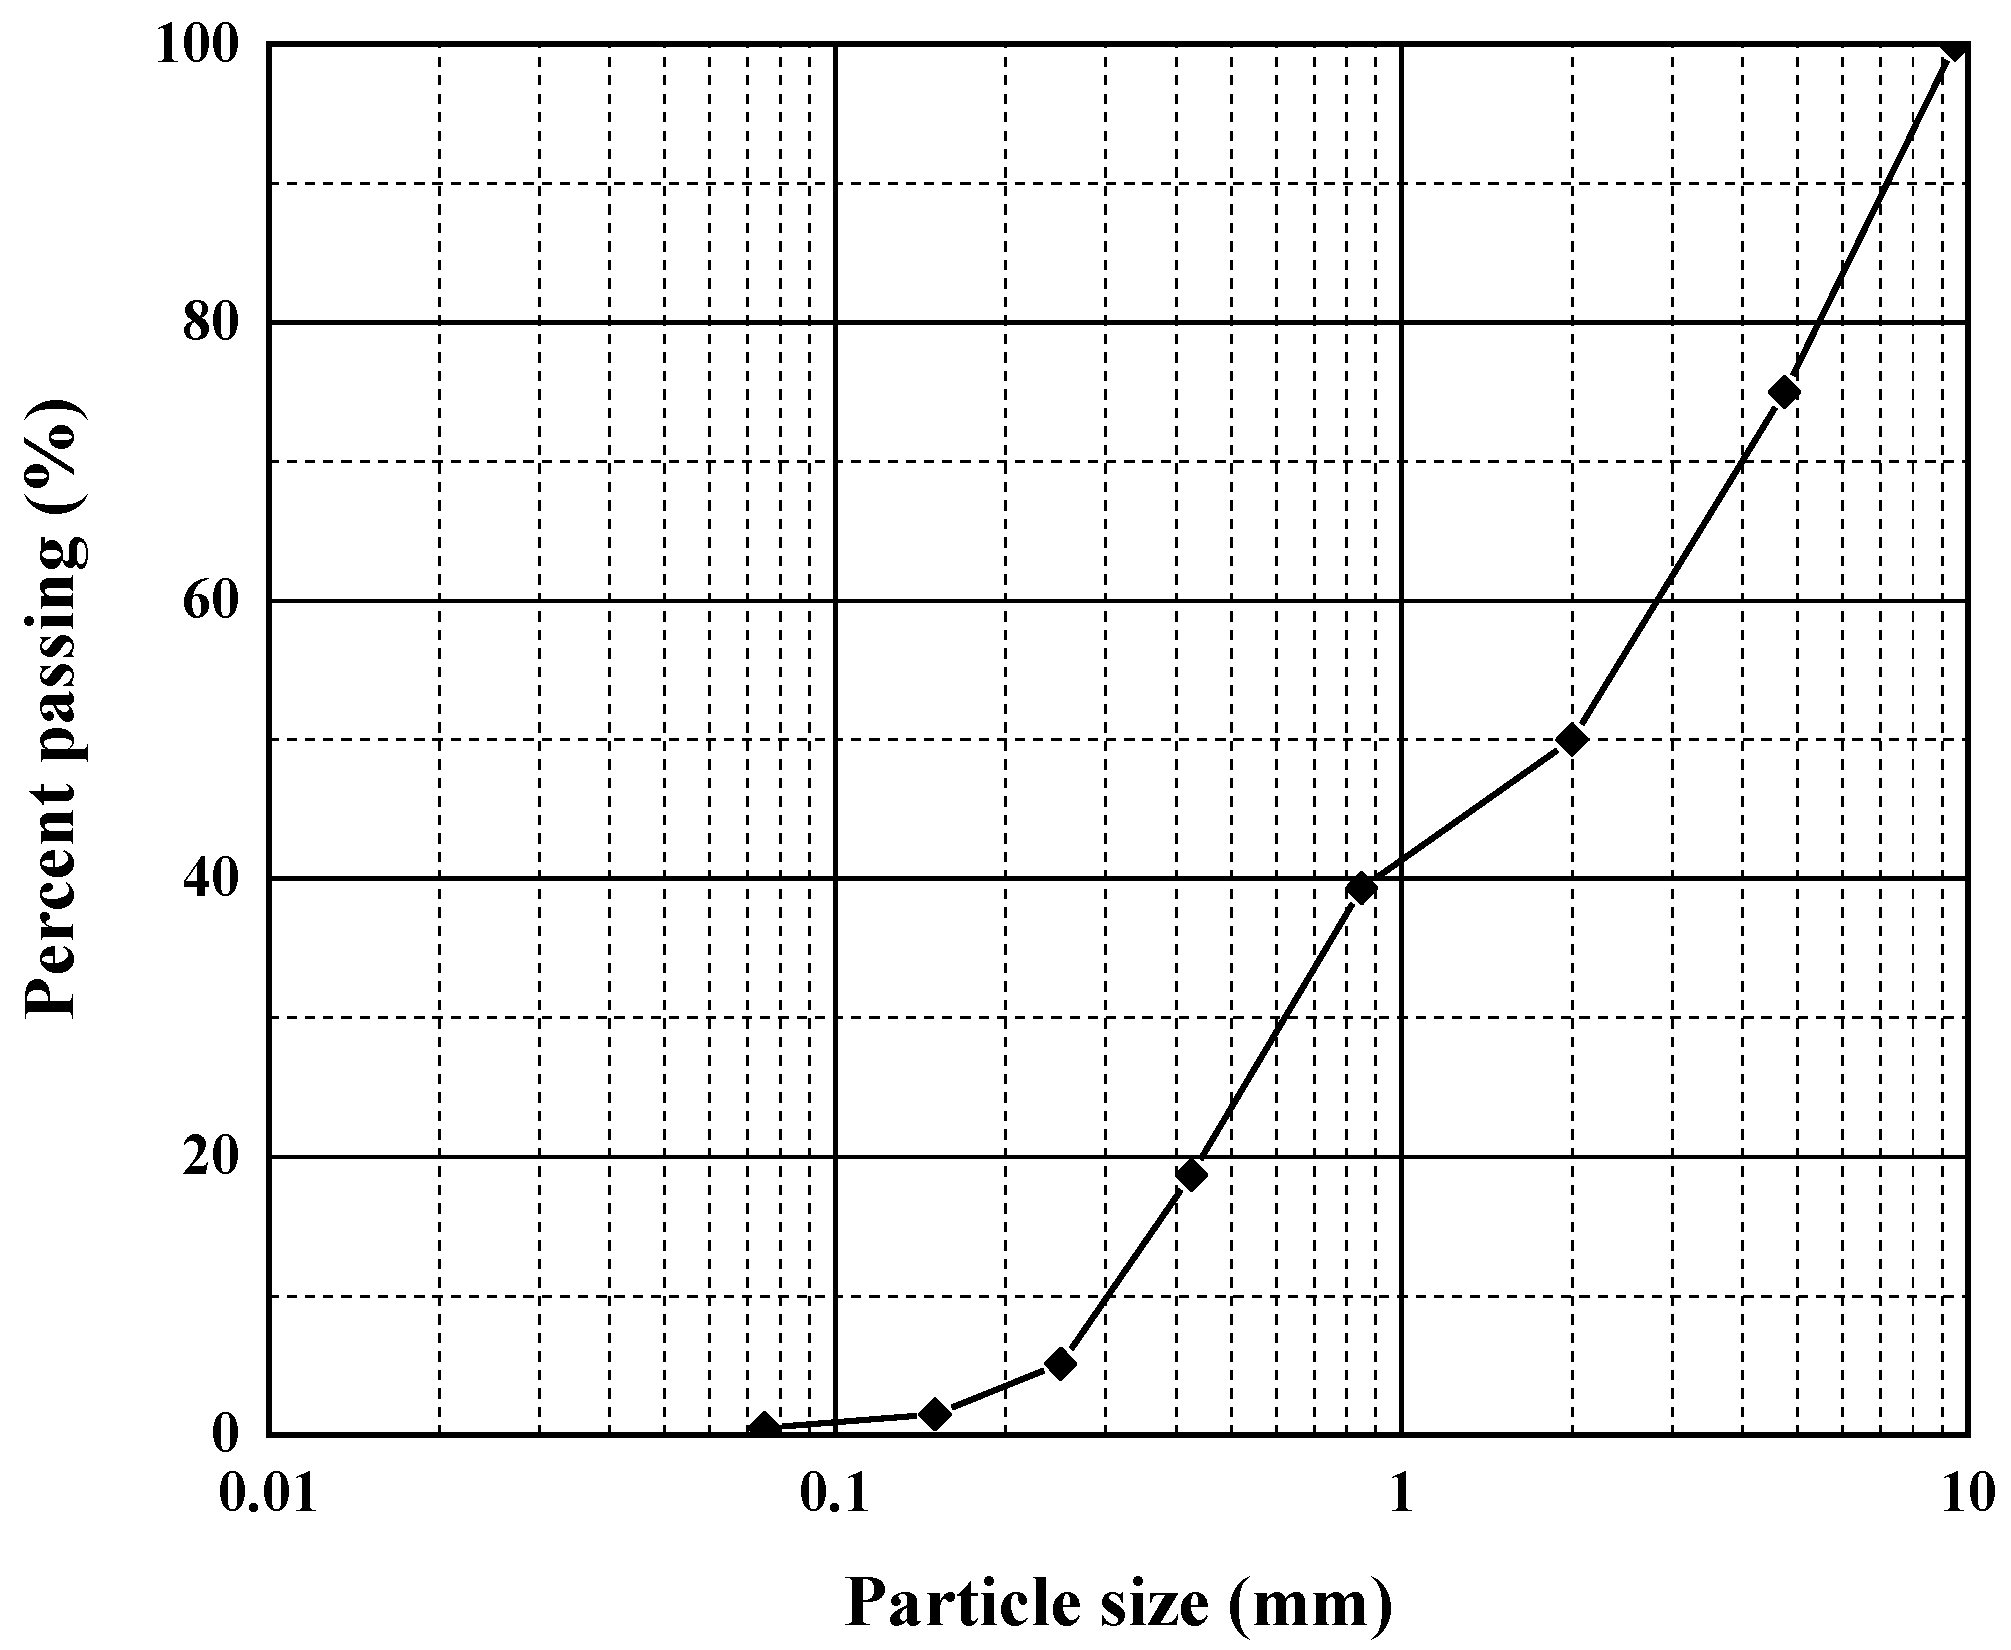
In this study, mixed samples were generated in a storage tank to reproduce the debris flow phenomenon. The mixed samples were prepared according to previous studies with similar experimental scales [5,40,44]. Through a preliminary experiment, we verified that the index confirming the reproduction of debris flow suggested by Fairfield [44] was satisfied: formation of a head composed coarse particles, and a uniform phase with solid and liquid. Figure 3 shows the particle size distribution curve of the mixed sediment obtained through sieve analysis, and Table 2 shows the weights of the mixed samples used in the laboratory tests, where Wtotal is the total weight of the mixed sample, WW is the weight of water, and ρ is the density of the mixed sample. The mixed sediment comprised particle sizes of 2 mm or less representing 50% by weight, 2–4.75 mm constituting 25% by weight, and 4.75–9.5 mm corresponding to 25% by weight. The mixed samples used in this study were mostly composed of soil and gravel, which reflects the research results of Kim and Paik [5], who found that most of the debris flow generated in Korea was composed of soil and gravel rather than clay. Regardless of the test type, a 4500 cm3 mixed sample was used in each of the tests, and the density of the mixed sample increased from 1578 to 1867 kg/m3 as the volumetric concentration of the sediment increased from 0.40 to 0.60 (Table 2).
2.4. Experimental Method
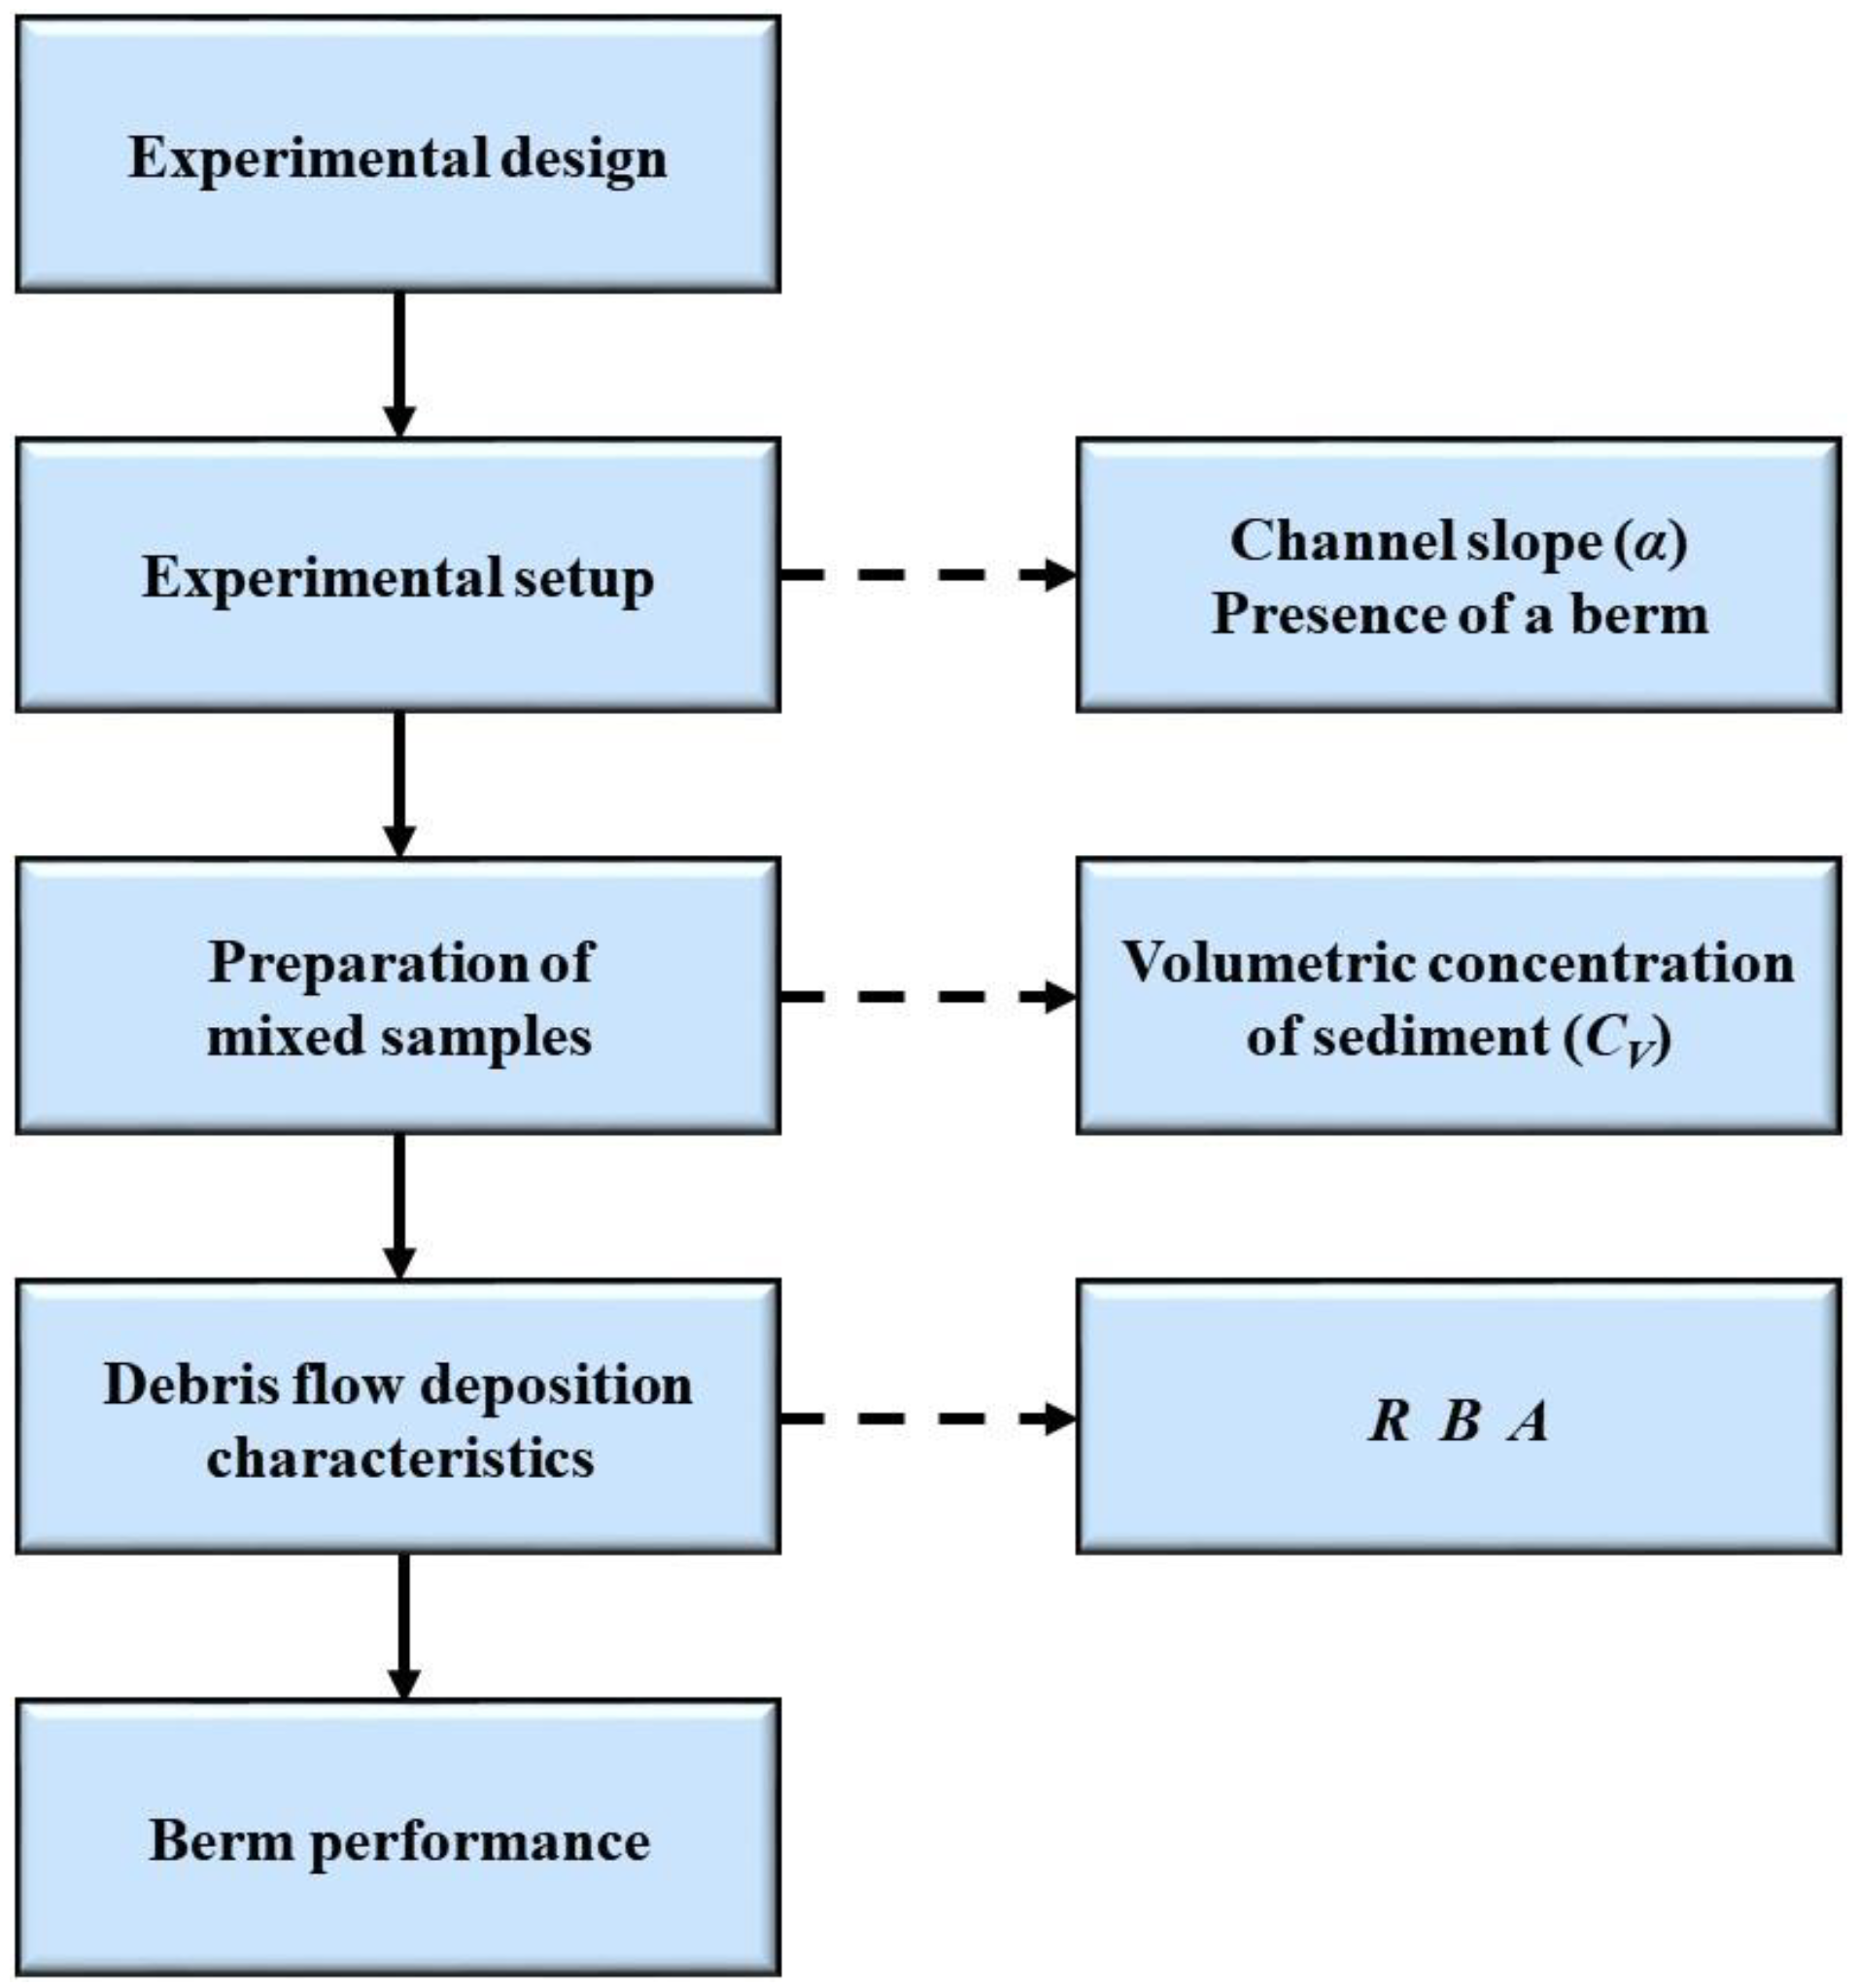
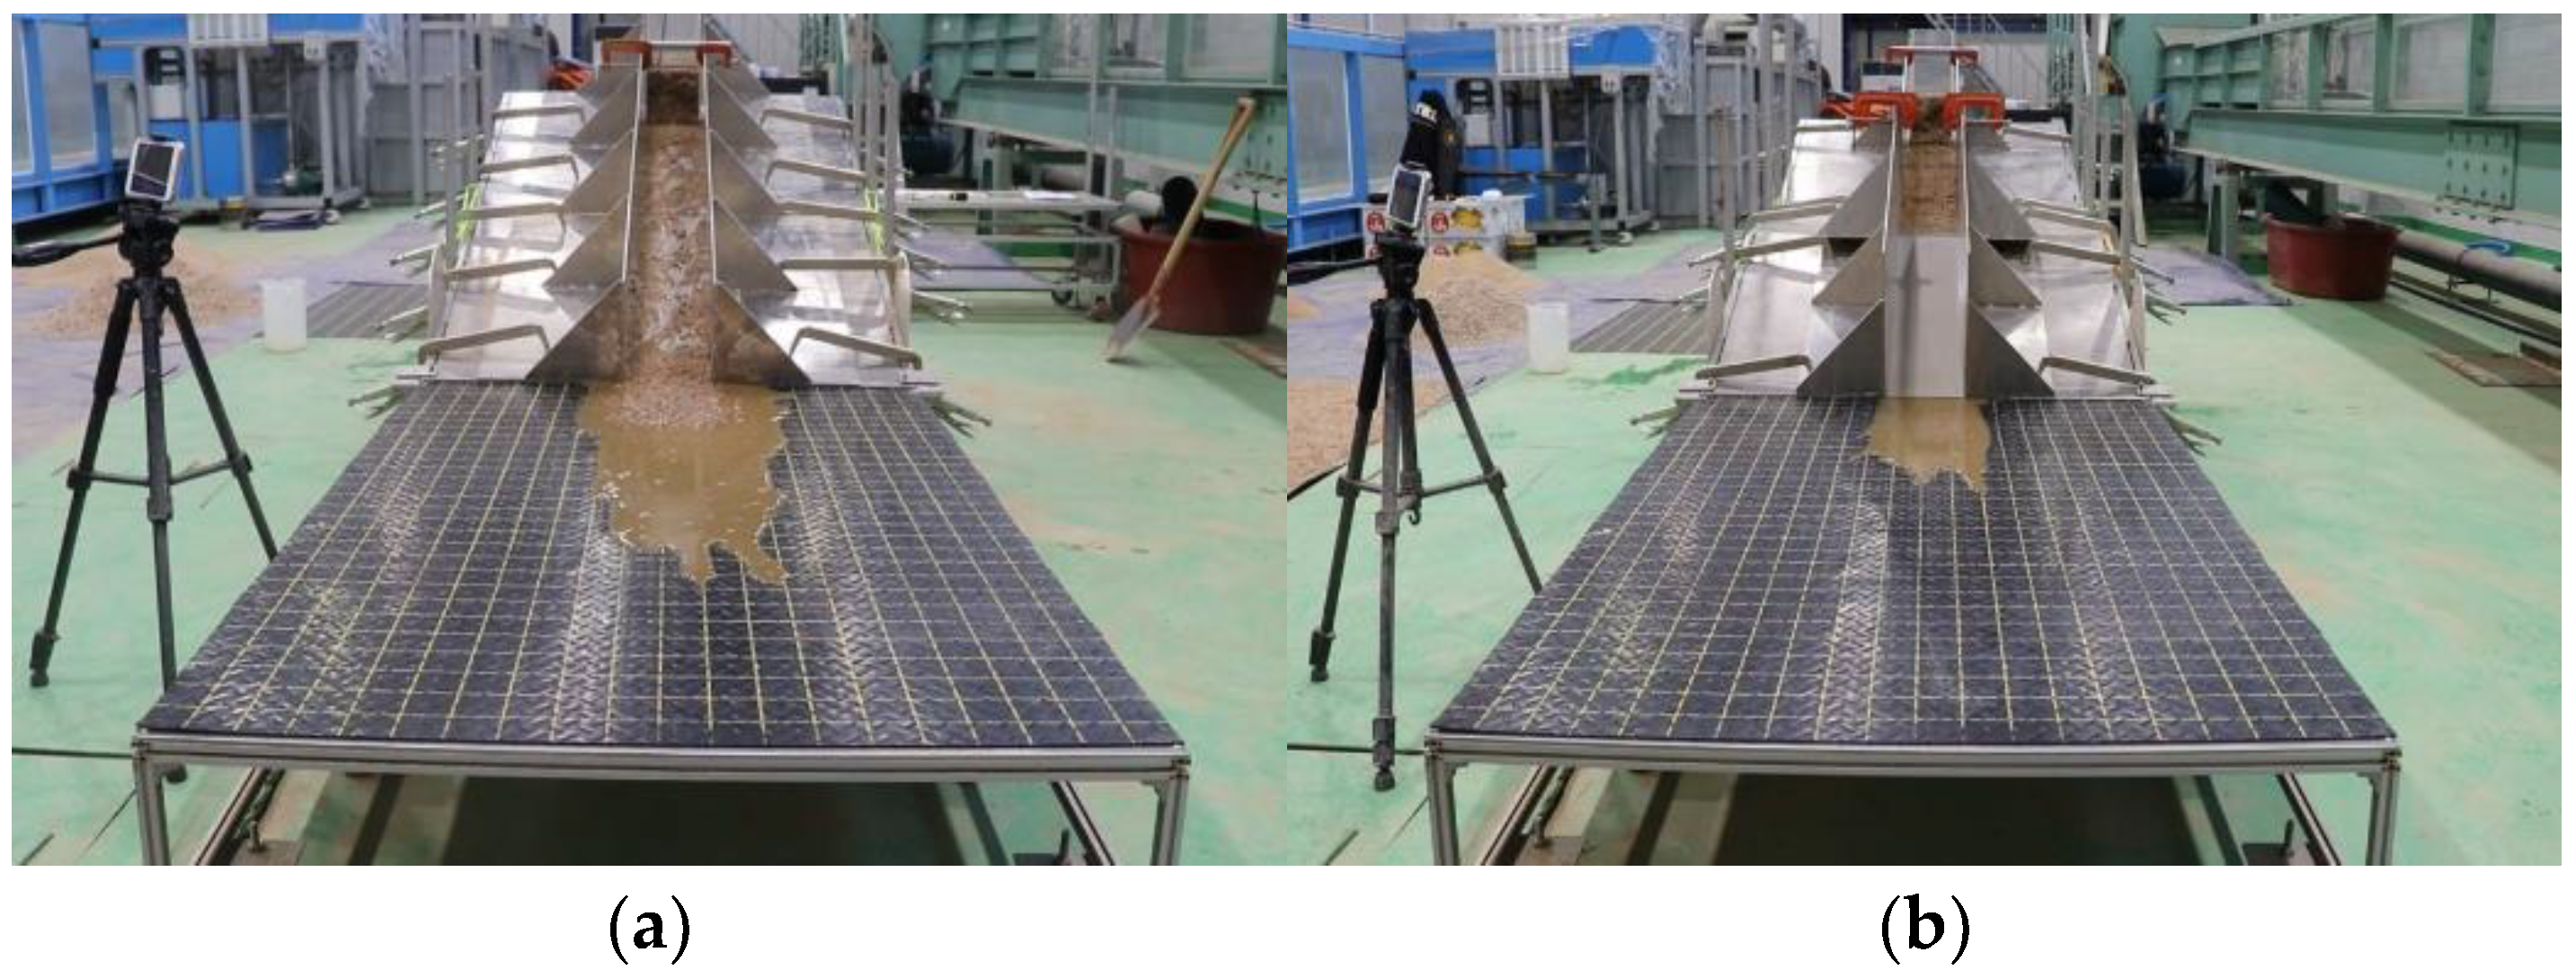
Figure 4 shows a flow chart of the laboratory tests. Each test in this study was conducted according to the following sequence. The experimental setup was first adjusted based on the channel slope and the presence of a berm. The sediment and water were then weighed out according to the intended volumetric concentration of the sediment before placing them in the storage tank to prepare a mixed sample. Next, the mixed sample was supplied to the experimental flume by rapidly opening the gate at the front of the storage tank. The runout distance and lateral width of the debris flow were then measured on the deposition plane, and the deposition area of the debris flow was measured using the captured image of the deposition geometry. Finally, the performance of the berm was examined by comparing the experimental results obtained using the straight channel with those acquired using the single-berm channel. Figure 5a,b depict example setups of the straight channel and single-berm channel laboratory tests conducted in this sequence.
2.5. Methods for Assessing Debris Flow Characteristics
The debris flow deposition characteristics obtained in this study were analyzed together with the flow characteristics obtained by Chang et al. [4] to determine the relationship between the two sets of data. The previously determined flow characteristics consisted of the flow velocity and the Froude number.
2.5.1. Flow Velocity
Debris flow velocity can be directly measured through field investigations or laboratory tests, or it can be calculated using mean debris flow velocity estimation equations. Debris flow velocity estimation equations were proposed differently in previous studies depending on the flow type. Equation (2) is an equation for Newtonian laminar flow [7] and can be expressed as
where g is the gravitational acceleration (9.81 m/s2), v is the flow velocity, h is the flow depth, μ is the apparent dynamic viscosity (Pa·s).
Equation (3) is for dilatant grain shearing flow [7,45] and can be expressed as
where ξ is the lumped coefficient affected by the volumetric concentration of sediment (m−1/2·s−1).
Equation (4) is for Newtonian turbulent flow [7,17] and can be expressed as
where n is the Manning coefficient (m−1/3·s).
2.5.2. Froude Number
Debris flows are a type of gravity driven flow occurring on a steep slope. Therefore, the similarity law should be applied using the Froude number, which physically represents the ratio of inertial force to gravity. The equation for the Froude number, , is expressed as
3. Results
Table 3 shows the debris flow characteristics observed during the laboratory tests. The reported debris flow velocity v, flow depth h, and Froude number Fr were measured by Chang et al. [4]; the runout distance R, lateral width B, and deposition area A were measured in this study. In the single-berm channel test, debris flow was deposited in the channel regardless of the channel slope when the volumetric concentration of sediment was 0.60. Thus, no analysis of this result was conducted when the volumetric concentration of sediment was 0.60. In addition, debris flow was not sufficiently developed to observe the flow depth in some of the straight channel and single-berm channel tests. Thus, these cases were not included in the result analysis because of the influence of the debris flow depth on the deposition characteristics.
3.1. Deposition Characteristics of Debris Flow
3.1.1. Runout Distance
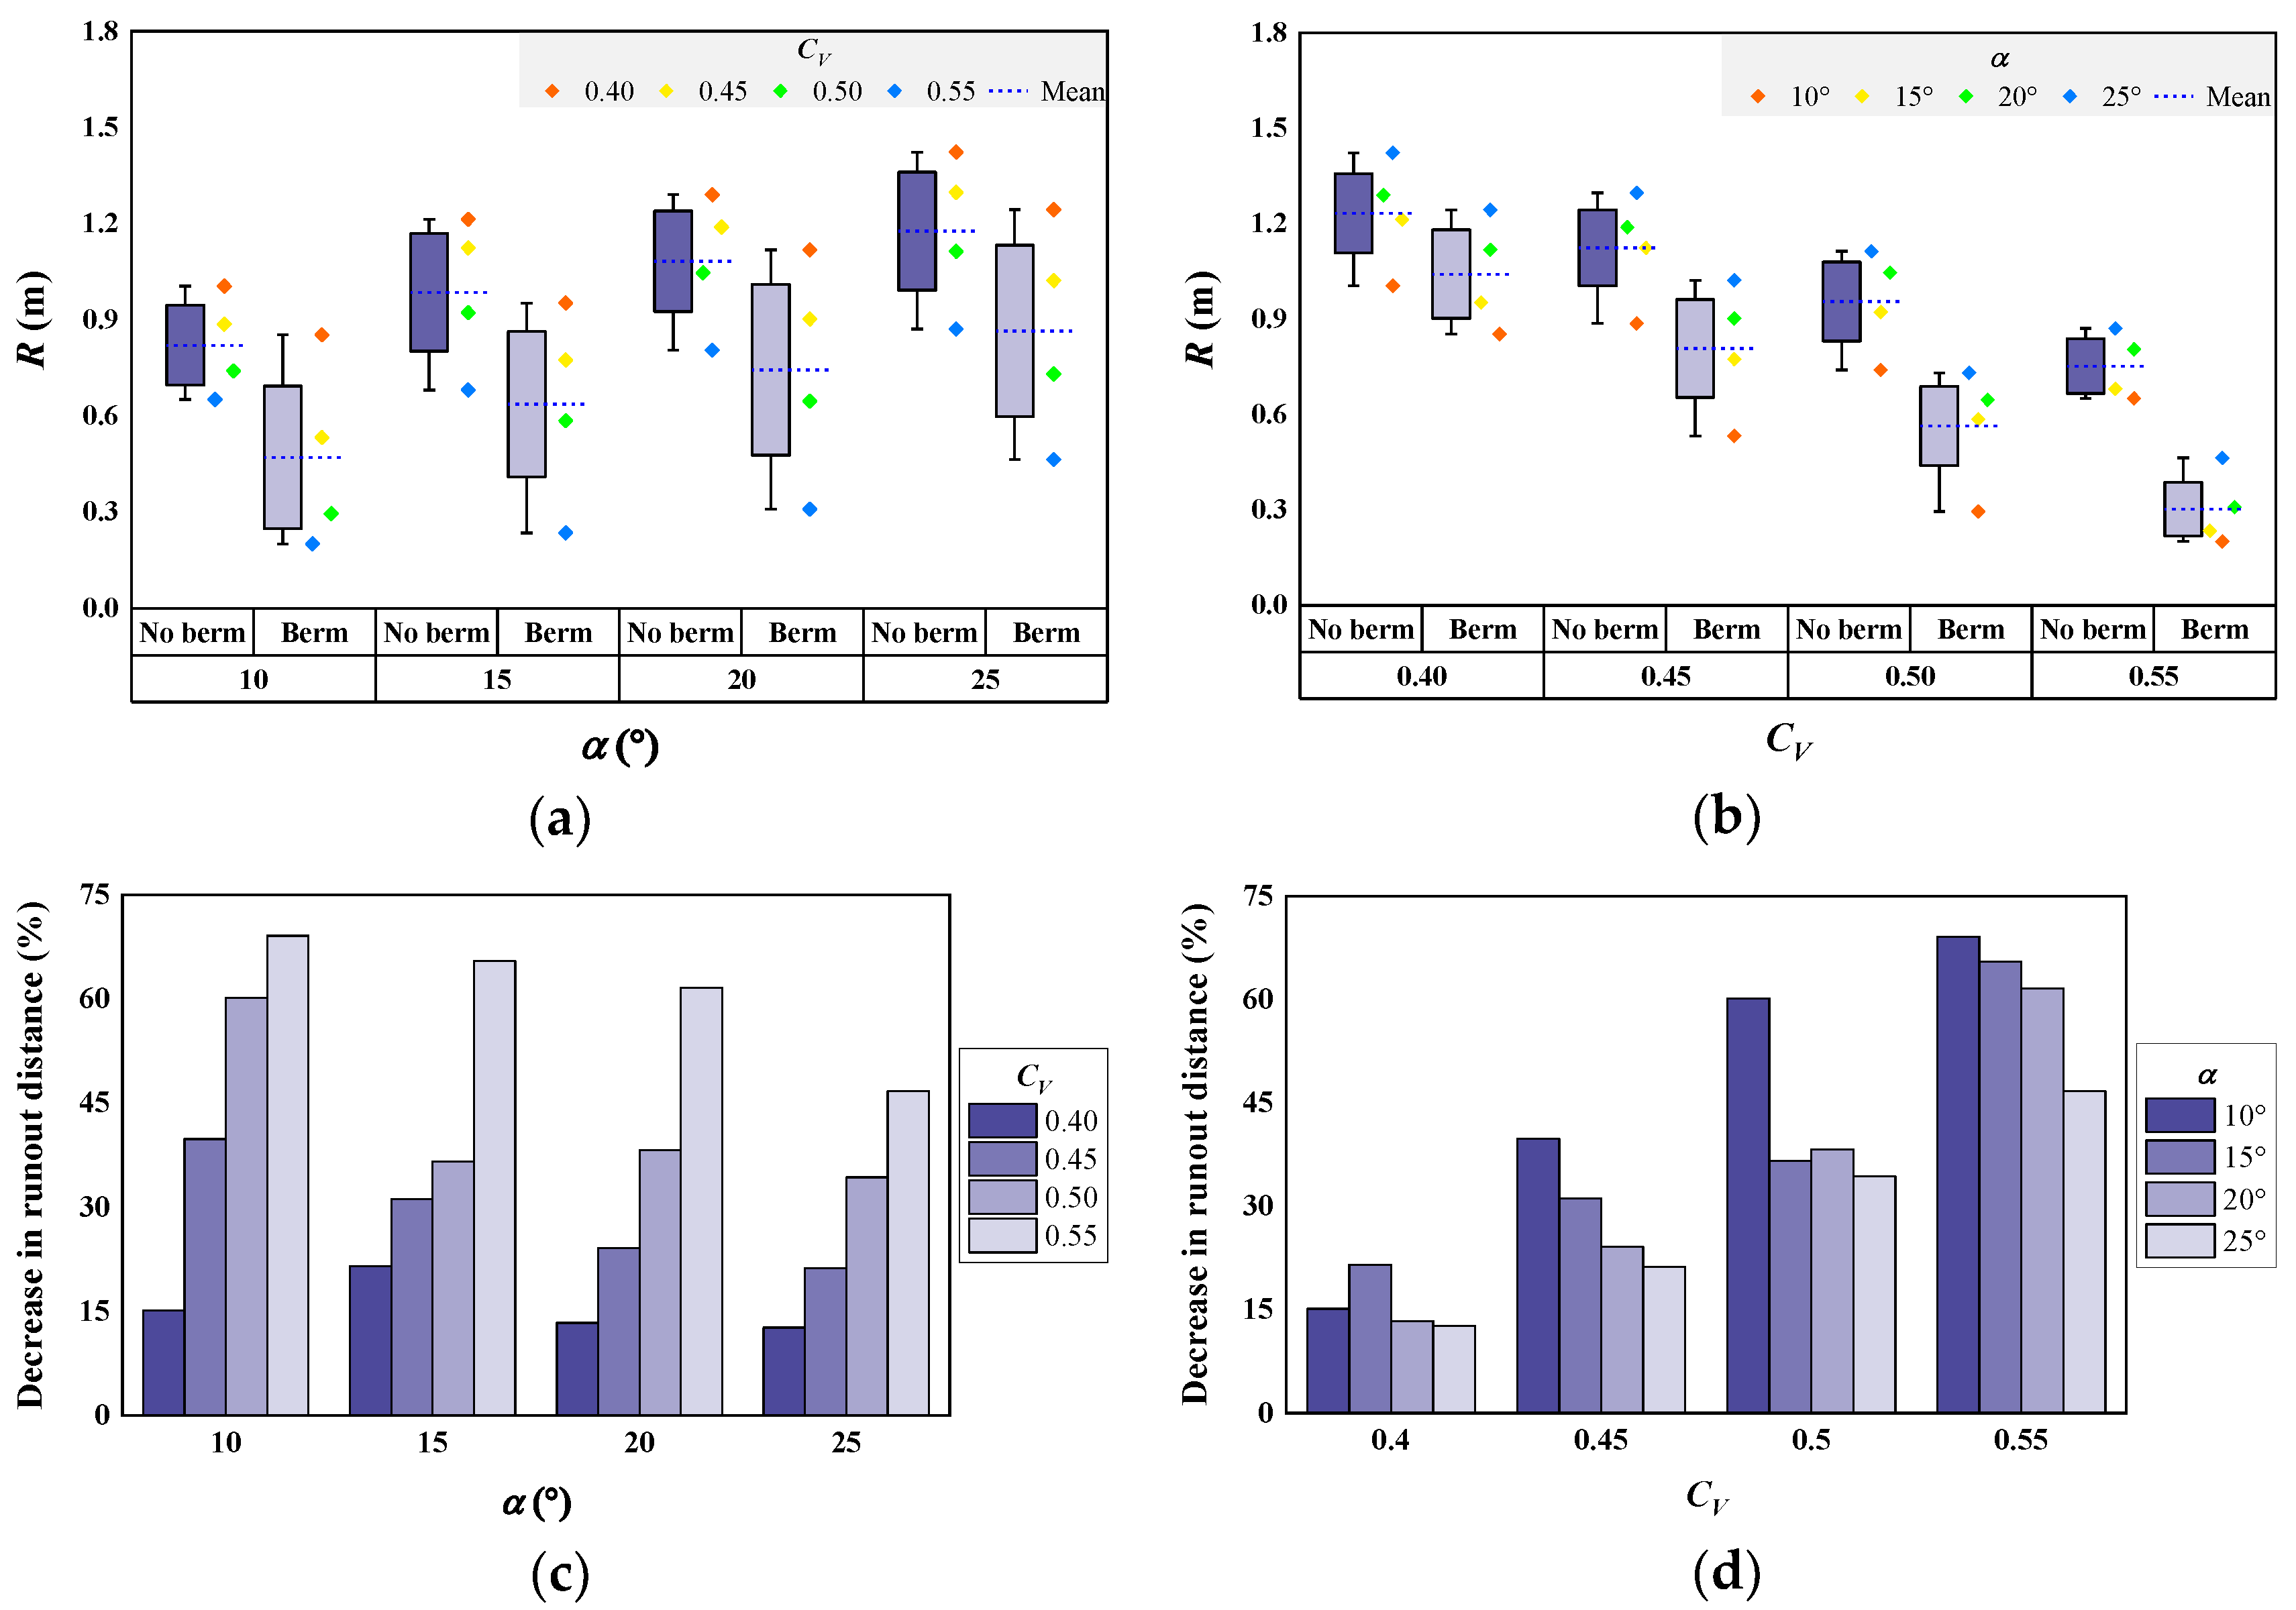
Figure 6 presents the runout distances of the debris flow observed during the laboratory tests and its change upon berm installation. Figure 6a,b depict the runout distance according to the channel slope and volumetric concentration of sediment, respectively. Figure 6c,d show the change in the runout distance upon berm installation according to the channel slope and volumetric concentration of sediment, respectively. The experimental results indicate that the runout distance increased as the channel slope increased or the volumetric concentration of the sediment decreased (Figure 6a,b). Berm installation on the slope decreased the runout distance by 12.7%–69.1% (Figure 6c,d). The average reduction in the runout distance for all volumetric concentrations of sediment was 46.1%, 38.7%, 34.3%, and 28.7% when the channel slope was 10°, 15°, 20°, and 25°, respectively, and for all channel slopes was 15.7%, 29.1%, 42.3%, and 60.7% when the volumetric concentration of sediment was 0.40, 0.45, 0.50, and 0.55, respectively. In other words, the average reduction in runout distance upon berm installation increased with decreasing channel slope and increasing volumetric concentration of sediment.
3.1.2. Lateral Width
Figure 7 presents the lateral width of the debris flow observed during the laboratory tests and its change upon berm installation. Figure 7a,b depict the lateral width of the debris flow according to the channel slope and volumetric concentration of sediment, respectively. Figure 7c,d show the change in lateral width upon berm installation according to the channel slope and volumetric concentration of sediment, respectively. The experimental results reveal that the lateral width increased as the channel slope increased or the volumetric concentration of sediment decreased (Figure 7a,b). Berm installation on the slope decreased the lateral width by 14.3%–65.9% (Figure 7c,d). The average reduction in lateral width for all volumetric concentrations of sediment was 36.8%, 39.1%, 33.4%, and 22.0% when the channel slope was 10°, 15°, 20°, and 25°, respectively, and for all channel slopes was 23.2%, 25.1%, 32.0%, and 51.0% when the volumetric concentration of sediment was 0.40, 0.45, 0.50, and 0.55, respectively. In other words, the average reduction in lateral width upon berm installation increased with increasing volumetric concentration of sediment.
3.1.3. Deposition Area
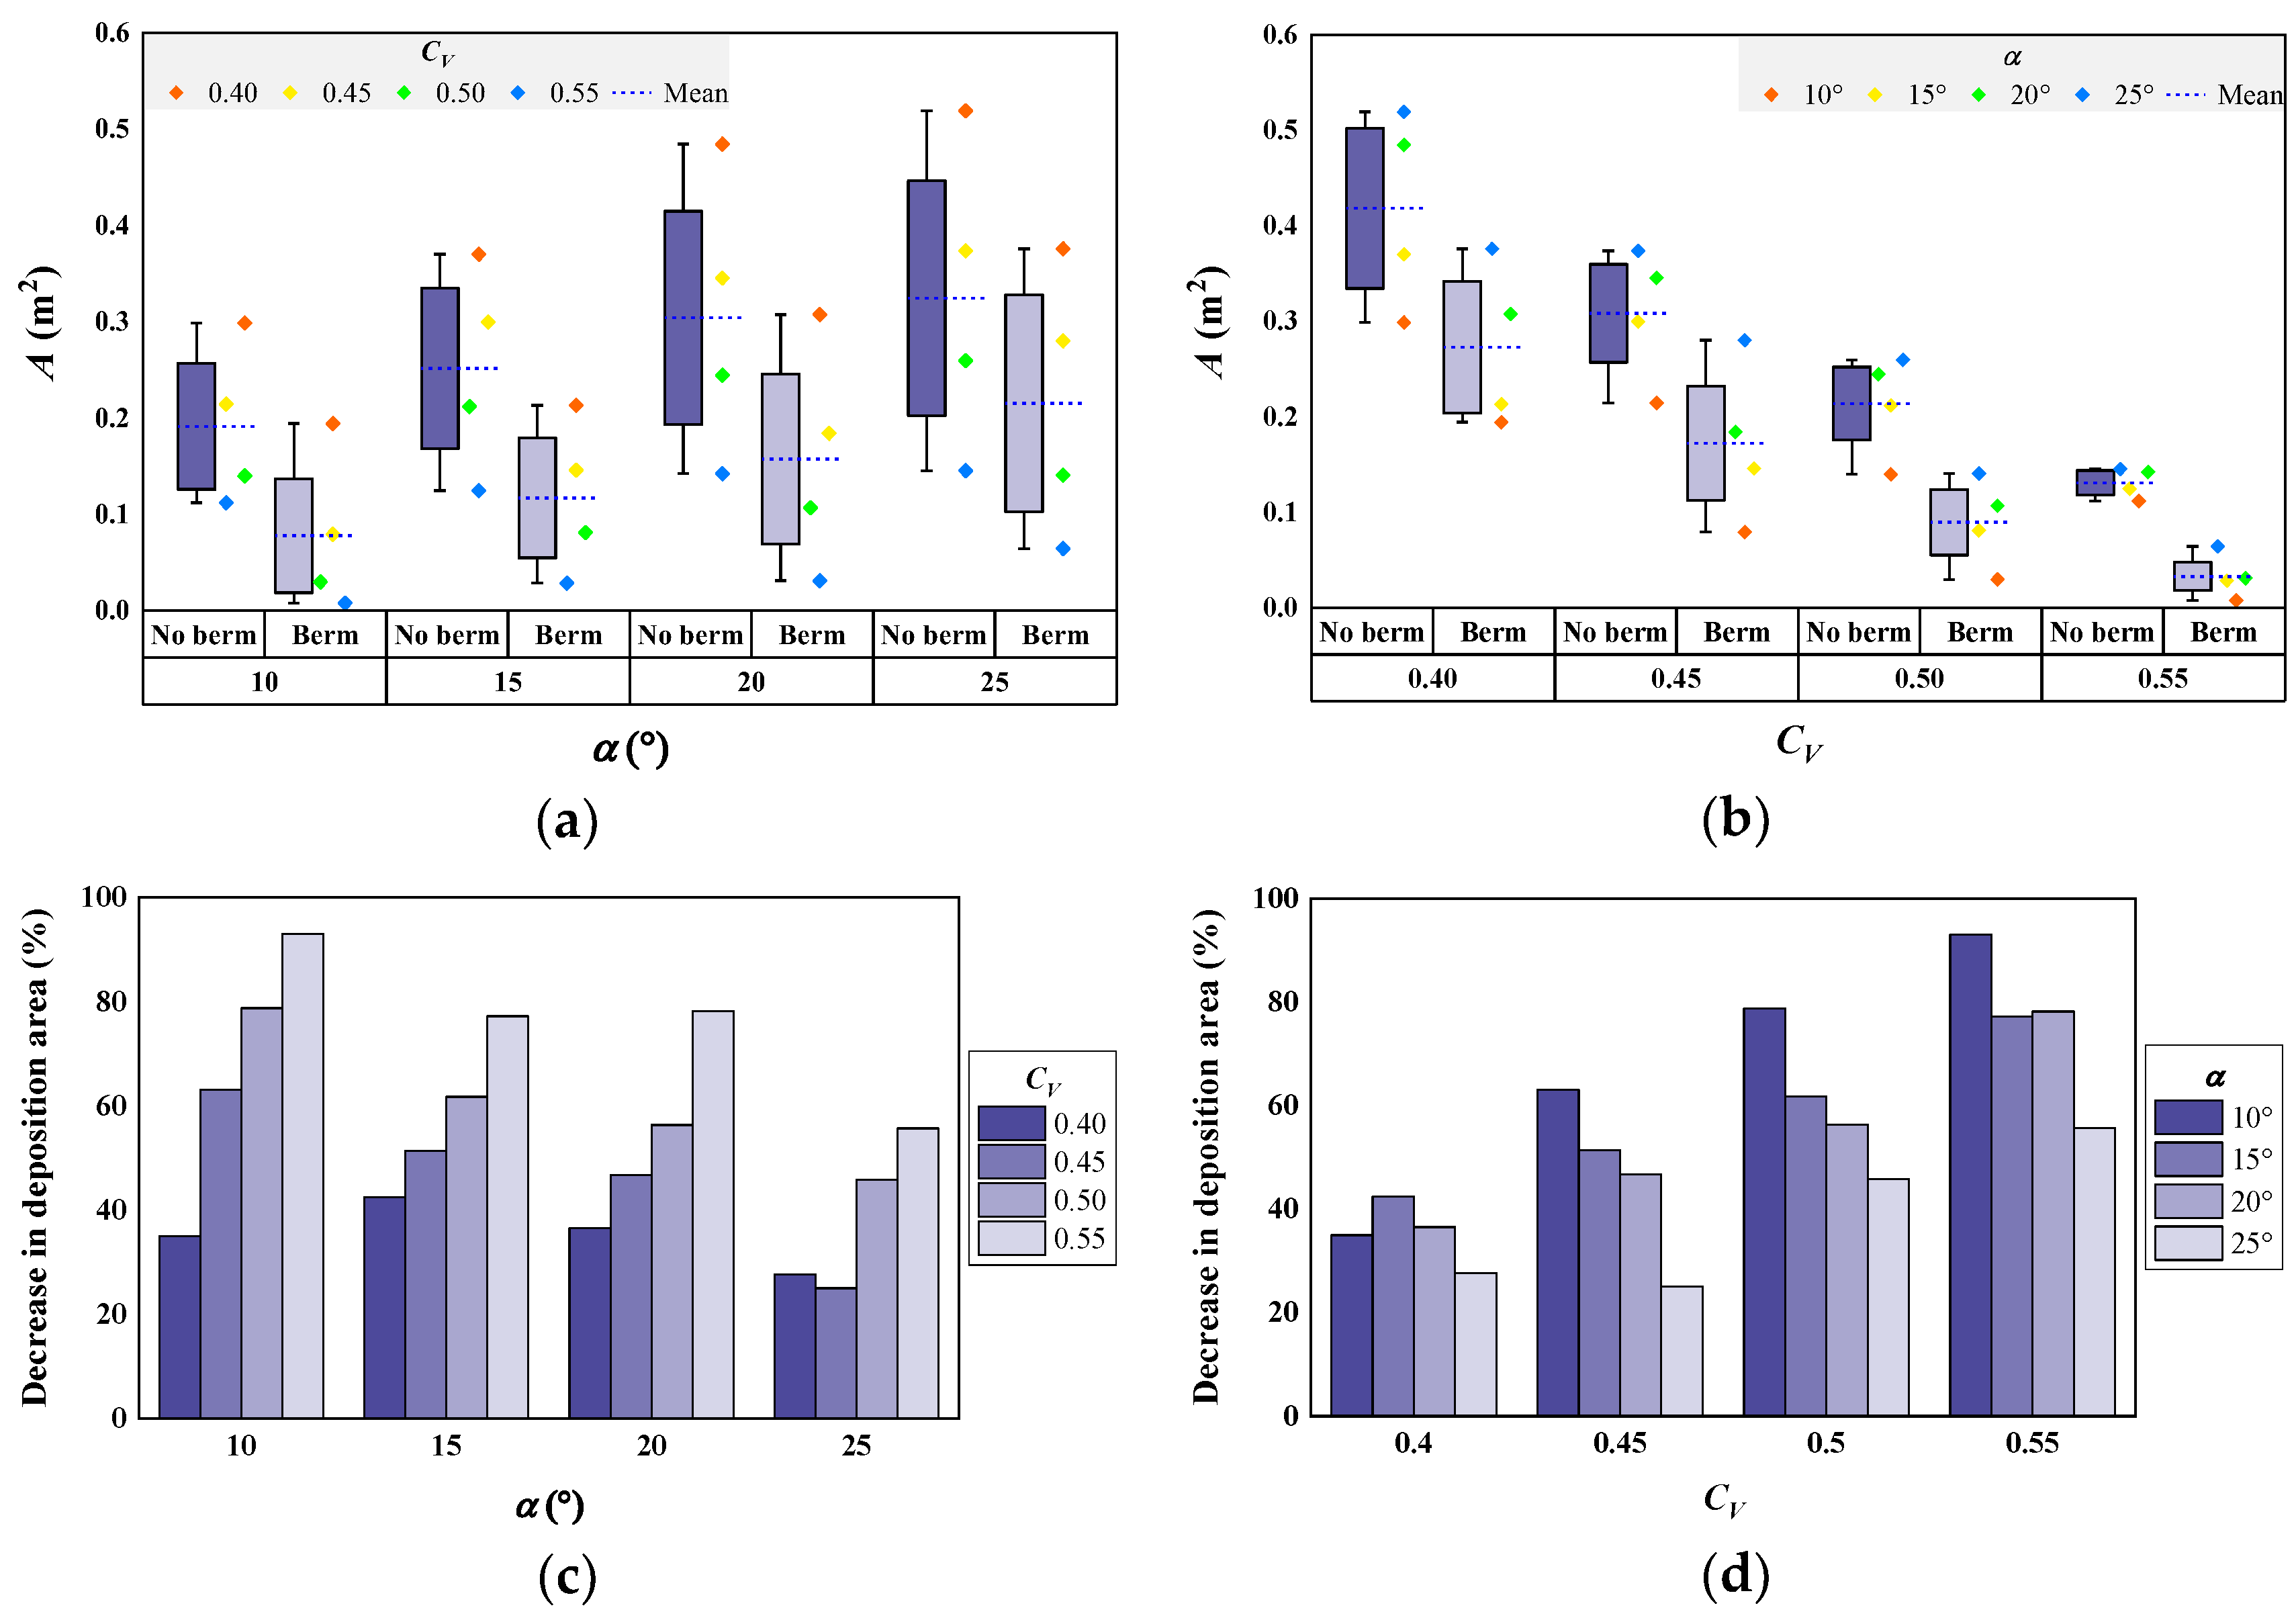
Figure 8 shows the debris flow deposition area observed during the laboratory tests and its change upon berm installation. Figure 8a,b present the deposition area according to the channel slope and volumetric concentration of sediment, respectively. Figure 8c,d illustrate the change in deposition area upon berm installation according to the channel slope and volumetric concentration of sediment, respectively. The experimental results reveal that the deposition area increased as the channel slope increased or the volumetric concentration of sediment decreased (Figure 8a,b). Upon berm installation on the slope, the deposition area was reduced by 25.0–93.0% (Figure 8c,d). The average reduction in deposition area for all volumetric concentrations of sediment was 67.5%, 58.2%, 54.4%, and 38.5% when the channel slope was 10°, 15°, 20°, and 25°, respectively, and for all channel slopes was 35.4%, 46.5%, 60.7%, and 76.0% when the volumetric concentrations of sediment was 0.40, 0.45, 0.50, and 0.55, respectively. In other words, the average reduction in deposition area upon berm installation significantly increased with decreasing channel slope and increasing volumetric concentration of sediment.
3.2. Relationships between Flow Characteristics and Deposition Characteristics
Predicting the runout of a debris flows is critical for mitigating potential risks [16,36]. Indeed, the runout distance of debris flow plays an important role in estimating the debris flow risk area [12,47], and the topography of the debris flow movement path significantly affects the dynamics and deposition pattern of debris flow [48]. Therefore, in this study, the relationship between the flow and deposition characteristics of debris flow was analyzed to prepare a basis for mitigating potential risks. Table 4 shows the ranges, means, and standard deviations of the deposition characteristics (runout distance, lateral width, and deposition area) of the debris flow measured in the laboratory tests. Cases in which the debris flow stopped on the channel are not included. Upon berm installation, the average reductions in the runout distance, lateral width, and deposition area of debris flow were 36.9%, 32.8%, and 54.7%, respectively. In other words, the reduction in the longitudinal runout was slightly higher than that in the lateral runout, and berm installation on the slope significantly reduced the deposition area.
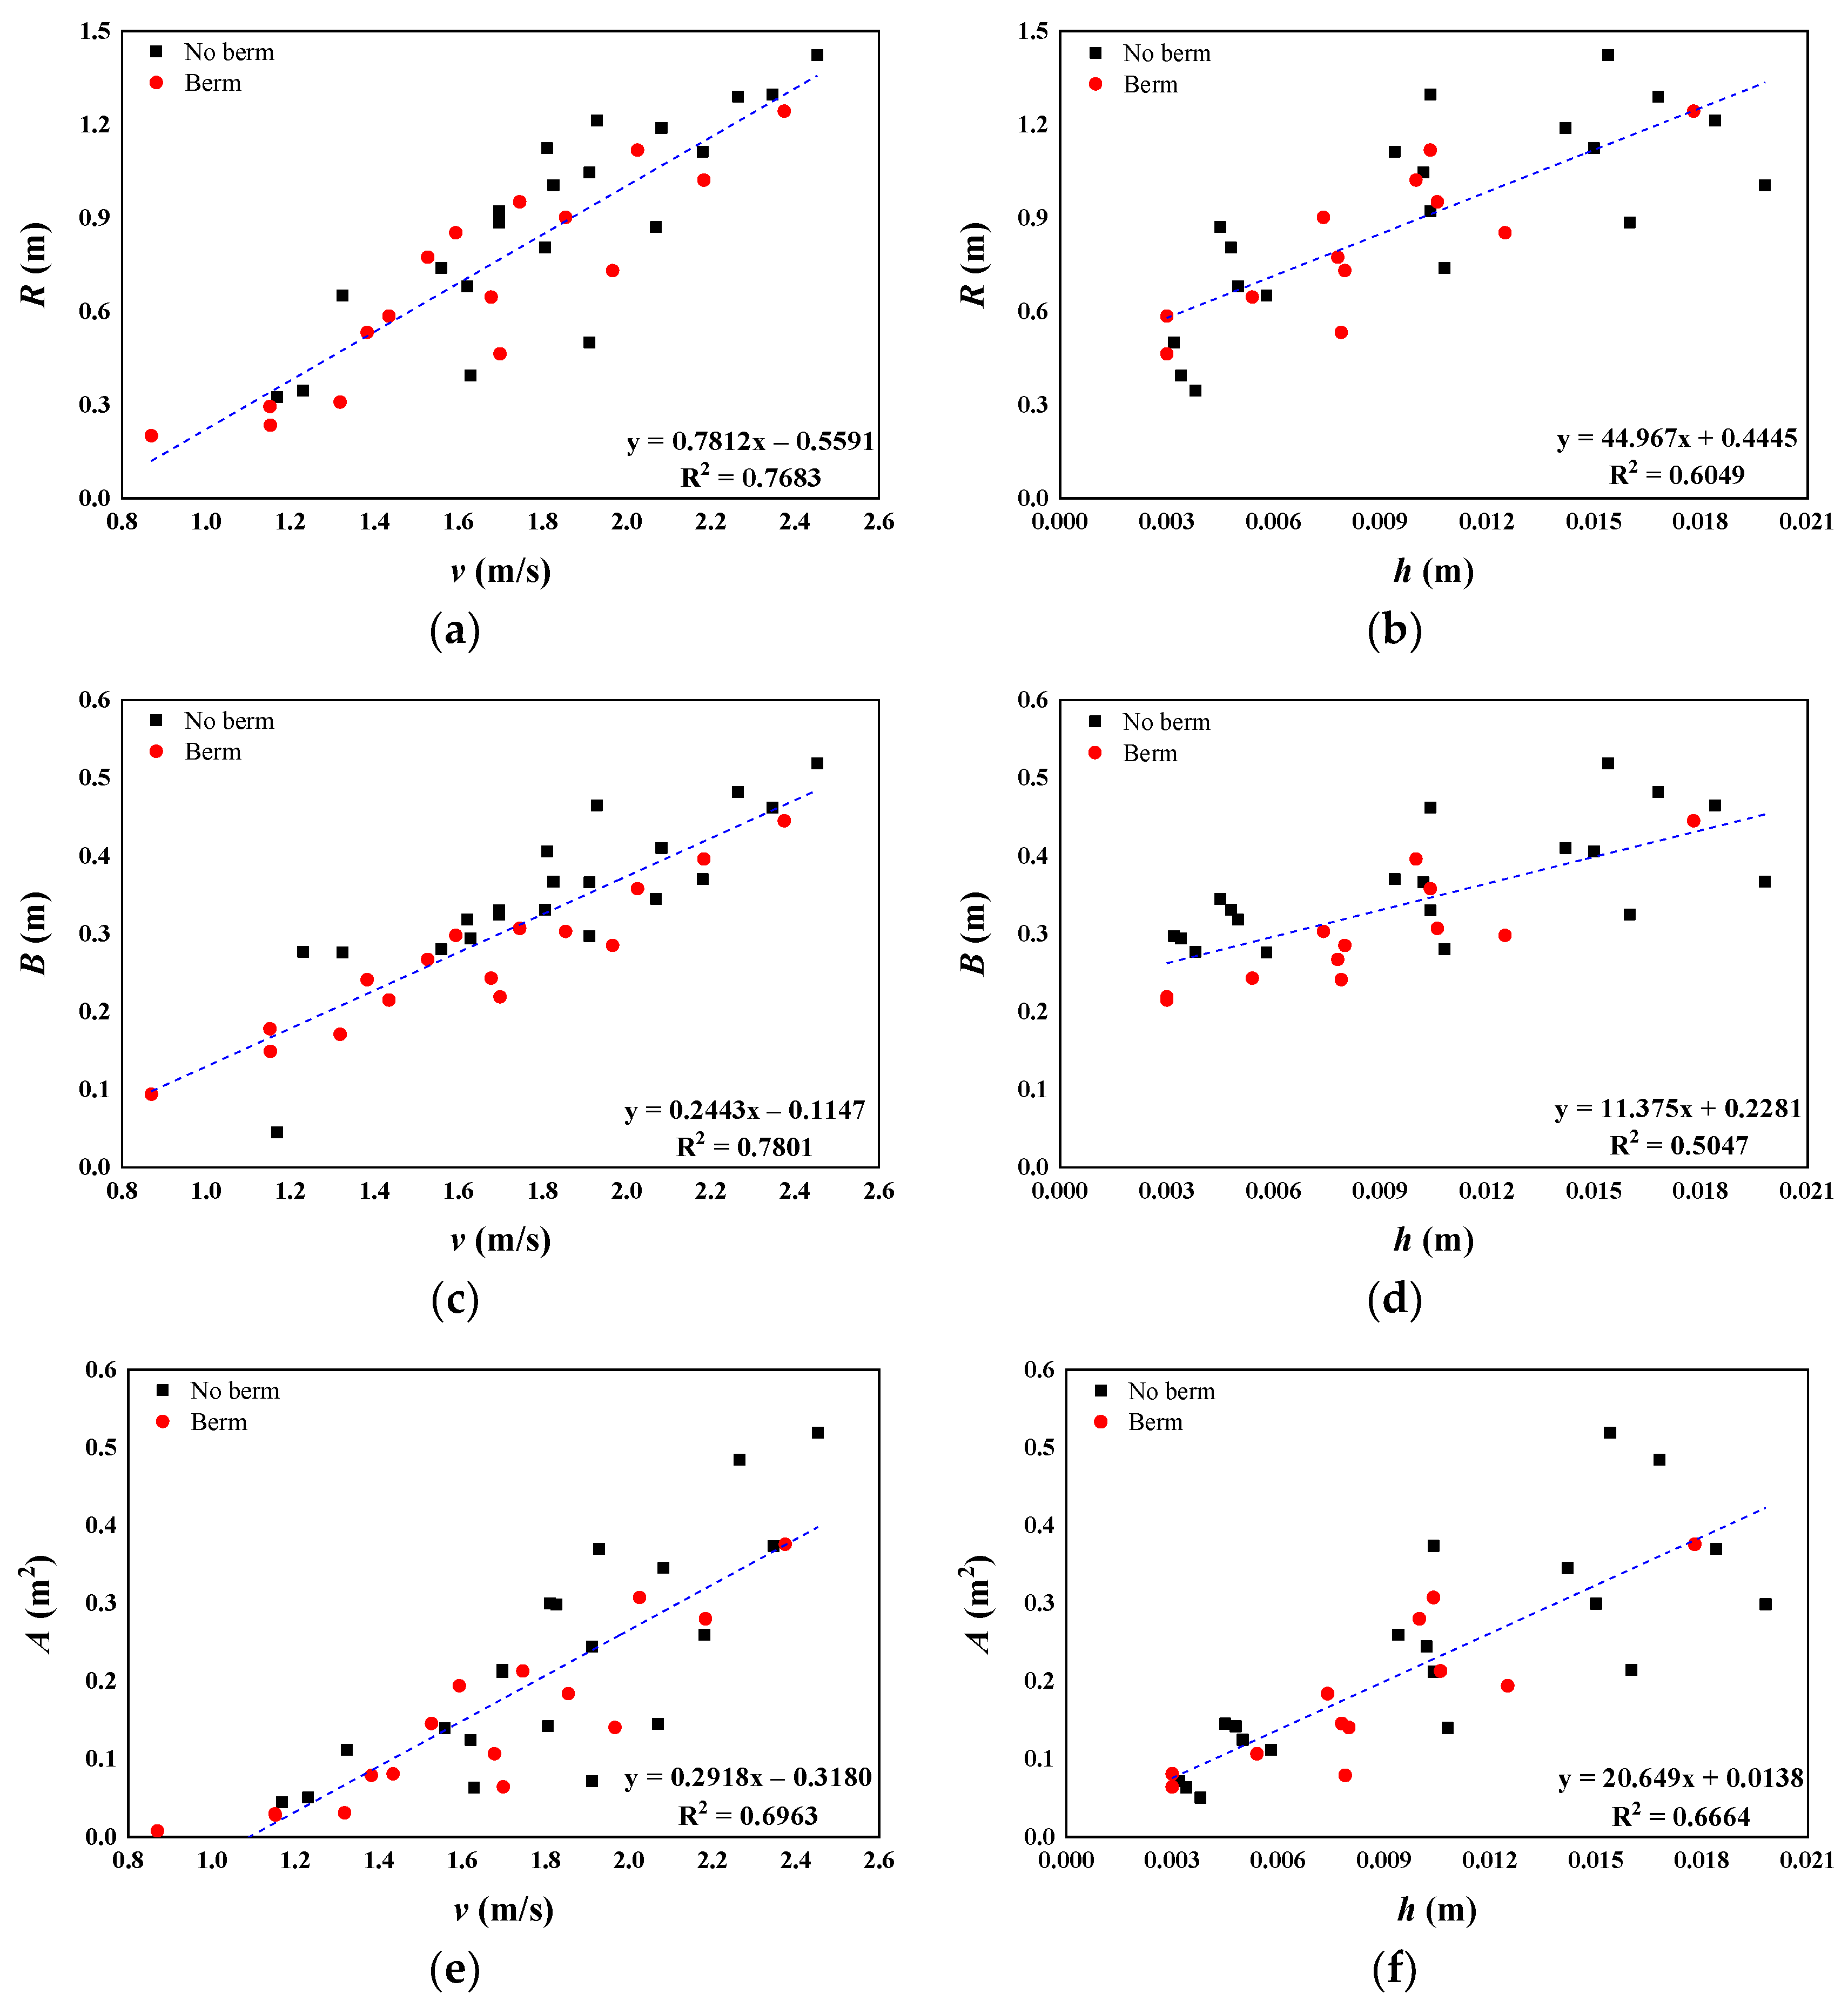
Figure 9 presents the relationships between the flow characteristics (flow velocity and flow depth) and deposition characteristics (runout distance, lateral width, and deposition area) of the debris flow. Figure 9a,c,e show the runout distance, lateral width, and deposition area, respectively, according to the flow velocity, and Figure 9b,d,f depict the runout distance, lateral width, and deposition area, respectively, according to the flow depth. The experimental results reveal that the runout distance, lateral width, and deposition area of the debris flow were significantly affected by the flow velocity and flow depth. As the flow velocity and flow depth increased, farther and wider runout was observed, and the deposition area increased accordingly. The relationships of the runout distance, lateral width, and deposition area of debris flow with the flow velocity exhibited higher coefficients of determination than their relationships with the flow depth (Figure 9a–f).
4. Discussion
Debris flow has recently become more frequent in urban areas adjacent to mountainous areas in Korea, such as the debris flow at Mt. Woomyeon that occurred in July 2011. To respond actively to debris flow damage in urban and suburban areas, the direction of debris flow policy establishment in Korea has changed to include “daily life areas” as well as “mountainous areas” [1,6]. In Korea, studies related to immature debris flows in urban areas have already been conducted [49,50]. In this study, laboratory tests were performed considering a berm as a debris flow mitigation measure to reduce the damage caused by debris flow in urban areas. The berm was installed between the upper and lower channels to reflect changes in channel topography, and the debris flow deposition characteristics were analyzed according to the channel slope, volumetric concentration of sediment, and presence of the berm.
Takahashi [43] reported that debris flow stops in a channel if the volumetric concentration of sediment exceeds 0.58 and that the particle separation of debris flow is activated if the volumetric concentration of sediment is less than 0.55. In this study, debris flow also stopped in the channel, regardless of the channel slope, when the volumetric concentration of sediment was 0.60 in the single-berm channel test. In the straight channel test, however, the debris flow reached the deposition plane even when the volumetric concentration of the sediment was 0.60. The value of 0.60 clearly affected the runout of debris flow in laboratory tests, but it appears that the debris flow did not stop in the channel and traveled farther to the deposition plane, even though the volumetric concentration of sediment exceeded 0.58, owing to the low content of fine-grained soil in the mixed samples used in this study. In general, debris flow can travel a longer distance while exhibiting higher mobility when the content of coarse-grained soil is high [36,41]. Furthermore, debris flow occurs when the channel slope is 15° or greater, and deposition gradually begins at a channel slope of 15° and ends at 10° in most cases [7,9]. In this study, when the channel slope was less than 15°, the development of debris flow was not sufficient for the flow depth to be observed under the various experimental conditions. Nevertheless, debris flow reached the deposition plane when the volumetric concentration of sediment was less than 0.60. Although a channel slope of 15°, at which debris flow began, affected the debris flow development in the laboratory tests, it appears that different results have been obtained depending on the study because the behavior (occurrence, transportation, and deposition) of debris flow is affected by a combination of the debris flow volume and the content of fine-grained soil, as well as the channel slope and volumetric concentration of sediment.
The experimental results showed that the runout distance, lateral width, and deposition area of debris flow increased as the channel slope increased (Figure 6a, Figure 7a, and Figure 8a) and decreased as the volumetric concentration of sediment increased (Figure 6b, Figure 7b, and Figure 8b). In addition, the runout distance, lateral width, and deposition area increased as the flow velocity and flow depth of the debris flow increased, and the flow velocity exhibited a higher coefficient of determination with these parameters than the flow depth (Figure 9a–f). These trends seem to have occurred because the flow velocity exhibited a consistent pattern of change in the single-berm channel test, but the flow depth did not, as splash flow slightly occurred at the berm when the channel slope was 25° [4]. Chang et al. [4] confirmed that the flow depth increased rapidly when the channel slope was 25° in the single-berm channel test because the debris flow rapidly moved down the channel owing to its high mobility. Furthermore, the flow depth was affected by the cross-sectional geometry of the channel where the berm was installed. For these reasons, in the single-berm channel test, the Froude number increased until the channel slope was less than 25°, but decreased sharply at 25°.
When the berm was installed in the middle of the experimental flume, the runout distance, lateral width, and deposition area of the debris flow were reduced by up to 69.1%, 65.9%, and 93.0%, respectively (Figure 6c,d, Figure 7c,d, and Figure 8c,d). These findings demonstrate that the installation of a berm in the debris flow movement path is suitable for mitigating the risk of debris flow by reducing mobility and runout in the deposition area. Upon berm installation, the reductions in runout distance, lateral width, and deposition area of debris flow were found to be highest for high-viscosity debris flows with high volumetric concentrations of sediment (Figure 6d, Figure 7d, and Figure 8d). The reductions in runout distance and deposition area upon berm installation increased as the channel slope decreased (Figure 6c and Figure 8c), whereas the lateral width of the debris flow was reduced by berm installation, but exhibited no consistent change pattern according to channel slope (Figure 7c).
In this study, the representativeness of the generated debris flow was confirmed through comparison of Froude numbers (Table 3) because no field investigation was conducted. The Froude numbers employed in this study were in the range of 4.14–10.79, which is similar to those employed in previous laboratory tests at similar experimental scales [6,44]. Though, actual debris flow may increase in volume by absorbing riverbed material through strong erosive force [51,52,53], the various experimental conditions pertaining to the berm characteristics (geometry, number of berms, and backslope) and debris flow characteristics (initial volume, particle size distribution, content of fine-grained soil, and absorption of the riverbed material) in this study were limited by the restrictions of the experimental setup and laboratory environment. Although there are limitations in conducting research on the runout of debris flow in the deposition area using mixed samples under restricted conditions, the results of this study can still be used to identify berm performance for debris flow in urban areas. If laboratory tests are conducted after identifying material properties through a field investigation of areas in which debris flow occurs, it is expected that the debris flow deposition geometry can be estimated more accurately.
5. Conclusions
In this study, we focused on debris flow in urban areas using a berm as a debris flow mitigation measure. We conducted laboratory tests of debris flow considering the channel slope, volumetric concentration of sediment, and berm installation, then analyzed the relationships between the resulting flow characteristics (flow velocity and flow depth) and deposition characteristics (runout distance, lateral width, and deposition area). In addition, we compared the experimental results using a straight channel without a berm with those of a single-berm channel to examine the berm performance. The main conclusions of this study are as follows.
The runout distance, lateral width, and deposition area of the debris flow exhibited a positive correlation with the channel slope, but a negative correlation with the volumetric concentration of sediment. In the single-berm channel test, debris flow was deposited in the flume regardless of the channel slope when the volumetric concentration of sediment was 0.60, and debris flow was insufficiently developed to observe the flow depth in the various experimental conditions when the channel slope was less than 15°. In other words, the well-known general debris flow occurrence slope of 15° also affected the debris flow behavior simulated in the laboratory tests. In addition, the deposition characteristics (runout distance, lateral width, and deposition area) of the debris flow exhibited a positive correlation with the flow characteristics (the flow velocity and flow depth), and tended to be more affected by flow velocity than flow depth.
The average reductions in runout distance, lateral width, and deposition area of the debris flow owing to berm installation increased 3.87, 2.20, and 2.15 times, respectively, as the volumetric concentration of sediment increased from 0.40 to 0.55; when the channel slope decreased from 25° to 10° these reductions increased 1.61, 1.67, and 1.75 times, respectively. The debris flow mitigation performance of the berm was therefore more affected by the change in volumetric concentration of sediment than in the channel slope. With the berm installed in the middle of the experimental flume, the maximum reductions in the runout distance, lateral width, and deposition area of the debris flow were 69.1%, 65.9%, and 93.0%, respectively. These results indicate that a berm is suitable for partially controlling the runout of debris flow in the deposition area.
As only laboratory tests were performed in this study, there exist several limitations to the application of these experimental results. Furthermore, the results of this study are insufficient to account for various experimental conditions such as the content of fine particles (clay and silt) and geometry of the berm owing to the focus on the effects of changes in channel slope and volumetric concentration of sediment. Nevertheless, this study demonstrated the usefulness of berms as debris flow mitigation measures by elucidating their ability to control the runout of debris flow in the deposition area. In future research, experimental conditions describing the geometry of the berm can be variously configured and laboratory tests performed based on a field investigation of debris flow events to obtain a more accurate berm performance analysis.
Author Contributions
Conceptualization and methodology, H.L.; formal analysis, H.C.; investigation and writing-review and editing, K.R.; writing-original draft preparation, K.R. and H.C. All authors have read and agreed to the published version of the manuscript.
Funding
This research was supported by the Basic Science Research Program through the National Research Foundation of Korea (NRF) funded by the Ministry of Education (NRF-2017R1D1A3B03035477 & NRF-2019R1A6A3A01096145).
Institutional Review Board Statement
Not applicable.
Informed Consent Statement
Not applicable.
Data Availability Statement
The data presented in this study are not available without the agreement of the authors.
Conflicts of Interest
The authors declare no conflict of interest. The funders had no role in the study design; in the collection, analyses, or interpretation of data; in the writing of the manuscript; or in the decision to publish the results.
References
- Eu, S.; Im, S.; Kim, D.; Chun, K.W. Flow and deposition characteristics of sediment mixture in debris flow flume experiments. For. Sci. Technol. 2017, 13, 61–65. [Google Scholar] [CrossRef] [Green Version]
- Eu, S.; Im, S. Examining the impact force of debris flow in a check dam from small-flume experiments. In Proceedings of the 7th International Conference on Debris-Flow Hazards Mitigation, Golden, CO, USA, 10–13 June 2019. [Google Scholar]
- Nguyen, B.; Lee, J.; Kim, Y.; Lee, S.; Kwon, T. Effect of rheological properties on debris-flow intensity and deposition in large scale flume experiment. In Proceedings of the 7th International Conference on Debris-Flow Hazards Mitigation, Golden, CO, USA, 10–13 June 2019. [Google Scholar]
- Chang, H.; Ryou, K.; Lee, H. Debris flow characteristics in flume experiments considering berm installation. Appl. Sci. 2021, 11, 2336. [Google Scholar] [CrossRef]
- Kim, Y.; Paik, J. Depositional characteristics of debris flows in a rectangular channel with an abrupt change in slope. J. Hydro-Environ. Res. 2015, 9, 420–428. [Google Scholar] [CrossRef]
- Eu, S.; Im, S.; Kim, D. Development of debris flow impact force models based on flume experiments for design criteria of soil erosion control dam. Adv. Civ. Eng. 2019, 2019, 1–8. [Google Scholar] [CrossRef]
- Hungr, O.; Morgan, G.C.; Kellerhals, R. Quantitative analysis of debris torrent hazards for design of remedial measures. Can. Geotech. J. 1984, 21, 663–677. [Google Scholar] [CrossRef]
- Iverson, R. Debris-flow mechanics. In Debris-flow Hazards and Related Phenomena; Jakob, M., Hungr, O., Eds.; Springer: Berlin/Heidelberg, Germany, 2005; pp. 105–134. [Google Scholar]
- Costa, J.E. Physical geomorphology of debris flows. In Developments and Applications of Geomorphology; Costa, J.E., Fleisher, P.J., Eds.; Springer: Berlin/Heidelberg, Germany, 1984; pp. 268–317. [Google Scholar]
- Highland, L.M.; Bobrowsky, P. The Landslide Handbook: A Guide to Understanding Landslides; U.S. Geological Survey: Reston, VA, USA, 2008; p. 129. [Google Scholar]
- Kang, H.; Kim, Y. The physical vulnerability of different types of building structure to debris flow events. Nat. Hazards 2016, 80, 1475–1493. [Google Scholar] [CrossRef]
- D’Agostino, V.; Cesca, M.; Marchi, L. Field and laboratory investigations of runout distances of debris flows in the Dolomites (Eastern Italian Alps). Geomorphology 2010, 115, 294–304. [Google Scholar] [CrossRef]
- Proske, D.; Suda, J.; Hübl, J. Debris flow impact estimation for breakers. Georisk 2011, 5, 143–155. [Google Scholar] [CrossRef]
- Iverson, R.M. The physics of debris flows. Rev. Geophys. 1997, 35, 245–296. [Google Scholar] [CrossRef] [Green Version]
- Koch, T. Testing various constitutive equations for debris flow modelling. In Hydrology, Water Resources and Ecology in Headwaters; Kovar, K., Tappeiner, U., Peters, N.E., Craig, R.G., Eds.; IAHS Press: Wallingford, UK, 1998; pp. 249–257. [Google Scholar]
- Bettella, F.; Bisantino, T.; D’Agostino, V.; Gentile, F. Debris-flow runout distance: Laboratory experiments on the role of Bagnold, Savage and friction numbers. In Monitoring, Stimulation, Prevention and Remediation of Dense and Debris Flows Ⅳ; De Wrachien, D., Brebbia, C.A., Mambretti, S., Eds.; WIT Press: Southampton, UK, 2012; pp. 27–36. [Google Scholar]
- Lo, D.O.K. Review of Natural Terrain Landslide Debris-Resisting Barrier Design: Geo Report No. 104; Geotechnical Engineering Office, Civil Engineering Department, The Government of Hong Kong Special Administrative Region: Hong Kong, China, 2000; p. 92. [Google Scholar]
- D’Agostino, V.; Bettella, F.; Cesca, M. Basal shear stress of debris flow in the runout phase. Geomorphology 2013, 201, 272–280. [Google Scholar] [CrossRef]
- Cheng, W.; Ni, J.C.; Arulrajah, A.; Huang, H. A simple approach for characterizing tunnel bore conditions based upon pipe-jacking data. Tunn. Undergr. Space Technol. 2018, 71, 494–504. [Google Scholar] [CrossRef]
- Cheng, W.; Wang, L.; Xue, Z.; Ni, J.C.; Rahman, M.M.; Arulrajah, A. Lubrication performance of pipejacking in soft alluvial deposits. Tunn. Undergr. Space Technol. 2019, 91, 102991. [Google Scholar] [CrossRef]
- Xue, Z.; Cheng, W.; Wang, L.; Song, G. Improvement of the shearing behaviour of loess using recycled straw fiber reinforcement. KSCE J. Civ. Eng. 2021, 25, 3319–3335. [Google Scholar] [CrossRef]
- Hungr, O. A review of landslide hazard and risk assessment methodology. In Landslides and Engineered Slopes. Experience, Theory and Practice; Aversa, S., Cascini, L., Picarelli, L., Scavia, C., Eds.; CRC Press: London, UK, 2016; pp. 3–27. [Google Scholar]
- Yifru, A.L.; Laache, E.; Norem, H.; Nordal, S.; Thakur, V. Laboratory investigation of performance of a screen type debris-flow countermeasure. HKIE Trans. 2018, 25, 129–144. [Google Scholar] [CrossRef]
- Roddy, B.; Howard, E. Hydrological function of berms within a waste landform design. In Proceedings of the 11th International Conference on Mine Closure, Perth, Australia, 15–17 March 2016. [Google Scholar]
- Yu, G.; Huang, H.; Wang, Z.; Brierley, G.; Zhang, K. Rehabilitation of a debris-flow prone mountain stream in southwestern China-strategies, effects and implications. J. Hydrol. 2012, 414–415, 231–243. [Google Scholar] [CrossRef]
- Lin, X.; Huo, M.; Zhou, J.; Cao, T.; Yang, F.; Zhou, H. An experimental study on controlling post-earthquake debris flows using slit dams. Environ. Earth Sci. 2017, 76, 780. [Google Scholar] [CrossRef]
- Wang, F.; Chen, X.; Chen, J.; You, Y. Experimental study on a debris-flow drainage channel with different types of energy dissipation baffles. Eng. Geol. 2017, 220, 43–51. [Google Scholar] [CrossRef]
- Chen, J.; Chen, X.; Zhou, W.; You, Y. Debris flow drainage channel with energy dissipation structures: Experimental study and engineering application. J. Hydraul. Eng. 2018, 144, 06018012. [Google Scholar] [CrossRef]
- Jiang, R.; Fei, W.; Zhou, H.; Huo, M.; Zhou, J.; Wang, J.; Wu, J. Experimental and numerical study on the load and deformation mechanism of a flexible net barrier under debris flow impact. Bull. Eng. Geol. Environ. 2020, 79, 2213–2233. [Google Scholar] [CrossRef]
- Tan, D.; Yin, J.; Qin, J.; Zhu, Z.; Feng, W. Experimental study on impact and deposition behaviours of multiple surges of channelized debris flow on a flexible barrier. Landslides 2020, 17, 1577–1589. [Google Scholar] [CrossRef]
- Kim, S.; Lee, H. A study of the debris flow activity on the one-stepped channel slope. Soil Water Res. 2015, 10, 32–39. [Google Scholar] [CrossRef] [Green Version]
- De Stefano, M.; Gharabaghi, B.; Clemmer, R.; Jahanfar, M.A. Berm design to reduce risks of catastrophic slope failures at solid waste disposal sites. Waste Manag. Res. 2016, 34, 1117–1125. [Google Scholar] [CrossRef]
- Chen, X.; Chen, J.; Zhao, W.; Li, Y.; You, Y. Characteristics of a debris-flow drainage channel with a step-pool configuration. J. Hydraul. Eng. 2017, 143, 04017038. [Google Scholar] [CrossRef]
- Jiang, H.; Zhou, X.; Xiao, Z. Stability of extended earth berm for high landfill. Appl. Sci. 2020, 10, 6281. [Google Scholar] [CrossRef]
- Li, S.; Peng, C.; Wu, W.; Wang, S.; Chen, X.; Chen, J.; Zhou, G.G.D.; Chitneedi, B.K. Role of baffle shape on debris flow impact in step-pool channel: An SPH study. Landslides 2020, 17, 2099–2111. [Google Scholar] [CrossRef]
- de Haas, T.; Braat, L.; Leuven, J.R.F.W.; Lokhorst, I.R.; Kleinhans, M.G. Effects of debris flow composition on runout, depositional mechanisms, and deposit morphology in laboratory experiments. J. Geophys. Res. Earth Surf. 2015, 120, 1949–1972. [Google Scholar] [CrossRef] [Green Version]
- Lanzoni, S.; Gregoretti, C.; Stancanelli, L.M. Coarse-grained debris flow dynamics on erodible beds. J. Geophys. Res. Earth Surf. 2017, 122, 592–614. [Google Scholar] [CrossRef]
- Iverson, R.M.; Logan, M.; LaHusen, R.G.; Berti, M. The perfect debris flow? Aggregated results from 28 large-scale experiments. J. Geophys. Res. 2010, 115, F03005. [Google Scholar] [CrossRef]
- Iverson, R.M. Scaling and design of landslide and debris-flow experiments. Geomorphology 2015, 244, 9–20. [Google Scholar] [CrossRef]
- Im, S.; Eu, S.; Kim, D. Understanding debris flow characteristics using flume experiments. In Advancing Culture of Living with Landslides; Mikos, M., Tiwari, B., Yin, Y., Sassa, K., Eds.; Springer: Cham, Switzerland, 2017; pp. 357–361. [Google Scholar]
- Li, S.; Zhou, G.G.D.; Chen, X.; Song, D. Debris-flow deposition: Effects of fluid viscosity and grain size. In Proceedings of the 7th International Conference on Debris-Flow Hazards Mitigation, Golden, CO, USA, 10–13 June 2019. [Google Scholar]
- Cao, Y.; Zhu, X.; Liu, B.; Nan, Y. A qualitative study of the critical conditions for the initiation of mine waste debris flows. Water 2020, 12, 1536. [Google Scholar] [CrossRef]
- Takahashi, T. Debris flow: Mechanics, Prediction, and Countermeasures, 2nd ed.; CRC Press: London, UK, 2014; p. 572. [Google Scholar]
- Fairfield, G. Assessing the Dynamic Influences of Slope Angle and Sediment Composition on Debris Flow Behaviour: An Experimental Approach. Master’s Thesis, Durham University, Durham, UK, 2011. [Google Scholar]
- Takahashi, T. Debris flow. Annu. Rev. Fluid Mech. 1981, 13, 57–77. [Google Scholar] [CrossRef]
- Rickenmann, D. Debris flows 1987 in Switzerland: Modelling and fluvial sediment transport. In Hydrology in Mountainous Regions II; Sinniger, R.O., Monbaron, M., Eds.; IAHS: Lausanne, Switzerland, 1990; pp. 371–378. [Google Scholar]
- Rickenmann, D. Empirical relationships for debris flows. Nat. Hazards 1999, 19, 47–77. [Google Scholar] [CrossRef]
- Zhou, G.G.D.; Li, S.; Song, D.; Choi, C.E.; Chen, X. Depositional mechanisms and morphology of debris flow: Physical modelling. Landslides 2019, 16, 315–332. [Google Scholar] [CrossRef]
- Paik, J.; Park, S. Numerical simulation of flood and debris flows through drainage culvert. Ital. J. Eng. Geol. Environ. 2011, 11, 487–493. [Google Scholar]
- Jun, B. Numerical simulation of the topographical change in Korea mountain area by intense rainfall and consequential debris flow. Adv. Meteorol. 2016, 2016, 1–11. [Google Scholar] [CrossRef] [Green Version]
- Frank, F.; McArdell, B.W.; Huggel, C.; Vieli, A. The importance of entrainment and bulking on debris flow runout modeling: Examples from the Swiss Alps. Nat. Hazards Earth Syst. Sci. 2015, 15, 2569–2583. [Google Scholar] [CrossRef] [Green Version]
- De Haas, T.; van Woerkom, T. Bed scour by debris flows: Experimental investigation of effects of debris-flow composition. Earth Surf. Process. Landf. 2016, 41, 1951–1966. [Google Scholar] [CrossRef] [Green Version]
- Zhou, J.; Yang, X.; Hou, T. An analysis of the supply process of loose materials to mountainous rivers and gullies as a result of dry debris avalanches. Environ. Earth Sci. 2017, 76, 452. [Google Scholar] [CrossRef]
Figure 1.
Examples of berms installed on actual slopes: (a) Slopes with berms in Thailand (Roengrit Kongmuang/Shutterstock.com; accessed on 9 March 2021); (b) slopes with berms in Crete, Greece (Gestiafoto/Shutterstock.com; accessed on 9 March 2021).
Figure 1.
Examples of berms installed on actual slopes: (a) Slopes with berms in Thailand (Roengrit Kongmuang/Shutterstock.com; accessed on 9 March 2021); (b) slopes with berms in Crete, Greece (Gestiafoto/Shutterstock.com; accessed on 9 March 2021).

Figure 2.
Experimental setups for laboratory tests: (a) Image of the straight channel test setup; (b) image of the single-berm channel test setup; (c) schematic diagram of the straight channel test; (d) schematic diagram of the single-berm channel test.
Figure 2.
Experimental setups for laboratory tests: (a) Image of the straight channel test setup; (b) image of the single-berm channel test setup; (c) schematic diagram of the straight channel test; (d) schematic diagram of the single-berm channel test.


Figure 3.
Particle size distribution curve of the mixed sediment used in the laboratory tests.

Figure 4.
Flow chart of laboratory tests.

Figure 5.
Examples of laboratory tests: (a) Example of a straight channel test (α = 20° and CV = 0.50); and (b) example of a single-berm channel test (α = 20° and CV = 0.50).
Figure 5.
Examples of laboratory tests: (a) Example of a straight channel test (α = 20° and CV = 0.50); and (b) example of a single-berm channel test (α = 20° and CV = 0.50).

Figure 6.
(a) Runout distance according to α (when CV = 0.40–0.55); (b) runout distance according to CV (when α = 10°–25°); (c) percentage decrease in runout distance due to berm according to α (when CV = 0.40–0.55); (d) percentage decrease in runout distance due to berm according to CV (when α = 10°–25°).

Figure 7.
(a) Lateral width according to α (when CV = 0.40–0.55); (b) lateral width according to CV (when α = 10°–25°); (c) percentage decrease in lateral width due to berm according to α (when CV = 0.40–0.55); (d) percentage decrease in lateral width due to berm according to CV (when α = 10°–25°).
Figure 7.
(a) Lateral width according to α (when CV = 0.40–0.55); (b) lateral width according to CV (when α = 10°–25°); (c) percentage decrease in lateral width due to berm according to α (when CV = 0.40–0.55); (d) percentage decrease in lateral width due to berm according to CV (when α = 10°–25°).

Figure 8.
(a) Deposition area according to α (when CV = 0.40–0.55); (b) deposition area according to CV (when α = 10°–25°); (c) percentage decrease in deposition area due to berm according to α (when CV = 0.40–0.55); (d) percentage decrease in deposition area due to berm according to CV (when α = 10°–25°).

Figure 9.
Relationships between flow characteristics and deposition characteristics of debris flow: (a) Relationship between flow velocity and runout distance; (b) relationship between flow depth and runout distance; (c) relationship between flow velocity and lateral width; (d) relationship between flow depth and lateral width; (e) relationship between flow velocity and deposition area; (f) relationship between flow depth and deposition area.


Table 1.
Experimental conditions for laboratory tests.
| Test Type | α (°) | CV | ||||
|---|---|---|---|---|---|---|
| Straight channel test | 10 | 0.40 | 0.45 | 0.50 | 0.55 | 0.60 |
| 15 | 0.40 | 0.45 | 0.50 | 0.55 | 0.60 | |
| 20 | 0.40 | 0.45 | 0.50 | 0.55 | 0.60 | |
| 25 | 0.40 | 0.45 | 0.50 | 0.55 | 0.60 | |
| Single-berm channel test | 10 | 0.40 | 0.45 | 0.50 | 0.55 | 0.60 |
| 15 | 0.40 | 0.45 | 0.50 | 0.55 | 0.60 | |
| 20 | 0.40 | 0.45 | 0.50 | 0.55 | 0.60 | |
| 25 | 0.40 | 0.45 | 0.50 | 0.55 | 0.60 | |
Table 2.
Weights of mixed samples for laboratory tests.
| CV | Wtotal (kg) | SP | SP | GP | WW (kg) | ρ (kg/m3) |
|---|---|---|---|---|---|---|
| <2 mm (kg) | 2–4.75 mm (kg) | 4.75–9.5 mm (kg) | ||||
| 0.40 | 7.100 | 2.200 | 1.100 | 1.100 | 2.700 | 1578 |
| 0.45 | 7.425 | 2.475 | 1.238 | 1.238 | 2.475 | 1650 |
| 0.50 | 7.750 | 2.750 | 1.375 | 1.375 | 2.250 | 1722 |
| 0.55 | 8.075 | 3.025 | 1.513 | 1.513 | 2.025 | 1794 |
| 0.60 | 8.400 | 3.300 | 1.650 | 1.650 | 1.800 | 1867 |
Table 3.
Summary of observed data from laboratory tests.
| Test Type | α (°) | v (m/s) [4] | h (m) [4] | Fr [4] | R (m) | B (m) | A (m2) |
|---|---|---|---|---|---|---|---|
| Straight channel | 10 | 1.169–1.829 | 0.0058–0.0198 | 4.14–5.55 | 0.326–1.005 | 0.045–0.367 | 0.0450–0.2988 |
| 15 | 1.231–1.929 | 0.0038–0.0184 | 4.54–7.32 | 0.346–1.213 | 0.277–0.465 | 0.0506–0.3701 | |
| 20 | 1.629–2.265 | 0.0034–0.0168 | 5.58–8.92 | 0.394–1.290 | 0.294–0.482 | 0.0637–0.4846 | |
| 25 | 1.912–2.453 | 0.0032–0.0154 | 6.31–10.79 | 0.501–1.423 | 0.297–0.519 | 0.0718–0.5192 | |
| Single-berm channel | 10 | 0.870–1.594 | 0.0079–0.0125 | 4.55–4.97 | 0.201–0.853 | 0.094–0.298 | 0.0078–0.1943 |
| 15 | 1.153–1.746 | 0.0030–0.0106 | 5.41–8.36 | 0.235–0.952 | 0.149–0.307 | 0.0284–0.2131 | |
| 20 | 1.319–2.026 | 0.0054–0.0104 | 6.34–7.29 | 0.309–1.118 | 0.171–0.358 | 0.0310–0.3076 | |
| 25 | 1.699–2.375 | 0.0030–0.0178 | 5.68–9.90 | 0.464–1.243 | 0.219–0.445 | 0.0644–0.3759 |
Table 4.
Deposition characteristics of debris flow.
| Deposition Characteristics | Range of Values | Mean Value | Standard Deviation | |
|---|---|---|---|---|
| R (m) | No berm | 0.326–1.423 | 0.891 | 0.323 |
| Berm | 0.201–1.243 | 0.679 | 0.314 | |
| All | 0.201–1.423 | 0.797 | 0.336 | |
| B (m) | No berm | 0.045–0.519 | 0.348 | 0.099 |
| Berm | 0.094–0.445 | 0.261 | 0.089 | |
| All | 0.045–0.519 | 0.309 | 0.104 | |
| A (m2) | No berm | 0.045–0.519 | 0.226 | 0.138 |
| Berm | 0.008–0.376 | 0.142 | 0.107 | |
| All | 0.008–0.519 | 0.189 | 0.132 | |
Publisher’s Note: MDPI stays neutral with regard to jurisdictional claims in published maps and institutional affiliations. |
© 2021 by the authors. Licensee MDPI, Basel, Switzerland. This article is an open access article distributed under the terms and conditions of the Creative Commons Attribution (CC BY) license (https://creativecommons.org/licenses/by/4.0/).
Share and Cite
MDPI and ACS Style
Ryou, K.; Chang, H.; Lee, H. Laboratory Analysis of Debris Flow Characteristics and Berm Performance. Water 2021, 13, 2223. https://doi.org/10.3390/w13162223
AMA Style
Ryou K, Chang H, Lee H. Laboratory Analysis of Debris Flow Characteristics and Berm Performance. Water. 2021; 13(16):2223. https://doi.org/10.3390/w13162223
Chicago/Turabian StyleRyou, Kukhyun, Hyungjoon Chang, and Hojin Lee. 2021. "Laboratory Analysis of Debris Flow Characteristics and Berm Performance" Water 13, no. 16: 2223. https://doi.org/10.3390/w13162223
Note that from the first issue of 2016, this journal uses article numbers instead of page numbers. See further details here.