
Variation in Anisotropy with Dehydration in Layered Sandstone


1
Fujian Institute of Geotechnical Engineering Survey and Research Co., Ltd., Fuzhou 350108, China
2
College of Architecture and Civil Engineering, Xi’an University of Science and Technology, Xi’an 710054, China
*
Authors to whom correspondence should be addressed.
Water 2021, 13(16), 2224; https://doi.org/10.3390/w13162224
Submission received: 19 July 2021
/
Revised: 10 August 2021
/
Accepted: 11 August 2021
/
Published: 16 August 2021
(This article belongs to the Special Issue Water–Rock/Soil Interaction)
Abstract
:Anisotropy in rock could significantly affect the stability and safety of rock engineering by differing physical and mechanical properties of rock in different directions. Another major factor for physical and mechanical properties of rock is moisture state, however, whether anisotropy can be altered by it remains unclear. This study investigated variation in anisotropy (by conduct-ing ultrasonic tests) with moisture state (measured by nuclear magnetic resonance) in layered sandstones, and interpreted the phenomenon from the perspective of linking dehydration with pore structure of rock. The results show that (1) sandstone with more obvious bedding bears stronger anisotropy, the P-wave velocity in the perpendicular direction is much lower than that in the parallel direction. (2) The anisotropy index fluctuates around 1 with dehydration of sandstone without obvious bedding, while the anisotropy in sandstone with obvious bedding was significantly enhanced be dehydration. (3) During dehydration bulk water escaped firstly then capillary water and bound water. (4) Dehydration is controlled by the bedding structure. The different dehydration rates of pore water in different directions inevitably lead to heterogeneity in moisture state that change the anisotropy of the rock, which is reflected by the non-synchronous changes in P-wave velocities in different directions.
1. Introduction
In nature, rocks have anisotropic structures with a large number of primary weak features such as bedding planes and joints. Sandstone, schist and shale are generally regarded as transversely isotropic (TI) materials [1]. Anisotropy in rock structures leads to anisotropy in physical and mechanical properties, which can significantly affect the stability and safety of engineered structures such as underground chambers and rock slopes and should be considered in the design and construction processes [2,3,4]. Rocks exist in complex geological and hydrogeological environments and their moisture state are often in a dynamic state [5,6,7]. The moisture state has an important influence on the physical and mechanical properties of rocks [8,9,10]. Changes in moisture content can change the physical and mechanical properties of rocks; however, it is not clear whether anisotropy is affected. Such anisotropy needs to be understood to allow the influence of water to be fully considered when evaluating the stability of underground chambers or slopes. Therefore, it needs to be studied in depth.
Anisotropy in TI rocks is commonly estimated by measuring the ultrasonic or mechanical properties along different orientations of the bedding plane [11,12,13]. These properties vary according to the bedding plane orientation [14]; accordingly, the strongest and weakest orientations can be determined [15,16,17]. Ultrasonic testing is convenient and rapid and is commonly used to study anisotropy in rocks. The ultrasonic wave velocity is well correlated with the mechanical parameters of rocks [18,19,20]. Ultrasonic testing has been used to study anisotropic changes in rock under different load conditions, such as fatigue load [17,21], impact load [22] and static load [23], and under different environmental conditions, such as high temperatures [24], freeze-thaw cycling [25] and dry-wet cycling [26]. The above studies on the anisotropy of bedded rocks are basically focused on the dry and saturated states [27,28], but the studies on the anisotropy of rocks under different moisture content are rare.
In this paper, we investigated variation in anisotropy by conducting ultrasonic tests with moisture state (measured by nuclear magnetic resonance (NMR)) in two kinds of layered sandstones (with and without an obvious bedding structure). By linking dehydration of pore water with pore structure of rock, the mechanisms of dehydration altering anisotropy in sandstone were interpreted.
2. Experimental Design
2.1. Sample Preparation
- (1)
- Sample processing and selection
We used two different kinds of bedded sandstones: sample 1 was an orange bedded sandstone, while sample 2 was grey sandstone. The porosities of these samples were 17.39% and 7.02%, respectively. Used supereyes to observe the rock surface, it can be seen that sample 1 has a bedded structure, which is not obvious, and the distribution of mineral grains is relatively uniform (Figure 1a). The bedding structure of sample 2 is more obvious and the size of the mineral grains differs according to the bedding type (Figure 1b). The pore size distribution of a rock (Figure 1d) can be calculated according to its NMR T2 spectrum (Equation (3)). Based on the rock pore size classification proposed by Jia et al. [25], pores with apertures < 0.1 μm are classified as micropores, those between 0.1 μm and 1000 μm are mesopores, and those > 1000 μm are macropores. The pore size distributions can be described as follows. Sample 1: double peak with a high proportion of mesopores. Sample 2: single peak with a uniform pore distribution and high proportion of micropores. For testing convenience, the rocks were processed into cube samples 75 mm on each side. These were tested in three directions (≥I-I, II-II, III-III) by ultrasonication. Directions I-I and II-II were parallel to the bedding direction, while III-III was perpendicular to it (Figure 1c).
- (2)
- Preparation of samples with different saturations
Samples of different saturations were obtained by pumping to saturation followed by controlled dehydration. The main steps were as follows: (1) Drying. Samples were placed in an oven at 105 °C to dry and their mass measured after 36, 42, and 48 h. Samples with a mass that remained unchanged after 36 h were regarded as dry with a dry mass . (2) Vacuum saturation. The samples were then placed in a vacuum chamber at −1 bar for 4 h, immersed in water, then the air release valve was opened after bubbles no longer emerged from the rock surface. The masses of the samples were measured every 24 h until they did not change and were then considered to be completely saturated (this stage lasted for about 72 h) with a saturated mass . (3) Dehydration. Samples were placed in a laboratory with a temperature of 24 °C and humidity of about 80% and allowed to dehydrate to saturations of 90–50%. Samples with 40–0% saturation were prepared by dehydrating the samples in an oven at 40 °C. When the temperature reached the pre-calculated saturation mass (), they were wrapped in cling film and allowed to stand for 6 h to make the water distribution in the rock samples as uniform as possible. The formula for calculating saturation is:
where is the saturation level required for the test (0%, 10%, 20%, 30%, 40%, 50%, 60%, 70%, 80%, 90%, 100%); and is the mass of the sample at the test saturation; is the dry mass; and is the completely saturated mass (g in all cases).
2.2. Principles of the NMR Tests
2.2.1. Basic Principles of NMR
The H protons in the pore water of rock have random orientations. When a rock sample was put into the nuclear magnetic resonance (NMR) instrument, these protons were magnetised by a magnetic field. Then, the emission of alternating electromagnetic fields causes these polarised protons to flip from their new equilibrium position. After the alternating magnetic field is removed, these protons return to their original equilibrium positions in a process called relaxation. Generally, we judge changes in rock and soil pore water by measuring the relaxation time T2, which is the transverse relaxation time of a proton in water. The transverse magnetization vector strength is the signal strength measured during NMR scanning, which is proportional to the number of protons. For a given sample, the magnitude of the signal is affected by temperature and variation in the material [29].
2.2.2. Measurement of the Pore Structure of Rocks
The water in pores of different diameters has different transverse relaxation times. Therefore, the pore size distribution of a rock can be calculated according to its T2 spectrum [30]. The relationship between pore water T2 and the geometric parameters of the pores is:
where is the transverse surface relaxation rate (constant for certain rocks at 5 μm/s); is the pore surface area; and is the pore volume. By introducing the concept of average pore size, the above equation can be expressed as:
where is a geometric factor (for spherical pores, = 3, for columnar pores, = 2, this article takes = 2) and is the average radius. According to the above equation, there is a one-to-one correspondence between T2 and pore size.
2.2.3. Categorization of Pore Water
The pore water confined in porous rocks can be broadly categorized into three types: bound water, capillary water and bulk water (or free water) [31]. Bound water mainly occurs as adsorbed water on the surfaces of minerals or as interlayer water in the presence of clay minerals. The T2 spectrum of pore water in a uniform magnetic field at a constant temperature is dominated by surface relaxation [30], which depends mainly on the nature of the liquid and its affinity for mineral surfaces (or internal surfaces; [32]. Therefore, the fractions of pore water can be deduced from the T2 spectrum. It has been observed that the T2 of bound water in sandstone is generally < 3 ms, whereas that of capillary water ranges between 3 ms and 33 ms, and values > 33 ms are associated with bulk water or free water [33,34]. We employed these critical values to partition the pore water fractions.
2.3. Experimental Design
- (1)
- Ultrasonic testing of rock samples under different saturations
Changes in the P-wave velocity were measured with a M-4A non-metal ultrasonic analyser was manufactured by Beijing KONCRETE Engineering Testing Technology Co., Ltd., with the settings: range = 75 mm; zero sound = 6.4 μs, sampling period = 0.8 μs; emitted voltage = 500 V; window length = 4096 and sampling length = 512. Samples were tested with saturation levels of 0%, 10%, 20%, 30%, 40%, 50%, 60%, 70%, 80%, 90% and 100%. The test saturations were consistent with those of the NMR test. As we were investigating the anisotropy of bedded sandstone, the ultrasonic tests were carried out in three different directions (I-I, II-II, III-III) in cube samples of the same saturation. After that, the rock samples were dehydrated to the next saturation level, wrapped in cling film and allowed to stand for 6 h to make the water distribution in the rock samples as uniform as possible, then tested by the ultrasonic analyser in the three directions. The above tests were repeated until all samples and saturation levels had been tested.
- (2)
- NMR testing of rock samples at different saturations
The equipment used was an NMR low-temperature pore analyser (macroMR12-150H-I) with the settings: P1 = 30 μs, P2 = 54 μs, TD = 560,028, PRG = 3, TW = 1000 ms, TE = 0.28 ms, NECH = 8000, SW = 250 kHz, RFD = 0.02 ms, RG1 = 10 dB, DRG1 = 3, and NS = 8. The test saturations were consistent with those of the ultrasonic test. The completely saturated rock samples were put into the NMR coil for signal acquisition, from which T2 distributions were obtained by inversion and NMR signals were recorded. After that, the rock samples were dehydrated to the next saturation level and tested by the NMR. The tests were repeated until complete.
3. Results
3.1. Variation in P-Wave Velocity of Layered Sandstone during Dehydration
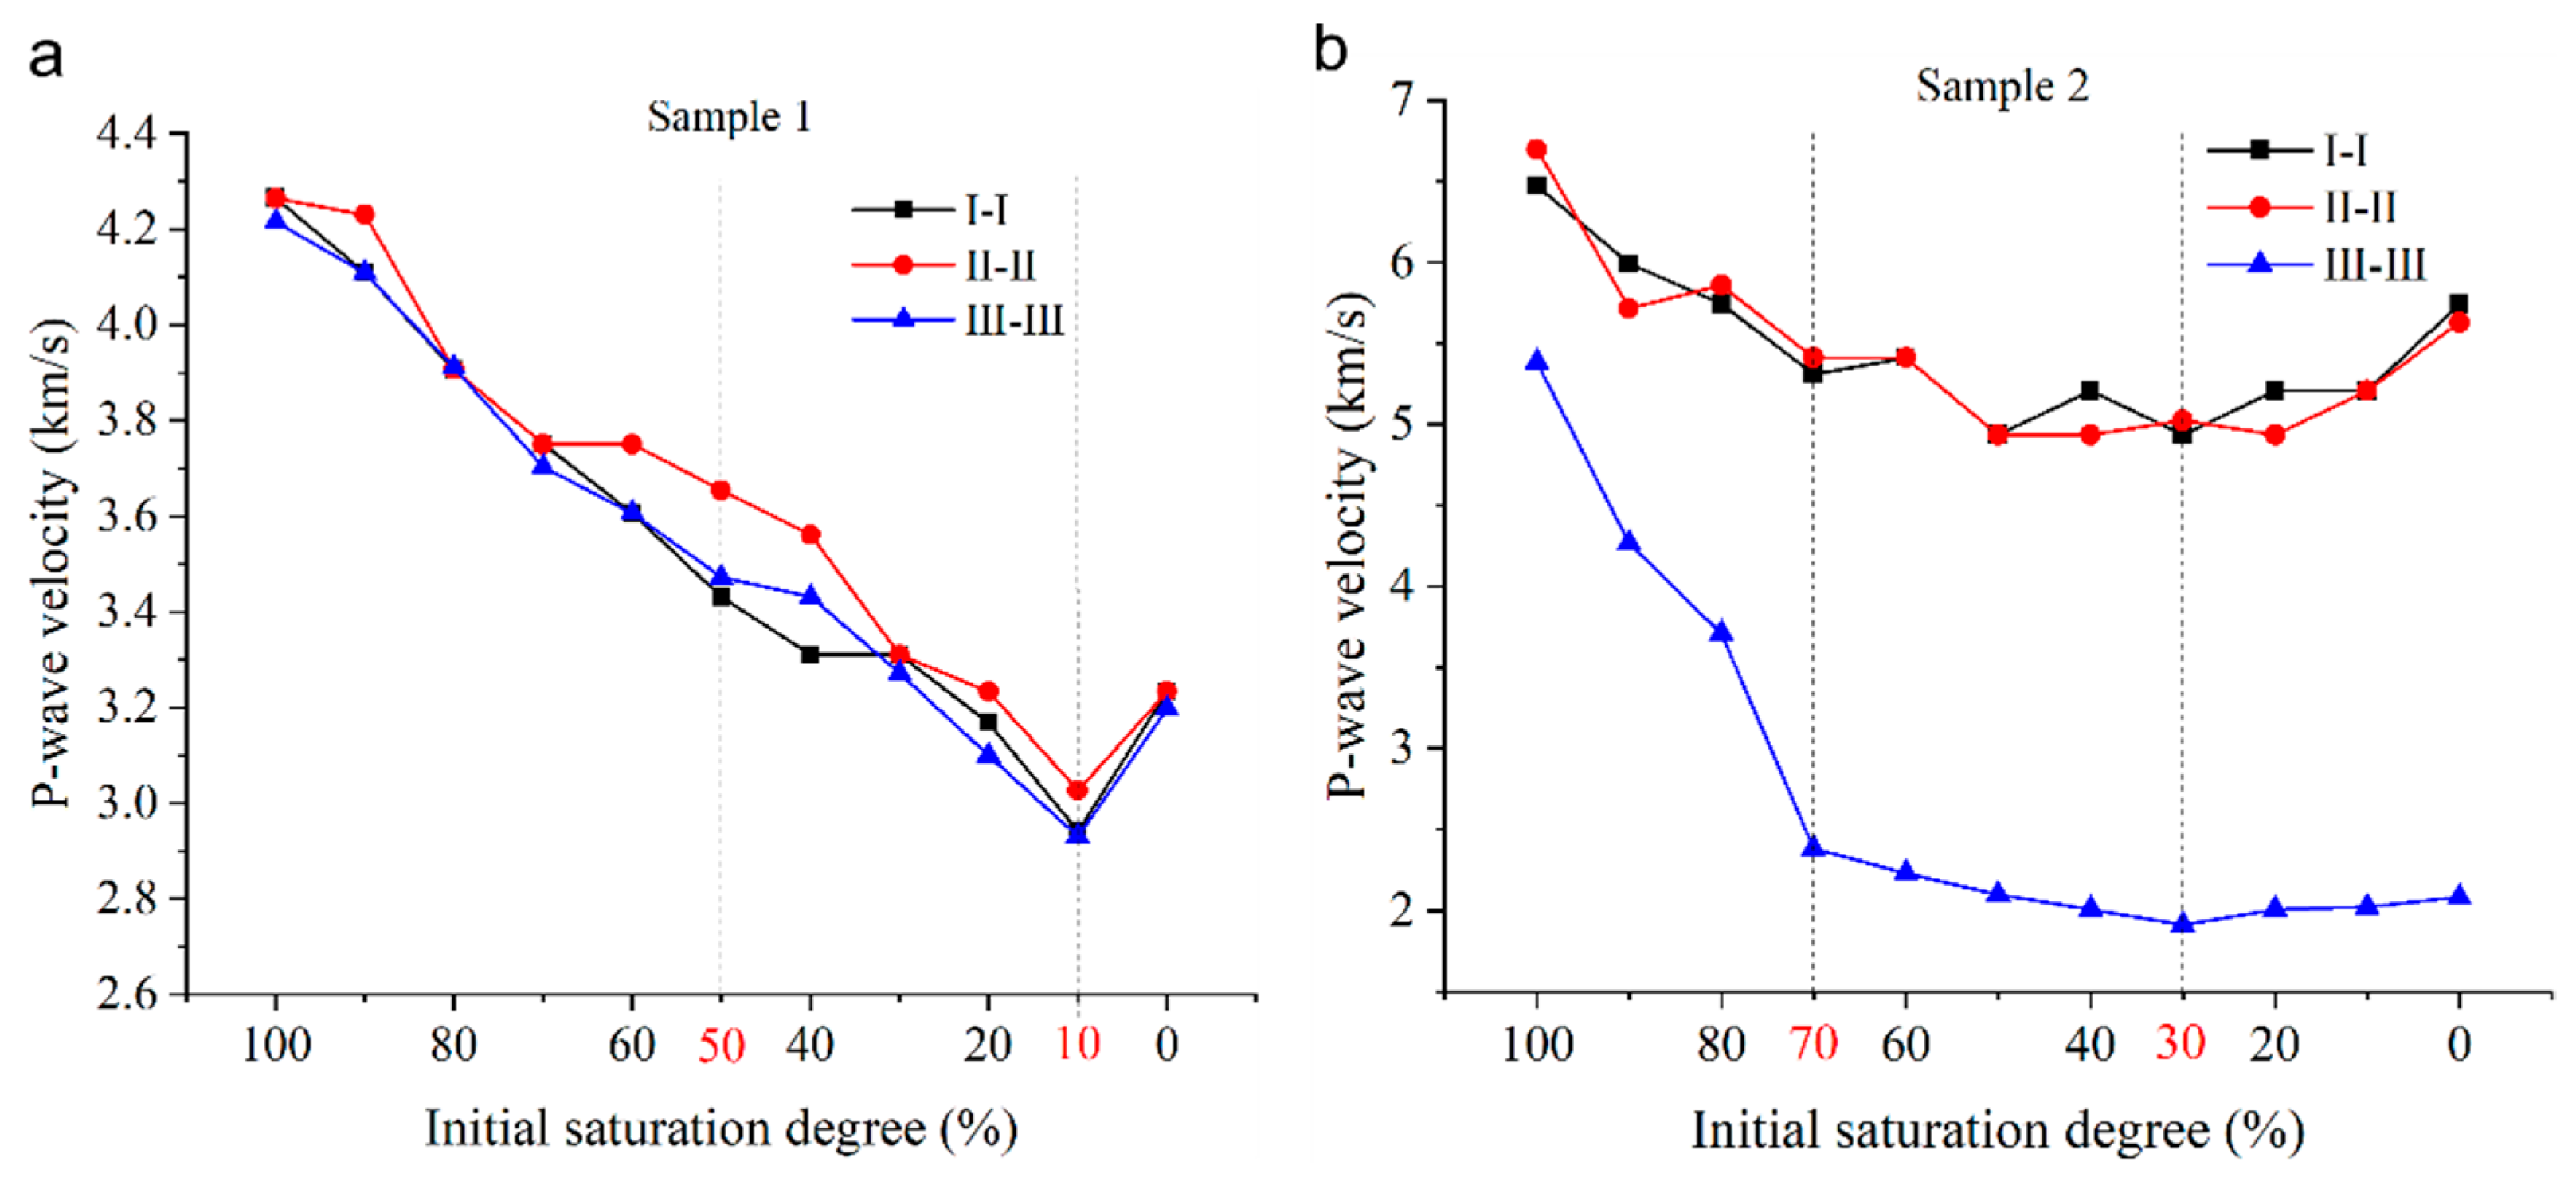
Figure 2a shows the variation in P-wave velocities according to saturation degree in sample 1 in the three directions (I-I, II-II and III-III). It shows that the P-wave velocity in these three directions varies with saturation basically the same. The P-wave velocities in the three directions had the same trends: all decreased with saturation (from 100% to 10%) but increased when the sample was almost completely dry (from 10% to 0%). In sample 2 (Figure 2b), directions I-I and II-II were parallel to the bedding direction, so the P-wave velocities in both directions were similar. Meanwhile, the III-III direction was perpendicular to the bedding and the figure shows that the P-wave velocities in this direction were much lower than in the other two directions. This difference increased as the saturation decreased. Moreover, the variation in P-wave velocity with saturation in the direction parallel to the bedding was different from that in the perpendicular direction. In parallel directions, at saturations > 30%, the wave velocity decreased with saturation; while at saturations < 30%, the P-wave velocity increased. In the perpendicular direction, the P-wave velocity showed a two-stage trend with decreases in saturation; at saturations > 70%, the P-wave velocity decreased rapidly from about 5.5 km/s to about 2 km/s with decreases in saturation; while at saturations < 70%, P-wave velocity was largely unchanged.
3.2. Variation in Anisotropy in Bedded Sandstone during Dehydration
The anisotropy index is a standard measure of anisotropy in rocks and is usually defined by P-wave velocity [25]. In this paper, the index was defined as the ratio of the P-wave velocity parallel to the bedding to that perpendicular to the bedding:
where and are the anisotropy indexes in the I-I and II-II directions, respectively, and , and are the P-wave velocities in the I-I, II-II and III-III directions, respectively.
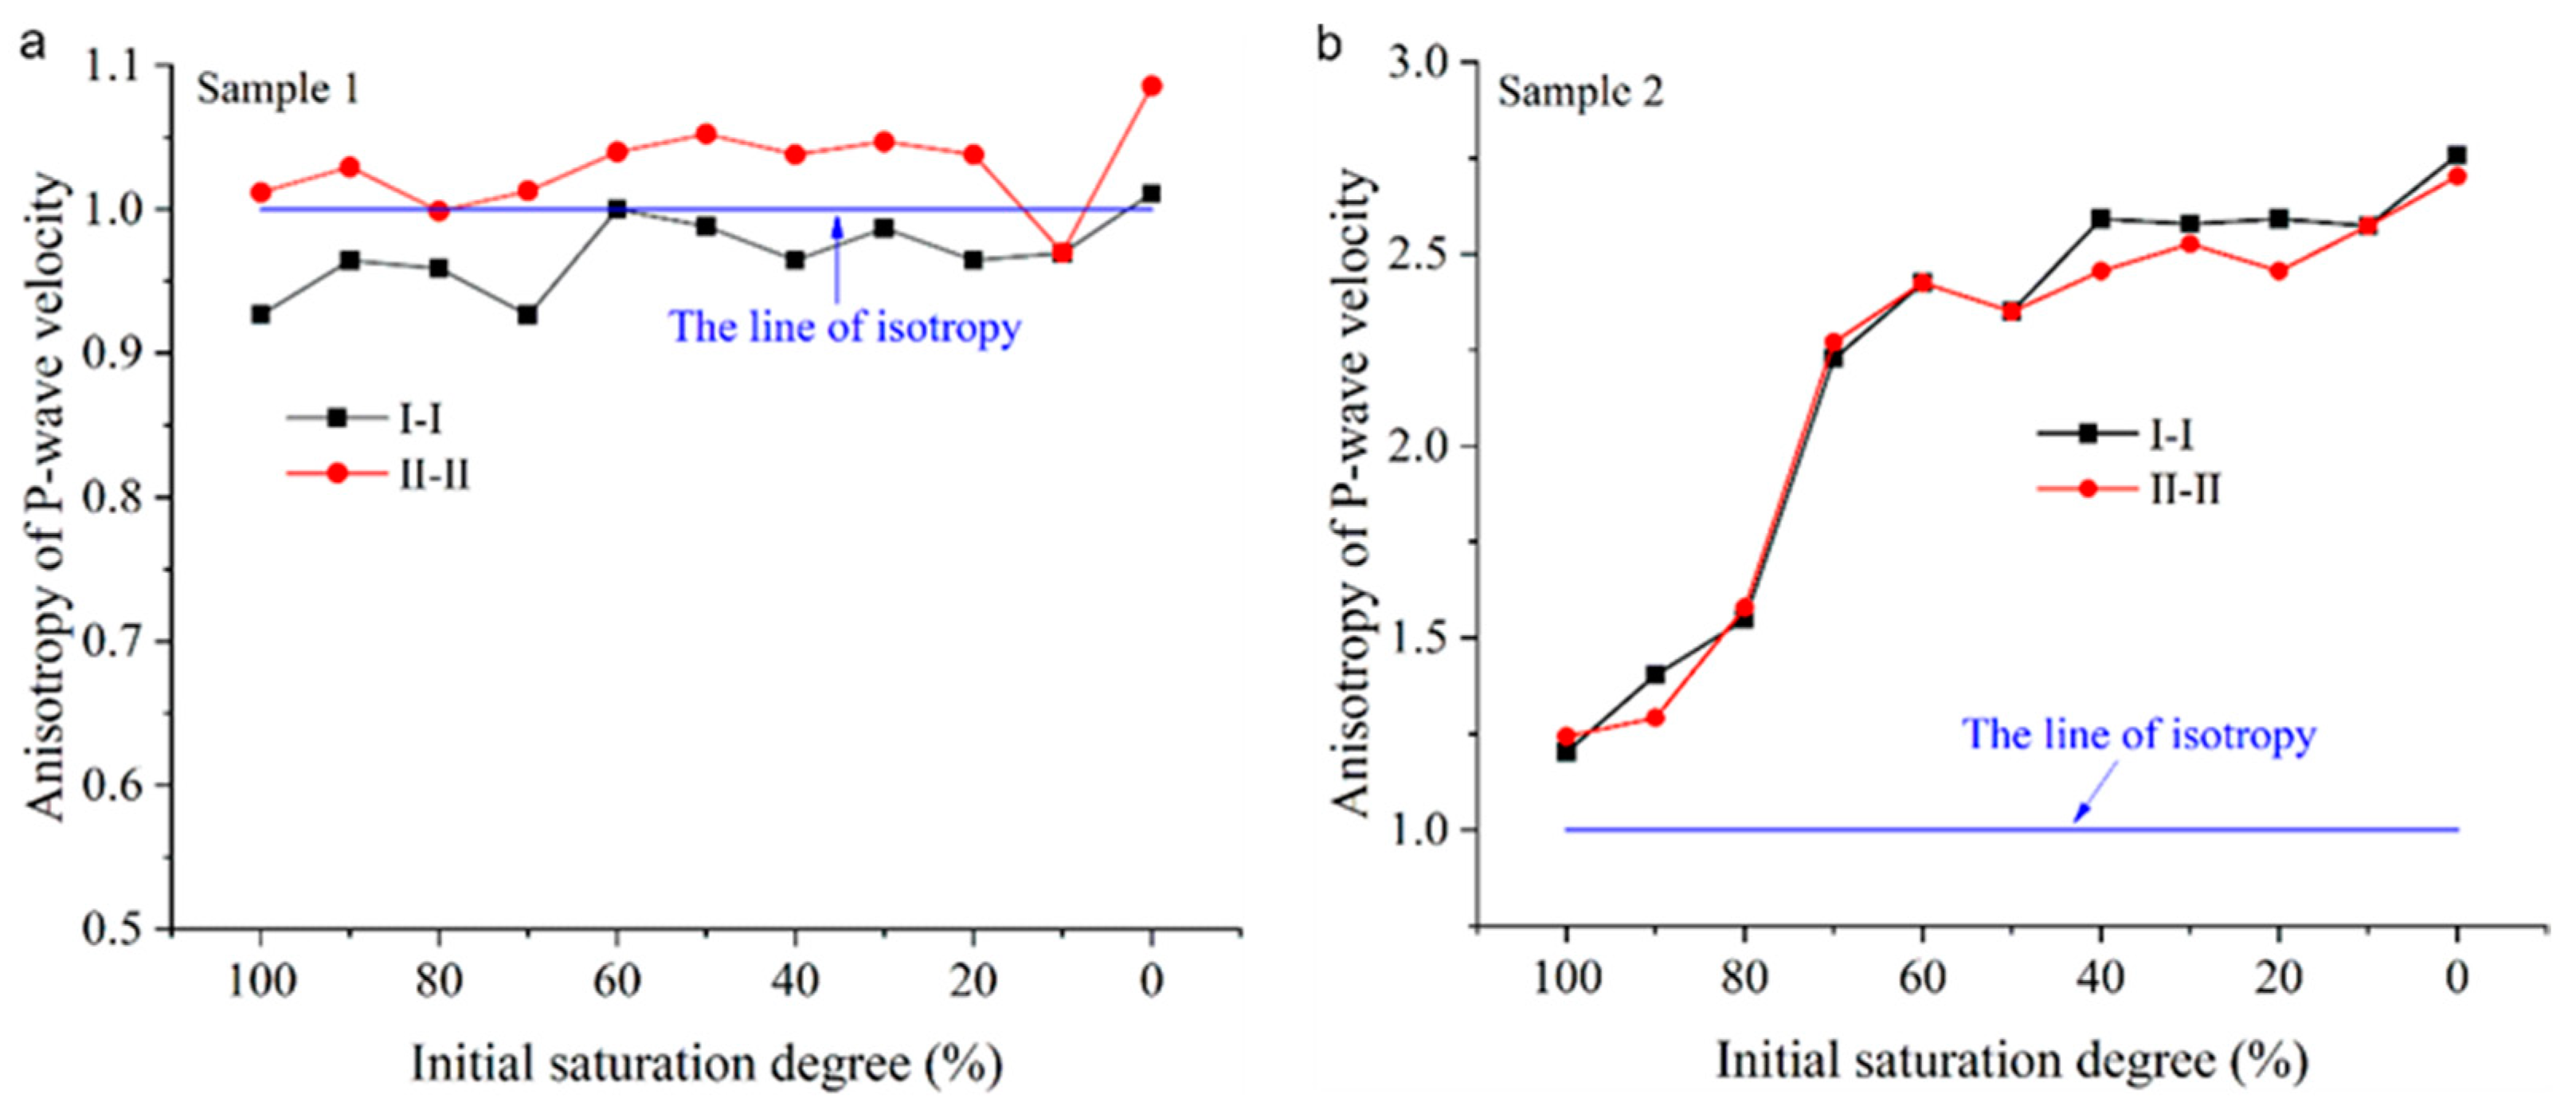
According to the variation in P-wave velocity with saturation (Figure 2) and combined with Equation (2), the relationship between the anisotropy index and saturation in the two types of rocks was obtained (Figure 3). Figure 3a shows the anisotropy curve for sample 1 in directions I-I and II-II. It shows that the anisotropic index fluctuated around 1 with changes in saturation, with the II-II direction have slightly higher values than the I-I direction. This is consistent with the P-wave velocity curve of sample 1 in Figure 2a. For sample 2 (Figure 3b), the anisotropy in directions I-I and II-II varied with decreases in saturation with similar two-stage trends; that is, at saturations > 70%, the anisotropy index increased rapidly from about 1.2 to about 2.3; while at saturations < 70%, the index increased slowly, which is consistent with the variation in P-wave velocity of sample 2 (Figure 2b).
3.3. Moisture State in Layered Sandstone during Dehydration
3.3.1. T2 Spectra of Rocks under Different Saturations
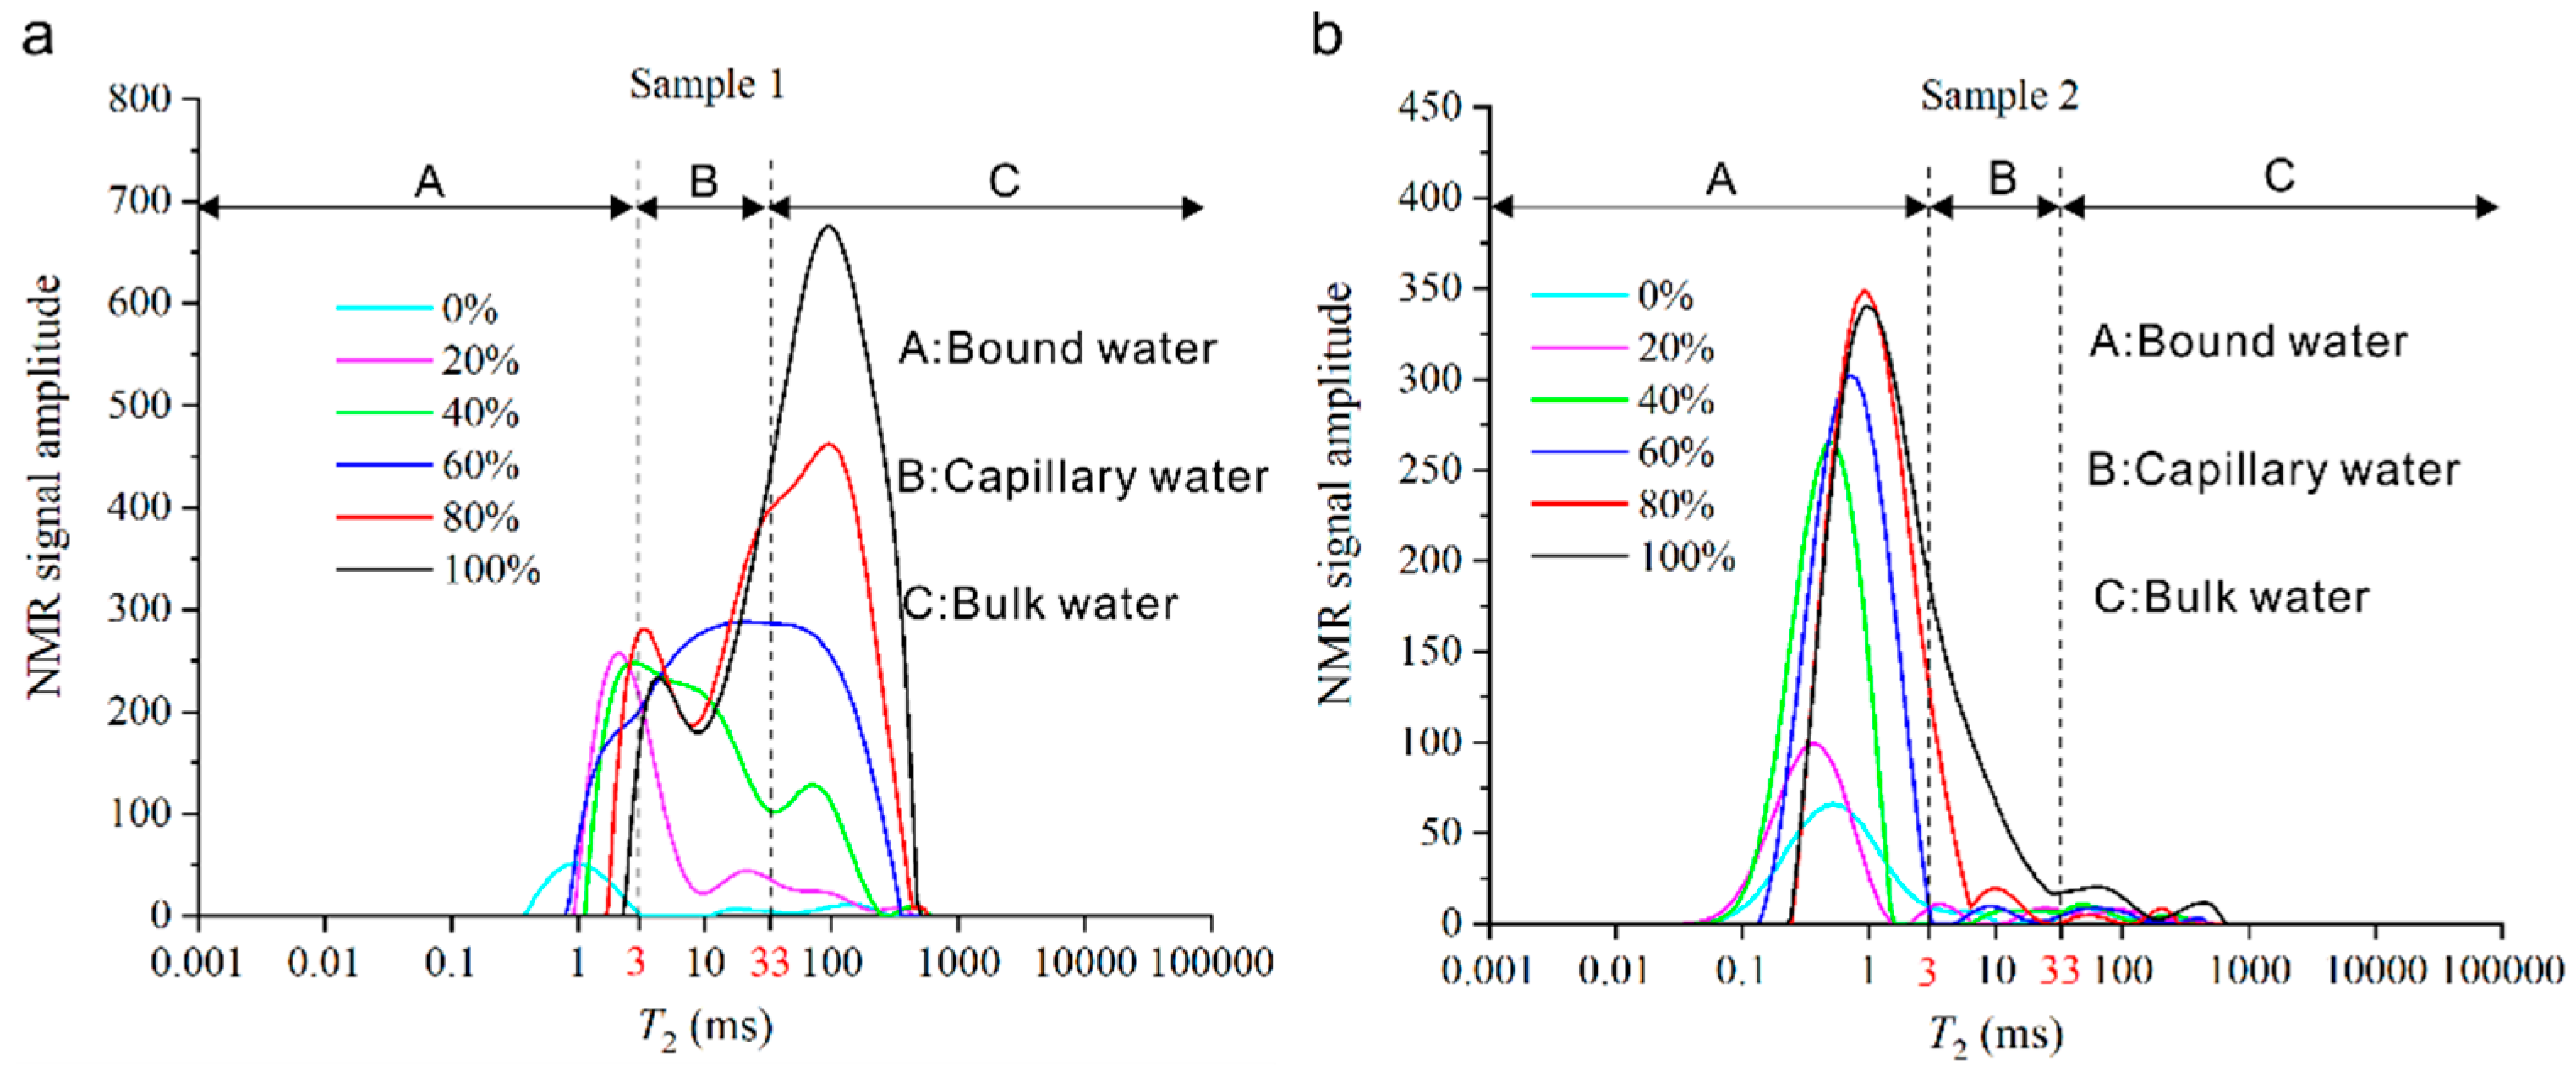
According to NMR theory, the total area of a T2 spectrum of a rock reflects its water content, while the relaxation time reflects the type of pore water. The pore water consists of three parts: bound water (A), capillary water (B) and bulk water (C; Figure 4). The T2 spectrum of sample 1 when completely saturated has a double peak, with the main peak appearing in the region corresponding to bulk water (Figure 4a). The spectrum of sample 2 has a single peak appearing in the region corresponding to bound water (Figure 4b). The T2 spectrum peak heights and areas of the two samples decrease with saturation, the peak widths became narrower, and the spectral lines shift to the left. In particular, for sample 1, the right peak decreases significantly at saturation about 50%, the right peak basically disappears, and the T2 spectrum has a single peak at the boundary of the bound water and capillary water regions. As the saturation continues to decrease, the spectral line continues to move to the left and the peak height continues to decrease.
3.3.2. Variations in Pore Water Type with Different Saturations
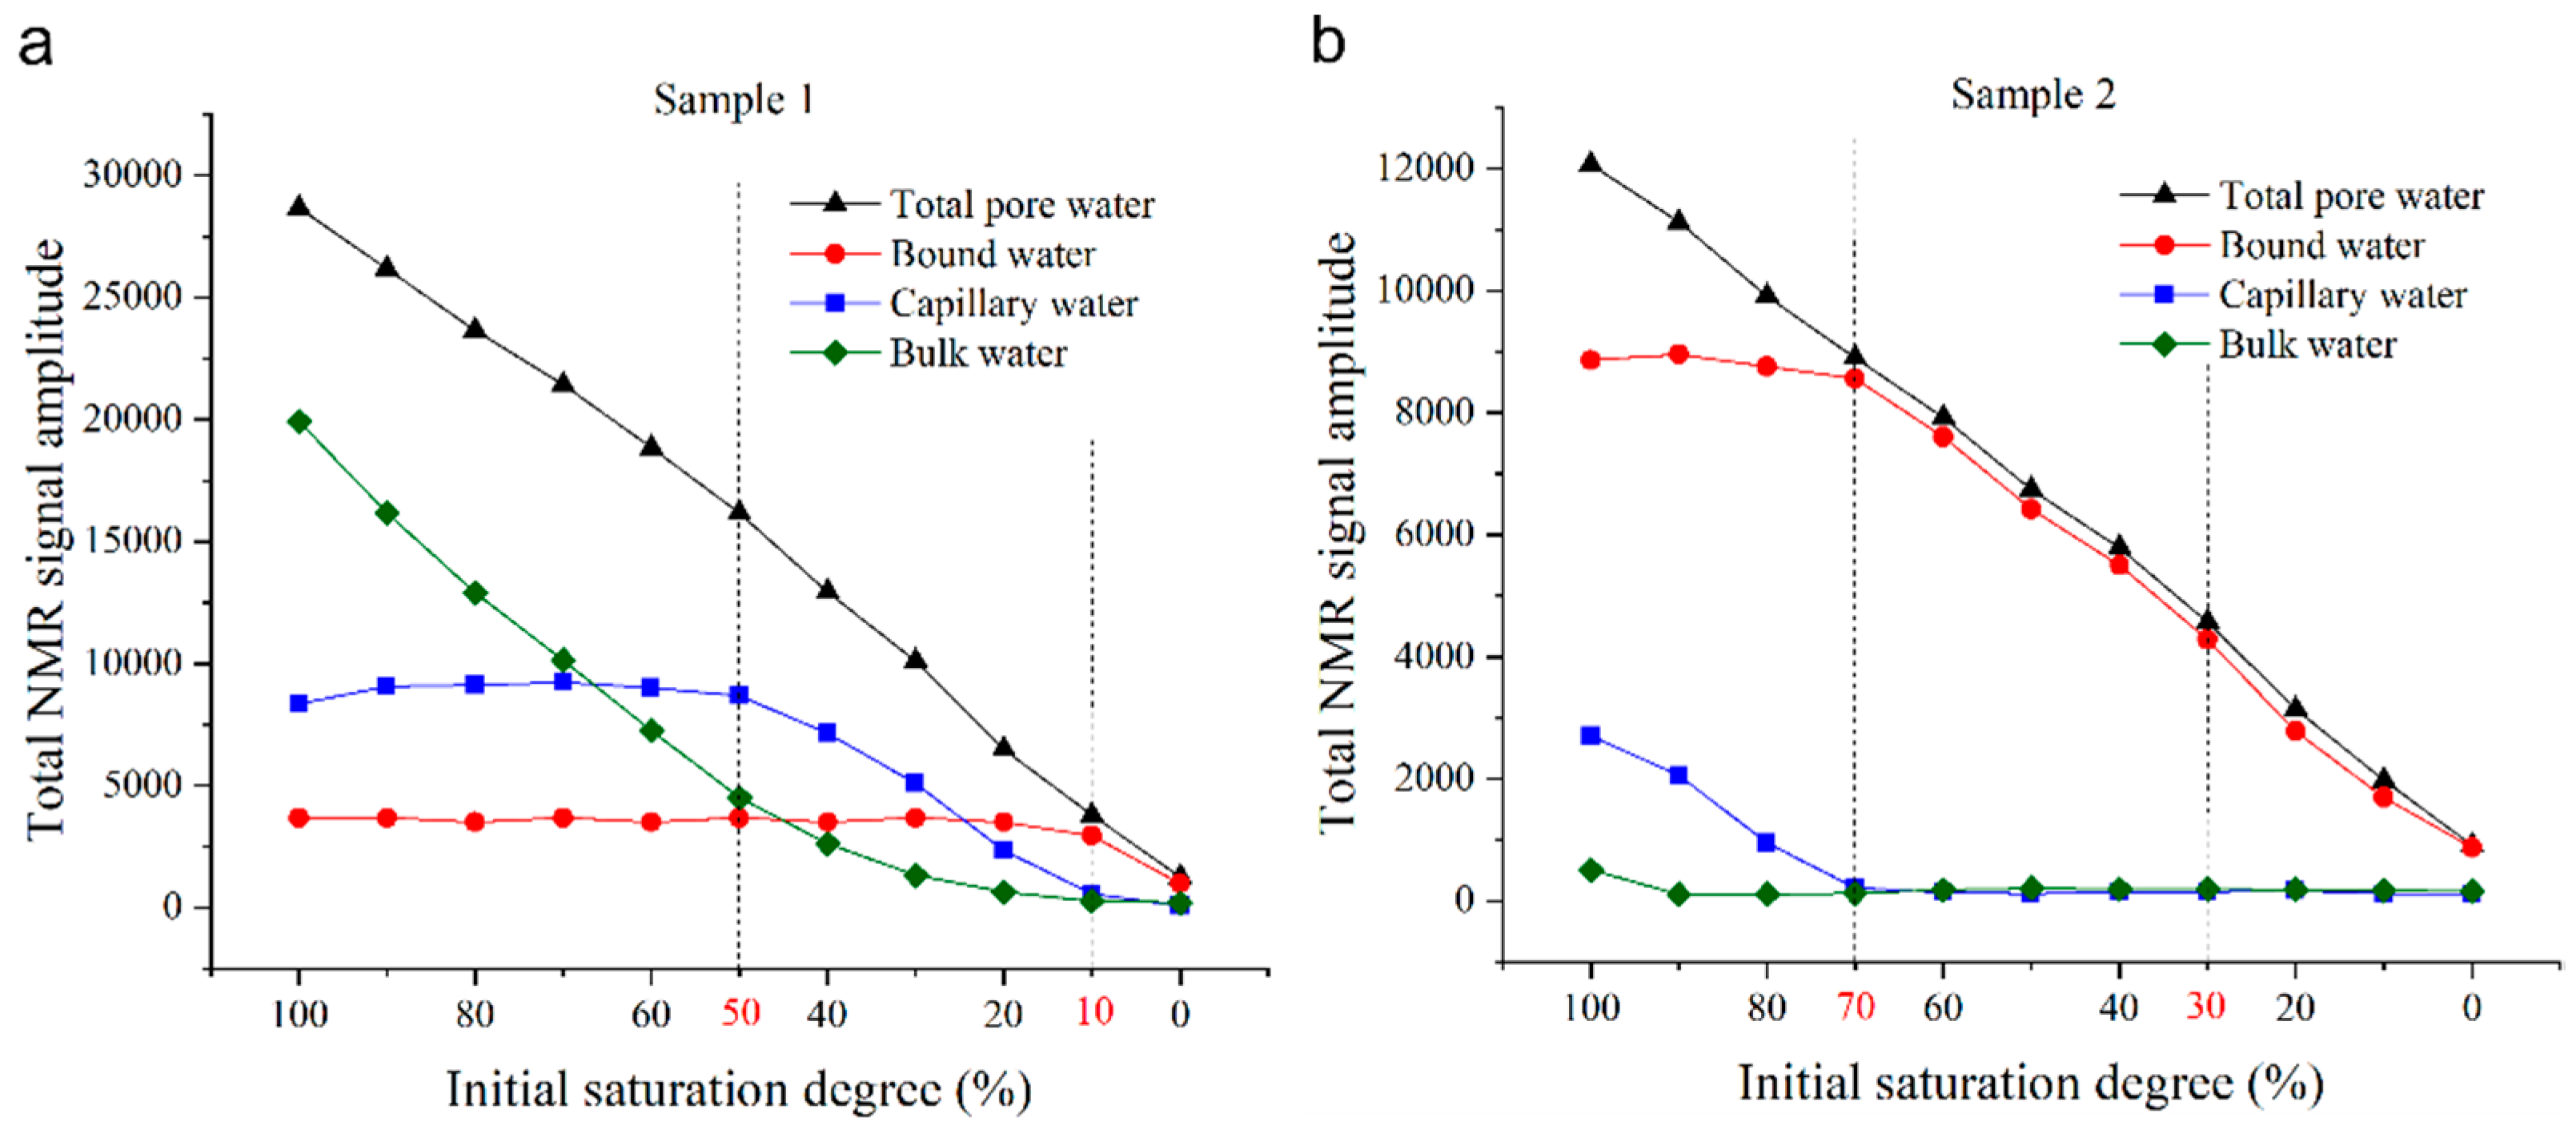
The total area of a rock’s T2 spectrum reflects its water content. Hence, the total NMR signal intensity corresponding to each type of pore water can be obtained by accumulating the amplitudes of parts A, B and C of the NMR signal, which reflect the water content of each type of pore. Figure 5 shows the variation in total NMR signal intensity in parts A, B and C of the T2 spectrum corresponding to pore water in the two rock samples at different saturation levels.
In sample 1 (Figure 5a), at saturations > 50%, the bound water and capillary water contents were basically unchanged, but the bulk water content gradually decreased. As the saturation decreased from 50% to 10%, the bound water content remained the same, while the capillary and bulk water contents decreased. At saturation < 10%, the bound water content decreased but the capillary and bulk water contents remained almost the same. It can be seen from the above results that at saturations > 50%, the decrease in pore water was mainly due to the decrease of bulk water, and at saturations of 50–10%, the decrease in pore water is mainly caused by bulk water and capillary water; while at the saturation < 10%, the change in pore water was because of bound water. In sample 2 (Figure 5b), at saturations > 70%, the bound water content was largely unchanged, the capillary water decreased with saturation, and the bulk water decreased slightly. At saturations < 70%, the bound water decreased linearly but the capillary water and bulk water were largely unchanged. Therefore, at saturations > 70%, the reduction in pore water content was mainly due to the decrease of capillary water and, at saturations < 70%, the change in pore water was mainly caused by bound water.
4. Discussion
4.1. Dehydration Process of Pore Water in Bedded Sandstone
Rocks are heterogeneous bodies composed of various minerals and containing pores and microcracks. Complex pore-space structures are formed by differences in the rock’s geological environment (such as the degree of water saturation), which result in complex bedding structures. In this paper, the pore structure of bedded sandstone was abstracted, and a conceptual bedding structure model was derived (Figure 6). The bedding structure controls the dehydration process. Variation in the anisotropy of bedded rocks was further discussed by analysing the differences in dehydration rate in different bedding directions.
According to the result of supereyes (Figure 1a), it can be seen that the bedding in sample 1 was not obvious and its particle composition was relatively uniform, and the pore connectivity was largely the same in both directions. By analysing the changes in pore water types with saturation in sample 1 (Figure 5a), the dehydration process of rock can be divided into three stages. From 100–50% saturation, the bulk water undergoes vapour diffusion in two directions. As saturation decreases from 50% to 10%, the bulk water continued decreases and the capillary water began to decrease in two directions. From 10% to 0% saturation, the adsorbed water on the surfaces of mineral particles decreases gradually [29] and the sample finally reaches the dry state. It can be seen from the above analysis that the dehydration rates of pore water in the two bedding directions are basically the same; this is, as the saturation decreases, the pore water distributions in both directions remain largely the same.
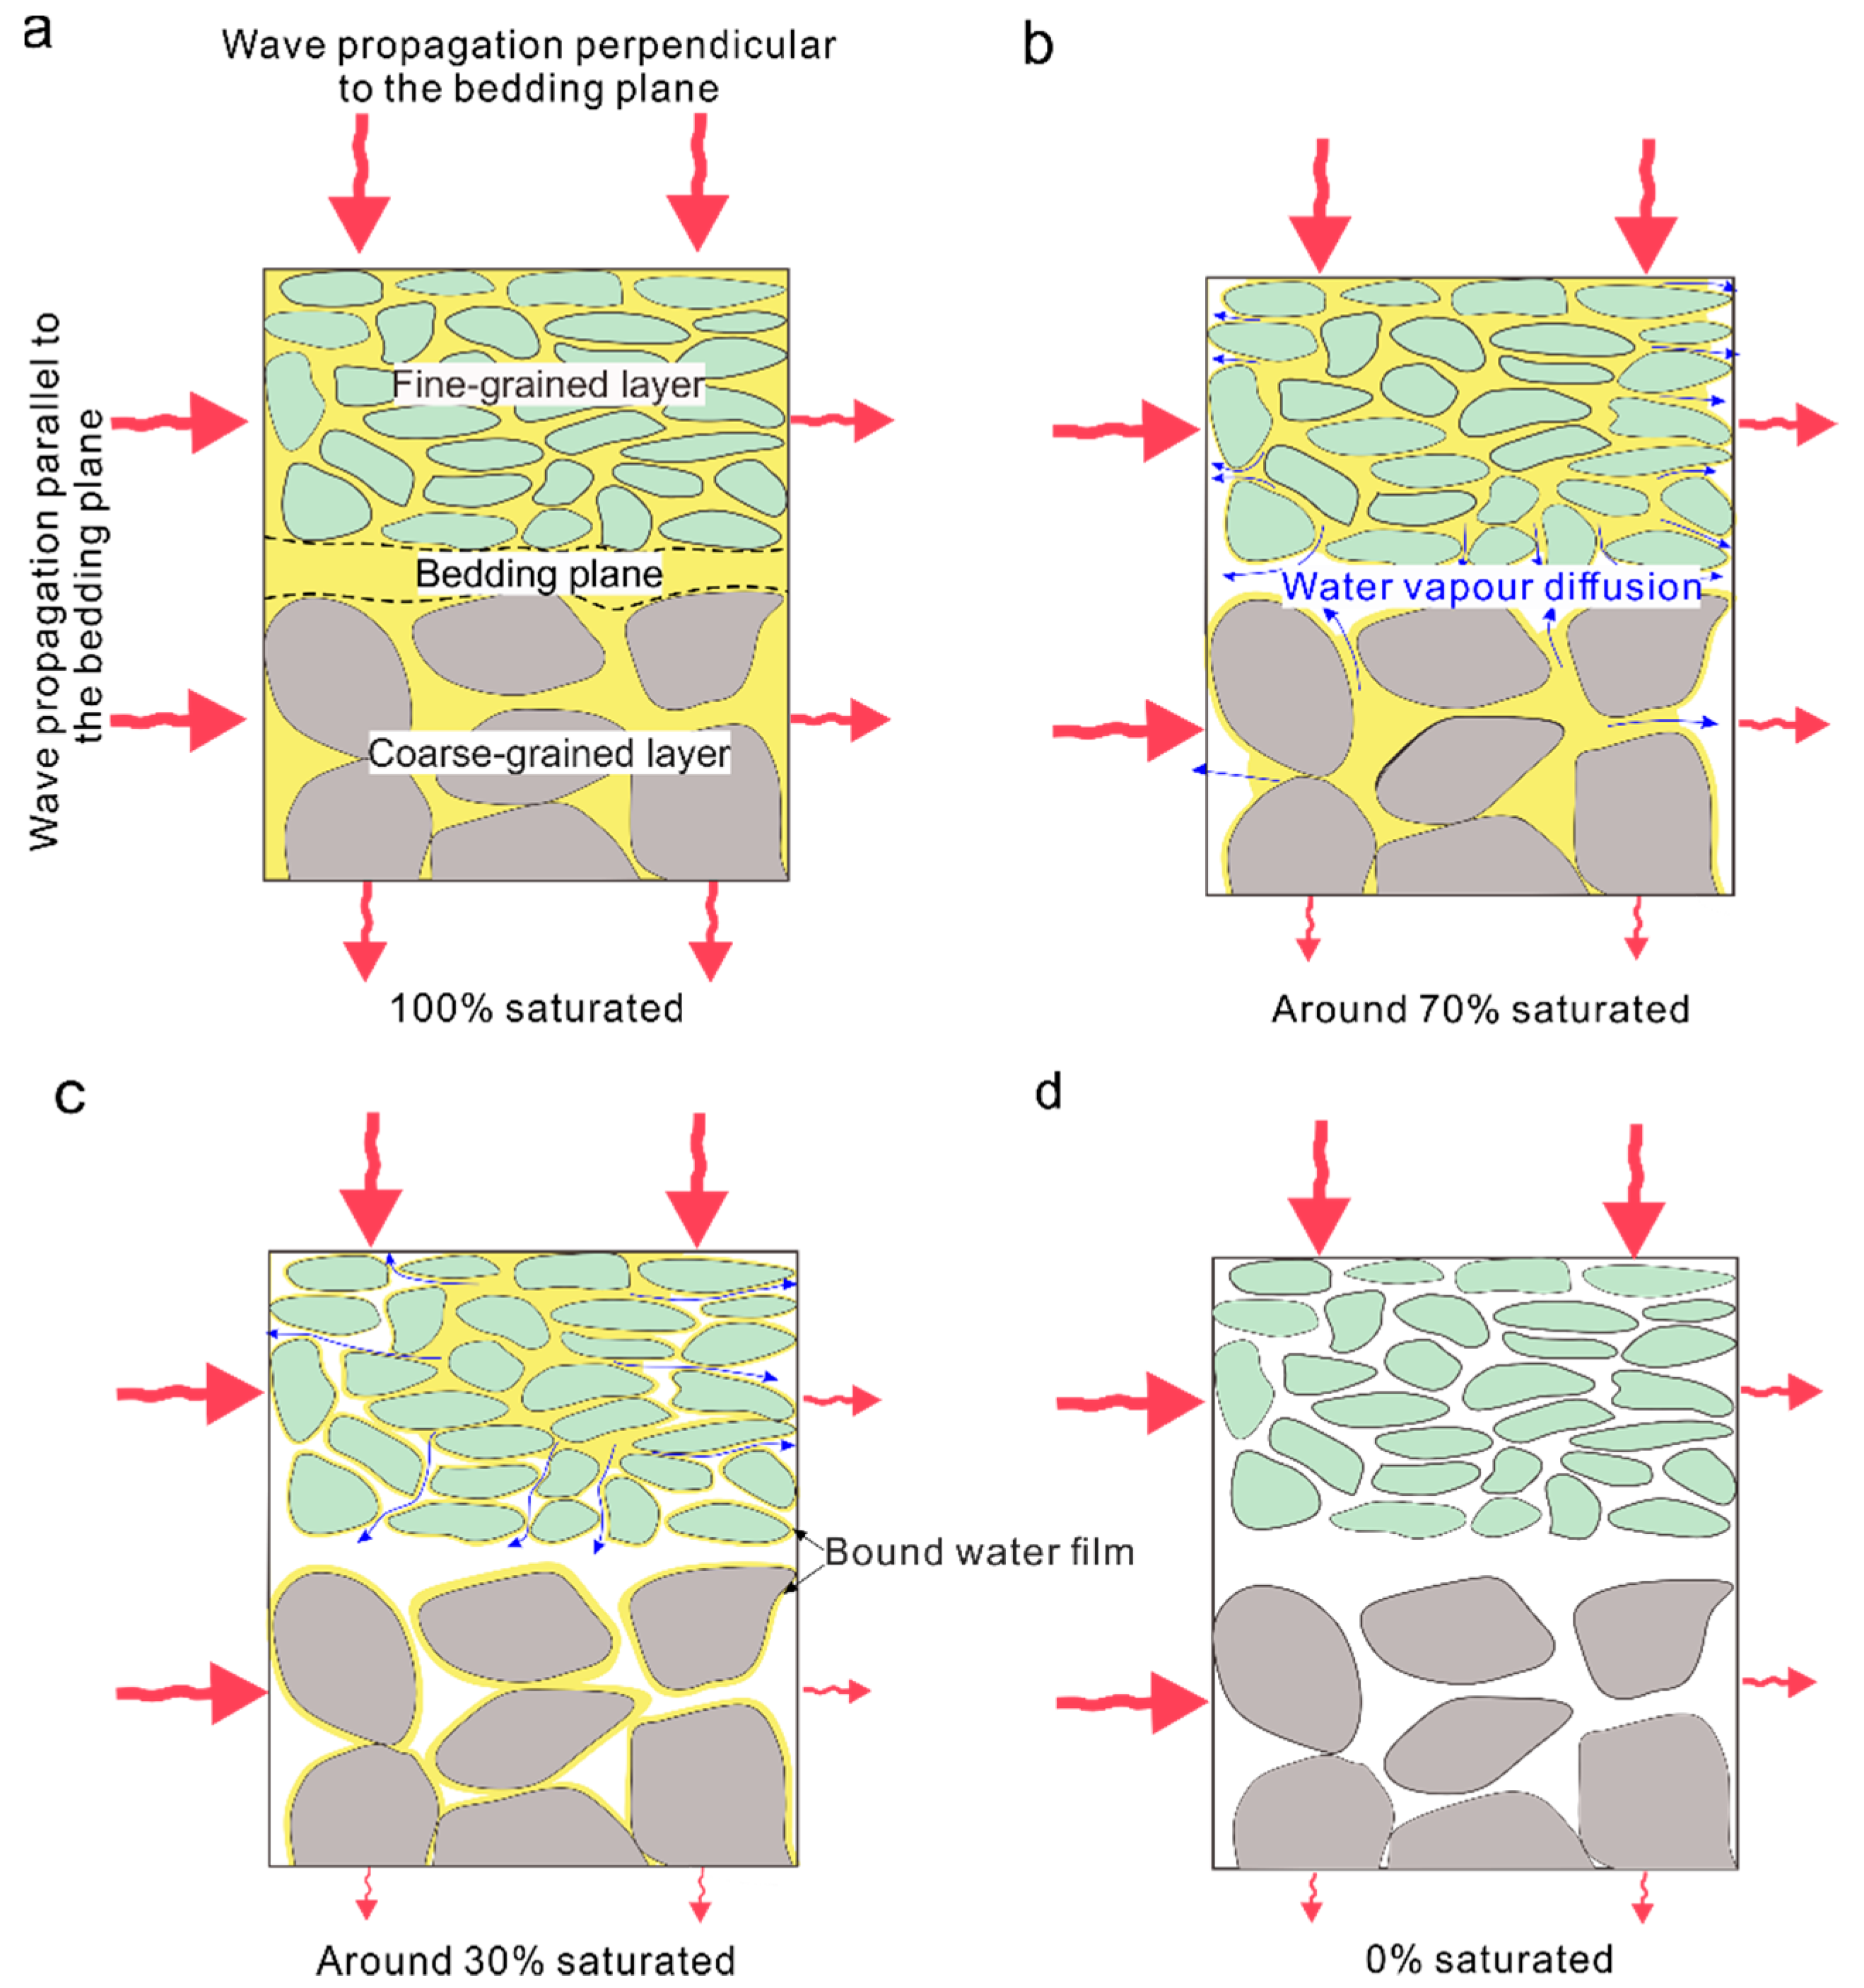
Sample 2 had more obvious bedding than sample 1(Figure 1b). In this kind of rock, the distribution of pores in the bedding plane is relatively concentrated and the pore connectivity is better, while the pores in the grained layer are much fewer and the grain continuity is good, especially in the fine-grain layer (Figure 6a), there are great differences in the connectivity of pores in the two directions. From 100% to 70% saturation, due to the better connectivity of the pores in the bedding plane, a “drainage channel” is formed and there is vapour diffusion of bulk water and capillary water in the bedding plane. Compared with the bedding plane, the pores in the grain layer are much fewer, so there is only a small amount of pore water vapour diffusion (Figure 6b). As the saturation decreases from 70% to 30%, the capillary water and weakly adsorbed water in the grained layer undergo vapour diffusion through the “drainage channel”, and the pore water vapour diffusion in the coarse-grain layer is faster than that in the fine-grain layer [35] (Figure 6c). From 30% to 0% saturation, the strongly absorbed water on the surfaces of mineral particles in the grained layers and bedding plane gradually reduce until the rock is completely dry. It can be seen from the above analysis that pore water is lost more rapidly in the direction parallel to the bedding plane than in the perpendicular direction, indicating that the pore water distributions in the two directions are quite different with decreases in saturation.
4.2. Mechanism of Dehydration Altering Anisotropy in Bedded Rocks
From the above analysis of the dehydration process in bedded sandstone, it can be seen that the bedding structure controls the dehydration process. Therefore, the different dehydration rates of pore water in different directions will inevitably lead to differences in moisture state. This will change the rock’s anisotropy, which can be reflected by non-synchronous changes in wave velocity in different directions. The mechanism of change in anisotropic bedded sandstone was further explained by changes in P-wave velocity in different bedding directions.
Sample 1 had a non-obvious bedding structure. As its saturation decreased from 100% to 50%, the appearance of a water-air interface, a reduction in elastic modulus (the elastic wave velocity is a function of the elastic constant of the rock; a decrease in the elastic parameter means a decrease in the wave velocity [36,37], and a change in propagation medium led to significant decreases in P-wave velocity. As the saturation decreased from 50% to 10%, the liquid propagation medium continued to decrease and the gas propagation medium increased, which led to decreases in P-wave velocity. From 10% saturation to the dry state, the adsorbed water on the mineral particle surfaces gradually decreased, the elastic modulus gradually increased [36,37], and the P-wave velocity increased. The P-wave velocity of sample 1 in the directions parallel and perpendicular to the bedding changed in a similar way to the saturation, and the anisotropy was largely stable at around 1 (Figure 3a), further indicating that the anisotropy of sample 1 remained largely unchanged with changes in saturation.
Sample 2 had an obvious bedding structure. It can be seen from Figure 2b that the P-wave velocities parallel to the bedding direction were significantly higher than those perpendicular to the bedding under both dry and saturated conditions. This difference increased with decreases in saturation. This, combined with the variation in the anisotropy of sample 2 during dehydration (Figure 3b) shows that the P-wave velocity of bedded sandstone is mainly controlled by the compactness of the bedding plane [37]. Many test results have also proven that the moisture content of rock has a great influence on the P-wave velocity perpendicular to the bedding direction, but a small influence on it in the parallel direction [6,38].
The above results and analysis demonstrate that the waves propagate in greatly different paths in the perpendicular and parallel directions in this kind of sandstone. In the parallel direction, the elastic waves propagate in two paths: in the coarse-grained layer and in the fine-grained layer (Figure 6a). In the direction perpendicular to the bedding, ultrasonic waves propagate alternately between the grained layers and the bedding planes (as shown in Figure 6a), both through the bedding plane (which has good pore connectivity) and through the grained layer (which has good continuity between particles, especially in the fine-grained layer). Therefore, there are more refracting interfaces in the perpendicular direction than in the parallel direction, and the difference in pore size between the coarse- and fine-grained layers also has a great influence on wave propagation. So, the wave velocity in the perpendicular direction is significantly lower than that in the parallel direction at full saturation, indicating that this bedded sandstone has an initial anisotropy.
From 100% to about 70% saturation, the P-wave velocity perpendicular to the bedding direction decreased rapidly. This was because the propagation media in the bedding planes changed from liquid to air; meanwhile, the appearance of a water-air interface increased the reflection amplitude of the wave [7,38], which also produced an angle of refraction. The combination of these two mechanisms significantly reduced the wave velocity in the perpendicular direction (Figure 6a). Compared with the bedding plane, only a small amount of pore water underwent vapour diffusion from the grained layer (especially the fine-grained layer), so the decrease in wave velocity in the parallel direction was much less than that in the perpendicular direction (Figure 6b). As the saturation decreased from 70% to 30%, pore water vapour diffusion was continuous in the grained layer. Therefore, the wave velocity in the parallel direction continued to decrease, while that in the perpendicular direction only decreased slightly (Figure 6c). From 30% saturation to dry, the adsorbed water on the surfaces of mineral particles gradually decreased and the elastic modulus of the rock samples gradually increased [36,37], so the P-wave velocities in the parallel and perpendicular directions slightly increased (Figure 6d). It can be seen from the above analysis that, during the dehydration process, the change in wave velocity in the parallel direction in sample 2 was inconsistent with that in the perpendicular direction, indicating that the anisotropy of such bedded sandstone changes greatly with decreases in saturation.
Indicated that the change of water-bearing state will have an impact on its anisotropy. Therefore, the influence of water should be taken into full consideration when evaluating the stability of underground chamber or slope. In the future engineering stability evaluation, ultrasonic test can be carried out first, the anisotropy of the rapid judgment, to lay a foundation for the follow-up work.
5. Conclusions
In this paper, two kinds of sandstone (with and without obvious bedding structures) were subjected to ultrasonic and NMR testing. Variations in pore water type, P-wave velocity and wave velocity anisotropies at different saturation levels were measured and their micro-mechanisms were discussed. The following conclusions can be drawn:
- (1)
- Sandstone with more obvious bedding bears stronger anisotropy. For the sandstone with no obvious bedding structure, the wave velocities in the directions parallel and perpendicular to the bedding plane were close, and both decreased gradually with dehydration. For the sandstone with an obvious bedding structure, the P-wave velocity perpendicular to the bedding plane was much lower than that in the parallel direction and the difference between them increased with dehydration.
- (2)
- In the sandstone with no obvious bedding structure, the anisotropy index fluctuated around 1 with changes in saturation. For the sandstone with the obvious bedding structure, the anisotropy showed a two-stage trend with decreases in saturation. At saturations > 70%, the anisotropy index increased rapidly from about 1.2 to about 2.3; and at saturations < 70%, it increased slightly.
- (3)
- During the dehydration process in the sandstone with no obvious bedding structure, at saturations > 50%, the decrease in pore water content was mainly due to the decreased of bulk water. At saturations of 50–10%, it was mainly caused by bulk water and capillary water. At saturation < 10%, it was mainly because of bound water. For the sandstone with an obvious bedding structure, the decrease in pore water was caused by capillary water at saturations > 70% and by bound water at saturations < 70%.
- (4)
- The bedding structure controls the dehydration process. The different dehydration rates of pore water in different directions inevitably lead to heterogeneity in moisture state that change the anisotropy of the rock, which is reflected by the non-synchronous changes in P-wave velocities in different directions.
Author Contributions
Conceptualization, F.L. and H.J.; methodology, F.L. and H.J.; investigation, F.L. and L.Y.; data curation, L.Y.; writing—original draft preparation, L.Y.; writing—review and editing, H.J. All authors have read and agreed to the published version of the manuscript.
Funding
Grant number 41702334.
Institutional Review Board Statement
Not applicable.
Informed Consent Statement
Not applicable.
Data Availability Statement
Conflicts of Interest
The authors declare that they have no known competing financial interests or personal relationships that could have appeared to influence the work reported in this paper.
References
- Johnston, J.E.; Christensen, N.I. Seismic anisotropy of shales. J. Geophys. Res. Solid Earth 1995, 100, 5991–6003. [Google Scholar] [CrossRef] [Green Version]
- Ademović, N.; Kurtović, A. Influence of planes of anisotropy on physical and mechanical properties of freshwater limestone (Mudstone). Constr. Build. Mater. 2021, 268, 121174. [Google Scholar] [CrossRef]
- Zhang, F.; Xie, S.Y.; Hu, D.W.; Shao, J.F.; Gatmiri, B. Effect of water content and structural anisotropy on mechanical property of claystone. Appl. Clay Sci. 2012, 69, 79–86. [Google Scholar] [CrossRef]
- Vernik, L.; Liu, X. Velocity anisotropy in shales: A petrophysical study. Geophysics 1997, 62, 521–532. [Google Scholar] [CrossRef]
- Lloret-Cabot, M.; Wheeler, S.J.; Pineda, J.A.; Romero, E.; Sheng, D. From saturated to unsaturated conditions and vice versa. Acta Geotech. 2018, 13, 15–37. [Google Scholar] [CrossRef] [Green Version]
- Du, C.; Sun, L.; Qin, B.; Xu, J.; Liu, Y. Shear Behavior and Anisotropy Characteristics of the Fracture Morphology of Sandstone with Different Water Contents. Geofluids 2020, 2020, 4543719. [Google Scholar] [CrossRef]
- Domenico, S.N. Effect of Water Saturation on Seismic Reflectivity of Sand Reservoirs Encased in Shale. Geophysics 1974, 39, 759–769. [Google Scholar] [CrossRef]
- Hamzaban, M.-T.; Buyuksagis, I.S.; Fasaghandis, M.; Touranchezadeh, A. The effect of saturation on the physical and mechanical behavior of some rock samples. Civil Eng. Limits 2021, 3, 23–31. [Google Scholar] [CrossRef]
- Zhou, Z.; Cai, X.; Cao, W.; Li, X.; Xiong, C. Influence of Water Content on Mechanical Properties of Rock in Both Saturation and Drying Processes. Rock Mech. Rock Eng. 2016, 49, 3009–3025. [Google Scholar] [CrossRef]
- Sarout, J.; Esteban, L.; Delle Piane, C.; Maney, B.; Dewhurst, D.N. Elastic anisotropy of Opalinus Clay under variable saturation and triaxial stress. Geophys. J. Int. 2014, 198, 1662–1682. [Google Scholar] [CrossRef] [Green Version]
- Kim, K.Y.; Zhuang, L.; Yang, H.; Kim, H.; Min, K.-B. Strength Anisotropy of Berea Sandstone: Results of X-ray Computed Tomography, Compression Tests, and Discrete Modeling. Rock Mech. Rock Eng. 2016, 49, 1201–1210. [Google Scholar] [CrossRef]
- Li, X.; Lei, X.; Li, Q. Response of Velocity Anisotropy of Shale under Isotropic and Anisotropic Stress Fields. Rock Mech. Rock Eng. 2018, 51, 695–711. [Google Scholar] [CrossRef]
- Wang, P.; Cai, M.; Ren, F. Anisotropy and directionality of tensile behaviours of a jointed rock mass subjected to numerical Brazilian tests. Tunn. Undergr. Space Technol. 2018, 73, 139–153. [Google Scholar] [CrossRef]
- Jin, Z.; Li, W.; Jin, C.; Hambleton, J.; Cusatis, G. Anisotropic elastic, strength, and fracture properties of Marcellus shale. Int. J. Rock Mech. Min. Sci. 2018, 109, 124–137. [Google Scholar] [CrossRef] [Green Version]
- Ramamurthy, T.; Rao, G.V.; Singh, J. Engineering behaviour of phyllites. Eng. Geol. 1993, 33, 209–225. [Google Scholar] [CrossRef]
- Louis, L.; Baud, P.; Wong, T.-F. Microstructural Inhomogeneity and Mechanical Anisotropy Associated with Bedding in Rothbach Sandstone. In Rock Physics and Natural Hazards; Vinciguerra, S., Bernabé, Y., Eds.; Birkhäuser Basel: Basel, Switzerland, 2009; pp. 1063–1087. [Google Scholar]
- Gatelier, N.; Pellet, F.; Loret, B. Mechanical damage of an anisotropic porous rock in cyclic triaxial tests. Int. J. Rock Mech. Min. Sci. 2002, 39, 335–354. [Google Scholar] [CrossRef]
- Ding, Q.-L.; Song, S. Experimental Investigation of the Relationship between the P-Wave Velocity and the Mechanical Properties of Damaged Sandstone. Adv. Mater. Sci. Eng. 2016, 2016, 7654234. [Google Scholar] [CrossRef] [Green Version]
- Chawre, B. Correlations between ultrasonic pulse wave velocities and rock properties of quartz-mica schist. J. Rock Mech. Geotech. Eng. 2018, 10, 594–602. [Google Scholar] [CrossRef]
- Best, A.I.; McCann, C.; Sothcott, J. The relationships between the velocities, attenuations and petrophysical properties of reservoir sedimentary rocks1. Geophys. Prospect. 1994, 42, 151–178. [Google Scholar] [CrossRef]
- Ding, C.; Hu, D.; Zhou, H.; Lu, J.; Lv, T. Investigations of P-Wave velocity, mechanical behavior and thermal properties of anisotropic slate. Int. J. Rock Mech. Min. Sci. 2020, 127, 104176. [Google Scholar] [CrossRef]
- Dai, F.; Xia, K. Loading Rate Dependence of Tensile Strength Anisotropy of Barre Granite. Pure Appl. Geophys. 2010, 167, 1419–1432. [Google Scholar] [CrossRef]
- Dai, F.; Xia, K.; Zuo, J.P.; Zhang, R.; Xu, N.W. Static and Dynamic Flexural Strength Anisotropy of Barre Granite. Rock Mech. Rock Eng. 2013, 46, 1589–1602. [Google Scholar] [CrossRef]
- Shi, X.; Jing, H.; Yin, Q.; Zhao, Z.; Han, G.; Gao, Y. Investigation on physical and mechanical properties of bedded sandstone after high-temperature exposure. Bull. Eng. Geol. Environ. 2020, 79, 2591–2606. [Google Scholar] [CrossRef]
- Jia, H.; Ding, S.; Zi, F.; Li, G.; Yao, Y. Development of Anisotropy in Sandstone Subjected to Repeated Frost Action. Rock Mech. Rock Eng. 2021, 54, 1863–1874. [Google Scholar] [CrossRef]
- Zamora, M. Experimental study of acoustic anisotropy and birefringence in dry and saturated Fontainebleau sandstone. Geophysics 1990, 55, 1455–1465. [Google Scholar] [CrossRef] [Green Version]
- Ding, P.; Di, B.; Wang, D.; Wei, J.; Zeng, L. P- and S-wave velocity and anisotropy in saturated rocks with aligned cracks. Wave Motion 2018, 81, 1–14. [Google Scholar] [CrossRef]
- Do, D.-P.; Tran, N.-H.; Dang, H.-L.; Hoxha, D. Closed-form solution of stress state and stability analysis of wellbore in anisotropic permeable rocks. Int. J. Rock Mech. Min. Sci. 2019, 113, 11–23. [Google Scholar] [CrossRef]
- Jia, H.; Ding, S.; Wang, Y.; Zi, F.; Sun, Q.; Yang, G. An NMR-based investigation of pore water freezing process in sandstone. Cold Reg. Sci. Technol. 2019, 168, 102893. [Google Scholar] [CrossRef]
- Jia, H.; Ding, S.; Zi, F.; Dong, Y.; Shen, Y. Evolution in sandstone pore structures with freeze-thaw cycling and interpretation of damage mechanisms in saturated porous rocks. Catena 2020, 195, 104915. [Google Scholar] [CrossRef]
- Jia, H.; Zi, F.; Yang, G.; Li, G.; Shen, Y.; Sun, Q.; Yang, P. Influence of Pore Water (Ice) Content on the Strength and Deformability of Frozen Argillaceous Siltstone. Rock Mech. Rock Eng. 2020, 53, 967–974. [Google Scholar] [CrossRef]
- Godefroy, S.; Korb, J.P.; Fleury, M.; Bryant, R.G. Surface nuclear magnetic relaxation and dynamics of water and oil in macroporous media. Phys. Rev. E 2001, 64, 021605. [Google Scholar] [CrossRef] [PubMed]
- Matteson, A.; Tomanic, J.; Herron, M.; Allen, D.; Kenyon, W. NMR Relaxation of Clay-Brine Mixtures. SPE Reserv. Eval. Eng. 2000, 3, 408–413. [Google Scholar] [CrossRef]
- Martinez, G.A.; Davis, L.A. Petrophysical Measurements on Shales Using NMR. In SPE/AAPG Western Regional Meeting; OnePetro: Richardson, TX, USA, 2000. [Google Scholar]
- Li, X.; Zhang, L.M. Characterization of dual-structure pore-size distribution of soil. Can. Geotech. J. 2009, 46, 129–141. [Google Scholar] [CrossRef] [Green Version]
- Inoue, M.; Ohomi, M. Relation between Uniaxial Compressive Strength and Elastic Wave Velocity of Soft Rock. In Proceedings of the ISRM International Symposium, Tokyo, Japan, 9–13 September 1981. [Google Scholar]
- Deng, H.F.; Yuan, X.F.; Li, J.L.; He, M.; Luo, S.; Zhu, M. Experimental Research on Influence of Saturation Degree on Sandstone Longitudinal Wave Velocity and Strength. Chin. J. Rock Mech. Eng. 2013, 32, 1626–1631. [Google Scholar]
- Amalokwu, K.; Chapman, M.; Best, A.I.; Minshull, T.A.; Li, X.-Y. Water saturation effects on P-wave anisotropy in synthetic sandstone with aligned fractures. Geophys. J. Int. 2015, 202, 1088–1095. [Google Scholar] [CrossRef] [Green Version]
Figure 1.
(a,b) Photographs of test samples, (c) Schematic diagram of ultrasonic testing direction and (d) pore size distributions based on T2 spectra.
Figure 1.
(a,b) Photographs of test samples, (c) Schematic diagram of ultrasonic testing direction and (d) pore size distributions based on T2 spectra.

Figure 2.
Variations in P-wave velocity with saturation in three directions relative to the bedding plane in samples (a) 1 and (b) 2.
Figure 2.
Variations in P-wave velocity with saturation in three directions relative to the bedding plane in samples (a) 1 and (b) 2.

Figure 3.
Variation in anisotropy with saturation in samples (a) 1 and (b) 2.

Figure 4.
Variation in T2 spectra with sandstone saturation in samples (a) 1 and (b) 2.

Figure 5.
Variation in the contents of different types of pore water with rock saturation degree in samples (a) 1 and (b) 2.
Figure 5.
Variation in the contents of different types of pore water with rock saturation degree in samples (a) 1 and (b) 2.

Figure 6.
Schematic diagram of ultrasonic propagation mechanism of rocks with a distinct bedding plane during dehydration. (a) Schematic diagram of ultrasonic propagation at 100% saturation, (b) Schematic diagram of ultrasonic propagation at around 70% saturation, (c) Schematic diagram of ultrasonic propagation at around 30% saturation and (d) schematic diagram of ultrasonic propagation at 0% saturation (the red arrows indicate the ultrasonic wave, and of their different sizes indicate the magnitude of the P-wave velocity; the blue arrows show the direction of vapour diffusion of pore water.)

Publisher’s Note: MDPI stays neutral with regard to jurisdictional claims in published maps and institutional affiliations. |
© 2021 by the authors. Licensee MDPI, Basel, Switzerland. This article is an open access article distributed under the terms and conditions of the Creative Commons Attribution (CC BY) license (https://creativecommons.org/licenses/by/4.0/).
Share and Cite
MDPI and ACS Style
Liu, F.; Yang, L.; Jia, H. Variation in Anisotropy with Dehydration in Layered Sandstone. Water 2021, 13, 2224. https://doi.org/10.3390/w13162224
AMA Style
Liu F, Yang L, Jia H. Variation in Anisotropy with Dehydration in Layered Sandstone. Water. 2021; 13(16):2224. https://doi.org/10.3390/w13162224
Chicago/Turabian StyleLiu, Fujun, Liu Yang, and Hailiang Jia. 2021. "Variation in Anisotropy with Dehydration in Layered Sandstone" Water 13, no. 16: 2224. https://doi.org/10.3390/w13162224
Note that from the first issue of 2016, this journal uses article numbers instead of page numbers. See further details here.