
Spatiotemporal Analysis of Meteorological and Hydrological Droughts and Their Propagations


1
Land Science Research Center, Nanjing University of Information Science & Technology, Nanjing 210044, China
2
Center of Excellence in Water Resources, University of Engineering and Technology, Lahore 54890, Pakistan
3
Department of Civil and Architectural Engineering, University of Wyoming, Laramie, WY 82071, USA
*
Author to whom correspondence should be addressed.
Water 2021, 13(16), 2237; https://doi.org/10.3390/w13162237
Submission received: 10 July 2021
/
Revised: 12 August 2021
/
Accepted: 15 August 2021
/
Published: 17 August 2021
(This article belongs to the Special Issue Management of Hydro-Meteorological Hazards)
Abstract
:The quantitative description of relationships and propagation between different forms of drought at multiple spatiotemporal scales in various geographical locations is informative for early drought warning systems. This study intends to evaluate the historical hydrometeorological drought from 1984–2015 in the Soan River Basin, which is a critical water source for the Pothwar region of Pakistan. The reconnaissance drought index (RDI) and standardized runoff index (SRI) are used to characterize meteorological and hydrological droughts, respectively. The spatiotemporal variations of the RDI and SRI demonstrated that 2000 and 2010 were extremely dry and wet years, respectively. The results further reveal that the frequency of hydrometeorological drought events was higher in a shorter time scale (3 and 6 months), while durations featured longer timescales (9 and 12 months). The RDI and SRI time series showed a significant decreasing trend in terms of the Mann–Kendal and Sen slope estimator (SSE) results. Cross-correlation analysis for RDI and SRI with a time lag acknowledged the existence of a sequence between the RDI and SRI and a positive relationship between the two indices. The findings of this study could be helpful for better understanding drought variability and water resource management.
1. Introduction
Droughts are characterized by deficits of water supplies over an extended period, including surface, ground, or atmospheric water [1]. Irrespective of the climatic situations, droughts can occur worldwide, including in humid environments [2]. Recent droughts have resulted in serious economic losses due to crop damage, infrastructure destruction, and population displacement and have led to jurisdictional conflicts over water rights [3].
Drought events are projected to occur in the future with increasing frequency due to climate change [4], so it is imperative to understand the drought phenomenon. Droughts can be classified into different categories (e.g., meteorological, agricultural, hydrological, and socioeconomic) depending on the consequences leading to water shortages [5]. In general, droughts persist in regions where climatic conditions (e.g., precipitation) are significantly below normal conditions over a period of time [6]. At early stages, droughts are usually referred to as meteorological droughts. A meteorological drought may start quickly as it mainly depends on the deficiency of precipitation, and if precipitation shortfall is propagated throughout specific regions, then a meteorological drought can evolve into a hydrological drought and then into an agricultural drought. The transition of different drought types is defined as drought propagation [7].
Drought index methods provide one of the most practical ways to identify droughts, in which drought indices are derived from a variety of simple parameters to more complex functions. The Palmer drought severity index [8] and the surface water supply index [9] require a diverse range of data and thorough computational effort. On the other hand, the reconnaissance drought index (RDI) and standardized runoff index (SRI) are relatively simple and effective indices that require few input parameters and can be easily calculated [10]. The RDI introduced by Tsakiris et al. [11] has been extensively used to characterize and monitor meteorological droughts [12]. It can be used to measure the severity and occurrence of droughts by using precipitation and evapotranspiration data [13]. The SRI developed by Shukla and Wood [14] is based on the standardized precipitation index and is usually applied to characterize hydrological droughts.
A plethora of research has been found in the literature about the usage of either the RDI or SRI to assess meteorological and hydrological droughts in different regions of the world. For instance, meteorological drought studies were carried out using the RDI method in the UK [13], Ethiopia [15], China [16], Malaysia [17], Turkey [18], and Vietnam [19]; however, few studies have explained the links between meteorological and hydrological droughts due to the inherent complexity [20]. Previous studies have mainly focused on the characteristics and variations within these characteristics in the context of drought propagation; however, further exploration of what meteorological drought intensity is needed to generate a hydrological drought in a different region is needed, as drought events are regional in nature. Moreover, the lack of understanding regarding hydrological drought response to different meteorological drought conditions in different regions presents an unsolved question for drought risk management. To address these questions, it is vital to perform a comprehensive study of droughts that encompasses large geographic areas over long periods [21]. Using the information on regional drought characteristics, water resource management strategies can be efficiently implemented with accurate water-based information [22].
Considering the erratic, scant, and unstable climate and current drought situation in Pakistan [23], drought propagation information is essential at the regional and national scales as it could provide the appropriate and consistent information necessary for efficient water management and the implementation of an early drought warning system. Drought propagation information can assist in reducing economic damages with an informed decision-making ability. There is strong evidence in the literature that the geographical variability of drought occurrence has increased over the past few decades. Historical detection of these variations is highly important for agriculture-based countries like Pakistan. In this context, several studies have been conducted in the region [24,25,26,27,28]. Ahmad et al. [29] and Ahmed et al. [30] reported a decreasing tendency in annual drought events over the northern, northeastern, and northwestern regions of Pakistan; however, in another study, Reggiani et al. [31] reported an increasing tendency of these events for different subbasins of the upper Indus basin. The Soan Basin is an important tributary of the Indus Basin and is highly significant for its contribution to agricultural production; however, no comprehensive study has been reported regarding the spatiotemporal trends of hydrometeorological droughts. We intend to fill this gap by providing a detailed spatiotemporal analysis of hydrometeorological drought variations in the Soan River Basin. The Soan River is one of the major tributaries of the Indus River Basin in Pakistan. It originates from the Murree Mountains and flows into the Indus River through the Dhoke Pathan Hydrological Station. The present study focuses on characterizing meteorological and hydrological droughts based on climate and hydrological data recorded in the vicinities of the Soan River Basin. The main objectives of this study include: (1) analyzing meteorological and hydrological drought evolution by using the RDI and SRI methods; (2) determining long-term trends in drought indices at different time scales; and (3) investigating the relationships between meteorological and hydrological droughts.
2. Materials and Methods
2.1. Study Area
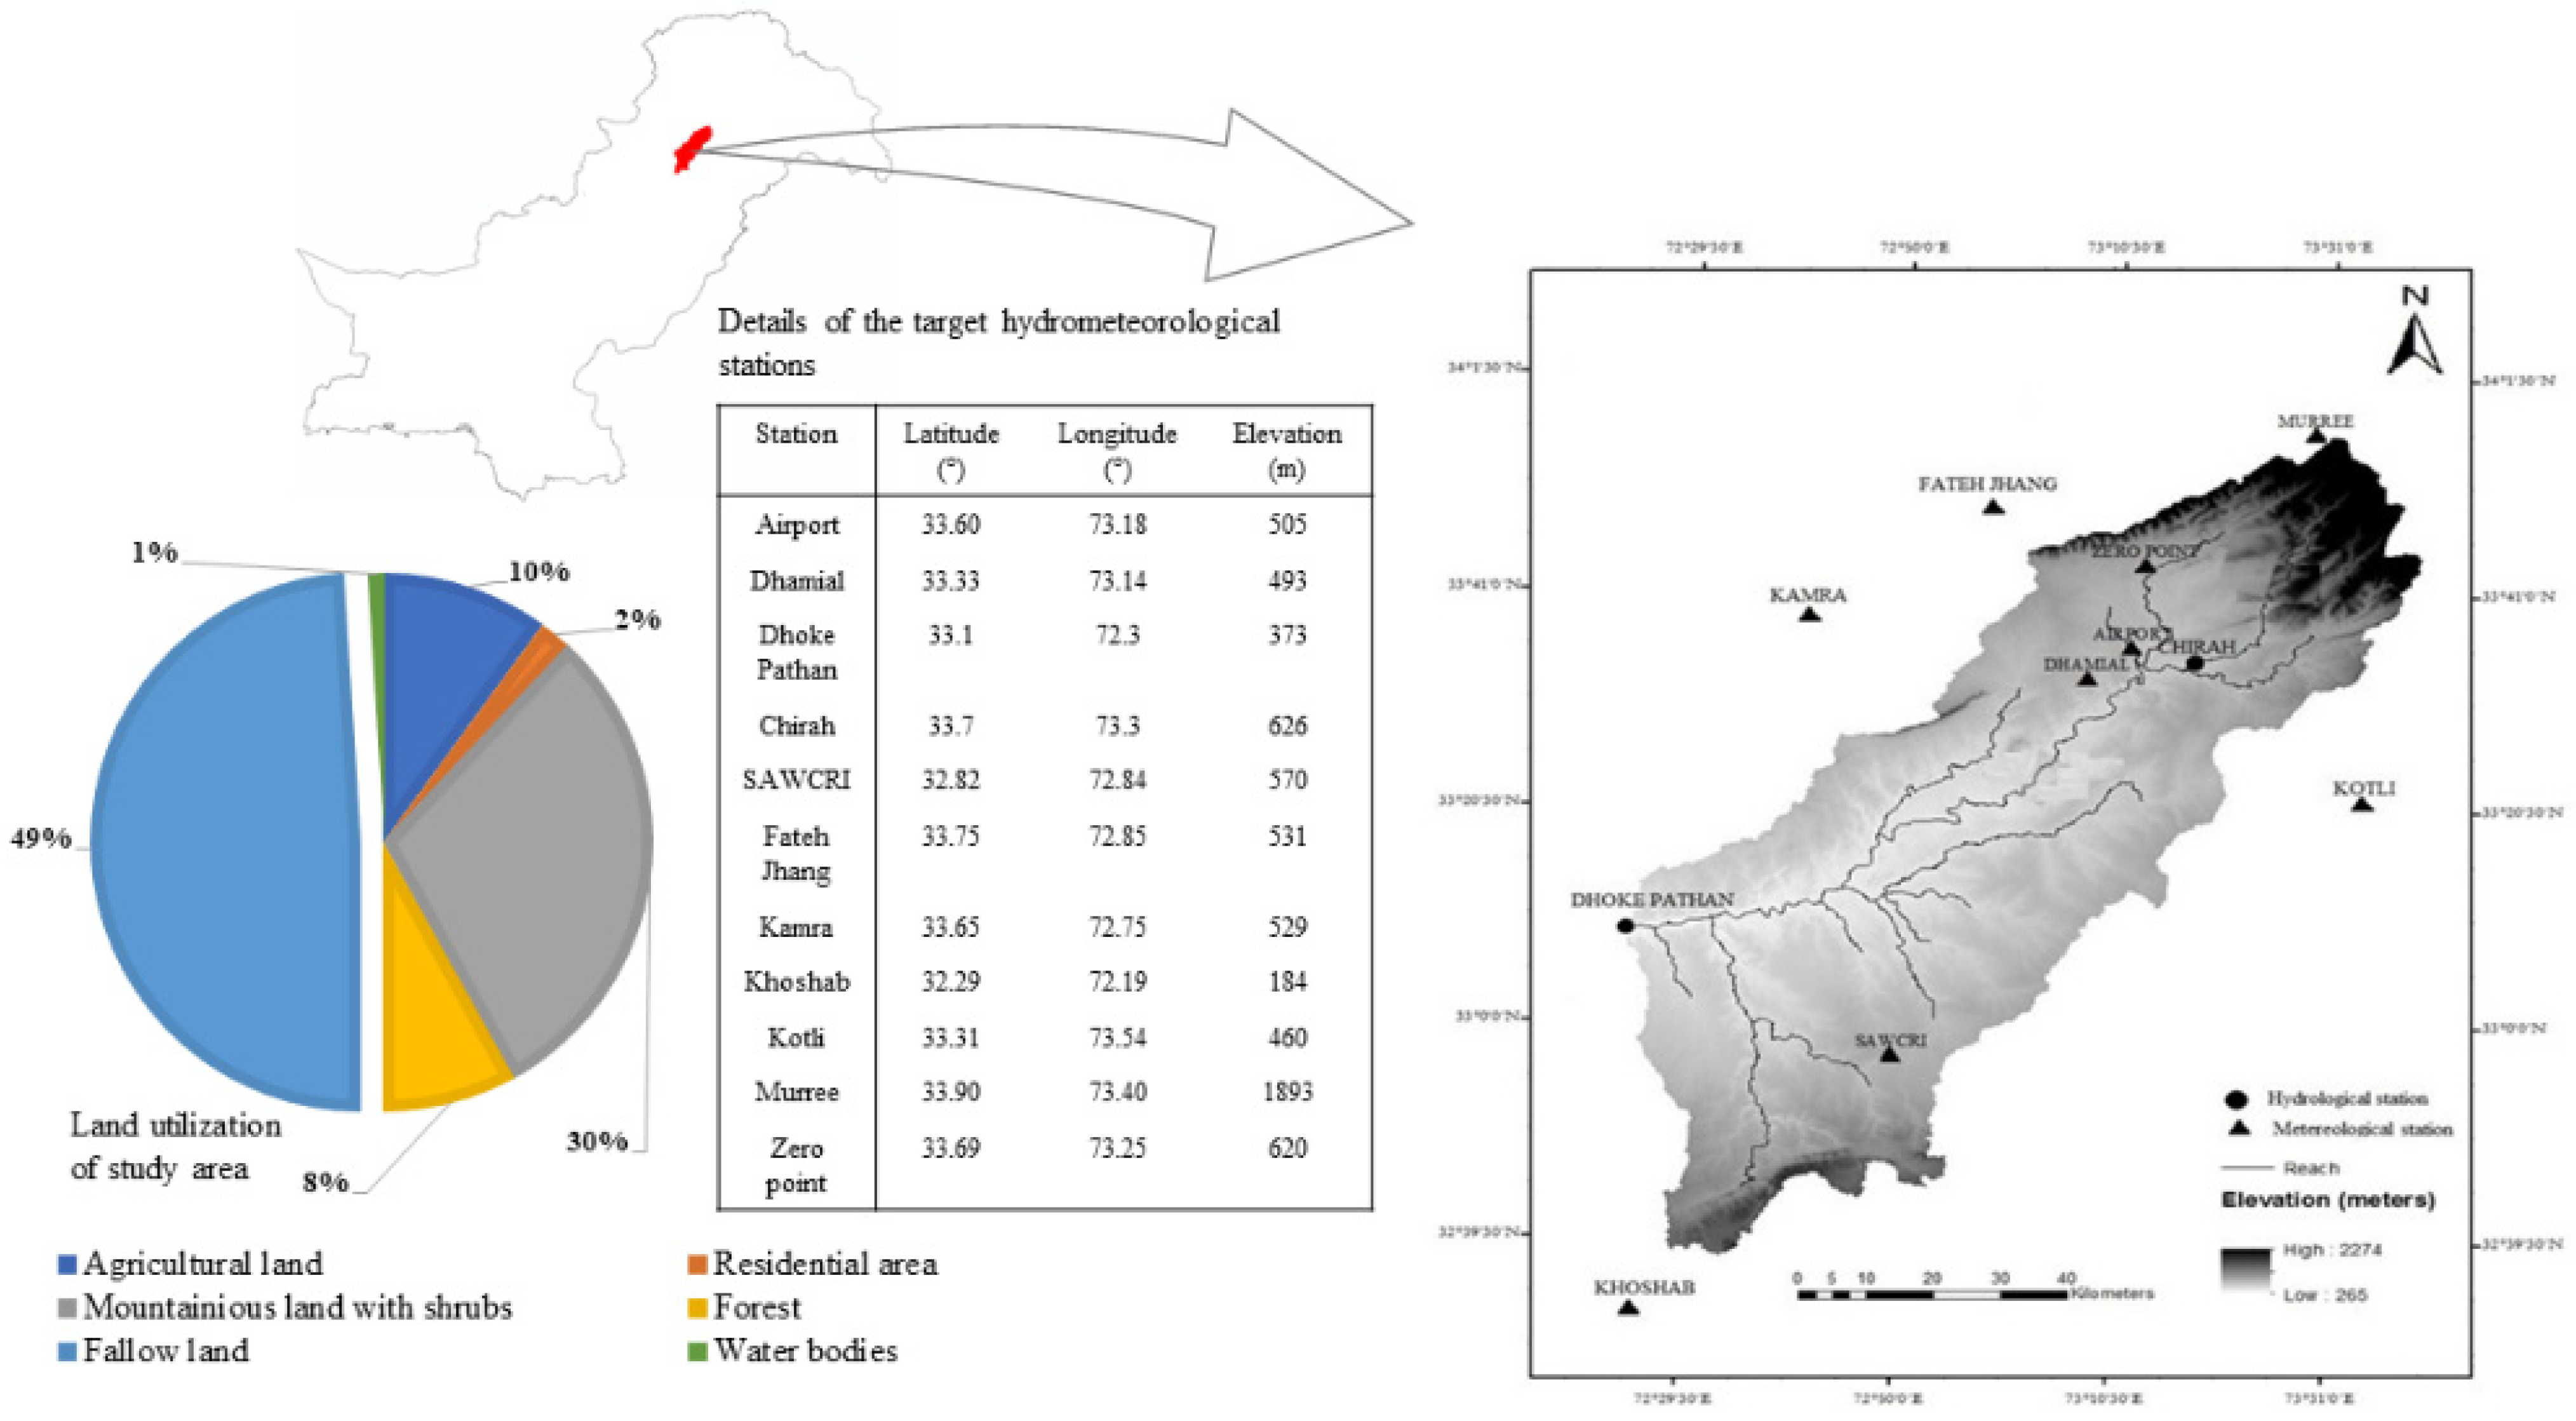
The Soan River is a seasonal river of Punjab, Pakistan, in the Pothwar region, which starts from Murree Mountains, passes through the capital city of Islamabad, and then finally joins the Indus River at Kalabagh in Mianwali District, featuring an elevation range from 265 to 2274 m. There are two hydrological gauge stations (Chirah and Dhok Pathan) in the watershed area of the Soan River [32]. Since the study area is in a tropical monsoon climate, persistent floods and droughts are major natural hazards. Most areas are used for rainfed crops, which are predominantly located in drought-prone areas. As is the case of water-use sectors, droughts have adverse impacts on water supply, agriculture, and the environment [33]. As such, the use of scientific insights can lead to better understanding and the ability to predict a drought as the data available in the watershed meet the requirements of an index approach for drought analysis. Thirty-two years (1984–2015) of meteorological (precipitations and evapotranspiration) and hydrological (streamflow) data were collected from Pakistan Metrological Department (PMD) and Water and Power Development Authority (WAPDA), respectively, at all selected stations. Geographical location of the study area and details of target hydrometeorological stations are presented in Figure 1. The approximate length of the Soan River is 274 km, and its geographic location is 32.6–33.9° N and 72.4–73.5° E with a watershed area of about 6475 km2. The average annual rainfall of the study area ranges from 492–1710 mm, with average monthly highest and lowest temperatures between 35–41 °C, and 1–25 °C, respectively. The monsoon season, starting in July and ending in September/October, is the main rainy season and is responsible for 70–75% of annual rainfall [34].
2.2. Drought Indices
Hydrometeorological droughts in the Soan River Basin were studied using two different drought indices. The reconnaissance drought index (RDI) and standardized runoff index (SRI) were used to investigate meteorological and hydrological drought behaviors, respectively. The RDI [11] is a common indicator for monitoring and quantifying the severity of meteorological drought events caused by the aggregated deficits between precipitation and the evaporative demand of the atmosphere [35]. This index was selected due to its simplicity and robustness, and it can be estimated at different time scales, such as with 1, 3, 6, and 12 months. The RDI can be computed in three different forms, i.e., the alpha RDI (Equation (1)), normalized RDI (Equation (2)), and standard RDI (Equation (3)) [36], whereas the standard RDI and alpha RDI are used for the evaluation of drought severity and aridity classification, respectively. The RDI computation for any location begins with an aggregated form (i.e., alpha RDI) using a monthly time step and may be calculated for each month of the hydrological year or a complete year. Moreover, the RDI drought index is particularly useful in semiarid and arid regions facing climate instability [11]. The estimation of meteorological droughts was carried out using the RDI. In this study, we used four time scales of 3, 6, 9, and 12 months. As the hydrological year starts from October and ends in September, K-3 stands for the aggregation of the last 3 months from October, K-6 stands for the last 6 months from October, and similarly K-9 and K-12 stand for aggregation of last 9 months and 12 months, respectively. The estimation of different forms of RDI was explained in Tsakiris et al. [11]. The expression of the standard RDI is given as follows:
where is the reconnaissance drought index of the j-th hydrological month of the i-th year and is the natural log of the alpha RDI, while and are the mean and standard deviation natural log of precipitation for the k-th time scale.
The SRI was developed by Shukla and Wood [14] and has been commonly used for characterizing hydrological drought events. The process of SRI computation also involves distribution fitting to the streamflow data and the estimation of a probability density function (PDF) and cumulative distribution function (CDF). These functions are then converted into standardized distributions with zero means and unit standard deviations, which provides the value of the SRI. The positive value of the SRI indicates the wet condition, while the negative value represents the drought conditions. The SRI can also be estimated at different time scales, e.g., with 1, 3, 6, and 12 month durations.
The RDI and SRI are based on monthly time series of precipitation and streamflow data. The cumulative sums of precipitation and streamflow for 3, 6, 9, and 12-month time scales were used to calculate RDI-3, SRI-3, RDI-6, SRI-6, RDI-9, SRI-9, RDI-12, and SRI-12, respectively. For example, the cumulative sum for October while calculating RDI-3 and SRI-3 was obtained by adding the previous two months (i.e., August and September) of data to the October data. Similarly, for November, September, and October, data were also added. For RDI-6 and SRI-6, the cumulative sum was obtained by adding six months from May to October. Moreover, the time series were fitted to a gamma probability distribution and the cumulative probability distribution of the series data was transformed into the normal distribution [37].
The RDI values from each meteorological station (9 in total) were computed over different time scales and then spatially averaged using the inverse distance weighted method [38]. These average RDI values were used to determine the meteorological dry and wet periods of the study area. The SRI was obtained based on the monthly streamflow data recorded at the two gauging stations (local names Chirrah and Dhok Pathan). Since the RDI and SRI were calculated similarly, the same criteria could be used to categorize the drought classification for the RDI and SRI. The drought thresholds defined in this study were the following: extreme wet (1.50 ≤ index), moderate wet (1 ≤ index ≤ 1.49), slight wet (0 ≤ index ≤ 0.99), weak drought (−1.0 ≤ index < 0), moderate drought (−1.49 ≤ index < −1.0), severe drought (−1.99 ≤ index < −1.50), and extreme drought (index ≤ −2.0). These two indices were calculated and discussed in conjunction to establish the links and transitions between meteorological and hydrological droughts.
2.3. Trend Analysis
For trend analysis of the RDI and SRI values at different time scales, the commonly used statistical approaches, i.e., Mann–Kendall testing [39] and Sen slope estimation [40], were employed. The Mann–Kendall (M–K) test is a non-parametric statistical technique to study the significant variations of time series data. The M–K test statistic (S) and standardized statistics (Zmk) were computed as follows:
where n is the sample size (number of the data values), and are the data values in corresponding time series p and q, respectively, is the sign functions, and is the variance of S. Given confidence level α, the sequential data would be supposed to experience a statistically significant trend if , where is the corresponding value of when following the standard normal distribution.
Besides the M–K test, Sen’s slope estimator method, developed by Sen [40], is also a non-parametric method to discover a trend in time series data. This method estimates the slope of a regression line that fits time series data based on a least squares estimate. The slope estimates of all data pairs were obtained from the following equation:
where is a slope estimate of the time series data and is the number of all data pairs for which p is greater than q.
A positive value of the SSE indicates an increasing trend, whereas a negative value represents a decreasing trend of the time series data.
Furthermore, cross-correlations between the RDI and SRI values with varying lag times between the two series were calculated to evaluate the relationships between the meteorological and hydrological droughts. These cross-correlations were identified using the Pearson correlation coefficient () [41]. The estimate of this Pearson correlation coefficient was obtained using the following equation:
where is the Pearson correlation coefficient, and are RDI and SRI values at the time i, respectively, and is the number of paired values of X and Y. As discussed previously, hydrological droughts usually develop from meteorological droughts. To analyze the delay in drought propagation, the monthly SRI values at a given time scale were lagged behind the RDI values in monthly increments from zero lag up to a lag of 12 months. Their cross-correlations (r-values) were then computed using Equation (6). Cross-correlation analysis was performed using the R package “astsa”. Additionally, Excel 2019, ArcMap 10.3.1, MATLAB R2016b, and Adobe Illustrator CC 2018 were used for spreadsheets/data arrangement, multivariate interpolation, statistical analysis, and figure presentations, respectively.
3. Results and Discussions
3.1. Spatiotemporal Analysis of Hydrometeorological Droughts
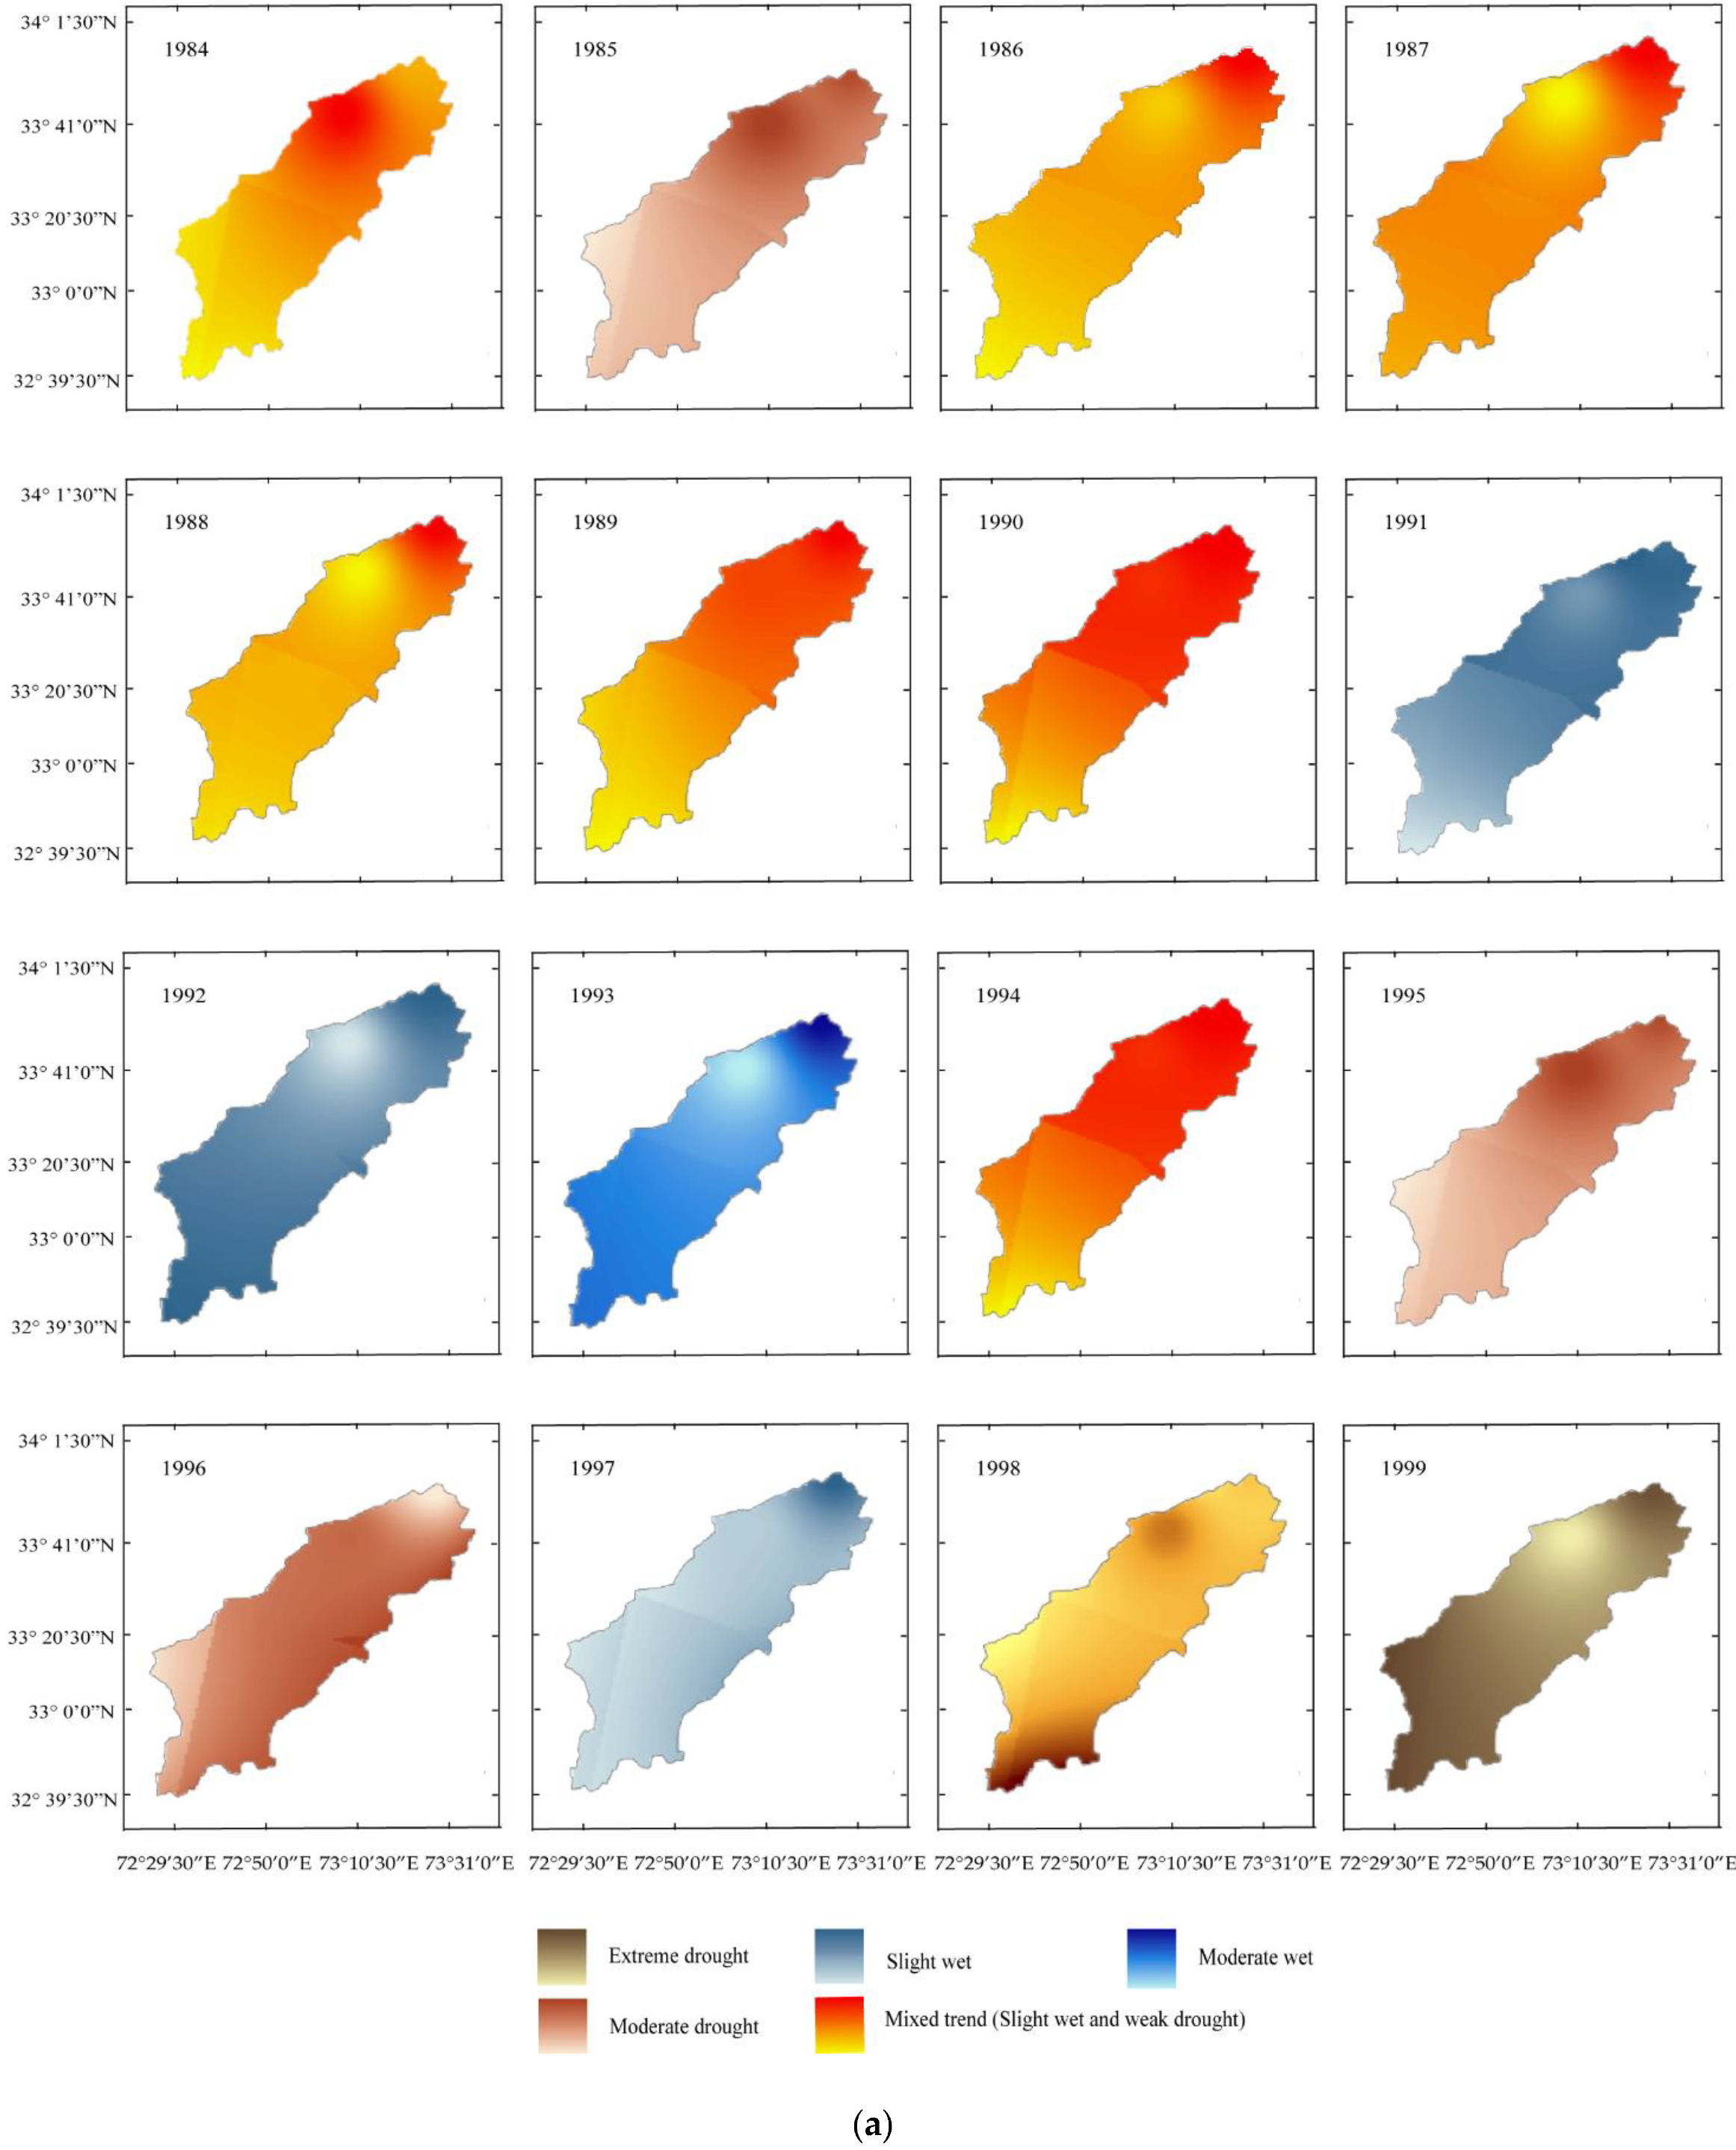
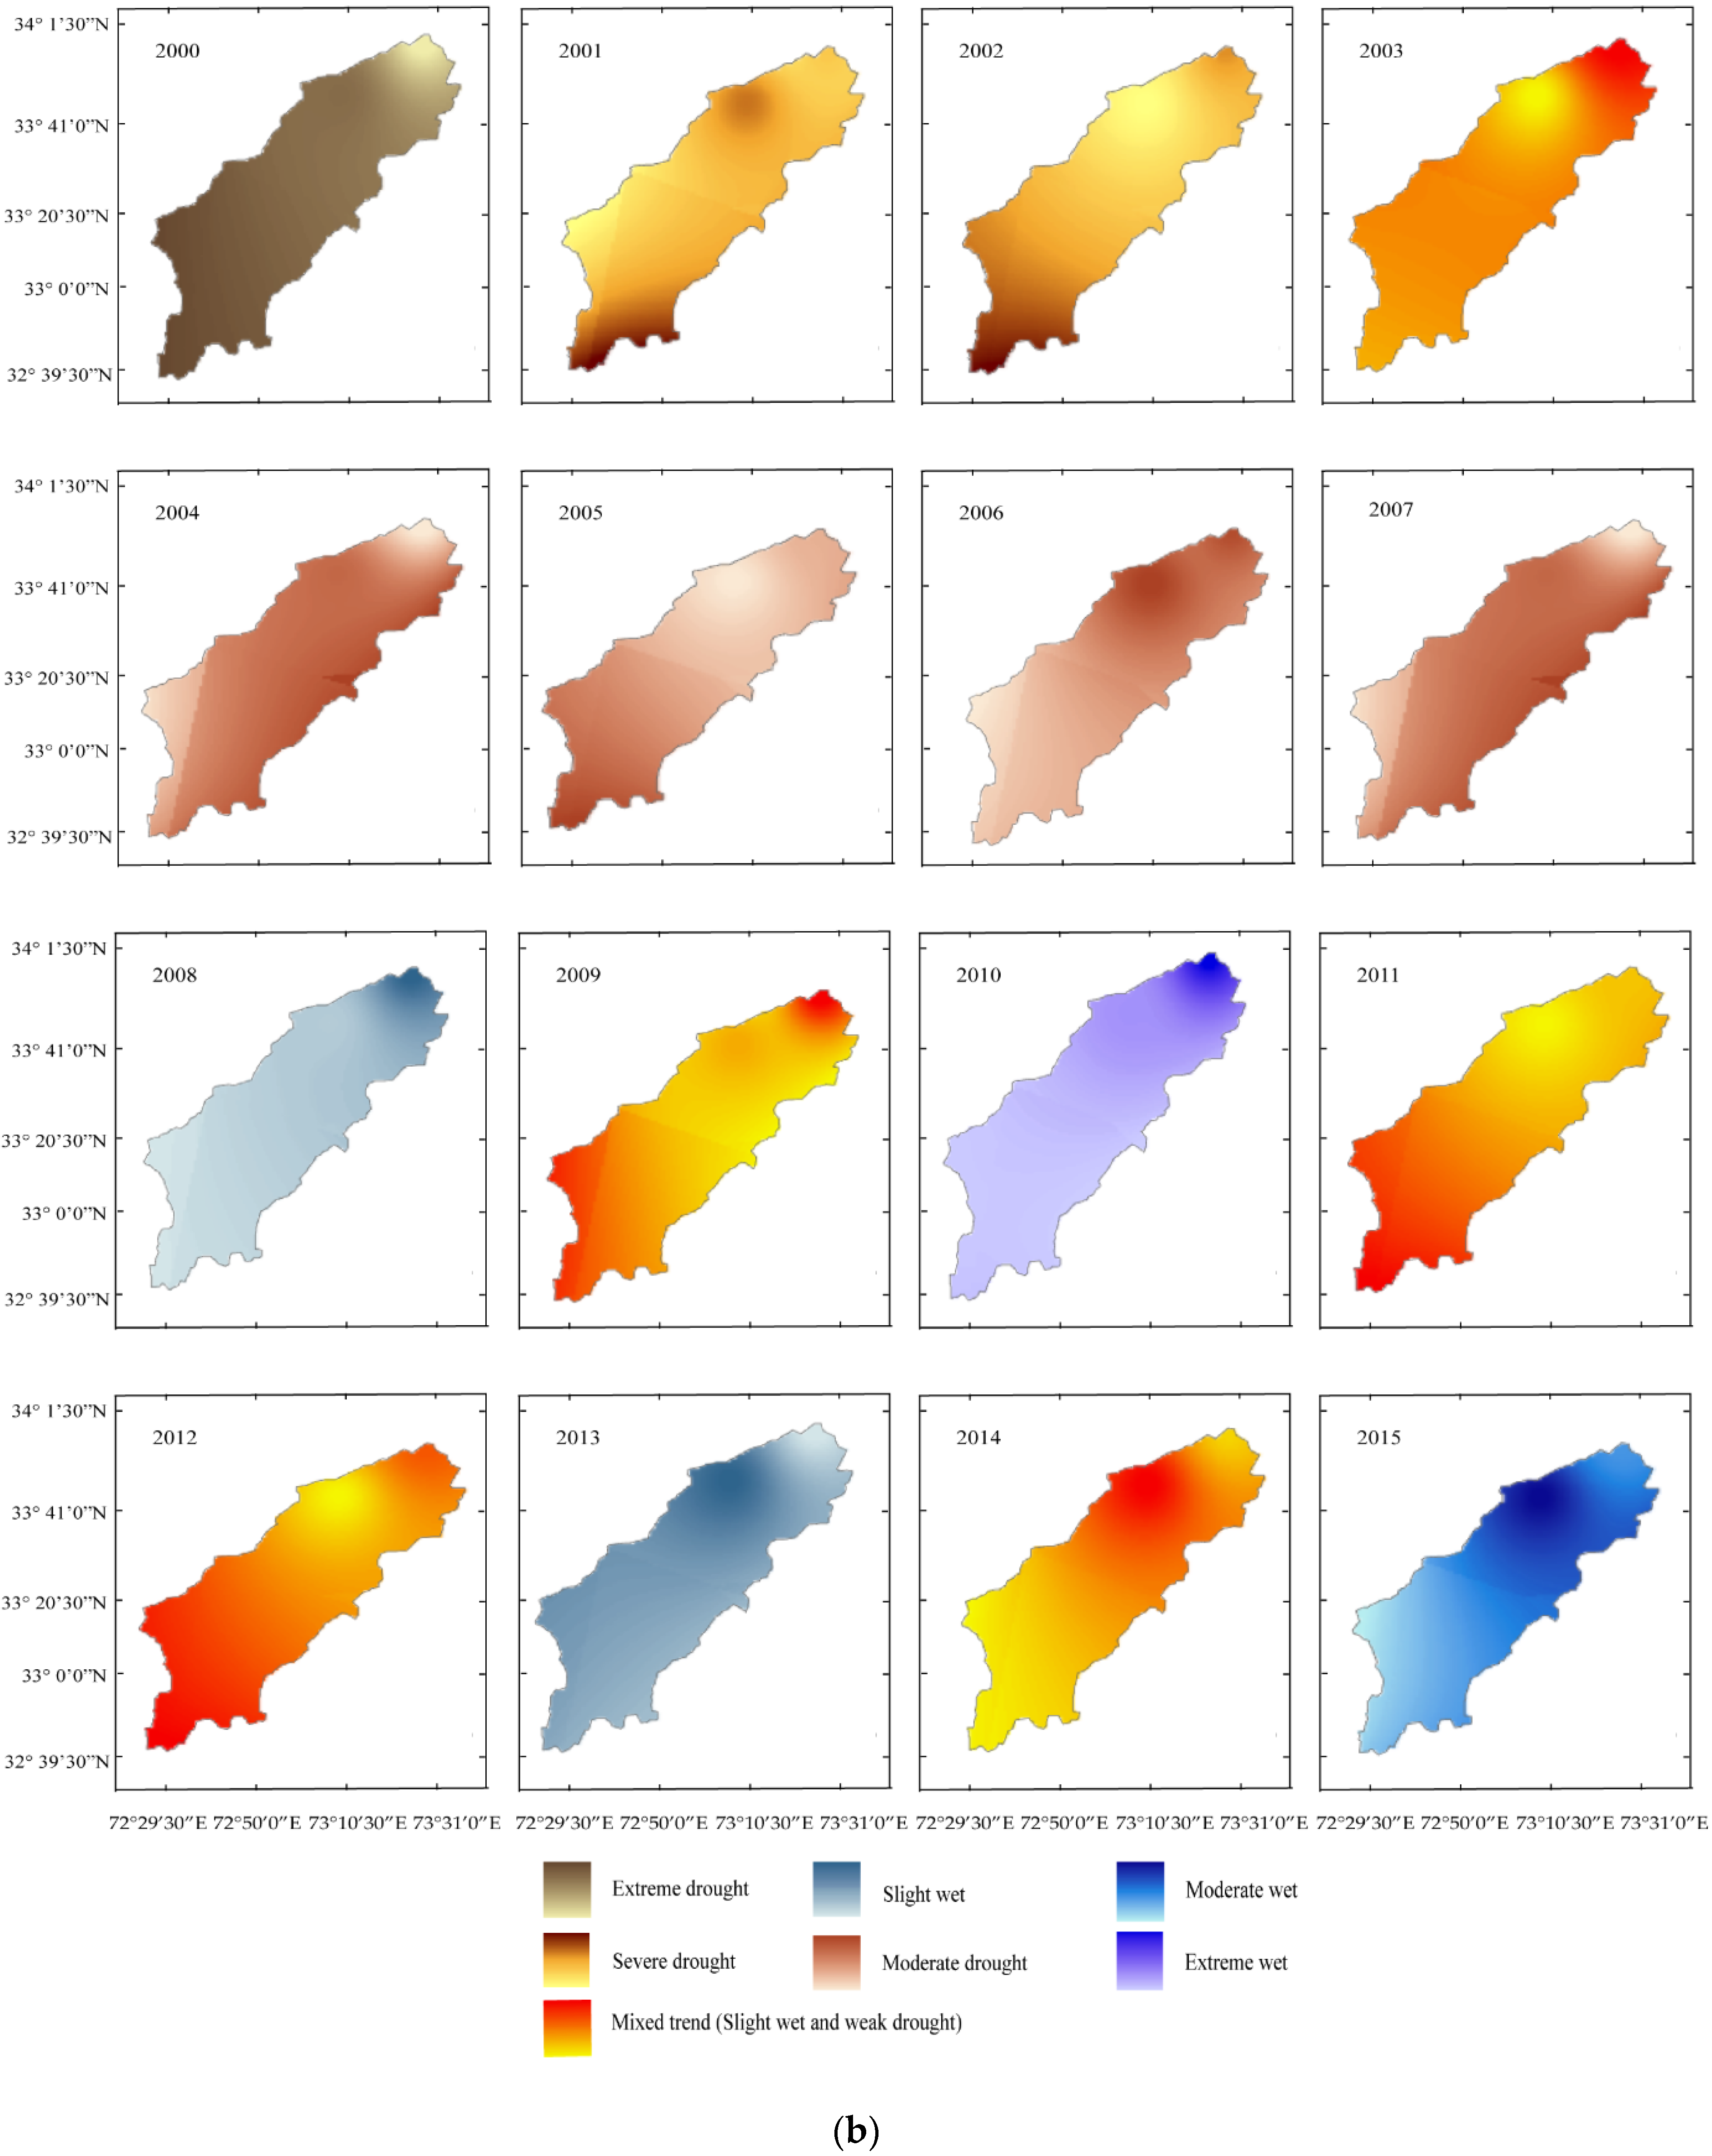
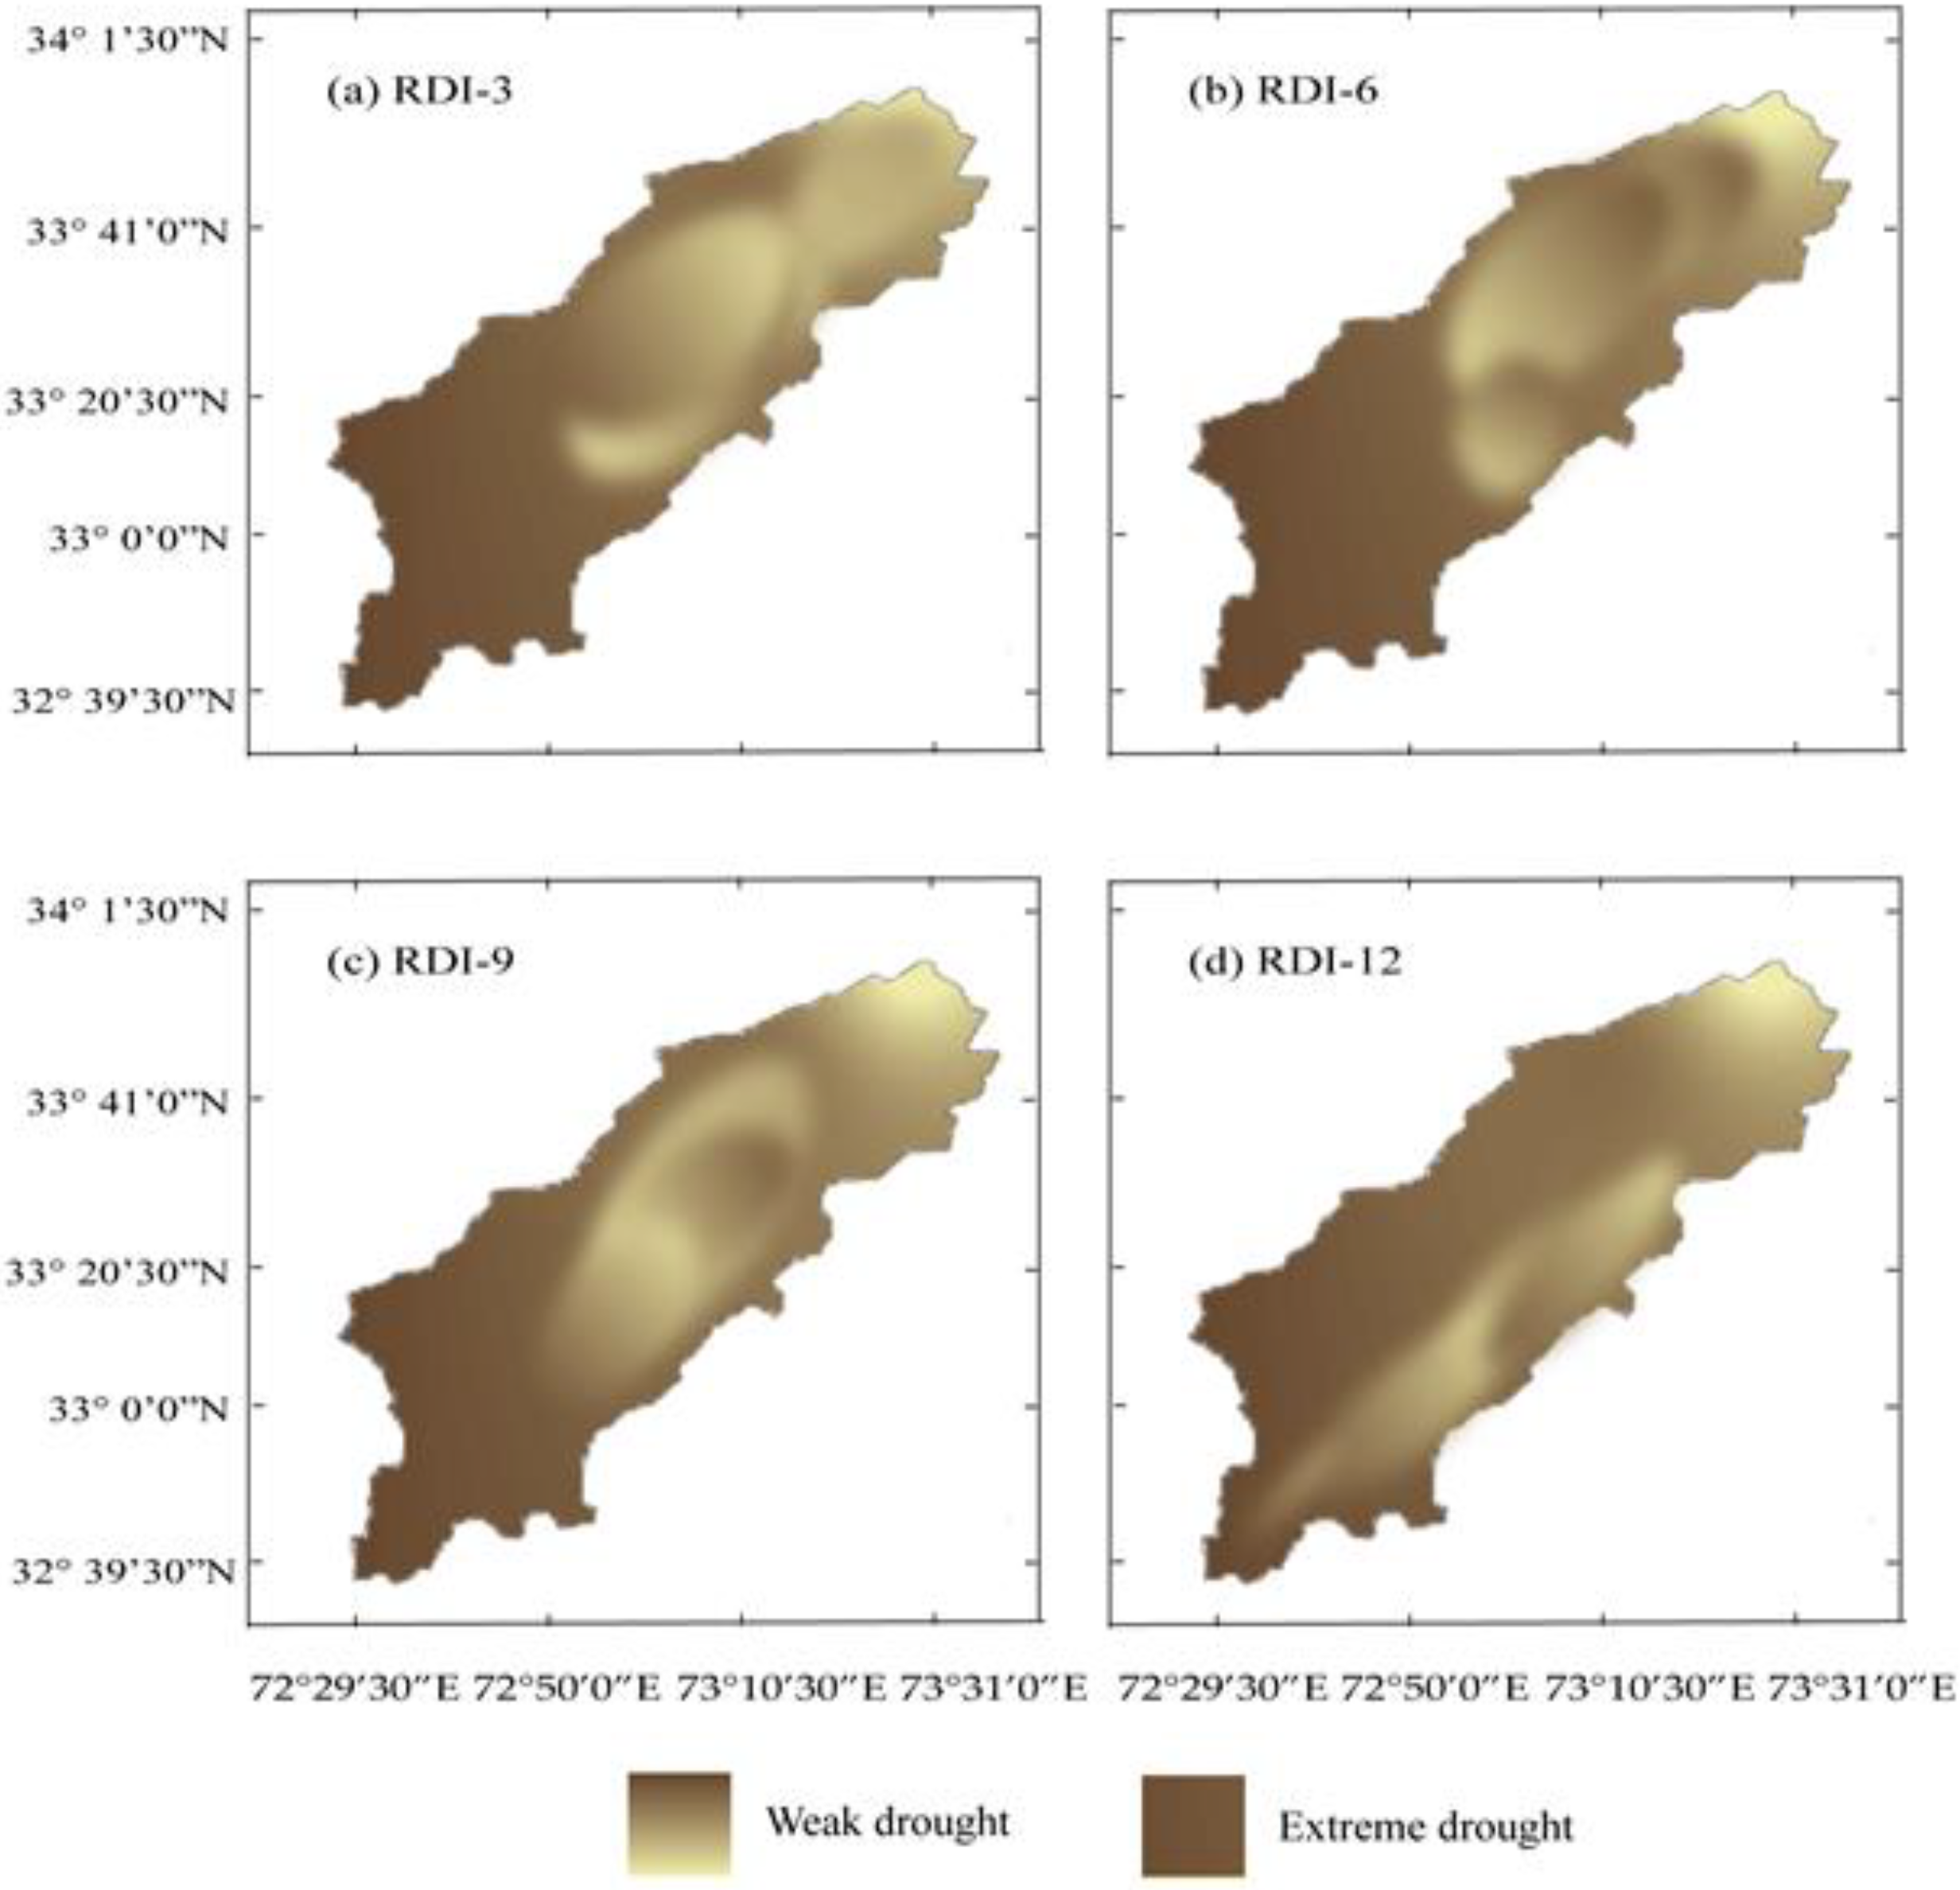
The spatiotemporal variations of RDI values obtained using the inverse distance weighting interpolation method during the study period of 32 years from 1984 to 2015 are depicted in Figure 2a,b. Figure 2a shows results from 1983 to 1999 and Figure 2b from 2000–2015. The overall extreme drought events occurred continuously from 1998 to 2001, while 2000 was the driest year during the study period. Drought patches were further observed randomly during 1985, 1994–1997, and 2002–2007. The year 2010 was reported as the extreme wet year. Additionally, the spatiotemporal variations for the driest year were further elaborated in Figure 3. Figure 3a,b show that extreme drought events were observed in the southwest of the watershed for RDI-3 and RDI-9, respectively. Figure 3c,d demonstrate that extreme drought events also occurred in the southwest and northeast parts of the watershed for RDI-6 and RDI-12, respectively.
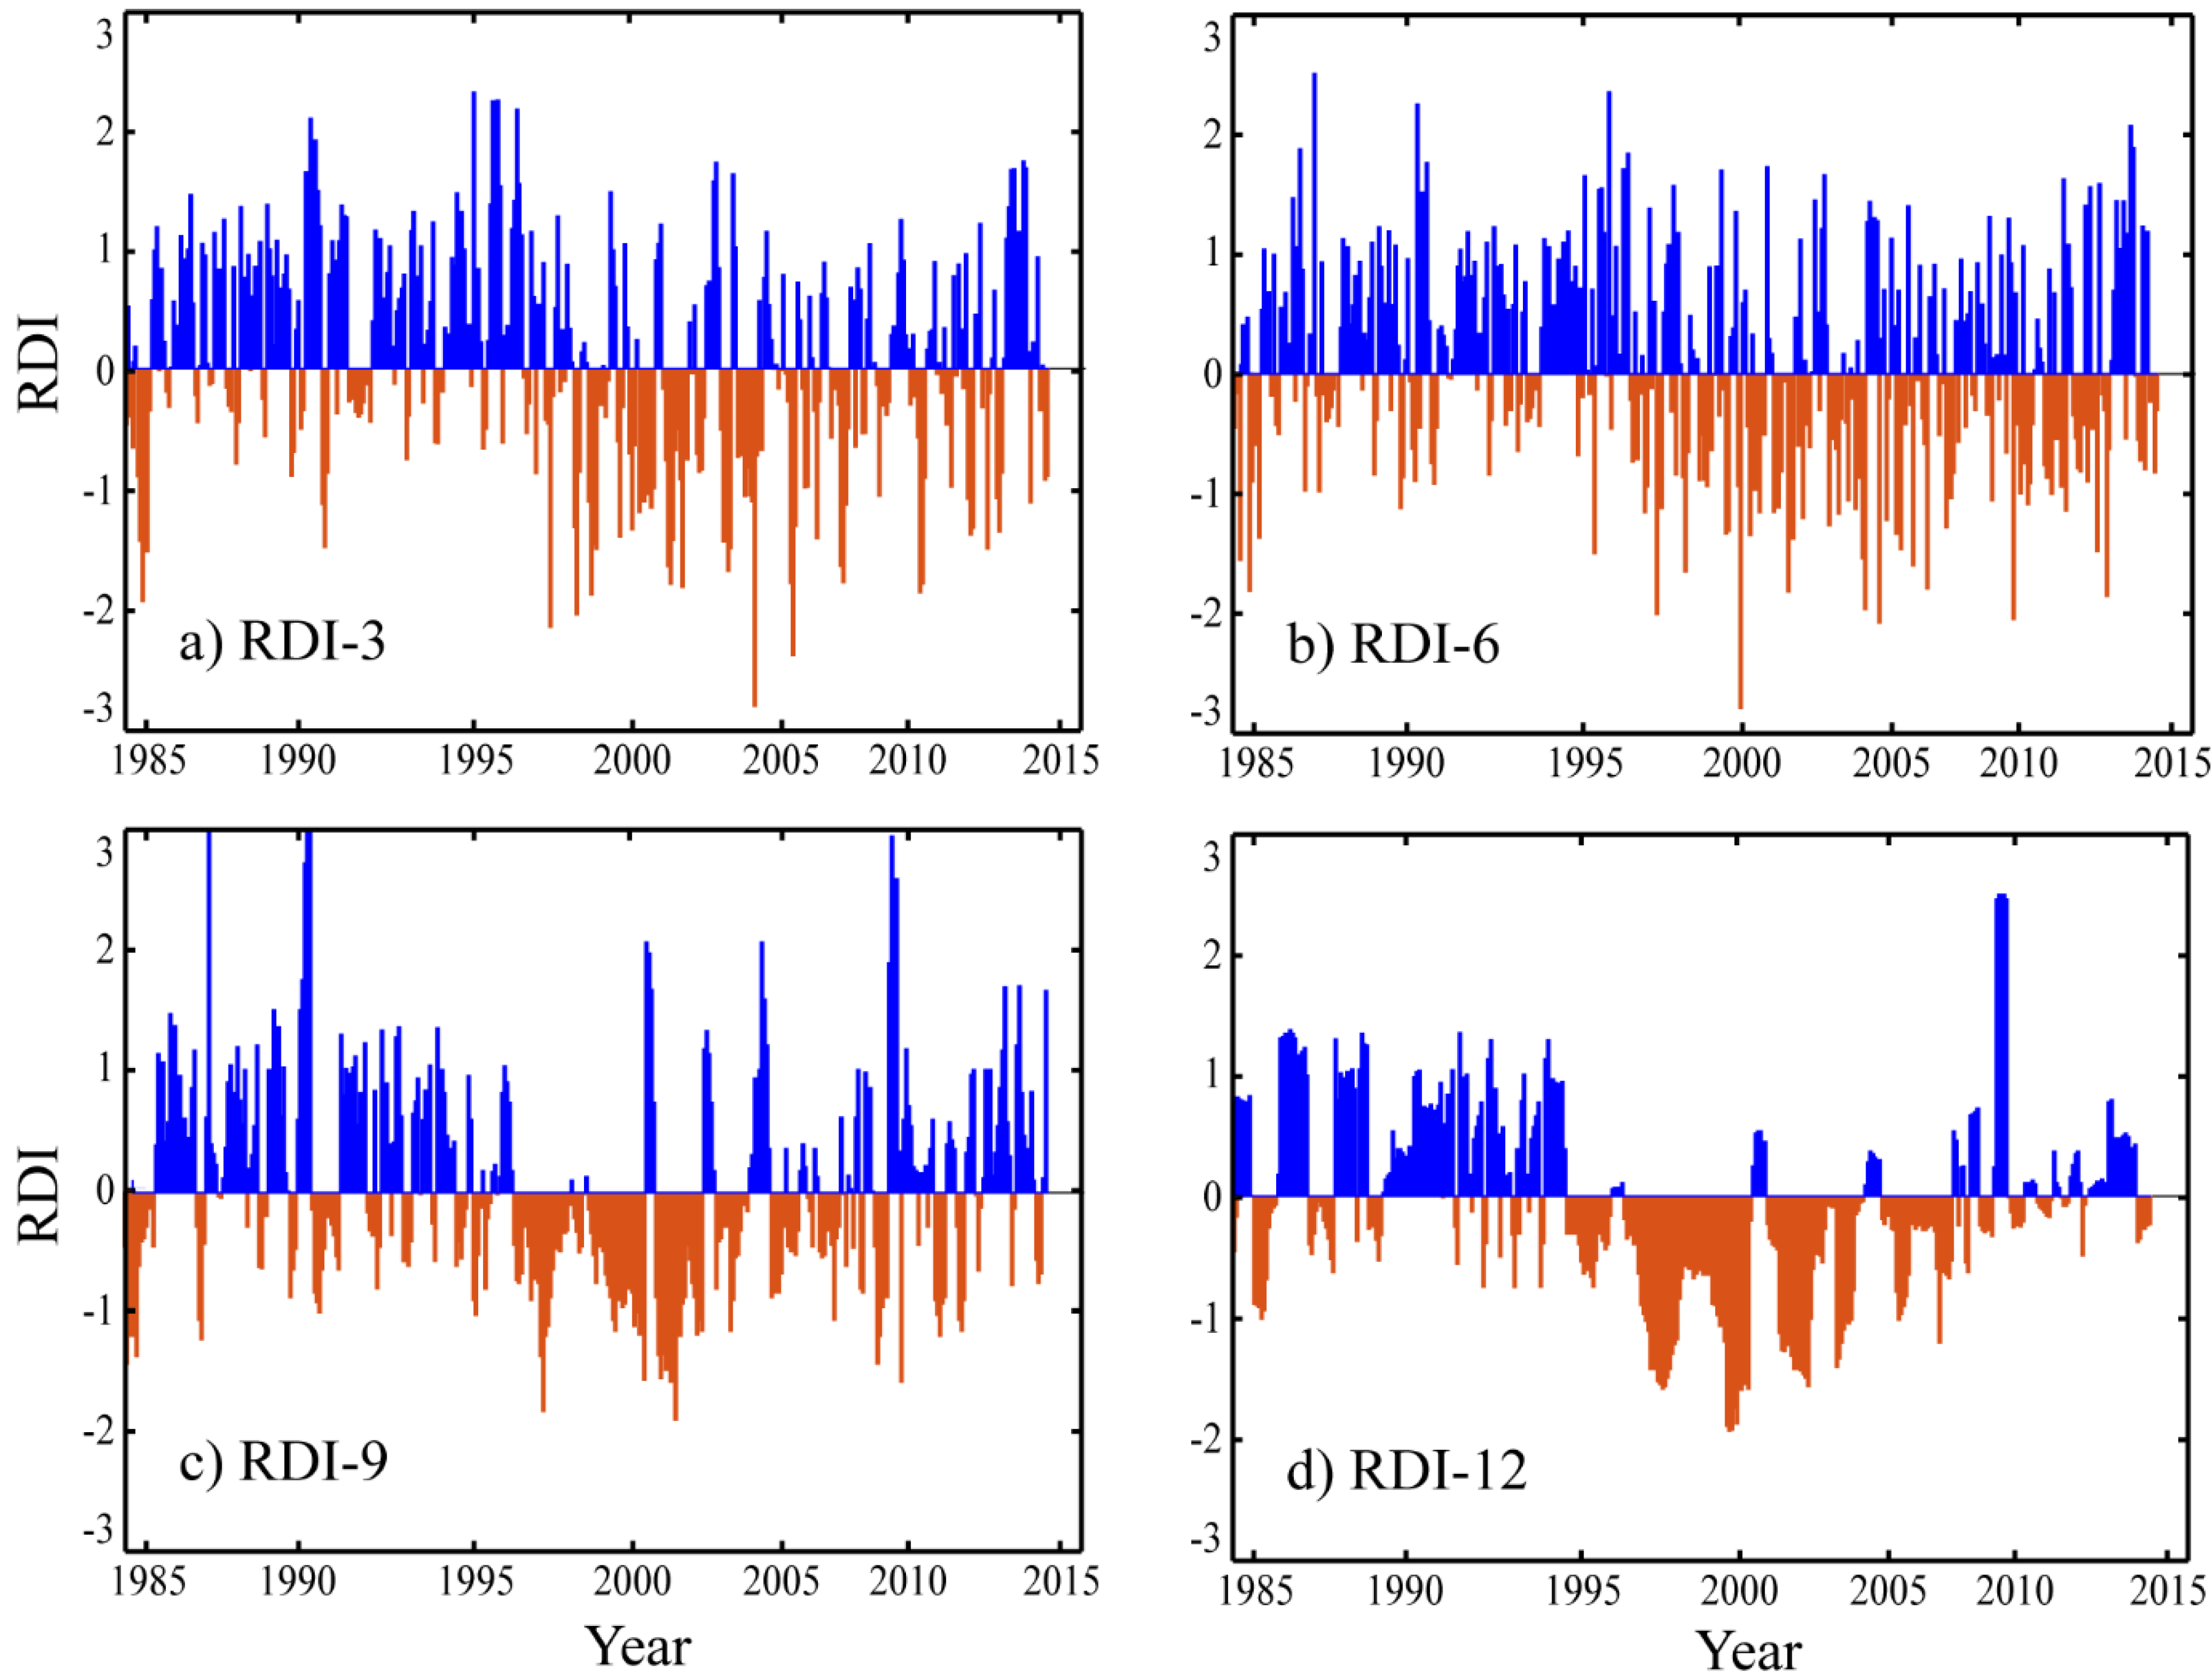
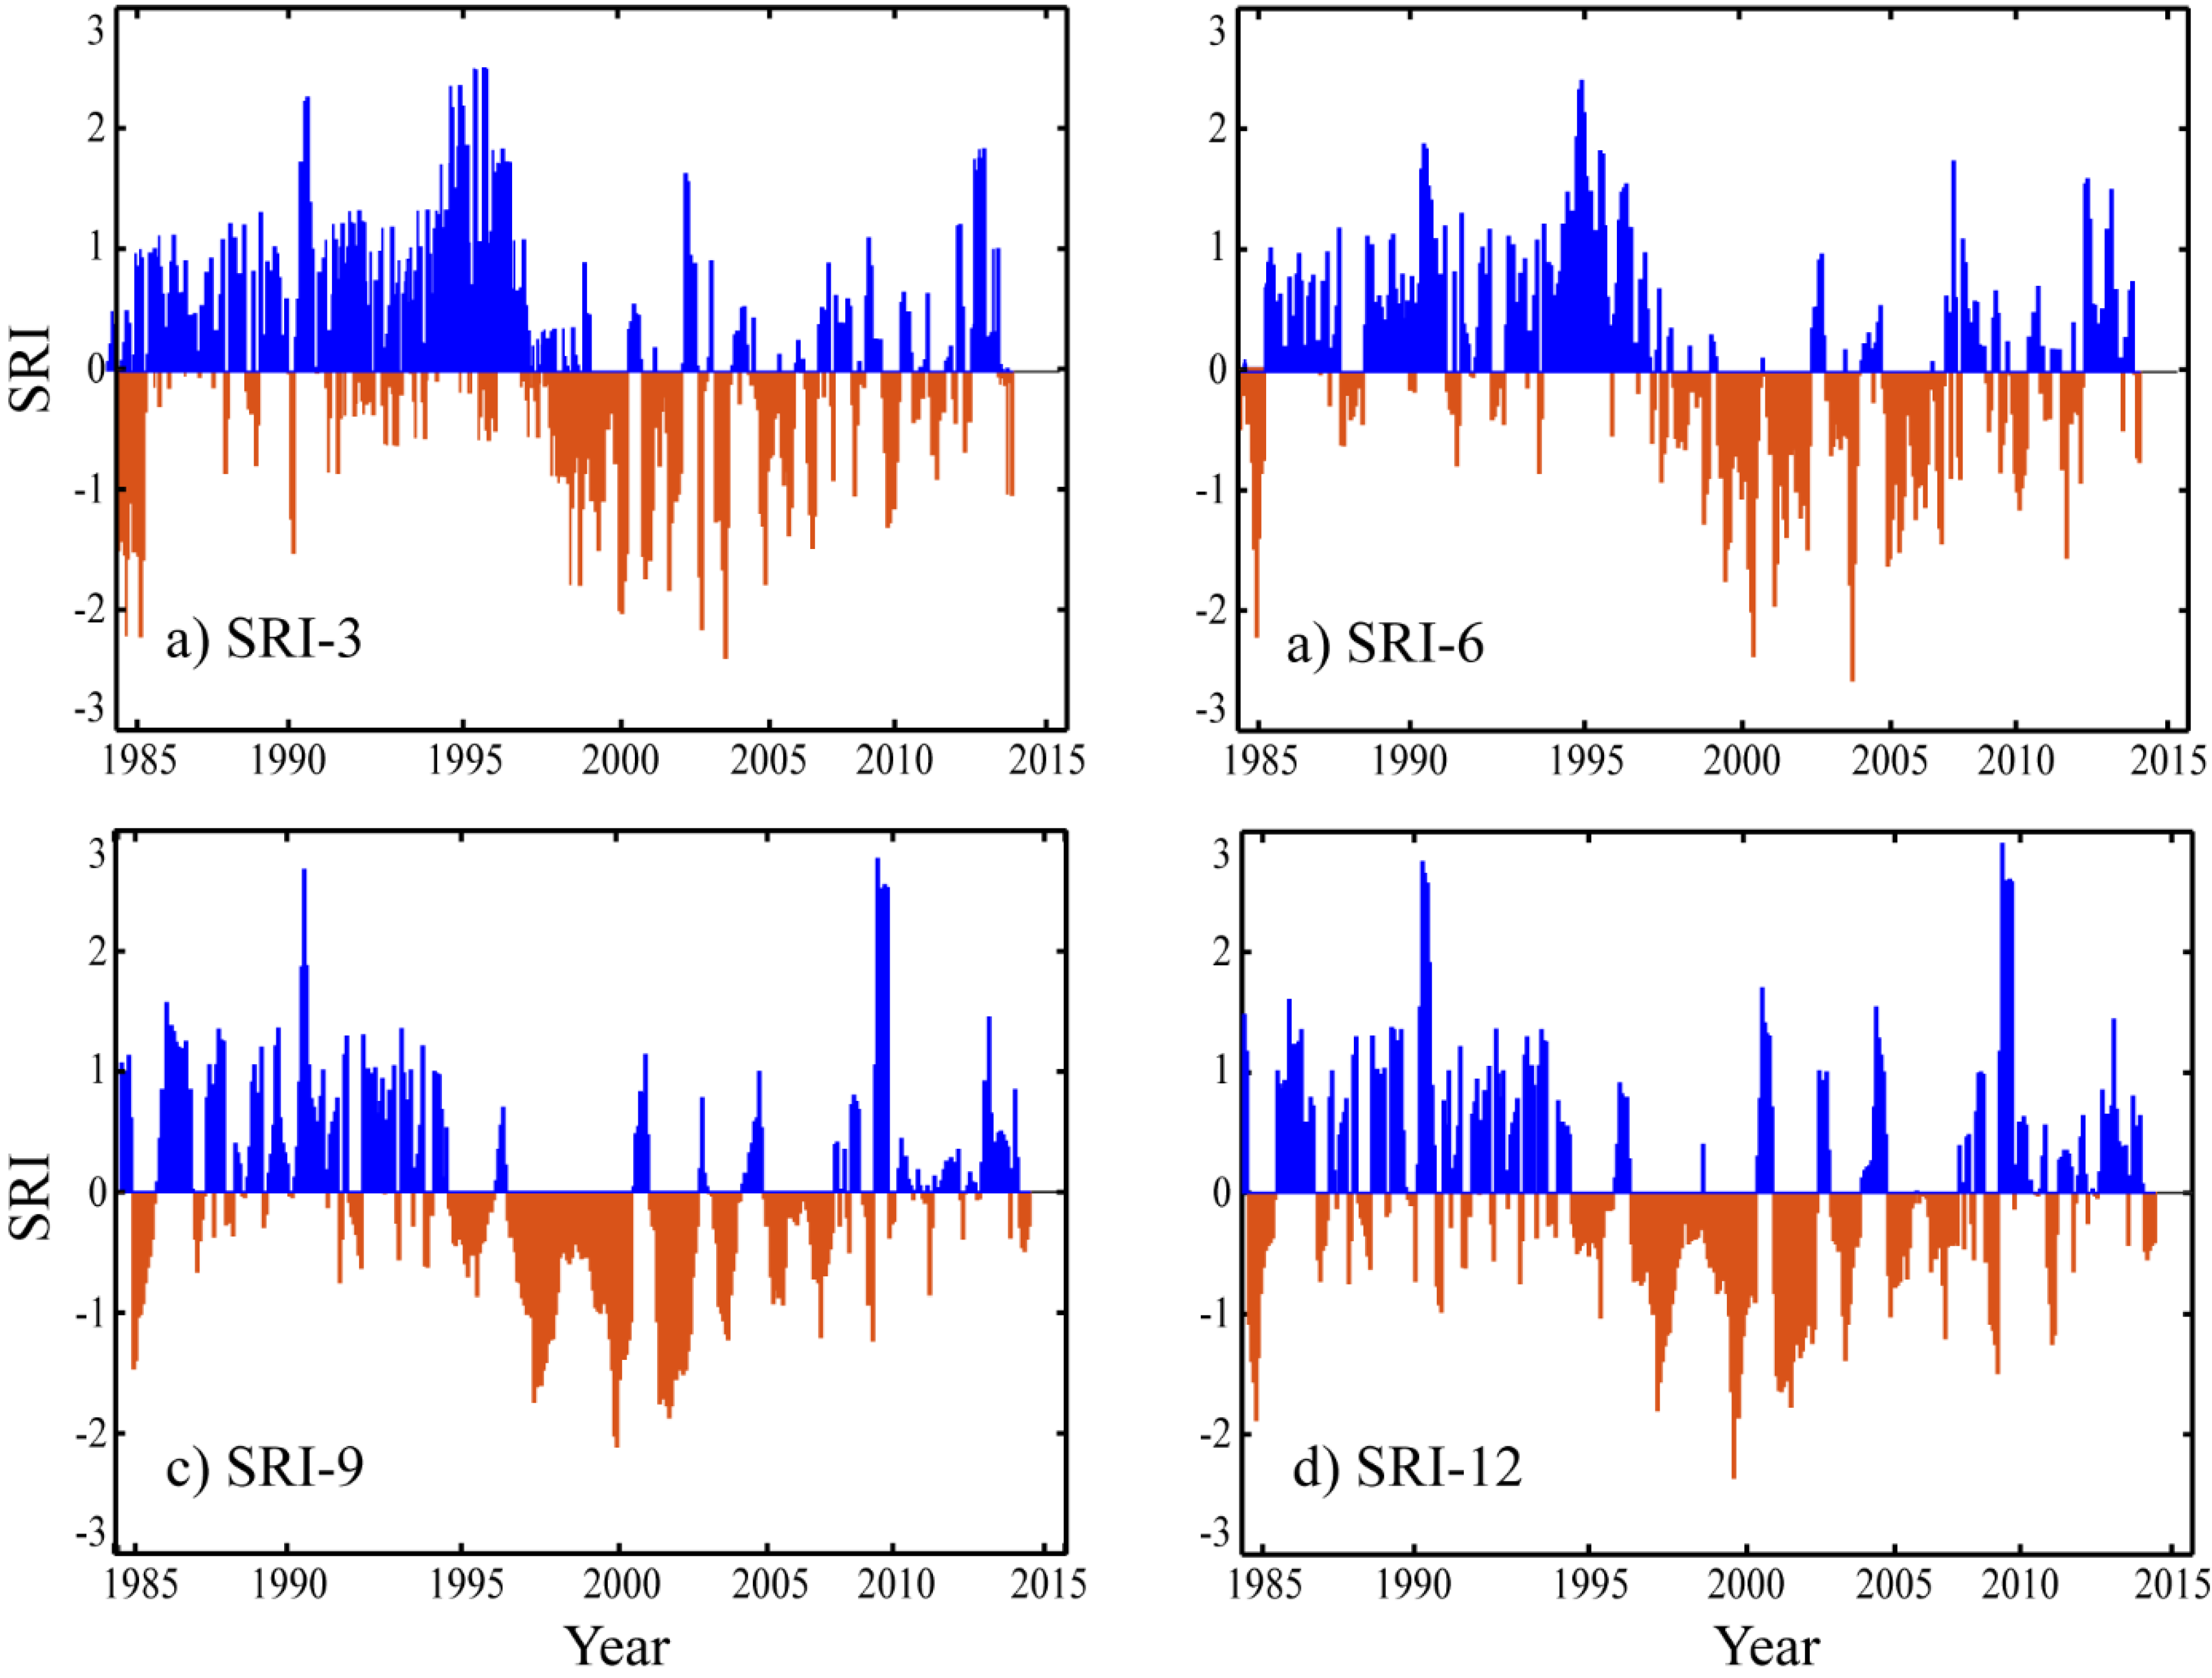
The frequency, intensity, duration, and severity of hydrometeorological droughts are depicted in Figure 4 and Figure 5 when using the RDI and SRI series for different reference time scales. Figure 4 and Figure 5 show the fluctuations in the wet and dry periods for the Soan River Basin during 1984–2015. Frequency and intensity of occurrence were comparatively higher at short time scales (RDI and SRI-3 and -6), while the duration and severity were longer and more severe at longer time scales of 9 and 12 months. Moreover, it was further observed that fluctuations in the frequency of drought events in RDI-3 were higher than those of SRI-3, while frequency fluctuations between RDI-6 and SRI-6 were relatively lower, as SRI-6 tended to be more stable than RDI-6. The durations and severities of drought events seemed increase as the time scale increased. For instance, drought duration became longer for the time scales of 9 and 12 months for both the RDI and SRI, which increased the drought severity. Additionally, the highest drought intensity occurred in a short time scale for both RDI-3 and RDI-6 and was noted as −2.75. The highest drought intensity was −2.5 and −2.3 for SRI-3 and SRI-6, respectively. The highest drought duration was observed in long time scale for both RDI and SRI, and a stable drought was observed during 1996–2002 with a drying episode during 2001 for RDI and SRI at 9 and 12 months. Furthermore, three to four major drought events were recorded on longer time scales of 9 and 12 months for both RDI and SRI, which lasted at least for one year with an intensity ranging from moderate to extreme drought. In conclusion, a consistent cycle of wet and dry episodes over the river basin is obvious and requires more consistent long-term data to better attribute the changes in drought dynamics.
3.2. Trend Analysis of Hydrogeological Droughts
Mann–Kendall testing was performed for the RDI and SRI time series for 1984–2015 and the null hypothesis of trend absence was tested. Given the condition that if probability threshold value p is less or equal to the significance level (α = 0.05), the null hypothesis will be rejected. Rejecting the null hypothesis detects the existence of a significant trend in the time series. On the contrary, the null hypothesis will be accepted if the probability threshold is greater than the significance level. Accepting the null hypothesis indicates the absence of a significant trend. Furthermore, negative and positive values of the Mann–Kendal trend show the decrease and increase in the trend in the time series. Results of Mann–Kendal analysis reveals that the null hypothesis was rejected for all of the time series except RDI-9 (i.e., RDI-3, RDI-6, RDI-12, SRI-3, SRI-6, SRI-12), indicating the existence of a significant trend in all-time series. The RDI-9 still follows a consistent negative Mann–Kendal trend indicating a decreasing drought severity with a relatively lower probability (significance bound >90%). Sen’s slope estimator (SSE) revealed the magnitudes of slopes in the RDI and SRI time series. The SSE analysis revealed a downward trend for all RDI and SRI series. Furthermore, the highest and lowest slope magnitudes were observed RDI-9 and SRI-6, respectively. The results of Mann–Kendal and SSE were presented in Table 1, and overall, the results revealed the tendency to increase hydrometeorological droughts in recent years. While the decreasing trend employs a decrease in drought severity over time and wetting trend. The increase in mean precipitation and extreme events could be potential drivers of such trends and further studies are required to accurately verify this [24,42,43]. The findings of our study are consistent with those of [36,37,38,39].
3.3. Hydrometeorological Correlations
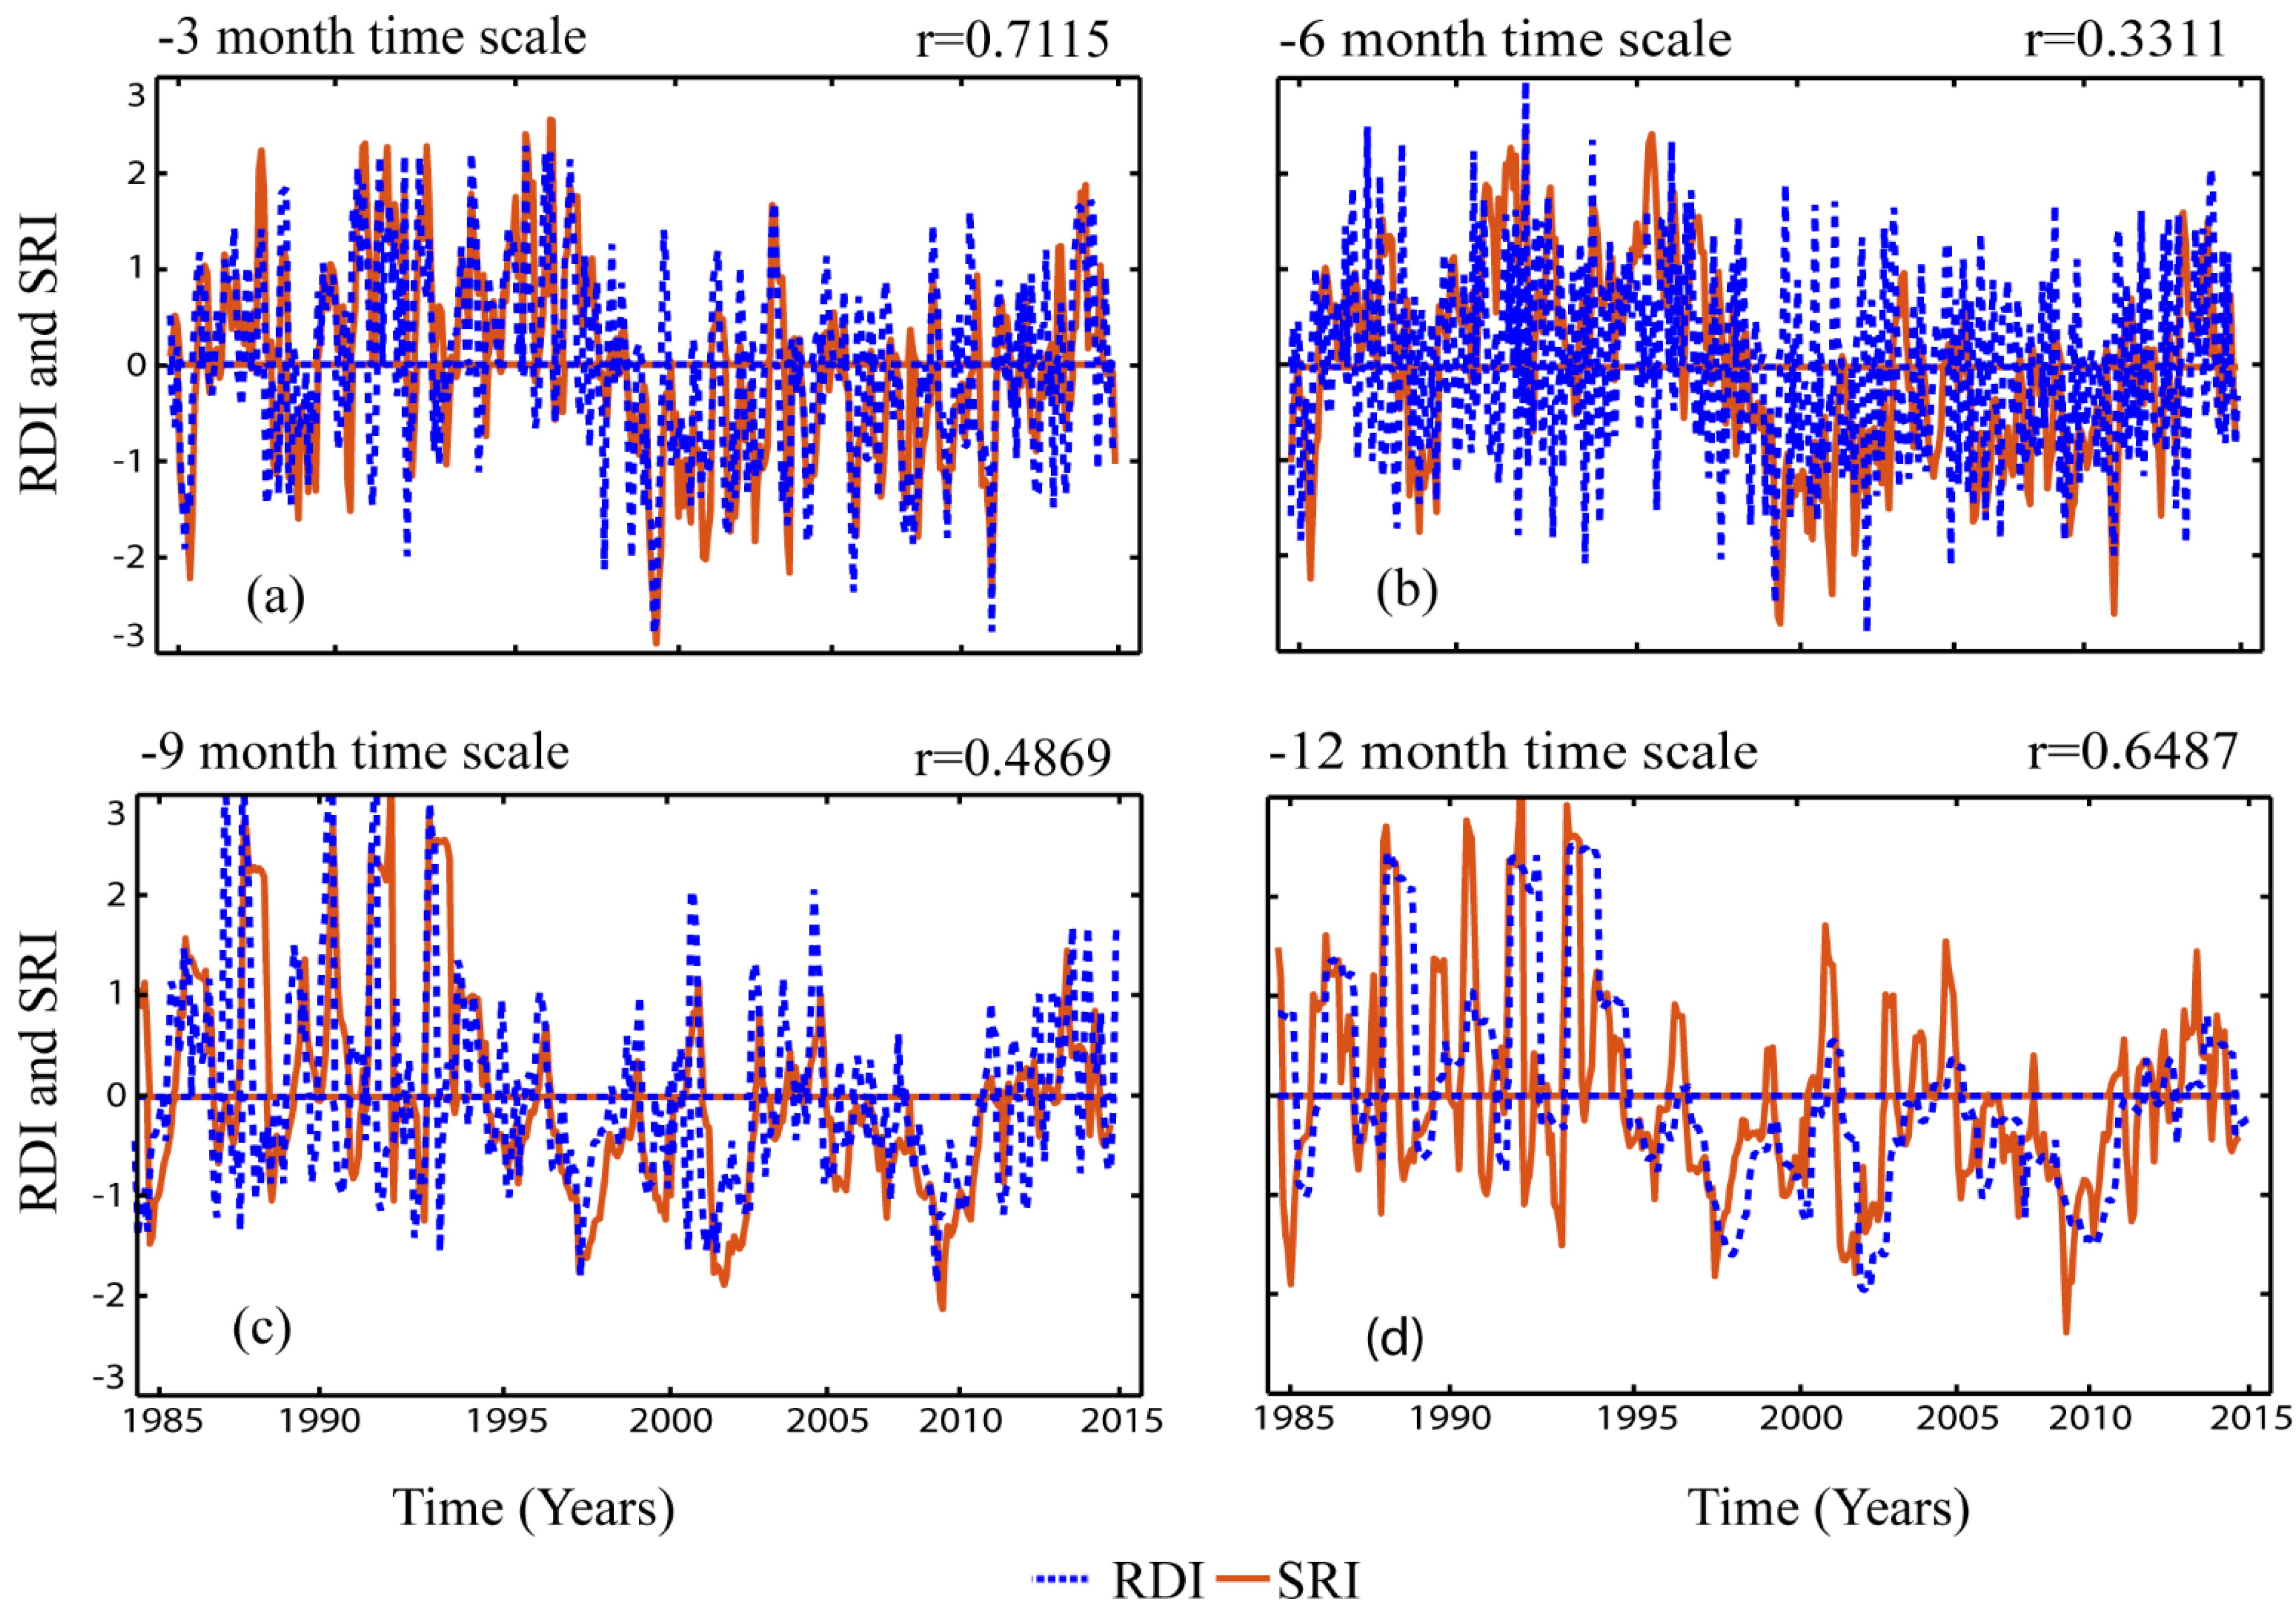
Figure 6 shows the area-averaged temporal evolution of the RDI and SRI when computed at time scales of 3, 6, 9, and 12 months. The correlation analysis revealed a positive relationship between the hydrometeorological droughts (RDI and SRI) in all time scales. The lowest and highest correlations were found with time scales of 3 (RDI-3 and SRI-3) and 12 (RDI-12 and SRI-12) months. The co-variability of the indices reveals that both the indices have exhibited similar dynamic variability over the study period indicating the wet and dry episodes consistently. The quantified relationship in terms of correlation was relatively higher for 3 months (0.72), followed by 12 months (0.65), and 9 and 6 months afterward, which was found to be significant with 95% confidence. The dynamic variability further shows intensified wetting in the early study period, followed by an extreme dry episode and relatively moderate wetting afterward. The cross-correlation revealed that the RDI series could be used to predict hydrological drought events. Our results align with those of Nalbantis and Tsakiris [44] and Wu et al. [16], who also reported a strong correlation between the RDI and SRI.
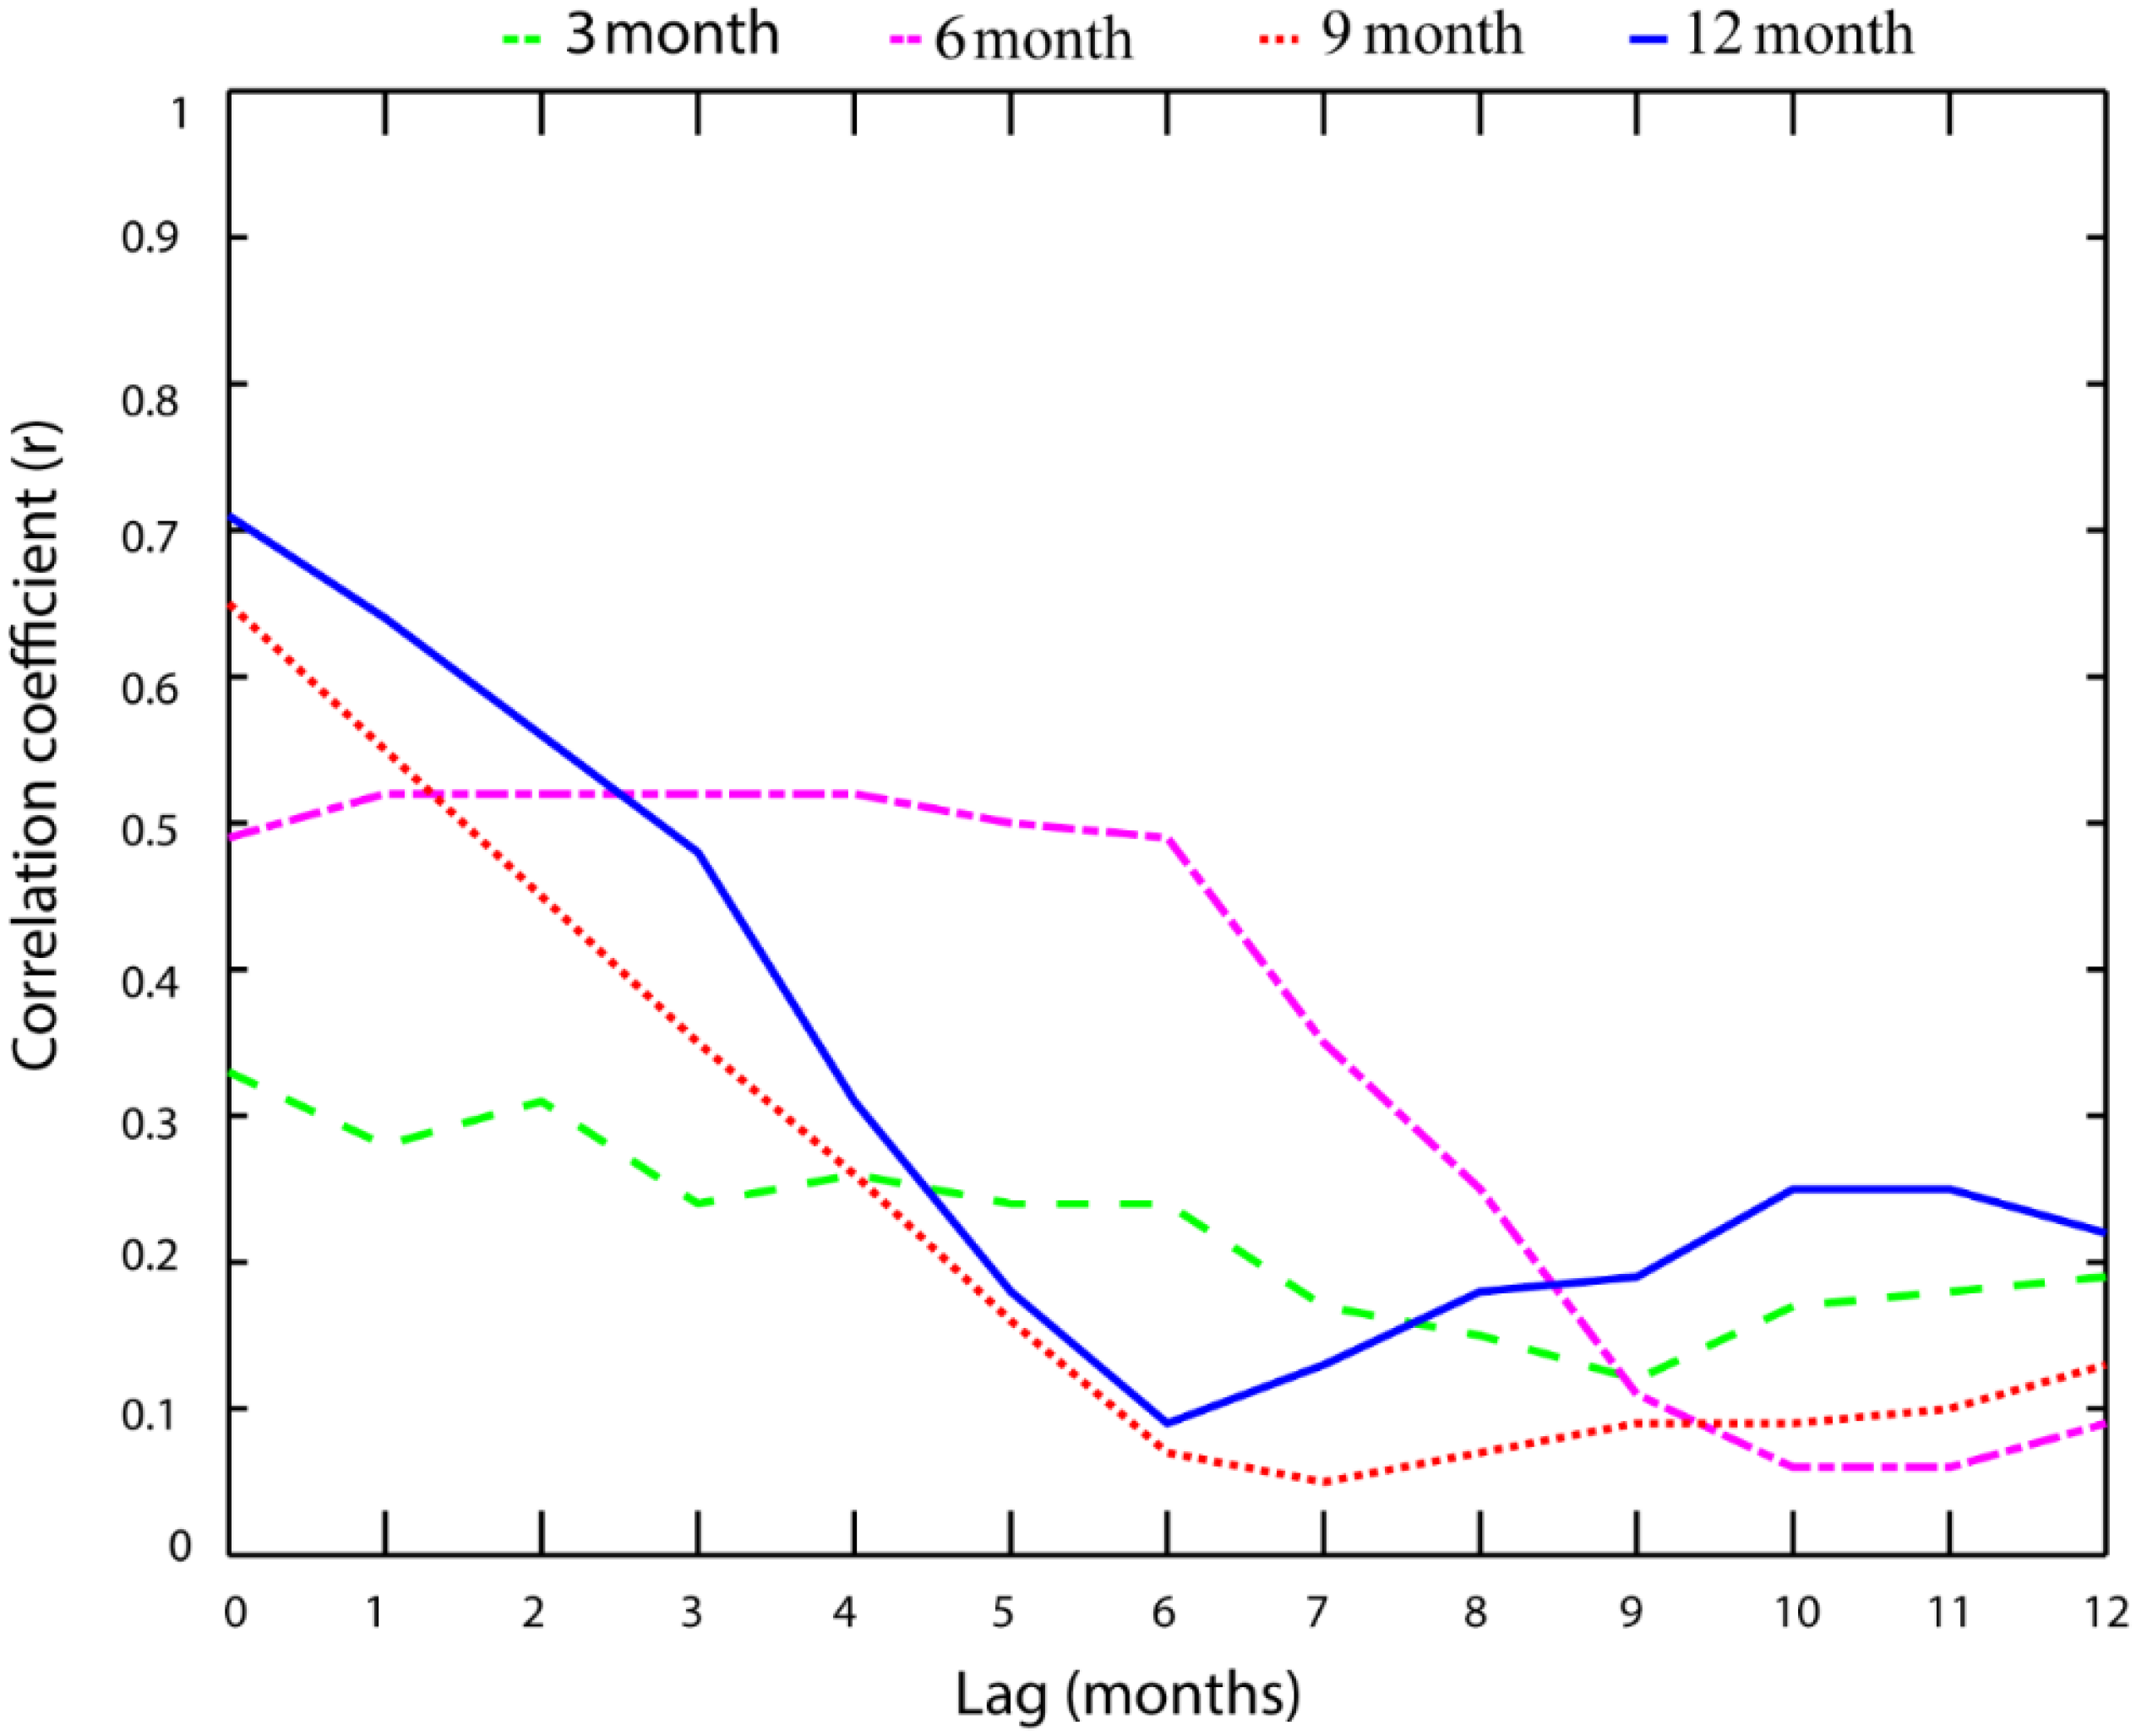
Figure 7 shows the changes in the linear correlation coefficients (r-values) between the RDI series and corresponding SRI series that were lagged compared to the RDI series in months. The highest correlations between the RDI and SRI series for all reference time scales were evident at the zero-lag state, with a consistent decrease obvious at higher lags. The sensitivity of the drought indices and precipitation relationship was driven by the choice of the index time scale. At 3 and 6 months, the drought and precipitation lagged correlation exhibited a dynamic relationship with a relatively weaker correlation than the rest of the indices. The strength of the correlation was relatively higher for 9 and 12 months, implying that precipitation had relatively higher impacts on these two indices than the first two. The overall positive relationship is indicative of two aspects of the precipitation relationship with the drought indices, where the first is the direct impact on replenishing the soil moisture deficit and the ample availability of water for irrigation in the upstream storage reservoir. Over time, the relationship was driven by an increased atmospheric evapotranspiration demand that depleted soil moisture and reservoir storage. Wu et al. [45] also found that the correlation improved as the RDI series was compared with the SRI series of the following month. Moreover, a low correlation between the RDI and SRI was found at lagged months. These results likely occur as both the volume and variation of river discharge are determined by the local meteorological conditions and are affected by the underlying landscape characteristics. The size of the drainage area plays an important role that leads to hydrologic delays in the form of soil moisture, groundwater, and even surface streamflow routines. Nalbantis and Tsakiris [44] also showed that a delay of one month between the two drought indices was too large for their test basin with an area of about 350 km2; however, a month-long lag was too small for the Seyhan and Ceyhan River Basins with a total area of approximately 43,840 km2 [37]. Moreover, estimates of propagation based on the correlation of drought indices can be influenced by droughts and wet extremes. In addition, reservoir operation or seasonal irrigation activities can also affect the statistical relationship between drought indices. Irrigation activities mainly influence hydrological droughts by streamflow and groundwater consumption, which usually leads to a decrease in the streamflow and groundwater levels. The high percentage of cropland in a catchment may also increase evapotranspiration and reduce the water yield capacity, thus intensifying a hydrological drought. This finding is in line with that of a previous study [46].
3.4. Discussions
Spatiotemporal variations of the RDI revealed that 2000 and 2010 were observed as extremely dry and wet years, respectively, with extreme drought events occurring in the northeastern and southwestern parts of the Soan River Basin. The analysis further revealed that for both the RDI and SRI, drought events occurred more frequently in a shorter time scale but lasted for a longer duration with a longer time scale. This demonstrated that the severity of drought increased with time scale for both RDI and SRI. Furthermore, the occurrences of RDI and SRI were correlated, and a similar trend was also detected, where r2 was observed as 0.37, 0.61, 0.64, and 0.66 for RDI-3 and SRI-3, RDI-6 and SRI-6, RDI-9 and SRI-9, and RDI-12 and SRI-12, respectively. Moreover, the Mann–Kendal and SSE tests detected a significant decreasing trend for all RDI and SRI time series (confidence of 95%), except RDI-9 (confidence of 90%), which also exhibited a decreasing trend with relatively lower confidence. Cross-correlation between RDI and SRI was performed with a time lag, which also acknowledged the sequence between RDI and SRI and illustrated that meteorological drought events could be used to predict hydrological droughts in relatively small watersheds.
For further studies, it is suggested to use hydrometeorological drought indices in different regions worldwide to develop more comprehensive drought monitoring and prediction systems. The difference between the RDI and SRI trends could exist due to evapotranspiration or lag time between rainfall and runoff, which could predict propagation from meteorological to hydrological droughts. Basin characteristics such as soil moisture, land use, and the relations between streamflow and groundwater could also influence drought propagation.
4. Conclusions
This study has investigated meteorological and hydrological droughts in the Soan River Basin of Pakistan and their relationships. The analysis of both drought indices was performed based on the monthly values of the RDI and SRI from 1984 to 2015. The RDI and SRI, together with their classifications, could be used as reliable tools in the assessment of meteorological and hydrological drought evolution in both space and time. The Mann–Kendall test suggested that the occurrence of hydrometeorological droughts has increased in recent years. Sen’s slope estimator also revealed a decreasing slope magnitude. The relationship between meteorological and hydrological droughts indicated a time lag between the two droughts, which can be useful information in determining future potential hydrological droughts when precipitation data are available. The study has offered a framework for the exploration of meteorological and hydrological droughts.
Author Contributions
A.A.: overall conceptualization, methodology, investigation, analysis, writing, C.Z.: supervision, data curation, conceptualization, M.W.: review and editing W.U.: data curation and formal analysis, J.Z.: review and editing. All authors have read and agreed to the published version of the manuscript.
Funding
This research was funded by the key project of National Natural Science Foundation (4213000267), the Innovative and Entrepreneurial Talent Program of Jiangsu Province (R2020SC04) and the Strategic Priority Research Program of the Chinese Academy of Sciences (XDA2006030201).
Institutional Review Board Statement
Not applicable.
Informed Consent Statement
Not applicable.
Data Availability Statement
The datasets used and/or analyzed during the current study are available from the corresponding author upon reasonable request.
Acknowledgments
Authors would like to express their appreciation to funding agencies for their sponsorship.
Conflicts of Interest
The authors declare no conflict of interest.
References
- Dobler-Morales, C.; Bocco, G. Social and Environmental Dimensions of Drought in Mexico: An Integrative Review. Int. J. Disaster Risk Reduct. 2021, 102067. [Google Scholar] [CrossRef]
- Abbasian, M.S.; Najafi, M.R.; Abrishamchi, A. Increasing Risk of Meteorological Drought in the Lake Urmia Basin under Climate Change: Introducing the Precipitation–Temperature Deciles Index. J. Hydrol. 2021, 592, 125586. [Google Scholar] [CrossRef]
- Bachmair, S.; Stahl, K.; Collins, K.; Hannaford, J.; Acreman, M.; Svoboda, M.; Knutson, C.; Smith, K.H.; Wall, N.; Fuchs, B.; et al. Drought Indicators Revisited: The Need for a Wider Consideration of Environment and Society. Wiley Interdiscip. Rev. Water 2016, 516–536. [Google Scholar] [CrossRef] [Green Version]
- Duan, R.; Huang, G.; Li, Y.; Zhou, X.; Ren, J.; Tian, C. Stepwise Clustering Future Meteorological Drought Projection and Multi-Level Factorial Analysis under Climate Change: A Case Study of the Pearl River Basin, China. Environ. Res. 2021, 196, 110368. [Google Scholar] [CrossRef]
- Noorisameleh, Z.; Khaledi, S.; Shakiba, A.; Firouzabadi, P.Z.; Gough, W.A.; Qader Mirza, M.M. Comparative Evaluation of Impacts of Climate Change and Droughts on River Flow Vulnerability in Iran. Water Sci. Eng. 2020, 13, 265–274. [Google Scholar] [CrossRef]
- Tramblay, Y.; Koutroulis, A.; Samaniego, L.; Vicente-Serrano, S.M.; Volaire, F.; Boone, A.; Le Page, M.; Llasat, M.C.; Albergel, C.; Burak, S.; et al. Challenges for Drought Assessment in the Mediterranean Region under Future Climate Scenarios. Earth Sci. Rev. 2020, 210, 103348. [Google Scholar] [CrossRef]
- Rehana, S.; Sireesha Naidu, G. Development of Hydro-Meteorological Drought Index under Climate Change—Semi-Arid River Basin of Peninsular India. J. Hydrol. 2021, 594, 125973. [Google Scholar] [CrossRef]
- Palmer, W.C. Keeping Track of Crop Moisture Conditions, Nationwide: The New Crop Moisture Index. Weatherwise 1968, 21, 156–161. [Google Scholar] [CrossRef]
- Shafer, B.A.; Dezman, L.E. Development of a Surface Water Supply Index (SWSI) to Assess the Severity of Drought Conditions in Snowpack Runoff areas|Western Snow Conference. Available online: https://westernsnowconference.org/node/932 (accessed on 28 June 2021).
- Yerdelen, C.; Abdelkader, M.; Eris, E. Assessment of Drought in SPI Series Using Continuous Wavelet Analysis for Gediz Basin, Turkey. Atmos. Res. 2021, 260, 105687. [Google Scholar] [CrossRef]
- Tsakiris, G.; Pangalou, D.; Vangelis, H. Regional Drought Assessment Based on the Reconnaissance Drought Index (RDI). Water Resour. Manag. 2007, 21, 821–833. [Google Scholar] [CrossRef]
- Fooladi, M.; Golmohammadi, M.H.; Safavi, H.R.; Mirghafari, R.; Akbari, H. Trend Analysis of Hydrological and Water Quality Variables to Detect Anthropogenic Effects and Climate Variability on a River Basin Scale: A Case Study of Iran. J. Hydro-Environ. Res. 2021, 34, 11–23. [Google Scholar] [CrossRef]
- Barker, L.J.; Hannaford, J.; Chiverton, A.; Svensson, C. From Meteorological to Hydrological Drought Using Standardised Indicators. Hydrol. Earth Syst. Sci. 2016, 20, 2483–2505. [Google Scholar] [CrossRef] [Green Version]
- Shukla, S.; Wood, A.W. Use of a Standardized Runoff Index for Characterizing Hydrologic Drought. Geophys. Res. Lett. 2008, 35. [Google Scholar] [CrossRef] [Green Version]
- Edossa, D.C.; Babel, M.S.; Gupta, A. Das. Drought Analysis in the Awash River Basin, Ethiopia. Water Resour. Manag. 2010, 24, 1441–1460. [Google Scholar] [CrossRef]
- Wu, J.; Chen, X.; Yao, H.; Zhang, D. Multi-Timescale Assessment of Propagation Thresholds from Meteorological to Hydrological Drought. Sci. Total Environ. 2021, 765, 144232. [Google Scholar] [CrossRef]
- Tan, M.L.; Chua, V.P.; Li, C.; Brindha, K. Spatiotemporal Analysis of Hydro-Meteorological Drought in the Johor River Basin, Malaysia. Theor. Appl. Climatol. 2019, 135, 825–837. [Google Scholar] [CrossRef]
- Ozkaya, A.; Zerberg, Y. A 40-Year Analysis of the Hydrological Drought Index for the Tigris Basin, Turkey. Water 2019, 11, 657. [Google Scholar] [CrossRef] [Green Version]
- Tri, D.Q.; Dat, T.T.; Truong, D.D. Application of Meteorological and Hydrological Drought Indices to Establish Drought Classification Maps of the Ba River Basin in Vietnam. Hydrology 2019, 6, 49. [Google Scholar] [CrossRef] [Green Version]
- Bayer Altin, T.; Altin, B.N. Response of Hydrological Drought to Meteorological Drought in the Eastern Mediterranean Basin of Turkey. J. Arid Land 2021, 1, 1–17. [Google Scholar] [CrossRef]
- Vogel, J.; Paton, E.; Aich, V.; Bronstert, A. Increasing Compound Warm Spells and Droughts in the Mediterranean Basin. Weather Clim. Extrem. 2021, 32, 100312. [Google Scholar] [CrossRef]
- Nabaei, S.; Sharafati, A.; Yaseen, Z.M.; Shahid, S. Copula Based Assessment of Meteorological Drought Characteristics: Regional Investigation of Iran. Agric. For. Meteorol. 2019, 276–277, 107611. [Google Scholar] [CrossRef]
- Muhammad, W.; Muhammad, S.; Khan, N.M.; Si, C. Hydrological Drought Indexing Approach in Response to Climate and Anthropogenic Activities. Theor. Appl. Climatol. 2020, 141, 1401–1413. [Google Scholar] [CrossRef]
- Ullah, W.; Wang, G.; Lou, D.; Ullah, S.; Bhatti, A.S.; Ullah, S.; Karim, A.; Hagan, D.F.T.; Ali, G. Large-Scale Atmospheric Circulation Patterns Associated with Extreme Monsoon Precipitation in Pakistan during 1981–2018. Atmos. Res. 2021, 253, 105489. [Google Scholar] [CrossRef]
- Ellahi, A.; Almanjahie, I.M.; Hussain, T.; Hashmi, M.Z.; Faisal, S.; Hussain, I. Analysis of Agricultural and Hydrological Drought Periods by Using Non-Homogeneous Poisson Models: Linear Intensity Function. J. Atmos. Solar-Terr. Phys. 2020, 198, 105190. [Google Scholar] [CrossRef]
- Ahmed, K.; Shahid, S.; Nawaz, N. Impacts of Climate Variability and Change on Seasonal Drought Characteristics of Pakistan. Atmos. Res. 2018, 214, 364–374. [Google Scholar] [CrossRef]
- Khan, M.A.; Faisal, M.; Hashmi, M.Z.; Nazeer, A.; Ali, Z.; Hussain, I. Modeling Drought Duration and Severity Using Two-Dimensional Copula. J. Atmos. Solar-Terr. Phys. 2021, 214, 105530. [Google Scholar] [CrossRef]
- Qaiser, G.; Tariq, S.; Adnan, S.; Latif, M. Evaluation of a Composite Drought Index to Identify Seasonal Drought and Its Associated Atmospheric Dynamics in Northern Punjab, Pakistan. J. Arid Environ. 2021, 185, 104332. [Google Scholar] [CrossRef]
- Ahmad, I.; Tang, D.; Wang, T.; Wang, M.; Wagan, B. Precipitation Trends over Time Using Mann-Kendall and Spearman’s Rho Tests in Swat River Basin, Pakistan. Adv. Meteorol. 2015, 2015. [Google Scholar] [CrossRef] [Green Version]
- Ahmed, K.; Shahid, S.; Chung, E.S.; Ismail, T.; Wang, X.J. Spatial Distribution of Secular Trends in Annual and Seasonal Precipitation over Pakistan. Clim. Res. 2017, 74, 95–107. [Google Scholar] [CrossRef]
- Reggiani, P.; Mukhopadhyay, B.; Rientjes, T.H.M.; Khan, A. A Joint Analysis of River Runoff and Meteorological Forcing in the Karakoram, Upper Indus Basin. Hydrol. Process. 2017, 31, 409–430. [Google Scholar] [CrossRef]
- Nabi, G.; Hussain, F.; Wu, R.S.; Nangia, V.; Bibi, R. Micro-Watershed Management for Erosion Control Using Soil and Water Conservation Structures and SWAT Modeling. Water 2020, 12, 1439. [Google Scholar] [CrossRef]
- Hussain, F.; Nabi, G.; Wu, R.S. Spatiotemporal Rainfall Distribution of Soan River Basin, Pothwar Region, Pakistan. Adv. Meteorol. 2021, 2021. [Google Scholar] [CrossRef]
- Ashraf, A. Risk Modeling of Soil Erosion under Different Land Use and Rainfall Conditions in Soan River Basin, Sub-Himalayan Region and Mitigation Options. Model. Earth Syst. Environ. 2020, 6, 417–428. [Google Scholar] [CrossRef]
- Belayneh, A.; Adamowski, J.; Khalil, B.; Ozga-Zielinski, B. Long-Term SPI Drought Forecasting in the Awash River Basin in Ethiopia Using Wavelet Neural Networks and Wavelet Support Vector Regression Models. J. Hydrol. 2014, 508, 418–429. [Google Scholar] [CrossRef]
- Tsakiris, G.; Nalbantis, D.; Pangalou, D.; Tigkas, D.; Vangelis, H. Drought Meteorological Monitoring Network Design for the Reconnaissance Drought Index (RDI). Options Méditerranéennes Ser. A 2008, 80, 57–62. [Google Scholar]
- Gumus, V.; Algin, H.M. Meteorological and Hydrological Drought Analysis of the Seyhan−Ceyhan River Basins, Turkey. Meteorol. Appl. 2017, 24, 62–73. [Google Scholar] [CrossRef]
- Ramkar, P.; Yadav, S.M. Spatiotemporal Drought Assessment of a Semi-Arid Part of Middle Tapi River Basin, India. Int. J. Disaster Risk Reduct. 2018, 28, 414–426. [Google Scholar] [CrossRef]
- Kendall, M.G. Rank Correlation Methods; Griffin: London, UK, 1975. [Google Scholar]
- Sen, P.K. Estimates of the Regression Coefficient Based on Kendall’s Tau. J. Am. Stat. Assoc. 1968, 63, 1379–1389. [Google Scholar] [CrossRef]
- Hipel, K.W.; McLeod, A.I. Time Series Modelling of Water Resources and Environmental Systems, 1st ed.; Elsevier: Amsterdam, The Netherlands, 1994; Volume 45. [Google Scholar]
- Bhatti, A.S.; Wang, G.; Ullah, W.; Ullah, S.; Hagan, D.F.T.; Nooni, I.K.; Lou, D.; Ullah, I. Trend in Extreme Precipitation Indices Based on Long Term In Situ Precipitation Records over Pakistan. Water 2020, 12, 797. [Google Scholar] [CrossRef] [Green Version]
- Ullah, S.; You, Q.; Ullah, W.; Ali, A. Observed Changes in Precipitation in China-Pakistan Economic Corridor during 1980–2016. Atmos. Res. 2018, 210, 1–14. [Google Scholar] [CrossRef]
- Nalbantis, I.; Tsakiris, G. Assessment of Hydrological Drought Revisited. Water Resour. Manag. 2009, 23, 881–897. [Google Scholar] [CrossRef]
- Wu, J.; Chen, X.; Gao, L.; Yao, H.; Chen, Y.; Liu, M. Response of Hydrological Drought to Meteorological Drought under the Influence of Large Reservoir. Adv. Meteorol. 2016, 2016. [Google Scholar] [CrossRef] [Green Version]
- Van Loon, A.F. Hydrological Drought Explained. WIREs Water 2015, 2, 359–392. [Google Scholar] [CrossRef]
Figure 1.
Study area with the locations of hydrometeorological stations and pattern of land utilizations.
Figure 1.
Study area with the locations of hydrometeorological stations and pattern of land utilizations.

Figure 2.
(a) Spatiotemporal variations of RDI-12 from 1984 to 1999. (b) Spatiotemporal variations of RDI-12 from 2000 to 2015.
Figure 2.
(a) Spatiotemporal variations of RDI-12 from 1984 to 1999. (b) Spatiotemporal variations of RDI-12 from 2000 to 2015.


Figure 3.
(a–d), Spatial variations of RDI-3, -6, -9, and -12, respectively, for an extreme drought year.
Figure 3.
(a–d), Spatial variations of RDI-3, -6, -9, and -12, respectively, for an extreme drought year.

Figure 4.
Temporal evolution of the average RDI of the nine meteorological stations in the accumulation periods of (a) 3, (b) 6, (c) 9, and (d) 12 months.
Figure 4.
Temporal evolution of the average RDI of the nine meteorological stations in the accumulation periods of (a) 3, (b) 6, (c) 9, and (d) 12 months.

Figure 5.
Temporal evolution of the average SRI of the two hydrological monitoring stations in the accumulation periods of (a) 3, (b) 6, (c) 9, and (d) 12 months.
Figure 5.
Temporal evolution of the average SRI of the two hydrological monitoring stations in the accumulation periods of (a) 3, (b) 6, (c) 9, and (d) 12 months.

Figure 6.
Average RDI and SRI values from hydrometeorological stations for various reference time scales (3, 6, 9, and 12 months). (a) RDI-3 and SRI-3 series; (b) RDI-6 and SRI-6 series; (c) RDI-9 and SRI-9 series; and (d) RDI-12 and SRI-12 series.
Figure 6.
Average RDI and SRI values from hydrometeorological stations for various reference time scales (3, 6, 9, and 12 months). (a) RDI-3 and SRI-3 series; (b) RDI-6 and SRI-6 series; (c) RDI-9 and SRI-9 series; and (d) RDI-12 and SRI-12 series.

Figure 7.
Correlation coefficients between RDI and SRI at time lags ranging from 0 to 12 months.


Table 1.
Z-values of the M–K test (ZM–K) and Sen’s slope estimator (SSE) of the RDI and SRI series during 1984–2015 (values in bold represent statistically significant trends at a 5% significance level).
Table 1.
Z-values of the M–K test (ZM–K) and Sen’s slope estimator (SSE) of the RDI and SRI series during 1984–2015 (values in bold represent statistically significant trends at a 5% significance level).
| Test | Value | RDI-3 | RDI-6 | RDI-9 | RDI-12 | SRI-3 | SRI-6 | SRI-9 | SRI-12 |
|---|---|---|---|---|---|---|---|---|---|
| ZM–K | Z | −3.7355 | −2.2912 | −1.7558 | −2.8748 | −4.0737 | −4.8948 | −3.1840 | −2.5310 |
| p | 0.0002 | 0.0219 | 0.0791 | 0.0040 | 0.0000 | 0.0000 | 0.0015 | 0.0114 | |
| SSE | SS | −0.0017 | −0.0009 | −0.0007 | −0.0026 | −0.0023 | −0.0028 | −0.0021 | −0.0015 |
Publisher’s Note: MDPI stays neutral with regard to jurisdictional claims in published maps and institutional affiliations. |
© 2021 by the authors. Licensee MDPI, Basel, Switzerland. This article is an open access article distributed under the terms and conditions of the Creative Commons Attribution (CC BY) license (https://creativecommons.org/licenses/by/4.0/).
Share and Cite
MDPI and ACS Style
Abbas, A.; Waseem, M.; Ullah, W.; Zhao, C.; Zhu, J. Spatiotemporal Analysis of Meteorological and Hydrological Droughts and Their Propagations. Water 2021, 13, 2237. https://doi.org/10.3390/w13162237
AMA Style
Abbas A, Waseem M, Ullah W, Zhao C, Zhu J. Spatiotemporal Analysis of Meteorological and Hydrological Droughts and Their Propagations. Water. 2021; 13(16):2237. https://doi.org/10.3390/w13162237
Chicago/Turabian StyleAbbas, Adnan, Muhammad Waseem, Waheed Ullah, Chengyi Zhao, and Jianting Zhu. 2021. "Spatiotemporal Analysis of Meteorological and Hydrological Droughts and Their Propagations" Water 13, no. 16: 2237. https://doi.org/10.3390/w13162237
Note that from the first issue of 2016, this journal uses article numbers instead of page numbers. See further details here.