
Dairy Wastewater Treatment with Organic Coagulants: A Comparison of Factorial Designs


1
College of Agricultural Engineering, Campinas State University, Ave. Cândido Rondon, 501, Campinas 13083-875, Brazil
2
Department of Agricultural Engineering, Federal University of Viçosa, Ave. P. H. Rolfs, s/n, Viçosa, Minas Gerais 36570-900, Brazil
*
Author to whom correspondence should be addressed.
Water 2021, 13(16), 2240; https://doi.org/10.3390/w13162240
Submission received: 15 July 2021
/
Revised: 2 August 2021
/
Accepted: 11 August 2021
/
Published: 17 August 2021
(This article belongs to the Special Issue Innovative Technology and Integrated Management for Wastewater Treatment and Reuse)
Abstract
:Optimization of coagulant dosage and pH to reduce the turbidity and chemical oxygen demand (COD) of synthetic dairy wastewater (SDW) was investigated using a full factorial design (FFD) and full factorial design with center point (FFDCP). Two organic coagulants, polyacrylamide (PAM) and Tanfloc were used. The optimal values of coagulant dosage and pH were determined using a multiple response optimization tool and desirability function. The results obtained revealed that the optimum condition for removing turbidity and COD were at pH 5.0 using 50 mg L−1 of coagulant. The same optimum point was obtained in both experimental designs, indicating a good agreement between them. In optimum conditions, the expected removal of turbidity was above 98% with PAM and above 95% with Tanfloc. The estimated COD removal was above 72% with PAM and above 65% with Tanfloc. The addition of center points with replicates in the factorial design allowed to obtain the estimate of the experimental error with a smaller number of runs, allowing to save time and cost of the experimental tests. Moreover, the addition of center points did not affect the estimates of the factorial effects and it was possible to verify the effect of curvature, allowing obtaining information about the factors at intermediate levels.
1. Introduction
Wastewater treatment systems require coagulant dosages that provide pollutant removals at specific levels. The efficiency of coagulants is highly dependent on the pH value since each coagulant has a specific pH range in which it may be more or less efficient [1,2,3]. Thus, determining the dosage of coagulant and pH at which coagulation/flocculation is most efficient is essential for a good performance of the treatment system and to minimize the costs arising from this process.
Statistical methods have been the main tools used when seeking to obtain the best conditions in which there is a high efficiency of pollutant removal [4,5,6,7,8]. Statistical methods can be divided into univariate and multivariate methods. The univariate methods are characterized by optimizing only one factor, while the levels of the other factors remain constant, thus, a large number of experiments are required, increasing the costs and time to obtain the desirable conditions. In addition, in most cases, this technique is unable to determine the optimal combination of the levels of the factors under study, since the effect of some interactions is not determined. [9]. On the other hand, in multivariate methods, it is possible to evaluate the effects of several factors at the same time and achieve the ideal conditions for desirable responses with a limited number of planned experiments, [10,11], with factorial design being one of the multivariate statistical methods most used in water and wastewater treatment studies [12,13,14,15].
In some cases, factorial designs are used as screening experiments. Screening experiments are performed with an interest in determining experimental variables and interactions between variables that have a significant influence on different responses of interest [16]. Factorial designs can be divided into a full factorial design without center point (FFD), full factorial design with center point (FFDCP), and fractional factorial design (FF), being FF indicated when there is a high number of factors and, consequently, an increase in the number of runs.
In 2k factorial design, where k is the number of factors, it is assumed that the response dependency relationship for the factors is linear since only two levels of each factor are used [17,18]. There is, then, concern about this assumption of linearity. When an interaction term is added to a first-order main effects model, a model capable of representing a curvature in the response variable is obtained. This curvature is the result of the torsion in the plane induced by the terms of the interaction represented in Equation (1) [15]. One way to test for curvature is by adding center points to the design 2k.
FFD have traditionally been used in multivariate experimental designs. As an advantage, in these experiments, all the combinations are used in the calculation of the main effects of the factors and the effects of the interactions, reason why the number of repetitions, for the calculation of the averages of the levels of the factors, is high [19]. Often, performing repetitions can be inconvenient for several reasons. Therefore, to circumvent this misfortune and obtain a good estimate of the errors, an experiment is usually included in the center of the planning in which the average value of the levels of all variables is used, thus originating the FFDCP. In this way, it is possible to evaluate the significance of the effects or coefficients in factorial designs (full or fractional) by making repetitions only at the central point [16].
Industrial processing of dairy products requires large amounts of water, generating a large volume of wastewater that needs to be treated before being discharged [20,21,22]. Dairy wastewater treatment can be carried out using different technologies, from physical-chemical [23,24], biological [25,26], to electrochemical processes [21,27]. In the concept of a circular economy, the reduction of available freshwater resources has increased the interest in the reuse of wastewater, thus, obtaining an effluent suitable for reuse is desirable in treatment units.
Organic coagulants have been successfully used in physical–chemical treatment systems to replace metallic coagulants [28,29,30,31]. As an advantage, organic coagulants generate less sludge volume, generally, this sludge is absent of substances potentially toxic to the environment, and furthermore, these coagulants have high efficiency in removing pollutants at low dosages [32,33,34].
In this study, we compared the FFD and FFDCP in the treatment of dairy wastewater. Two organic coagulants have been used and the removal of turbidity and COD was analyzed by varying the coagulant dosage and pH.
2. Materials and Methods
2.1. Dairy Wastewater
The wastewaters generated in dairy industries have great variability in their characteristics since their composition depends a lot on the processed products, the procedures used during manufacture, the products used for cleaning and hygiene, among others [20,35]. Thus, to obtain wastewater with a standard characteristic, to guarantee repeatability, and control over the treatments, in this study, we chose to use synthetic dairy wastewater (SDW) that satisfactorily represented the real wastewater. Studies reported in the literature also indicate the use of synthetic dairy wastewater in bench-scale studies, in order to obtain better control over the studied process, in addition to allowing subsequent replicability and comparison of results [36,37,38,39].
Analytical grade and purity reagents (Sigma-Aldrich, San Louis, USA) were used in the preparation of SDW in the following concentrations: glucose (2.4 mg L−1), FeSO4.7H2O (24.0 mg L−1), NaH2PO4.H2O (900.0 mg L−1), NaHCO3 (1560.0 mg L−1), MgSO4.7H2O (600.0 mg L−1), MnSO4.H2O (24.0 mg L−1), CaCl2·2H2O (36.0 mg L−1), NH4Cl (583.3 mg L−1), (NH2)2CO (2700.0 mg L−1), and whole milk powder (1440.0 mg L−1) [36]. Reagents were dissolved in tap water. Table 1 shows the characteristics of SDW.
2.2. Experimental Design and Statistical Analysis
In this study, we used the FFD and the FFDCP to assess the effects of coagulant dosage and pH factors on the removal of turbidity and COD from SDW. The center points are represented by the values (0, 0) in the coded scale of levels. The high and low levels of the factors (Table 2) were determined in preliminary tests and based on results reported in the literature [32].
In FFDCP, four conditions of combinations of coagulant dosage and pH were studied, and three repetitions were performed at the center point [12], totaling seven runs. In FFD, the same four combinations of coagulant dosage and pH were studied, and, in this design, each condition was replicated three times, totaling twelve runs. Although the effect of ionic strength was a factor to be considered, since the protein in dairy wastewater can be aggregated with high ionic strength [40,41], in this study, we did not consider it as a source of variation, since Zhang et al. [40] mention that this effect is more pronounced in water with an ionic strength greater than 0.4 M.
To verify the significance of these effect terms, an analysis of variance (ANOVA) was performed at a 5% probability. The optimum point for turbidity and COD removal in each design was obtained using the optimization function (maximizing turbidity and COD removal) and the desirability criterion. A regression model was presented for each response and in each statistical design. The Minitab 19 software was used in this step.
2.3. Jar Tests
Aiming an eco-friendly procedure, organic coagulants—polyacrylamide (PAM) (MTC 250 P Colina Química Nacional Ltda, Piracibaba, Brazil) and Tanfloc POP (TANAC S.A., Montenegro, Brazil)—were used in coagulation/flocculation. Organic coagulants generate biodegradable sludge in a smaller volume, eliminating the environmental liability produced by metallic salt coagulants. Coagulation/flocculation tests were performed in jar test equipment (Alfakit AT700, Alfa Tecnoquimica) using 2 L of SDW in each jar. On coagulation, rapid mixing at 200 rpm for 1 min was performed, followed by slow mixing at 30 rpm for 5 min. The coagulants were measured on a high precision analytical balance and the pH was adjusted by a pH meter (Q–400A, Quimis) with the addition of 1:2 v/v sodium hydroxide (97%, Vetec) or hydrochloric acid (36–38%, Vetec) solutions.
Dissolved air flotation was used to separate the formed flocs using a bench-scale floater (218 – 3Flow, Nova Ethics). The flotation system consisted of a compressor, a saturation chamber, and a flotation column. The saturation chamber was filled with tap water up to 2 L; then, air was injected into the lower part of the saturation chamber at a pressure of 8 bar for 2 min. After saturating the water with air, a needle valve located at the bottom of the chamber was opened and 20% of the volume (recirculation rate) of water saturated with air was injected into the flotation column containing SDW. The flotation time was 5 min, and after this time, 1 L of effluent was collected at the bottom of the flotation column to determine residual turbidity and COD.
2.4. Analytical Methods
Analytical determinations followed procedures described in Standard Methods for the Examination of Water and Wastewater [42]. A portable turbidimeter (Orion AO3010) was used for turbidity analysis. COD was determined by the colorimetric method using the closed reflux procedure. A spectrophotometer model 700 plus FEMTO was used at a wavelength of 600 nm in this analysis. The final values of removed turbidity and COD were corrected by a correction factor corresponding to 1.2 due to the recirculation ratio (20%), thus eliminating the sample dilution effect due to injection of saturated water into the SDW [32]. Equation (2) was used to calculate removed turbidity and COD.
where is removed turbidity (NTU) or COD (mg L−1); is initial turbidity (NTU) or COD (mg L−1); is final turbidity (NTU) or COD (mg L−1); and, RR is recirculation ratio (%).
3. Results and Discussion
3.1. Turbidity and COD Removal
Removed values of turbidity and COD from SDW using PAM and Tanfloc are shown in Table 3 and Table 4, respectively.
Since some points studied are repeated in both plans (dosage = 50.0 mg L−1 at pH 5.0, dosage = 50.0 mg L−1 at pH 9.0, dosage = 0.0 at pH 5.0 and dosage = 0.0 at pH 9.0), it is essential to compare the removal efficiencies obtained at the same point, common in both designs, in order to validate comparisons and avoid misinterpretation of results [32]. Thus, the coefficients of variation (CV) observed between designs for PAM and Tanfloc are shown in Table 5. Low CV values between designs were observed, which provides similarity to the results observed between designs at the same studied point and allows comparison of results between designs.
PAM and Tanfloc showed high efficiency on turbidity and COD removal from SDW. Greater removal efficiencies were observed with the highest dosages of coagulant (50 mg L−1), in both designs. The absence of coagulant revealed turbidity and COD removal efficiencies below 40% which is not satisfactory in terms of disposal of wastewater in water bodies, as under these conditions, SDW still has high levels of contaminants that will be harmful to the environment.
PAM has been efficient in removing turbidity and COD at the studied pH values. On the other hand, Tanfloc has been most effective at pH 5.00. As the medium became alkaline, Tanfloc became less efficient in removing turbidity and COD. This behavior can be attributed to the structural nature of the tannin-based flocculant, which is known to be denatured at alkaline pH [43]. Similar results were observed by other authors [44,45,46,47].
Addition of a center point in FFDCP allowed evaluation of the efficiency of coagulants at intermediate dosage (25 mg L−1) and neutral medium (pH 7.00). In this condition, PAM presented a mean efficiency of turbidity and COD removal of 88.2% and 59.4%, respectively; and Tanfloc presented a mean efficiency of turbidity and COD removal of 48.4% and 48.3%, respectively. The use of center point in statistical design allowed to show that PAM has a high turbidity removal efficiency at half the dosage that has been considered in FFD (50 mg L−1). Reducing the coagulant dosage directly implies reducing treatment costs and the amount of sludge generated and should be considered when optimizing the treatment system. In turn, we can note that Tanfloc had low turbidity and COD removal efficiency at the center point. The efficiency of Tanfloc, although dependent on dosage, is directly related to the pH of the medium, given the coagulation mechanism associated with this polymer [44], which will be discussed posteriorly.
3.2. Pareto Charts
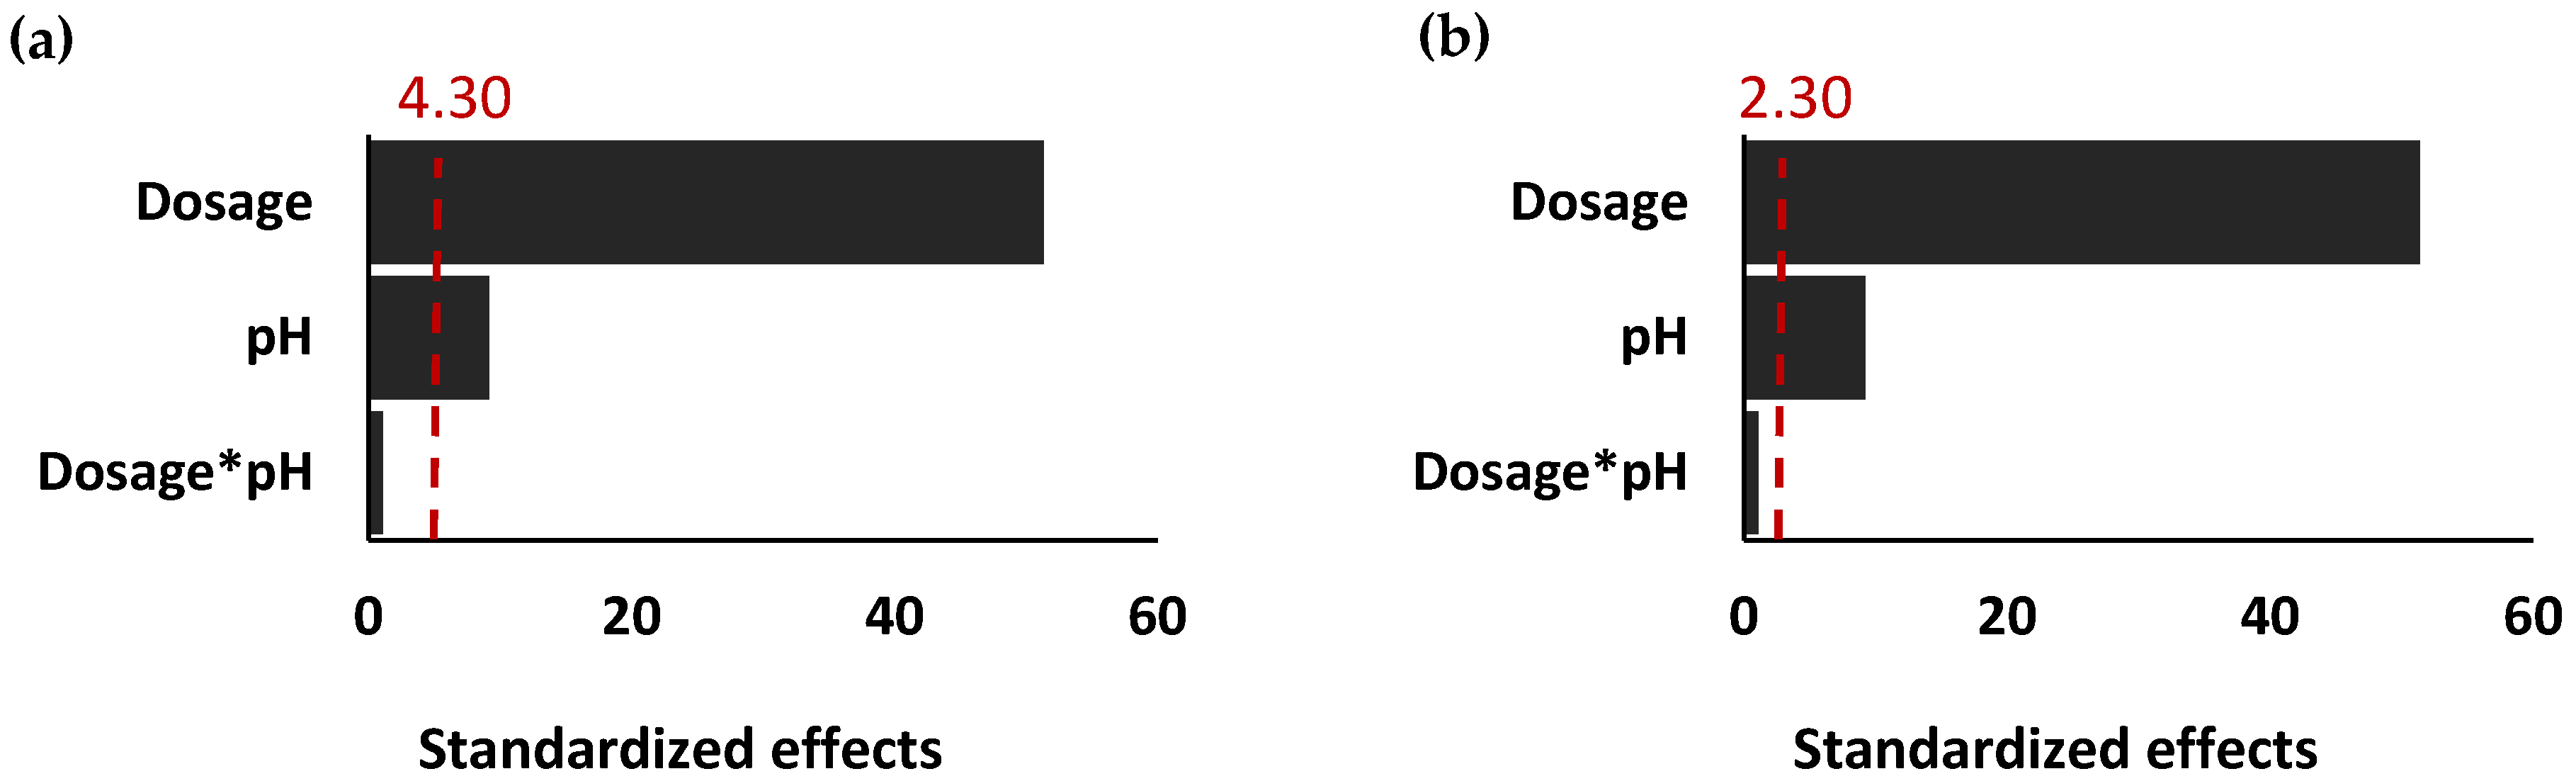
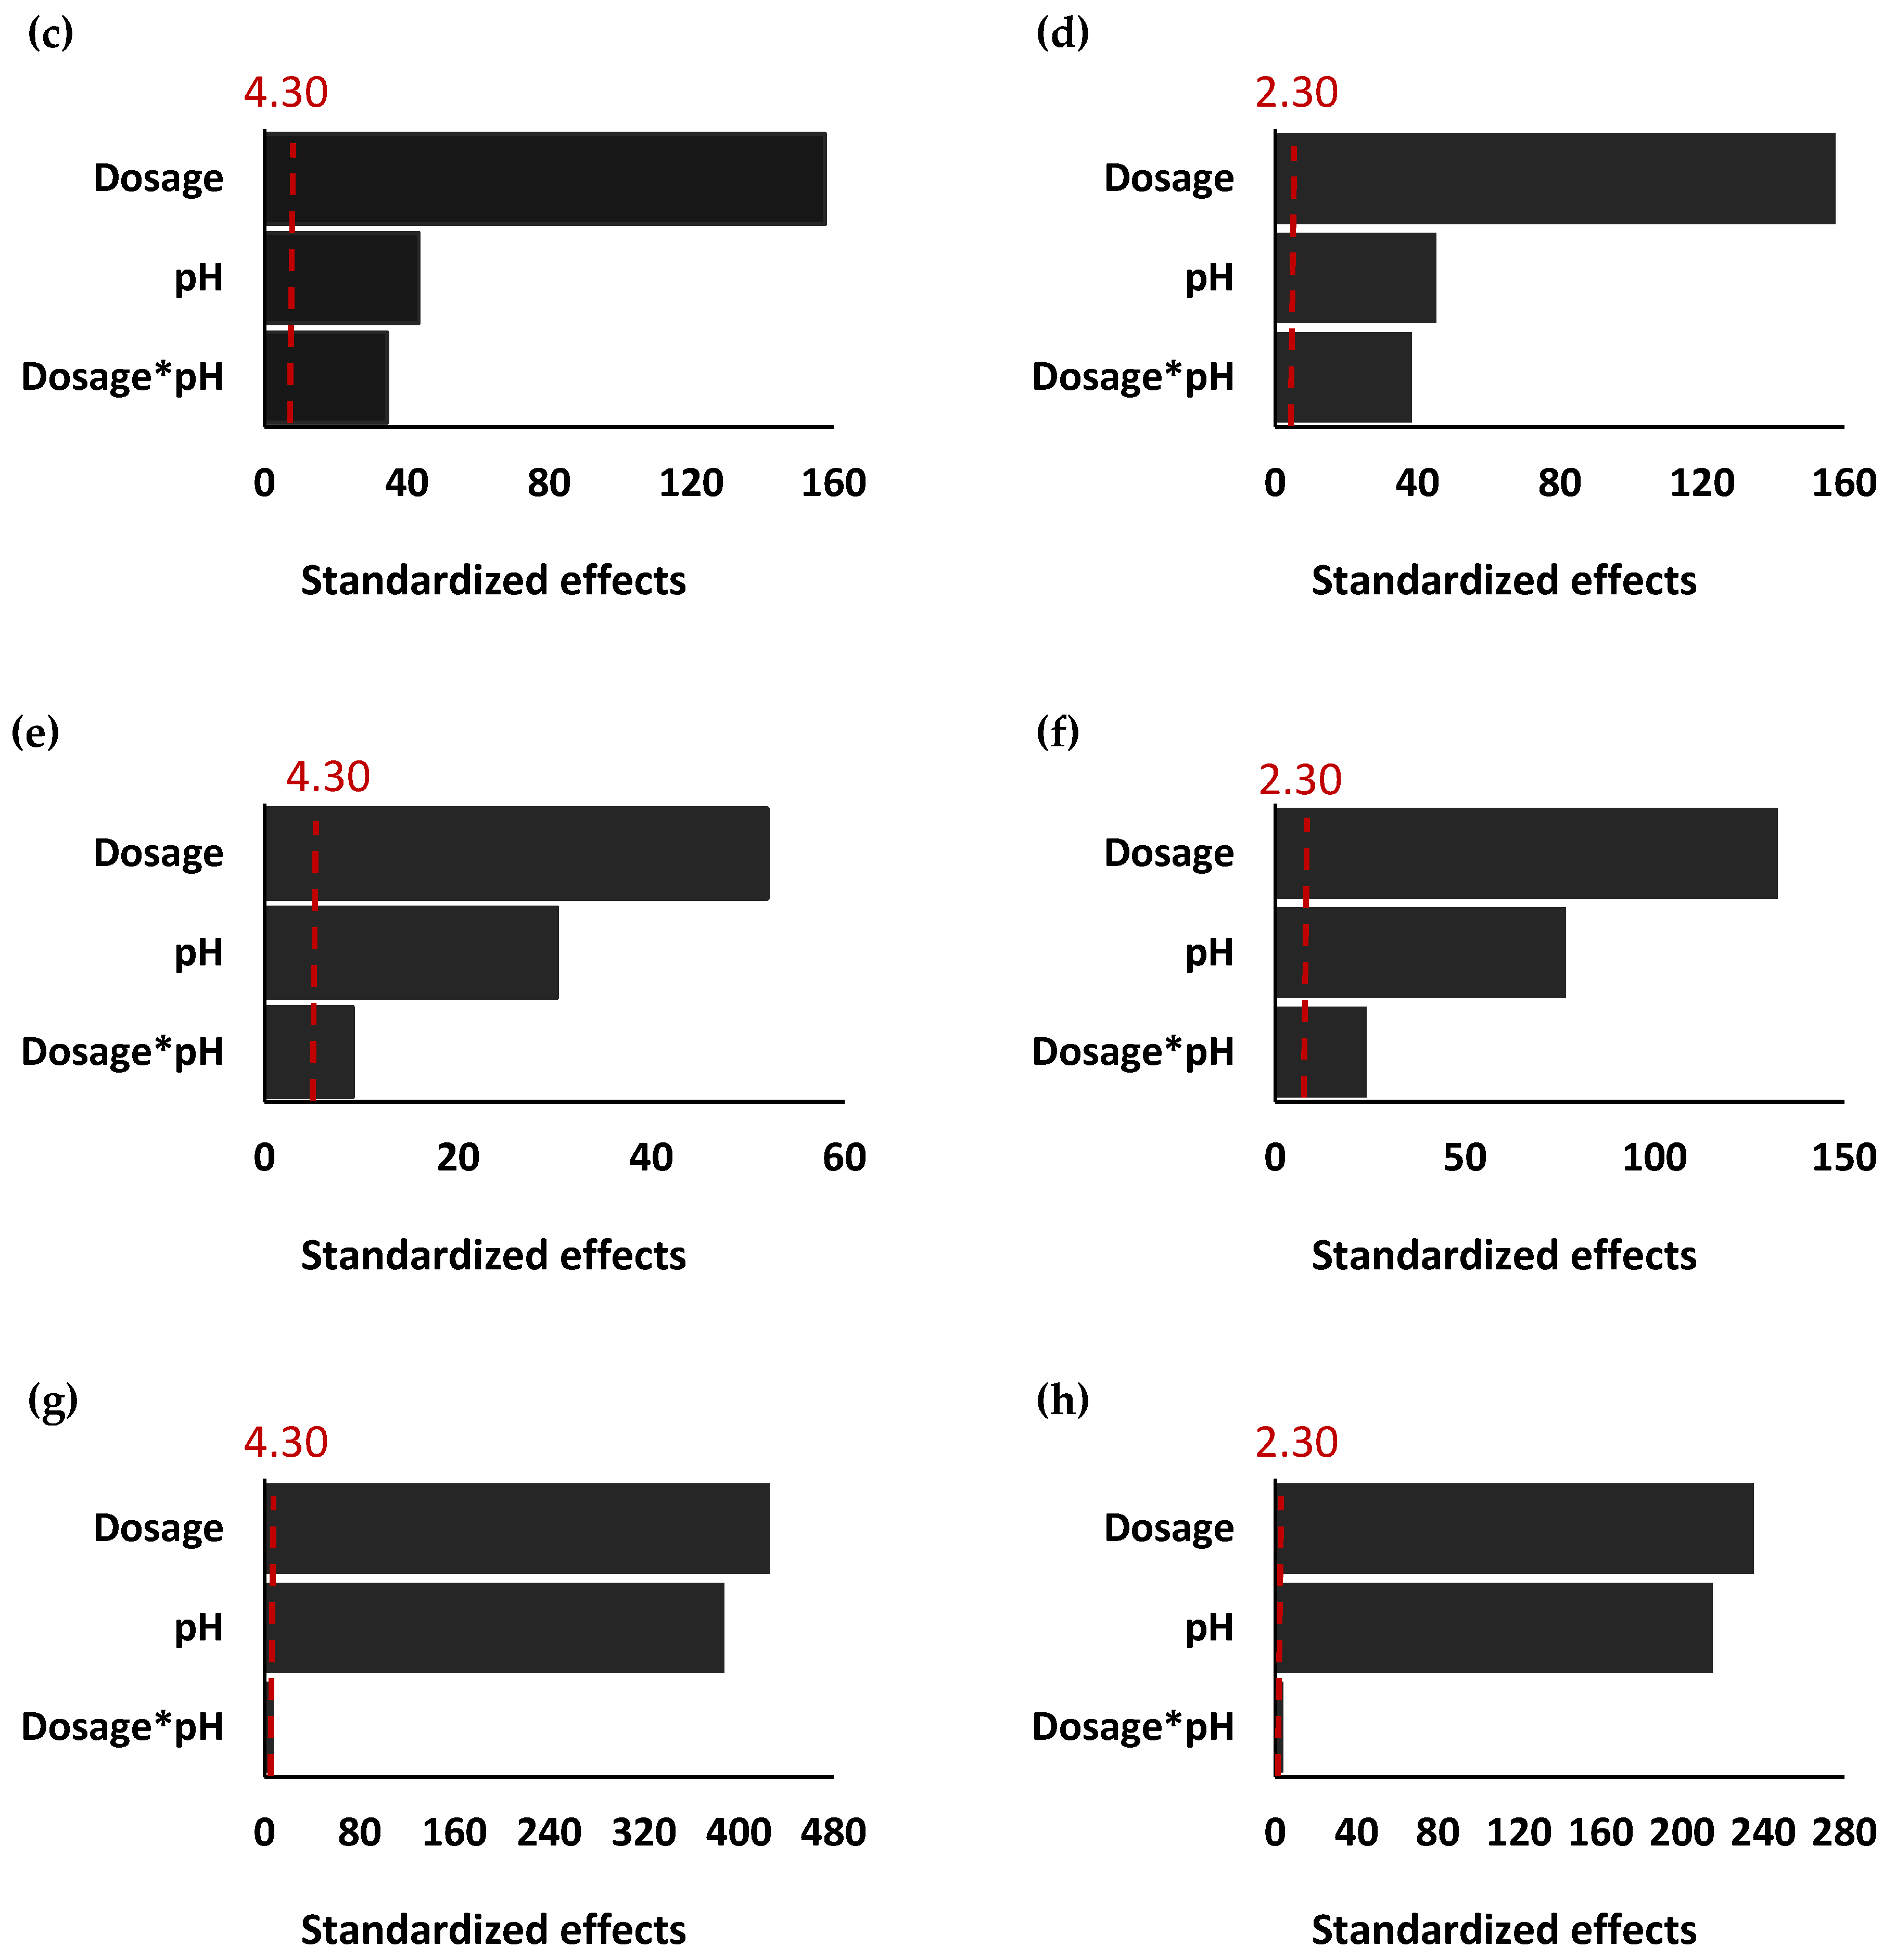
The Pareto Charts (Figure 1) shows the statistically relevant effect of each factor on response and is a practical way to visualize the results. The effects are classified from largest to smallest, and the effects corresponding to the bars that exceed the vertical line (which correspond to a p-value of 0.05) are considered statistically significant, with the length of the bars being proportional to the absolute value of the effects standardized [48,49].
According to p values (p ≤ 0.05 is significant) and t ratios, it can be shown that the main effects (dosage and pH) are highly significant, especially when Tanfloc was used (Figure 1e–h). Effect of dosage on turbidity and COD removal is the most important among the main effects for both coagulants. Similar results were also observed by Muniz et al. [32] and Pereira et al. [38]. Unlike Tanfloc, when PAM was used, we can observe that dosage*pH interaction has no significant effect (p > 0.05) on turbidity removal (Figure 1a,b), showing that the factors are independent, i.e., the behavior of PAM dosage is independent of pH variation on turbidity removal from SDW. In this case, the separate conclusions for the factors are valid [50]. This result was observed in the FFD and FFDCP, showing that both were efficient in identifying the factors that affect the removal of pollutants from wastewater. Furthermore, we can observe that both designs similarly estimated the absolute value of the standardized effects in all conditions studied, which provides greater reliability in choosing the appropriate statistical design.
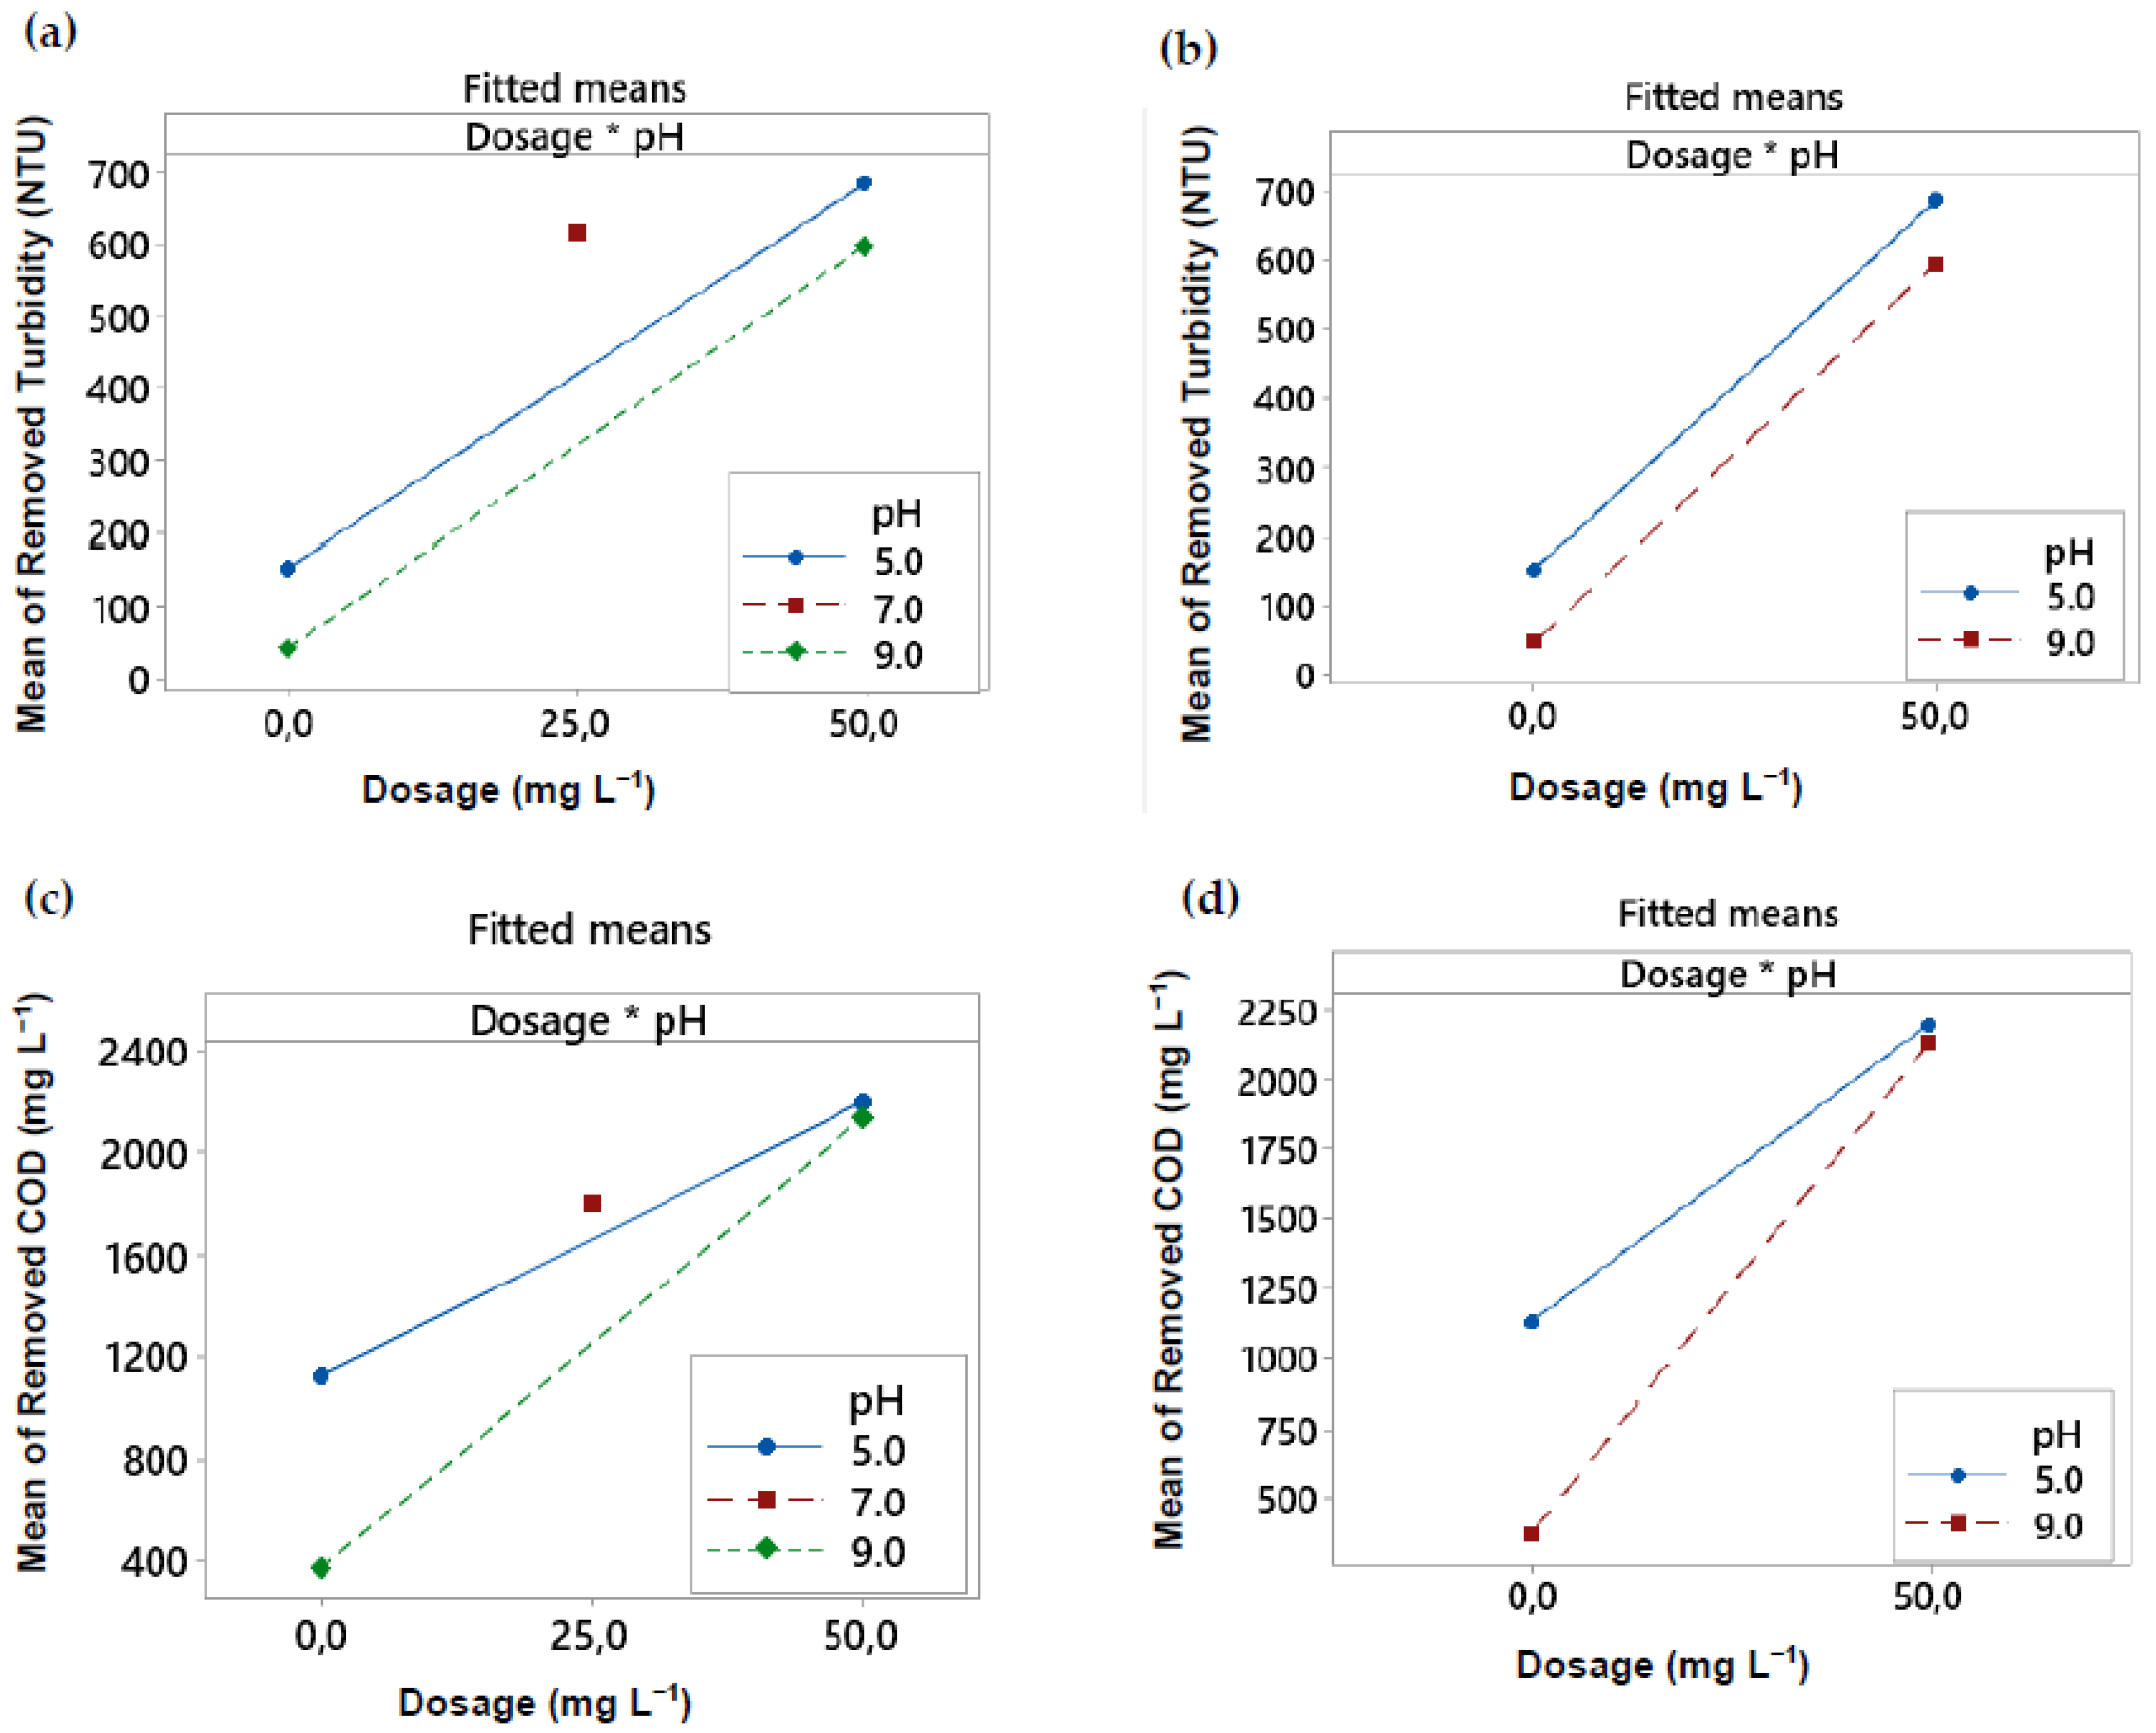
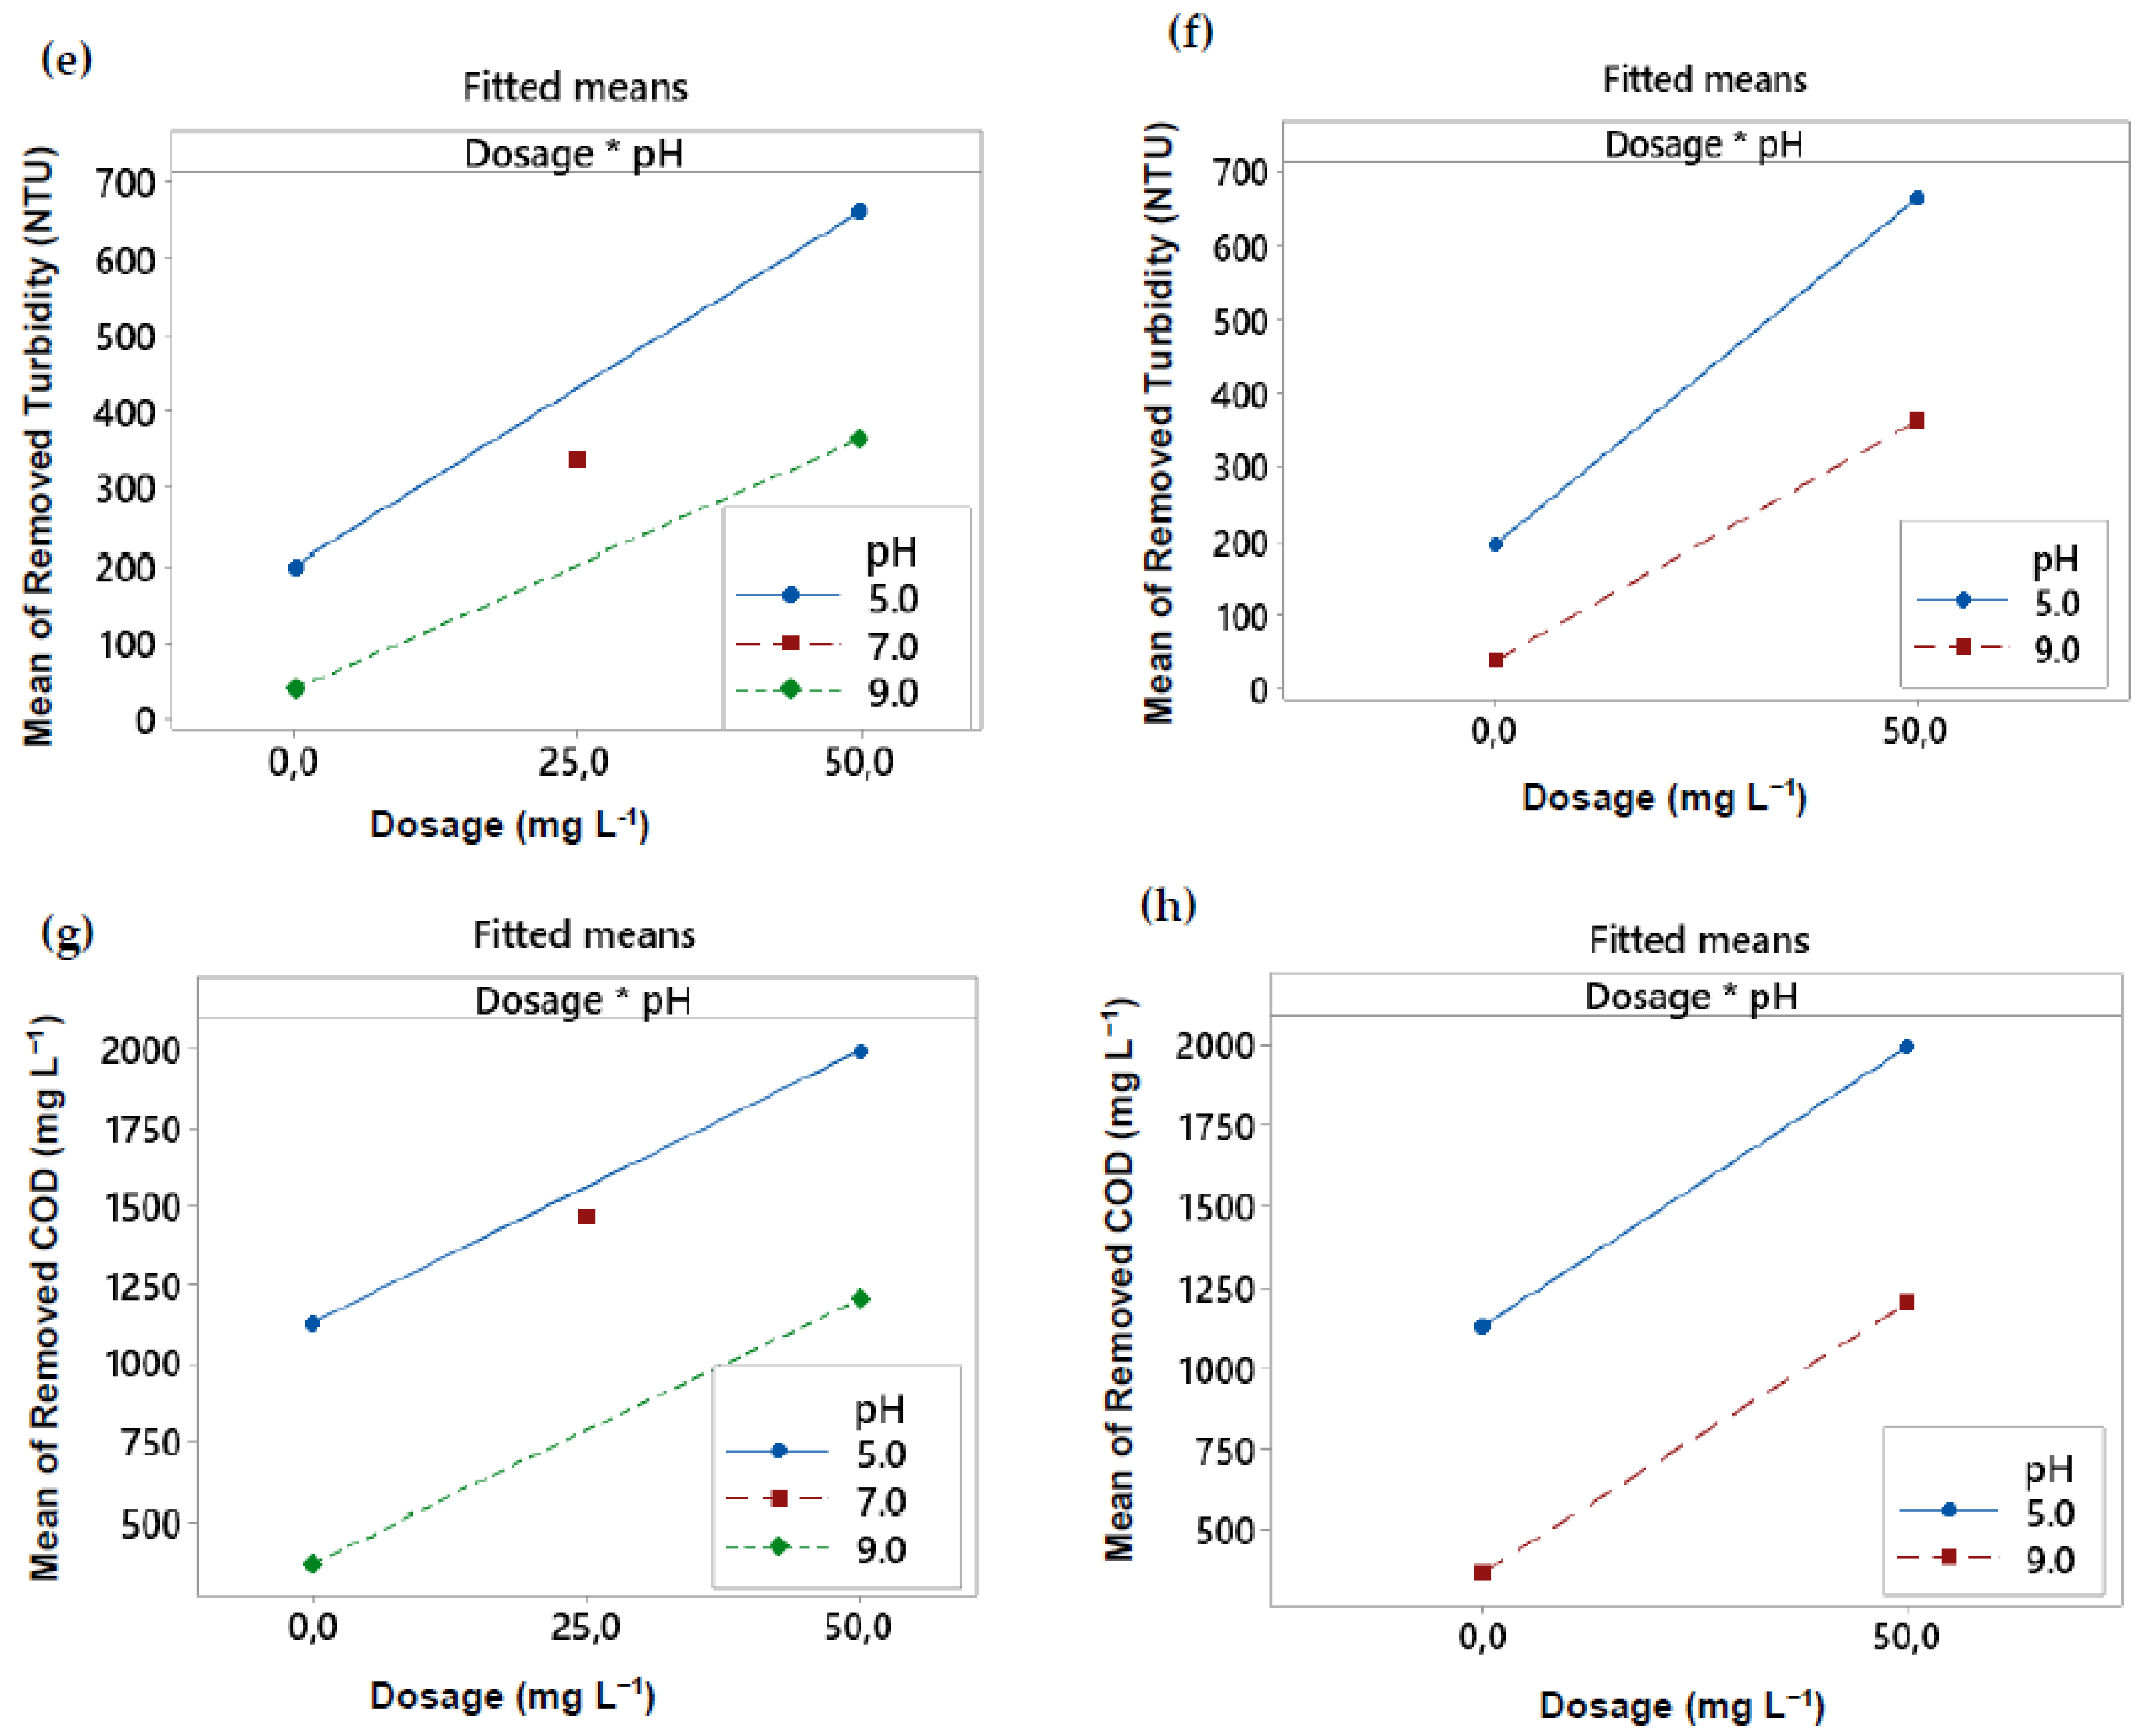
3.3. Interaction Effects
Figure 2 shows the graphs of the effects of the Dosage*pH interaction on the removal of turbidity and COD from SDW. Graphs of interaction effects describe the average variation of one factor as a function of the levels of the other factor. The interaction effects were similarly shown in both statistical designs, indicating their close agreement for data collection and analysis. In Figure 2a,b, it is shown that the effect caused by the increase in the dosage of PAM on turbidity removal is independent of the pH value, and the interaction between these factors is not significant (p > 0.05). Therefore, we can conclude that PAM is effective for turbidity removal in any pH range studied. The effectiveness of PAM on coagulation/flocculation over a wide pH range has also been reported in other studies [32,51,52,53,54] and can be explained in terms of PAM surface charges. In the studied pH range, similar results are reported in the literature. Ma et al. [51] evaluated the efficiency of PAM in removing color and turbidity from drinking water with a varying pH from 3.0 to 11.0. The authors reported removal efficiency above 70% with a dosage of 40 mg L−1 of coagulant. In the pH range between 6.0 and 8.0, the removal efficiencies observed were greater than 95%, reaching over 98% at pH 7.0. Removal efficiency decreased with a further increase in pH ranging from 8.0 to 11.0, which is in line with our results. At very acidic pH, i.e., close to 3.0, the efficiency of PAM decreases due to the fact that H+ would compete with the cationic flocculant, thus weakening the electrostatic attraction between the positively charged PAM and the negatively charged colloids in the water [51].
The effect of increasing the dosage of PAM and Tanfloc on COD removal is pH-dependent and was statistically significant (p ≤ 0.05) (Figure 2c,d,g,h), as well as the interaction effect on turbidity removal using Tanfloc (Figure 2e,f).
The dependence of the factors tested on the efficiency of coagulation/flocculation can be explained as a function of the predominant coagulation mechanisms under different pH conditions, reported for the coagulants used. For example, Ma et al. [51] mention that PAM removes pollutants from water through co-precipitation and charge neutralization, with the predominance of these mechanisms being pH-dependent. Thus, some mechanisms, such as charge neutralization and adsorption, can be more efficient when the pH value of the medium favors the action of the coagulant, especially when it has a predominantly cationic or anionic nature. Increases in coagulant dosage, while increasing the available sites for interaction with pollutants favoring flocculation, may also increase interaction with H+ or OH−, depending on pH, which would harm flocculation.
In the case of Tanfloc, which is a cationic coagulant, Hameed et al. [47] clarify that, at pH 7.00, it is expected that its efficiency will be reduced with a less than ideal coagulant dosage, because at pH 7.00, Tanfloc may not have sufficient charge for the neutralization of effluent charges to occur. Still, according to the authors, higher Tanfloc zeta potential values were observed at lower pH values, and increased whenever the dose of Tanfloc was increased. This can be justified due to charge neutralization, which confirms the cationic nature of Tanfloc.
The high dependence of pH*dosage on COD removal was also confirmed by Yang et al. [55]. These authors observed that the COD removal rate from waters with algal blooms significantly decreased (p ≤ 0.05) with increasing pH after flocculation. For example, the COD removal rate at pH 4.5 (41.9%) was higher than at pH 10.5 (21.4%). According to the authors, at pH 4.5 the positive charges of Tanfloc resulted in a larger hydrodynamic radius of Tanfloc due to electrostatic repulsion. Both the positive charges and the stretched forming structure of Tanfloc contributed to increasing removal efficiency and reducing optimal dosage [56]. The authors measured the zeta potential of the supernatant and found it to be close to zero when the optimal dosage of extracellular organic matter removal was reached; however, the zeta potential became the opposite with an overdose of Tanfloc. This indicated that charge neutralization was the main mechanism in acidic conditions. [55]. Negatively charged organic matter was attracted, neutralized, and coated by the positively charged Tanfloc. After being completely covered, the destabilized colloids, with almost zero surface charge, continuously aggregated to form large flocs [55].
3.4. ANOVA
The polynomial models (Table 6) that describe the turbidity and COD removal from SDW obtained in each design are presented in Equations (3)–(10) (in Table 6). In these equations, the positive and negative coefficients of the main effects show how the response changes in relation to these variables. The absolute value of a coefficient shows the effectiveness of the related effect [49].
The significance and goodness of fit of the models were assessed using analysis of variance (ANOVA), and the results are shown in Table 7 for PAM and Table 8 for Tanfloc. In FFDCP, we can observe the curvature as a source of variation. For a 2-level factorial design, if a design has center points, one degree of freedom is for the curvature test. If the term for center points is in the model, the line for curvature is part of the model. If the term for center points is not in the model, the line for curvature corresponds to the part of the error used to test terms that are in the model. The test examines the adjusted mean of the response at the midpoints against the expected mean if the relationships between the model terms and the response are linear [57,58]. If the p-value is less than or equal to the significance level, it is possible to conclude that at least one of the factors has a response curve relationship. In this case, it would be possible, for example, to add axial points to the design to model the curvature. If the p-value is greater than the significance level, it is not possible to conclude that any of the factors have a curved relationship with the response. If the curvature is part of the model, we can readjust the model without a term for the center points so that curvature is part of the error. In our study, we can observe that the curvature for removed turbidity using Tanfloc was non-significant (p > 0.05), so we cannot state that dosage and pH have a curved relationship with removed turbidity. Furthermore, in FFD, the dosage of PAM and Tanfloc and pH showed a significant curved relationship with removed turbidity and COD. The absence of curvature in the FFD implied a greater number of degrees of freedom for the error, which leads to better estimates of the experimental error.
Overall, ANOVA showed that all linear models and interactions (with exception of the turbidity removal interaction with PAM), have p-values less than 0.05, and were significantly different from zero at the 95% confidence level. High Fcal values also confirmed the significance of the generated models.
The quality of the models was assessed, and the results are shown in Table 9.
In Table 9, S represents the standard deviation of the distance between the data values and the adjusted values. S is measured in response units. The model summary revealed that the lowest R2 value was 99.94%, and the adjusted R2 value was 99.84%. Values of R2 close to 1 are desirable and it is necessary to have a reasonable agreement with the adjusted R2 [59]. R2 is a measure of the amount of variation around the mean explained by the model. The adjusted R2 compares the explanatory power of regression models that contain different numbers of predictors, so it is adjusted for the number of predictors in the model. It decreases as the number of terms in the model increases if these additional terms do not add value to the model [49]. The observed values of R2 and adjusted R2 indicate good accurate representations of the actual relationships between dosage and pH factors with removed turbidity and COD. Therefore, the models can be used if a moderately accurate model is needed. [60]. In FFD, it is also possible to calculate another indicator of model quality, which is the predicted R2. Predicted R2 indicates how well a regression model predicts responses to new observations. This statistic helps determine when the model fits the original data but is less able to produce valid predictions for the new observations. One of the main benefits of predicted R2 is that it can prevent the model from being overfitted. An overfitted model contains too many predictors and starts to model random noise [38].
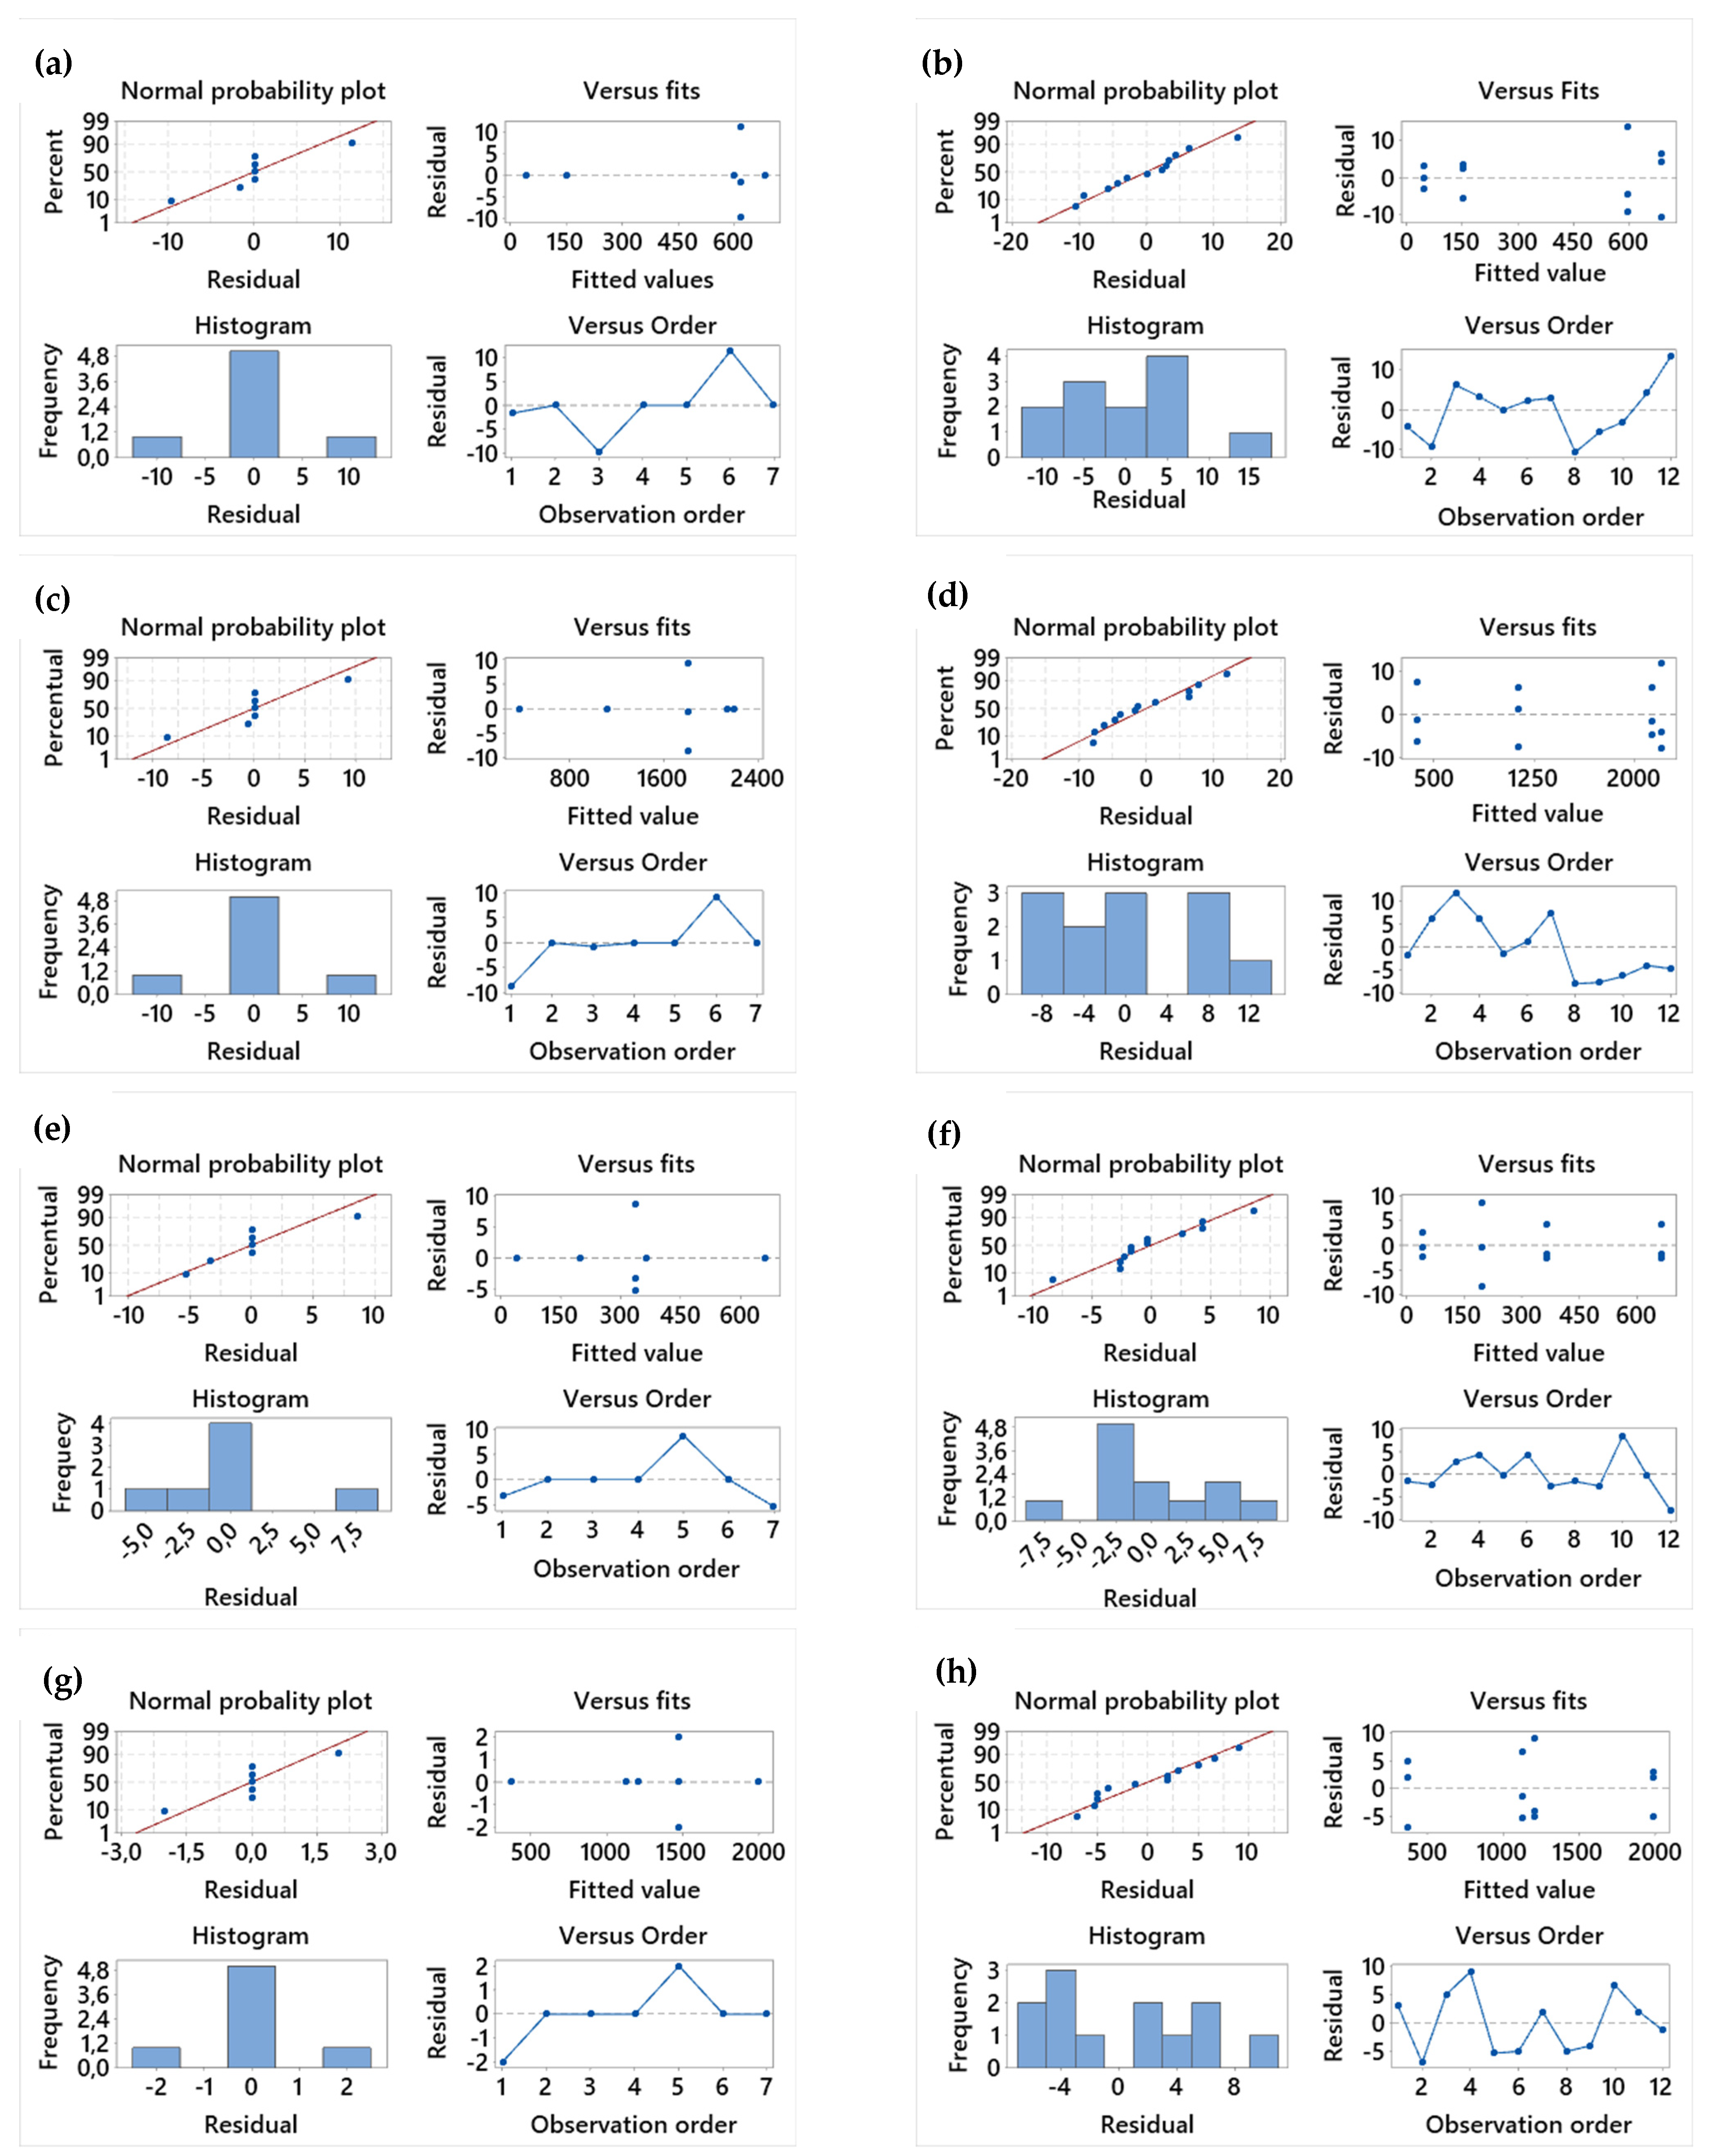
The residual plots of the models are shown in Figure 3.
Normal probability plots are used when it is important to obtain an independent estimate of the experimental error to judge the importance of the main and interaction effects [61]. This type of error comes from uncontrollable factors that produce a variation in the responses when performing the tests under pre-established conditions. Thus, the use of these plots is based on the fact that the main or interaction effects that are negligible are distributed according to a normal distribution centered on zero and with σ2 variance, that is, these effects tend to be concentrated along a normal line. in the graph, as seen in Figure 3.
Residual histograms were used to assess their dispersion and distribution, confirming the symmetry of the data [58]. In residual versus adjusted values plots, we have evidence regarding the behavior of the variance of the residuals in relation to the adjusted values. It was observed that the residuals have constant variance. The random distribution of residuals is a necessary requirement to confirm whether a mathematical model is suitable for the experimental data [62]. In residuals versus order plots, we obtained indications of independence between residuals. There was no systematic behavior in these plots, so we have evidence that no “extra” variable influenced the results, a fact that confirms the ANOVA results and the conclusions.
3.5. Determination of the Optimum Point
Response optimization helps to identify the combination of variable definitions that optimize a simple response or set of responses. From the models adjusted for each response, it was possible to use the Response Optimizer function, available in MINITAB 19 software, to look for the ideal responses to remove turbidity and COD. First, an individual desirability for each response and weight was calculated. Each variable can be assigned a different weight, according to its importance, in this case, we assign equal weight to turbidity and COD removal. This technique consists of converting each response variable into an individual desirability function (d) that varies in the range of 0–1.0. A value of 0 is assigned to predicted response variable values outside the region of interest, and a desirability value of 1.0 corresponds to the response variable when it is at its target [63]. Once the desirability functions (d) were specified for response removed turbidity and COD, these functions were incorporated into a single function called global desirability (D), which is normally obtained by the geometric mean of all individual desirability. An ideal solution occurs when the overall desirability is at its maximum. Thus, the optimal operating conditions for turbidity and COD removal for each coagulant were determined and are presented in Table 10. Using an optimization plot, it is possible to adjust variable definitions and determine how changes affect the response.
4. Conclusions
Experimental tests were performed to compare the full factorial design (FFD) and the full factorial design with center point (FFDCP) in the optimization of turbidity and COD removal from synthetic dairy wastewater (SDW) using polyacrylamide and (PAM) and Tanfloc. The results revealed the excellent performance of PAM and Tanfloc, mainly in an acidic medium (pH 5.0). Tanfloc had low removal efficiency of turbidity and COD at alkaline pH (9.0), which was attributed to its coagulation/flocculation mechanism. Both designs led to the same point considered optimal for removal of turbidity and COD from SDW (50 mg L−1 of coagulant at pH 5.0). In this condition, it was observed that PAM removed about 99% of turbidity and 72% of COD, while Tanfloc removed 96% of turbidity and 66% of COD from SDW. Regression models obtained in both statistical designs were significant (p ≤ 0.05) and useful in predicting turbidity and COD removal from SDW. Although 2-level factorial designs are unable to fully explore a vast region in the factor space, they have provided useful information for a relatively small number of trials per factor. With the 2-level factorial experiments, it was possible to identify important trends in the optimization process, suggesting the importance of using them to provide guidance for further experimentation.
The addition of central points with replicas in the factorial experiment allowed us to obtain the estimate of the experimental error with a smaller number of runs, allowing time and cost of the experimental runs. The addition of center points did not affect the estimates of the factor effects and it was possible to verify the effect of curvature, allowing obtaining information on the factors at intermediate levels, being indicated in the screening tests. In this case, it is noteworthy that the effect of only two variables was studied, with three or more variables the difference in the number of runs increases too much, and the use of FFD is not recommended.
Author Contributions
Conceive and design the study, G.L.M., M.d.S.P., and A.C.B.; perform the experiments, collect the data, analyze the results, and write the original manuscript draft, G.L.M.; contribution to the results interpretation and elaboration of the final manuscript, M.d.S.P. supervise the research work and contribute to the interpretation of the results and manuscript revision, A.C.B.; All authors have read and agreed to the published version of the manuscript.
Funding
This research was funded by the Coordination for the Improvement of Higher Education Personnel (CAPES Finance Code 001) and by the National Council for Scientific and Technological Development (CNPq grant # 131525/2016-6).
Institutional Review Board Statement
Not applicable.
Informed Consent Statement
Not applicable.
Data Availability Statement
All data obtained in this research were published in tables in the article.
Conflicts of Interest
The authors declare no conflict of interest.
References
- Sharma, S.; Aygun, A.; Simsek, H. Electrochemical treatment of sunflower oil refinery wastewater and optimization of the parameters using response surface methodology. Chemosphere 2020, 249, 126511. [Google Scholar] [CrossRef]
- Ibrahim, A.; Yaser, A.Z.; Lamaming, J. Synthesising tannin-based coagulants for water and wastewater application: A review. J. Environ. Chem. Eng. 2021, 9, 105007. [Google Scholar] [CrossRef]
- Elazzouzi, M.; Haboubi, K.; Elyoubi, M.; El Kasmi, A. Development of a novel electrocoagulation anode for real urban wastewater treatment: Experimental and modeling study to optimize operative conditions. Arab. J. Chem. 2021, 14, 102912. [Google Scholar] [CrossRef]
- Tanimu, A.; Jillani, S.M.S.; Ganiyu, S.A.; Chowdhury, S.; Alhooshani, K. Multivariate optimization of chlorinated hydrocarbons’ micro-solid-phase extraction from wastewater using germania-decorated mesoporous alumina-silica sorbent and analysis by GC-MS. Microchem. J. 2020, 160, 105674. [Google Scholar] [CrossRef]
- Rahimi, M.; Pourmortazavi, S.M.; Zandavar, H.; Mirsadeghi, S. Recyclable methodology over bimetallic zero-valent Mg: Zn composition for hexavalent chromium remediation via batch and flow systems in industrial wastewater: An experimental design. J. Mater. Res. Technol. 2021, 11, 1–18. [Google Scholar] [CrossRef]
- Belgada, A.; Charik, F.Z.; Achiou, B.; Kambuyi, T.N.; Younssi, S.A.; Beniazza, R.; Dani, A.; Benhida, R.; Ouammou, M. Optimization of phosphate/kaolinite microfiltration membrane using Box–Behnken design for treatment of industrial wastewater. J. Environ. Chem. Eng. 2021, 9, 104972. [Google Scholar] [CrossRef]
- Abdulsalam, K.A.; Giwa, A.-R.A.; Adelowo, J.M. Optimization studies for decolourization of textile wastewater using a sawdust-based adsorbent. Chem. Data Collect. 2020, 27, 100400. [Google Scholar] [CrossRef]
- Kumar, V.; Al-Gheethi, A.; Asharuddin, S.M.; Othman, N. Potential of cassava peels as a sustainable coagulant aid for institutional wastewater treatment: Characterisation, optimisation and techno-economic analysis. Chem. Eng. J. 2020, 127642, 127642. [Google Scholar] [CrossRef]
- Trinh, T.K.; Kang, L.S. Response surface methodological approach to optimize the coagulation–flocculation process in drinking water treatment. Chem. Eng. Res. Des. 2011, 89, 1126–1135. [Google Scholar] [CrossRef]
- Hamidi, D.; Fard, M.B.; Yetilmezsoy, K.; Alavi, J.; Zarei, H. Application of Orchis mascula tuber starch as a natural coagulant for oily-saline wastewater treatment: Modeling and optimization by multivariate adaptive regression splines method and response surface methodology. J. Environ. Chem. Eng. 2021, 9, 104745. [Google Scholar] [CrossRef]
- Le, T.M.K.; Mäkelä, M.; Schreithofer, N.; Dahl, O. A multivariate approach for evaluation and monitoring of water quality in mining and minerals processing industry. Miner. Eng. 2020, 157, 106582. [Google Scholar] [CrossRef]
- Shahabadi, S.M.S.; Reyhani, A. Optimization of operating conditions in ultrafiltration process for produced water treatment via the full factorial design methodology. Sep. Purif. Technol. 2014, 132, 50–61. [Google Scholar] [CrossRef]
- Badr, N.B.; Al-Qahtani, K.M.; Mahmoud, A.E.D. Factorial experimental design for optimizing selenium sorption on Cyperus laevigatus biomass and green-synthesized nano-silver. Alex. Eng. J. 2020, 59, 5219–5229. [Google Scholar] [CrossRef]
- Heiderscheidt, E.; Leiviska, T.; Kløve, B. Chemical treatment response to variations in non-point pollution water quality: Results of a factorial design experiment. J. Environ. Manag. 2015, 150, 164–172. [Google Scholar] [CrossRef] [PubMed]
- Rahimpour, M.; Taghvaei, H. Degradation of crystal violet in water solution using post discharge DBD plasma treatment: Factorial design experiment and modeling. Chemosphere 2019, 232, 213–223. [Google Scholar] [CrossRef] [PubMed]
- Teofilo, R.; Ferreira, M.M.C. Quimiometria II: Planilhas eletrônicas para cálculos de planejamentos experimentais, um tutorial. Química Nova 2006, 29, 338–350. [Google Scholar] [CrossRef]
- El Atrache, L.L.; Ben Sghaier, R.; Kefi, B.B.; Haldys, V.; Dachraoui, M.; Tortajada, J. Factorial design optimization of experimental variables in preconcentration of carbamates pesticides in water samples using solid phase extraction and liquid chromatography–electrospray-mass spectrometry determination. Talanta 2013, 117, 392–398. [Google Scholar] [CrossRef]
- Da Rocha, F.; Vale, N.M.D.; Barili, L.D.; Coimbra, J.L.M.; Guidolin, A.F.; Bertoldo, J.G. An approach to the decomposition of interaction in a factorial experiment with five factors. Acta Sci. Agron. 2012, 34, 51–59. [Google Scholar] [CrossRef] [Green Version]
- Chastain, T.G. Biological principles of seed production. In The Art and Science of Seed Production in the Pacific Northwest; Cambridge Scholars Publishing: Cambridge, UK, 2003; pp. 12–34. ISBN 9788578110796. [Google Scholar]
- Ji, S.; Ma, W.; Wei, Q.; Zhang, W.; Jiang, F.; Chen, J. Integrated ABR and UASB system for dairy wastewater treatment: Engineering design and practice. Sci. Total. Environ. 2020, 749, 142267. [Google Scholar] [CrossRef]
- Sandoval, M.A.; Salazar, R. Electrochemical treatment of slaughterhouse and dairy wastewater: Toward making a sustainable process. Curr. Opin. Electrochem. 2021, 26, 100662. [Google Scholar] [CrossRef]
- Gogoi, M.; Biswas, T.; Biswal, P.; Saha, T.; Modak, A.; Gantayet, L.M.; Nath, R.; Mukherjee, I.; Thakur, A.R.; Sudarshan, M.; et al. A novel strategy for microbial conversion of dairy wastewater into biofertilizer. J. Clean. Prod. 2021, 293, 126051. [Google Scholar] [CrossRef]
- Muniz, G.L.; da Silva, T.C.F.; Borges, A.C. Assessment and optimization of the use of a novel natural coagulant (Guazuma ulmifolia) for dairy wastewater treatment. Sci. Total. Environ. 2020, 744, 140864. [Google Scholar] [CrossRef] [PubMed]
- Tahri, M.; Bounakhla, M.; Zghaïd, M.; Noack, Y.; Benyaïch, F.; Benchrif, A. Ambiente e Agua-An Interdisciplinary Journal of Applied Science. Ambient. e Agua-Interdiscip. J. Appl. Sci. 2016, 15, 1–14. [Google Scholar] [CrossRef]
- Sivaprakasam, S.; Balaji, K. A review of upflow anaerobic sludge fixed film (UASFF) reactor for treatment of dairy wastewater. Mater. Today Proc. 2021, 43, 1879–1883. [Google Scholar] [CrossRef]
- Santos, A.D.; Martins, R.C.; Quinta-Ferreira, R.M.; Castro, L.M. Moving bed biofilm reactor (MBBR) for dairy wastewater treatment. Energy Rep. 2020, 6, 340–344. [Google Scholar] [CrossRef]
- Chakchouk, I.; Elloumi, N.; Belaid, C.; Mseddi, S.; Chaari, L.; Kallel, M. A Combined Electrocoagulation-Electrooxidation Treatment for Dairy Wastewater. Braz. J. Chem. Eng. 2017, 34, 109–117. [Google Scholar] [CrossRef]
- Heiderscheidt, E.; Tesfamariam, A.; Pulkkinen, J.; Vielma, J.; Ronkanen, A.-K. Solids management in freshwater-recirculating aquaculture systems: Effectivity of inorganic and organic coagulants and the impact of operating parameters. Sci. Total. Environ. 2020, 742, 140398. [Google Scholar] [CrossRef]
- Dayarathne, H.; Angove, M.J.; Aryal, R.; Abuel-Naga, H.; Mainali, B. Removal of natural organic matter from source water: Review on coagulants, dual coagulation, alternative coagulants, and mechanisms. J. Water Process. Eng. 2021, 40, 101820. [Google Scholar] [CrossRef]
- Agarwal, P.; Saini, G. Use of natural coagulants (Moringa oleifera and Benincasa hispida) for volume reduction of waste drilling slurries. Mater. Today Proc. 2021. [Google Scholar] [CrossRef]
- Wang, H.-F.; Hu, H.; Wang, H.-J.; Zeng, R.J. Combined use of inorganic coagulants and cationic polyacrylamide for enhancing dewaterability of sewage sludge. J. Clean. Prod. 2019, 211, 387–395. [Google Scholar] [CrossRef]
- Muniz, G.L.; Borges, A.; Souza, D.V.; Da Silva, T.C.F.; Batista, R.O. Comparison of the Central Composite Rotatable Design with Doehlert Matrix on the Optimization of the Synthetic Dairy Effluent Treatment. Water, Air, Soil Pollut. 2018, 229, 306. [Google Scholar] [CrossRef]
- Vijayaraghavan, G.; Sivakumar, T.; Kumar, A.V. Application of plant based coagulants for waste water treatment. Int. J. Adv. Eng. Res. Stud. 2011, 1, 88–92. [Google Scholar]
- Dos Santos, J.D.; Veit, M.; Juchen, P.T.; Gonçalves, G.D.C.; Palácio, S.M.; Fagundes-Klen, M. Use of different coagulants for cassava processing wastewater treatment. J. Environ. Chem. Eng. 2018, 6, 1821–1827. [Google Scholar] [CrossRef]
- Brião, V.B.; Salla, A.C.V.; Miorando, T.; Hemkemeier, M.; Favaretto, D.P.C. Water recovery from dairy rinse water by reverse osmosis: Giving value to water and milk solids. Resour. Conserv. Recycl. 2019, 140, 313–323. [Google Scholar] [CrossRef]
- Muniz, G.L.; Borges, A.C.; Da Silva, T.C.F.; Batista, R.O.; De Castro, S.R. Chemically enhanced primary treatment of dairy wastewater using chitosan obtained from shrimp wastes: Optimization using a Doehlert matrix design. Environ. Technol. 2020, 2020, 1–18. [Google Scholar] [CrossRef] [PubMed]
- Pereira, M.D.S.; Borges, A.C.; Heleno, F.F.; Squillace, L.F.A.; Faroni, L.R.D. Treatment of synthetic milk industry wastewater using batch dissolved air flotation. J. Clean. Prod. 2018, 189, 729–737. [Google Scholar] [CrossRef]
- Pereira, M.D.S.; Borges, A.C.; Muniz, G.L.; Heleno, F.F.; Faroni, L.R.D. Dissolved air flotation optimization for treatment of dairy effluents with organic coagulants. J. Water Process. Eng. 2020, 36, 101270. [Google Scholar] [CrossRef]
- Brião, V.B.; Tavares, C.R.G.; Favaretto, D.P.C.; Hemkemeier, M. Ultrafiltração de Efluente Modelo E Efluente Industrial de Laticínios. Rev. CIATEC-UPF 2015, 7, 1. [Google Scholar] [CrossRef]
- Zhang, Z.; Dalgleish, D.; Goff, H.D. Effect of pH and ionic strength on competitive protein adsorption to air/water interfaces in aqueous foams made with mixed milk proteins. Colloids Surfaces B Biointerfaces 2004, 34, 113–121. [Google Scholar] [CrossRef]
- Mohebrad, B.; Rezaee, A.; Sohrabi, B. Effect of isoelectric point on cheese whey wastewater treatment using a microbial electrochemical system. Bioelectrochemistry 2018, 130, 107200. [Google Scholar] [CrossRef]
- APHA. Standard Methods for The Examination of Water & Wastewater; APHA: Washington, USA, 2017. [Google Scholar]
- Sánchez-Martín, J.; González-Velasco, M.; Beltran-Heredia, J. Acacia mearnsii de Wild Tannin-Based Flocculant in Surface Water Treatment. J. Wood Chem. Technol. 2009, 29, 119–135. [Google Scholar] [CrossRef]
- Beltran-Heredia, J.; Sanchez-Martin, J. Municipal wastewater treatment by modified tannin flocculant agent. Desalination 2009, 249, 353–358. [Google Scholar] [CrossRef]
- Sánchez-Martín, J.; Beltran-Heredia, J.; Solera-Hernández, C. Surface water and wastewater treatment using a new tannin-based coagulant. Pilot plant trials. J. Environ. Manag. 2010, 91, 2051–2058. [Google Scholar] [CrossRef] [PubMed]
- Hameed, Y.T.; Idris, A.; Hussain, S.A.; Abdullah, N.; Man, H.C.; Suja, F. A tannin–based agent for coagulation and flocculation of municipal wastewater as a pretreatment for biofilm process. J. Clean. Prod. 2018, 182, 198–205. [Google Scholar] [CrossRef]
- Hameed, Y.T.; Idris, A.; Hussain, S.A.; Abdullah, N. A tannin-based agent for coagulation and flocculation of municipal wastewater: Chemical composition, performance assessment compared to Polyaluminum chloride, and application in a pilot plant. J. Environ. Manag. 2016, 184, 494–503. [Google Scholar] [CrossRef] [PubMed]
- Cristóvão, R.; Gonçalves, C.; Botelho, C.; Martins, R.J.; Loureiro, J.; Boaventura, R. Fish canning wastewater treatment by activated sludge: Application of factorial design optimization. Water Resour. Ind. 2015, 10, 29–38. [Google Scholar] [CrossRef] [Green Version]
- Asadollahzadeh, M.; Tavakoli, H.; Torab-Mostaedi, M.; Hosseini, G.; Hemmati, A. Response surface methodology based on central composite design as a chemometric tool for optimization of dispersive-solidification liquid–liquid microextraction for speciation of inorganic arsenic in environmental water samples. Talanta 2014, 123, 25–31. [Google Scholar] [CrossRef]
- Perecin, D.; Filho, A.C. Efeitos por comparações e por experimento em interações de experimentos fatoriais. Ciência e Agrotecnologia 2008, 32, 68–72. [Google Scholar] [CrossRef] [Green Version]
- Ma, J.; Wang, R.; Wang, X.; Zhang, H.; Zhu, B.; Lian, L.; Lou, D. Drinking water treatment by stepwise flocculation using polysilicate aluminum magnesium and cationic polyacrylamide. J. Environ. Chem. Eng. 2019, 7, 103049. [Google Scholar] [CrossRef]
- Shu, G.; Bu, K.; Zhao, B.; Zheng, S. Evaluation of newly developed reverse demulsifiers and cationic polyacrylamide flocculants for efficient treatment of oily produced water. Colloids Surfaces A Physicochem. Eng. Asp. 2021, 610, 125646. [Google Scholar] [CrossRef]
- Yang, Z.; Yuan, B.; Huang, X.; Zhou, J.; Cai, J.; Yang, H.; Li, A.; Cheng, R. Evaluation of the flocculation performance of carboxymethyl chitosan-graft-polyacrylamide, a novel amphoteric chemically bonded composite flocculant. Water Res. 2012, 46, 107–114. [Google Scholar] [CrossRef]
- Sen, G.; Kumar, R.; Ghosh, S.; Pal, S. A novel polymeric flocculant based on polyacrylamide grafted carboxymethylstarch. Carbohydr. Polym. 2009, 77, 822–831. [Google Scholar] [CrossRef]
- Yang, Z.; Hou, J.; Miao, L.; Yang, Y.; You, G.; Jia, D.; Gao, M. Removing specific extracellular organic matter from algal bloom water by Tanfloc flocculation: Performance and mechanisms. Sep. Purif. Technol. 2019, 212, 65–74. [Google Scholar] [CrossRef]
- Yang, Z.; Wu, H.; Yuan, B.; Huang, M.; Yang, H.; Li, A.; Bai, J.; Cheng, R. Synthesis of amphoteric starch-based grafting flocculants for flocculation of both positively and negatively charged colloidal contaminants from water. Chem. Eng. J. 2014, 244, 209–217. [Google Scholar] [CrossRef]
- Barros, N.B.; Scarminio, I.S.; Bruns, R.E. Como Fazer Experimentos: Pesquisa e Desenvolvimento Na Ciência e Na Indústria, 3rd ed.; UNICAMP: Campinas, Brazil, 2007; ISBN 978-85-268-0753-2. [Google Scholar]
- Montgomery, D.C. Applications of design of experiments in engineering. Qual. Reliab. Eng. Int. 2008, 24, 501–502. [Google Scholar] [CrossRef]
- Kania, D.; Yunus, R.; Omar, R.; Rashid, S.A.; Jan, B.M. Rheological investigation of synthetic-based drilling fluid containing non-ionic surfactant pentaerythritol ester using full factorial design. Colloids Surf. A Physicochem. Eng. Asp. 2021, 625, 126700. [Google Scholar] [CrossRef]
- Shojaeimehr, T.; Rahimpour, F.; Khadivi, M.A.; Sadeghi, M. A modeling study by response surface methodology (RSM) and artificial neural network (ANN) on Cu2+ adsorption optimization using light expended clay aggregate (LECA). J. Ind. Eng. Chem. 2014, 20, 870–880. [Google Scholar] [CrossRef]
- Devor, R.E.; Chang, T.-H.; Sutherland, J.W. Statistical Quality Design and Control: Contemporary Concepts and Methods; Prentice Hall: New Jersey, NJ, USA, 2006. [Google Scholar]
- Coelho, T.L.S.; Braga, F.M.S.; Silva, N.M.C.; Dantas, C.; Júnior, C.A.L.; Sousa, S.; Vieira, E.C. Optimization of the protein extraction method of goat meat using factorial design and response surface methodology. Food Chem. 2018, 281, 63–70. [Google Scholar] [CrossRef] [PubMed]
- Berrocal, C.; Chico, H.; Carranza, E.; Vega, R. Desirability function for optimization of the synthesis of high-panose isomaltooligosaccharides from maltose catalyzed by a novel commercial enzyme preparation from Aspergillus niger. Biochem. Eng. J. 2021, 171, 108003. [Google Scholar] [CrossRef]
Figure 1.
Standardized effects of factors on turbidity and COD removal when PAM (a–d) and Tanfloc (e–h) were applied. (a) Turbidity removal with PAM in FFDCP; (b) turbidity removal with PAM in FFD; (c) COD removal with PAM in FFDCP; (d) COD removal with PAM in FFD; (e) turbidity removal with Tanfloc in FFDCP; (f) turbidity removal with Tanfloc in FFD; (g) COD removal with Tanfloc in FFDCP; (h) COD removal with Tanfloc in FFD.


Figure 2.
Dosage*pH interaction effects on turbidity and COD removal using PAM and Tanfloc. (a) turbidity removal with PAM in FFDCP; (b) turbidity removal with PAM in FFD; (c) COD removal with PAM in FFDCP; (d) COD removal with PAM in FFD; (e) turbidity removal with Tanfloc in FFDCP; (f) turbidity removal with Tanfloc in FFD; (g) COD removal with Tanfloc in FFDCP; (h) COD removal with Tanfloc in FFD.


Figure 3.
Residual plots of (a) turbidity removal with PAM in FFDCP; (b) turbidity removal with PAM in FFD; (c) COD removal with PAM in FFDCP; (d) COD removal with PAM in FFD; (e) turbidity removal with Tanfloc in FFDCP; (f) turbidity removal with Tanfloc in FFD; (g) COD removal with Tanfloc in FFDCP; (h) COD removal with Tanfloc in FFD.


Table 1.
Raw wastewater characteristic data.
| Parameter | Value |
|---|---|
| Turbidity (NTU) | 698.0 ± 9.4 |
| pH (dimensionless) | 7.5 ± 0.1 |
| COD 1 (mg L−1) | 3037.5 ± 20.0 |
| BOD 2 (mg L−1) | 1283.0 ± 27.0 |
| UV254 (cm−1) | 1.119 ± 0.2 |
1 COD—chemical oxygen demand; 2 BOD—biochemical oxygen demand.
Table 2.
Levels of the factors used in the factorial designs.
| Experimental Design | Factors | Levels | ||
|---|---|---|---|---|
| −1 | 0 | +1 | ||
| FFDCP | Coagulant dosage (mg L−1) | 0 | 25.0 | 50.0 |
| pH | 5.0 | 7.0 | 9.0 | |
| FFD | Coagulant dosage (mg L−1) | 0 | - | 50.0 |
| pH | 5.0 | - | 9.0 | |
Table 3.
Experimental matrix and removed turbidity and COD values, followed by removal efficiency, using PAM.
Table 3.
Experimental matrix and removed turbidity and COD values, followed by removal efficiency, using PAM.
| Design | Run Order | Coded Levels | Uncoded Levels | Residual Turbidity (NTU) | Removed Turbidity (NTU) | Residual COD (mg L−1) | Removed COD (mg L−1) | ||
|---|---|---|---|---|---|---|---|---|---|
| Dosage | pH | Dosage (mg L−1) | pH | ||||||
| FFDCP | 1 | 0 | 0 | 25.0 | 7.0 | 186 | 614 (88.0%) | 1540 | 1797 (59.2%) |
| 2 | −1 | −1 | 0.0 | 5.0 | 572 | 151 (21.6%) | 2102 | 1123 (37.0%) | |
| 3 | 0 | 0 | 25.0 | 7.0 | 193 | 606 (86.8%) | 1533 | 1805 (59.4%) | |
| 4 | +1 | −1 | 50.0 | 5.0 | 128 | 684 (98.0%) | 1207 | 2197 (72.3%) | |
| 5 | −1 | +1 | 0.0 | 9.0 | 663 | 42 (6.0%) | 2731 | 368 (12.1%) | |
| 6 | 0 | 0 | 25.0 | 7.0 | 176 | 627 (89.8%) | 1525 | 1815 (59.8%) | |
| 7 | +1 | +1 | 50.0 | 9.0 | 200 | 598 (85.7%) | 1258 | 2135 (70.3%) | |
| FFD | 1 | +1 | +1 | 50.0 | 9.0 | 204 | 593 (85.0%) | 1260 | 2133 (70.2%) |
| 2 | +1 | +1 | 50.0 | 9.0 | 208 | 588 (84.2%) | 1253 | 2141 (70.5%) | |
| 3 | +1 | −1 | 50.0 | 5.0 | 119 | 695 (99.6%) | 1193 | 2214 (72.9%) | |
| 4 | −1 | −1 | 0.0 | 5.0 | 571 | 153 (21.9%) | 2092 | 1135 (37.4%) | |
| 5 | −1 | +1 | 0.0 | 9.0 | 661 | 44 (6.3%) | 2727 | 373 (12.3%) | |
| 6 | −1 | −1 | 0.0 | 5.0 | 571 | 152 (21.8%) | 2096 | 1130 (37.2%) | |
| 7 | −1 | +1 | 0.0 | 9.0 | 659 | 47 (6.7%) | 2719 | 382 (12.6%) | |
| 8 | +1 | −1 | 50.0 | 5.0 | 133 | 678 (97.1%) | 1209 | 2194 (72.2%) | |
| 9 | −1 | −1 | 0.0 | 5.0 | 578 | 144 (20.6%) | 2103 | 1121 (36.9%) | |
| 10 | −1 | +1 | 0.0 | 9.0 | 664 | 41 (5.9%) | 2731 | 368 (12.1%) | |
| 11 | +1 | −1 | 50.0 | 5.0 | 121 | 693 (99.3%) | 1206 | 2198 (72.4%) | |
| 12 | +1 | +1 | 50.0 | 9.0 | 189 | 611 (87.5%) | 1263 | 2130 (70.1%) | |
Table 4.
Experimental matrix and removed turbidity and COD values, followed by removal efficiency, using Tanfloc.
Table 4.
Experimental matrix and removed turbidity and COD values, followed by removal efficiency, using Tanfloc.
| Design | Run Order | Coded Levels | Uncoded Levels | Residual Turbidity (NTU) | Removed Turbidity (NTU) | Residual COD (mg L−1) | Removed COD (mg L−1) | ||
|---|---|---|---|---|---|---|---|---|---|
| Dosage | pH | Dosage (mg L−1) | pH | ||||||
| FFDCP | 1 | 0 | 0 | 25.0 | 7.0 | 420 | 334 (47.9%) | 1817 | 1465 (48.2%) |
| 2 | −1 | +1 | 0.0 | 9.0 | 666 | 39 (5.6%) | 2730 | 369 (12.1%) | |
| 3 | +1 | +1 | 50.0 | 9.0 | 395 | 364 (52.1%) | 2033 | 1205 (39.7%) | |
| 4 | −1 | −1 | 0.0 | 5.0 | 532 | 199 (28.5%) | 2097 | 1129 (37.2%) | |
| 5 | 0 | 0 | 25.0 | 7.0 | 410 | 346 (49.6%) | 1813 | 1469 (48.4%) | |
| 6 | +1 | −1 | 50.0 | 5.0 | 146 | 662 (94.8%) | 1374 | 1996 (65.7%) | |
| 7 | 0 | 0 | 25.0 | 7.0 | 421 | 332 (47.6%) | 1815 | 1467 (48.3%) | |
| FFD | 1 | +1 | −1 | 50.0 | 5.0 | 146 | 663 (95.0%) | 1374 | 1996 (65.7%) |
| 2 | −1 | +1 | 0.0 | 9.0 | 667 | 37 (5.3%) | 2738 | 359 (11.8%) | |
| 3 | +1 | +1 | 0.0 | 9.0 | 663 | 42 (6.0%) | 2728 | 371 (12.2%) | |
| 4 | +1 | +1 | 50.0 | 9.0 | 391 | 368 (52.7%) | 2028 | 1211 (39.9%) | |
| 5 | −1 | −1 | 0.0 | 5.0 | 535 | 196 (28.1%) | 2102 | 1123 (37.0%) | |
| 6 | +1 | −1 | 50.0 | 5.0 | 141 | 669 (95.8%) | 1381 | 1988 (65.4%) | |
| 7 | +1 | −1 | 50.0 | 5.0 | 146 | 662 (94.8%) | 1375 | 1995 (65.7%) | |
| 8 | +1 | +1 | 50.0 | 9.0 | 396 | 362 (51.9%) | 2040 | 1197 (39.4%) | |
| 9 | +1 | +1 | 50.0 | 9.0 | 397 | 361 (51.7%) | 2039 | 1198 (39.4%) | |
| 10 | −1 | −1 | 0.0 | 5.0 | 527 | 205 (29.4%) | 2092 | 1135 (37.4%) | |
| 11 | −1 | +1 | 0.0 | 9.0 | 666 | 39 (5.6%) | 2731 | 368 (12.1%) | |
| 12 | −1 | −1 | 0.0 | 5.0 | 541 | 188 (26.9%) | 2098 | 1127 (37.1%) | |
Table 5.
CV values between designs for turbidity and COD removed.
| Dosage (mg L−1) | pH | CV (%) PAM Coagulant | CV (%) Tanfloc Coagulant | ||
|---|---|---|---|---|---|
| Turbidity | COD | Turbidity | COD | ||
| 0 | 5 | 0.63 | 0.36 | 0.57 | 0.22 |
| 0 | 9 | 3.29 | 1.21 | 0.60 | 0.04 |
| 50 | 5 | 0.48 | 0.16 | 0.28 | 0.11 |
| 50 | 9 | 0.08 | 0.01 | 0.06 | 0.18 |
Table 6.
Polynomial models for turbidity and COD removal.
| Coagulant | Design | Model | |
|---|---|---|---|
| PAM | FFDCP | Removed turbidity (NTU) = 287.2 + 10.085 Dosage − 27.25 pH + 0.115 Dosage*pH + 246.92 Cp | (3) |
| Removed COD (mg L−1) = 2066.8 + 4.155 Dosage − 188.75 pH + 3.4650 Dosage*pH + 349.92 Cp | (4) | ||
| FFD | Removed turbidity (NTU) = 369.92 − 273.08 Dosage_0 + 273.08 Dosage_50 + 49.25 pH_5 − 49.25 pH_9 + 3.58 Dosage*pH_0 5 − 3.58 Dosage*pH_0 9 − 3.58 Dosage*pH_50 5 + 3.58 Dosage*pH_50 9 | (5) | |
| Removed COD (mg L−1) = 1459.92 − 708.42 Dosage_0 + 708.42 Dosage_50 + 205.42 pH_5 − 205.42 pH_9 + 171.75 Dosage*pH_0 5 − 171.75 Dosage*pH_0 9 − 171.75 Dosage*pH_50 5 + 171.75 Dosage*pH_50 9 | (6) | ||
| Tanfloc | FFDCP | Removed turbidity (NTU) = 399.0 + 12.71 Dosage − 40.0 pH − 0.69 Dosage*pH + 21.33 Cp | (7) |
| Removed COD (mg L−1) = 2079.00 + 18.115 Dosage − 190.0 pH − 0.155 Dosage*pH + 292.25 Cp | (8) | ||
| FFD | Removed turbidity (NTU) = 316.0 − 198.17 Dosage_0 + 198.17 Dosage_50 + 114.50 pH_5 − 114.50 pH_9 − 36.0 Dosage*pH_0 5 + 36.0 Dosage*pH_0 9+ 36.0 Dosage*pH_50 5 − 36.0 Dosage*pH_50 9 | (9) | |
| Removed COD (mg L−1) = 1172.33 − 425.17 Dosage_0 + 425.17 Dosage_50 + 388.33 pH_5 − 388.33 pH_9 − 7.17 Dosage*pH_0 5 + 7.17 Dosage*pH_0 9+ 7.17 Dosage*pH_50 5 − 7.17 Dosage*pH_50 9 | (10) |
Note: Cp = center point; * indicates interaction between dosage and pH.
Table 7.
Analysis of variance for removed turbidity and COD using PAM.
| FFDCP | |||||||||
|---|---|---|---|---|---|---|---|---|---|
| Turbidity | COD | ||||||||
| Source | DF | Sum of Squares | Mean Square | F Value | p-Value | Sum of Squares | Mean Square | F Value | p-Value |
| Model | 4 | 410,635 | 102,659 | 913.9 | 0.001 | 2,514,655 | 628,664 | 7729.47 | <0.001 |
| Linear | 2 | 305,986 | 152,993 | 1362.0 | 0.001 | 2,184,692 | 1,092,346 | 13,430.49 | <0.001 |
| Dosage | 1 | 296,480 | 296,480 | 2639.3 | <0.001 | 2,017,820 | 2,017,820 | 24,809.27 | <0.001 |
| pH | 1 | 9506 | 9506 | 84.6 | 0.012 | 166,872 | 166,872 | 2051.71 | <0.001 |
| Dosage*pH | 1 | 132 | 132 | 1.2 | 0.391 | 120,062 | 120,062 | 1476.18 | 0.001 |
| Curvature | 1 | 104,516 | 104,516 | 930.4 | 0.001 | 209,900 | 209,900 | 2580.74 | <0.001 |
| Error | 2 | 225 | 112 | 163 | 81 | ||||
| Total | 6 | 410,860 | 2,514,817 | ||||||
| FFD | |||||||||
| Turbidity | COD | ||||||||
| Source | DF | Sum of Squares | Mean Square | F Value | p-Value | Sum of Squares | Mean Square | F Value | p-Value |
| Model | 3 | 924,155 | 308,052 | 4632.36 | <0.001 | 6,882,579 | 2,294,193 | 37,456.21 | <0.001 |
| Linear | 2 | 924,001 | 462,000 | 6947.37 | <0.001 | 6,528,602 | 3,264,301 | 53,294.71 | <0.001 |
| Dosage | 1 | 894,894 | 894,894 | 13,457.05 | <0.001 | 6,022,250 | 6,022,250 | 98,322.45 | <0.001 |
| pH | 1 | 29,107 | 29,107 | 437.70 | <0.001 | 506,352 | 506,352 | 8266.97 | <0.001 |
| Dosage*pH | 1 | 154 | 154 | 2.32 | 0.166 | 353,977 | 353,977 | 5779.21 | <0.001 |
| Error | 8 | 532 | 67 | 490 | 61 | ||||
| Total | 11 | 924,687 | 6,883,069 | ||||||
Table 8.
Analysis of variance for removed turbidity and COD using Tanfloc.
| FFDCP | |||||||||
|---|---|---|---|---|---|---|---|---|---|
| Turbidity | COD | ||||||||
| Source | DF | Sum of Squares | Mean Square | F Value | p-Value | Sum of Squares | Mean Square | F Value | p-Value |
| Model | 4 | 213,218 | 53,305 | 929.73 | 0.001 | 1,473,110 | 368,277 | 92,069.38 | <0.001 |
| Linear | 2 | 207,677 | 103,838 | 1811.14 | 0.001 | 1,326,453 | 663,226 | 165,806.56 | <0.001 |
| Dosage | 1 | 155,236 | 155,236 | 2707.60 | 0.000 | 725,052 | 725,052 | 181,263.06 | <0.001 |
| pH | 1 | 52,441 | 52,441 | 914.67 | 0.001 | 601,400 | 601,400 | 150,350.06 | <0.001 |
| Dosage*pH | 1 | 4761 | 4761 | 83.04 | 0.012 | 240 | 240 | 60.06 | 0.016 |
| Curvature | 1 | 780 | 780 | 13.61 | 0.066 | 146,417 | 146,417 | 36,604.31 | <0.001 |
| Error | 2 | 115 | 57 | 8 | 4 | ||||
| Total | 6 | 213,333 | 1,473,118 | ||||||
| FFD | |||||||||
| Turbidity | COD | ||||||||
| Source | DF | Sum of Squares | Mean Square | F Value | p-Value | Sum of Squares | Mean Square | F Value | p-Value |
| Model | 3 | 644,115 | 214,705 | 8001.43 | <0.001 | 3,979,450 | 1,326,483 | 33,939.87 | <0.001 |
| Linear | 2 | 628,563 | 314,282 | 11,712.36 | <0.001 | 3,978,834 | 1,989,417 | 50,901.92 | <0.001 |
| Dosage | 1 | 471,240 | 471,240 | 17,561.75 | <0.001 | 2,169,200 | 2,169,200 | 55,501.93 | <0.001 |
| pH | 1 | 157,323 | 157,323 | 5862.97 | <0.001 | 1,809,633 | 1,809,633 | 46,301.92 | <0.001 |
| Dosage*pH | 1 | 15,552 | 15,552 | 579.58 | <0.001 | 616 | 616 | 15.77 | 0.004 |
| Error | 8 | 215 | 27 | 313 | 39 | ||||
| Total | 11 | 644,330 | 3,979,763 | ||||||
Table 9.
Summary of the regression models.
| Coagulant | Design | Variable | S | R2 | R2(adj.) | R2(pred.) |
|---|---|---|---|---|---|---|
| PAM | FFDCP | Turbidity | 10.60 | 99.95 | 99.84 | - |
| COD | 9.02 | 99.99 | 99.98 | |||
| FFD | Turbidity | 8.15 | 99.94 | 99.92 | 99.87 | |
| COD | 7.83 | 99.99 | 99.99 | 99.98 | ||
| Tanfloc | FFDCP | Turbidity | 7.57 | 99.95 | 99.84 | - |
| COD | 2.00 | 100.0 | 100.0 | |||
| FFD | Turbidity | 5.18 | 99.97 | 99.95 | 99.93 | |
| COD | 6.25 | 99.99 | 99.99 | 99.98 |
Table 10.
Response Optimizer for turbidity and COD removal; and removed turbidity and COD values predicted by the models.
Table 10.
Response Optimizer for turbidity and COD removal; and removed turbidity and COD values predicted by the models.
| Coagulant | Design | Dosage (mg L−1) | pH | Desirability | Removed Turbidity (NTU) | Removed COD (mg L−1) |
|---|---|---|---|---|---|---|
| PAM | FFDCP | 50.0 | 5.0 | 1.00 | 684.0 (98.0%) | 2197.0 (72.3%) |
| FFD | 50.0 | 5.0 | 0.99 | 688.0 (98.6%) | 2202.0 (72.5%) | |
| Tanfloc | FFDCP | 50.0 | 5.0 | 1.00 | 662.0 (94.8%) | 1996.0 (65.7%) |
| FFD | 50.0 | 5.0 | 0.99 | 664.0 (95.1%) | 1993.0 (65.6%) |
Publisher’s Note: MDPI stays neutral with regard to jurisdictional claims in published maps and institutional affiliations. |
© 2021 by the authors. Licensee MDPI, Basel, Switzerland. This article is an open access article distributed under the terms and conditions of the Creative Commons Attribution (CC BY) license (https://creativecommons.org/licenses/by/4.0/).
Share and Cite
MDPI and ACS Style
Muniz, G.L.; Pereira, M.d.S.; Borges, A.C. Dairy Wastewater Treatment with Organic Coagulants: A Comparison of Factorial Designs. Water 2021, 13, 2240. https://doi.org/10.3390/w13162240
AMA Style
Muniz GL, Pereira MdS, Borges AC. Dairy Wastewater Treatment with Organic Coagulants: A Comparison of Factorial Designs. Water. 2021; 13(16):2240. https://doi.org/10.3390/w13162240
Chicago/Turabian StyleMuniz, Gustavo Lopes, Magno dos Santos Pereira, and Alisson Carraro Borges. 2021. "Dairy Wastewater Treatment with Organic Coagulants: A Comparison of Factorial Designs" Water 13, no. 16: 2240. https://doi.org/10.3390/w13162240
Note that from the first issue of 2016, this journal uses article numbers instead of page numbers. See further details here.