
Experimental Study of the Effect of Controlled Drainage on Soil Water and Nitrogen Balance


Agricultural Water Conservancy Department, Chang Jiang River Scientific Research Institute, Wuhan 430010, China
*
Authors to whom correspondence should be addressed.
Water 2021, 13(16), 2241; https://doi.org/10.3390/w13162241
Submission received: 20 July 2021
/
Revised: 7 August 2021
/
Accepted: 12 August 2021
/
Published: 17 August 2021
(This article belongs to the Special Issue Efficient Use of Water and Soil Resources)
Abstract
:Field experiments and micro test pit experiments are conducted at the Four Lake Watershed with a shallow groundwater table in the Hubei province of China in order to study the effect of controlled pipe drainage on soil moisture and nitrogen under different experiment scales. Soil moisture and nitrogen contents are continuously observed at the effective soil depth; water and nitrogen balance are calculated after several heavy rainfalls. The results showed that controlled pipe drainage significantly reduced the fluctuation of soil water content in the entire growth stage. There is a positive correlation between the soil moisture and the control water level in the test pits but no obvious correlation between them in the field experiments, which is related to the vertical and lateral recharge of groundwater in the field. After rainfall, soil organic matter mineralization was enhanced, and the control pipe drainage measures increased the relative content of soil mineralized ammonia nitrogen, which enhanced the stability of soil nitrogen and helped to reduce the loss of nitrogen. The calculation of soil water and nitrogen balance in the field and micro-area after rainfall showed that the soil water storage increased in the effective soil layer under the control water level of 30 cm and 50 cm after rainfall, and the amount of nitrogen mineralization was larger than that under the free drainage treatment.
1. Introduction
The Four Lake Watershed is a lacustrine plain area located on the north bank of the middle reaches of the Yangtze River, and 83.9% of its area consists of cultivated land. The mean annual precipitation is 1189.7 mm, and the mean evaporation is 1050 mm. Rainfall is concentrated during the period from May to August (the multi-year average was 850 mm). The mean temperature is 16.2 °C, with the highest in July (28.9 °C) and the lowest in January (3.2 °C). The low-lying topography and rich rainfall often result in flooding and heavy waterlogging in most of this area of the district [1]. In addition, traditional drainage in the area consists of surface drainage with bulky outflow, high peak flows, and a large drainage intensity, resulting in serious floods during the flood season from May to September.
Many studies were carried out on farmland drainage management measures to reduce the impact of waterlogging disaster on crops. Controlled drainage, a multi-objective agricultural water management technique that aims to reduce over-drainage and relieve source pollution caused by field drainage [2,3,4,5], has been widely studied and is currently applied in China. Controlled drainage has proved to have environmental benefits on drain discharge quantity and quality [6,7]. A field water table management experiment conducted by Wesstrom et al. [8] showed that total drain outflow from controlling the subsurface drainage decreased compared to conventional drainage, and the total amount of nitrate in drain outflow corresponded to the reduced outflow rates. In addition, least squares estimation of the parameters initial outflow, initial storage volume, and retention constant revealed that the initial outflows were higher and that the retention constant and the temporary storage were lower in controlled drainage [9]. A surface-controlled drainage experiment showed that drain outflow and nitrogen leaching were both reduced [10]. Field experiments demonstrated that by reducing the depth of the field ditches from 1 m to 0.4 m, the drain outflow was reduced by 50–60%, while the salt concentration was still below the rice tolerance level [1]; this controlled drainage measure caused a water table rise of 1.8 cm, the total drainage reduced by 50%, and the ground water drainage reduced by 46% [11]. Previous studies have shown that surface runoff tends to loss more nitrate, sediment, phosphorus, organic nitrogen, and other substances attached to sediments [9]. Field experiments performed in the Hetao Irrigation district of China showed that controlled drainage increased the relative water content of soil profile by 8.27%, increased the increase in water content during irrigation period, and reduced the decrease in water content during the intermittent period. At the same time, the control of drainage also improved the distribution uniformity of salt in soil profile, and the practice will alleviate salinization in the arid area [12]. A 10 year study in Egypt found that controlled drainage increased yield and also affected soil salinity. Reasonable control of salinity in irrigation water could reduce salinity accumulation [13]. Controlled drainage (CD) and free drainage (FD) were tested in combination with open ditches and subsurface pipes systems in North-Eastern Italy over two monitoring periods (1995–2002 and 2006–2013), and the results showed that CD reduced outflow waters by 69% with respect to FD [14].
Cotton is the primary cash crop in the Four Lake Watershed. The period from July to September is not only the rainy season but also the most important growth stage for cotton. Waterlogging and flooding are typically terrible during this period if no proper drainage is implemented. The ground water table is typically approximately 1 m below the soil surface. Therefore, no irrigation is required unless the year is extremely dry. Cotton-rape rotation is commonly used in this area. In order to provide better advice for improving water management, we conducted a three-year field controlled pipe drainage experiment from 2008 to 2010 at the Yajiao Drainage and Irrigation Station in Jing zhou, Hubei Province.
Hubei province is located in central China. According to relevant research literature on meteorological characteristics of Hubei Province [15], the average rainfall in Hubei Province in the nearly 60 years since 1960 is 1257.9 mm, which is not much different from the annual rainfall in our experiment years. Global warming has a certain impact on the weather in Hubei Province, especially on rainfall, which is not abrupt but proceeds year by year, and the impact is positive and negative. Our previous results showed that both the drain outflow and nitrogen leaching were reduced [16]. Y. L. Sun studied the effects of climate and management factors on cotton yield and found that the fluctuation of these two factors was greater than their trend change on cotton yield per unit area [17]. That is to say that only the occurrence of extreme climate events can have a large impact on cotton yield, and the trend change has little impact on cotton yield.
Controlled drainage in the field experiments and micro test pit experiments both reduced drain outflow, nitrogen leaching, and altered the soil water balance. During the field experiments and micro test pit experiments, the drainage boundary conditions were different and, thus, inevitably resulted in different drain outflows, ending up with different soil moisture statuses. In addition, transformations between nitrate nitrogen and ammonium nitrogen in the field and test pits were distinctive. However, the impacts of experiment scales on soil moisture and soil nitrogen balance under controlled drainage is less understood and require further research. The primary objectives of this study were (1) to understand the effect of controlled drainage on the soil water and nitrogen balance and (2) to reveal the mechanisms of soil water and nitrogen dynamics due to controlled drainage under boundary conditions. The results of the study can be used as a guideline for agricultural water management in waterlogging areas.
2. Materials and Methods
2.1. Site Description
A three-year experiment was conducted at the Yajiao Drainage and Irrigation Station in the Four Lake Watershed from 2008 to 2010. The study site was situated at 112°31’ E and 30°21’ N and 29.4 m above sea level. The depth of the groundwater table is approximately 1 m below the soil surface most of the time. The crop was cotton.
2.2. Experimental Design
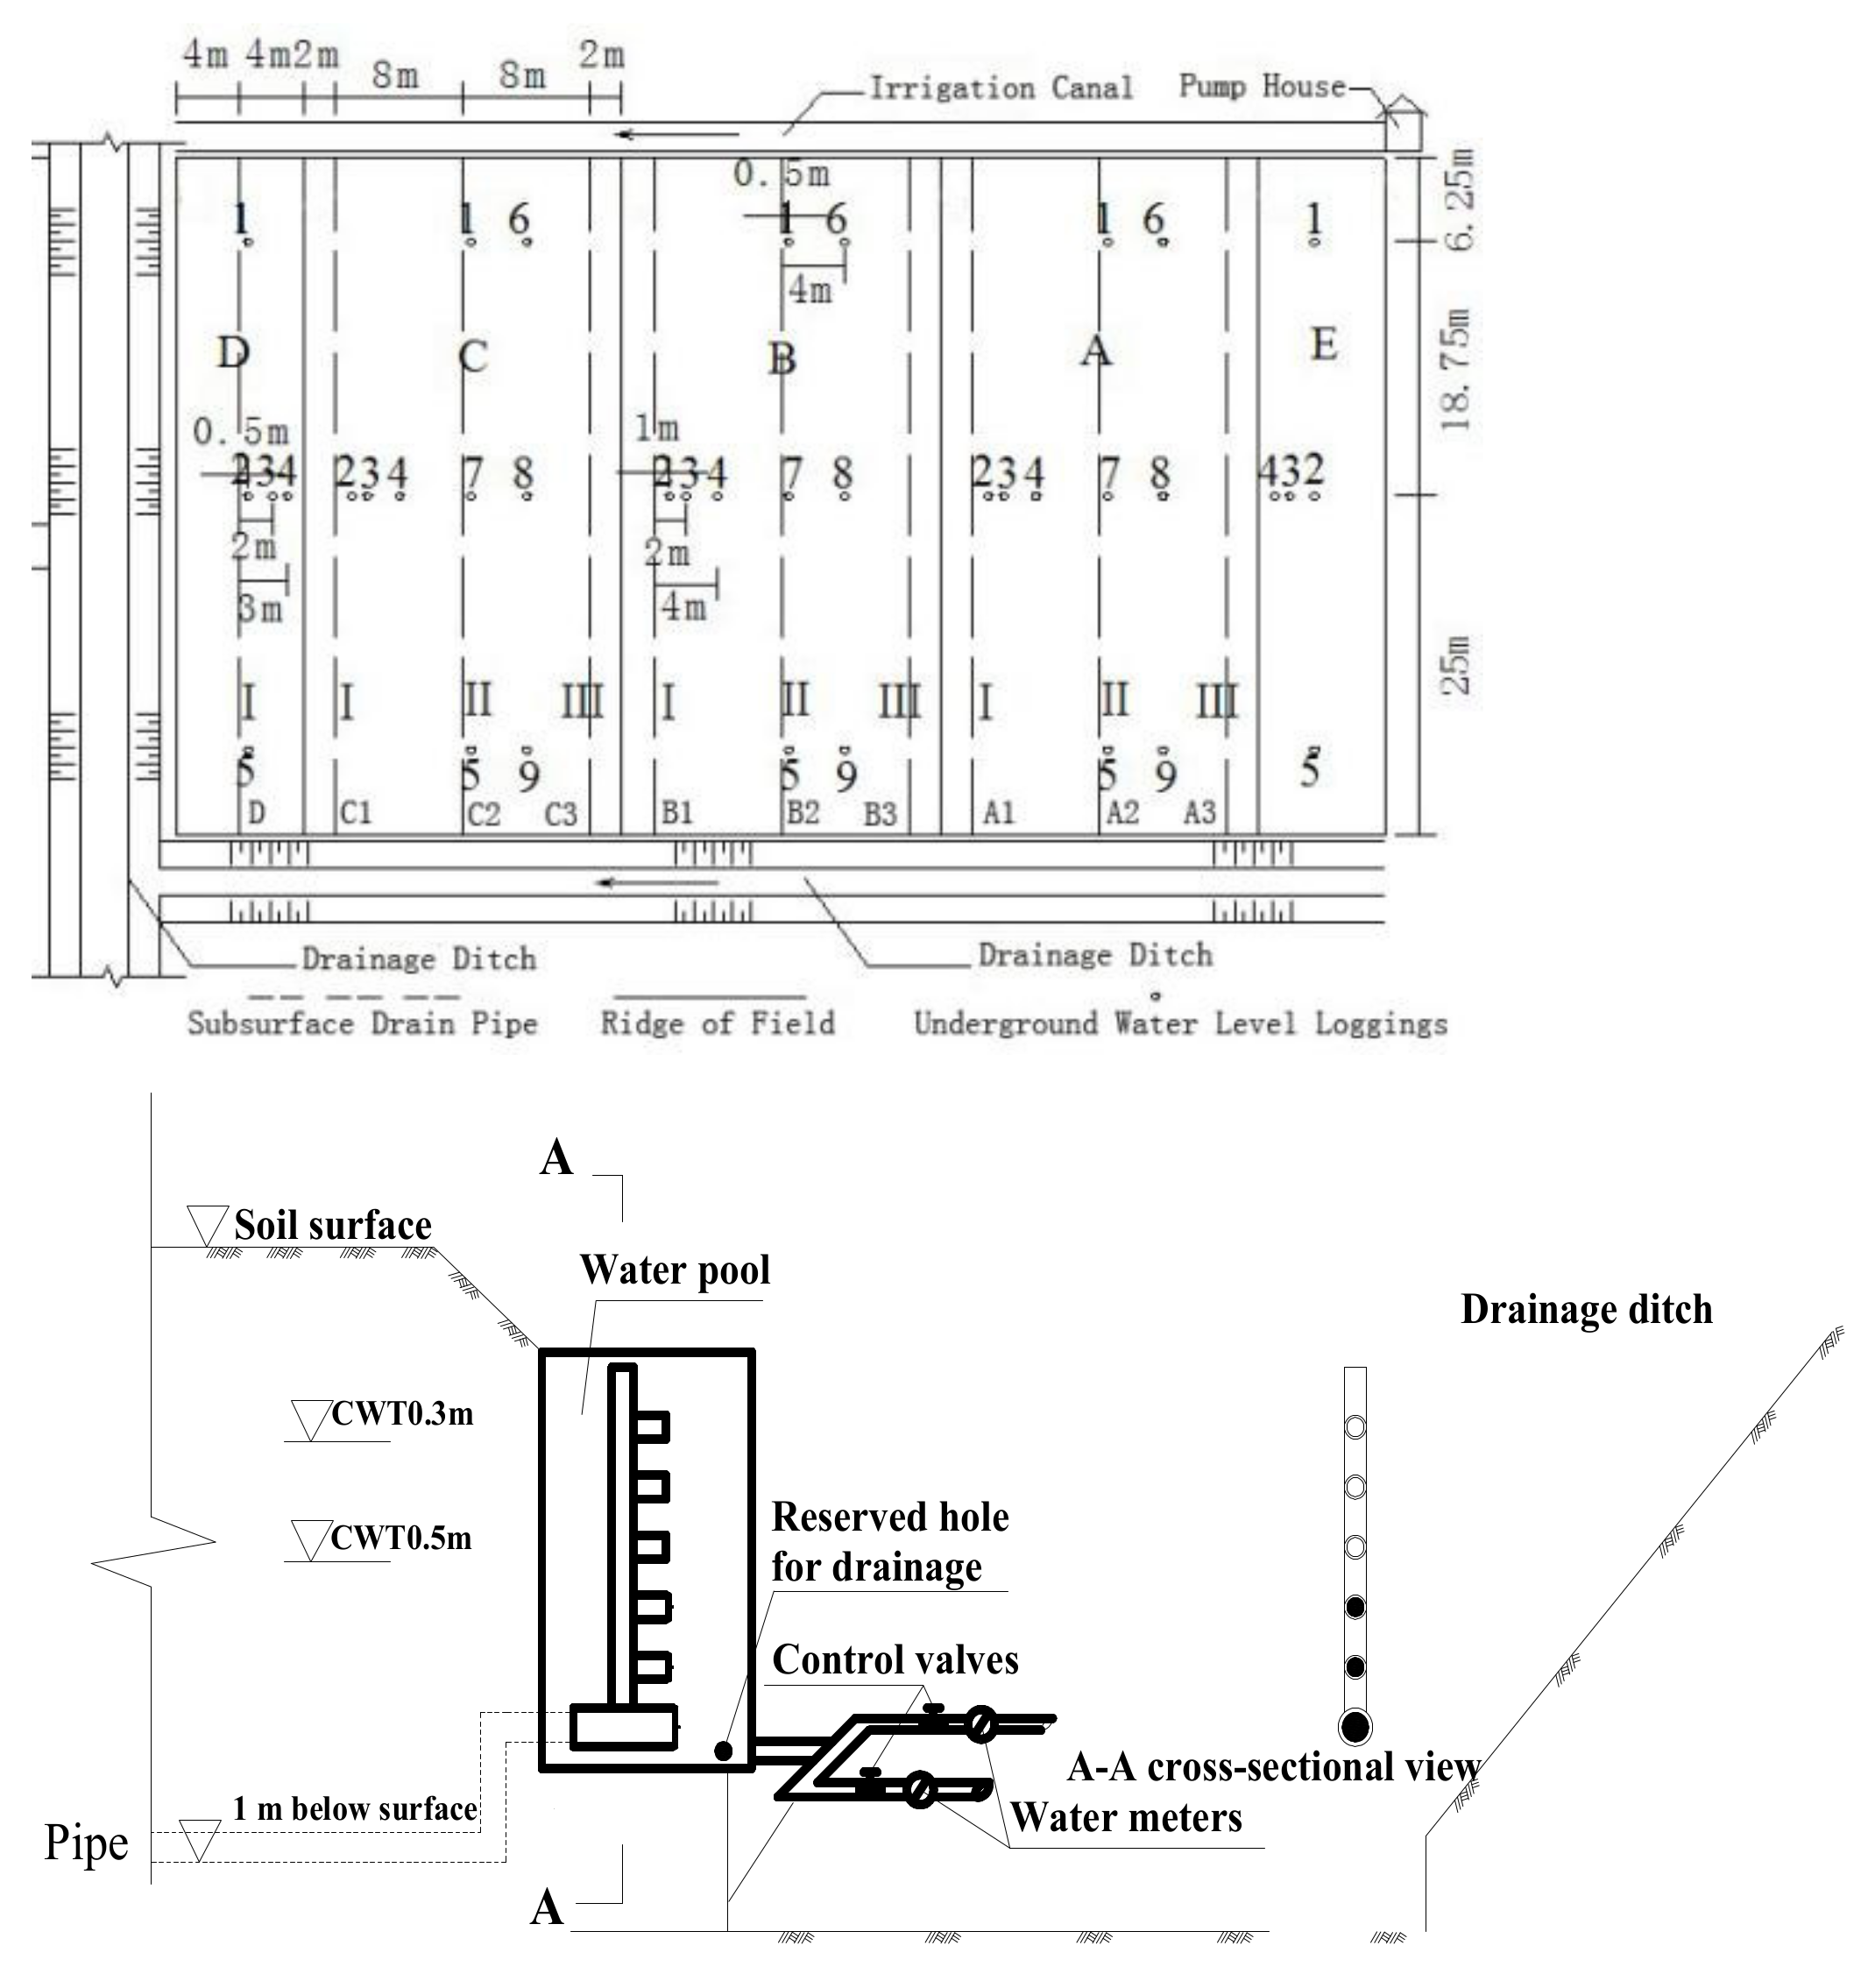
The layout of the field experimental site is shown in Figure 1. The plots marked A, B, C, D, and E were adopted. The drainage ditch next to plot D was covered by concrete and had little effect on the groundwater table in plot D. Plot E worked as a buffer to overcome external influences since there was an irrigation ditch linked to a main irrigation canal next to E, and the water table in the ditch was high and stable. The plots were separated by concrete walls that were 0.2 m wide and 1.2 m below the soil surface, with a plastic sheet to prevent lateral leakage and interactions. Five water table observation wells were installed in each plot (Figure 1). A pipe drainage system was installed. All of the drains were laid at a depth of 1 m below the soil surface. The outlet elevation was adjusted according to the predesign by moving or fixing the water level controllers (Figure 2). Three water meters that were used to measure the outflow were fixed at the subsurface and surface outlets in each plot: two in the subsurface and one at the surface.
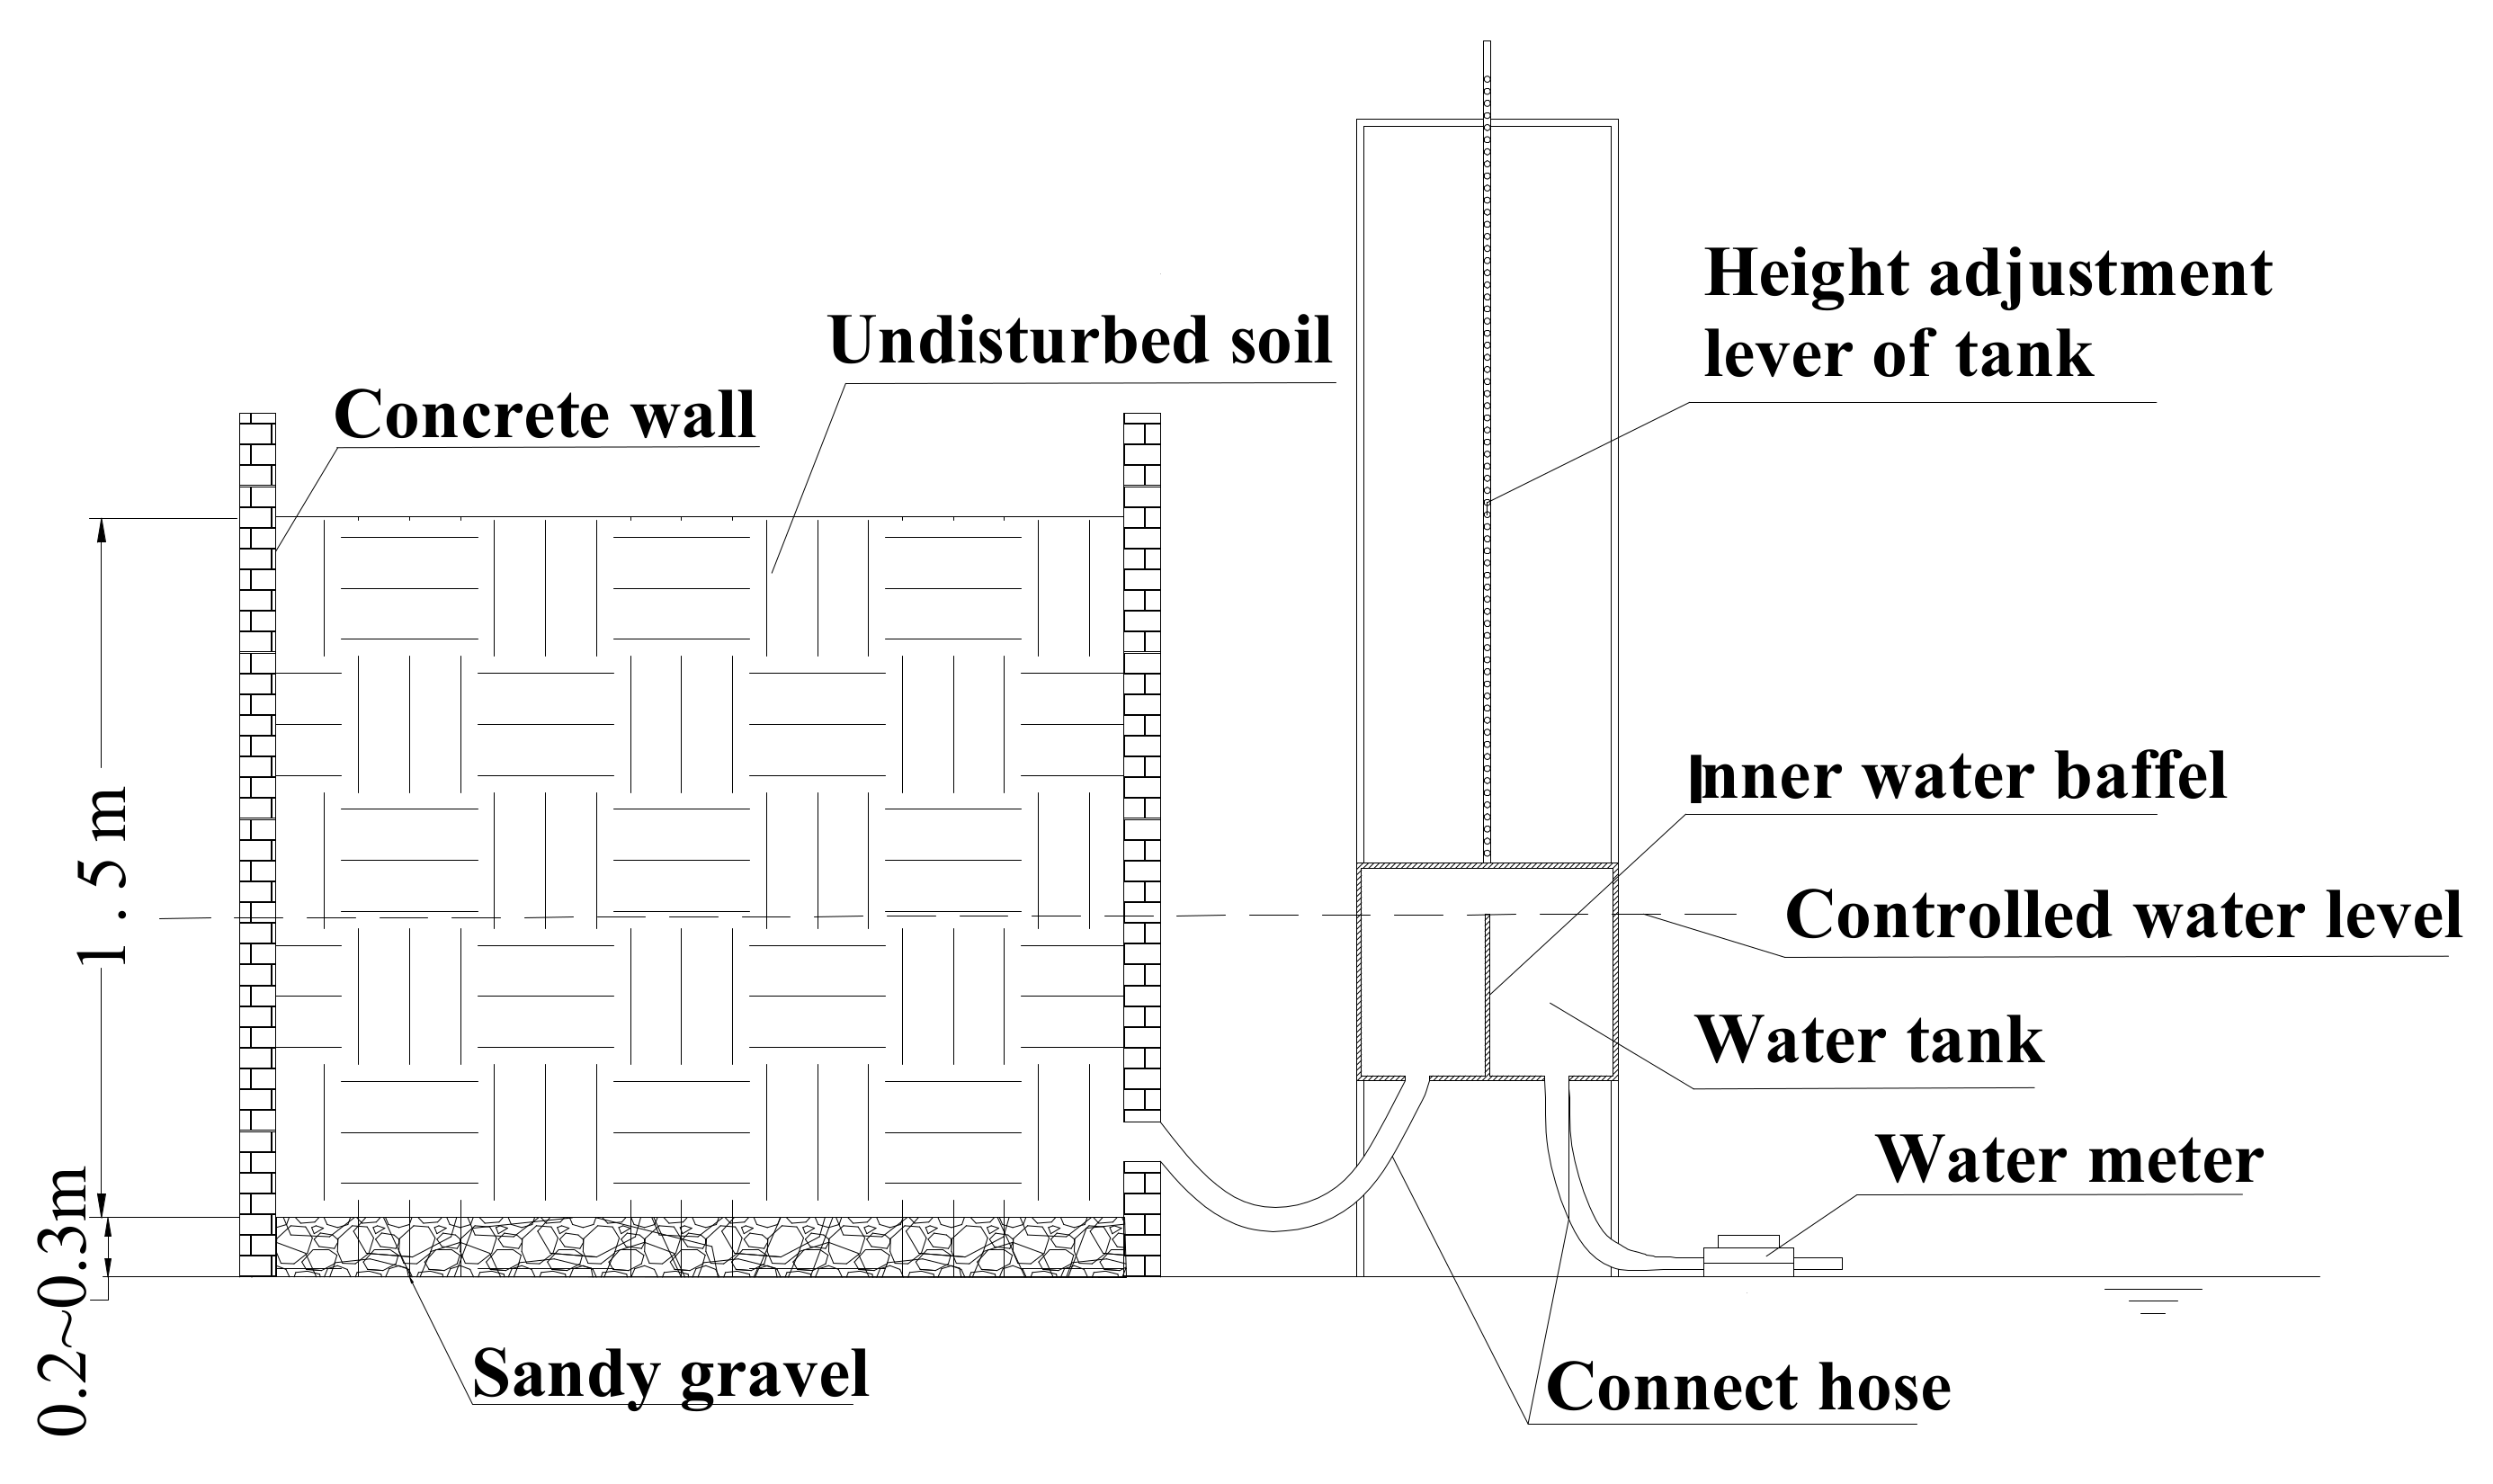
Micro test pit experiments were conducted in the 20 test pits. Each test pit was 2 m wide, 2 m long, and 1.8 m above ground, and sandy gravel was laid at the bottom, approximately 0.2–0.3 m thick. There was no interaction between the adjacent pits because the sidewalls were all covered with concrete.
In the test pits, soil was backfilled according to the field layers within 1.5 m, and the soil constitution was same as that of the field. Every test pit had a groundwater table observation well installed 1.2 m below the soil surface. The water table control structure is shown in Figure 2.
Table 1 shows the controlled water table design in the field plots. Table 2 shows the controlled water table design in the test pits, and the numbers 1, 2, 3, and 4 represent the four types of treatments in the test pits. The seeding stage meant that a small cotton tree in a nutritional bowl was transplanted from the seedbed similar to a greenhouse to the field or the test pits.
2.3. Measurements and Sampling
2.3.1. Soil Water
Soil water contents and ground water table during the cotton growth period were measured until the cotton stalk was pulled out. Soil water content was measured in 6 soil layers in the field plots (surface, 20 cm, 40 cm, 60 cm, 80 cm, and 100 cm below soil surface) and 4 layers (20 cm, 40 cm, 60 cm, and 80 cm below soil surface in the test pits). Soil nitrogen content was measured in 5 layers in the field plots (surface, 20 cm, 40 cm, 60 cm, and 80 cm below soil surface) and 5 layers (20 cm, 40 cm, 60 cm, and 80 cm below soil surface in the test pits).
Soil water content was monitored once every 5 d in field plots and almost once every month in test pits by the oven-drying method. Ground water table was monitored once every 5 d in field plots and once each day from 1 June to 30 August in test pits by buoy observation, and frequency was increased when there rainfall occured. Precipitation was noted by the meteorological station at the drainage and irrigation station.
The water content was measured 54 times during the cotton growth period from 2008 to 2010 to analyze the change rule of soil moisture content and water balance. The specific sampling date are listed in the Table 3. The period from 10 July to 18 September 2009, with less rainfall, was a drier year.
2.3.2. Nitrogen
Soil Nitrogen
Nitrate and ammonium nitrogen concentrations in soil profile during the cotton growth period were measured. Soil layers of 5 depths were selected for analysis, including topsoil, 20 cm below the surface, 40 cm below the surface, 60 cm below the surface, and 80 cm below the surface. Five sampling points were taken along the “S” shape in each test field, and the final concentrations in each layer were averaged at 5 points.
Ammonia volatilization in the field was detected by ventilation method, and a sponge was used to absorb ammonia. Two capture devices were randomly placed in each treatment field after fertilization. At 8 a.m on the next day, the sponge in the capture device was taken out to test the ammonia. Sponge analysis was performed two days later, until the content cannot be measured.
Plant Nitrogen
Plant nitrogen uptake: Ten random strains of cotton plant were pulled out in every field at end of cotton picking. After fixing and drying, dry matter weight was measured. Total nitrogen content of the plant was detected by using H2SO4–H2O2 boiling and Nye’s colorimetry determination.
Drainage Nitrogen
Determination of nitrogen concentration in drainage: The samples are taken immediately after the drainage of rainfall. Generally, the samples are taken once every 2–3 h in the initial stage of drainage, and the sampling frequency is reduced when the nitrogen concentration is low in the later stage. The nitrogen indexes measured in drainage include nitrate, ammonium, and total nitrogen. The total nitrogen was determined by alkaline potassium persulfate digestion ultraviolet spectrophotometry (gb11894-89), nitrate nitrogen by ultraviolet spectrophotometry (HJ/t346-2007), and ammonium nitrogen by Nah reagent colorimetry (gb7479-87).
Other Nitrogen
The balance equation is used to calculate the data that cannot be measured. The nitrogen balance formula of cotton in the whole growth period of farmland ecosystem is as follows:
where ΔNC is the increment of crop nitrogen (kg/ha); NS is the increment of mineral nitrogen in the effective soil (kg/ha); NF is the fertilizer application rate (kg/ha); and NO is the amount of organic matter mineralization in the effective soil layer. Due to insufficient data, NO cannot be specifically counted. NR and ND are nitrogen inputs from rainfall and irrigation, respectively (kg/ha); NL refers to the nitrogen loss (kg/ha) of the farmland ecosystem.
As mentioned in Tapio Salo’s research [18], when the measured data of nitrogen (N) losses to the environment are not available, calculated N balances are often used to indicate losses. In this paper, nitrogen loss terms, especially NO-NL, that cannot be directly measured is calculated by using the nitrogen balance equation.
2.4. Chemical Methods
Soil nitrate and ammonium nitrogen concentration, ammonia volatilization, and plant dry matter and total nitrogen were measured. The chemical methods are listed in Table 4. Subsurface and surface runoffs were measured by the water-meters. Depth to the groundwater (centimeters below soil surface) was measured every 5 d and daily after precipitations. Climatological data, including precipitation, temperature, and wind velocity and so on, were collected by the local weather station.
3. Results
Soil moisture and nitrogen content from 2008 to 2010 are shown here. From 2008 to 2010, the data of soil water content at different soil depths were drawn into the change trend chart. Combined with rainfall, the changes and causes of soil water content at surface and below 20 cm, 40 cm, 60 cm, 80 cm, and 100 cm under the conditions of controlled drainage treatment and conventional drainage treatment were analyzed. Field and pit analysis were conducted separately. The field soil water balance was calculated after a single rainfall. Nitrogen balance during the whole growth period was calculated by nitrogen balance calculation, and the field nitrogen balance after three rainfalls was calculated.
3.1. Soil Moisture in the Field
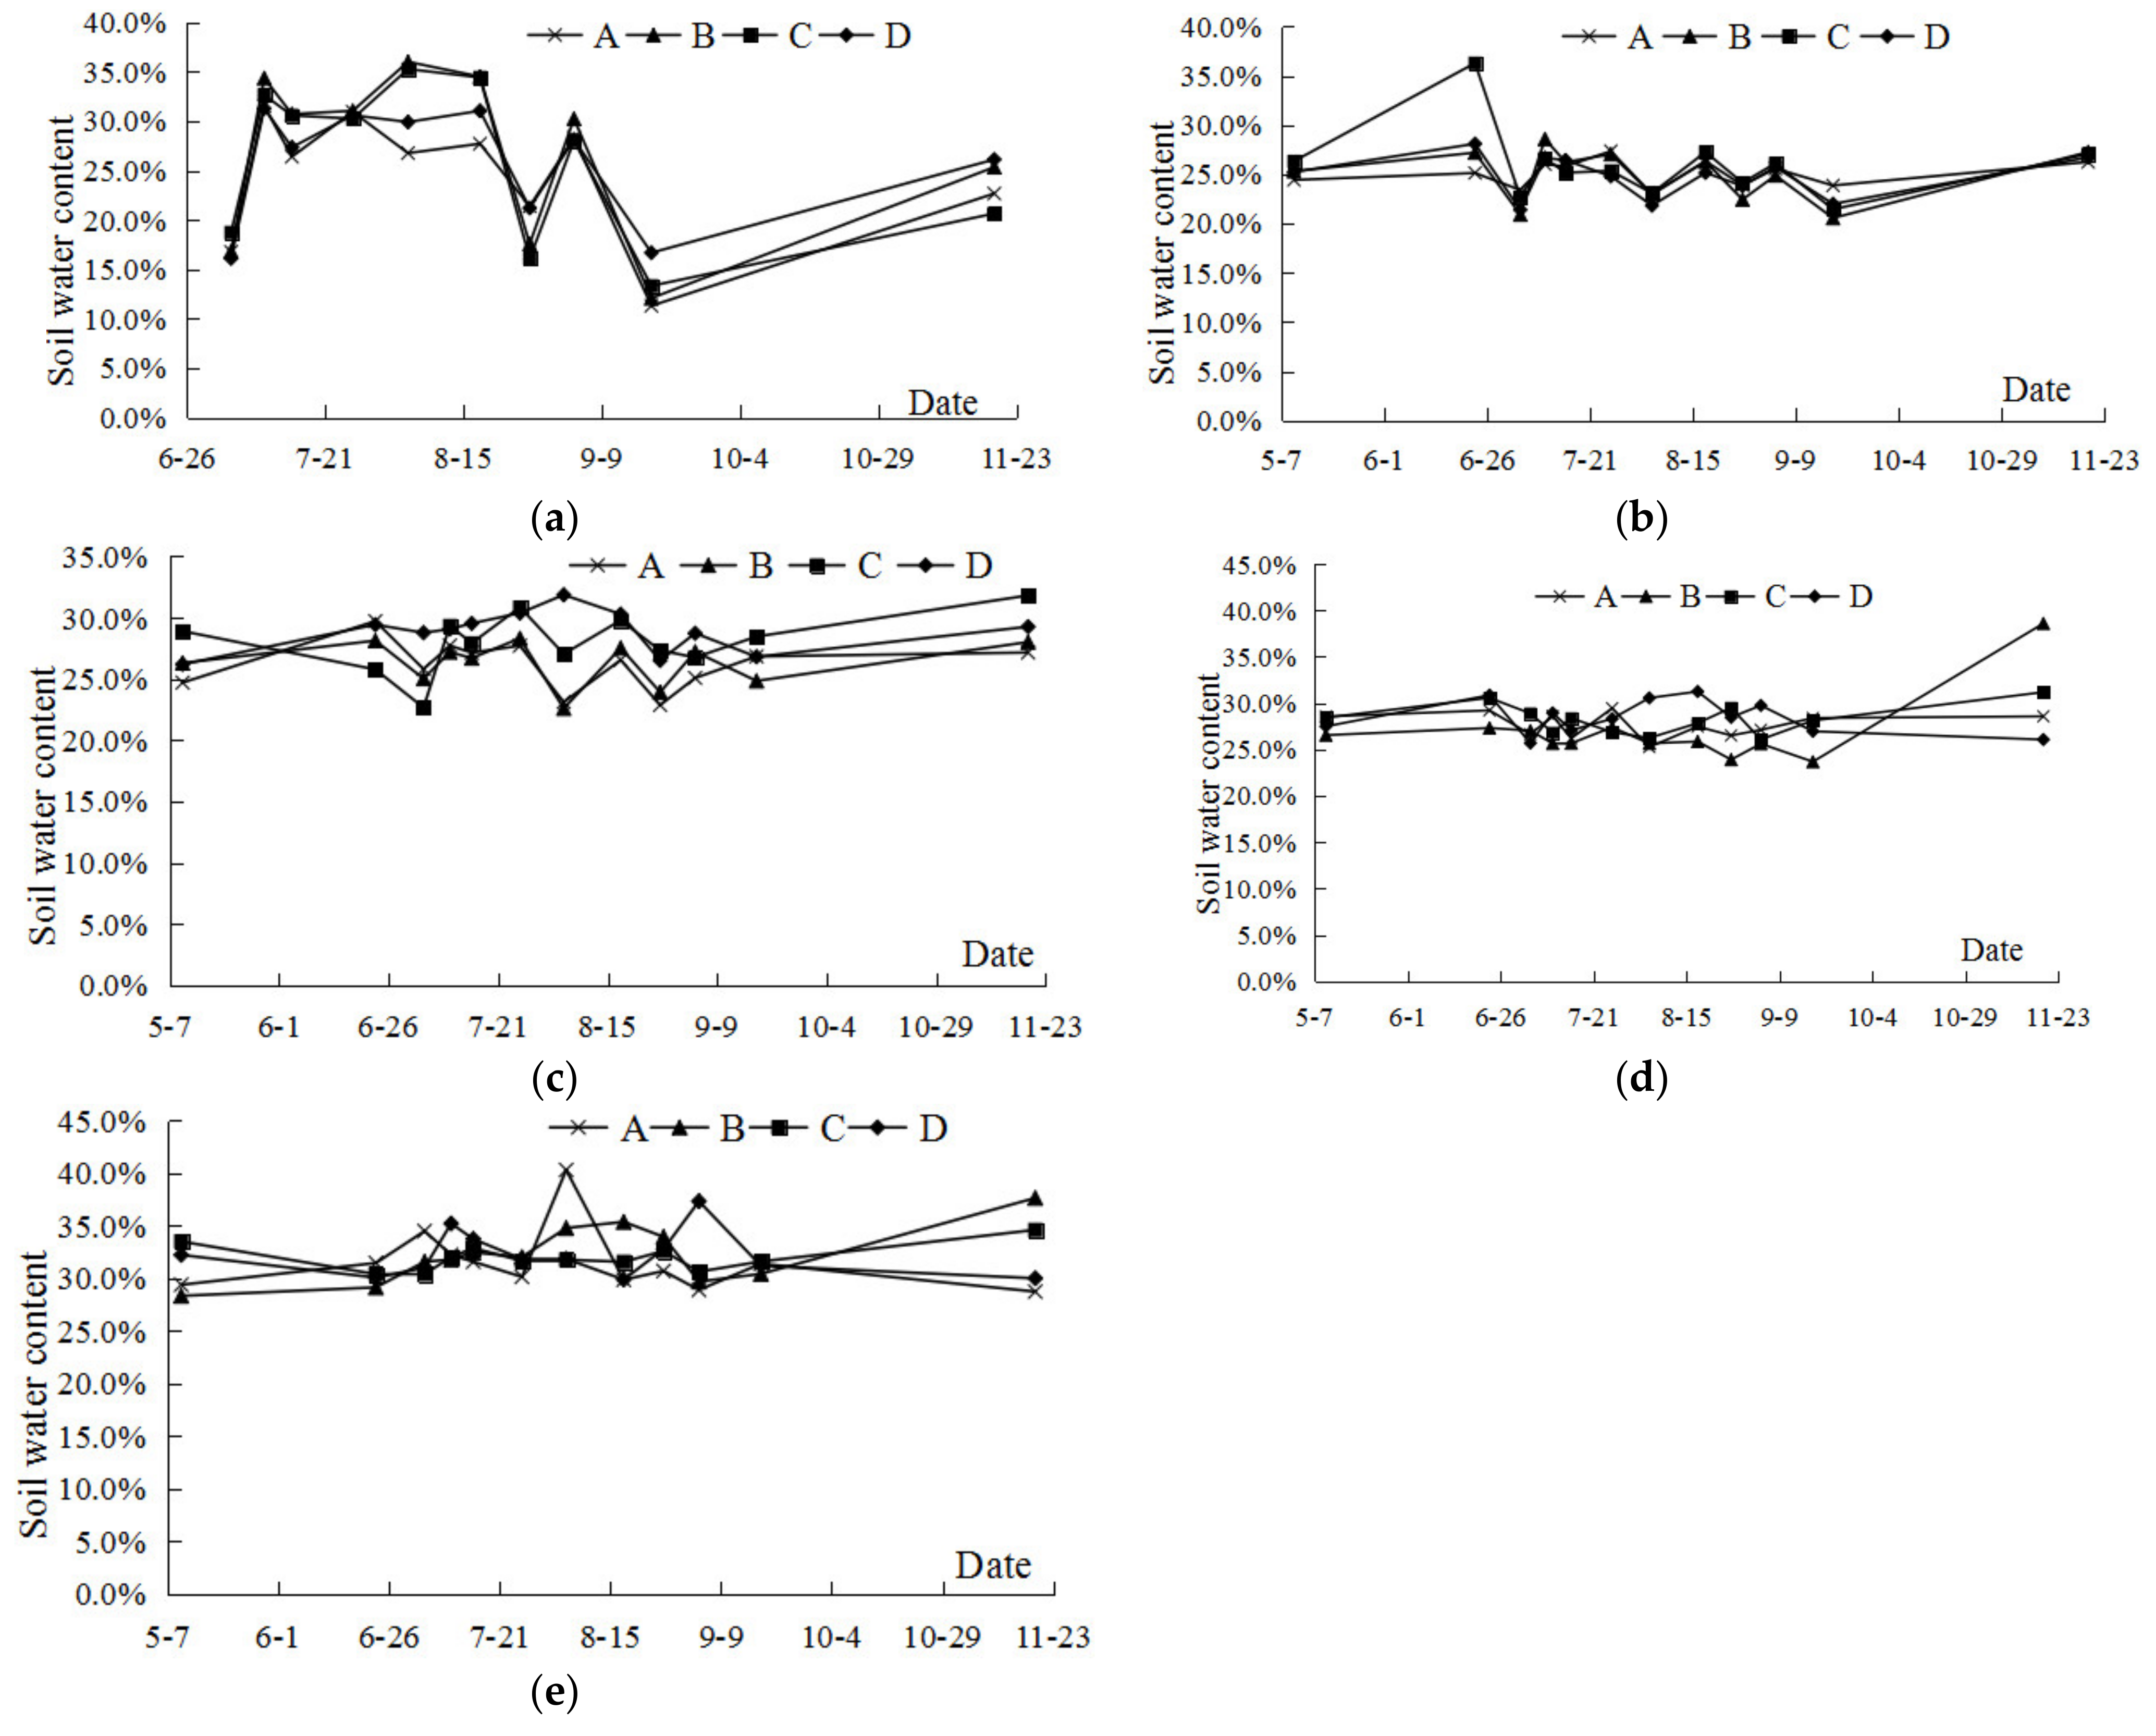
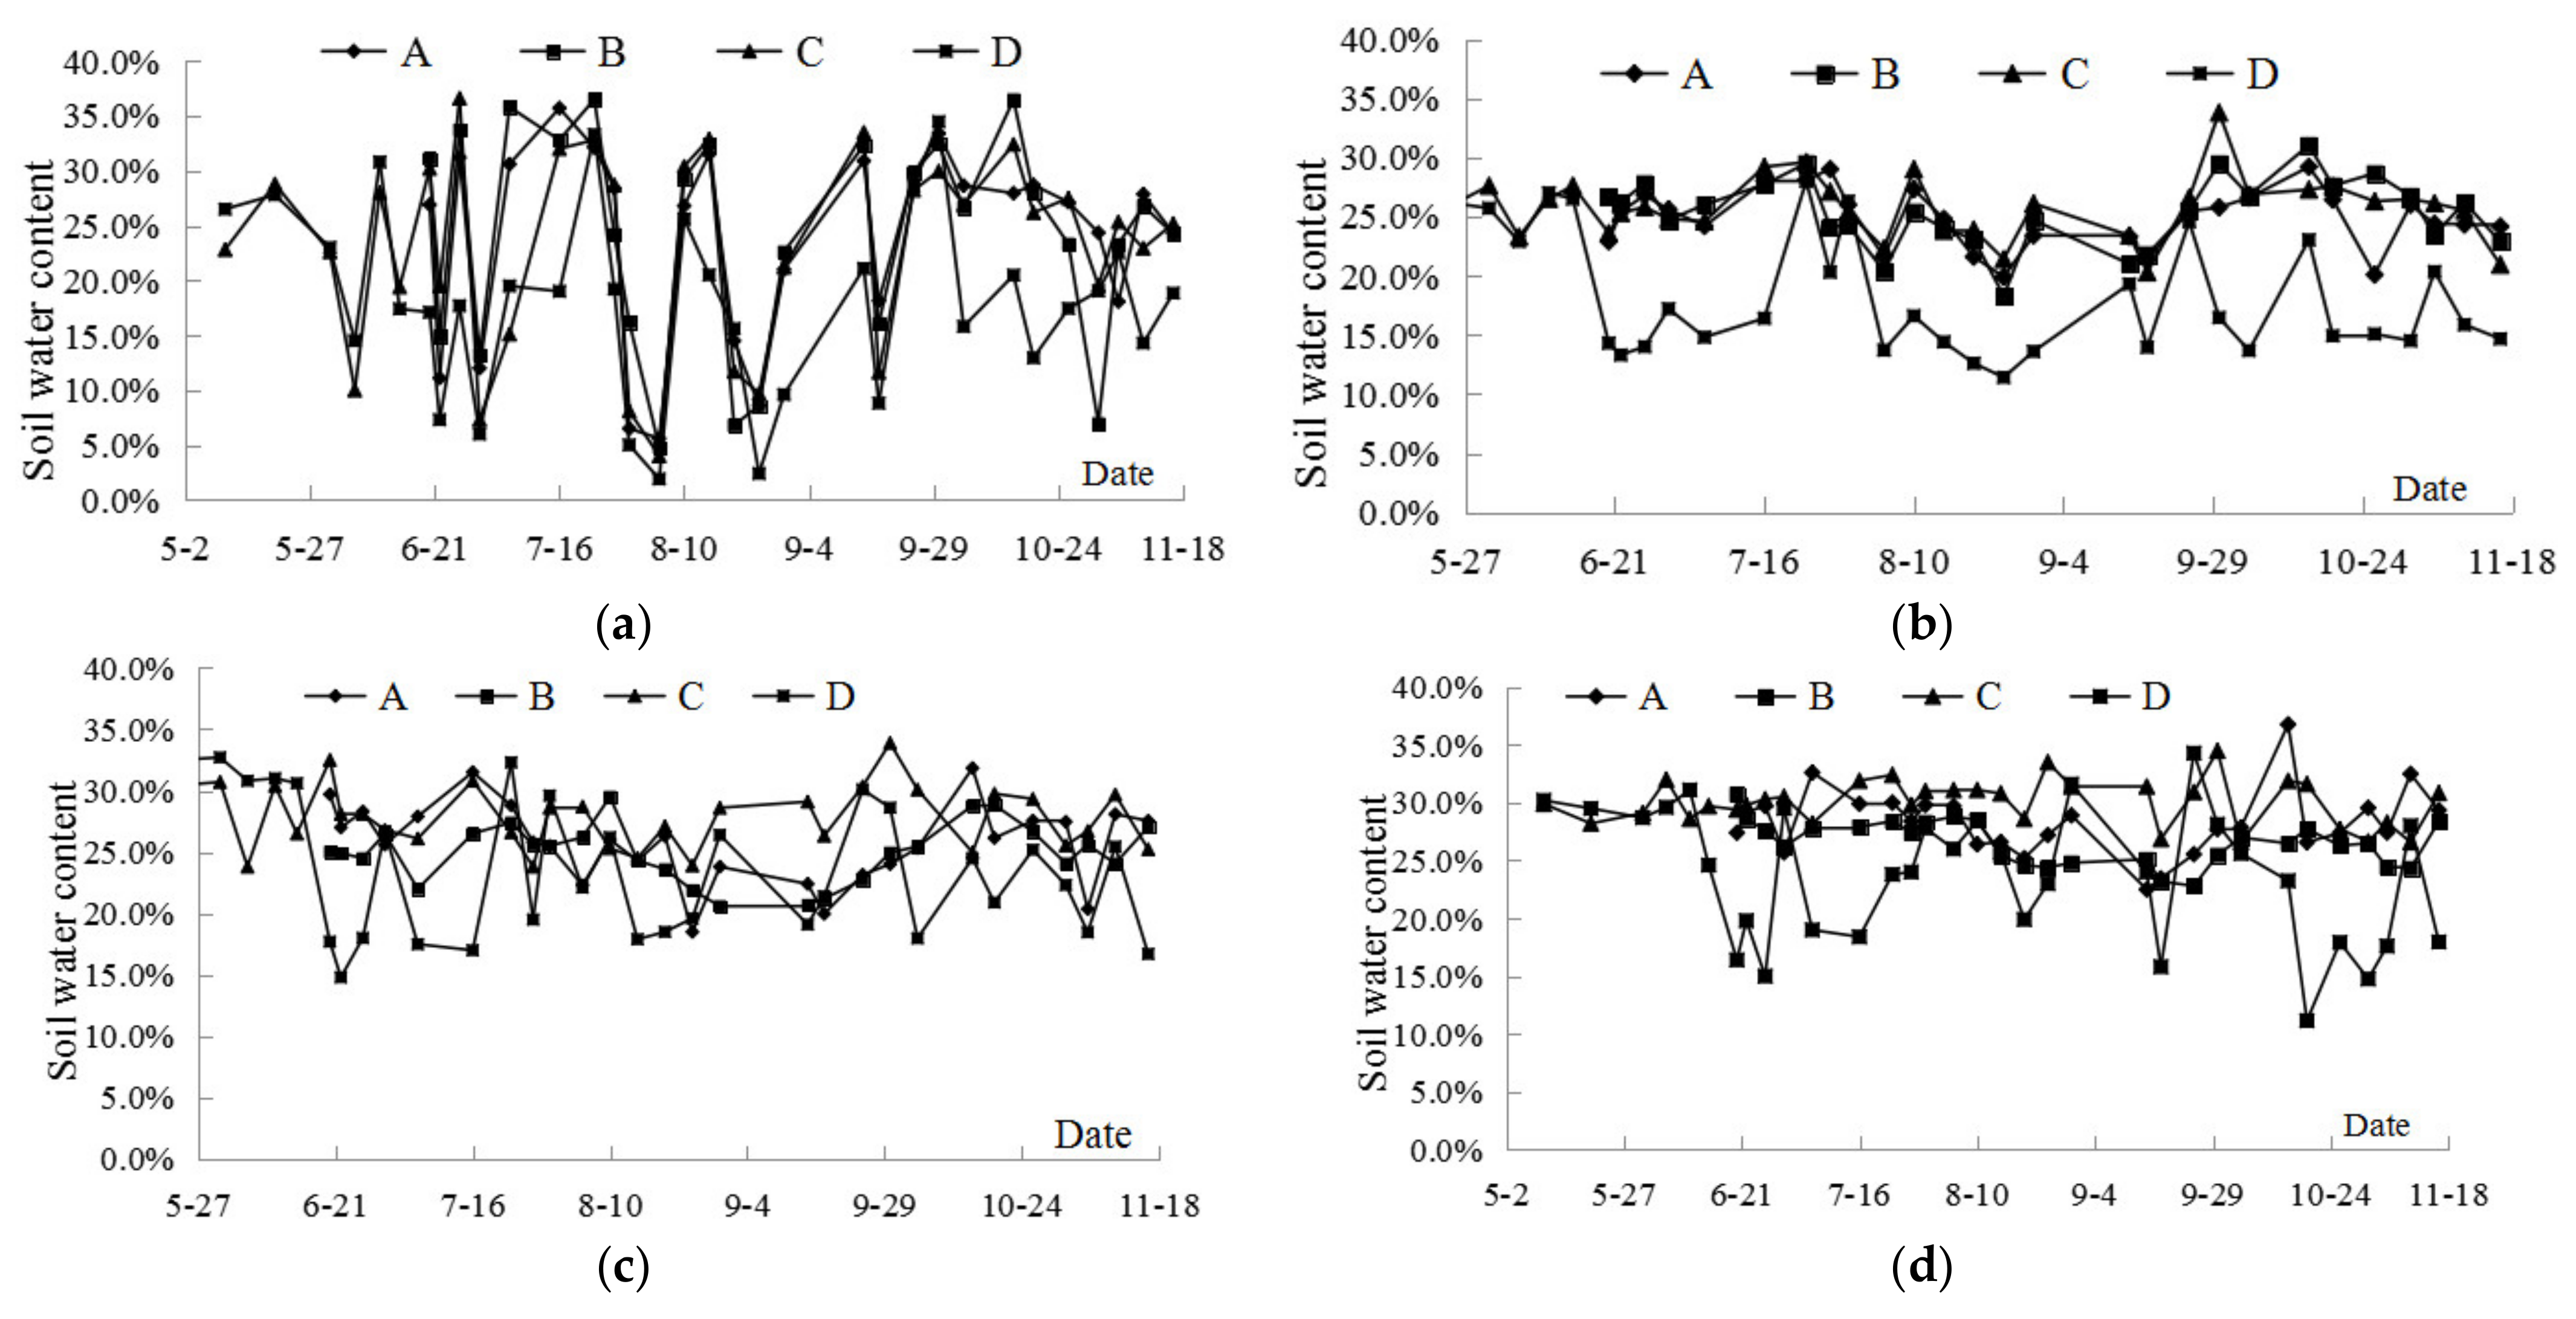
Figure 3, Figure 4 and Figure 5 show the changes of the soil moisture content at each layer of the field in 2008–2010. As can be observed from Figure 3, with an increase in the soil depth, the water content increased. The moisture content of the surface soil fluctuated less, and the moisture content measured in the sample on 4 July was smaller, which was related to the longer duration of rainfall that occurred on that sampling date. Subsequently, the measured moisture content on 10 July, 15 July, 26 July, 5 August, and 18 August was all higher and at a peak stage, which was related to the heavy rainfall during the days from 10 July to 18 August. On 27 August, the reading was very low; 27 August was less than ten days after the last sampling, and since there was no rainfall during the period and the temperature was high, the crops required more water. This resulted in a reduction in the soil moisture content in the field. There was considerable rainfall between the sampling day on 27 August and the sampling day on 4 September, so the observed moisture content on September 4 increased. Since there was only one small rainfall after the sampling on September 4 and the cotton was in the early stage of wadding, which requires a large amount of water, the measured value on September 18 dropped again and was only 10%. However, the water level in the periphery rose in November, and even if the sampling day was longer than the rainfall day, the moisture content still rose.
The change in the moisture content in the 20 cm soil layer fluctuated significantly from 10 May to 23 June. Due to prolonged rainfall, the measured value reached a peak on 23 June. Without rain for a long period of time, the fourth of July fell to a trough. There was rain from 4 to 10 July, and the moisture content rose slightly. It fell on 15 July, but not significantly. It returned to the peak on 26 July, which was related to a heavy rainfall from 15 to 26 July. When there was no rain for nearly ten days, the small amount of rain on August 4 did not make the field moisture content rise, and the measured value fell to a low point on 5 August. After the heavy rainfall on 15 August, the moisture content rose to a peak on 18 August and fell to the trough on 27 August. It peaked again on 4 September and bottomed on 18 September. It did not recover until November, when the water level rose outside. In summary, the moisture content of the 20 cm soil layer was closely related to the rainfall frequency and rainfall amount during the entire growth period. It increased or decreased with rainfall frequency and the rainfall amount, and it was generally maintained at approximately 25%. There seemed to be little difference between the different control water level treatments, and the fluctuation law was basically the same.
The water content fluctuation law of each treatment of the controlled drainage in the 40 cm soil layer was basically the same as that in the 20 cm soil layer, which is closely related to rainfall. However, there was a large difference between each treatment at the peak point and the trough point. When the water level was controlled at 80 cm, the fluctuation was more obvious than that at 30 cm and 50 cm. At the trough point on 4 July, it was much lower than that of the other treatments. The measured values on 10 July, 15 July, 26 July, 5 August, 18 August, and 27 August were the peak, trough, peak, trough, peak, and trough of the water content, respectively, which were higher than that of the other treatments. The change law of the control water level at 30 cm and 50 cm was basically the same. For the free drainage treatment variation rule and other processing on 4 July, 10 July, 15 July, 26 July, 5 August, 18 August, 27 August, and 4 September, only one obvious peak value, the highest value, occurred on 5 August in a total of eight observations. It then fell to a low on 27 August. In addition, after 4 September, 18 September, and 19 November, the three observations change rule was the same as that of the control drainage treatment.
The soil moisture content in the 60 cm and 80 cm soil layers had no obvious change law, and the change law of each treatment was not consistent. In addition, the relationship with the rainfall was not as obvious as that in the 20 cm and 40 cm soil layers. The observation value of the treated 80 cm soil layer with a water level of 30 cm had a big peak on 26 July, which was related to a heavy rainfall from 22 to 24 July. The observation results of the treatment with 50 cm water level control on 26 July, 5 August, and 18 August were all higher. This indicated that the water content in the deep soil may have increased due to the delayed drainage under the condition of high-water level control. In conclusion, the influence of rainfall on the soil moisture content in the soil below 40 cm was not obvious. In general, under the controlled drainage conditions, the soil moisture content of the 60 cm and 80 cm soil layers fluctuated more obviously than that of the free drainage treatment.
The sampling dates in 2009 were 15 May, 12 June, 9 July, 23 July, 8 August, 29 August, 14 September, 24 October, and 23 November, and the irrigation occurred once on 11 September, with an irrigation amount of 90 mm. The period from 10 July to 18 September 2009, had less rainfall and was a drier year.
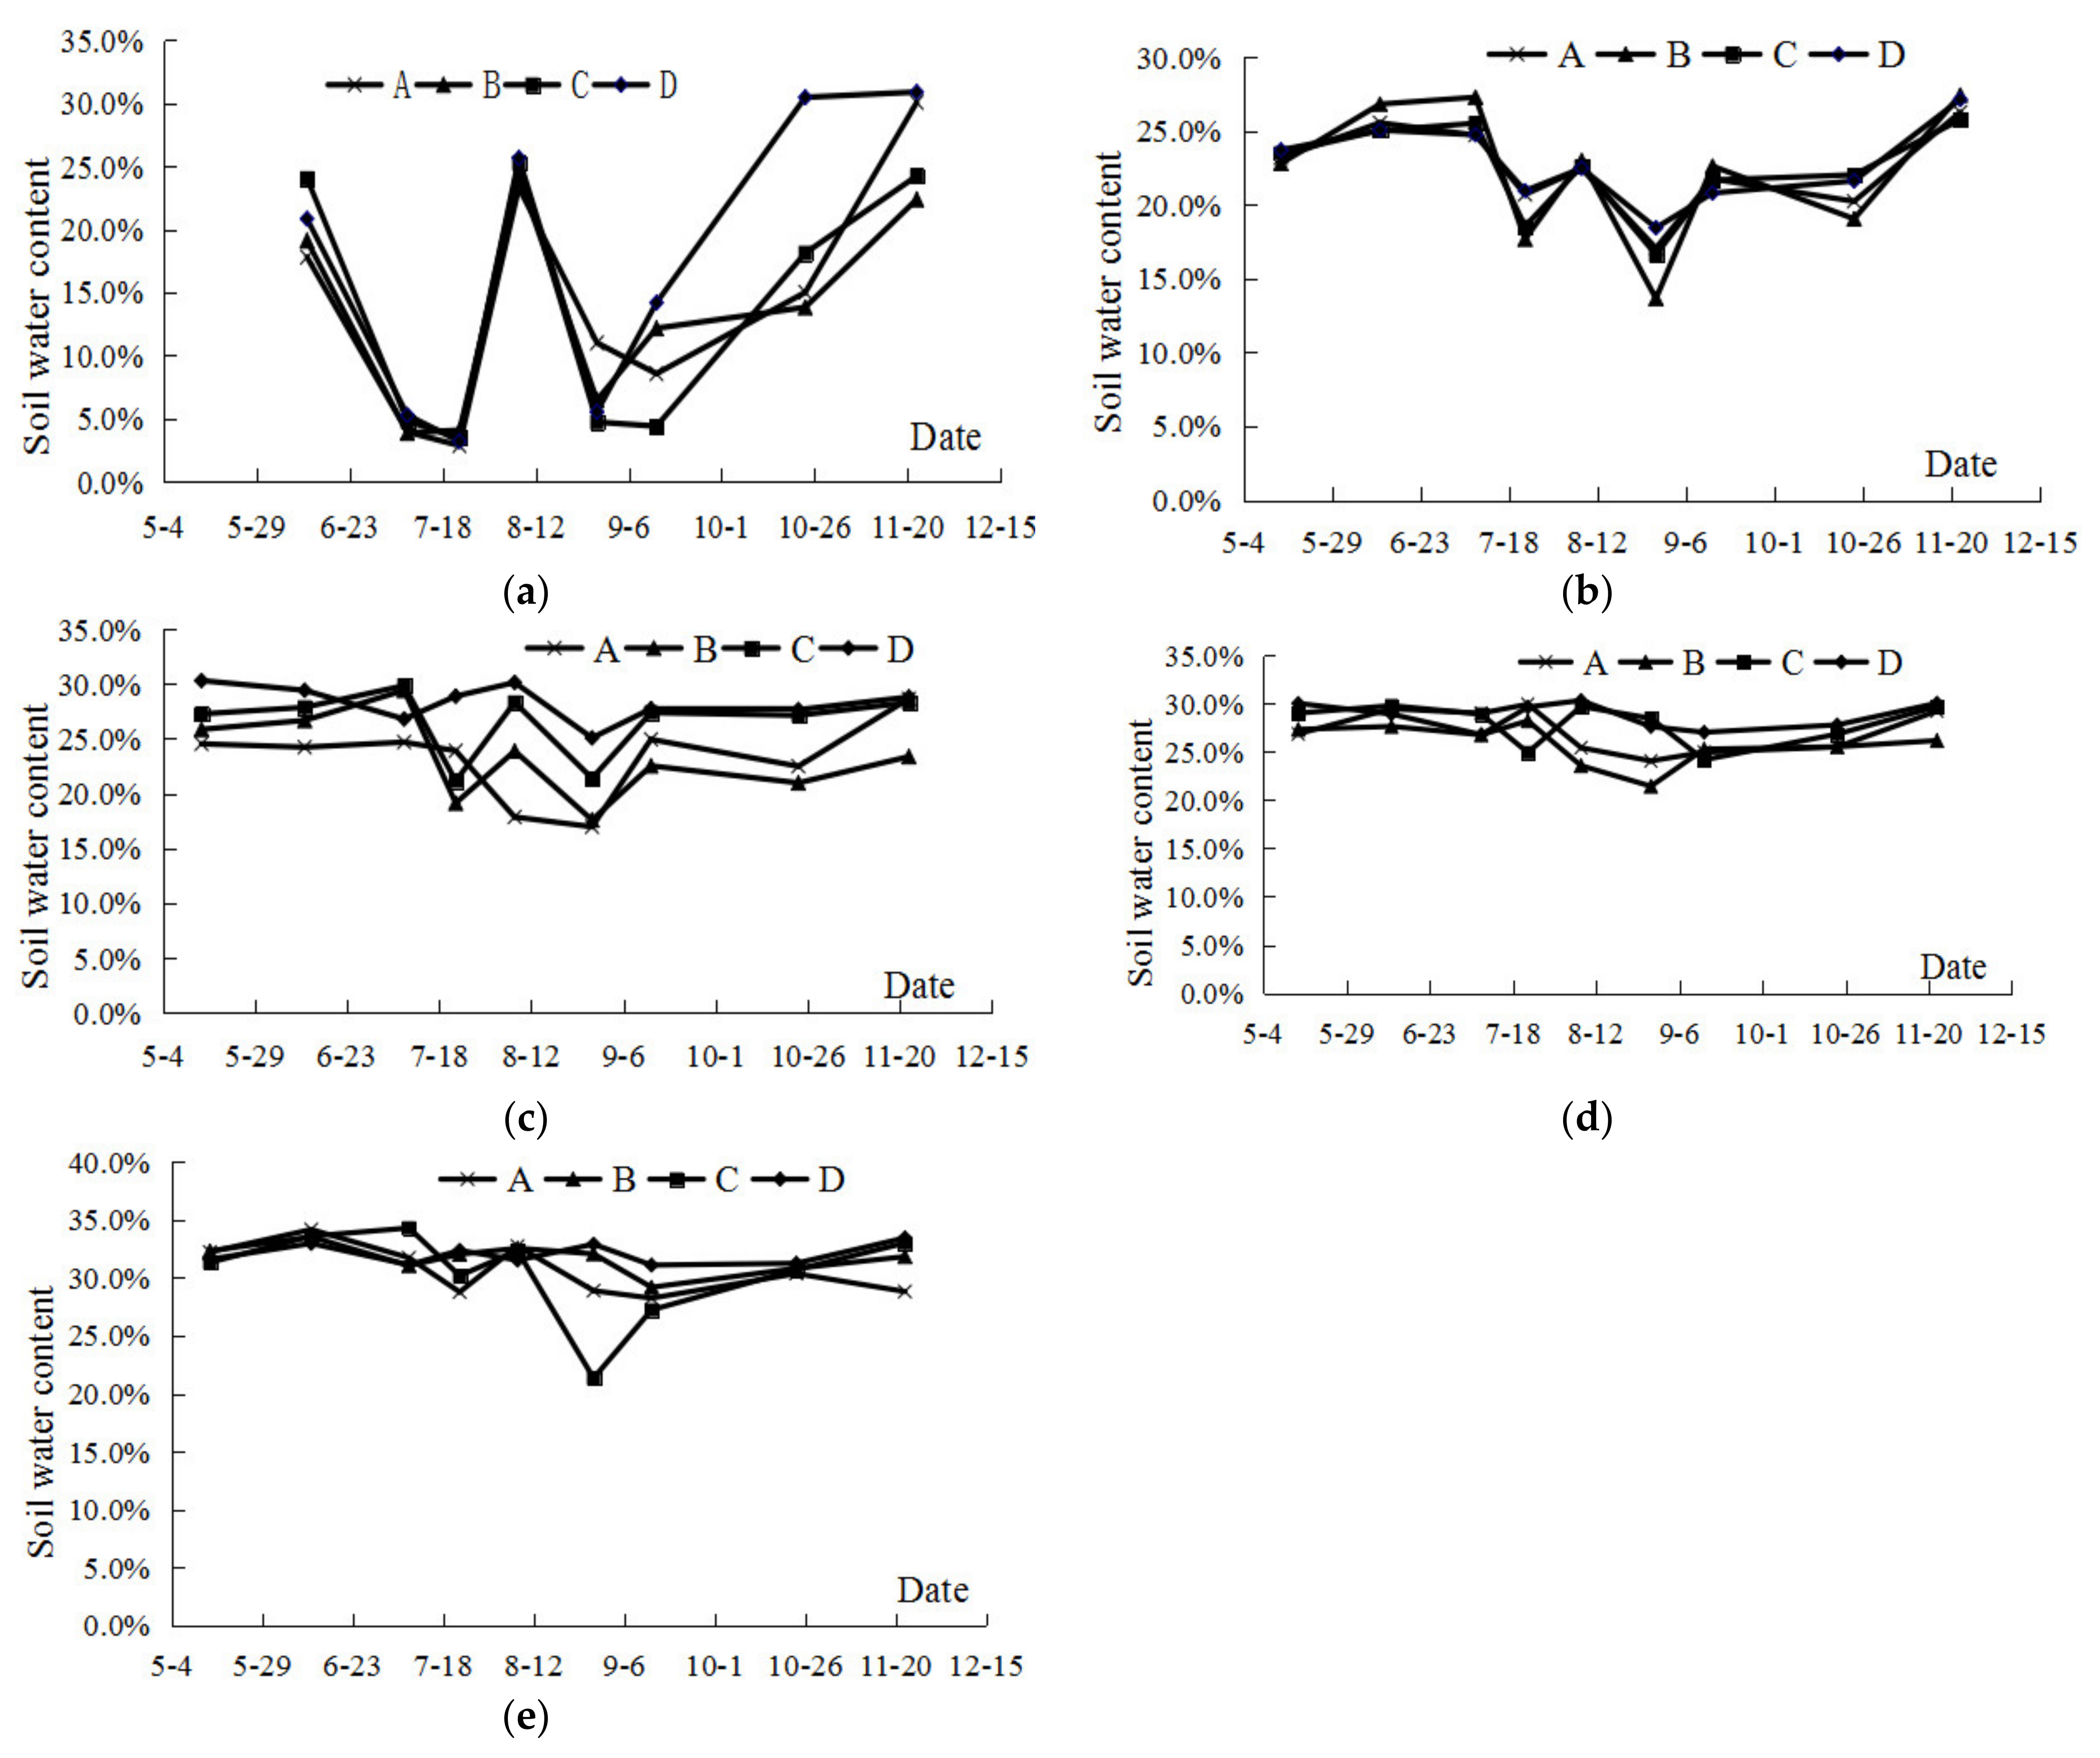
Figure 4 shows the change in the soil moisture content from the surface to the 80 cm soil layer during the entire growth period during 2009. As can be observed from the figure, the change law of surface soil moisture and moisture content was obvious during the entire growth period. The surface sampling began on 12 June, and the measured moisture content value was relatively high. On 9 July, the moisture content significantly decreased compared with that on 12 June, and it dropped even lower on 23 July. This drop was related to the absence of rainfall. The moisture content increased to the peak value on 8 August, and there was more rainfall between 24 July and 8 August. Subsequently, the observed values on 29 August all decreased significantly. The observed value on 14 September slightly increased, which was related to the irrigation on 11 September. Although the irrigation volume was relatively large, the observed value did not increase much due to the early drought, and the irrigation water did not fully moisten the soil after it reached the field. It was not until October and November that the outer water level rose and the underground water supplied the soil water. Then, the observed moisture content began to rise. In conclusion, the changes in the early stage of each treatment were basically the same, and the differences appeared after September. The highest observed value of the free drainage treatment was related to the fact that the free drainage treatment was close to the irrigation ditch.
The variation in the soil moisture content in the 20 cm soil layer was more obvious than that in the surface layer, and the observed values on 12 June and 9 July were higher, constituting a peak. The observed value fell to a trough on 23 July, which was related to the absence of rainfall between 10 and 23 July. The observed value rose to a peak on 8 August, fell to a trough on 29 August, and rose after irrigation on 14 September. As can be observed from the figure, the free drainage treatment had a smaller rise range than the control drainage treatment. On 23 October, the control water level of the 80 cm treatment and the free drainage treatment continued to rise, while the control water level of the 30 cm and 50 cm treatments decreased. In November, the moisture content of all the treatments increased significantly, which was related to a rise in the peripheral water level and the recharge of soil moisture in the field. In conclusion, the variation law of the soil moisture content in the 20 cm soil layer was closely related to rainfall and irrigation, but the moisture content did not fluctuate greatly due to low rainfall.
The change in soil moisture content in the 40 cm soil layer was basically the same as that in the 20 cm soil layer, but the fluctuation range was larger. In addition, the size difference between the treatments was also larger. With the exception of the treatment with a water level of 30 cm, the changes in the other three treatments were basically the same. The treatments with water levels of 50 cm and 80 cm completely had the same changes during the entire growth period, and the soil moisture content of the treatment with a water level of 80 cm was always higher than that with a water level of 50 cm. The change in the observed value in the free drainage treatment before 8 August was different from the other treatments. The change in the observed value after 8 August was consistent with the treatment of the control water level of the 50 cm and 80 cm layers, but the value was higher. Prior to 14 September, the change in water content in the treatment with a water level of 30 cm was completely different from the other treatments. The observed values on 15 May, 12 June, 9 July, and 23 July showed no significant fluctuations, but decreased to the trough on 8 August and 29 August and rose again on 14 September, 24 October, and 23 November. The change in the soil moisture content in the 60 cm and 80 cm soil layers had no obvious rule, and the relationship with rainfall was not obvious.
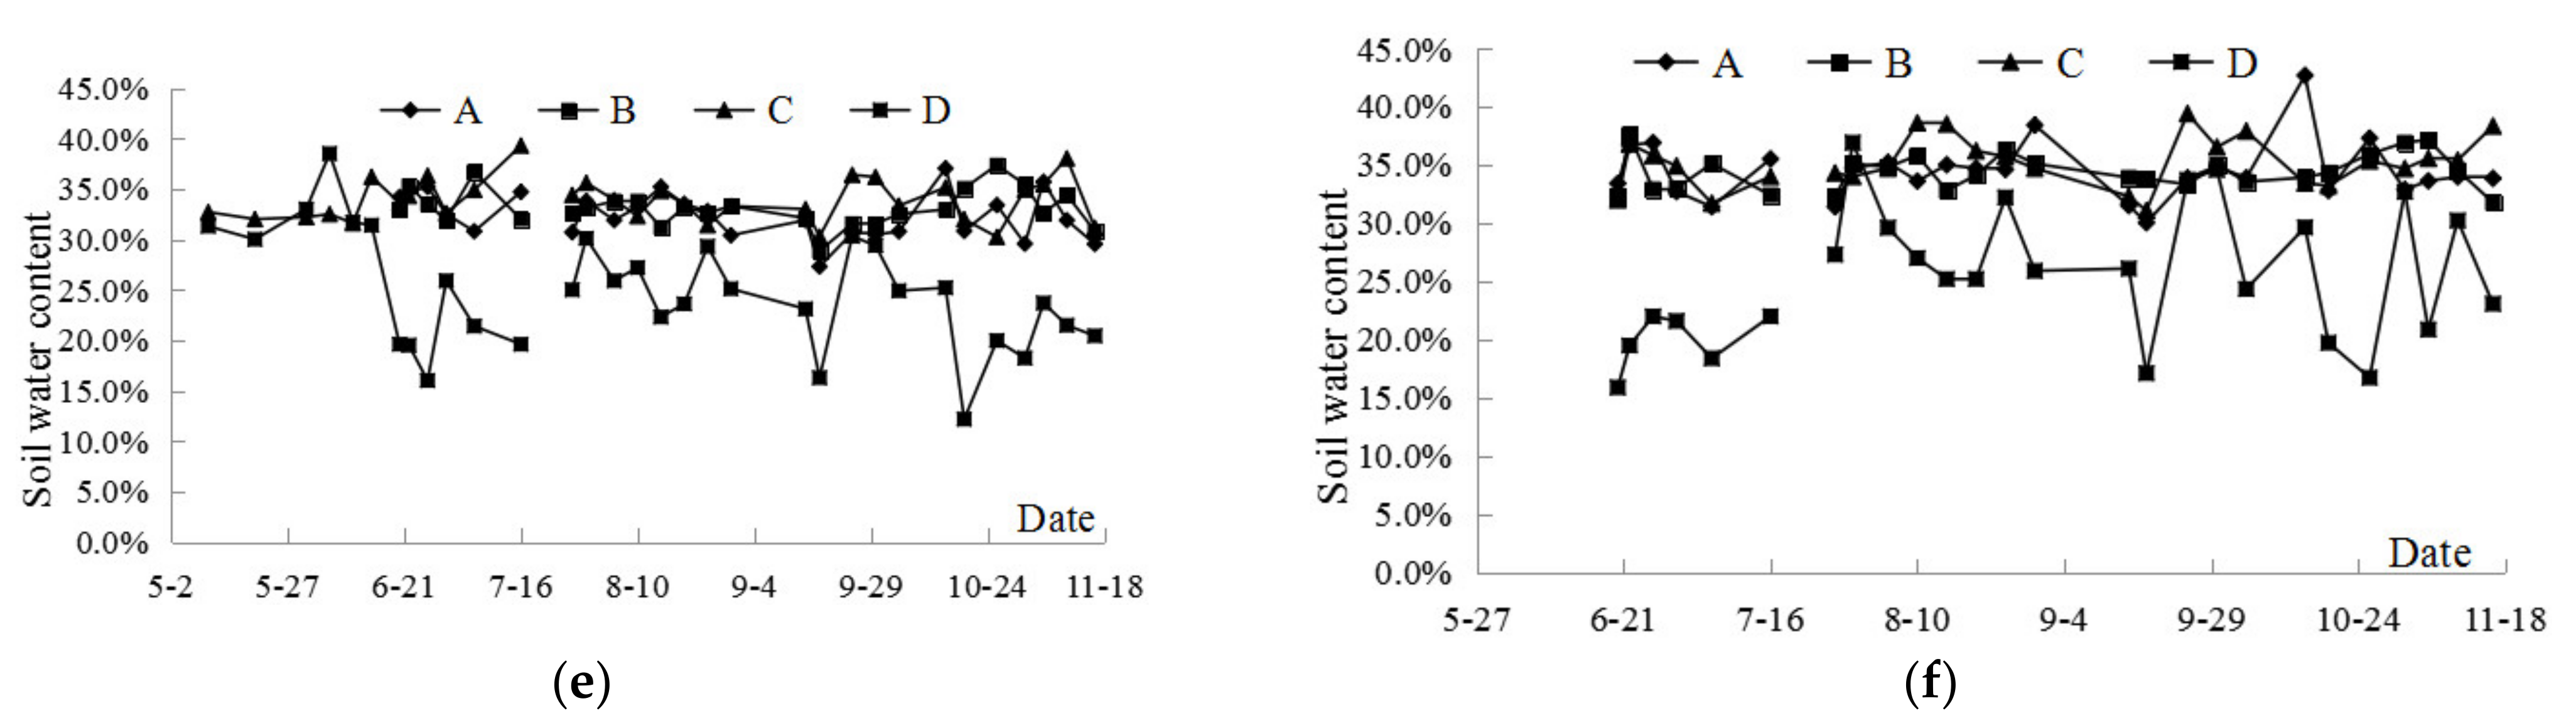
As can be observed from Figure 5, the surface soil moisture content fluctuated greatly, and the variation law of the moisture content for each treatment was basically consistent, which was closely related to rainfall. The variation in the soil moisture content for the 20 cm soil layer was smaller than that of the surface layer. The soil moisture content of the 40 cm and 60 cm soil layers had multiple obvious peaks. The moisture contents in the free drainage treatment of the 80 cm and 100 cm soil layers were significantly lower than that in the controlled drainage treatment, and the peaks in each treatment layer were not as obvious as those in the other soil layers. During the entire growth period, the moisture content of the free drainage treatment was generally lower than that of the controlled drainage treatment. After September, the water content of the controlled drainage varied significantly.
3.2. Soil Moisture in the Pits
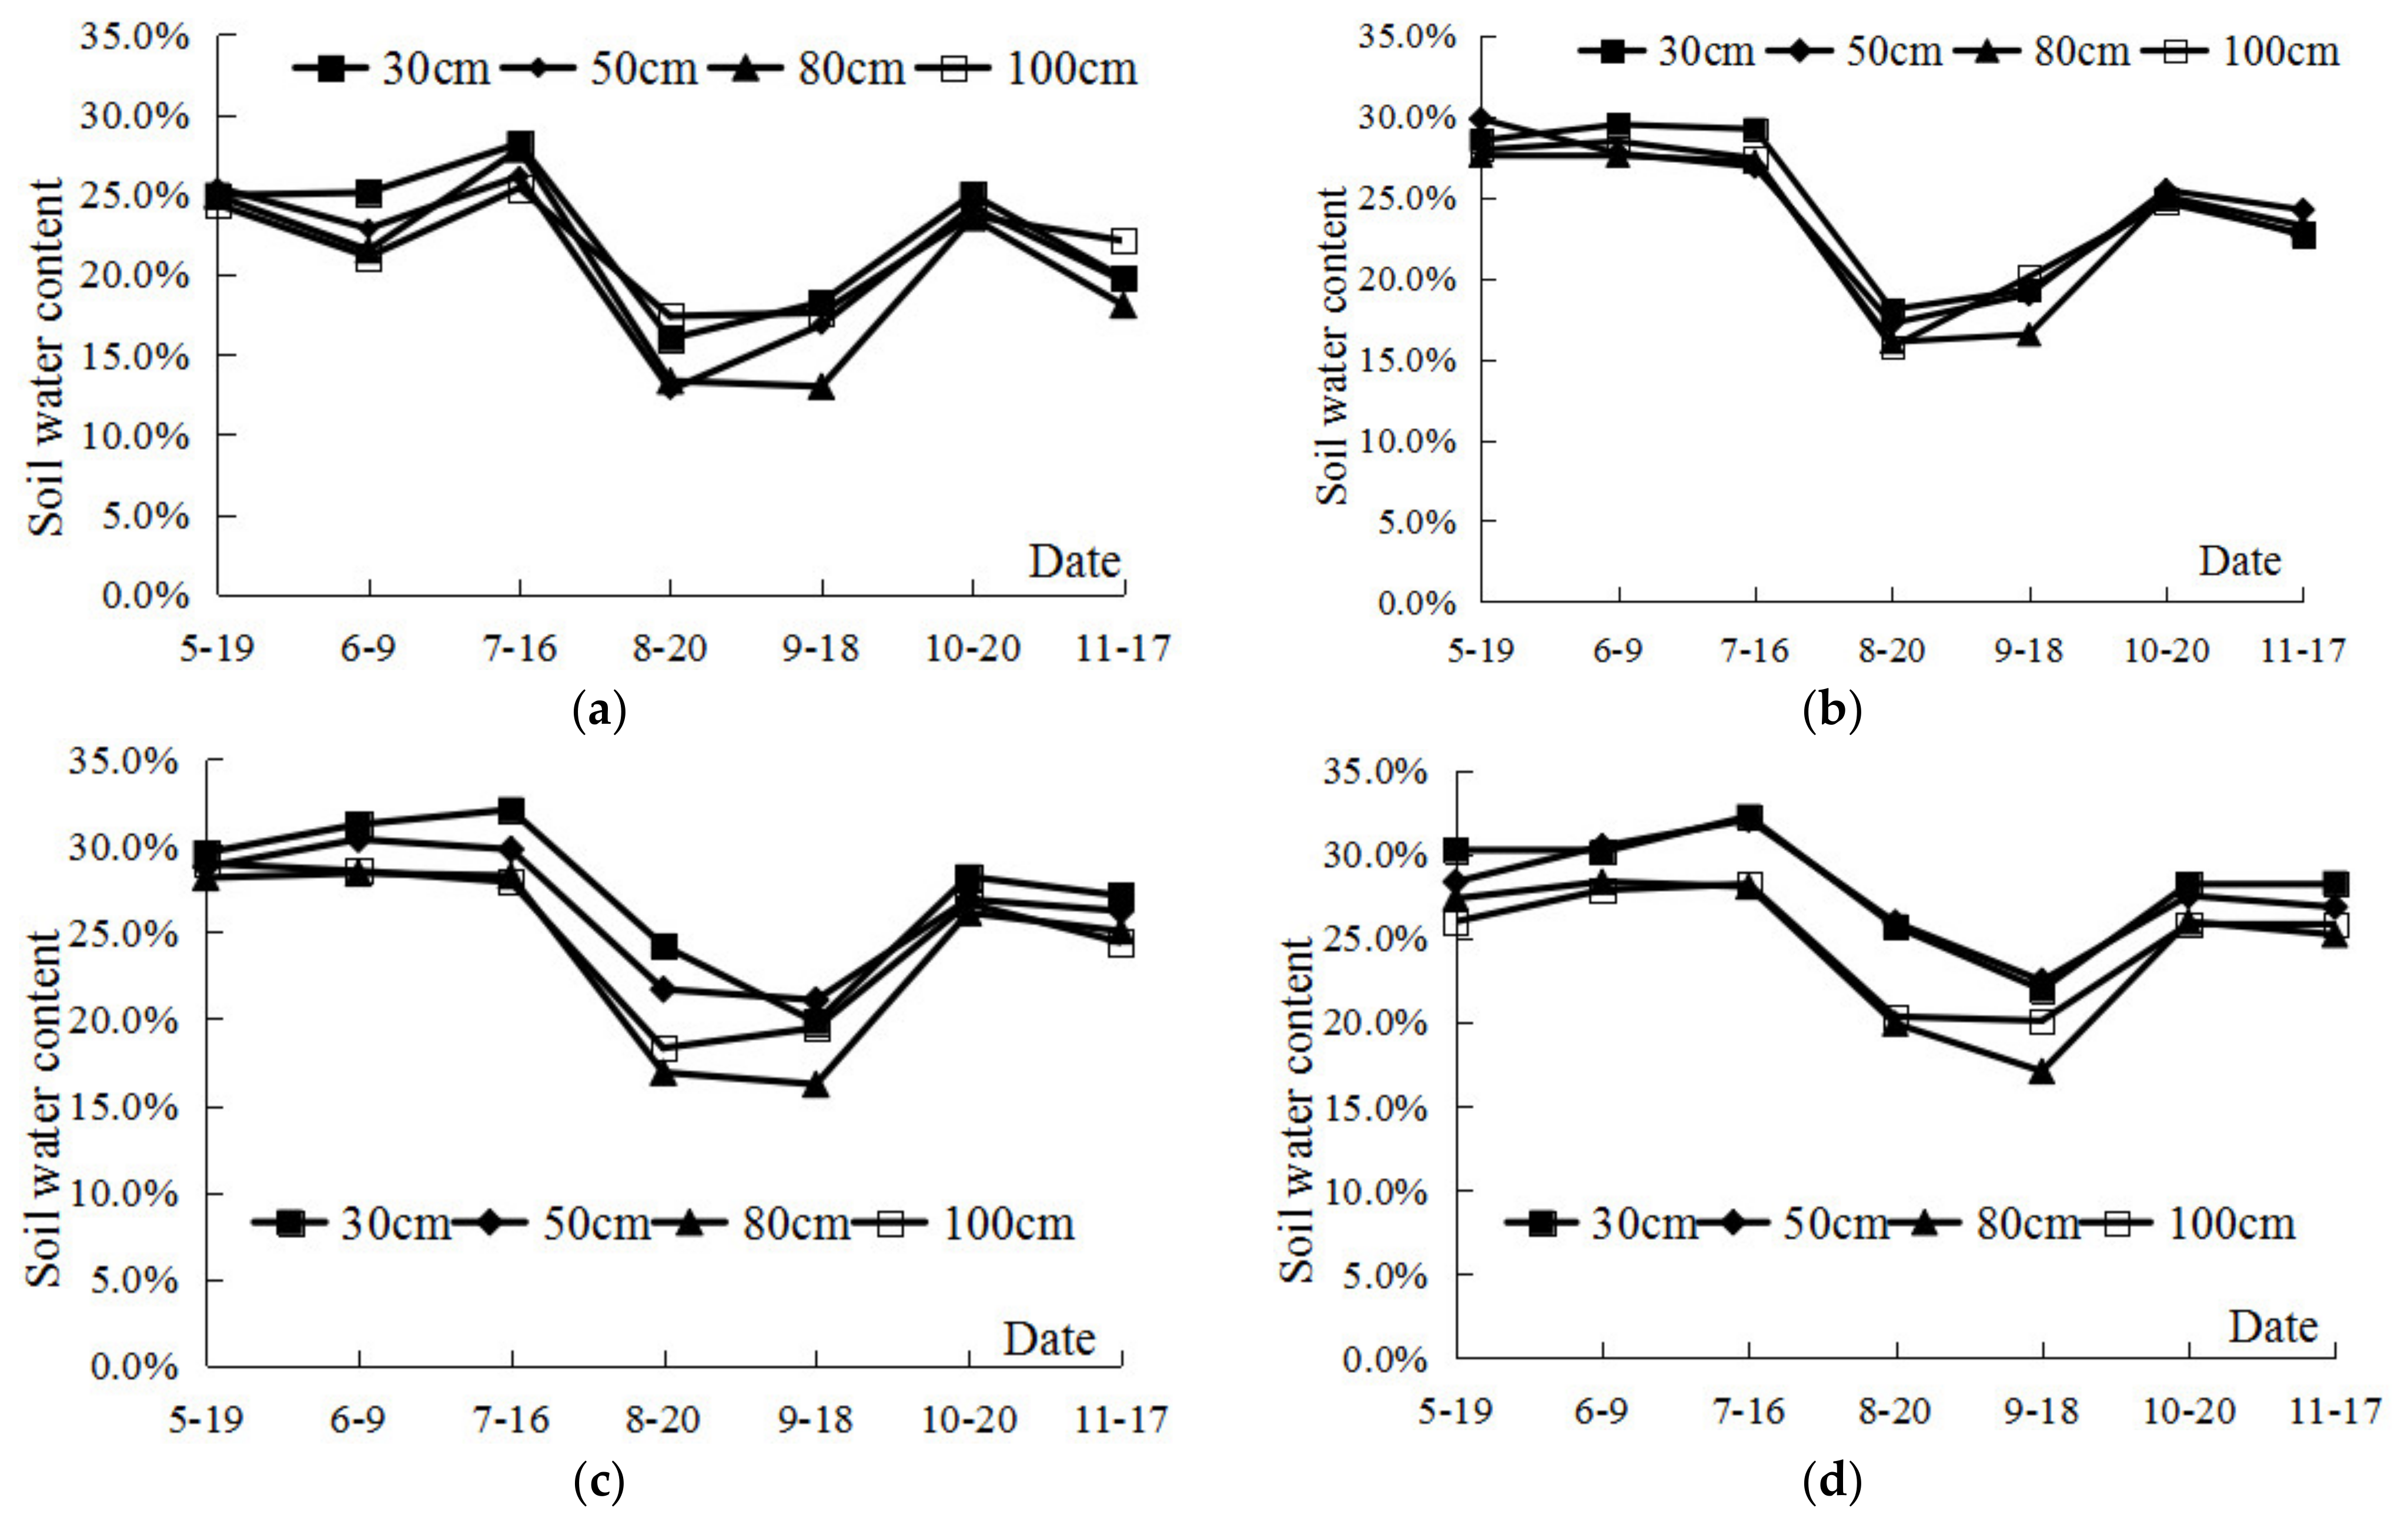
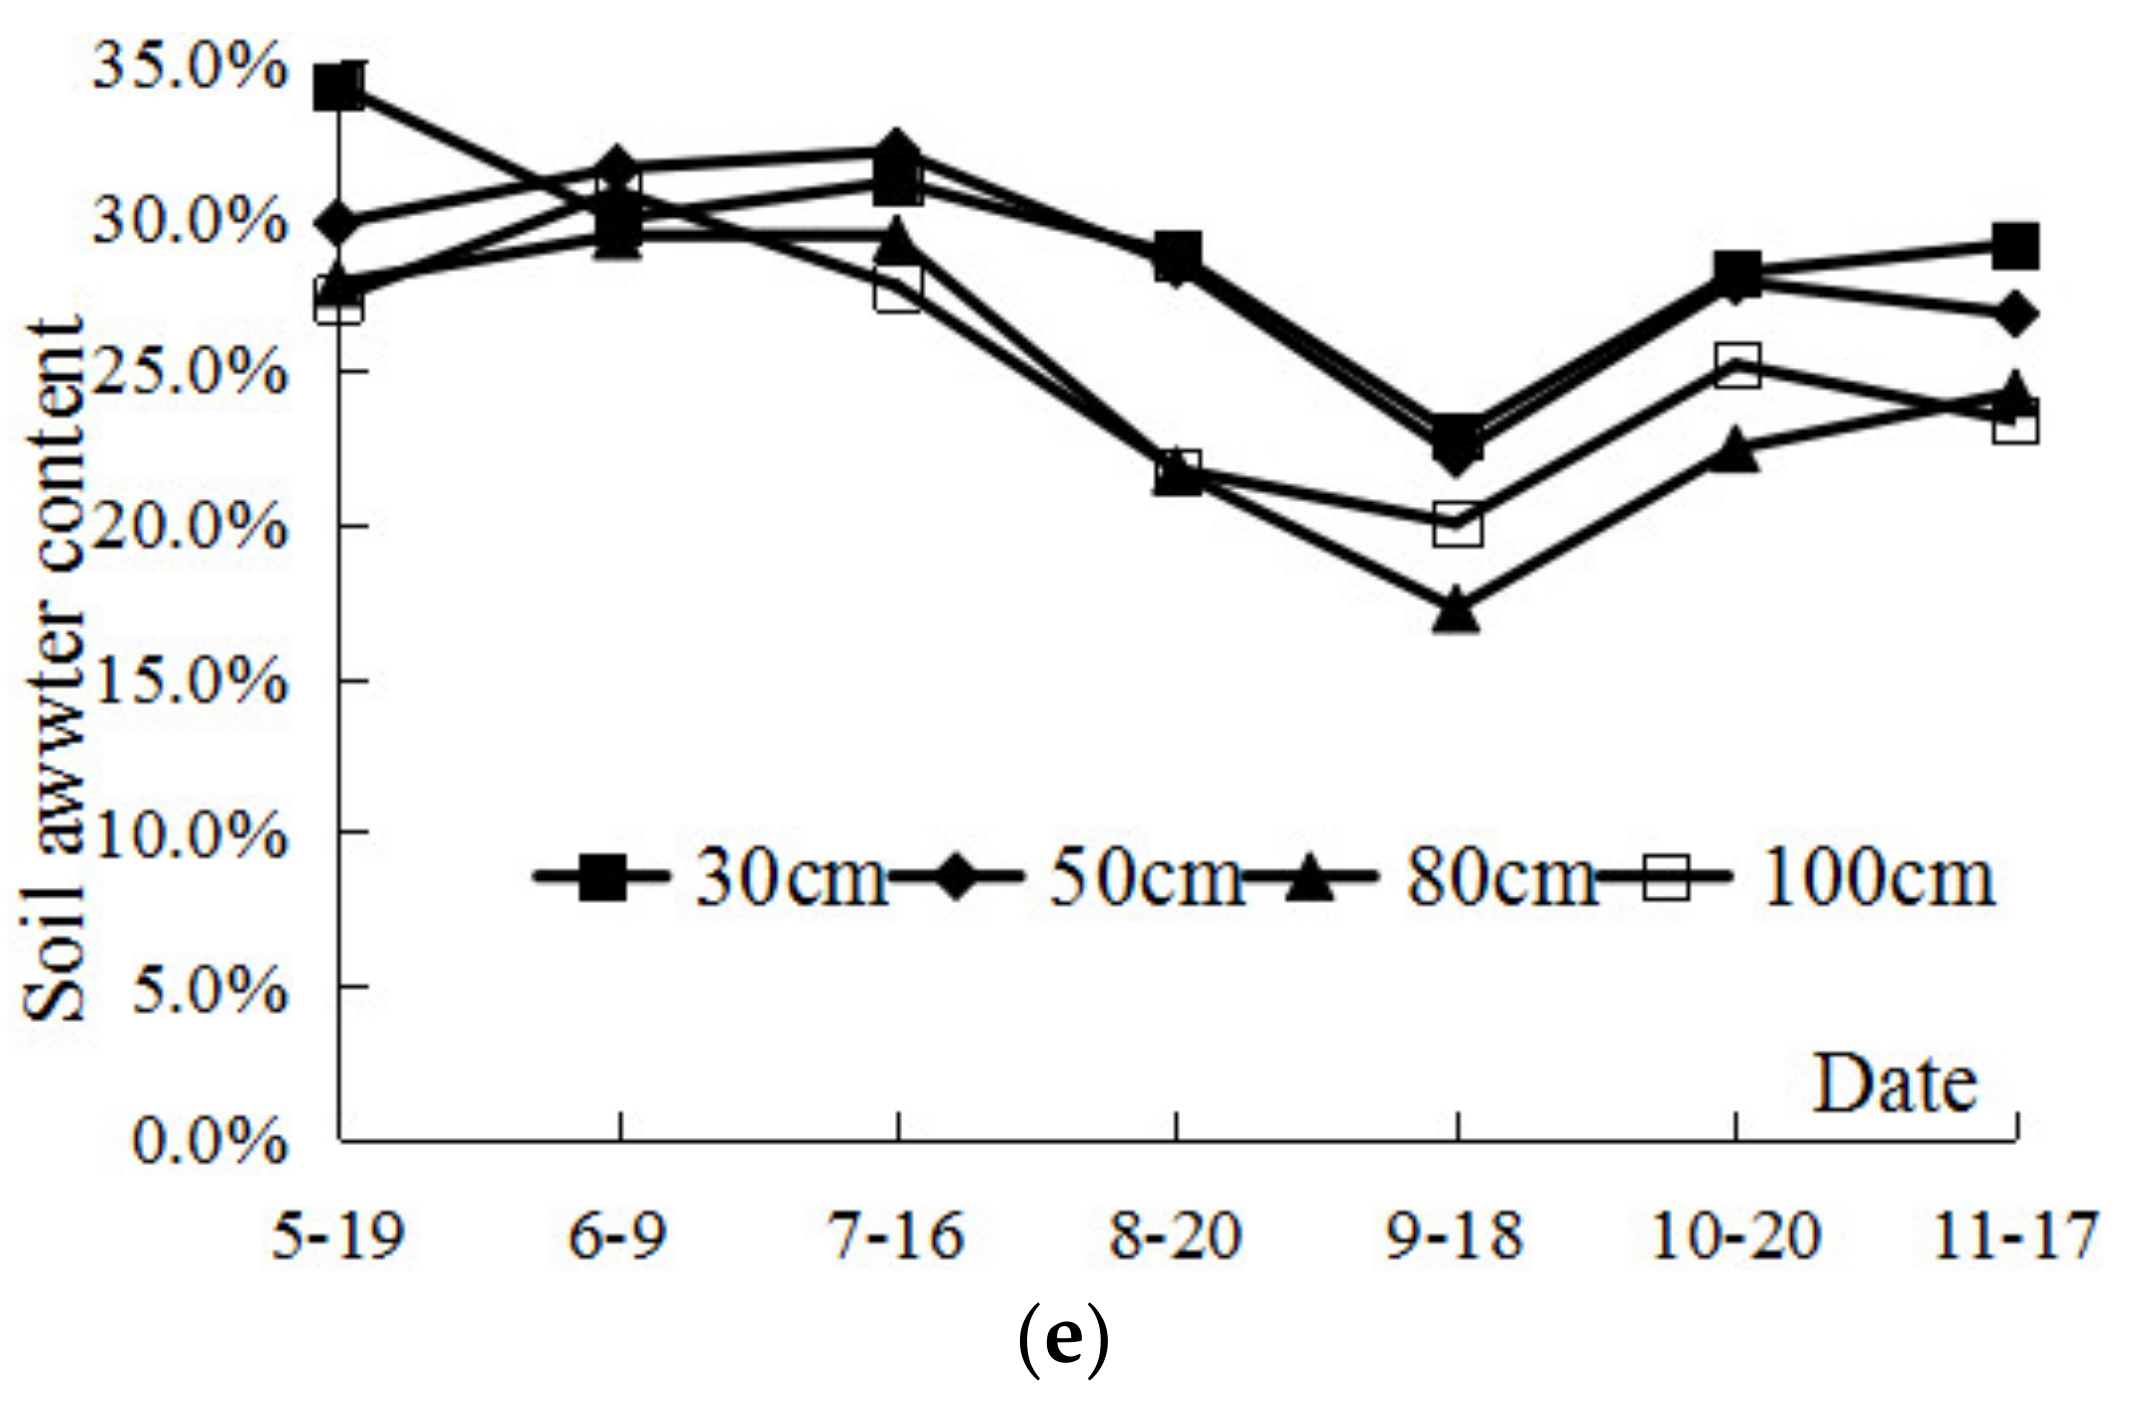
Figure 6 shows the change of soil moisture content during the whole growth period of the measured pits. From the surface layer to the 80 cm layer, the variation trend of soil moisture content is basically the same, and the soil moisture content is relatively high in May, June, and July. The soil moisture content decreased in August and September. It rose in October but was lower than the observed value in July. The water content dropped in November. The observed values of water content in the 40 cm, 60 cm, and 80 cm soil layers treated with the control water level of 80 cm and 100-100-100-100 cm were lower than those treated with the control water level of 30-40-40-30 cm and 50-60-60-50 cm.
3.3. Soil Water Balance after Single Rainfall in the Field
Table 5 presents the calculation table of the change in the soil water storage in the field between the two sampling times on 6 July and 16 July in 2010. The rainfall from 8 to 13 July was 219.8 mm, during which the soil water content of the field was measured. After calculation, it was found that the treated water storage with the control water levels of 30 cm and 50 cm increased after the rainfall: The higher the control water level, the greater the increase. The treated water storage with the control water levels of 80 cm and 100 cm reduced: The higher the control water level, the smaller the reduction. According to the calculation results of the soil water storage in each soil layer, when the control water level was 30 cm and 50 cm, the water storage in the 20 cm soil layer changed the most.
As it can be observed from the table, the soil water storage increased after a single rainfall for the treatments with the control water levels of 30 cm and 50 cm, while the soil water storage decreased after a single rainfall in the treatment with the control water level of 80 cm and the free drainage treatment. The surface soil moisture content with the control water level of 30 cm increased, and the water storage increased by 8 mm. The surface soil moisture content with the control water level of 50 cm decreased, and the water storage decreased by 33 mm. This result indicated that the control water level was too high, which resulted in the retention of soil moisture in the surface layer. Of course, this was also related to the initial soil moisture content.
3.4. Soil Nitrogen Balance Calculation in the Entire Growth Period
When measured data of nitrogen (N) losses to the environment are not available, calculated N balances are often used to indicate losses [18]. The nitrogen balance calculation of cotton in one growth period in 2009 is shown in Table 6. It can be deduced from the calculation of the nitrogen balance in the above-mentioned table that the nitrogen input from rainfall and irrigation was very small, accounting for 1–2% and 1% of the fertilizer application, respectively. The increment of plant nitrogen is the amount of nitrogen absorbed by crops during the growth period, and the proportion of this portion in the fertilizer application is the fertilizer utilization rate. The N utilization rates of the fields D, C, B, A, and E were 39%, 47%, 41%, 36%, and 36%, respectively. Hence, the highest nitrogen efficiency was in field C. The increment of mineral nitrogen in the effective soil layer included the increment of nitrogen reserves in the two main forms of mineral nitrogen, nitrate nitrogen and ammonium nitrogen, in the 0–100 cm soil layer. It can be observed from the above-mentioned table that the increment of mineral nitrogen in field D was the smallest, while that in field A was the largest, and the difference between the two was large. Finally, the sum of the organic matter mineralization amount and the nitrogen loss amount was small or even negative. This indicated that the organic matter mineralization nitrogen amount was relatively large.
3.5. Soil Nitrogen Balance after a Single Rainfall in the Field
The nitrogen balance study period considered in this study refers to the nitrogen balance before and after a rainfall that was different from the nitrogen balance during the entire growth period. Since the time before and after rainfall is short, the amount of nitrogen absorbed by the crops was not considered in the equilibrium equation. There was no fertilization during the study period, so inorganic and organic nitrogen inputs did not exist. With the support of relevant data, nitrogen loss can be divided into nitrogen loss with surface and underground runoff and deep leaching loss at the 100 cm interface. Three drainage processes, D723 (samples were taken on 23 July), D815 (samples were taken on 15 August), and D830 (samples were taken on 30 August) in 2009, with short time intervals and statistical data were selected as the analysis objects. The specific calculation results are shown in Table 7.
It can be observed from the statistical results that the nitrogen input from rainfall or irrigation and the nitrogen discharge from the surface and underground runoff were relatively small compared with the change in mineral nitrogen in the effective soil layer. Hence, the size of the last term was largely determined by the change in the mineral nitrogen in the effective soil layer. Overall, the increment of the soil mineral nitrogen was effectively D830 < D815 < D723, and this was because the D830 drainage process before and after the removal of shortest time interval (eight days) can more truly reflect the situation of mineral nitrogen leaching in the soil profile. Therefore, the mineral nitrogen increment was D830 < D815 < D723. This law also shows that the soil profile after the rain of the organic matter resulted in an increase in mineralization. Hence, the soil mineral nitrogen content in the short term can recover or even exceed that before rainfall.
4. Discussion
In this part, the influence mechanism of controlled drainage on soil moisture is discussed, the influence of controlled drainage on soil nitrogen stability at different depths is analyzed, and the influence of controlled drainage measures on water and nitrogen production by changing boundary conditions is also discussed.
4.1. Effect of Controlled Drainage on the Soil Moisture
The use of control drainage measures in the field has certain requirements on the farmland. Firstly, the water demand of the test crops at different growth stages should be consistent with the local rainfall. Secondly, the field in the area should not have a large slope, etc. [19]. There is no clear linear relationship between the control water level in the field and the soil moisture content. This linear relationship means that, for example, the control water level of 30 cm corresponds to the field moisture content of 35%, the control water level of 40 cm corresponds to the soil moisture content of 30%, and the control water level of 50 cm corresponds to the soil moisture content of 25%, and so on. Through a large number of continuous field and pit controlled drainage and free drainage tests, it was found that the soil moisture content was high near the drainage outlet and relatively low when located far away from the drainage outlet within 1–2 d after rainfall or irrigation after the implementation of controlled drainage measures. After a period of time, the entire control drainage field area soil moisture achieved a uniform distribution, usually after 4 to 5 d or after a longer period of time (depending on the size of the rainfall) [20]. This was because the controlled drainage changed the drainage boundary conditions and stranded the moisture in the field; that resulted in the change in soil water potential [21]. Under the condition of no rainfall or irrigation supply, the soil moisture content will continue to decrease until it reaches the lower limit due to evapotranspiration. Controlling drainage changes the field drainage outflow and, on the one hand, changes the total amount of drainage and, on the other hand, changes the ratio of surface and subsurface drain outflow [22,23,24]. In this paper, the critical test period was from May to September. By performing analysis before and after three typical rainfalls, we found that soil moisture increased when the controlled water level is 30 cm and 50 cm, and soil moisture decreased when the controlled water level is 80 cm and free drainage. We concluded that control drainage measures can significantly change the soil moisture content in the short term and reduce the variance over a long period of time.
4.2. Nitrogen Stability
Gitte et al. [25] summarized nitrogen leaching loss through long sequence field N balances calculation under different soil types, and the results were used to evaluate nitrogen leaching in different soil types. Nitrate nitrogen is more active than ammonia nitrogen in the soil and is more easily lost than ammonia. Nitrate leaching is an important yet difficult to manage contribution to groundwater and surface water contamination in agricultural areas. Of all performance metrics, N input was most closely aligned with field-level crop N harvest and nitrate leaching [26]. The nitrate nitrogen was the main sources of groundwater pollution [27,28]. In this study, the ratio of the average content of nitrate nitrogen and ammonia nitrogen in each treatment during the entire growth period in 2009 (see Table 8) was used to evaluate the effect of the controlled drainage and nitrogen application on the nitrogen content in the test pits. The F value represents the relative content of nitrate nitrogen and ammonia nitrogen. The larger F is, the higher the relative content of nitrate nitrogen, and more nitrogen is easily lost. This can be observed in Table 8.
The F value of each treatment basically decreased with an increase in the soil depth. This is consistent with Kou’s findings. In different growth processes, there will be concentration and consumption of nitrate in different depth [29]. In the same soil layer, the F value was ranked as 100 > 50 > 30 according to the treatment of the controlled water level. Controlled drainage increased the relative content of ammonia nitrogen in the soil, increased the stability of nitrogen in the soil, and reduced nitrogen loss. No increase or decrease in the nitrogen application was required in the control water level treatment.
4.3. The Effect of Boundary Condition on the Water and Nitrogen Balance under Controlled Drainage
The effect of controlled drainage measures on the soil moisture was obvious in the test pit, and the soil moisture content increased with the control water level. This was not obvious in the field, and the soil moisture content had no obvious change rule with the water level control. The soil water flux was changed by using controlled drainage measures, and the influence was closely related to the size of the test area. The boundary condition in the field belonged to the deep boundary of the groundwater, and the boundary condition of the pit was the free drainage boundary. The difference was related to whether there was any groundwater recharge. Lateral water motion in the large field existed; however, this movement could be ignored in the pit, and only vertical infiltration was affected.
The observations showed that whether in the field or in a test pit, controlled drainage changed the soil water content, and there were some differences between the two conditions. In the test pits, the soil water content was positively correlated with the controlled water table level. However, in the field, the relationship between the controlled water table and the soil water content was not definite. Two factors related to this result must be mentioned. First, some groundwater replenishment through the soil capillarity in the field occurred when the soil moisture content was very small. Second, there were many impact factors in the field, and the measurement error was greater.
R. Wayne Skaggs [30] summarized the effect of controlled drainage on the drain outflow in different areas under different kinds of soil. The difference of drain outflow reduction was mainly caused by soil diversity and location. They concluded that it must observe lateral and vertical seepage accurately on a large scale in order to study the effect of controlled drainage on drain outflow. ET and lateral seepages were reduced under controlled drainage, but it was not the root cause of drain outflow reduction and the vertical seepage was non-ignorable. Lateral seepage losses due to controlled drainage depend very much on scale. Youssef Mohamed, A. et al. [31] used a Drainmod model to simulate water transport under controlled drainage and free drainage conditions. It is considered that the change of water displacement due to controlled drainage is mainly due to lateral leakage. Ninety-six percent of the reduction in subsurface drainage due to controlled drainage was attributable to lateral seepage. This conclusion is consistent with our research results.
5. Conclusions
Based on the controlled drainage experiment, the conclusions are summarized as follows.
(1) Whether in the field plots or the test pits, controlled drainage changed the soil moisture content. In the test pits, the soil water content was positively correlated with the controlled water table level. In the test pits, the controlled drainage measures had long-term impacts on the soil moisture content.
(2) Without groundwater recharge, the soil moisture content and the water level control possessed a good positive correlation under the controlled drainage condition. With groundwater recharge, the condition of soil moisture content under the controlled drainage was higher than under free drainage. However, the relationship between the soil moisture content and the water level control was not clear, and the horizontal motion of water had a great influence on the soil moisture content.
(3) Nitrogen stability will be changed after controlled drainage because nitrate and ammonia nitrogen content were changed. When the controlled water level was 30 cm or 50 cm, the amount of nitrogen mineralization was larger than that under the free drainage treatment.
(4) Controlled drainage water management could be implemented in Hubei Sihu district, which will alleviate the loss of production caused by waterlogging. Furthermore, the suggested control water level is 30 cm or 50 cm.
Author Contributions
N.Y.: Data curation; Formal analysis; Investigation; Writting-original draft. Y.X.: Formal analysis; Investigation; Y.L.: Writting-review & editing. B.X.: Formal analysis; Investigation; F.L.: Project management. All authors have read and agreed to the published version of the manuscript.
Funding
We are grateful for grants from the National Natural Science Foundation of China (U2040213, 51709010, 51409007), the Central Public-Interest Scientific Institution Basal Research Fund for Changjiang River Scientific Research Institute(CKSF2019174/NY).
Acknowledgments
We thank LetPub (www.letpub.com) for its linguistic assistance during the preparation of this manuscript.
Conflicts of Interest
The authors declare no conflict of interest.
References
- Luo, W.; Jia, Z.; Fang, S.; Wang, N.; Liu, J.; Wang, L.; Tian, S.; Zhang, Y. Outflow reduction and salt and nitrogen dynamics at controlled drainage in the YinNan Irrigation District, China. Agric. Water Manag. 2008, 95, 809–816. [Google Scholar] [CrossRef]
- Madramootoo, C.A.; Dodds, G.T.; Papadopoulos, A. Agronomic and environmental benefits of water table management. J. Irrig. Drain. Eng. 1993, 119, 1052–1064. [Google Scholar] [CrossRef]
- Osmond, D.L.; Gilliam, J.W.; Evans, R.O. Riparian Buffers and Controlled Drainage to Reduce Agricultural Non-Point Source Pollution; North Carolina Agricultural Research Service Technical Bulletin 318; North Carolina State University: Raleigh, NC, USA, 2002. [Google Scholar]
- Evans, R.O. Controlled versus conventional drainage-effects on water quality. In Proceedings of the Management of Irrigation and Drainage Systems, Park City, UT, USA, 21–23 July 1993; ASAE: St. Joseph, MI, USA, 1993; pp. 511–518. [Google Scholar]
- Liu, W.; Youssef, M.A.; Birgand, F.P.; Chescheir, G.M.; Tian, S.; Maxwell, B.M. Processes and mechanisms controlling nitrate dynamics in an artificially drained field: Insights from high-frequency water quality measurements. Agric. Water Manag. 2020, 232, 106032. [Google Scholar] [CrossRef]
- Lalonde, V.; Madramootoo, C.A.; Trenholm, L.; Broughton, R.S. Effects of controlled drainage on nitrate concentrations in subsurface drain discharge. Agric. Water. Manag. 1996, 29, 187–199. [Google Scholar] [CrossRef]
- Yu, Y.; Xu, J.; Zhang, P.; Meng, Y.; Xiong, Y. Controlled Irrigation and Drainage Reduce Rainfall Runoff and Nitrogen Loss in Paddy Fields. Int. J. Environ. Res. Public Health 2021, 18, 3348. [Google Scholar] [CrossRef]
- Wesstrom, I.; Messing, I.; Linner, H.; Lindstrom, J. Controlled drainage-effects on drain outflow and water quality. Agric. Water Manag. 2001, 47, 85–100. [Google Scholar] [CrossRef]
- Wesstrom, I.; Ekbohm, G.; Linner, H.; Messing, I. The effects of controlled drainage on subsurface outflow from level agricultural fields. Hydrol. Process. 2003, 17, 1525–1538. [Google Scholar] [CrossRef]
- Yin, G.; Zhang, Z.; Guo, X.; Shao, G. Effect of drainage controlling devices on nitrogen losses in surface runoff farmland. J. Hydraul. Eng. 2006, 37, 926–931. (In Chinese) [Google Scholar]
- Liu, J.; Luo, W.; Jia, Z.; Fang, S.; Wang, N. Feasibility study of adopting controlled drainage in Yinnan irrigation district based on salt and water balance. Trans. CSAE 2005, 21, 43–46. (In Chinese) [Google Scholar]
- Chi, B.; Shi, H.; Xu, D.; Jiao, P. Distribution and variation of water and salt in soil profile under controlling subsurface drainage. Trans. Chin. Soc. Agric. Eng. (Trans. CSAE) 2021, 37, 148–158, (In Chinese with English abstract). [Google Scholar] [CrossRef]
- Fodaa, E.M.; Sobeihb, M.M.; Salamc, G.A.; Ellayn, A.F.; Atta, Y.M. Long-term effects of using controlled drainage on: Crop yields and soil salinity in Egypt. Water Sci. 2020, 34, 143–154. [Google Scholar] [CrossRef]
- Tolomio, M.; Borin, M. Controlled drainage and crop production in a long-term experiment in North-Eastern Italy. Agric. Water Manag. 2019, 222, 21–29. [Google Scholar] [CrossRef]
- Cui, Y.; Cui, L.F. Research on the spatio-temporal distribution characteristics of temperature and precipitation variation in Hubei Province in the past 50 years. J. Huanggang Norm. Univ. 2020, 40, 80–86. [Google Scholar]
- Yuan, N.; Huang, J.; Xie, H.; Huang, Z. Experimental study of nitrogen leaching pattern in controlled pipe-drainage cotton field. Trans. CSAE 2010, 26, 8–13, (In Chinese with English abstract). [Google Scholar]
- Sun, Y.L.; Fan, W.Y.; Shi, P.J.; Wang, Z.; Sun, S. The regional difference of the influence of climate change and management factors on cotton yield in Hubei province. Geogr. Res. 2021, 40, 1064–1077. [Google Scholar]
- Salo, T.; Turtola, E. Nitrogen balance as an indicator of nitrogen leaching in Finland. Agric. Ecosyst. Environ. 2006, 113, 98–107. [Google Scholar] [CrossRef]
- Skaggs, W.; Fausey, N.R.; Evans, R.O. Drainage water management. J. Soil Water Conserv. 2012, 67, 167A–172A. [Google Scholar] [CrossRef] [Green Version]
- Yuan, N.; Xie, H.; Liu, F.; Huang, Z. Effect of Controlled Drainage on Soil Moisture Under Different Boundary Conditions. In Proceedings of the International Conference on Environmental Protection and Human Health, Wuhan, Hubei, China, 13–14 December 2014. [Google Scholar]
- Yin, G.; Zhang, Z.; Guo, X.; Shao, G. Experimental study on effect of controlled drainage from ground surface on concentration and discharge of nitrogen. J. Hohai Univ. 2006, 34, 21–24. [Google Scholar]
- Yuan, N.; Huang, J.; Huang, Z. Effect of Controlled Pipe Drainage on the Outflow and Nitrogen Leaching in Sihu District, China. In Proceedings of the 11th ICID International Drainage Workshop on Agricultural Drainage Needs and Future Priorities, Cairo, Egypt, 23–27 September 2012. [Google Scholar]
- Gunn, K.M.; Fausey, N.R.; Shang, Y.; Vinayak, S.S.; Ehsan, G.; Wahla, M.D.; Larry, C.B. Subsurface drainage volume reduction with drainage water management: Case studies in Ohio, USA. Agric. Water Manag. 2015, 149, 131–142. [Google Scholar] [CrossRef]
- Li, S.; Wu, M.; Jia, Z.; Luo, W.; Fei, L.; Li, J. Influence of different controlled drainage strategies on the water and salt environment of ditch wetland: A model-based study. Soil Tillage Res. 2021, 208, 104894. [Google Scholar] [CrossRef]
- Blicher-Mathiesen, G.; Andersen, H.E.; Larsen, S.E. Nitrogen field balances and suction cup-measured N leaching in Danish catchments. Agric. Ecosyst. Environ. 2014, 196, 69–75. [Google Scholar] [CrossRef]
- Compton, J.E.; Pearlstein, S.L.; Erban, L.; Coulombe, R.A.; Hatteberg, B.; Henning, A.; Brooks, J.R.; Selker, J.E. Nitrogen inputs best predict farm field nitrate leaching in the Willamette Valley, Oregon. Nutr. Cycl. Agroecosyst. 2021, 120, 223–242. [Google Scholar] [CrossRef] [PubMed]
- Kumazawa, K. Nitrogen fertilization and nitrate pollution in groundwater in Japan: Present status and measures for sustainable agriculture. Nutr. Cycl. Agroecosyst. 2002, 63, 129–137. [Google Scholar] [CrossRef]
- Garnier, M.; Recanatesi, F.; Ripa, M.N.; Antonio, L. Agricultural nitrate monitoring in a lake basin in Central Italy:a further step ahead towards an integrated nutrient management aimed at controlling water pollution. Env. Monit Assess 2010, 170, 273–286. [Google Scholar] [CrossRef]
- Kou, C.; Luo, X.; Ju, X. Effects of optimal nitrogen fertilization on N balance and nitrate-N accumulation in greenhouse tomato fields. J. Plant Nutr. Fertil. 2021, 27, 837–848. [Google Scholar]
- Skaggs, R.W.; Youseef, M.A. Effects of Drainage Water Management on Nitrogen Losses to Surface Waters. In Proceedings of the 16th National Nonpoint Source Monitoring Workshop, Columbus, OH, USA, 14–18 September 2008. [Google Scholar]
- Youssef, M.A.; Liu, Y.; Chescheir, G.M.; Skaggs, R.W.; Negm, L.M. DRAINMOD modeling framework for simulating controlled drainage effect on lateral seepage from artificially drained fields. Agric. Water Manag. 2021, 254, 106944. [Google Scholar] [CrossRef]
Figure 1.
Schematic of the experimental field plots and control structure.

Figure 2.
Schematic of the experimental test pits and the control structure.

Figure 3.
Variation in the soil water content in the different layers during the cotton growth period in the field in 2008. (a) Soil water content at the surface; (b) Soil water content in the 20 cm layer; (c) Soil water content in the 40 cm layer; (d) Soil water content in the 60 cm layer; (e) Soil water content in the 80 cm layer.

Figure 4.
Variation in the soil water content in the different layers during the cotton growth period in the field in 2009. (a) Soil water content at the surface; (b) Soil water content in the 20 cm layer; (c) Soil water content in the 40 cm layer; (d) Soil water content in the 60 cm layer; (e) Soil water content in the 80 cm layer.

Figure 5.
Variation in the soil water content in the different layers during the cotton growth period in the field in 2010. (a) Soil water content at the surface; (b) Soil water content in the 20 cm layer; (c) Soil water content in the 40 cm layer; (d) Soil water content in the 60 cm layer; (e) Soil water content in the 80 cm layer; (f) Soil water content in the 100 cm layer.


Figure 6.
Variation in the soil water content in the different layers during the cotton growth period in the test pits in 2010. (a) Soil water content at the surface; (b) Soil water content in the 20 cm layer; (c) Soil water content in the 40 cm layer; (d) Soil water content in the 60 cm layer; (e) Soil water content in the 80 cm layer.


Table 1.
Controlled water table design in the plots.
| Plot | Controlled Water Table/cm | Replicate | |||
|---|---|---|---|---|---|
| Seedling Stage (20 May to 3 July) | Bud Stage (4 July to 20 July) | Flowering and Boll Setting Stage (21 July to 28 August) | Boll Opening Stage (29 August to 20 November) | ||
| A | 30 | 40 | 40 | 30 | 0 |
| B | 50 | 60 | 60 | 50 | 0 |
| C | 80 | 80 | 80 | 80 | 0 |
| D | free drainage (100) | free drainage (100) | free drainage (100) | free drainage (100) | 0 |
Table 2.
Controlled water table design in the test pits.
| Treatment | Controlled Water Table/cm | Replicate | |||
|---|---|---|---|---|---|
| Seedling Stage (20 May to 3 July) | Bud Stage (4 July to 20 July) | Flowering and Boll Setting Stage (21 July to 28 August) | Boll Opening Stage (29 August to 20 November) | ||
| 1 | 30 | 40 | 40 | 30 | 6 |
| 2 | 50 | 60 | 60 | 50 | 6 |
| 3 | 80 | 80 | 80 | 80 | 5 |
| 4 | free drainage (100) | free drainage (100) | free drainage (100) | free drainage (100) | 3 |
Table 3.
Specific sampling date.
| Year | Sampling Date |
|---|---|
| 2008 | 10 May, 23 June, 4 July, 10 July, 15 July, 26 July, 5 August, 18 August, 27 August, 4 September, 18 September and 19 November |
| 2009 | 15 May, 12 June, 9 July, 23 July, 8 August, 29 August, 14 September, 24 October, 23 November |
| 2010 | 10 May, 20 May, 30 May and 5 June, 10 June, 14 June, 20 June, 22 June, 26 June, 30 June, 6 July, 16 July, 23 July, 27 July, 30 July, 5 August, 10 August, 15 August, 20 August, 25 August, 30 August, 15 September, 18 September, 25 September, 30 September, 5 October, 15 October, 19 October, 26 October, 1 November, 5 November, 10 November |
Table 4.
Chemical methods.
| Index | Nitrate | Ammonium | Soil Water Moisture | Ammonia Volatilization | Plant Dry Matter | Plant Total Nitrogen |
|---|---|---|---|---|---|---|
| Methods | Digested ultraviolet spectrophotometry | Nessler’s reagent colorimetry | Oven drying | Ventilation method | Fixing drying | H2SO4-H2O2 boil and Nye’s colorimetry |
Table 5.
Calculation of the moisture storage change after rainfall in the test pits.
| Treatments | Layers | Soil Gravimetric Water Content | Change in the Period | Soil Bulk Density (g/m3) | Increase in Moisture Storage in the Period (mm) | |
|---|---|---|---|---|---|---|
| 6 July | 16 July | |||||
| 30 cm | Surface to 20 cm | 25.35% | 28.17% | 2.82% | 1.4 | 8 |
| 20–40 cm | 22.75% | 29.21% | 6.46% | 1.4 | 20 | |
| 40–60 cm | 26.35% | 32.05% | 5.70% | 1.49 | 17 | |
| 60–80 cm | 26.50% | 32.25% | 5.75% | 1.49 | 17 | |
| 80–100 cm | 27.57% | 31.08% | 3.51% | 1.43 | 11 | |
| total | 73 | |||||
| 50 cm | Surface to 20 cm | 37.27% | 26.12% | −11.15% | 1.4 | −33 |
| 20–40 cm | 14.43% | 26.88% | 12.45% | 1.4 | 38 | |
| 40–60 cm | 18.59% | 29.77% | 11.18% | 1.49 | 34 | |
| 60–80 cm | 28.84% | 32.05% | 3.21% | 1.49 | 10 | |
| 80–100 cm | 27.01% | 32.07% | 5.06% | 1.43 | 15 | |
| total | 64 | |||||
| 80 cm | Surface to 20 cm | 21.47% | 27.81% | 6.34% | 1.4 | 19 |
| 20–40 cm | 28.08% | 27.21% | −0.87% | 1.4 | −3 | |
| 40–60 cm | 32.23% | 28.25% | −3.98% | 1.49 | −12 | |
| 60–80 cm | 32.38% | 28.06% | −4.31% | 1.49 | −13 | |
| 80–100 cm | 32.73% | 29.23% | −3.50% | 1.43 | −11 | |
| total | −20 | |||||
| 100 cm | Surface to 20 cm | 28.80% | 25.39% | −3.41% | 1.4 | −10 |
| 20–40 cm | 29.05% | 27.41% | −1.64% | 1.4 | −5 | |
| 40–60 cm | 29.51% | 27.89% | −1.62% | 1.49 | −5 | |
| 60–80 cm | 30.55% | 28.22% | −2.33% | 1.49 | −7 | |
| 80–100 cm | 28.81% | 27.71% | −1.10% | 1.43 | −3 | |
| total | −30 | |||||
Table 6.
Calculation of the nitrogen balance during the entire growth period of cotton (kg/ha).
| Fields | NF | NR | ND | ΔNC | ΔNS | (NO-NL) |
|---|---|---|---|---|---|---|
| D | 196.88 | 3.21 | 1.69 | 76.40 | 151.82 | −26.44 |
| C | 154.00 | 3.21 | 1.69 | 72.84 | 228.87 | −142.81 |
| B | 154.00 | 3.21 | 1.69 | 62.55 | 190.14 | −93.79 |
| A | 218.82 | 3.21 | 1.69 | 78.23 | 273.94 | −128.45 |
| E | 266.33 | 3.21 | 1.69 | 96.80 | 172.46 | 1.96 |
Table 7.
Calculation of the nitrogen balance after three typical rainfalls (unit: kg/ha).
| Drainage Process | Plots | NR or ND | ΔNS | Nitrogen Loss with Surface and Subsurface Drainage | (NO-NL) |
|---|---|---|---|---|---|
| D723 | D | 0.48 | 43.18 | 0.29 | −42.99 |
| C | 0.48 | 35.30 | 0.31 | −35.13 | |
| B | 0.48 | 43.46 | 0.23 | −43.21 | |
| A | 0.48 | 139.50 | 0.30 | −139.32 | |
| E | 0.48 | 8.13 | 0.79 | −8.44 | |
| D815 | D | 0.80 | −14.18 | 0.15 | 14.83 |
| C | 0.80 | 16.95 | 0.11 | −16.25 | |
| B | 0.80 | −21.26 | 0.03 | 22.03 | |
| A | 0.80 | 23.28 | 0.10 | −22.57 | |
| E | 0.80 | 27.72 | 0.16 | −27.08 | |
| D830 | D | 0.75 | −64.36 | 0.04 | 65.06 |
| C | 0.75 | 8.04 | 0.23 | −7.52 | |
| B | 0.75 | −103.12 | 0.22 | 103.64 | |
| A | 0.75 | −44.30 | 0.22 | 44.83 | |
| E | 0.75 | −55.18 | 0.33 | 55.60 |
Table 8.
The ratio of nitrate and ammonia nitrogen average contents in the same soil layer.
| Soil Layer/cm | Ratio F | ||
|---|---|---|---|
| Water Level | |||
| 30 cm | 50 cm | 100 cm | |
| surface | 0.70 | 0.81 | 0.88 |
| 20 cm | 0.40 | 0.48 | 0.70 |
| 40 cm | 0.36 | 0.41 | 0.63 |
| 80 cm | 0.26 | 0.22 | 0.47 |
Publisher’s Note: MDPI stays neutral with regard to jurisdictional claims in published maps and institutional affiliations. |
© 2021 by the authors. Licensee MDPI, Basel, Switzerland. This article is an open access article distributed under the terms and conditions of the Creative Commons Attribution (CC BY) license (https://creativecommons.org/licenses/by/4.0/).
Share and Cite
MDPI and ACS Style
Yuan, N.; Xiong, Y.; Li, Y.; Xu, B.; Liu, F. Experimental Study of the Effect of Controlled Drainage on Soil Water and Nitrogen Balance. Water 2021, 13, 2241. https://doi.org/10.3390/w13162241
AMA Style
Yuan N, Xiong Y, Li Y, Xu B, Liu F. Experimental Study of the Effect of Controlled Drainage on Soil Water and Nitrogen Balance. Water. 2021; 13(16):2241. https://doi.org/10.3390/w13162241
Chicago/Turabian StyleYuan, Niannian, Yujiang Xiong, Yalong Li, Baokun Xu, and Fengli Liu. 2021. "Experimental Study of the Effect of Controlled Drainage on Soil Water and Nitrogen Balance" Water 13, no. 16: 2241. https://doi.org/10.3390/w13162241
Note that from the first issue of 2016, this journal uses article numbers instead of page numbers. See further details here.