Article

Reclaimed Water for Vineyard Irrigation in a Mediterranean Context: Life Cycle Environmental Impacts, Life Cycle Costs, and Eco-Efficiency

1
Department of Management, Finance and Technology, LUM Giuseppe Degennaro University, S.S. 100-Km 18, 70010 Casamassima, Italy
2
Department of Agricultural and Environmental Sciences, University of Bari Aldo Moro, 70126 Bari, Italy
3
Institute of Sciences of Food Production, National Research Council (CNR-ISPA), Via Amendola, 122/O, 70125 Bari, Italy
4
International Center for Advanced Mediterranean Agronomic Studies (CIHEAM-Bari), Via Ceglie 9, 70010 Valenzano, Italy
*
Authors to whom correspondence should be addressed.
Water 2021, 13(16), 2242; https://doi.org/10.3390/w13162242
Submission received: 7 June 2021 / Revised: 13 August 2021 / Accepted: 14 August 2021 / Published: 17 August 2021

Abstract

:
The agricultural sector in the Mediterranean region, is increasingly using reclaimed water as an additional source for irrigation. However, there is a limited number of case studies about product-based life cycle analysis to ensure that the overall benefits of reclaimed water do indeed outweigh the impacts. The Life Cycle Assessment (LCA) and Life Cycle Costing (LCC) methods are used in this study to investigate the environmental impacts and costs of vineyard cropping systems when tertiary reclaimed water is used as a supplementary source of irrigation water (integrated system). The conventional production system utilizing 100% groundwater was used as a reference system. As a proxy for sustainability, eco-efficiency, which combines economic and environmental performance, was assessed. The LCA revealed that the integrated system could reduce the net environmental impact by 23.8% due to lower consumption of irrigation water (−50%), electricity (−27.7%), and chemical fertilizers (−22.6%). Nevertheless, trade-offs between economics and the environment occurred as an integrated system is associated with higher life cycle costs and lower economic returns due to lower crop yield (−9.1%). The combined eco-efficiency assessment (ratio of economic value added to total environmental impact) revealed that the integrated system outperformed in terms of eco-efficiency by 12.6% due to lower environmental impacts. These results confirmed that reclaimed water could help to ensure an economically profitable yield with net environmental benefits. Our results provided an up-to-date and consistent life cycle analysis contributing to the creation of a valuable knowledge base for the associated costs and benefits of vineyard cultivation with treated wastewater.

Graphical Abstract

1. Introduction

The Apulia region represents a fundamental segment of Italian agriculture. In this region characterized by the Mediterranean climate, water shortages, water imports from nearby regions, and the overexploitation of aquifers are all intertwined. All current climate changes and future scenarios in the Mediterranean area indicate significant and increasing water demand in the coming decades [1]. In this setting, efficient and sustainable irrigation methods are becoming increasingly important for sustaining crop production and socio-economic prosperity. Among a variety of approaches, the reuse of treated wastewater is acknowledged as a prominent concept of the local water resource management plan [2]. However, a comparison of linear products with their circular counterparts is required to determine the environmental implications and provide scientific guidance for the sustainable use of reclaimed water [3].
Wastewater reclamation and reuse usually come with attendant benefits and trade-offs, necessitating a life cycle framework to capture the “whole picture” of each intervention and avoid burden shifting [4]. Life cycle thinking and, in particular, life cycle assessment (LCA) is gaining momentum in wastewater-related sustainability performance in the developed [5] and less developed countries such as China and India [6]. A rapidly growing number of publications on treated water methods and reuse evidences this. However, few studies have focused on the life cycle performance of treated water reuse for crop production. Arcidiacono and Porto [7] used LCA to analyze the impacts of biomass production in eastern Sicily (Italy) irrigated with urban wastewater. The irrigation plant was identified as one of the contributors to the overall environmental burden. In Almería, southeastern Spain, Munoz et al. [8] compared the potential LCA impacts of using treated wastewater, groundwater, or desalinated water for biomass crop irrigation. The authors demonstrated that desalinated water was the option with the highest environmental impacts. Romeiko [3] compared nine LCA-based impacts of maize, soybean, and wheat systems irrigated with groundwater and treated water in Northern China, demonstrating that there are environmental trade-offs between water supply options. Azeb et al. [9] demonstrated that the use of treated water in greenhouse cucumber production in Tipaza (Algeria) has greater environmental consequences than the use of groundwater, owing to over-fertilization.
Several technologies and crop systems were investigated with treated wastewater in Southern Italy as part of strategic regional R&D projects. However, water reuse projects in the Apulia region were rarely subjected to integrate life cycle thinking analysis [10,11,12]. In the provinces of Brindisi and Foggia in Southern Italy, Giungato and Guinée [12] and Canaj et al. [10] used LCA to map the impact of municipal wastewater reuse versus groundwater use. Moretti et al. [11] conducted an LCA of water reuse in orchard irrigation in Foggia, demonstrating trade-offs between beneficial eutrophication (marine and freshwater) and harmful climate change and toxicity impacts. Other studies focused separately on the economic analysis of the costs and benefits associated with wastewater treatment [13,14,15].
Crop cultivation with treated wastewater in an eco-efficient manner, i.e. with the highest economic value added and the least environmental impacts is currently a major challenge. Stakeholders are interested in knowing not only the environmental impacts but also the cost–benefits of reusing wastewater for a range of management and technology interventions in order to balance the objectives and make comprehensive decisions [16]. As a result, it is indispensable to combine potential economic and environmental metrics to evaluate the sustainability of water reuse [17]. New trends of research are focusing on integrating economic and environmental aspects through the use of eco-efficiency analysis. Because of its ability to represent both the environmental and economic performance of products and services, eco-efficiency has grown in popularity in the field of sustainability. The concept was proposed to diagnose how efficient is an economic activity concerning nature’s goods and services. Despite numerous case studies demonstrating the concept’s applicability, knowledge and experience on treated water reuse are relatively scarce.
In the present study, an environmental and economic analysis of table grape cultivation in the area of Acquaviva Delle Fonti (Southern Italy) was conducted in a two-fold perspective: (i) as a linear production system using 100% groundwater (“Conventional System”) and (ii) as a circular process using 50% treated wastewater and 50% groundwater (“Integrated System”). The impacts were assessed using Life Cycle Assessment (LCA) and Life Cycle Costing (LCC). Subsequently, economic and environmental aspects were used to produce the final eco-efficiency profile. By doing so, it was possible the conjoint verification of the economic–environmental–energy sustainability of the water use system. The results of this study improve product-related information in a Mediterranean context in terms of inventory data, environmental impact, cost and added value, and eco-efficiency when irrigated with reclaimed water. This allows gathering positive and negative aspects of this strategy. Our key research questions are how irrigation with reclaimed water affects the eco-efficiency results and whether reclaimed can lead to an increase or decrease in eco-efficiency of vineyard production.

2. Materials and Methods

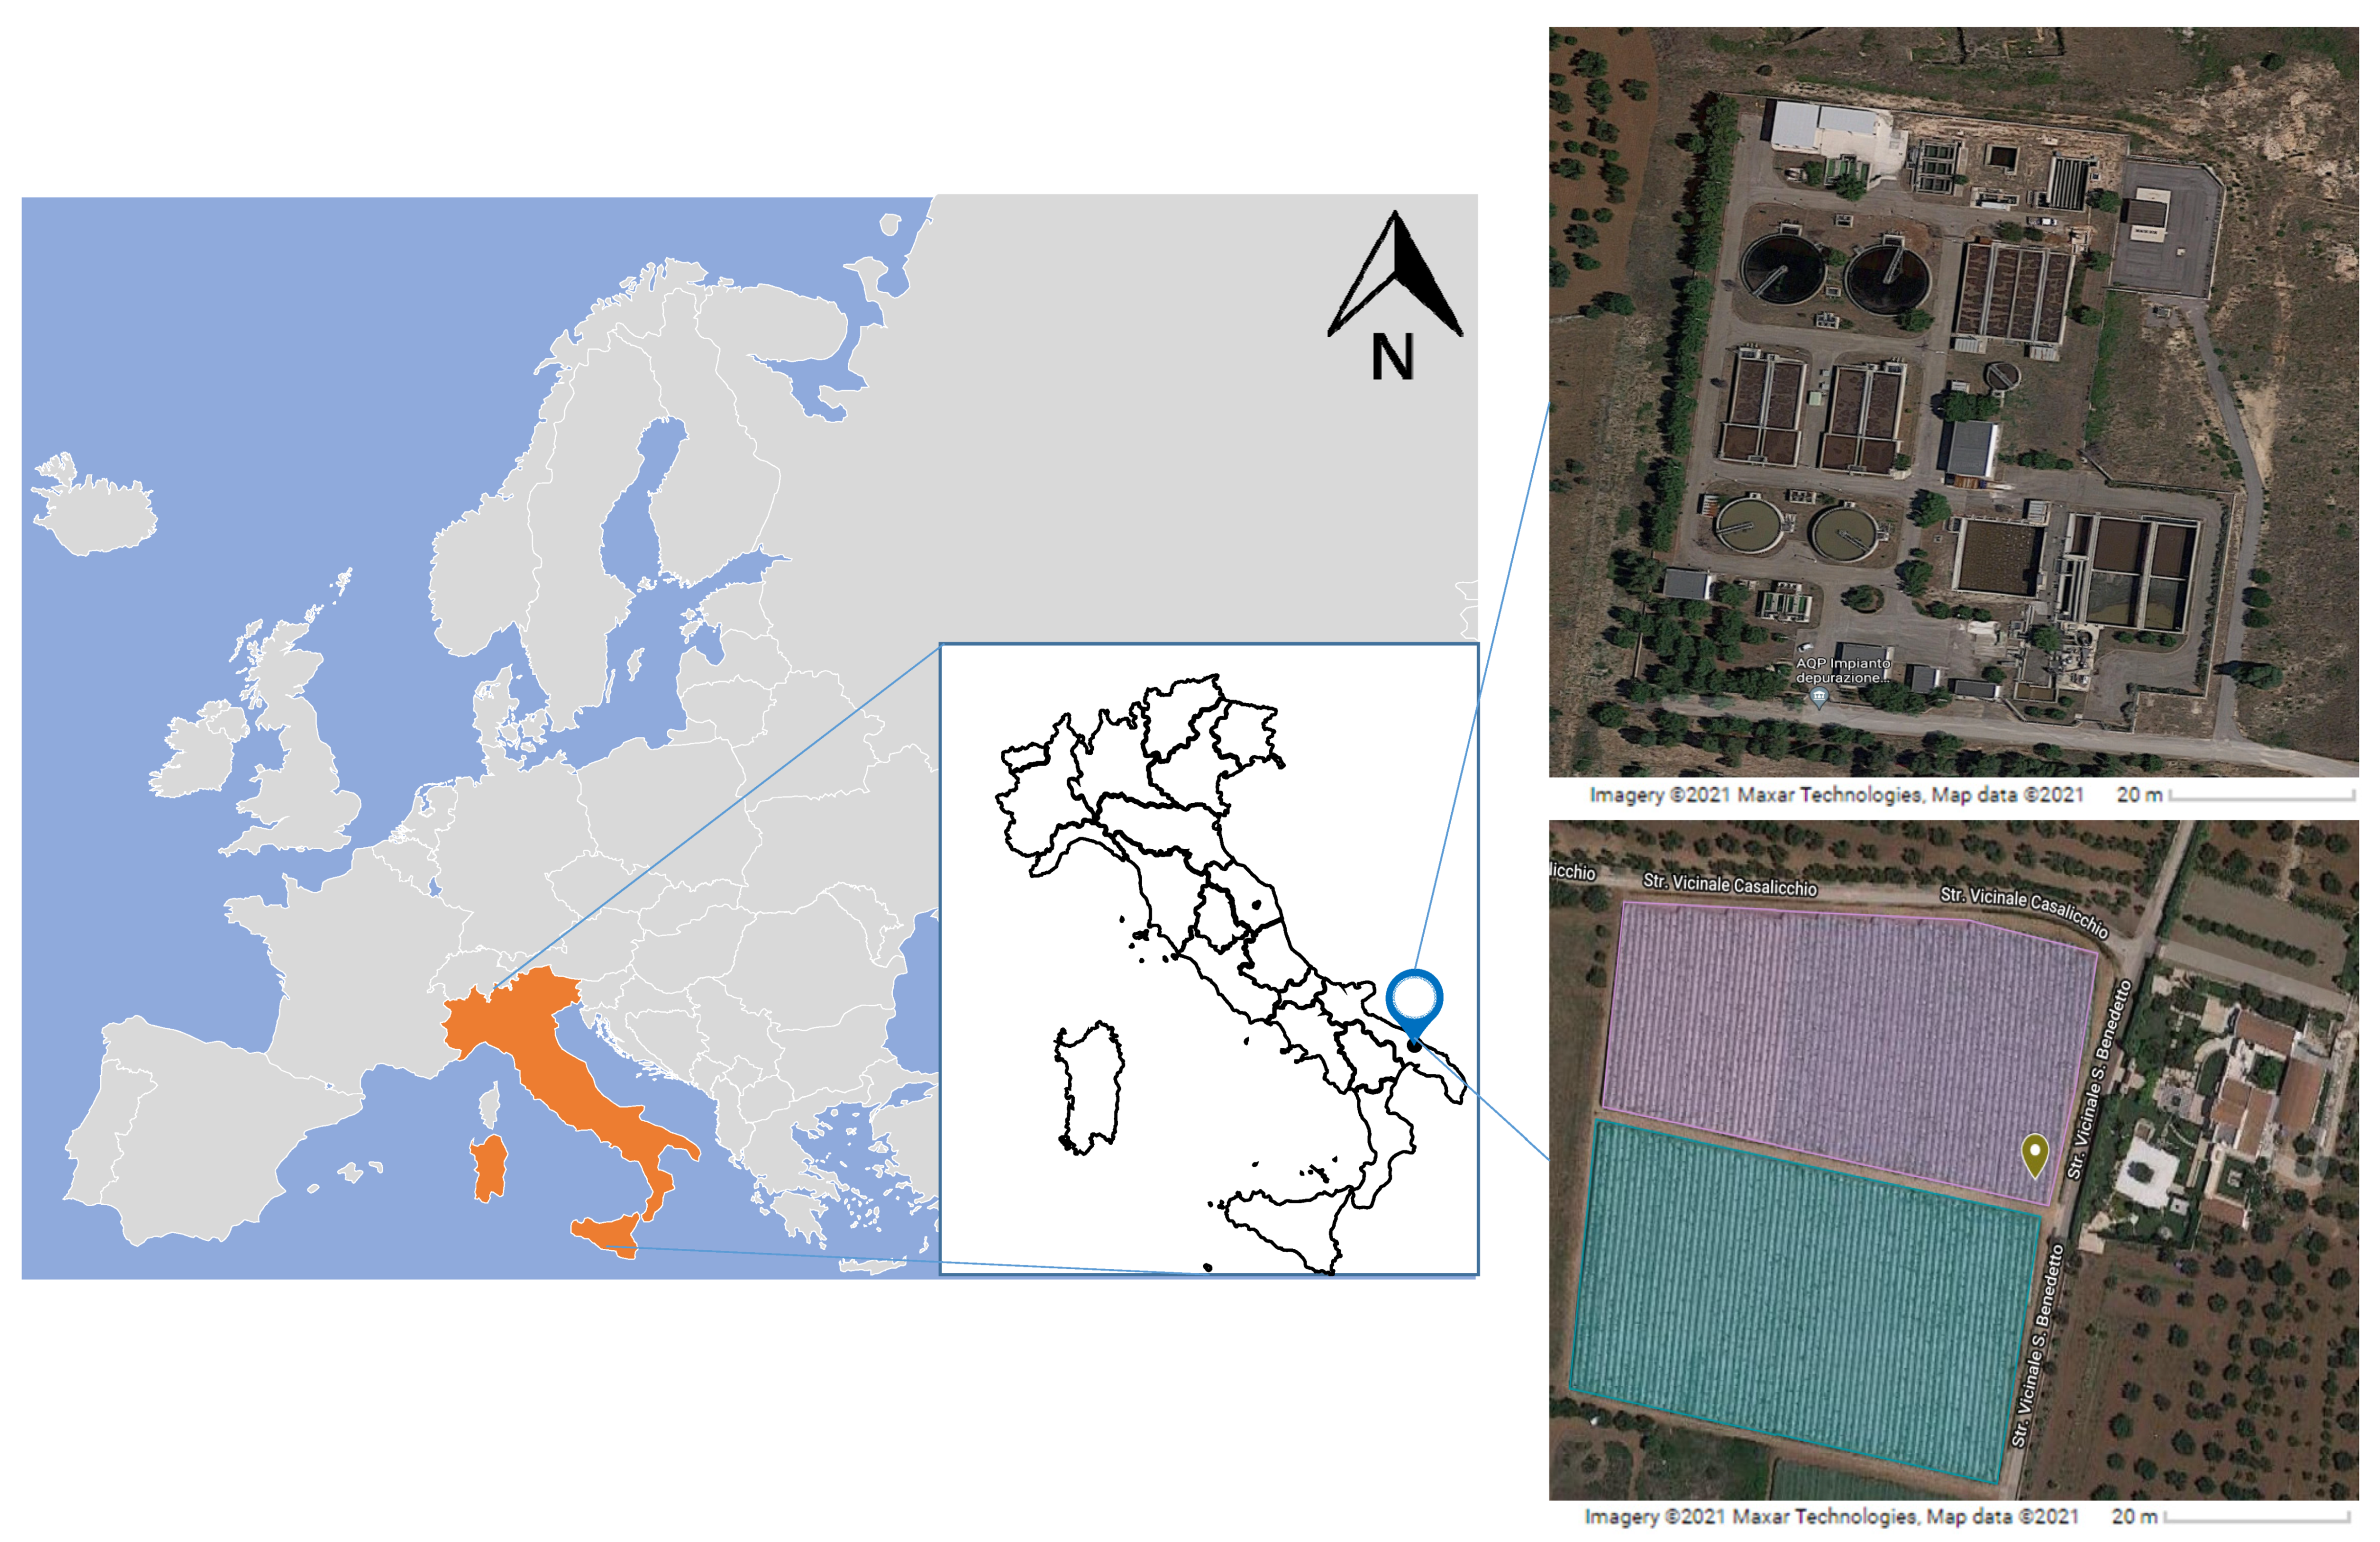
2.1. Experimental Site and Data Collection

The experimental activities were carried out at the Cooperative Society of Agricultural Producers “La Molignana” in Acquaviva delle Fonti (40°55′37.1″ N; 16°50′47.8″ E), Apulia region (Figure 1). The Cooperative has been active since 1978 and brings together over 200 farmers mainly dedicated to the cultivation of table grapes, wine grapes, olive trees, and orchards. The Cooperative manages the irrigation distribution of the water drawn from 11 wells, which it distributes to a served area of approximately 450 ha. The wells attached to the individual irrigation areas have an average depth that varies between 300 and 500 m below the ground level. Groundwater is pumped from a local well with limited availability of about 50 m3/h using electric pumps of 74 kW with average electricity consumption of 1.5 kWh/m3. The water source is accessible through a hydrant connected to the pressurized network. Since 2016, a part of the distribution network (owned by the Municipality of Acquaviva delle Fonti) has been equipped with the infrastructures to convey, in addition to the water taken from the wells, the tertiary effluent of the municipal wastewater treatment plant (Figure 1). The full-scale tertiary treatment is based on surface filtration (disk filters) and UV disinfection to treat an equalized average flow rate of 6720 m3/d, equal to about 280 m3/h. The reclaimed water was applied to the crops through drip irrigation. Treated wastewater (TWW) is supplied with an overall energy requirement of 33 kW or 0.66 kWh/m3.

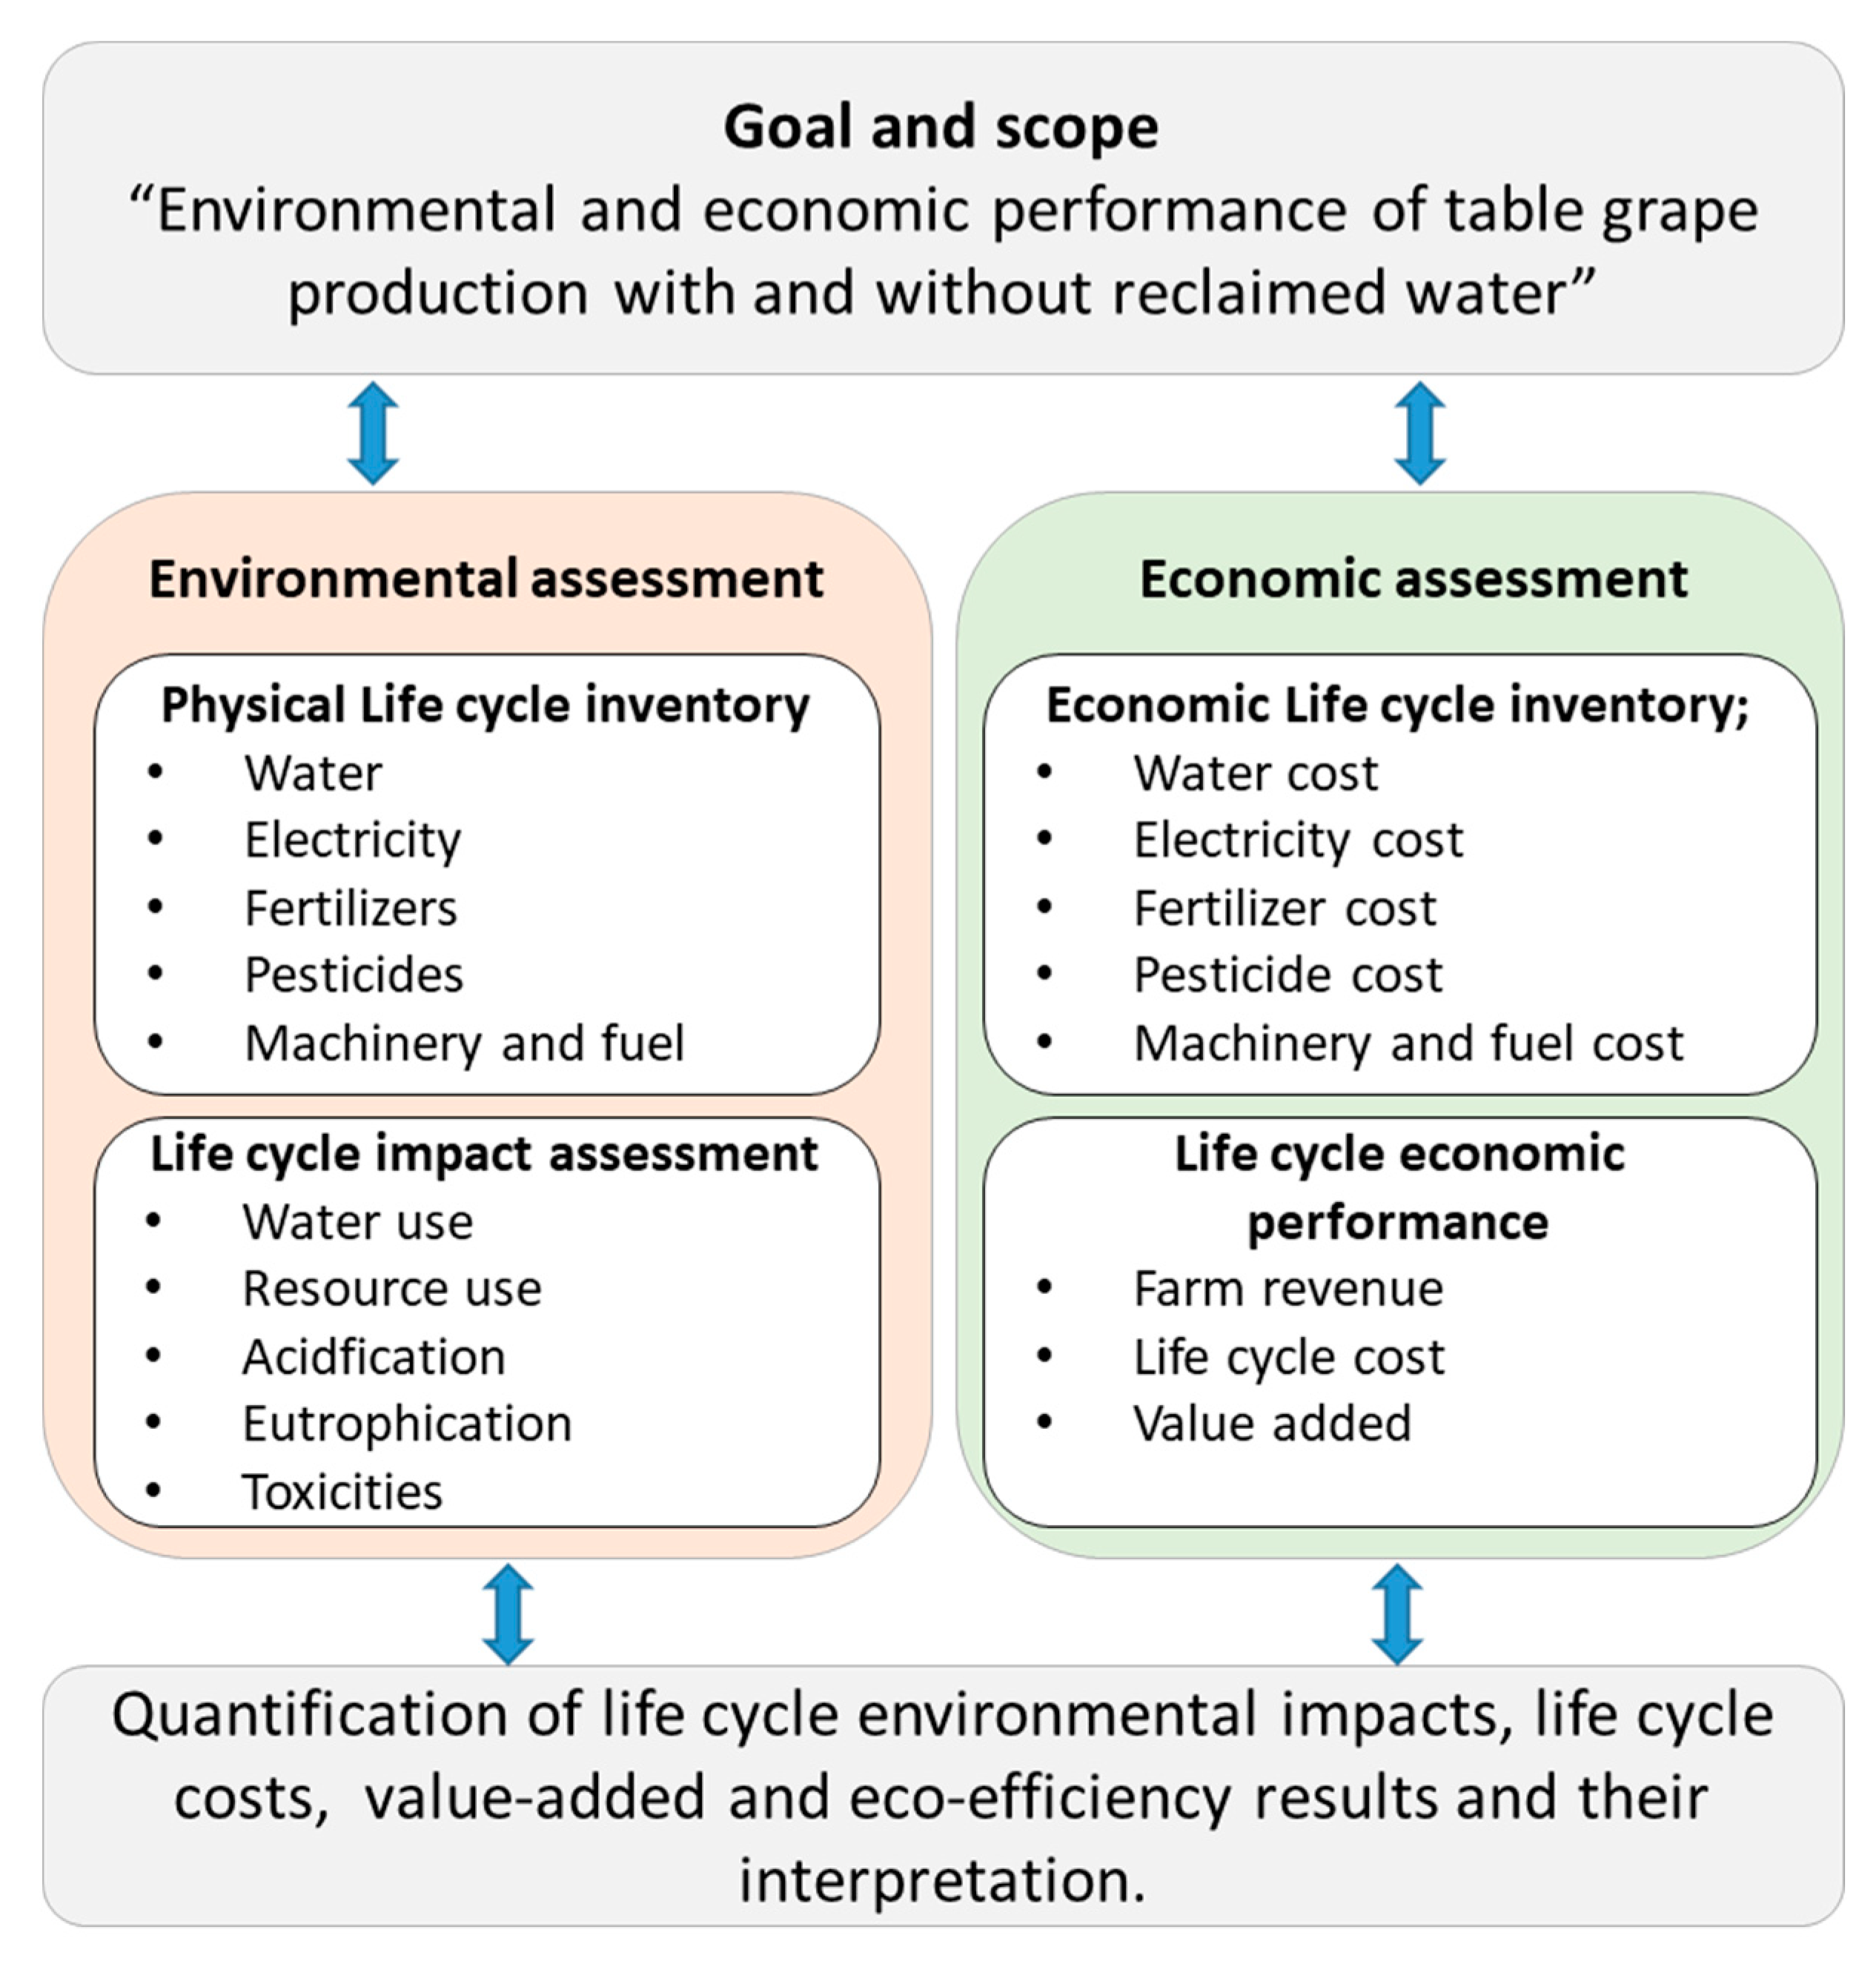
2.2. Environmental and Cost Assessment Methodology

Figure 2 depicts the approach adopted in this study. The LCA and LCC methodologies were combined to assess, respectively, the environmental impacts and financial costs incurred in the system’s processes. Multiple impact indicators were derived for environmental impact assessment using the Environmental Footprint (EF) method 3.0 (adapted) developed by the Joint Research Centre (JRC) of the European Commission. Economic impact indicators included internal (production cost), farm revenue, and total value added (TVA) due to water and adopted management practices. TVA is the total economic value from water use plus the income generated from any by-products produced minus the water-related costs [18]. The environmental and economic results offered the possibility to examine the environmental cost-effectiveness of studied options through aggregation to an overall Eco-Efficiency index (EEI). The relative costs, value-added and relative environmental burden were combined into a two-dimensional diagram (2 × 2 matrix) or a so-called Eco-Efficiency Portfolio.

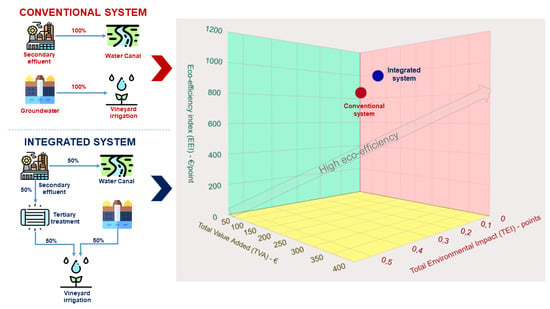
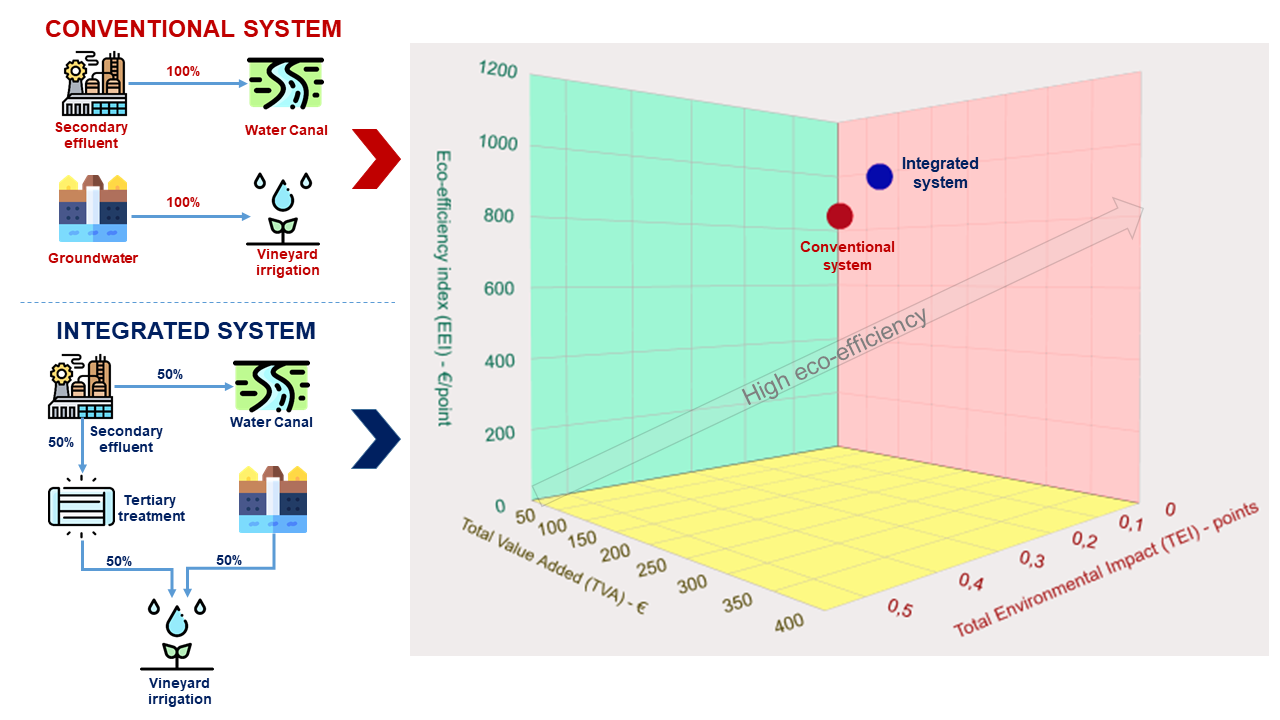
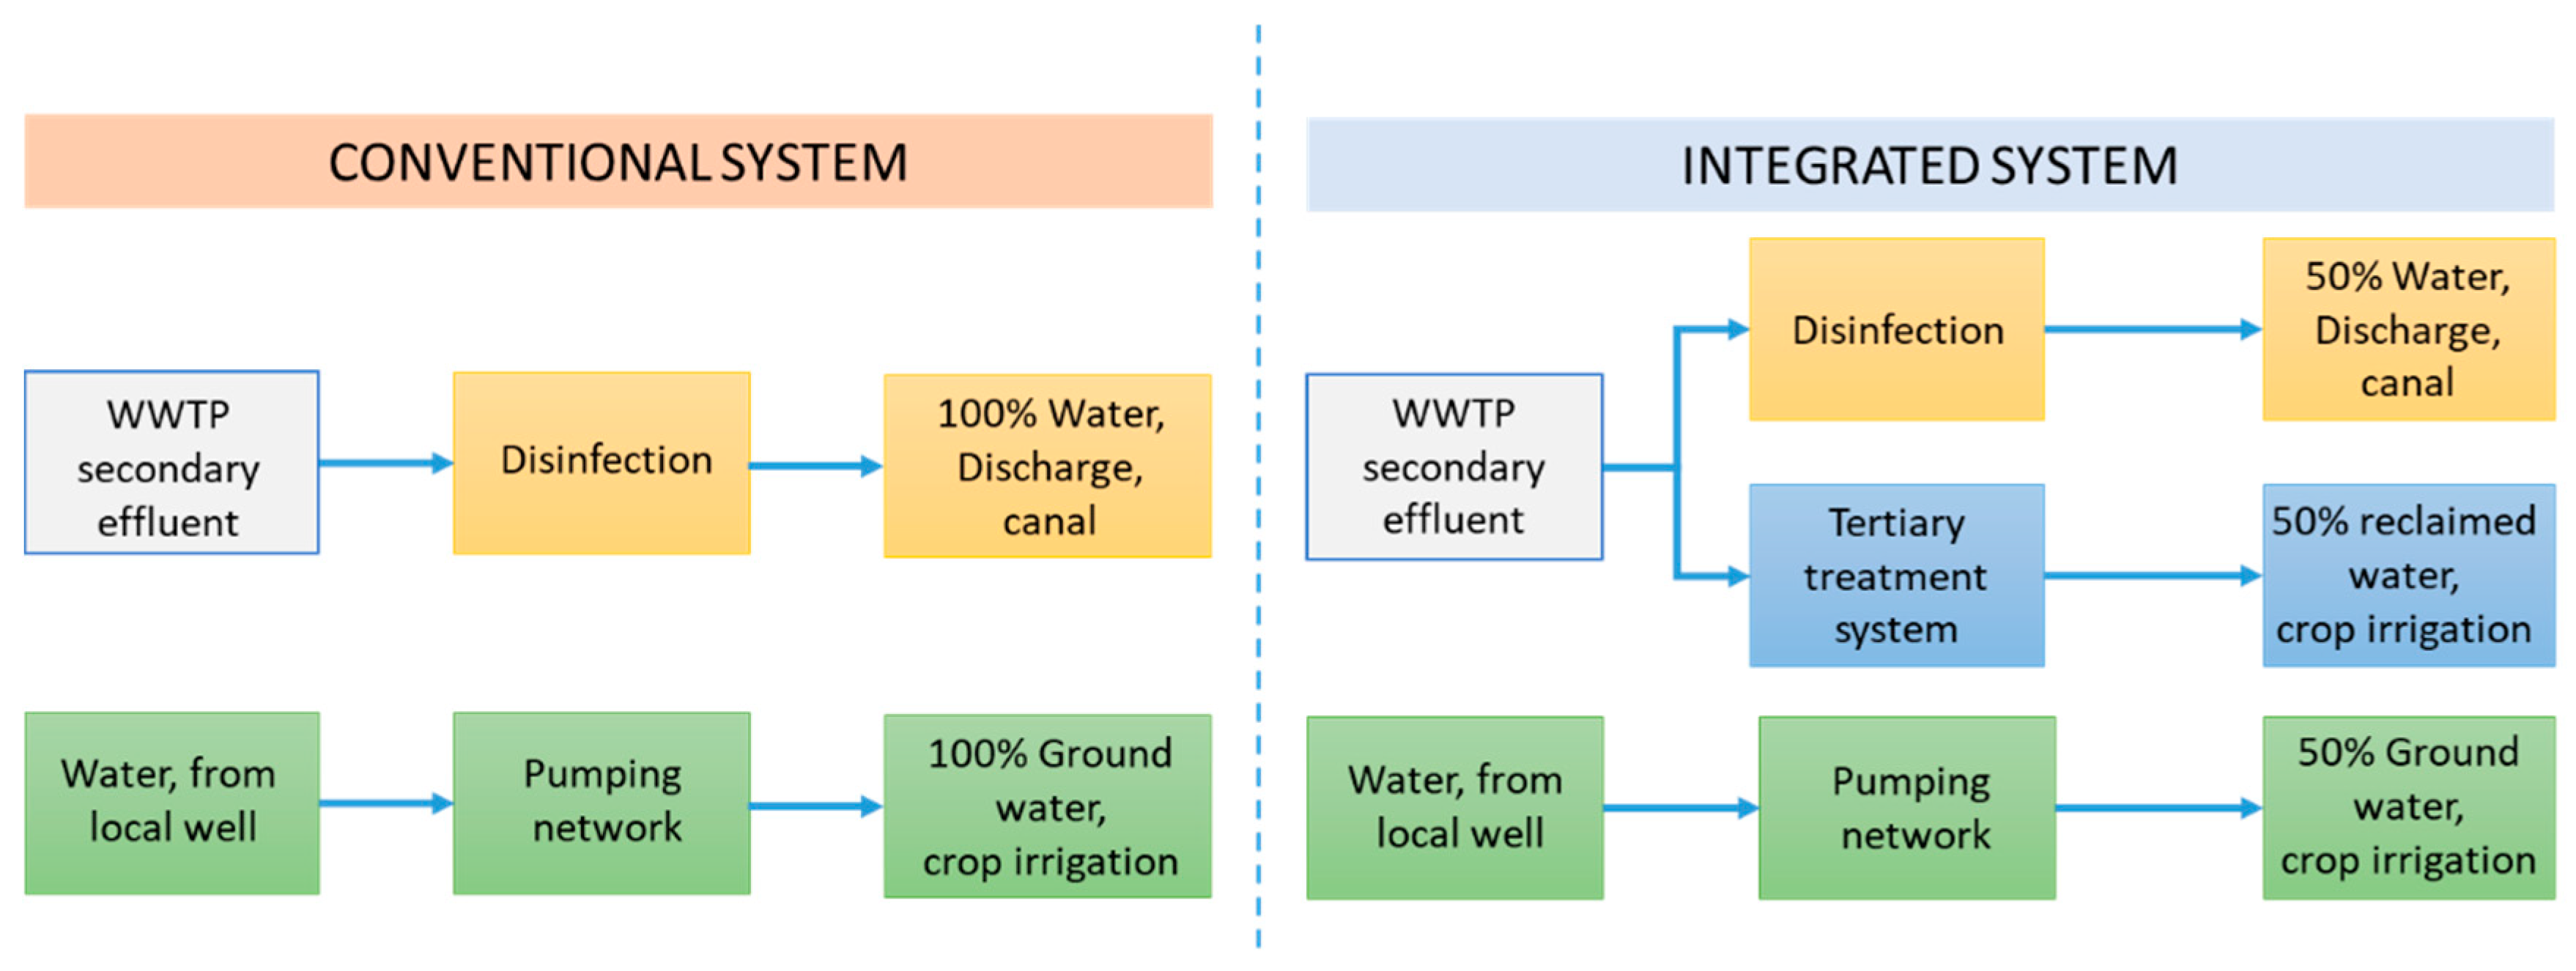
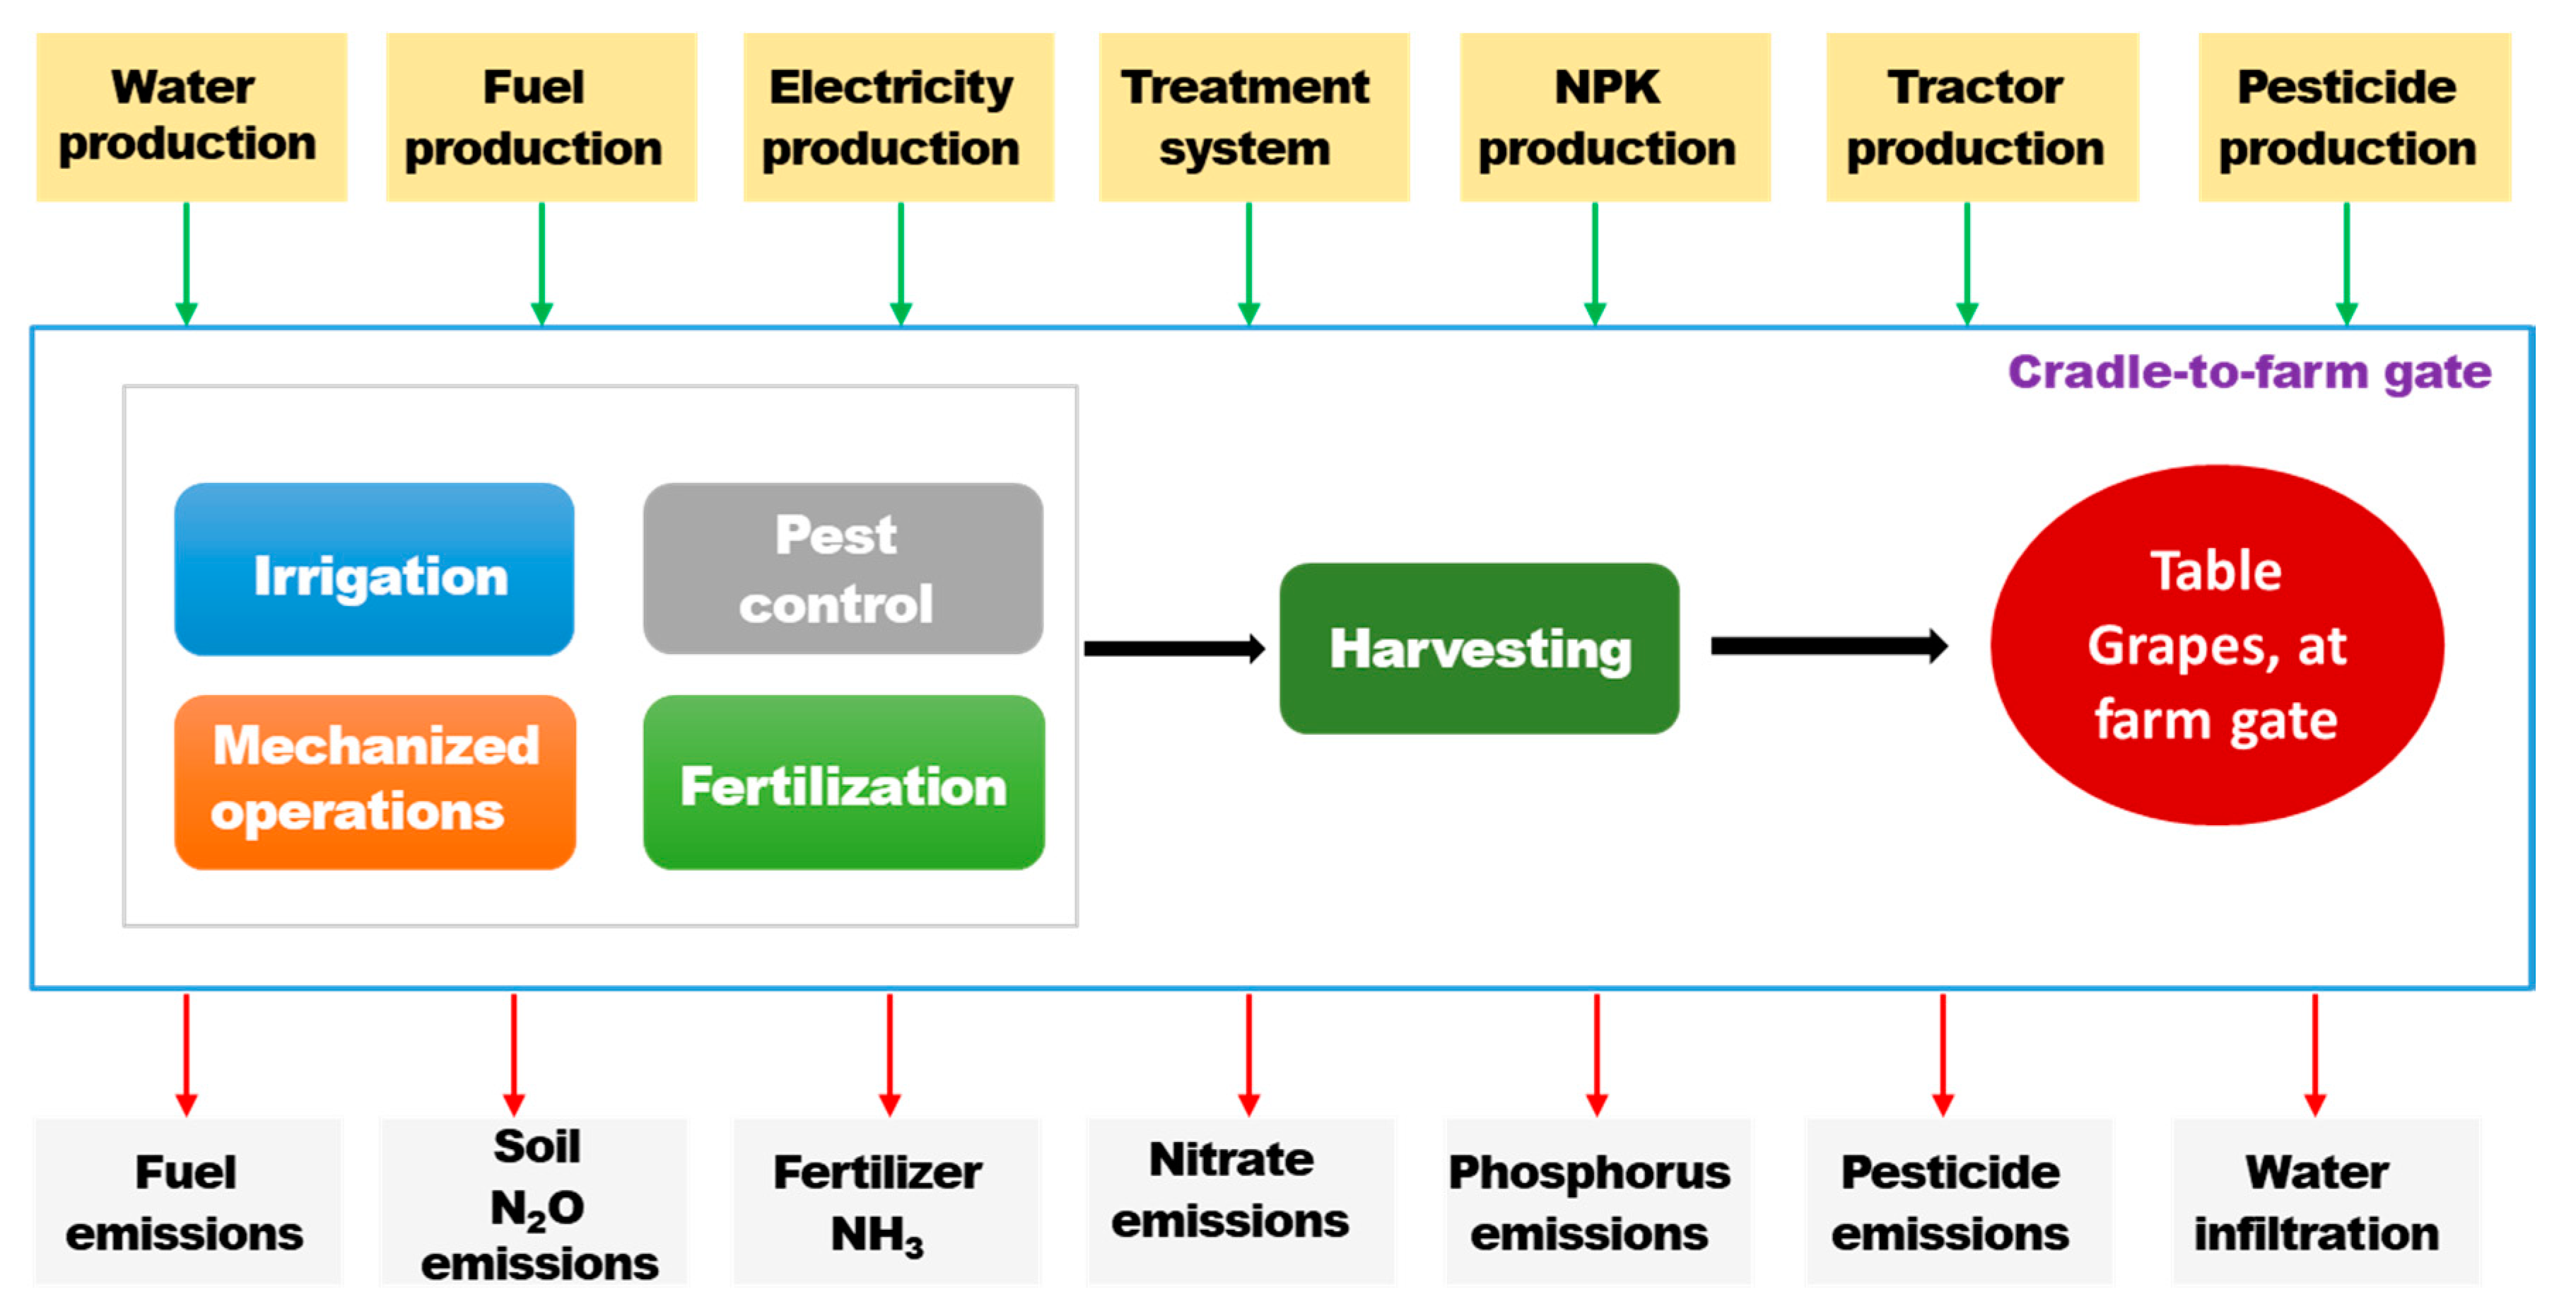
2.2.1. System Boundaries and Functional Unit

Figure 3 shows analyzed water supply options and associated processes. Two different water sources were compared for irrigation: groundwater (conventional system, CS) and water mix (integrated system, IS), where tertiary effluent is mixed with groundwater (50%:50%). In the CS, the secondary effluent is directly discharged into a canal (and then to the sea), and groundwater is extracted and treated for crop irrigation. In the IS, part of the secondary effluent (50%) is treated by a tertiary treatment system and used for irrigation together with groundwater. The remaining part of the secondary effluent is discharged to the canal. The release of effluent is modeled either by fully reaching the canal (CS) or the agricultural soil and canal (IS).
The system boundaries (Figure 4) include all the direct and indirect activities involved in grape cultivation following a cradle-to-farm gate perspective. The assessment comprised all agricultural operations, including irrigation with groundwater and treated wastewater (including construction, operation, and demolition stages of the targeted tertiary system), fertilization, and consumption of fuel for operations, plant protection, and transport. All the field emissions from fertilizers, fuel combustion, pesticides, and water application were accounted for. In the case of the integrated system, water and nutrients delivered to agriculture were accounted with credits using specific factors for the real substitution of groundwater or mineral fertilizer. An attributional approach was used to model the systems. The assessment was conducted for a functional unit (FU) of 1 ton of table grapes delivered at the farm gate and 1 ha of cultivated area.

2.2.2. Inventory Data

The inventory analysis involved the compilation and quantification of inputs and outputs of grape production systems throughout their life cycle. This study’s data were divided into two categories: specific data from direct field surveys and generic data derived from LCA databases. The cropping system under study consists of 1.2 ha with table grapes (cv Italia) at Renna farm. Irrigation and cropping practices were managed with the help of Bluleaf®, a DSS based on FAO methodology [19]. Overall, the quality of the data is considered to be sufficiently good. Primary data for key aspects of the study, such as consumption of irrigation water, energy, fertilizers, pesticides, and the consumption of diesel for agricultural practices, are provided in Table 1. In terms of crop yield, the average value was 23.12 and 21 t/ha for CS and IS, respectively. The lower yield obtained with the integrated system was due to soil conditions rather than water quality. The gross irrigation requirement monitored was 3160 m3/ha. The reclaimed water could save about 1580 m3/ha of groundwater every year. Irrigation total implied energy consumption was 4676.8 and 3381.2 kWh for CS and IS, respectively.
The total quantities of N, P, and K were measured in a wide range of mineral fertilizers applied to the crop taking the nitrogen supplied by the reclaimed water into account. Nitrogen, phosphorus, and potassium (NPK) concentration were 6.5, 0, and 3.8 mg/L in the case of groundwater and 22.4, 4.6, and 25.3 in the case of secondary effluent. Wastewater samples did not contain detectable quantities of metals. Concerning nutrients, during the irrigation season, the integrated system satisfied 39% (14.5 mg/L), 7% (1.55 mg/L), and 22% (4.9 mg/L) of N, P2O5, and K2O needs, respectively. This is translated into about 52 kg N/ha, 5 kg P2O5/ha, and 15.4 kg K2O/ha. The N-fertilizer is expressed as the sum of vegetal (3500 kg/ha with 2% N), ammonium sulfate (150 kg/ha with 27% N), and calcium nitrate (200 kg/ha with 15% N). Macronutrient requirements are 131.5 kg N/ha, 70 kg P2O5/ha, and 70 kg K2O/ha.
The air, soil, and water emissions caused by the use of nitrogen- and phosphorous-based fertilizers were calculated from Table 1 following IPCC (2006) TIER1 [20] and Nemecek and Kagi [21]. Direct N2O emissions were calculated as 1% of applied N. Nitrogen oxides (NOx) emissions to air were calculated as 21% of the direct N2O. The fraction of synthetic fertilizer N that volatilizes as NH3 and NOx was 10%. The fraction of N lost through leaching and runoff was 0.3.
The soil preparation was carried out with diesel-based tractors. Fuel consumption for field operations was 205 kg/ha of diesel. The “virtual” consumption of tractors and agricultural implements during the field operations was calculated according to Nemecek and Kagi [21], considering the total working time of operation (30.5 h), economic life span (7000 h), and tractor weight (3500 kg). All tractor processes (machinery implementation and fuel consumption) were managed using the same equipment and machinery. Therefore, no differences were observed in the studied systems.
The water treatment system includes filtration and disinfection (ultraviolet lamp production, for water disinfection). The design lifetime considered was 5 years.
Background emissions data on the production of electricity, agrochemicals, fuels, and materials were extracted from the database Ecoinvent v3.1. The geographical scope was Europe.

2.2.3. Life Cycle Impact Assessment

Environmental impacts were assessed with a set of sixteen impact categories using the EF 3.0 (adapted) method. Normalization and weighting factors (Table 2) were used to produce a single process and overall score to supports the interpretation and communication of the results of the analysis. The LCA was modeled in OpenLCA 1.10.2 [22] with datasets sourced from the Ecoinvent v.3.1 LCI database [23].

2.2.4. Value and Cost Assessment

Key economic indicators, such as farm revenue, variable costs (purchased physical inputs), and total value added (TVA), were calculated based on data presented in Table 3.

2.2.5. Uncertainty and Sensitivity Analysis

To address uncertainty, a Monte Carlo simulation (1000 simulations) was conducted for each system using the pedigree matrix approach. A pedigree matrix (Table A1) was created and used for the LCI data quality evaluation and characterization phase of LCIA with five criteria: (i) reliability, completeness, temporal correlation, geographical correlation, and further technological correlation. Each criterion was assigned a score between one and five: one being the best and five the worst. The distributions of the output impacts were then used to determine uncertainty bounds at certain quantiles of 5% and 95%. Output metrics employed for quantifying uncertainty in the LCA model were the coefficients of variation (CV). Further, a simplified sensitivity analysis of eco-efficiency scores was conducted with the analyzed effect of market price, crop yield, and fertilizer credits.

3. Results and Discussion

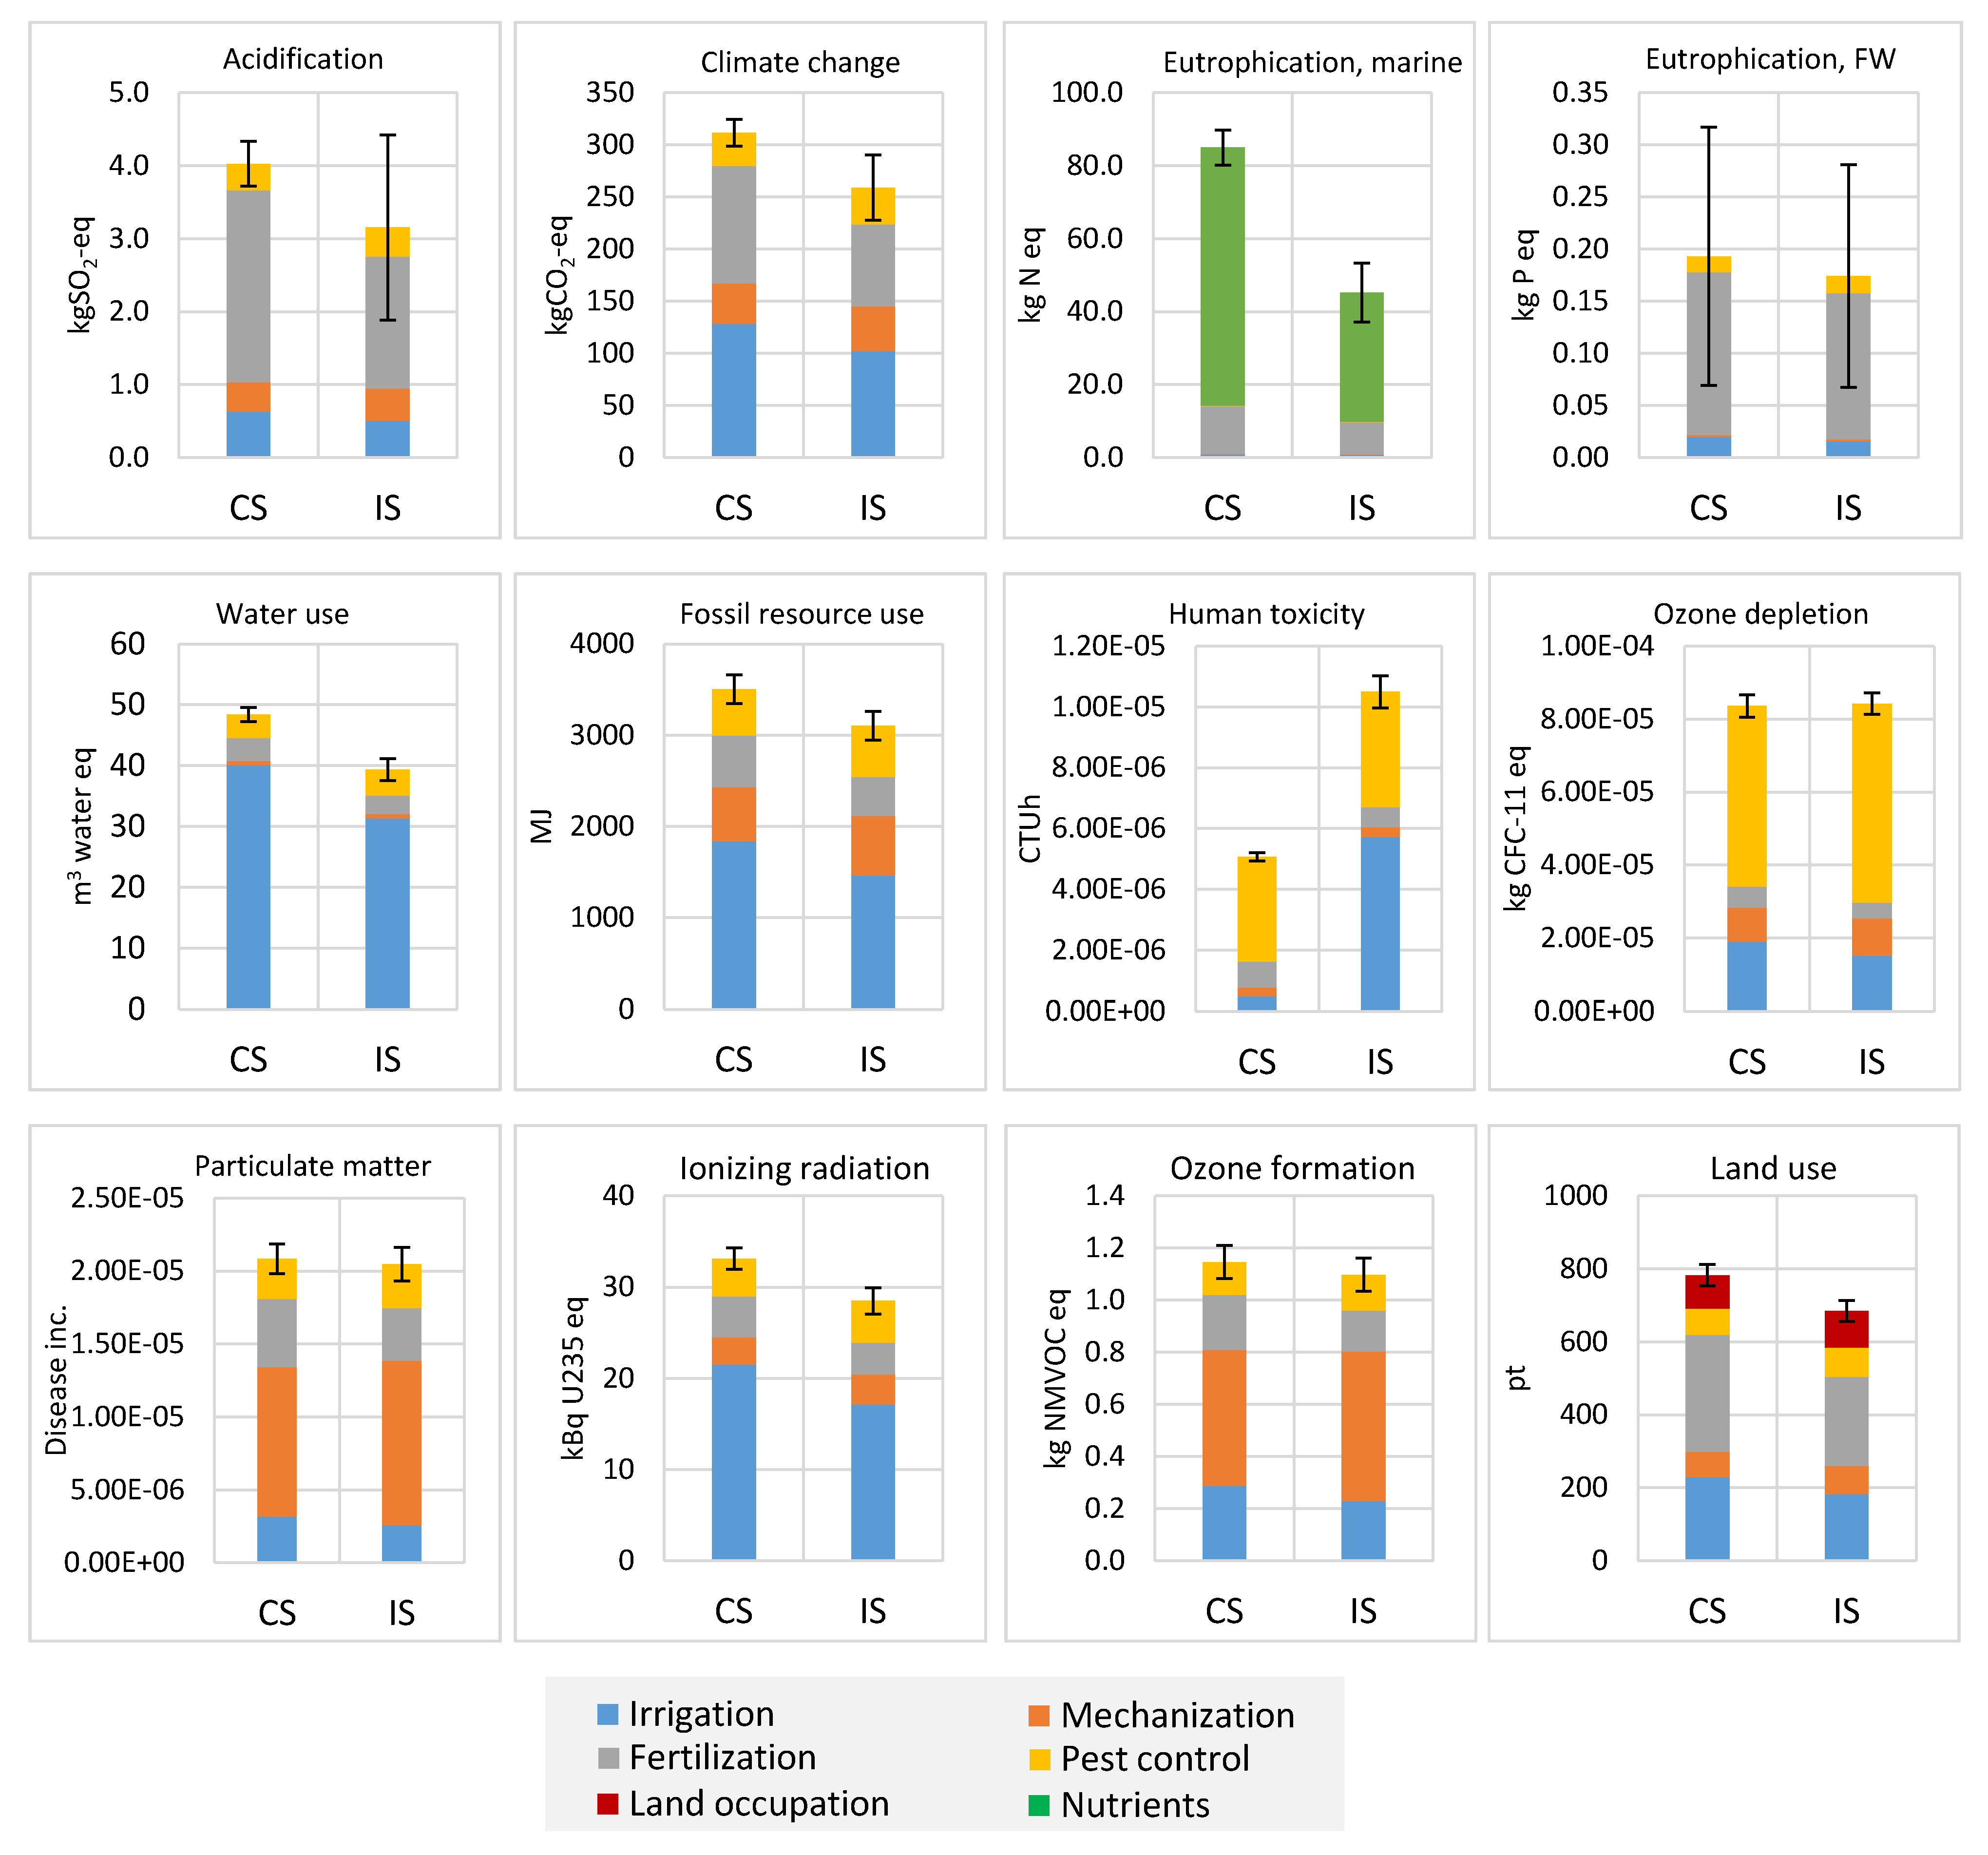
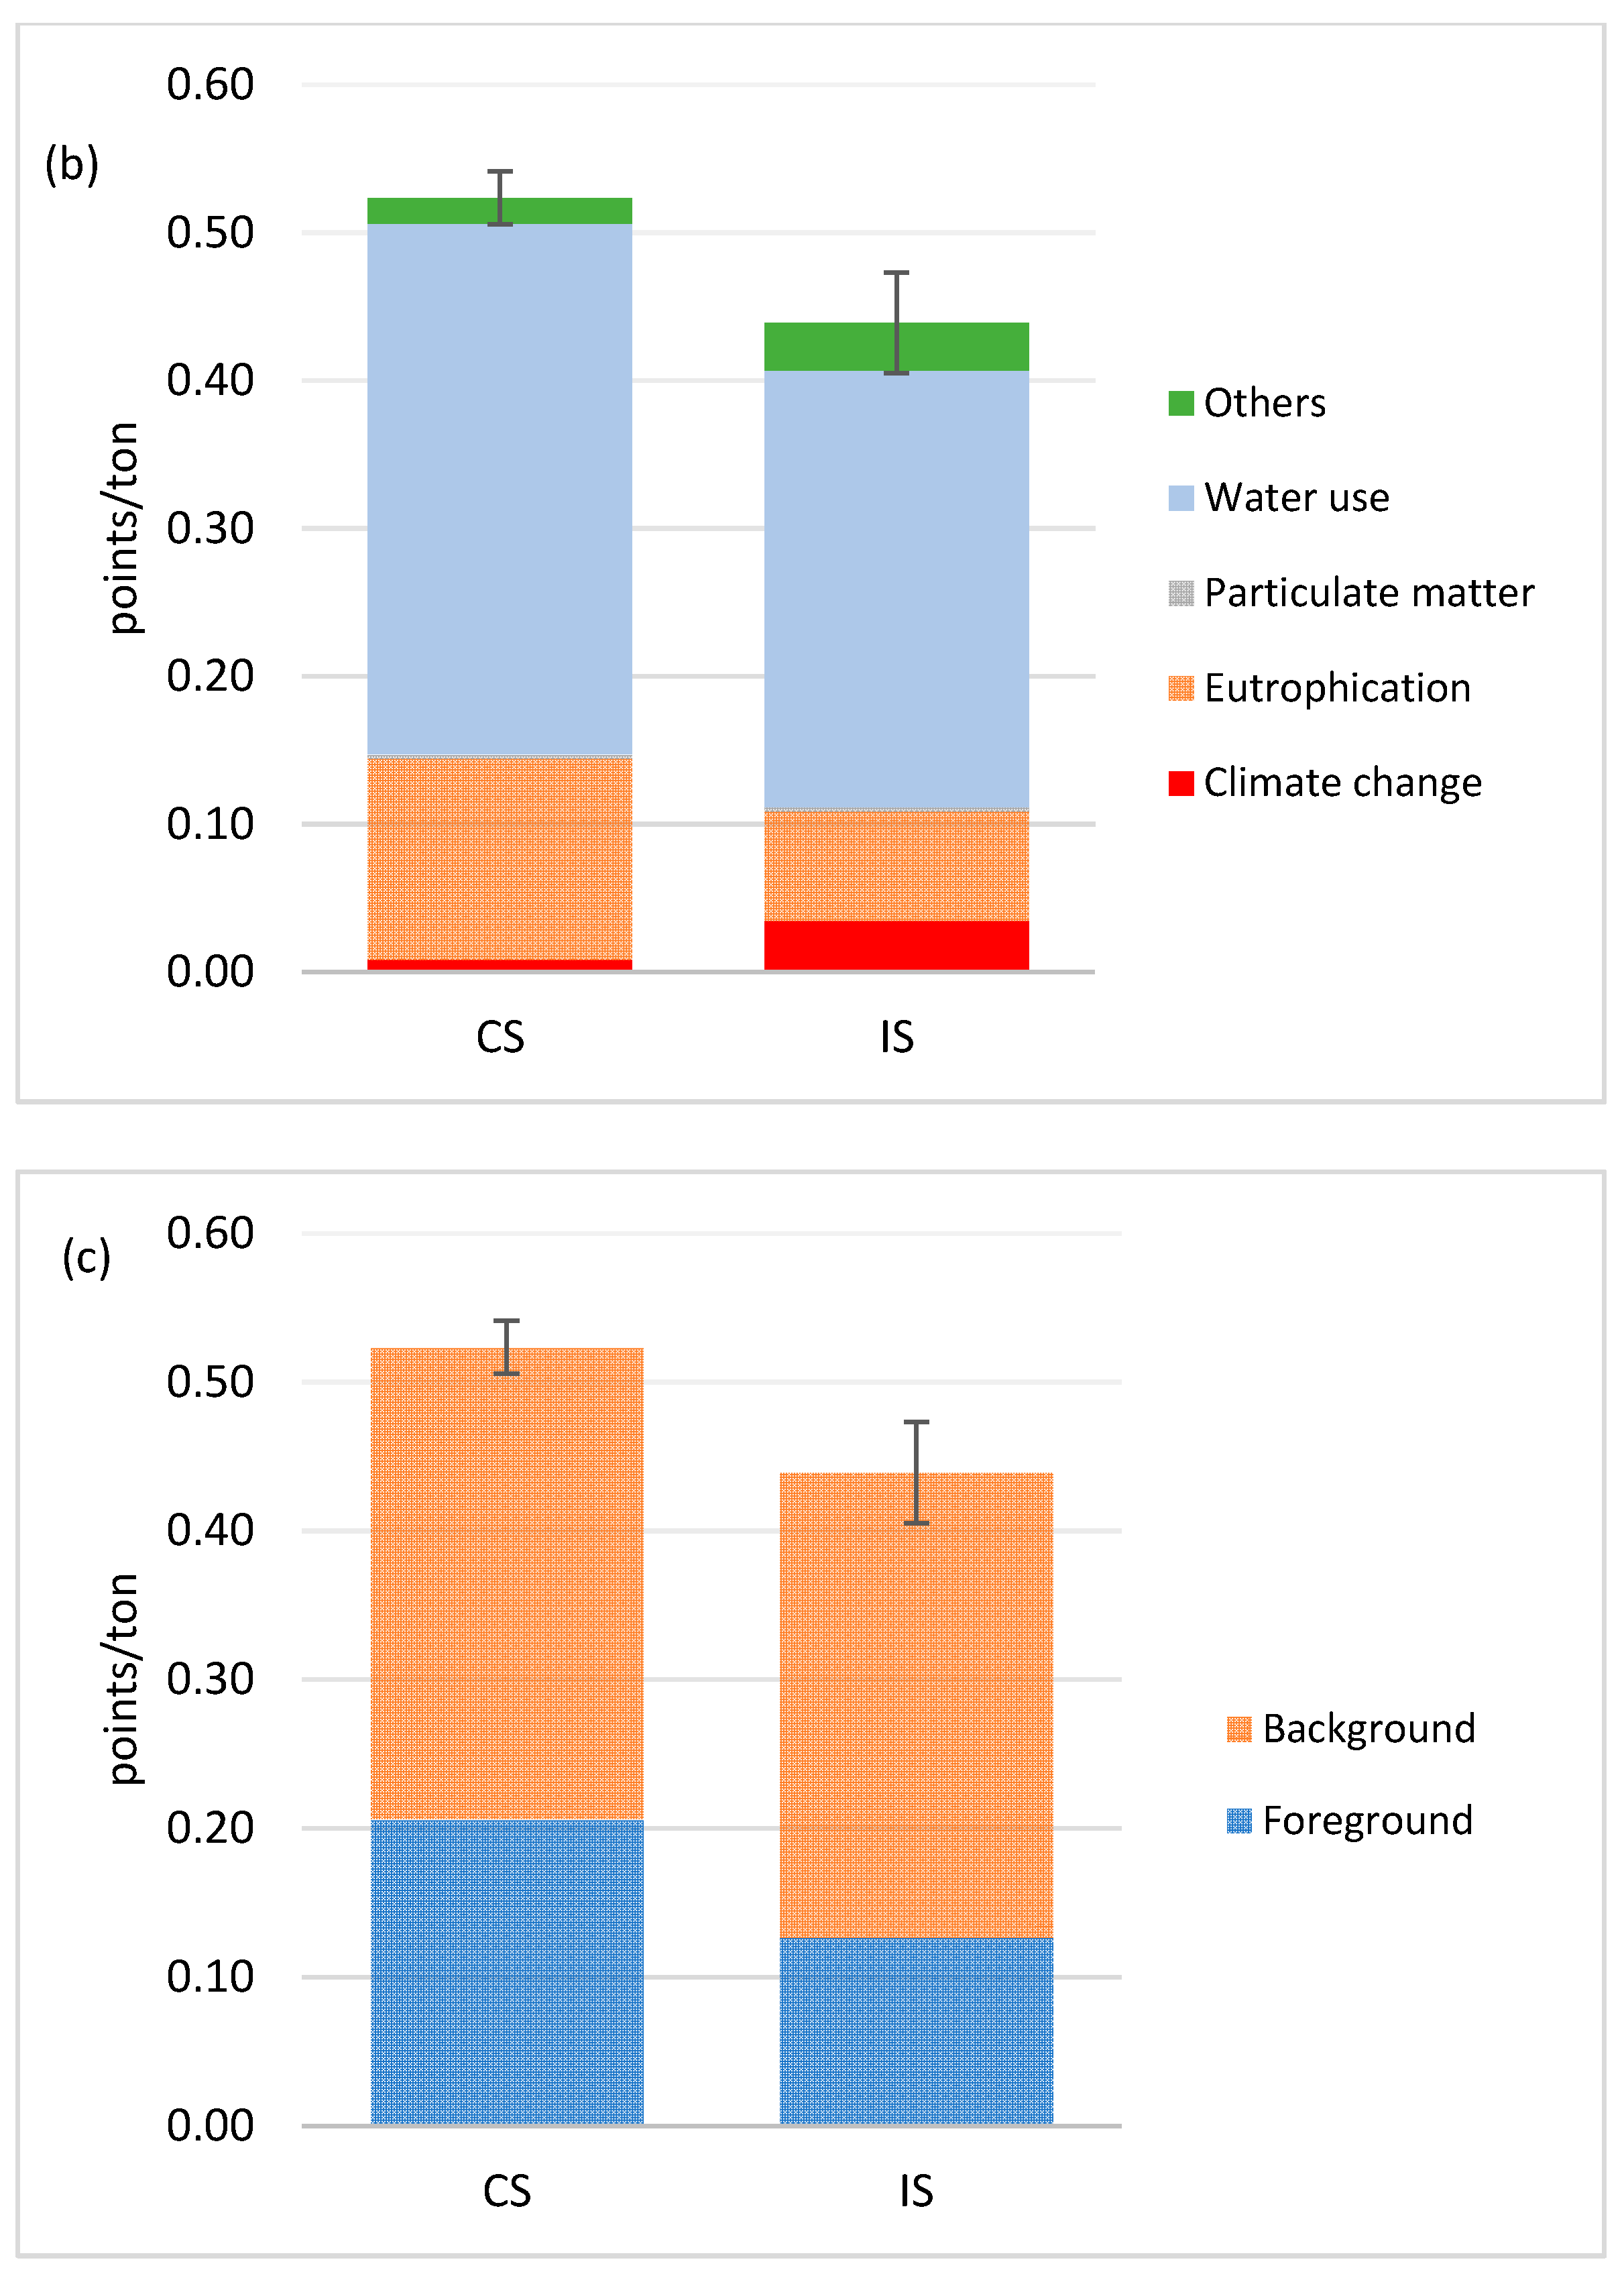
3.1. Results of Environmental Analysis

The results of life cycle impact assessment at the midpoint level with standard deviations (SD) from the Monte Carlo, indicated with a black line, are presented in Figure 5. A detailed summary of results is shown in Appendix A (Table A2).
The integrated system outperformed the conventional system in terms of eutrophication (both marine and terrestrial), acidification, water consumption, and fossil resource use. This was due to a better reduction in the demand for electricity for irrigation and nutrient use. Electricity consumption contributed to a large share of water use, resource use, ionizing radiation, and climate change impact categories. Another benefit from the use of alternative reclaimed water is the proportional decrease in blue water withdrawals and consumption (i.e., fresh surface and groundwater). It is known that the reuse of water can contribute to the reduction in the blue water footprint [24]. Another advantage of reclaimed water in the integrated system is the transfer of N and P effluents to irrigated fields, which provide nutrients while avoiding the impact of mineral fertilizer production. Since most of these nutrients are absorbed by the plant, they are removed from the water cycle and thus play no further role in the eutrophication of the surface or marine environment [25]. Moreover, climate change, acidification, and freshwater eutrophication are mitigated. The conventional system performed better for human toxicity and ozone depletion, which were primarily controlled by pest management and water treatment infrastructure. Mechanization through fuel combustion played a key role in particulate matter formation and photochemical ozone formation. Except for eutrophication and acidification, the results of Monte Carlo analysis (Table A3 and Table A4) revealed that the uncertainty was low for most impact categories. The uncertainty in eutrophication and acidification has a coefficient of variation of 61% and 40%. The high uncertainty in the acidification was due to ammonia volatilization, while for eutrophication, it was due to phosphorus emissions. Other impact categories show a coefficient of variation below 12.5%. These categories, therefore, have a relatively low level of uncertainty.

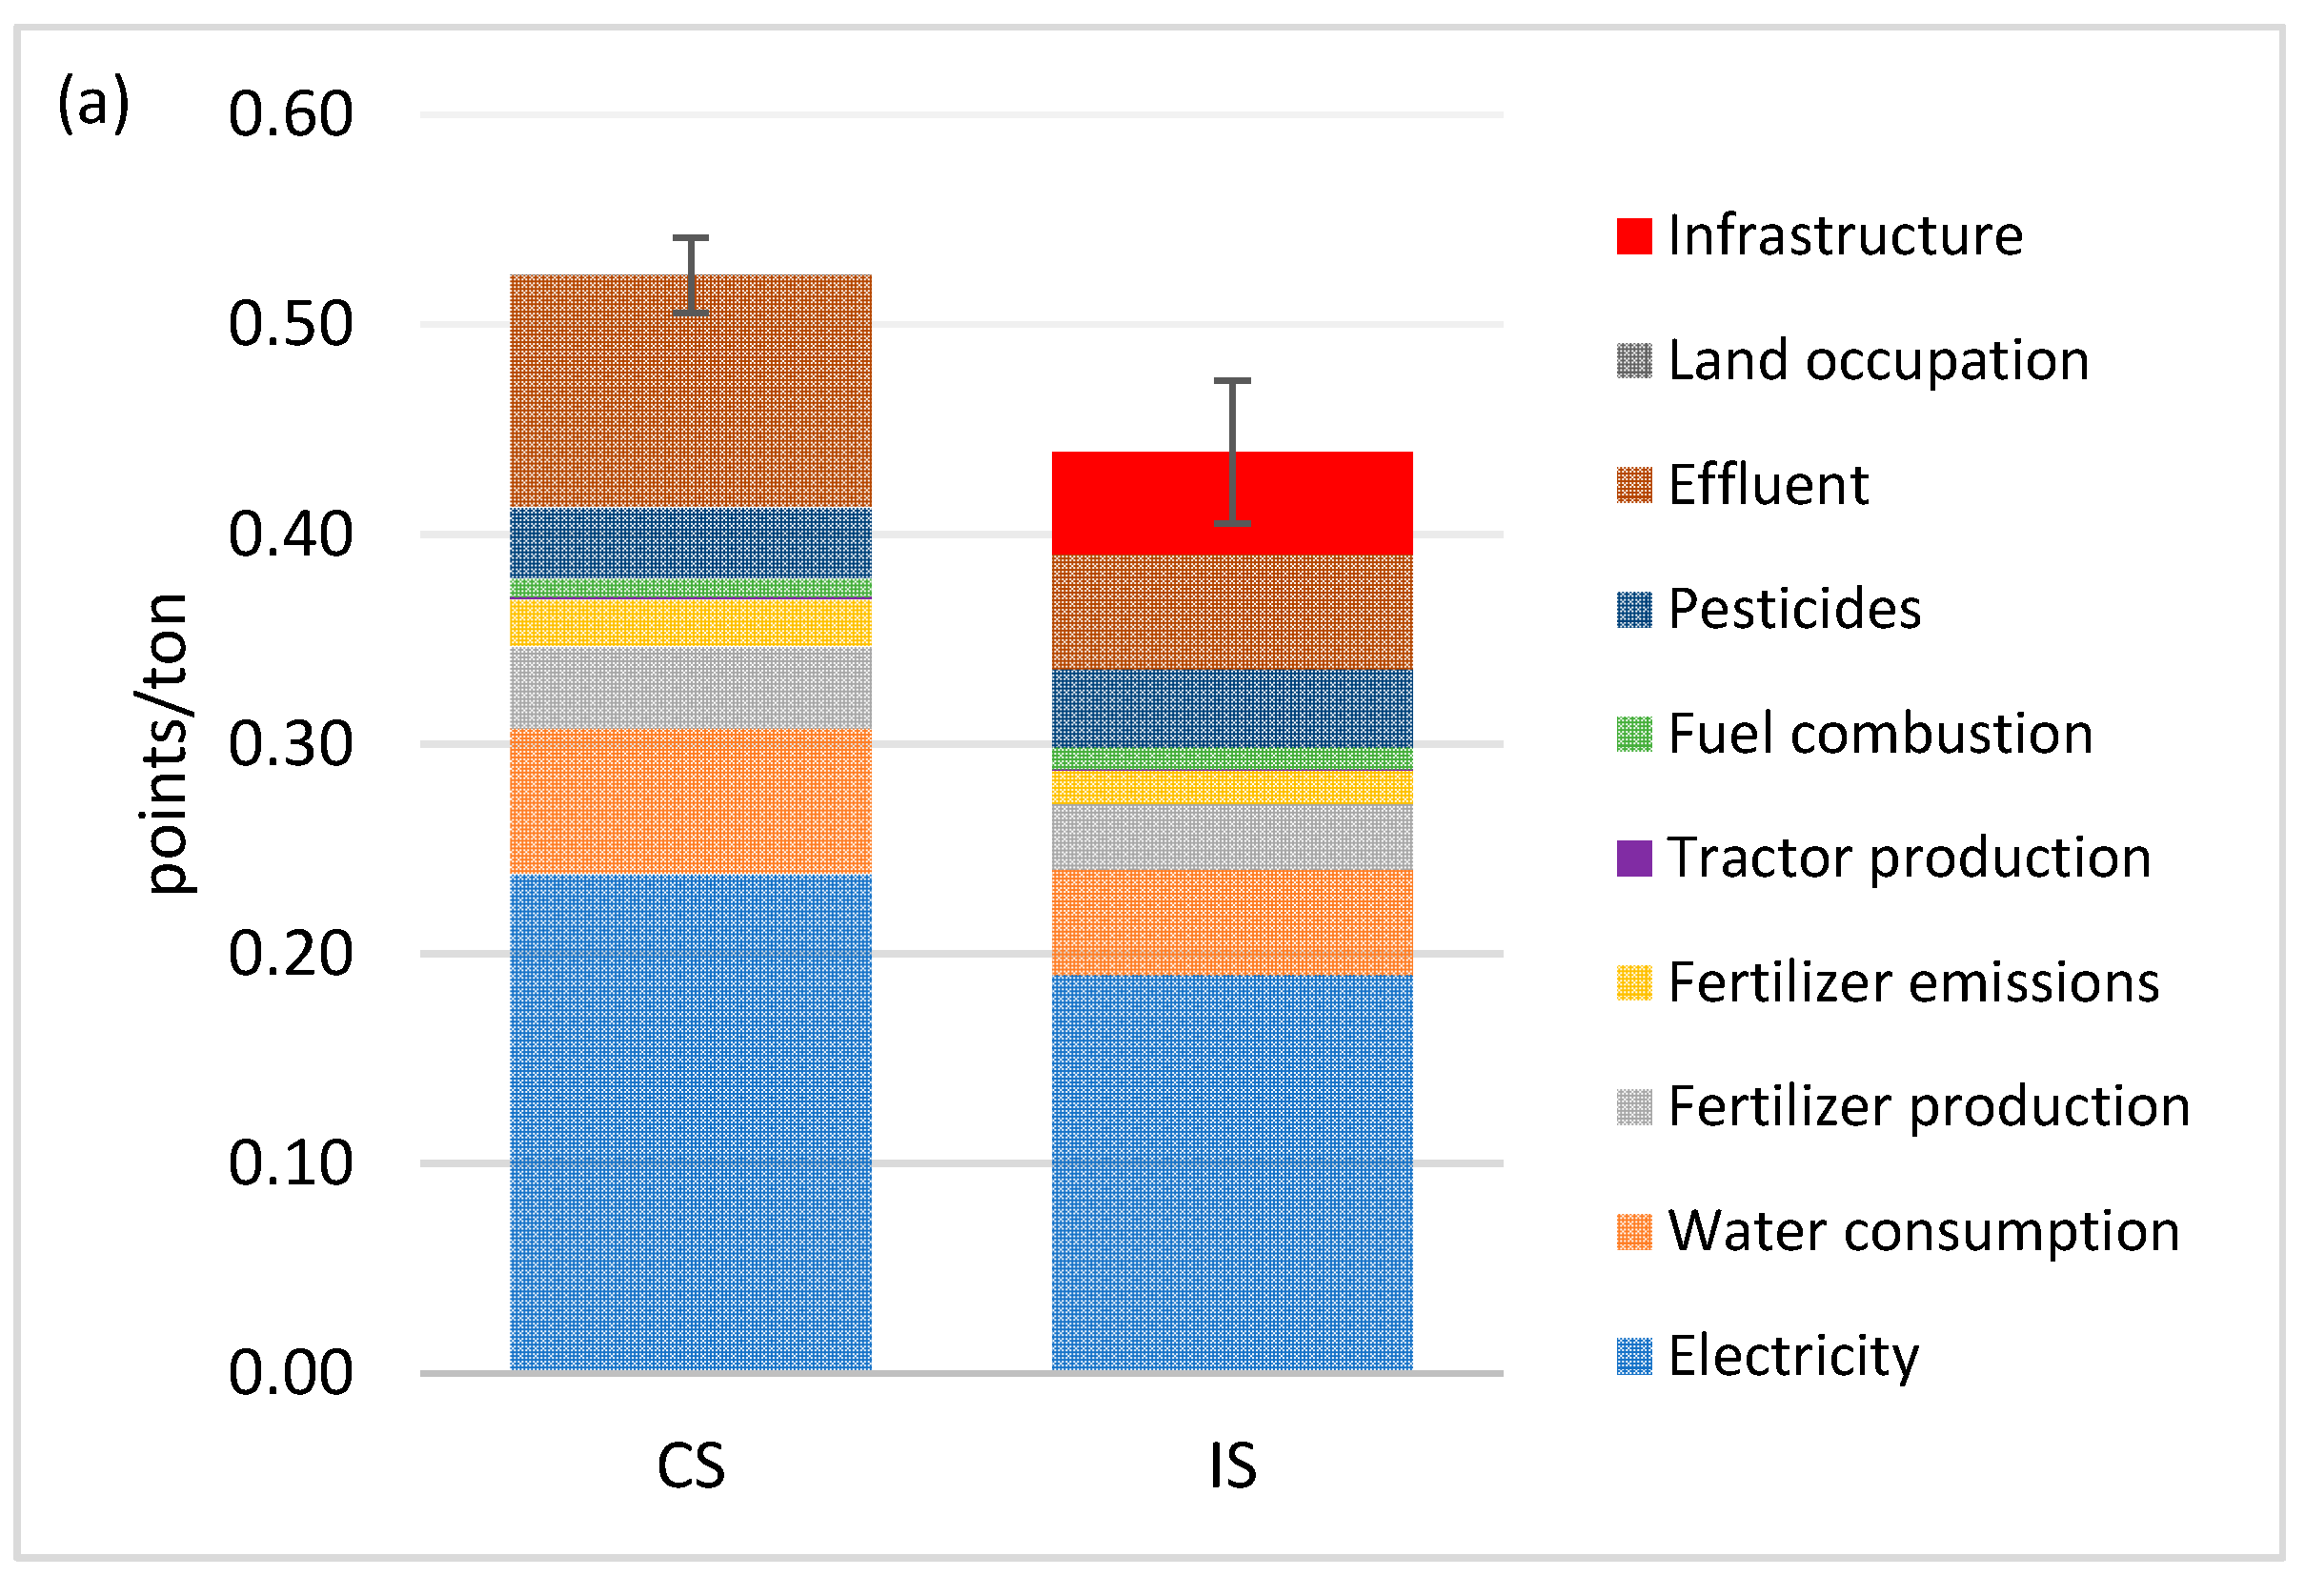
LCA Results in a Single Index

The process LCIA results were weighted to produce a single score for environmental impacts (Figure 6). This analysis indicates whether reclaimed water improved or degraded environmental performance. It also indicates the overall relevance of each process to the total environmental impact. Our final result shows that the use of reclaimed water for irrigation can reduce the environmental impact of grapes by about 16.1% (1 ton) and 23.8% (1 ha) compared to the use of groundwater as the sole source of irrigation. The single-score environmental impact for 1 ton was 0.523 (12.1 points/ha) and 0.44 points (9.22 points/ha) for the conventional and integrated system, respectively. The results show a high contribution of electricity production for both systems and across processes. In other LCA studies focusing on grape production, the following stages were identified as major contributors to the total environmental cost: organic fertilizer [26], usage of electricity for irrigation pumps, and diesel for agricultural machinery [27], pest control [28], agrochemical and power for irrigation [29]. In terms of impact categories, the indicator of water use is the most contributor to the final results. A significant portion of water use impacts is caused by the generation of grid electricity, which is used throughout the supply chain. Finally, comparing the contributions of on-site and supply chain activities, we found that the background processes have a significant impact on LCA performance. Reducing electricity use in the integrated system could result in 20.4% less process impact (i.e., from 0.238 points to 0.19 points). The Monte Carlo simulation results show a low level of uncertainty for the total environmental impact with a coefficient of variation of 7.7% and confirmed the dominant contribution of electricity and water use to the total environmental impact.

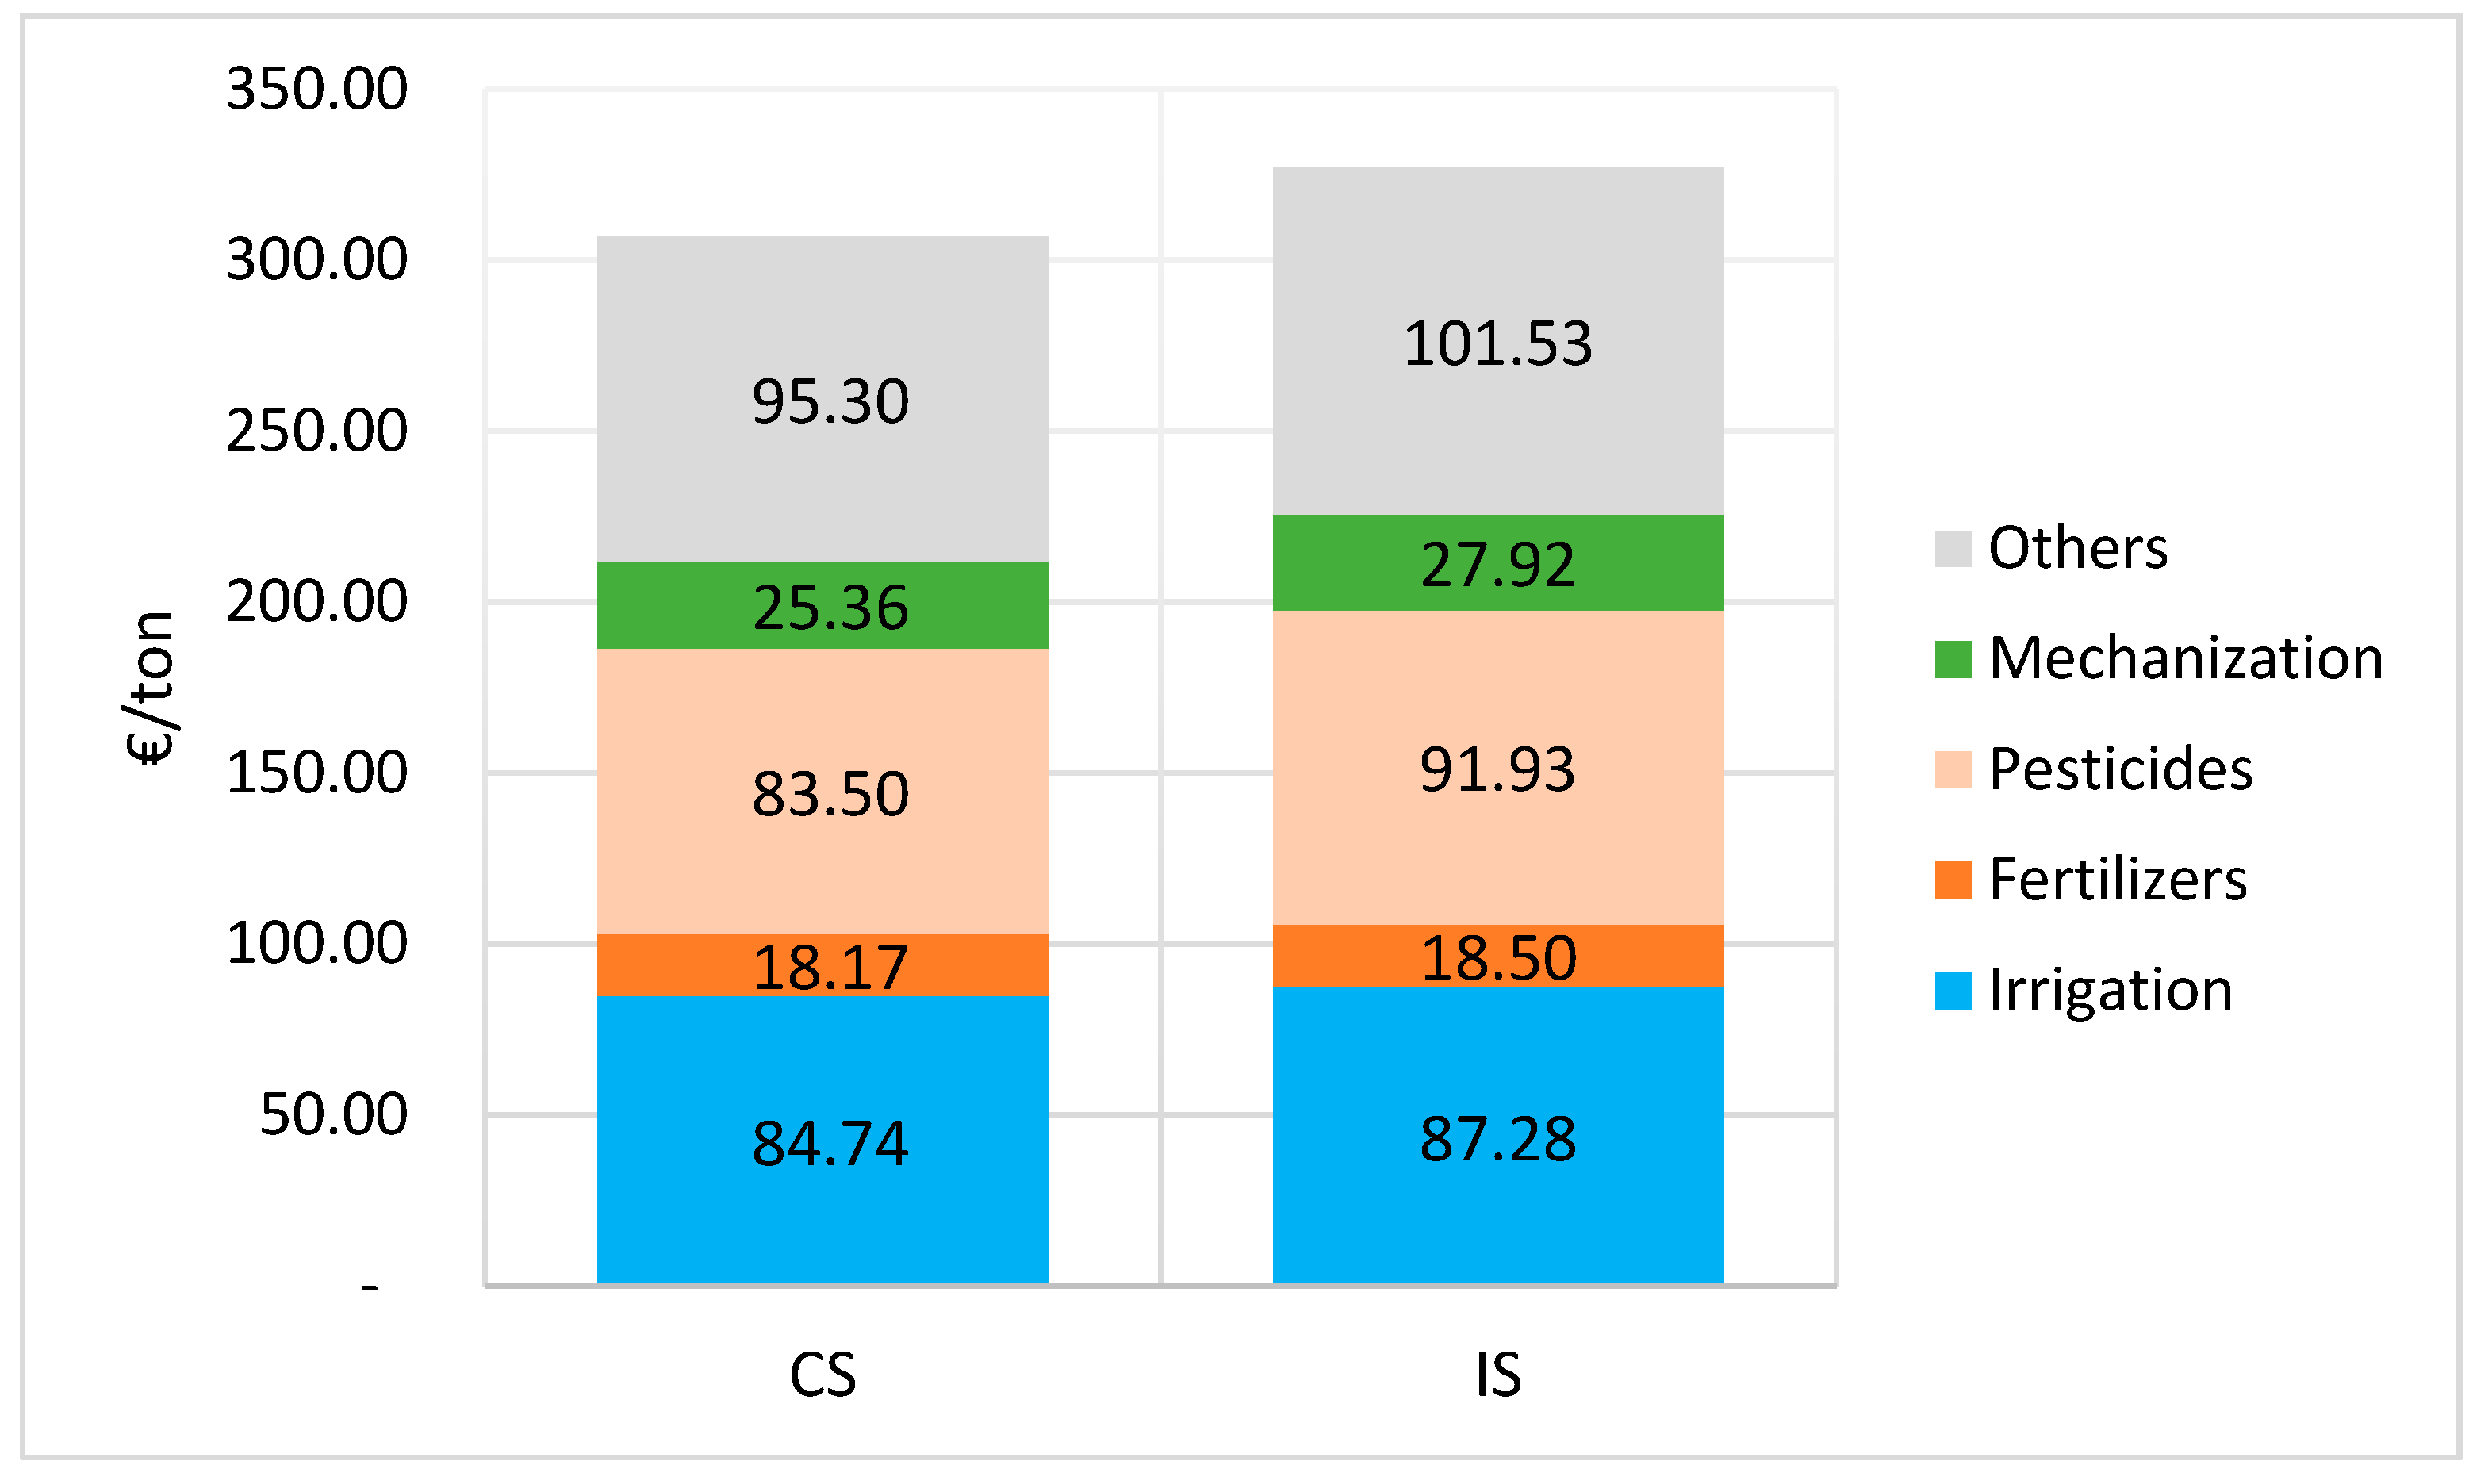
3.2. Result of Economic Analysis

Table 4 shows the computed economic indicators. The gross production value of the integrated system was 9.1% or 1484 euros per ha lower in comparison to the conventional system. On an area basis, the cost of irrigation in the integrated system was 6.4% lower compared to GW, i.e., 1959.3 vs. 1832.8 euro/ha. This comes as a result of lower energy consumption. The cost for fertilization processes is 388.4 euro/ha in the integrated system and 420.2 euro/ha in the conventional system. It should be noted that variable costs per unit of production are higher in the integrated system (Figure 7). Finally, the total value added (TVA) per 1 ton of product was 393 and 373 euros for the conventional and integrated systems, respectively. This is a consequence of the lower crop yield.

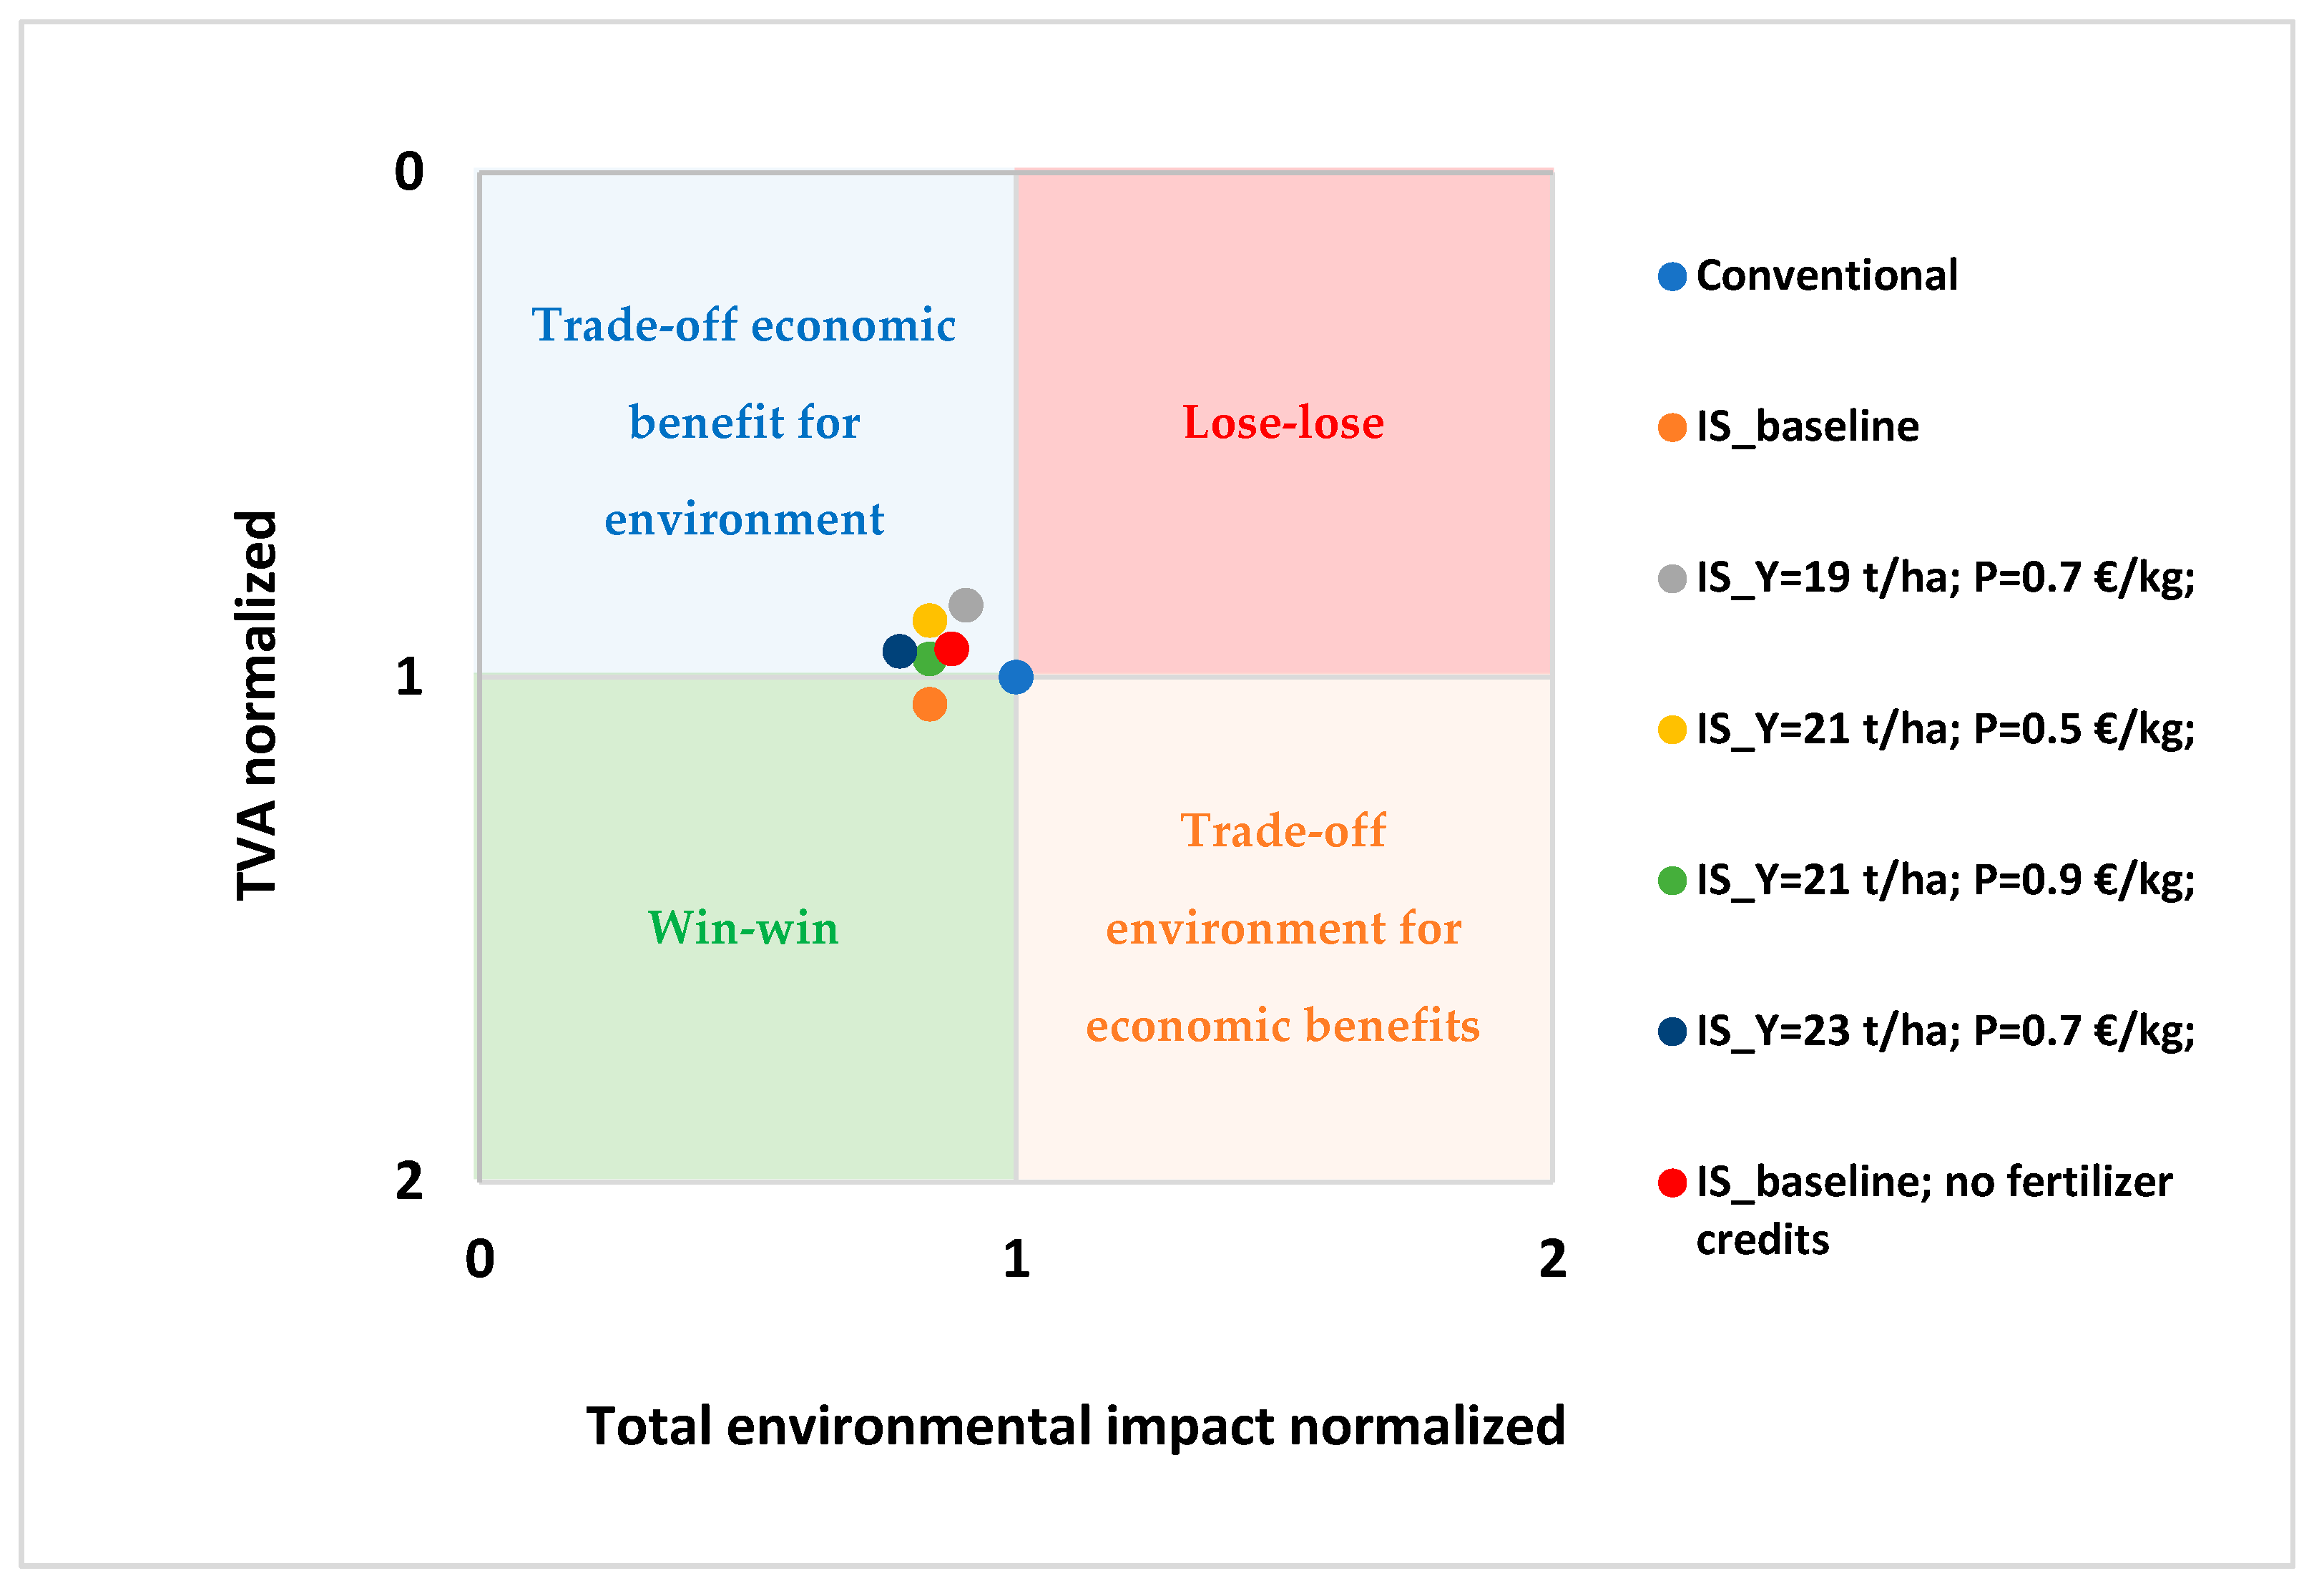
3.3. Eco-Efficiency Performance—Relation between Environment and the Economic Performance

The LCA and LCC assessment results were aggregated and presented in the form of the eco-efficiency portfolio (Figure 8), which is divided into four zones: Eco-Friendly, Stay Clear, Profiteering, and Eco-Efficient [30]. LCA and LCC results are expressed as a single score. The integrated system is positioned in the quadrant Eco-Friendly, which reduces the environmental footprint but adversely increases the production costs.
We calculated eco-efficiency as the ratio of the value added to environmental impact. An increase in eco-efficiency could result either from improved economic performance, reduced environmental impact, or even both [31]. Figure 9 shows the eco-efficiency portfolio (value-added vs. environmental impact) with a sensitivity analysis of price, yield, and fertilizer credits. The more eco-efficient scenario will have a higher value, which represents either increased value for the same environmental impact or a reduced environmental impact for the same product system value. The calculated eco-efficiency indicators were 750.7 and 845.7 EUR/point for the conventional and the integrated system, respectively. This means that the integrated system has a better eco-efficiency by about 12.6%. The sensitivity analysis shows that despite the reduction in yield and price, the eco-efficiency of the integrated system remains positive, mainly due to the higher energy efficiency compared to the conventional system. Eco-efficiency is positively related to greater farm output (agricultural yield) and the higher market price of the crop.

3.4. Discussion

The presented results referred to the specific pedo-climatic, hydrological, and management conditions of one among many different realities describing the use of treated wastewater in Mediterranean agriculture. Nevertheless, the adopted methodology can be widely used for the eco-efficiency assessment of other irrigated areas. Our attempt to compare results across studies was challenging since this is the first analysis of table grape cultivation with treated wastewater. Furthermore, it is difficult to compare these results to those of other studies owing to the differences in the various LCA study elements (e.g., functional units, system boundaries, product allocation, and impact assessment methods).
Studies in the Mediterranean region highlight that the expected benefits of water reuse can be multiple and diverse according to specific local contexts [10]. Other results from the literature [3,11,32] consistently show that trade-offs exist between groundwater and reclaimed water as irrigation sources. The LCA results of crop production can vary depending on the data sources and aggregation methods, production methods and equipment, type of water reuse activity and its attendant energy requirements, yields, crop variety, and analytical assumptions [33]. Moreover, the assumptions of LCC analysis (i.e., the flow costs, prices) affect the result. Thus, the conclusions of this study cannot be applied unreservedly to other conditions. There will be of interest to investigate other life cycle impact assessment methods and how they affect eco-efficiency.
Our assessment shows that wastewater has a better performance compared to conventional groundwater. Based on the outcomes of this study, a further optimized reuse system would include demand-oriented irrigation, nutrient recovery, and improvement of energy efficiency. The environmental impacts are driven by the energy consumption in the use phase as well as by the groundwater availability and depth. Energy consumption for irrigation represents one of the most pollutant stages confirming other studies in grape cultivation [27,28] and wastewater reuse in crop production [3,11]. Therefore these results are very sensitive to the applied energy mix or the underlying energy carriers. Adopting cleaner energy sources, reducing electricity use, designing system configuration with fit-for-purpose, resource recovery, and decentralization concepts are effective strategies to mitigate the environmental and economic impacts of water reuse systems [34].
For example, climate change impact could decrease by about 46% due to the transition from traditional fuels to renewable sources [35]. Usually, the energy carries in the grid mix is beyond the authority of water and wastewater utilities. Hence, a direct way is the installation of solar panels directly on-site to partly cover the additional energy needs of water reuse with renewable energy. Additionally, pumping applications with variable-duty requirements offer great potential for energy, environmental impact, and costs. The combination of demand-oriented irrigation with nutrient recovery leads to maximum benefits. Usually, farmers’ have a lack aggregated farm information to manage precise asset applications and to save resources. Thus, computer-based DSS can be used to calculate crop irrigation requirements and fertilization recommendations according to farm productive goals and eco-efficiency principles [19]. The environmental DSS-based irrigation management in orchard cultivation could be up to 18% for 1 ton of product or 22.6% for 1 ha of cultivated land [36]. Our analysis was based on tertiary treatment, and advanced treatment options used specific pollutant removal, disinfection, etc. The tertiary treatment reduces the potential microbiological risk; however, risk matrixes and sanitary inspections of the system ensure sustainability and long-term safety.

4. Conclusions

Life cycle thinking is a fundamental aspect of determining the feasibility of water reuse for irrigation. Nevertheless, relatively few studies have focused on irrigation and crop production. Life Cycle Assessment (LCA) and Life Cycle Costing (LCC) were used in this study to investigate the environmental impacts and costs of irrigated vineyard cropping systems when tertiary treated wastewater is used as an additional source of irrigation (integrated system).
Our findings suggest that reclaimed water can provide environmental and economic benefits per 1 hectare of cultivated land through water and energy savings. The analysis on a mass basis (per 1 ton) indicated that environmental benefits are offset by lower economic value added. Plotting the economic versus environmental results in a two-dimensional eco-efficiency performance grid revealed that the integrated system is more eco-efficient than the conventional one due to significantly higher environmental efficiency. Reuse of wastewater decreases dependency on groundwater pumping and the overall energy-for-water requirements. These advantages outweighed the advantages of avoiding fertilizer and discharge into marine environments. Comparable crop yields, supported by water-efficient irrigation and a favorable crop market price, will further enhance the eco-efficiency of the integrated system, i.e., jointly achieve high economic performance with low environmental impacts.
Until now, research on the use of LCA, LCC, and eco-efficiency in crop production with reclaimed water encompassing a life cycle perspective is relatively new. This study used a multi-impact approach which allowed for a holistic view of the potential environmental and economic impacts, as well as conjoint verification of the economic–environmental–energy sustainability of non-conventional water resources reclamation and use. It provided a valuable contribution to the relevance and comparability of life cycle assessment studies, as well as a better understanding of the potential benefits of shifting from a linear to a circular agriculture model. We highlight that LCA and LCC can be robustly applied in the continued development of the water reuse systems and the assessment of their eco-efficiency. Despite the usefulness of the existing research, a life cycle sustainability assessment would result from a combination of LCA, LCC, and Social LCA, as well as microbial risk assessment.

Author Contributions

Conceptualization, K.C.; methodology, K.C. and M.T.; software, K.C.; validation, R.R. and M.T.; investigation, F.B. and V.C.; resources, F.B. and V.C; data curation, F.B.; writing—original draft preparation, K.C; writing—review and editing, K.C., D.M., R.R. and M.T; visualization, M.T.; supervision, D.M. and R.R. All authors have read and agreed to the published version of the manuscript.

Funding

This work has been supported by the ECO-LOOP project (No. 2AT8246) funded by the Regione Puglia POR Puglia FESR—FSE 2014–2020. Fondo Europeo Sviluppo Regionale. Azione 1.6—Avviso pubblico “InnoNetwork”.

Institutional Review Board Statement

Not applicable.

Data Availability Statement

Data are available by contacting the corresponding authors.

Acknowledgments

The authors would like to acknowledge the support on the logistics provided by La Società Cooperativa di Produttori Agricoli “La Molignana”.

Conflicts of Interest

The authors declare no conflict of interest.

Appendix A

Table A1. Data quality indicators (reliability, completeness, temporal correlation, geographical correlation, further technological correlation) used for uncertainty assessment.
ParameterReliabilityCompletenessTemporal
Correlation
Geographical
Correlation
Further Technological
Correlation
Irrigation water11111
Electricity21221
N-fertilizer21221
P-fertilizer21221
K-fertilizer21221
Pesticides21221
Tractor operations21221
Land occupation21221
Ammonia volatilization32122
Dinitrogen monoxide32122
Nitrous oxide32122
Nitrates 32122
Phosphorus32122
Phosphates32122
Pesticide emissions32122
Nutrient emissions21221
Table A2. Midpoint characterized results in absolute values per 1 ha of cultivated and 1 ton of table grapes at the farm gate with conventional (groundwater) and integrated (groundwater + reclaimed water) irrigation.
Impact CategoriesUnitConventional SystemIntegrated System
1 ha1 ton1 ha1 ton
Acidificationmol H+ eq93.14.0366.23.15
Climate changekg CO2 eq7206.5311.705439.1259.01
Ecotoxicity: freshwaterCTUe208,592.69022.17170711.48129.11
Eutrophication: freshwaterkg P eq4.50.1933.70.174
Eutrophication: marinekg N eq1964.684.97949.345.20
Eutrophication: terrestrialmol N eq440.819.06247.811.80
Human toxicity: cancerCTUh1.63 × 10−57.04 × 10−71.69 × 10−58.04 × 10⁻⁷
Human toxicity: non-cancerCTUh1.01 × 10−44.37 × 10−62.04 × 10−49.69 × 10⁻⁶
Ionising radiationkBq U235 eq765.733.12598.328.49
Land usePt18092.7782.5614384.4684.97
Ozone depletionkg CFC-11 eq1.93 × 10−38.36 × 10−51.77 × 10−38.42 × 10⁻⁵
Particulate matterDisease inc.4.82 × 10−42.08 × 10−54.3 × 10−42.05 × 10⁻⁵
Photochemical ozone formationkg NMVOC eq26.51.14623.01.098
Resource use: fossilsMJ81000.83503.4965156.93102.71
Resource use: minerals and metalskg Sb eq0.01767.62 × 10−40.01376.53 × 10−4
Water usem3 water eq1,118,816 48,391.69826,32739,348.85
Table A3. Results of Monte Carlo simulation for 1 ton of table grapes at the farm gate with conventional (groundwater) irrigation.
Impact CategoriesUnitConventional System
Mean5%95%SD
Acidificationmol H+ eq4.033.934.200.31
Climate changekg CO2 eq311.70298.9325.5612.97
Ecotoxicity: freshwaterCTUe9022.178661.89375.95245.78
Eutrophication: freshwaterkg P eq0.1930.1910.200.02
Eutrophication: marinekg N eq84.9779.491.724.76
Eutrophication: terrestrialmol N eq19.0617.620.570.96
Human toxicity: cancerCTUh7.04 × 10−76.78 × 10−77.31 × 10−71.64 × 10⁻⁸
Human toxicity: non-cancerCTUh4.37 × 10−64.19 × 10−64.54 × 10−61.21 × 10⁻⁷
Ionising radiationkBq U235 eq33.1231.6934.551.17
Land usePt782.56745.0820.6629.56
Ozone depletionkg CFC-11 eq8.36 × 10−57.99 × 10⁻⁵ 8.72 × 10−53.08 × 10−6
Particulate matterDisease inc.2.08 × 10−51.94 × 10−52.22 × 10−51.03 × 10⁻⁶
Photochemical ozone formationkg NMVOC eq1.151.071.220.06
Resource use: fossilsMJ3503.493333.73668.94157.07
Resource use: minerals and metalskg Sb eq7.62 × 10−47.33 × 10−47.91 × 10−42.06 × 10⁻⁵
Water usem3 water eq48,391.6946,556.350,278.641195.71
Table A4. Results of Monte Carlo simulation for 1 ton of table grapes at the farm gate with integrated (groundwater + reclaimed water) irrigation.
Impact CategoriesUnitIntegrated System
Mean5%95%SD
Acidificationmol H+ eq3.1532.813.541.27
Climate changekg CO2 eq259.01238.1281.8831.21
Ecotoxicity: freshwaterCTUe8129.117790.58530.30272.45
Eutrophication: freshwaterkg P eq0.1740.1510.200.11
Eutrophication: marinekg N eq45.2041.249.888.05
Eutrophication: terrestrialmol N eq11.8010.912.770.66
Human toxicity: cancerCTUh8.04 × 10−77.72 × 10−78.36 × 10−72.18 × 10⁻⁸
Human toxicity: non-cancerCTUh9.69 × 10−69.31 × 10−61.01 × 10−55.03 × 10⁻⁷
Ionising radiationkBq U235 eq28.4926.2730.941.44
Land usePt684.97640.1732.6128.85
Ozone depletionkg CFC-11 eq8.42 × 10−57.96 × 10−58.90 × 10−52.95 × 10⁻⁶
Particulate matterDisease inc.2.05 × 10−51.88 × 10−52.20 × 10−51.14 × 10⁻⁶
Photochemical ozone formationkg NMVOC eq1.101.001.190.072
Resource use: fossilsMJ3102.712863.43357.16156.90
Resource use: minerals and metalskg Sb eq6.53 × 10−46.26 × 10−46.81 × 10−41.67 × 10⁻⁵
Water usem3 water eq39,348.8936,498.942,596.221828.39

References

  1. Mancuso, G.; Lavrnić, S.; Toscano, A. Reclaimed water to face agricultural water scarcity in the Mediterranean area: An overview using Sustainable Development Goals preliminary data. In Wastewater treatment and Reuse—Present and Future Perspectives in Technological Developments and Management Issues; Elsevier: Amsterdam, The Netherlands, 2020; pp. 113–143. [Google Scholar] [CrossRef]
  2. Lonigro, A.; Montemurro, N.; Rubino, P.; Vergine, P.; Pollice, A. Reuse of treated municipal wastewater for irrigation in Apulia region: The "IN.TE.R.R.A." project. Environ. Eng. Manag. J. 2015, 14, 1665–1674. [Google Scholar] [CrossRef]
  3. Romeiko, X.X. A Comparative Life Cycle Assessment of Crop Systems Irrigated with the Groundwater and Reclaimed Water in Northern China. Sustainability 2019, 11, 2743. [Google Scholar] [CrossRef] [Green Version]
  4. Padilla-Rivera, A.; Morgan-Sagastume, J.M.; Güereca-Hernández, L.P. Sustainability Assessment of Wastewater Systems: An Environmental and Economic Approach. J. Environ. Prot. 2019, 10, 241–259. [Google Scholar] [CrossRef] [Green Version]
  5. Corominas, L.; Foley, J.; Guest, J.; Hospido, A.; Larsen, H.; Morera, S.; Shaw, A. Life cycle assessment applied to wastewater treatment: State of the art. Water Res. 2013, 47, 5480–5492. [Google Scholar] [CrossRef] [PubMed]
  6. Gallego-Schmid, A.; Tarpani, R.R.Z. Life cycle assessment of wastewater treatment in developing countries: A review. Water Res. 2019, 153, 63–79. [Google Scholar] [CrossRef] [Green Version]
  7. Arcidiacono, C.; Porto, S.M.C. Life cycle assessment of Arundo donax biomass production in a Mediterranean experimental field using treated wastewater. J. Agric. Eng. 2012, 42, 29. [Google Scholar] [CrossRef]
  8. Muñoz, I.; Gómez, M.D.M.; Fernández-Alba, A.R. Life Cycle Assessment of biomass production in a Mediterranean greenhouse using different water sources: Groundwater, treated wastewater and desalinated seawater. Agric. Syst. 2010, 103, 1–9. [Google Scholar] [CrossRef]
  9. Azeb, L.; Hartani, T.; Aitmouheb, N.; Pradeleix, L.; Hajjaji, N.; Aribi, S. Life cycle assessment of cucumber irrigation: Unplanned water reuse versus groundwater resources in Tipaza (Algeria). J. Water Reuse Desalination 2020, 10, 227–238. [Google Scholar] [CrossRef]
  10. Canaj, K.; Mehmeti, A.; Morrone, D.; Toma, P.; Todorović, M. Life cycle-based evaluation of environmental impacts and external costs of treated wastewater reuse for irrigation: A case study in southern Italy. J. Clean. Prod. 2021, 293, 126142. [Google Scholar] [CrossRef]
  11. Moretti, M.; Van Passel, S.; Camposeo, S.; Pedrero, F.; Dogot, T.; Lebailly, P.; Vivaldi, G. Modelling environmental impacts of treated municipal wastewater reuse for tree crops irrigation in the Mediterranean coastal region. Sci. Total. Environ. 2019, 660, 1513–1521. [Google Scholar] [CrossRef]
  12. Giungato, P.; Guinée, J.B. LCA of an urban wastewater tertiary treatment plant. In Proceedings of the 7th International Conference on Life Cycle Assessment in the Agri-Food Sector (LCA Food 2010), Bari, Italy, 22–24 September 2010. [Google Scholar]
  13. Arborea, S.; Giannoccaro, G.; De Gennaro, B.C.; Iacobellis, V.; Piccinni, A.F. Cost–Benefit Analysis of Wastewater Reuse in Puglia, Southern Italy. Water 2017, 9, 175. [Google Scholar] [CrossRef] [Green Version]
  14. Arena, C.; Genco, M.; Mazzola, M.R. Environmental Benefits and Economical Sustainability of Urban Wastewater Reuse for Irrigation—A Cost-Benefit Analysis of an Existing Reuse Project in Puglia, Italy. Water 2020, 12, 2926. [Google Scholar] [CrossRef]
  15. Giannoccaro, G.; Arborea, S.; De Gennaro, B.C.; Iacobellis, V.; Piccinni, A.F. Assessing Reclaimed Urban Wastewater for Reuse in Agriculture: Technical and Economic Concerns for Mediterranean Regions. Water 2019, 11, 1511. [Google Scholar] [CrossRef] [Green Version]
  16. Mizyed, N.R. Challenges to treated wastewater reuse in arid and semi-arid areas. Environ. Sci. Policy 2013, 25, 186–195. [Google Scholar] [CrossRef]
  17. Sgroi, M.; Vagliasindi, F.G.; Roccaro, P. Feasibility, sustainability and circular economy concepts in water reuse. Curr. Opin. Environ. Sci. Health 2018, 2, 20–25. [Google Scholar] [CrossRef]
  18. Todorovic, M.; Mehmeti, A.; Scardigno, A. Eco-efficiency of agricultural water systems: Methodological approach and assessment at meso-level scale. J. Environ. Manag. 2016, 165, 62–71. [Google Scholar] [CrossRef] [PubMed]
  19. Saab, M.T.A.; Jomaa, I.; Skaf, S.; Fahed, S.; Todorovic, M. Assessment of a Smartphone Application for Real-Time Irrigation Scheduling in Mediterranean Environments. Water 2019, 11, 252. [Google Scholar] [CrossRef] [Green Version]
  20. Koeble, R. The Global Nitrous Oxide Calculator—GNOC—Online Tool Manual. Jt. Res. Cent. Eur. Comm. 2014, 1.2.4, 40. [Google Scholar]
  21. Nemecek, T.; Kagi, T. Life Cycle Inventories of Agricultural Production Systems; Ecoinvent report No. 15. Final Rep. Ecoinvent V2.0; Agroscope Reckenholz-Tanikon Research Station: Zürich, Switzerland; Dübendorf, Switzerland, 2007; pp. 1–360. Available online: https://db.ecoinvent.org/reports/15_Agriculture.pdf (accessed on 14 August 2021).
  22. Green Delta Open LCA Version 1.10., Green Delta GmbH, Germany. Available online: https://www.openlca.org/download/ (accessed on 20 May 2021).
  23. Ecoinvent Database Version 3.1 Swiss Centre for Life Cycle Inventories, Switzerland. Available online: https://www.ecoinvent.org/database/ecoinvent-371/ecoinvent-371.html (accessed on 20 May 2021).
  24. Hoekstra, A.Y.; Mekonnen, M.; Chapagain, A.K.; Mathews, R.E.; Richter, B.D. Global Monthly Water Scarcity: Blue Water Footprints versus Blue Water Availability. PLoS ONE 2012, 7, e32688. [Google Scholar] [CrossRef]
  25. FAO Food and Agriculture Organization of the United Nations, Crops and Drops: Making the Best Use of Water for Agriculture. World Food Day. Rome, Italy. 2002, p. 28. Available online: www.fao.org/DOCREP/005/Y3918E/Y3918E00.htm (accessed on 14 August 2021).
  26. Deng, L.; Chen, L.; Zhao, J.; Wang, R. Comparative analysis on environmental and economic performance of agricultural cooperatives and smallholder farmers: The case of grape production in Hebei, China. PLoS ONE 2021, 16, e0245981. [Google Scholar] [CrossRef]
  27. Russo, V.; Strever, A.E.; Ponstein, H.J. Exploring sustainability potentials in vineyards through LCA? Evidence from farming practices in South Africa. Int. J. Life Cycle Assess. 2021, 26, 1–17. [Google Scholar] [CrossRef]
  28. Falcone, G.; De Luca, A.I.; Stillitano, T.; Strano, A.; Romeo, G.; Gulisano, G. Assessment of Environmental and Economic Impacts of Vine-Growing Combining Life Cycle Assessment, Life Cycle Costing and Multicriterial Analysis. Sustainability 2016, 8, 793. [Google Scholar] [CrossRef] [Green Version]
  29. Roselli, L.; Casieri, A.; De Gennaro, B.C.; Sardaro, R.; Russo, G. Environmental and Economic Sustainability of Table Grape Production in Italy. Sustainability 2020, 12, 3670. [Google Scholar] [CrossRef]
  30. Ng, R.; Yeo, Z.; Low, J.S.C.; Song, B. A method for relative eco-efficiency analysis and improvement: Case study of bonding technologies. J. Clean. Prod. 2015, 99, 320–332. [Google Scholar] [CrossRef]
  31. Arampatzis, G.; Angelis-Dimakis, A.; Blind, M.; Assimacopoulos, D. A web-based Toolbox to support the systemic eco-efficiency assessment in water use systems. J. Clean. Prod. 2016, 138, 181–194. [Google Scholar] [CrossRef]
  32. Meneses, M.; Pasqualino, J.; Castells, F. Environmental assessment of urban wastewater reuse: Treatment alternatives and applications. Chemosphere 2010, 81, 266–272. [Google Scholar] [CrossRef]
  33. Sieverding, H.; Kebreab, E.; Johnson, J.M.F.; Xu, H.; Wang, M.; Del Grosso, S.J.; Bruggeman, S.; Stewart, C.E.; Westhoff, S.; Ristau, J.; et al. A life cycle analysis (LCA) primer for the agricultural community. Agron. J. 2020, 112, 3788–3807. [Google Scholar] [CrossRef]
  34. Xue, X.; Cashman, S.; Gaglione, A.; Mosley, J.; Weiss, L.; Ma, X.C.; Cashdollar, J.; Garland, J. Holistic analysis of urban water systems in the Greater Cincinnati region: (1) life cycle assessment and cost implications. Water Res. X 2019, 2, 100015. [Google Scholar] [CrossRef]
  35. Gargiulo, A.; Carvalho, M.L.; Girardi, P. Life Cycle Assessment of Italian Electricity Scenarios to 2030. Energies 2020, 13, 3852. [Google Scholar] [CrossRef]
  36. Fotia, K.; Mehmeti, A.; Tsirogiannis, I.; Nanos, G.; Mamolos, A.; Malamos, N.; Barouchas, P.; Todorovic, M. LCA-Based Environmental Performance of Olive Cultivation in Northwestern Greece: From Rainfed to Irrigated through Conventional and Smart Crop Management Practices. Water 2021, 13, 1954. [Google Scholar] [CrossRef]
Figure 1. Location of the study area in the municipality Acquaviva delle Fonti (Apulia region), wastewater treatment plant (upper photo), and experimental site (lower photo).
Water 13 02242 g001
Figure 2. Framework for environmental and economic analysis adopted in this study (modified from ISO 14045:2012).
Water 13 02242 g002
Figure 3. Overview of the assessed water supply options.
Water 13 02242 g003
Figure 4. System boundary for life cycle performance of grape production systems.
Water 13 02242 g004
Figure 5. Results and contributions for different impact categories for conventional (CS) and integrated system (IS) per 1 ton of grapes with Monte Carlo standard deviations indicated with a black line. Reclamation impacts are integrated into irrigation process impacts.
Water 13 02242 g005
Figure 6. Total environmental impact as a single score at the process (a), indicator (b), and sub-system (c) level for 1 ton of table grapes with conventional (CS) and integrated (IS) system. Monte Carlo standard deviation results are indicated with a black line.
Water 13 02242 g006aWater 13 02242 g006b
Figure 7. Process production cost for 1 ton of table grape with conventional (CS) and integrated (IS) system.
Water 13 02242 g007
Figure 8. Two-dimensional eco-efficiency chart (Cost vs. Environmental impact) showing the relative positioning of 1-ton table grape production with conventional (groundwater) and integrated (groundwater + reclaimed water) irrigation. Zones: (I) Eco-efficient—both cost and environmental footprint are reduced, (II) Eco-Friendly—reducing environmental footprint but increasing cost, (III) Stay clear—both cost and environmental footprint are increased, (IV) Profiteering—cost reduction at the expense of an increase in environmental footprint.
Water 13 02242 g008
Figure 9. Two-dimensional eco-efficiency chart (TVA vs. environmental impact) showing the relative positioning of table grape production with the integrated system or IS (groundwater + reclaimed water) under different yield (Y) and market prices (P).
Water 13 02242 g009
Table 1. Key primary data for table grape production under conventional (groundwater) and integrated (groundwater + treated wastewater) irrigation.
Input/OutputUnitConventional System (CS)Integrated System (IS)
Crop yield ton/ha23.12 21.00
Water withdrawalsm3/ton136.80143.60
Water consumptionm3/ton68.3417.10
Irrigation energykWh/ton202.50161.00
N-based fertilizerskg/ton5.693.82
P-based fertilizerskg/ton3.033.10
K-based fertilizerskg/ton3.032.60
Pesticideskg/ton2.763.05
Diesel Fuel MJ/ton399.10439.30
Treatment systemunit/ha-1
Table 2. Normalization and weighting factors for environmental impact categories using the Environmental Footprint 3.0 method.
Impact CategoriesNormalization
Factor
Weighting
Factor
Acidification55.5560.062
Climate change8097.1660.2106
Ecotoxicity: freshwater42,680.3240.0192
Eutrophication: freshwater1.6070.028
Eutrophication: marine19.5470.0296
Eutrophication: terrestrial176.7410.0371
Human toxicity: cancer0.0000.0213
Human toxicity: non-cancer0.0000.0184
Ionising radiation4219.4090.0501
Land use819,672.1310.0794
Ozone depletion0.0540.0631
Particulate matter0.0010.0896
Photochemical ozone formation40.6010.0478
Resource use: fossils65,019.5060.0832
Resource use: minerals and metals0.0640.0755
Water use11,469.2050.0851
Table 3. Crop market prices and cost incurred per unit input.
InputsUnitValue
Crop market price€/kg0.70
Cost groundwater€/m30.62
Cost of reclaimed water€/m30.44
Biovegetal€/kg0.07
Ammonium sulfate€/kg0.36
Calcium nitrate€/kg0.25
Fuel€/kg1.00
Pesticides€/kg32.5
Table 4. Economic indicators of table grape farming with conventional (groundwater) and integrated (groundwater + reclaimed water) irrigation.
ParametersUnitConventional SystemIntegrated System
Gross production value€/ha16,18414,700
Variable cost€/ha70996870
Variable cost€/ton307.1328.7
Returns over operating costs (gross returns)€/ha11,2889962
Returns over operating costs (gross returns)€/ton488.2474.3
Total Value Added (TVA)€/ha90847830
Total Value Added (TVA)€/ton393371.3
Publisher’s Note: MDPI stays neutral with regard to jurisdictional claims in published maps and institutional affiliations.

