
Submerged Wall Instead of a Penstock Shutoff Valve—Alternative Protection as Part of a Refurbishment
by
 , and
, and
Roman Gabl
1,2,* ,
,
Markus Wippersberger
3,*, 
Jakob Seibl
2,4,
Christian Kröner
2,5 and
Bernhard Gems
2 1
FloWave Ocean Energy Research Facility, Institute for Energy Systems, School of Engineering, The University of Edinburgh, Max Born Crescent, Edinburgh EH9 3BF, UK
2
Unit of Hydraulic Engineering, University of Innsbruck, Technikerstraße 13, 6020 Innsbruck, Austria
3
ÖBB-Infrastruktur AG, Claudiastraße 2, 6020 Innsbruck, Austria
4
Liebherr-Werk Nenzing GmbH, Dr. Hans Liebherr Straße 1, 6710 Nenzing, Austria
5
Müller Schupfner & Partner IP-Legal Services, Bavariaring 11, 80336 München, Germany
*
Authors to whom correspondence should be addressed.
Water 2021, 13(16), 2247; https://doi.org/10.3390/w13162247
Submission received: 1 July 2021
/
Revised: 10 August 2021
/
Accepted: 13 August 2021
/
Published: 17 August 2021
(This article belongs to the Special Issue Advances and Challenges in Hydropower)
Abstract
:Hydropower is an important source of renewable energy. Due to ageing infrastructure, more and more existing hydropower plants have to be refurbished and modernised. This includes a complete review of the design parameters as well as the change of specific parts. Investments should be targeted to improve the overall performance of hydropower plants and ensure a long lasting life extension. This paper presents the concept of the submerged wall as a local high point in the headrace tunnel, which can—in combination with the intake gates—replace existing penstock shutoff valves. Such a replacement was conducted for the hydropower plant Schneiderau in Austria, which also allowed us to prove the concept based on measurements including a simulated break of the penstock. The presented solution can help to reduce investment costs and also minimise maintenance efforts and therefore is an attractive option for classic penstock shutoff valves for comparable projects.
1. Introduction
In 2019, hydropower generated 4.305 TWh of electrical energy worldwide according to the 2020 status report of the International Hydropower Association [1]. The reported 15.6 GW increase of installed capacity was achieved in 2019 due to projects mainly located in East Asia and Pacific and South America. Key topics in Europe are the expansion of the pumped storage capacity and the modernisation of existing hydropower plants (HPPs) [1]. The bigger variability of other renewable energy sources in the electrical grid can be compensated with hydropower (including pump storage), which needs flexible operation under constantly changing conditions. Those challenges can be met by improved control strategies, innovative solutions for the generator design, including variable speed due to power electronic converters, and the availability of a digital twin covering the complete system [2]. Rahi and Chandel [3] provide an excellent overview of the main areas of potential refurbishment of HPPs including a focus on the turbine and especially the runner, which has to withstand more changes in operation [4,5] and is a key part of achieving optimal electricity production.
Existing HPPs and their reservoirs face further significant challenges caused by climate change [6,7] and the incoming sediment [8,9,10]. Nature measurements of velocities in reservoirs [11,12] are a key part of improving the numerical models and find the ideal solutions of sediment management [13]. Strategies should target the reduction of the incoming amount of sediment and can include the installation of a sediment bypass tunnel [14]. In the worst case scenario, the adaptation of the intake structure is a temporary solution to maintain the HPP in operation [15,16,17]. Ongoing modernisation efforts also allow the reduction of the environmental impact of HPP, which also includes the development of new fish protection concepts [18,19,20]. Additional changes of the core hydraulic structures are also needed. An example of such a needed modification is the update of the throttle to ensure the functionality of the surge tank [21,22,23]. The prevention and risk reduction of potential disaster situations are also receiving more and more attention.
In addition to those general challenges, specific aspects have to be considered for high-head power plants, which include longer pressurised conduits. A headrace tunnel with a lower pressure rating can cover a longer horizontal distance between the upper reservoir and the turbines and is typically connected upstream of the penstock at the surge tank. The penstock is the part of the hydropower plant in which the geodetic height (potential energy) is reduced and the available pressure in the conduit increases. The peak pressure load is further increased due to water hammer effects caused by any change of the discharge. Increased numbers of changes in the operation of the HPP can lead to additional fatigue of the penstock [24,25] and under specific conditions can also lead to a failure of the penstock [26]. A specific risk is the corrosion of steel pipes [27] and the complexity of the complete system, especially for a penstock constructed through a dam [28]. The risk management includes a detailed design of the measurement instrumentation to detect a potential problem [29], as well as regular inspection and maintenance of all critical parts of the penstock [30]. New methods have a high potential to increase the speed and accuracy of inspection [31] and therewith help to reduce the costs without compromising the quality. In addition to regular maintenance, a reliable monitoring of the penstock is essential, especially for aboveground systems, which are less protected than underground pipes. Consequently, the installation of rupture valves or penstock shutoff valves (PSV) [32] is a vital part of the limitation of the potential risk caused by a catastrophic case.
In recent projects [33,34,35], a local high point was installed to separate the penstock from the headrace tunnel after closing the inlet gates at the upstream reservoirs instead of a PSV. Section 2.3 describes this concept in detail, which was adapted to be integrated in the refurbishment of an existing hydropower plant. The chosen methodological approach for the design of the adaptation is summarised in Section 2, which also highlights the uncertainties in the numerical modelling of such an extreme case. Section 3 presents the unique measurements conducted at the refurbished hydropower plant, which are used as a check for the numerical simulations as well as the overall concept of the local high point The observation also included a simulated break of the penstock, proving the functionality of the presented solution. Both parts, namely the numerical simulations and measurements at the hydrpopower plant, are discussed in Section 4. The methodological approach, as well as the principal solution, can be adapted for future projects and the found research gaps are a starting point for further work considering the more realistic modelling of penstock failures.
2. Materials and Methods
2.1. Overview
This paper can be split into two different parts: (a) methodological approach of the design process and (b) the results of the measurements proving the functionality of the implemented solution. In a first step, Section 2.2 introduces the hydro power plant (HPP) project specific boundary conditions. The concept of the submerged wall as a local high point is introduced in Section 2.3. A detailed overview of the different stages of the design process of the wall can be found in Section 2.4. Therefore, a combination of 1D- and 3D-numerical simulations were used. After the implementation of the wall in the HPP, a series of measurements were conducted to validate the numerical results (Section 2.5). The results of those unique nature measurements are summarised in Section 3 and discussed in Section 4.
2.2. Project-Related Background
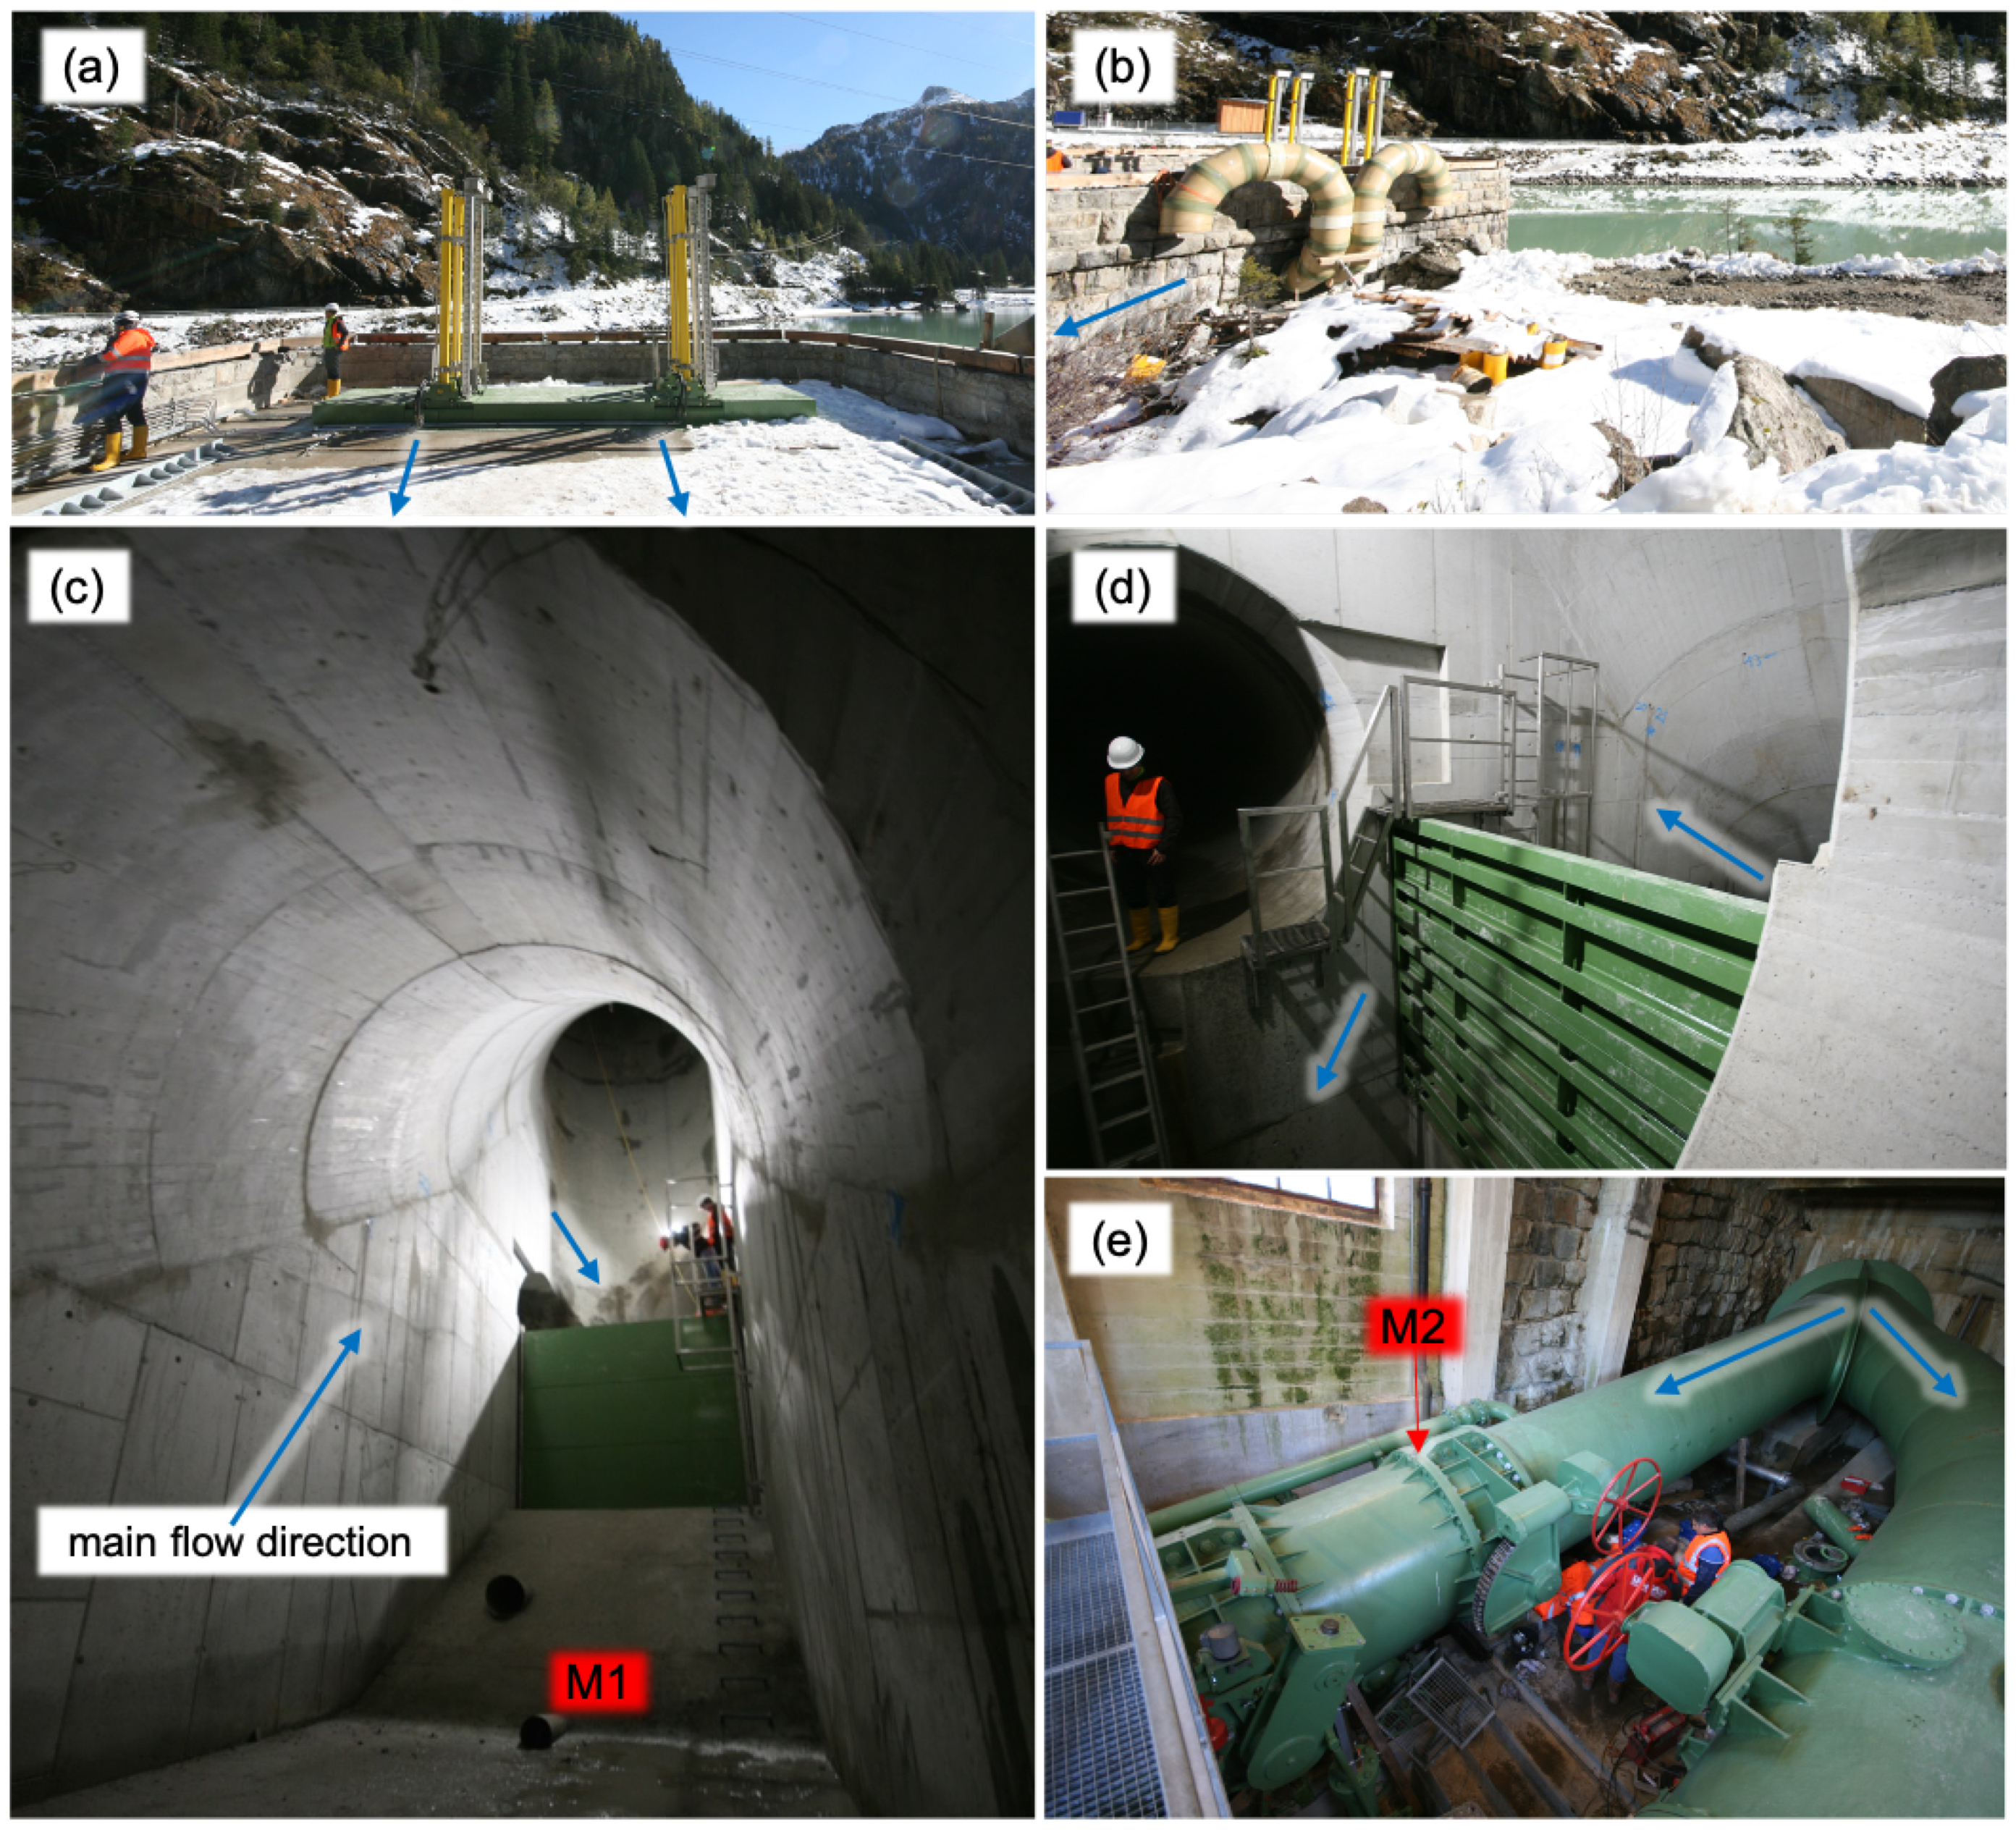
The hydropower plant (HPP) Schneiderau is part of the power plant group Stubachtal (Salzburg, Austria), owned by the Austrian Federal Railways (ÖBB). Originally built between 1936 and 1944, a second penstock was added in 1965. A total discharge of 10.8 m/s with a total gross head of 420 m powers four Pelton turbines. Both penstocks have an initial nominal diameter of 1.6 m, which is reduced to 1.2 m with increasing pressure level. The original concept allowed the separation of the two penstocks from the headrace tunnel based on rupture valves or penstock shutoff valves (PSV) [32]. For redundancy, two butterfly valves for each penstock were installed. They are located in a protected cavern in the main flow direction after the surge tank and upstream of the aboveground penstocks. Figure 1 provides an overview of the conducted modifications as part of the refurbishment in 2014.
The installed PSV has two main uses, which include (a) the reduction of water loss while maintaining of the penstock and (b) limiting the potential discharge due to a catastrophic event causing a damage at the penstock (emergency case). Closing the valves allows the emptying of and access to each penstock while keeping the headrace tunnel (diameter over 2.2 m and length of 1.5 km) flooded. Furthermore, the valves also close automatically in case a discharge is measured that is 20% bigger than the maximum operational discharge. This measurement is conducted independently close to the valves at the beginning of the penstock and could automatically trigger the valves. This advantage of this autonomous system also has its challenges. If damage to or a leakage of the penstock occurs when the HPP is not working or not all turbines are operating, the water loss is only detected after reaching the chosen threshold [36]. Consequently, this situation was improved as part of the modernisation of the HPP Schneiderau. Now, two independent measurements of the discharge on both sides of the penstock are available to calculate the discharge difference. Based on this concept, a maximum absolute and/or relative difference can be chosen to trigger the emergency response. The accuracy of those discharge measurements are typically 0.25% for laboratory applications [37] and is in the range of 1% for very big penstocks, like that of the Three Gorges Power Station with a penstock diameter of 12.4 m [38]. It also depends on the correct location and design of the instrumentation [39,40,41], which is critical for a correct measurement.
The full closing process of the PSV of the HPP Schneiderau was extended to 270 s, which ensured that the caused pressure wave and the needed air volume [42,43,44,45,46] do not exceed the capabilities of the hydraulic system. Those valves were safety-relevant and had to be maintained, moved and checked regularly by a specially trained group. The accessibility of the valves is challenging especially in the winter months due to the danger of avalanches on the access roads. All four valves were close to the end of their operational life and would have to be replaced in the short to medium-term. Those circumstances started the planning process to find an alternative solution, which was found with the installation of the submerged wall in the surge tank (Section 2.3). Comparable installation can be found in hydraulic systems to ensure that pressurised pipes keep filled under all steady circumstances [47]. The project was realised in 2014 and has been successfully in use since then. Detailed aspects of the concept were further investigated both numerically and experimentally [48,49,50]. The presented project triggered an ongoing research interest in the refurbishment of existing hydraulic infrastructure as well as catastrophic cases, which have to be included in the design process and the evaluation of HPP.
2.3. Concept of the Submerged Wall
Aboveground penstocks are more commonly used as part of older hydropower plants (HPPs). Current projects mainly use a complete underground system, which—in addition to other advantages—fully protect the steel liner of the penstock. In the case of such a new HPP, those additional valves, which are located at the connection point of headrace tunnel and the penstock, help to reduce the water loss for maintenance tasks.
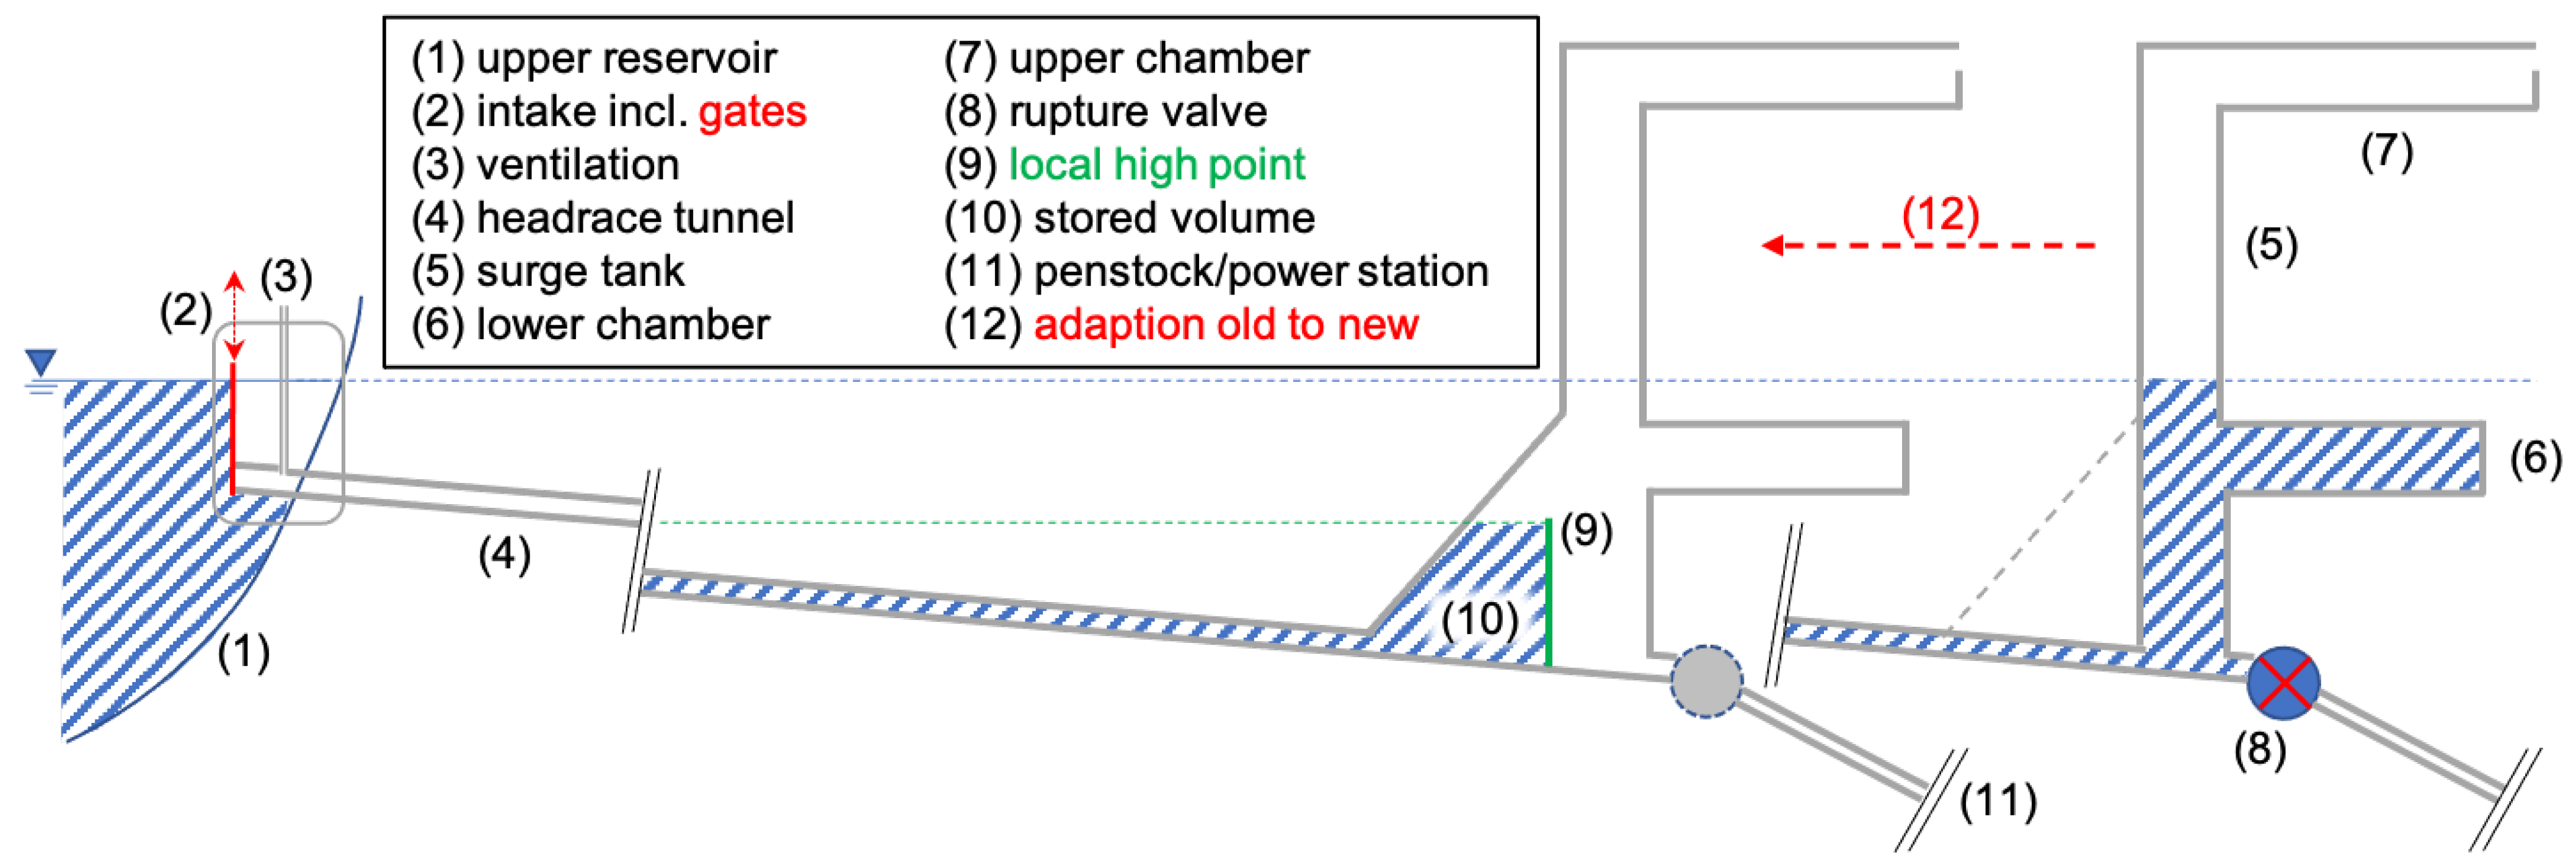
The recently built new pump storage hydropower plants, Limberg II and Reißeck II (both Austria), can achieve such a separation without a mechanical valve by including a local high point close to the surge tank. This change in the slope of the headrace tunnel was integrated in the lower chamber of the surge tank, which is an expanded cross section of the headrace tunnel [33,34,35]. The maximum direction change of the tunnel boring machine was, in this case, the limitation and allowed an integration with very small losses of the available gross head. Under normal operation conditions, this section is fully filled and the water flows over the local high point. After closing the intake gates, the water upstream of the local high point levels out and allows it to be stored there while emptying the penstock. As shown in Figure 2, the presented concept with the submerged wall utilises the same fundamental concept but reduces the needed change in the hydraulic structure to adapt existing water ways. The downside is increased losses, which have to be compared with a significant reduction of the investment cost as well as the construction time. Such a solution is obviously more likely to be chosen for existing HPPs.
Figure 2 provides a sketch comparing the original concept with the new approach and summarises the main components of the hydraulic system. The PSV is the main component in the original system (Figure 1c). The valves close automatically, as well as the intake gates, after the detection of potential damage. This proceeding separates the upstream reservoir and holds back the water upstream of the PSV. The new protection concept does not need the PSV and mainly uses the intake gates. Those two replaced gates located at the upper reservoir close to 100 s after triggering an emergency proceeding (Figure 1a). The closing time is a result of an optimisation process considering the limitation of the gate as well as the needed ventilation behind the gate, which required additional pipes (Figure 1b). Similar to the previous concept, the upper reservoir is separated from the downstream hydraulic structure. The water level in the headrace tunnel decreases down to the top of the newly included wall (Figure 1d,e), which allows storage of the water volume independently of what happens with the penstock. A bypass pipe provides the opportunity to fill the penstock slowly, which is also used for the presented measurements in Section 3. This can only be done with personnel on-site, which is deliberate, ensuring that the complete downstream waterway has been checked previously. The advantages and disadvantages of the concept are further discussed in Section 4.
2.4. Design Process Based on Numerical Simulations
The first aim of this paper is to provide an overview of the methodological approach to achieving the final geometry that was implemented. Figure 3 visualises the different steps from the initial feasibility study to the final measurements after the refurbishment of the HPP. Two different numerical approaches were used: 1D-numerical simulations covering big parts of the hydraulic system and local refinements with 3D-numerical simulations.
The starting point of the project was a feasibility study conducted mainly with the 1D-numerical software WANDA [51,52,53]. This commercial product has the capability of combining pressurised pipes as well as free surface flow inside a conduit. Consequently, the software is capable of covering the original system as well as the new approach with the wall. The main findings of the 1D-numerical simulations were:
- The needed height of the wall is close to 6 m (Figure 4), which allows us to achieve a similar total outflow volume at the modelled break outflow condition to that under the original version with the PSV;
- The water level behind the wall remained very close to the top of the wall;
- The closing time of the intake gate at the inlet of the upper reservoir could be optimised and the needed ventilation estimated;
- The adaptation does not have a negative influence on the surge tank oscillation;
- No new operational limitations had to be introduced and it could be ensured that, even in the case of a low water level in the upper reservoir, enough water flows over the wall.
For the design of the needed height of the wall, a worst case scenario was assumed by removing both penstocks at the same time at the first anchor block after the surge tank. Kröner et al. [36] investigated the influence of the location of the damage based on a generalised HPP with a single penstock. Therefore, three different options, namely at the top, middle and bottom of the penstock, were compared. A location closer to the turbine and with a lower geodetic height results in an increasing available pressure at the break. The potential acceleration of the flow in the penstock due to the damage is larger. Consequently, the initially chosen approach potentially underestimated the flow. In reality, occurring cavitation will limit the total discharge [54,55,56]. The initial 1D-numerical simulations deliberately ignored the potential reduction to be on the safe side and focused on the relative comparison between both systems, namely the original PSV and the new concept based on the submerged wall. WANDA includes a cavitation model and in Kröner et al. [36], a specific model adaptation was presented, which allows the control of the outlet pressure at the modelled damage so that no cavitation occurs in the system. This will only allow an expanded simplification and there is a big potential for further research to improve such simulations of extreme cases.
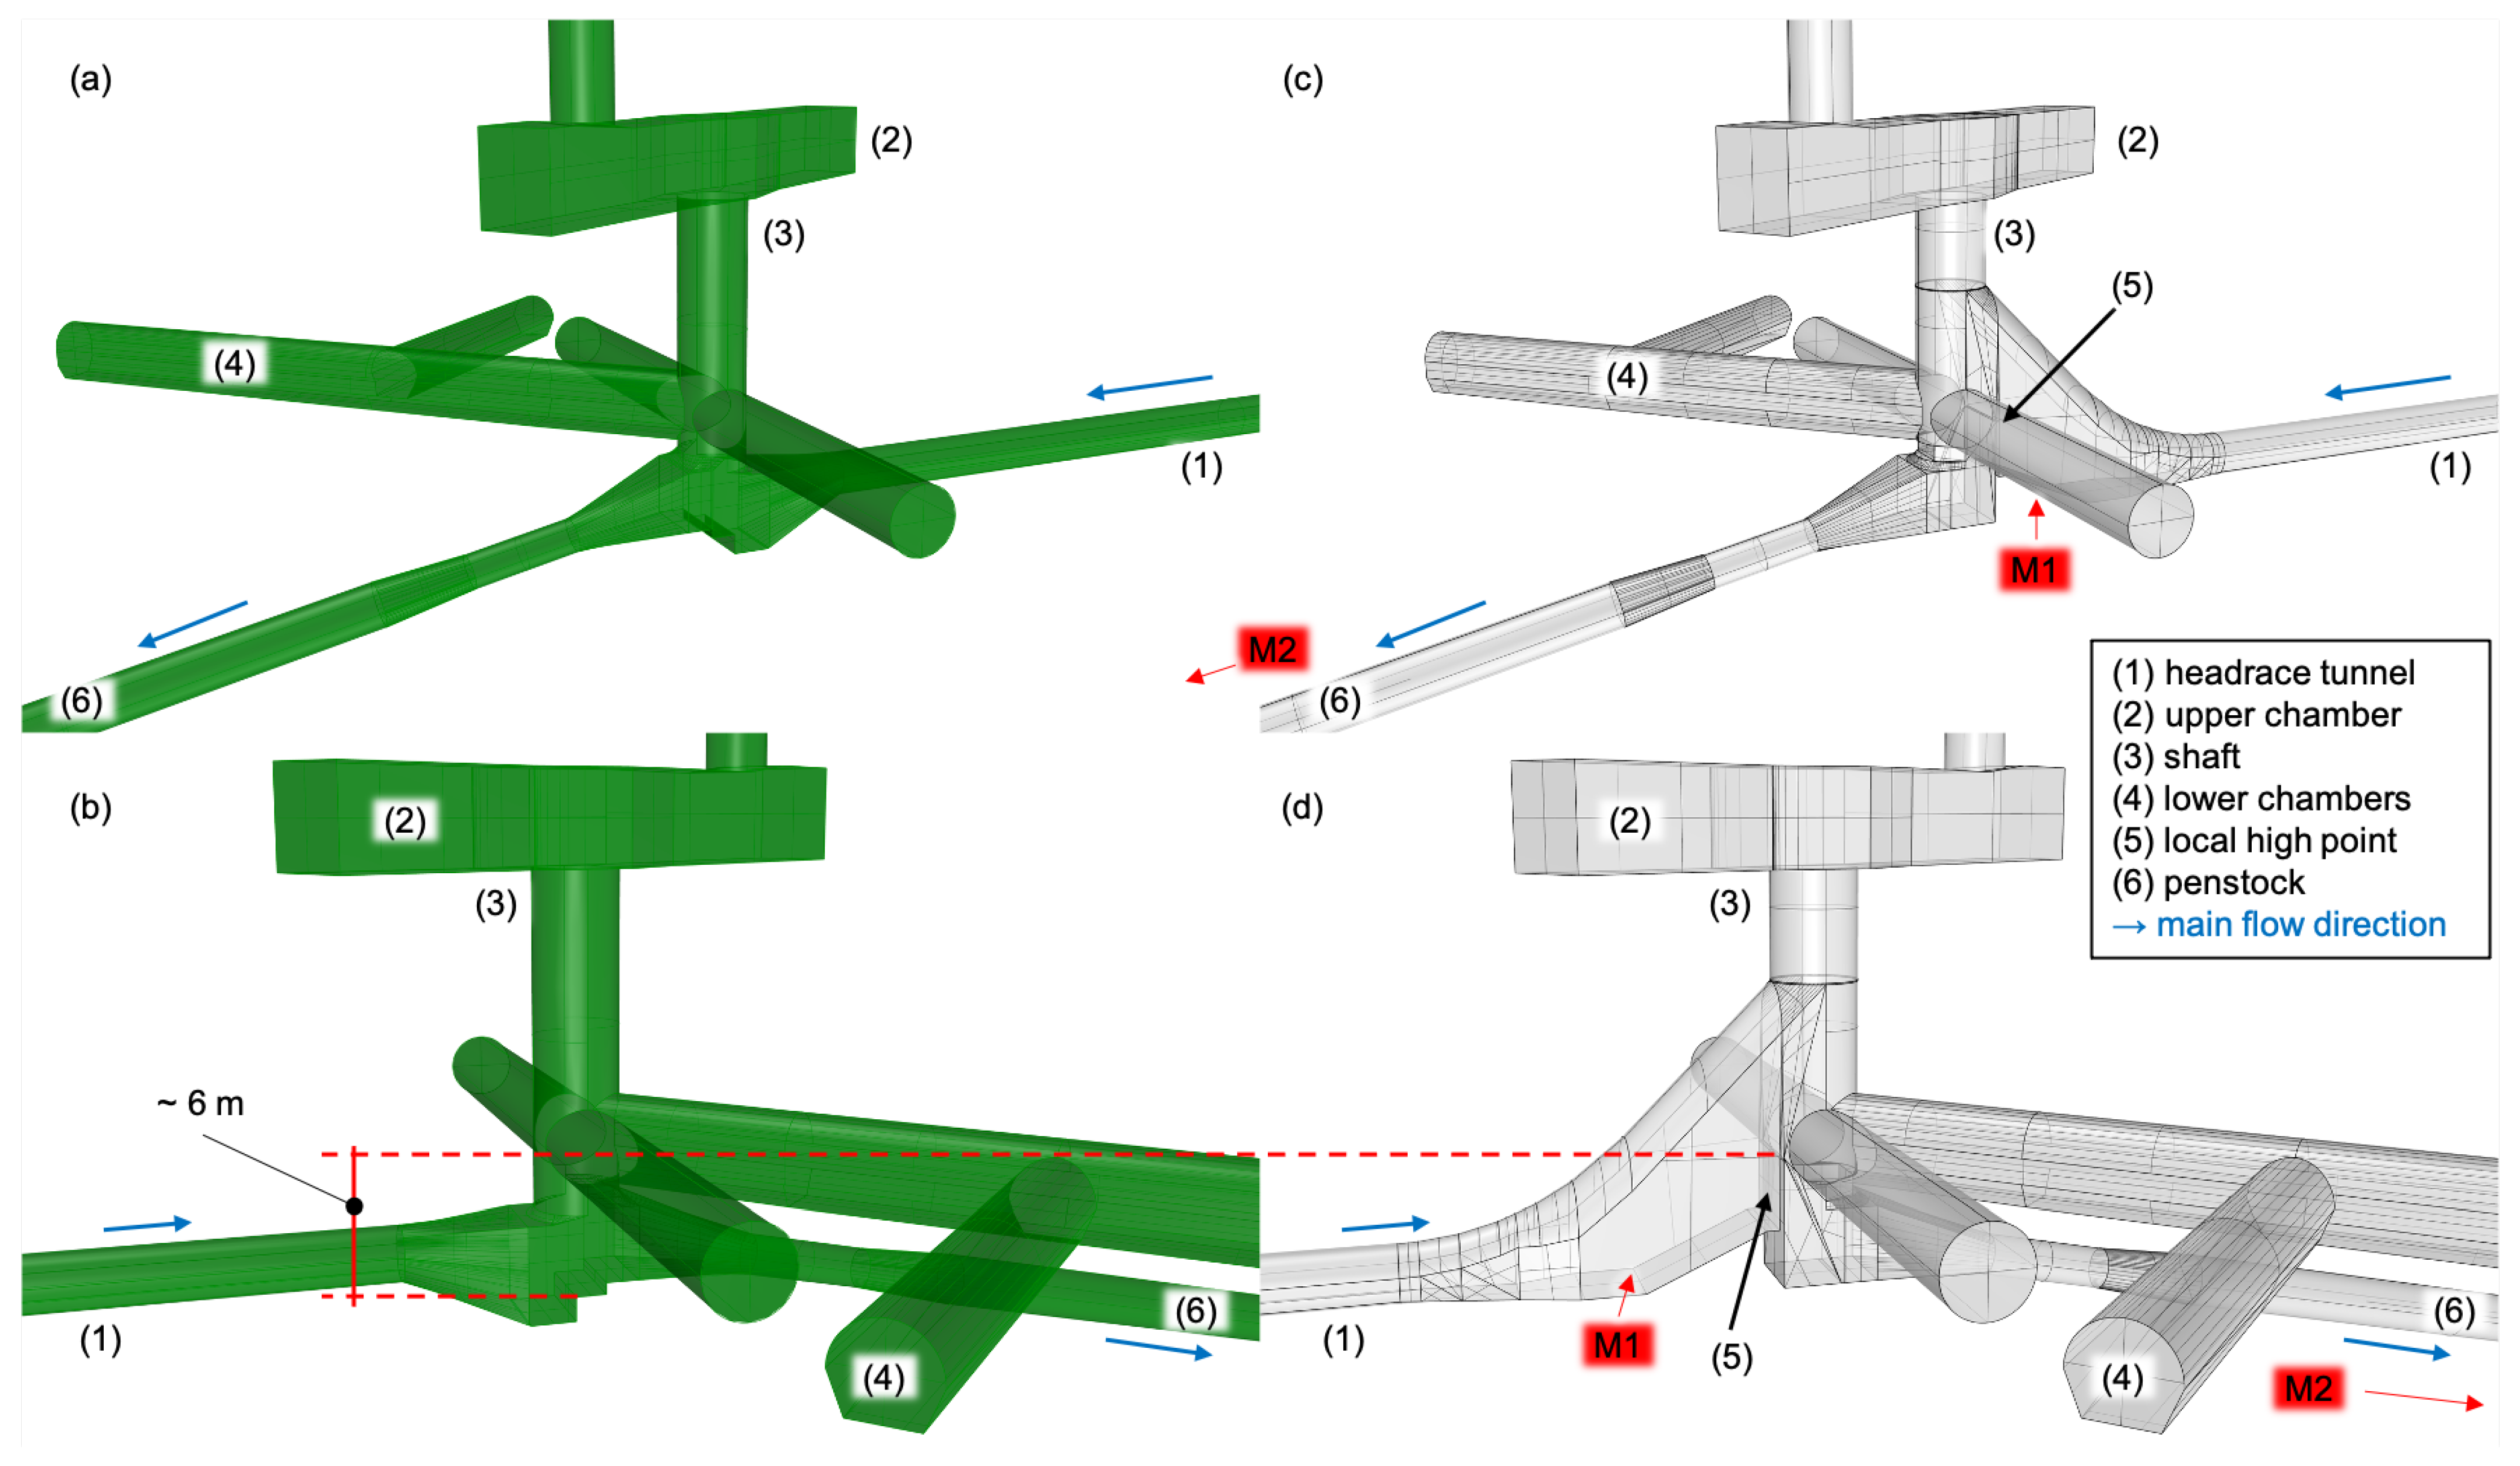
The 1D-numerical simulation indicated that the water level behind the wall remained very precisely at the height of the top of the wall. This was later also shown in a simplified experimental set-up as part of the dissertation of Seibl [48] and an initial version was presented in Seibl et al. [50]. Furthermore, the wall limits the potential increase of flow speed in the headrace tunnel due to a massive leak, hence the water always has to flow over the wall and the headrace tunnel stays filled. A variation of the closing speed of the intake gate was conducted based on the numerical simulation to find that the improvements after a certain value was not significant anymore. The chosen 100 s are a compromise of speed and implementation at the intake of the HPP Schneiderau. Two additional pipelines were installed to provide enough ventilation behind the gates (Figure 1b). The optimisation process focused on the global system using the initial 1D-numerical simulations, which also included a detailed investigation of the flow around the additional submerged wall. This was done with the help of 3D-numerical simulations with the software ANSYS-CFX. The main aim for this optimisation was to reduce the needed additional excavation as well as the additional local head loss due to the change. Therefore, the original geometry, including all the (lower) chambers, was simulated to quantify the original losses, which occurred due the the connection of the surge tank and the sand traps. Different concepts were investigated to change the shape of the additional excavation or the potential inclusion of structures to guide the water. It could be shown that a vertical wall is a comparably good solution but it has to be ensured that enough space is around it and that a further expansion has no influence on the total head loss. The split of the removable wall section and a concrete wedge were introduced based on static reasons, to guide the water better over the wall and also to allow improvement of the accessibility of the headrace tunnel for future maintenance work. Each segment was light enough so that it could be removed and so that nothing obstructed the access of the headrace tunnel through the lower chamber of the surge tank. The 3D-numerical simulation presented in Section 3.3 was conducted after the project’s end and the original geometry was compared with the final version of the wall to provide an insight into the change of the flow conditions caused by this change.
2.5. Measurement
The conducted refurbishing work included a new intake trash rack made of stainless steel, reinforcements in the headrace tunnel and the installation of the wall. It was decided that the existing, and now no longer needed, four PSVs (two for each penstock) would stay there and not be replaced with pipe segments. As part of future refurbishment of the penstock, the additional losses caused by the PSVs could be reclaimed for the production by replacing the PSVs with pipe segments. After the completion of the work, the HPP Schneiderau was made available for specific measurements to investigate the new concept. Therefore, the normal measurement system parameters of the HPP were used, as well as two additional pressure measurements recorded. The accessibility of the site for an installation of measurement was limited but, nevertheless, two very interesting measurement points and could be monitored. A specific label indicates the location in Figure 1c,d. At both locations, a WIKA relative pressure sensor Model CPT2500 was installed. Both identical instruments were connected with a USB adapter and were configured to adjust the measuring range to expected measurement values. This kept the measurement accuracy smaller than 0.2 % of the chosen measuring range [57]. The instruments recorded the pressure values with a frequency of 10 Hz.
The first point represents a location upstream of the newly included submerged wall by probing the bypass, which allows the slow filling of the penstock. This measurement point was also observed during the first flooding of the headrace tunnel after the modification. During this slow process, the overtopping of the wall with the top edge at a height of 1453 m (above sea level) could be clearly identified and referenced with a pressure of 1.53 bar at point . For the second measurement point , an existing measurement point at the penstock shutoff valve was used. This one represents the section downstream of the surge tank.
3. Results
3.1. Overview
The presentation of the results is split into four sections. A zero measurement provided an initial levelling of all pressure measurements and the integration of the temporally added instruments (Section 3.2). Those added measurement points allow us to assess the local loss under steady conditions, which was used as an input for the 3D-numerical simulation conducted for the final geometry. Section 3.3 presents the detailed investigation and Section 3.4 focuses on the comparison of the measured pressure at the surge tank with the 1D-numerical simulation. The core part was the simulation of the break by closing the intake gates under flow conditions and capturing the changes of the pressure at both measurement points. The results of this simulated break are presented in Section 3.5.
3.2. Zero Measurement
At the beginning of the measurement campaign, a zero measurement was conducted, which allowed us to reference the additional pressure transducer at and with the pressure measurement close to the turbines as well as the water level in the upper reservoir. Therefore, all turbines were stopped and the remaining mass oscillation had to be averaged out. An approximately 15 min long measurement series was cut out and used for the evaluation. Measured pressure values in [bar] are converted to [m] based on Equation (1) assuming a constant gravity acceleration g of 9.81 [m/s] and water density of 998 [kg/m] as well as a constant vertical offset [m] specific for each instrument.
The results of those steady state measurements are summarised in Table 1. A very similar difference between the minimum and maximum of the pressure measurement could be observed by the pressure transducer at the two points and (0.03 bar = 31 cm) and a bigger one for the permanent installed pressure transducer at the bottom of both penstocks close to the turbines ( and ; 0.08 bar = 82 cm). The recorded water level (WL) in the upper reservoir varies in the range of 12 cm (maximum minus minimum), which can be caused by the measurement accuracy of the recording and more likely by small waves in the reservoir. The measured values at the bottom of the penstocks clearly overestimate the water level but it has to be set in relation to the accuracy of the instrument of, typically, 0.5% of the maximum measurement span. Both instruments cover up to 80 bar, which results in a typical accuracy of 4.1 m. A correction of a constant offset would be possible results of the conducted measurement but these points are not critical for the presented investigation. An important finding was that the relation for with 1.53 bar representing 1453 m (height of the top of the installed wall) from the initial filling could be reproduced with an acceptable reference (difference is smaller than the observed variation over the time period of the zero measurement). Furthermore, the decision was made to use the calculated height of to calculate for , which is the measurement point downstream of the wall. In this context, it has to be highlighted that both measurement transducers were installed close to each other but due to the available attachment points, was located significantly lower than .
3.3. Local Head Losses
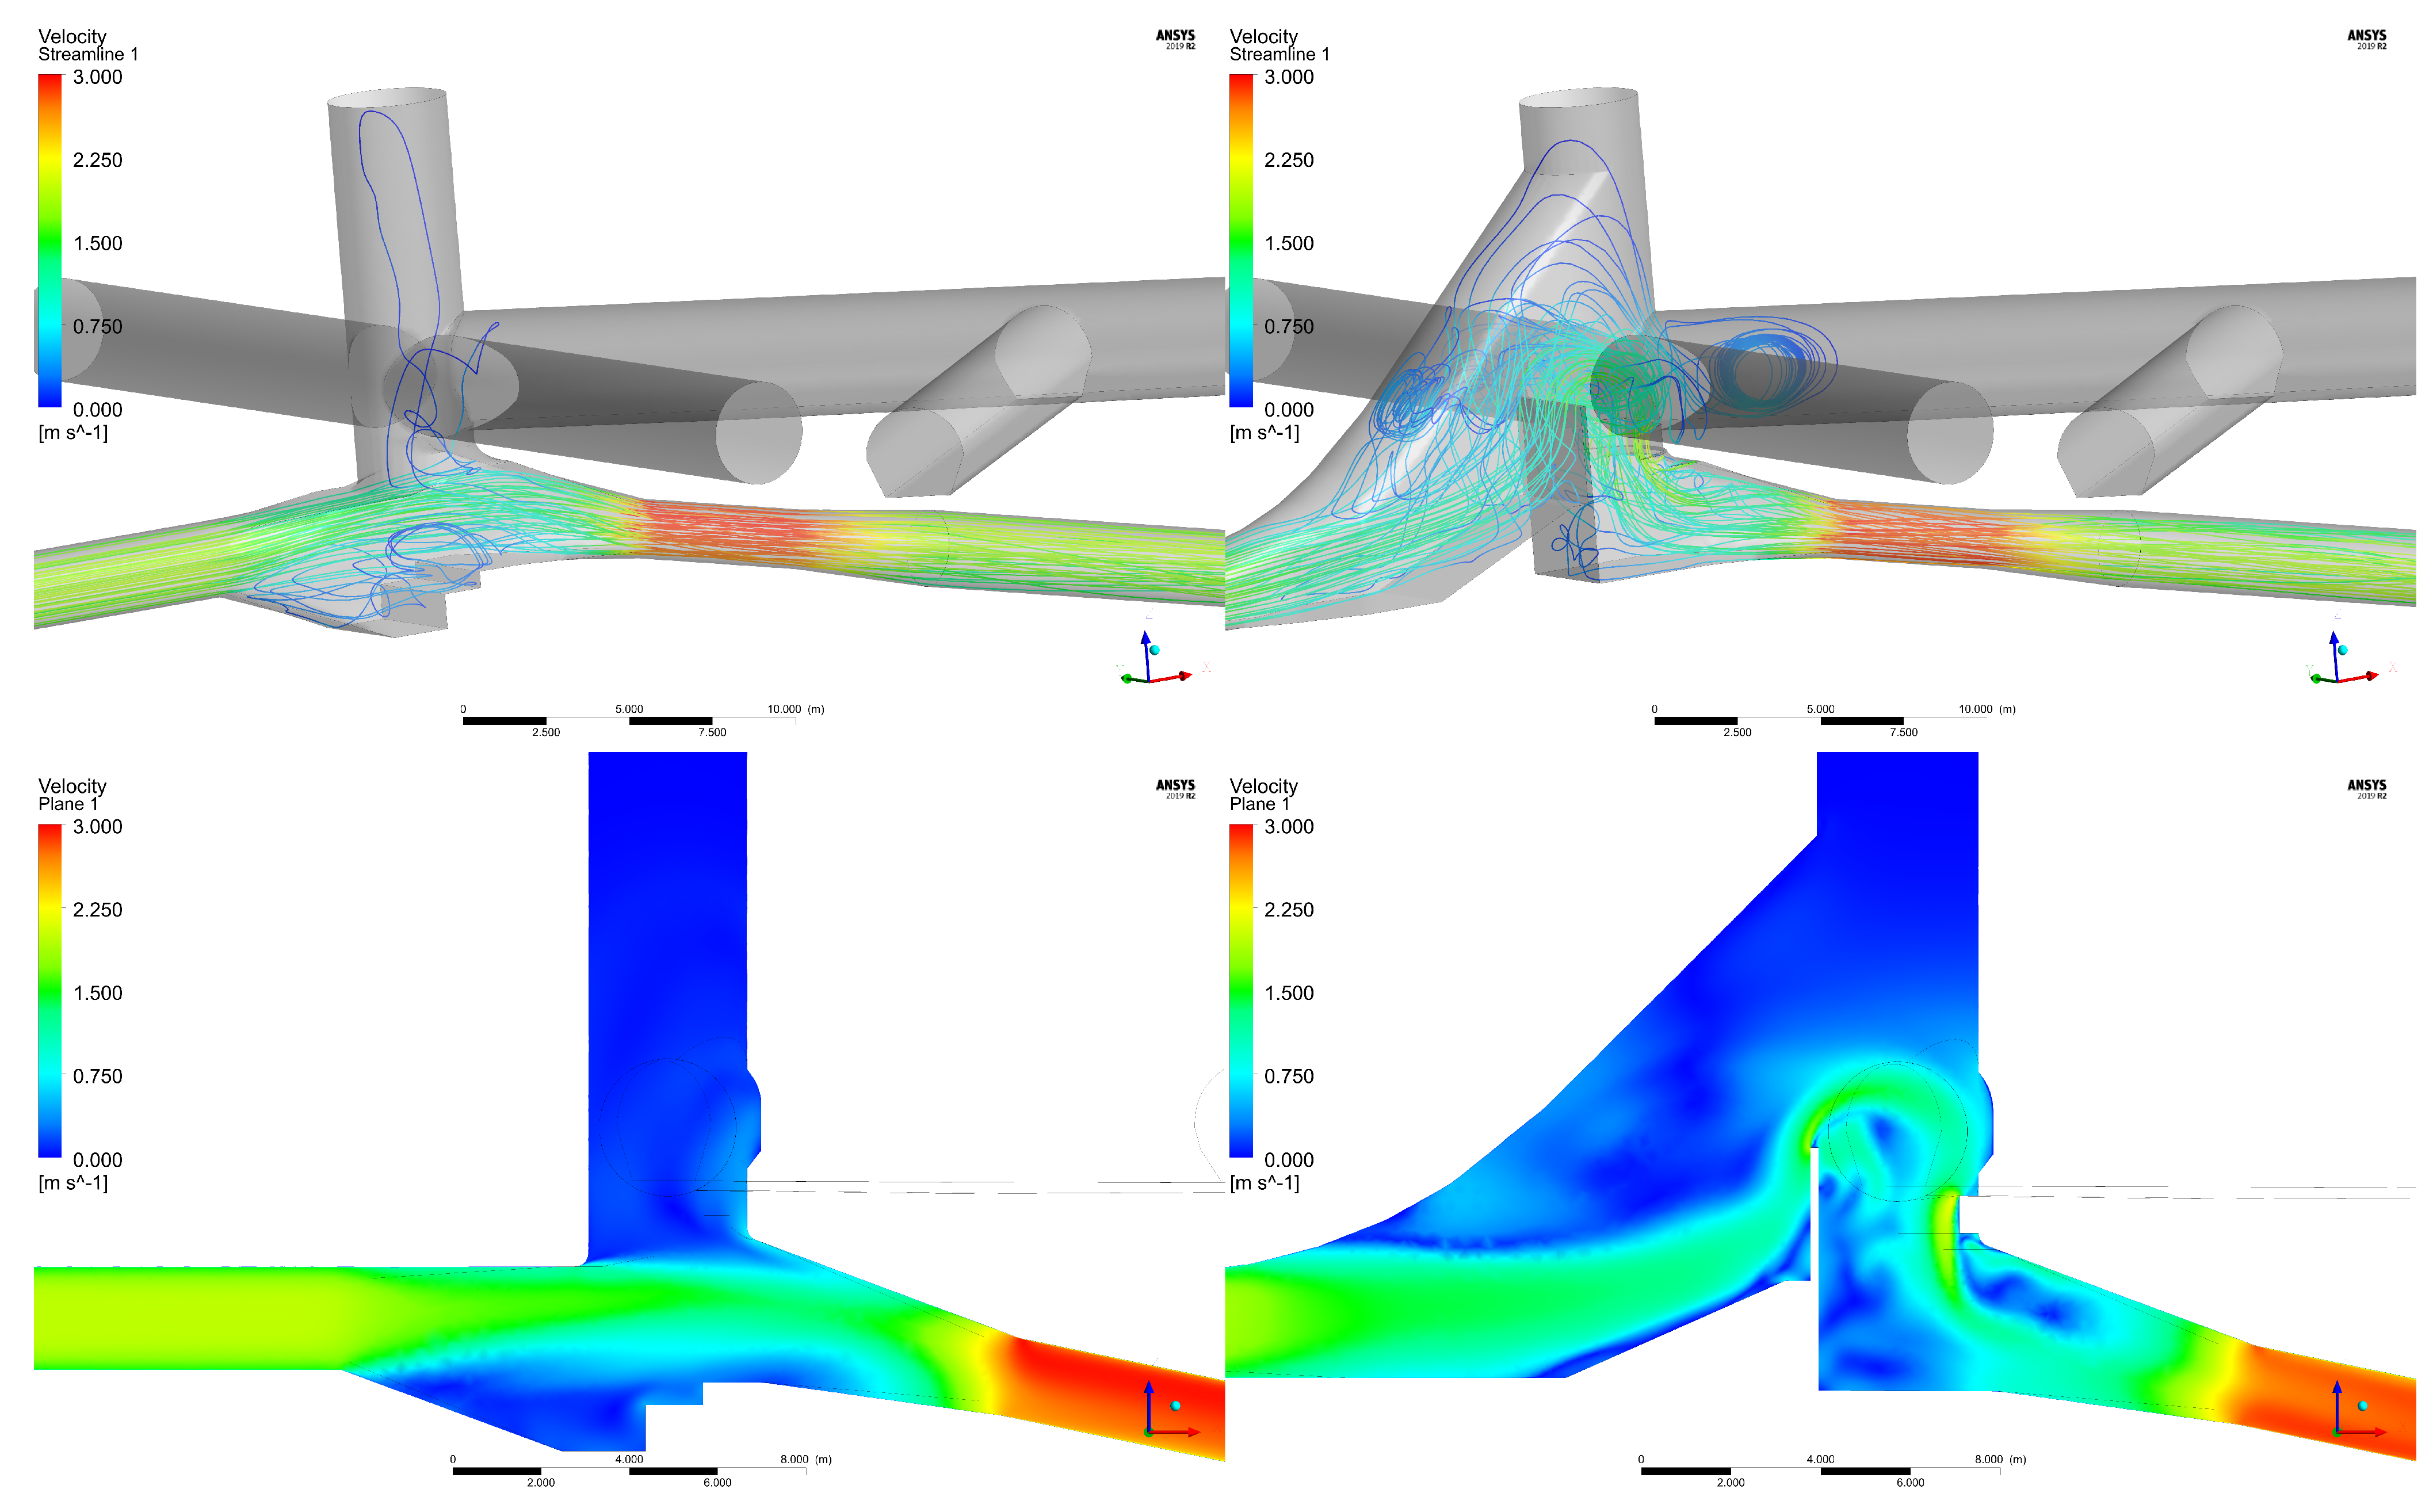
The detailed implementation of the submerged wall was investigated and optimised based on 3D-numerical simulations with the software ANSYS-CFX. This supporting simulation allowed an improvement of the 1D-numerical approach of the whole system and included various geometry variations but also an extensive verification process (test of the chosen boundary conditions, mesh independence, two phase flow). In this paper, only the comparison between the original geometry and the final realised version is presented in Figure 5.
For those simulations, the discharge at the inlet was fixed with the observed 7.079 m/s of the measurement and a constant static pressure at the outlet of 2.5 bar—which ensures that the whole fluid domain is pressurised—was set. As part of the verification process, a full two phase model with a free surface in the surge tank was simulated and compared to a single phase simulation with a boundary condition replacing the free surface. The water level in the surge tank is, in all operation cases, far enough away from the investigated geometry changes to have no significant influence on the result. Therefore, a free slip boundary condition was used to limit the shaft of the surge tank at the height of the free surface (Figure 5). The fluid domain was meshed with a maximum size of 0.5 m for the chambers and 0.12 m for the conduits and included a further refinement around the wall of 0.07 m. Furthermore, an inflation layer with a first layer height of 0.005 mm, 20 layers in total and a growth rate of 1.5 was defined to ensure an acceptable -value close to 1 [-] for all walls. Those settings resulted in a total number of elements in the range of 4.5 Million. The RANS model used the SST turbulence model, which is well validated and includes both the k- and k- models with a blending factor. Both geometries could be simulated with the stationary solver; nevertheless, the flow over the wall edge showed a higher transient variation of the velocity distribution. This had no significant influence on the evaluation of the local head loss.
The numerical simulation could be validated in general for a similar but simplified geometry with a laboratory experiment [48,49] based on a range of different cross sections and differential pressure measurements averaged over the full cross section. For nature measurements, the accessibility is very often a limiting factor and the probing of the upstream section with the bypass is not ideal, hence the velocity component cannot be fully quantified. The measured pressure difference between the measurement points and was 50.5 cm for the constant discharge of 7.079 m/s with a variation of 20 cm for and 30 cm for . Placing pressure evaluation points in the specific location of the numerical model resulted in a pressure difference of close to 30 cm. This does not represent the actual loss of the structure, which has to be based on a full cross section, which is conducted in the next step. Nevertheless, the measurements at least allow us to prove that the numerical simulation is in a good range. An inclusion of the bypass and the location of the pressure transducer at the instrument location would have brought an improvement as well as the usage of an additional differential pressure measurement with higher accuracy. Both will be included in comparable future measurements.
A local coordinate system is used with the z-axis aligned with the centre of the circular shaft of the surge tank and the x-axis pointing in the main flow direction for normal operating conditions. The upstream cross section for the calculation of the local head loss height was chosen 30 m upstream of the origin of the local coordinate system in the headrace tunnel and was fixed for all further comparisons. Different evaluation cross sections for the downstream cross section were investigated and are presented in Table 2. This table also includes the local head loss coefficient , which is calculated based on the reference cross section at the headrace tunnel (HRT) upstream of the wall. A cross section downstream of the local loss is typically chosen [37,58]. In this particular case, the area downstream includes a big variation of the cross sections and a better comparability can be achieved with this constant inlet section. Table 2 includes the kinetic energy flux coefficient , which provides an evaluation of the velocity distribution of the actual flow in the form of real kinetic energy divided by the theoretical kinetic energy [59]. Each cross section is oriented vertically and defined by a single distance from the origin of the local coordinate system and the shapes are identical for the investigated cases. At equal 2 m, the cross section is close to rectangular and changes to a round shape at equal 7 m. The higher value for the original geometry is caused by the concentrated flow coming from the upstream headrace tunnel. The expansion of the surge tank does not have a significant effect on the flow, and the velocities in the lower chambers are very small. A slight increase of the speed could be found for the adapted geometry, but only in the front facing lower chamber. All values after the reduction are very similar and close to perfect flow conditions, which are caused by the continuous increase of the velocity up to the penstock throttle. This part ends at approximately equal 18 m and a further cross section at equal 30 m was added to show that the difference of the local head loss between the two investigated options is consistently slightly bigger than 12 cm (representing an increased local head loss coefficient in the range of approximately 0.76; Table 2). This value was accepted especially since the new geometry included a sharp flow direction change over the wall (Figure 5). Removing the PSV and replacing them with a pipe segment could help to compensate for the added local head loss due to the submerged structure.
3.4. Surge Tank Oscillation
The conducted measurement program included different transient cases with a variation of closing times. Figure 6 shows the measurement of a time series, including the start of the turbines, in 60 s, and a constant operation with 7.079 m/s followed by a shut-down of all turbines simultaneously in 20 s. The initial conditions were not ideal hence the previous oscillation was still in the range of ±2 m. Nevertheless, this test was chosen to be presented in this paper as it was conducted with the shortest closing time and resulted in the maximum observed oscillation in the surge tank.
It was assumed that the measurement point represents the pressure in the surge tank. This could be shown by comparing with (upstream and downstream of the new wall/surge tank). Both locations provided very similar pressure values after the stop of the turbines. The water level change in the surge tank is, after the closing of the turbines, mainly dominated by the mass oscillation between the upstream reservoir and the surge tank. In relation to , showed a far higher pressure variation, which was still caused by the water hammer/pressure wave in the penstock. The measurement frequency was not high enough to fully capture this effect and resulted in a very noisy signal. Based on this, was not included in the presented Figure 6, which is focused on the comparison of the 1D-numerical simulation with the measurement.
The newly built wall structure was simplified in the 1D-numerical simulation as an additional throttle upstream of the connection of the surge tank. Separate 3D-numerical simulations were conducted to quantify the local head loss coefficient. The aim of the comparison with the measurements was to validate this assumption as well as the used roughness for the headrace tunnel. The latter is a critical value for the overall simulation and it is known that the roughness of the unlined tunnel can vary significantly [60,61]. All initial 1D-numerical simulations are based on a roughness of 6.5 mm in the headrace tunnel. These values were chosen based on previous measurements with the original geometry. With the installation of the submerged wall, significant efforts were made to improve the worst section of the tunnel and consequently a substantial reduction of the representative roughness could be achieved. The measured pressure at the surge tank and 1D-numerical simulation with the reduced roughness agreed very well as shown in Figure 6. Furthermore, it could be shown that the installation of the wall, as well as the improvement of the roughness, does not have a significant negative effect on the surge tank oscillation. The main finding was the successful validation of the 1D-numerical model.
3.5. Field Measurements during Simulated Break
The aim of the last part of the measurement program was to simulate a break of the penstock as accurately as possible without endangering the HPP. Different options were discussed, which included overlaying a mass oscillation with different changes of the turbine discharges. This requires very precise timing, which potentially could not be achieved. Hence the complexity was reduced, which led to the following proceeding: The HPP was running at a constant discharge of about 4 m/s to ensure that stable conditions were reached. This discharge was maintained while triggering a closing of the two intake gates similar to the reaction of a detected leakage. Therewith, the headrace tunnel was disconnected from the upstream reservoir.
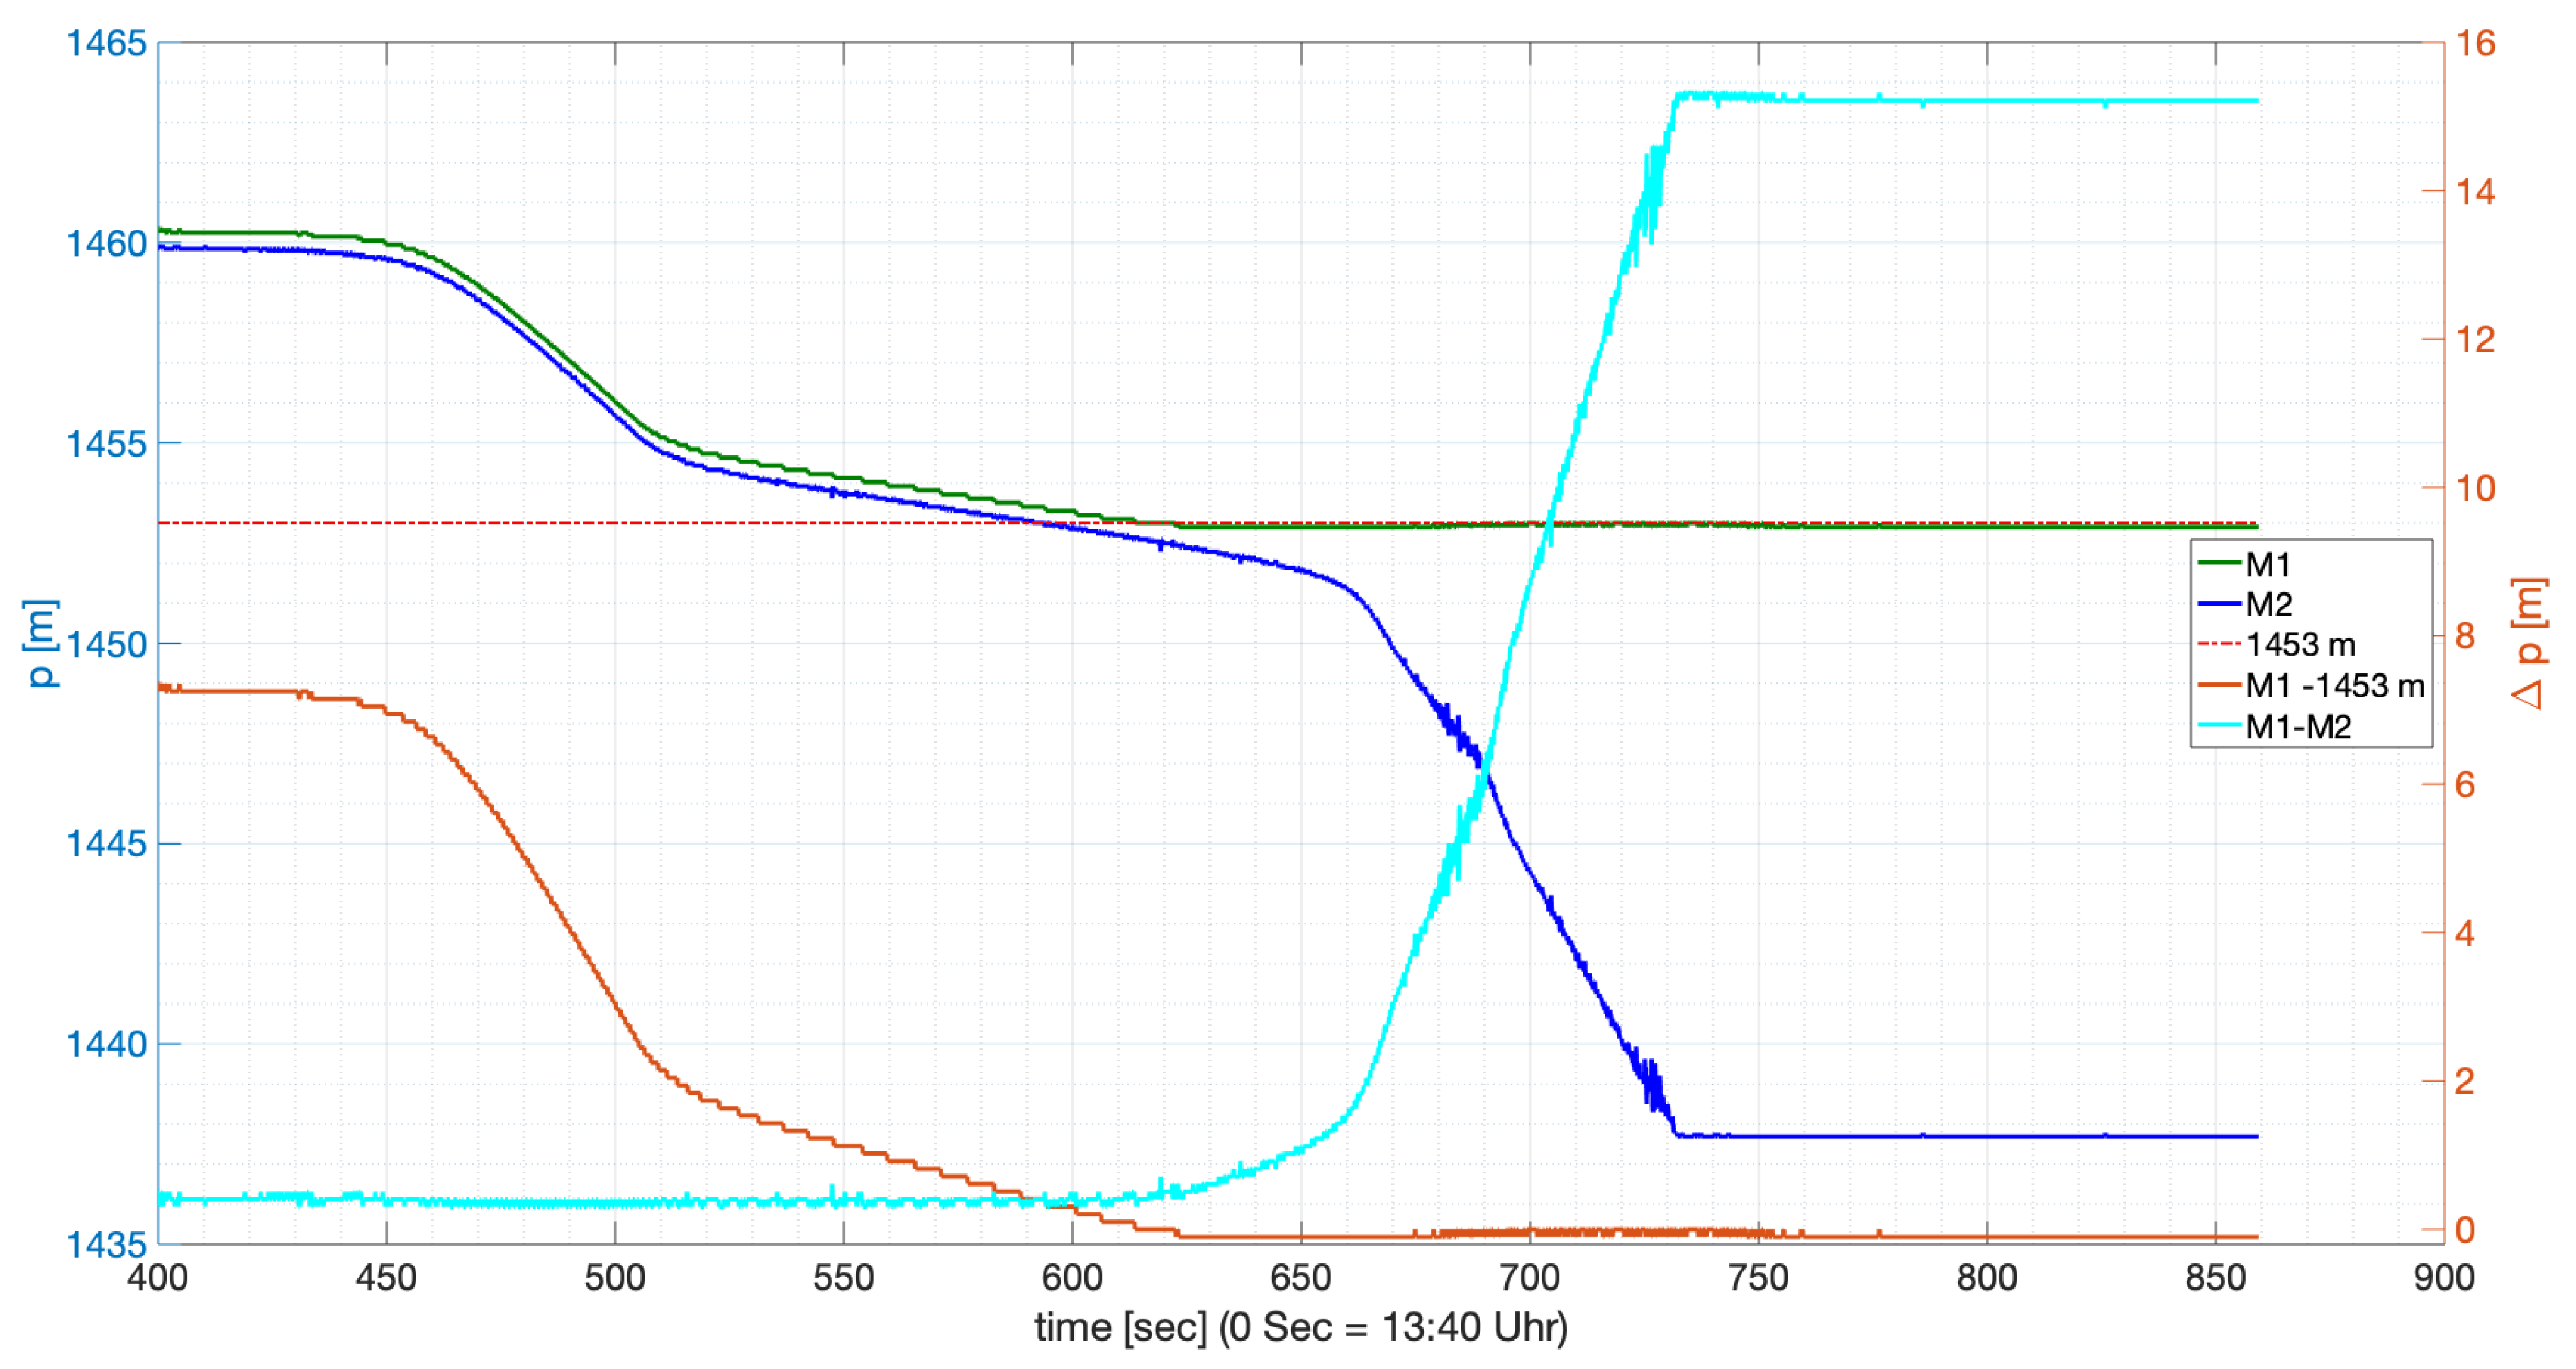
Figure 7 shows the pressures at the two points, , upstream of, and , downstream of, the wall. The water level in the surge tank is approximately 7.5 m higher than the top edge of the newly installed wall at 1453 m. Due to the constant discharge, the offset between the two measurement points stays the same with the falling water level, hence they are caused by the local loss and velocity difference. This went on until the water level reached the height of the top edge of the inserted wall. The value stayed there with a difference of approximately 10 cm shown by the difference -1453 m graph in Figure 7, which is an excellent result in relation to the accuracy of the instrument. Pressure at further decreased down to 0 bar. The ventilation of both penstocks could be clearly heard and felt at the location of the measurements close to downstream of the surge tank. At this point, the discharge through the turbines was stopped to reduce the water loss as well as the time needed to fill the system again. There was sadly no time to access the surge tank to check the water level behind the wall, because the HPP had to be brought back into operation as soon as possible. Nevertheless, the simulation of a break of the penstock showed the expected results and proved the concept of the submerged wall.
4. Discussion
The discussion part focuses first on the general concept of the submerged wall as a replacement for a penstock shutoff valve (PSV). In a second step, the lessons learned are summarised for the conducted measurement campaign at the HPP Schneiderau.
The concept of the submerged wall instead of a PSV is presented in Section 2.3. Such an additional structure increases the local head loss under operating conditions, which could be compensated for by replacing the two valves with pipe segments (Section Figure 5). In the specific case, the investment of four or at least two new PSV had to be assessed against the construction costs of the wall, as well as the significant reduction of the maintenance costs. Such economic considerations are very project specific and depend on the costs of the investment as well as on the future operation mode. Hence, such a consideration cannot be generalised and has to be decided case by case.
An obvious additional disadvantage of this system can be found in the case of small damages of the penstocks. After the detection, the intake gates close but the complete water volume, which cannot be held back by the wall, has to flow downstream. The PSV would close while the surge tank is not emptied and holds back more water. Nevertheless, in such a case most of the water can be bypassed safely through the turbines. Based on this, a small leak triggering a massive failure of the penstock can hopefully be prevented. Nevertheless, the new concept brings significant advantages based on a global risk analysis. The individual risk for the personnel, who have to maintain the PSV even in the winter months, is significantly reduced, as only the inlet gate has to be checked. The full ventilation is now provided through the surge tank for all conditions and no separate ventilation openings behind the PSV have to be maintained. Those also hold a potential risk of a malfunction by either not opening and causing potential damage to the penstock or not closing, resulting in a leakage. In general, all movable parts have a higher potential risk to fail in relation to a fixed structure. For the HPP Schneiderau, the advantages of the submerged wall are significant and the last years of operation prove the reliability and the low maintenance effort of this solution.
The preparation and conduction of this measurement campaign showed that the waiting time between flow changes can reduce the available time significantly. Long lasting mass oscillation between the surge tank and the upper reservoir can influence a clean zero measurement of all instruments. Nevertheless, this is a key task, along with the exact synchronisation of the different data streams. In future measurement campaigns, a long installation with a suitable data logger will be considered. This would allow the capture of a potential long time period without operation of the HPP and also different water levels in the upper reservoir. The accessibility to measure pressure or other values is limited and consequently compromises have to be accepted. Permanently installed instrumentation is needed for the safe operation of the HPP that has to cover a wide measurement span. This has an impact on the accuracy of those instruments, which makes it very hard to use them as part of a validation experiment. This is a common issue with measurements at comparable infrastructures. A higher measurement frequency would have enabled the capture of water hammer effects and a measurement of the differential pressure would have significantly improved the accuracy of the head loss measurement. All mentioned aspects will potentially be part of future measurements.
5. Conclusions
This paper presents the concept of the submerged wall, which introduces a local high point in the headrace tunnel. It allows the holding back of a significant volume of water after decoupling the headrace tunnel with the gate at the inlet structure. Such a modification replaces the conventional penstock shutoff valves, which are commonly used to protect aboveground penstocks. The presented design and optimisation process of the new hyrdaulic structure included 1D- and 3D-numerical simulations to combine the advantage of each approach. A successful modernisation project was conducted at the ÖBB hydropower plant (HPP) Schneiderau (Austria), which made it possible to prove the concept with nature measurements and validate the numerical design process.
The conducted measurement campaign include a constant operation to provide the boundary conditions for the local head loss simulation. An additional head loss of approximate 12 cm (discharge of 7.079 m/s) could be found based on the comparison of the original with the new geometry, with the help of a detailed 3D-numerical simulation. Different transient load cases and the caused surge tank oscillation allowed us to further validate the 1D-numerical simulation and quantify the improved roughness due to the refurbishment work in the headrace tunnel. The break of the penstock was simulated by keeping the turbines running and closing the gates at the inlet of the upper reservoir. It could be proven that the water level behind the wall remains very close to the top edge of the normally submerged structure. This testing campaign validated the numerical simulations and proved the effectiveness of the concept for replacing the valves. The reduced maintenance effort is a significant benefit of this concept and makes it a very interesting solution as part of the modernisation of existing HPPs. In addition to the successful methodological approach based on numerical simulations, the research project could identify specific research gaps such as the realistic modelling of the breaking boundary condition. Future research should address such catastrophic cases to quantify and reduce the overall potential risk.
Author Contributions
Conceptualization and measurement R.G., M.W. and J.S.; methodology R.G., M.W. and B.G., formal analysis, R.G., M.W., J.S. and C.K.; writing—original draft preparation, R.G., M.W. and C.K.; writing—review and editing, J.S. and B.G., funding R.G., M.W. and B.G. All authors have read and agreed to the published version of the manuscript.
Funding
This work was supported by the Austrian Science Fund (FWF) under Grant J3918 (R.G.), Tiroler Wissenschaftsfonds (TWF) and ÖBB Austrian Federal Railways Infrastructure.
Institutional Review Board Statement
Not applicable.
Informed Consent Statement
Not applicable.
Data Availability Statement
The data presented in this study are available on request from the corresponding author.
Conflicts of Interest
The authors declare no conflict of interest.
Abbreviations
The following abbreviations are used in this manuscript:
| HPP | hydropower plant |
| HRT | headrace tunnel |
| PSV | penstock shutoff valve |
| WL | water level |
| WLR | water level in the upper reservoir |
References
- International Hydropower Association (IHA). 2020 Hydropower Status Report—Sector Trend and Insights. Available online: https://archive.hydropower.org/publications/2020-hydropower-status-report (accessed on 11 February 2021).
- Kougias, I.; Aggidis, G.; Avellan, F.; Deniz, S.; Lundin, U.; Moro, A.; Muntean, S.; Novara, D.; Pérez-Díaz, J.I.; Quaranta, E.; et al. Analysis of emerging technologies in the hydropower sector. Renew. Sustain. Energy Rev. 2019, 113, 109257. [Google Scholar] [CrossRef]
- Rahi, O.P.; Chandel, A.K. Refurbishment and uprating of hydro power plants—A literature review. Renew. Sustain. Energy Rev. 2015, 48, 726–737. [Google Scholar] [CrossRef]
- Trivedi, C.; Cervantes, M.J.; Gandhi, B.K.; Dahlhaug, O.G. Transient Pressure Measurements on a High Head Model Francis Turbine During Emergency Shutdown, Total Load Rejection, and Runaway. ASME. J. Fluids Eng. 2014, 136, 121107. [Google Scholar] [CrossRef]
- Li, D.; Fu, X.; Zuo, Z.; Wang, H.; Li, Z.; Liu, S.; Wei, X. Investigation methods for analysis of transient phenomena concerning design and operation of hydraulic-machine systems—A review. Renew. Sustain. Energy Rev. 2019, 101, 26–46. [Google Scholar] [CrossRef]
- Ehrbar, D.; Schmocker, L.; Vetsch, D.F.; Boes, R.M. Hydropower Potential in the Periglacial Environment of Switzerland under Climate Change. Sustainability 2018, 10, 2794. [Google Scholar] [CrossRef] [Green Version]
- Zhong, W.; Guo, J.; Chen, L.; Zhou, J.; Zhang, J.; Wang, D. Future hydropower generation prediction of large-scale reservoirs in the upper Yangtze River basin under climate change. J. Hydrol. 2020, 588, 125013. [Google Scholar] [CrossRef]
- Schleiss, A.J.; Franca, M.J.; Juez, C.; De Cesare, G. Reservoir sedimentation. J. Hydraul. Res. 2016, 54, 595–614. [Google Scholar] [CrossRef]
- Ehrbar, D.; Schmocker, L.; Doering, M.; Cortesi, M.; Bourban, G.; Boes, R.M.; Vetsch, D.F. Continuous Seasonal and Large-Scale Periglacial Reservoir Sedimentation. Sustainability 2018, 10, 3265. [Google Scholar] [CrossRef] [Green Version]
- Gabl, R.; Gems, B.; Plörer, M.; Klar, R.; Gschnitzer, T.; Achleitner, S.; Aufleger, M. Numerical Simulations in Hydraulic Engineering. In Computational Engineering; Hofstetter, G., Ed.; Springer International Publishing: Berlin/Heidelberg, Germany, 2014; pp. 195–224. [Google Scholar]
- Müller, M.; De Cesare, G.; Schleiss, A.J. Continuous Long-Term Observation of Suspended Sediment Transport between Two Pumped-Storage Reservoirs. J. Hydraul. Eng. 2014, 140, 05014003. [Google Scholar] [CrossRef] [Green Version]
- Müller, M.; De Cesare, G.; Schleiss, A.J. Flow field in a reservoir subject to pumped-storage operation—In situ measurement and numerical modeling. J. Appl. Water Eng. Res. 2016, 109–124. [Google Scholar] [CrossRef]
- Chamoun, S.; De Cesare, G.; Schleiss, A.J. Managing reservoir sedimentation by venting turbidity currents: A review. Int. J. Sediment Res. 2016, 31, 195–204. [Google Scholar] [CrossRef]
- Müller-Hagmann, M.; Albayrak, I.; Auel, C.; Boes, R.M. Field Investigation on Hydroabrasion in High-Speed Sediment-Laden Flows at Sediment Bypass Tunnels. Water 2020, 12, 469. [Google Scholar] [CrossRef] [Green Version]
- Gabl, R.; Gems, B.; Birkner, F.; Hofer, B.; Aufleger, M. Adaptation of an Existing Intake Structure Caused by Increased Sediment Level. Water 2018, 10, 1066. [Google Scholar] [CrossRef] [Green Version]
- del Río, D.A.; Moffett, H.; Nieto-Londoño, C.; Vásquez, R.E.; Escudero-Atehortúa, A. Chivor’s Life Extension Project (CLEP): From Sediment Management to Development of a New Intake System. Water 2020, 12, 2743. [Google Scholar] [CrossRef]
- Mohammad, M.E.; Al-Ansari, N.; Knutsson, S.; Laue, J. A Computational Fluid Dynamics Simulation Model of Sediment Deposition in a Storage Reservoir Subject to Water Withdrawal. Water 2020, 12, 959. [Google Scholar] [CrossRef] [Green Version]
- Chanson, H.; Leng, X.; Wang, H. Challenging hydraulic structures of the twenty-first century—From bubbles, transient turbulence to fish passage. J. Hydraul. Res. 2021, 59, 21–35. [Google Scholar] [CrossRef]
- Beck, C.; Albayrak, I.; Meister, J.; Peter, A.; Selz, O.M.; Leuch, C.; Vetsch, D.F.; Boes, R.M. Swimming Behavior of Downstream Moving Fish at Innovative Curved-Bar Rack Bypass Systems for Fish Protection at Water Intakes. Water 2020, 12, 3244. [Google Scholar] [CrossRef]
- Meister, J.; Fuchs, H.; Beck, C.; Albayrak, I.; Boes, R.M. Head Losses of Horizontal Bar Racks as Fish Guidance Structures. Water 2020, 12, 475. [Google Scholar] [CrossRef] [Green Version]
- Seyfeddine, M.; Vorlet, S.; Adam, N.; De Cesare, G. Holistic Design Approach of a Throttled Surge Tank: The Case of Refurbishment of Gondo High-Head Power Plant in Switzerland. Water 2020, 12, 3440. [Google Scholar] [CrossRef]
- Adam, N.; De Cesare, G.; Nicolet, C.; Billeter, P.; Angermayr, A.; Bernard, V.; Schleiss, A. Design of a throttled surge tank for the refurbishment by power increase of a high head power plant. J. Hydraul. Eng. 2018, 144, 05017004. [Google Scholar] [CrossRef]
- Gabl, R.; Righetti, M. Design criteria for a type of asymmetric orifice in a surge tank using CFD. Eng. Appl. Comp. Fluid 2018, 12, 397–410. [Google Scholar] [CrossRef] [Green Version]
- Martínez-Lucas, G.; Pérez-Díaz, J.I.; Chazarra, M.; Sarasúa, J.I.; Cavazzini, G.; Pavesi, G.; Ardizzon, G. Risk of penstock fatigue in pumped-storage power plants operating with variable speed in pumping mode. Renew. Energy 2019, 133, 636–646. [Google Scholar] [CrossRef]
- Ye, J.; Zeng, W.; Zhao, Z.; Yang, J.; Yang, J. Optimization of Pump Turbine Closing Operation to Minimize Water Hammer and Pulsating Pressures During Load Rejection. Energies 2020, 13, 1000. [Google Scholar] [CrossRef] [Green Version]
- Adamkowski, A. Case study: Lapino powerplant penstock failure. J. Hydraul. Eng. 2001, 127, 547–555. [Google Scholar] [CrossRef]
- Rydbeck, B.V.; Injerd, D.; McKay, H.G., III. Steel Penstock Failure and Rehabilitation: HCJB Hydroelectric Power Station: Papallacta, Ecuador. In Proceedings of the Waterpower’99: Hydro’s Future: Technology, Markets, and Policy, Las Vegas, NV, USA, 6–9 July 1999; American Society of Civil Engineers (ASCE): Las Vegas, NV, USA, 1999; pp. 1–8. [Google Scholar]
- Uddin, N. Lessons learned: Failure of a hydroelectric power project dam. J. Perform. Constr. Facil. 2005, 19, 69–77. [Google Scholar] [CrossRef]
- Georgescu, A.M.; Coşoiu, C.I.; Alboiu, N.; Hlevca, D.; Tataroiu, R.; Popescu, O. Penstock failure detection system at the “Valsan” hydro power plant. IOP Conf. Ser. Earth Environ. Sci. 2012, 15, 052005. [Google Scholar] [CrossRef]
- Card, R.J.; Carpenter, M.D.; Roell, K.A. Large Diameter Penstock Condition Assessment & Replacement Two Case Studies. In Proceedings of the Pipelines 2013: Pipelines and Trenchless Construction and Renewals—A Global Perspective, Fort Worth, TX, USA, 23–26 June 2013. [Google Scholar]
- Özaslan, T.; Shen, S.; Mulgaonkar, Y.; Michael, N.; Kumar, V. Inspection of Penstocks and Featureless Tunnel-like Environments Using Micro UAVs. In Field and Service Robotics; Mejias, L., Corke, P., Roberts, J., Eds.; Springer Tracts in Advanced Robotics; Springer: Cham, Switzerland, 2015; Volume 105. [Google Scholar]
- Bambei, J.H.; Task Committee on Steel Penstock Design. Steel Penstocks, 2nd ed.; American Society of Civil Engineers (ASCE): Las Vegas, NV, USA, 2012; ASCE Manuals and Reports on Engineering Practice. [Google Scholar]
- Hager, A.; Wagner, E. Power station construction then and now through the example of the Glockner/Kaprun power station group and the PSW Limberg II in Kaprun. Geomech. Tunnelbau 2009, 2, 94–104. [Google Scholar] [CrossRef]
- Freitag, M.; Larcher, M.; Blauhut, A. The Reißeck II pumped storage power station/Das Pumpspeicherkraftwerk (PSKW) Reißeck II. Geomech. Tunn. 2011, 2, 119–128. [Google Scholar] [CrossRef]
- Freitag, M.; Larcher, M.; Hager, A. The Reißeck II pumped storage power station in Carinthia/Das Pumpspeicherkraftwerk (PSKW) Reißeck II in Kärnten. Geomech. Tunn. 2011, 5, 553–561. [Google Scholar] [CrossRef]
- Kröner, C.; Gabl, R.; Seibl, J.; Aufleger, M. Bruch der Druckrohrleitung als ein Extremlastfall bei Hochdruckwasserkraftanlagen [Failure of a penstock as an example of an extreme load-case as part of dimensioning of hydro power plants]. WasserWirtschaft 2017, 107, 29–35. [Google Scholar] [CrossRef]
- Gabl, R.; Achleitner, S.; Neuner, J.; Aufleger, M. Accuracy analysis of a physical scale model using the example of an asymmetric orifice. Flow Meas. Instrum. 2014, 36, 36–46. [Google Scholar] [CrossRef]
- Wang, C.; Meng, T.; Hu, H.; Zhang, L. Accuracy of the ultrasonic flow me- ter used in the hydroturbine intake penstock of the Three Gorges Power Station. Flow Meas. Instrum. 2012, 25, 32–39. [Google Scholar] [CrossRef]
- Martins, R.S.; Andrade, J.R.; Ramos, R. On the effect of the mounting angle on single-path transit-time ultrasonic flow measurement of flare gas: A numerical analysis. J Braz. Soc. Mech. Sci. Eng. 2020, 42, 13. [Google Scholar] [CrossRef]
- Wiranata, L.F.; Ardana, I.W.R. Simultaneous Multipath Ultrasonic Flowmeter. In Proceedings of the 2020 IEEE International Conference on Automatic Control and Intelligent Systems (I2CACIS), Shah Alam, Malaysia, 20–20 June 2020; pp. 1–6. [Google Scholar] [CrossRef]
- Amri, K.; Suprijanto, S.; Kurniadi, D.; Juliastuti, E. Asymmetric flow velocity measurement using multipath ultrasonic flowmeter with adaptive weighting method guided by tomography. J. Teknol. 2020, 82, 135–146. [Google Scholar] [CrossRef] [Green Version]
- Aydin, I. Air demand behind high head gates during emergency closure. J. Hydraul. Res. 2002, 40, 83–93. [Google Scholar] [CrossRef]
- Huard, M.-O.; Li, S.S. Air pressure drop in a penstock during the course of intake-gate closure. Can. J. Civ. Eng. 2016, 43, 998–1006. [Google Scholar] [CrossRef]
- Nikseresht, A.H.; Talebbeydokhti, N.; Khorshidi, H. Three-Dimensional Numerical Modeling of Cavitation and Aeration System in Dam Outlets. ASME. J. Fluids Eng. 2012, 134, 091302. [Google Scholar] [CrossRef]
- Hohermuth, B.; Schmocker, L.; Boes, R.M. Air Demand of Low-Level Outlets for Large Dams. J. Hydraul. Eng. 2020, 146, 04020055. [Google Scholar] [CrossRef]
- Wei, W.; Deng, J.; Xu, W. Numerical investigation of air demand by the free surface tunnel flows. J. Hydraul. Res. 2020. [Google Scholar] [CrossRef]
- Hua, Y.; Cai, F.; Zhou, J.; Zhang, W. Study of Self-Induced Sloshing in Model Test of a Water Retaining Weir. Water 2017, 9, 646. [Google Scholar] [CrossRef] [Green Version]
- Seibl, J. Numerische und Physikalische Untersuchung des Hydraulischen Verhaltens von Wandartigen Strukturen am Übergang von Druckstollen zu Druckschacht. Ph.D. Thesis, University of Innsbruck, Innsbruck, Austria, 2016. [Google Scholar]
- Seibl, J.; Gabl, R.; Kröner, C.; Aufleger, M. Alternativer hydraulischer Schutz des Triebwasserwegs—Konzept, Modellversuch und numerische 3-D-Simulation [Alternative hydraulic protection of penstocks—Concept, scale model test and numerical 3D simulation]. WasserWirtschaft 2017, 107, 36–41. [Google Scholar] [CrossRef]
- Seibl, J.; Gabl, R.; Birkner, F.; Aufleger, M. Alternative to existing pipe-break valves in high-head power plants. In Proceedings of the 36TH IAHR WORLD CONGRESS: Deltas of the Future and What Happens Upstream, Delft, The Netherlands, 28 June–3 July 2015; pp. 3199–3204. [Google Scholar]
- Ghidaoui, M.S.; Zhao, M.; McInnis, D.A.; Axworthy, D.H. A Review of Water Hammer Theory and Practice. ASME. Appl. Mech. Rev. 2005, 58, 49–76. [Google Scholar] [CrossRef]
- Akpan, P.U.; Jones, S.; Eke, M.N.; Yeung, H. Modelling and transient simulation of water flow in pipelines using WANDA Transient software. Ain Shams Eng. J. 2017, 8, 457–466. [Google Scholar] [CrossRef] [Green Version]
- Akpan, P.U.; Mgbemene, C.A.; Ume, J.I.; Jones, S.; Yeung, H. Constant heat outflow rates for air/surge vessel modelling during pressure transients. Int. J. Press. Vessel. Pip. 2019, 172, 295–303. [Google Scholar] [CrossRef]
- Adamkowski, A.; Lewandowski, M. Cavitation Characteristics of Shutoff Valves in Numerical Modeling of Transients in Pipelines with Column Separation. J. Hydraul. Eng. 2015, 141, 04014077. [Google Scholar] [CrossRef]
- Brinkhorst, S.; von Lavante, E.; Wendt, G. Numerical investigation of cavitating Herschel Venturi-Tubes applied to liquid flow metering. Flow Meas. Instrum. 2015, 43, 23–33. [Google Scholar] [CrossRef]
- Bermejo, D.; Escaler, X.; Ruiz-Mansilla, R. Experimental investigation of a cavitating Venturi and its application to flow metering. Flow Meas. Instrum. 2021, 78, 101868. [Google Scholar] [CrossRef]
- WIKA Pressure Sensor Model CPT2500 with USB Adapter. Available online: https://www.wika.co.uk/cpt2500_en_co.WIKA (accessed on 11 August 2021).
- Böttcher, H.; Gabl, R.; Aufleger, M. Experimental Hydraulic Investigation of Angled Fish Protection Systems—Comparison of Circular Bars and Cables. Water 2019, 11, 1056. [Google Scholar] [CrossRef] [Green Version]
- Gabl, R.; Innerhofer, D.; Achleitner, S.; Righetti, M.; Aufleger, M. Evaluation criteria for velocity distributions in front of bulb hydro turbines. Renew. Energy 2018, 121, 745–756. [Google Scholar] [CrossRef]
- Andersson, L.R.; Hellström, J.G.I.; Andreasson, P.; Lundström, T.S. Numerical Investigation of a Hydropower Tunnel: Estimating Localised Head-Loss Using the Manning Equation. Water 2019, 11, 1562. [Google Scholar] [CrossRef] [Green Version]
- Aberle, J.; Henry, P.-Y.; Kleischmann, F.; Navaratnam, C.U.; Vold, M.; Eikenberg, R.; Olsen, N.R.B. Experimental and Numerical Determination of the Head Loss of a Pressure Driven Flow through an Unlined Rock-Blasted Tunnel. Water 2020, 12, 3492. [Google Scholar] [CrossRef]
Figure 1.
Main components of the new protection concept—intake gates (a) with additional ventilation (b); the new wall at the bottom of the surge tank (c,d) and division of the two penstocks including the valves (e)—blue arrows indicate the main flow direction under normal operation— indicates the filling pipe which was used as an upstream measurement point and marks the downstream measurement point.

Figure 2.
Sketch of upper part of a power plant comparing the original (right side) and adapted version, which only uses the intake gates—the additional needed excavation is indicated by a grey dashed line—horizontal dashed lines indicated water levels.
Figure 2.
Sketch of upper part of a power plant comparing the original (right side) and adapted version, which only uses the intake gates—the additional needed excavation is indicated by a grey dashed line—horizontal dashed lines indicated water levels.

Figure 3.
Methodological overview, from the initial feasibility study to the final validation and usage of the 1D and 3D-numerical approach.
Figure 3.
Methodological overview, from the initial feasibility study to the final validation and usage of the 1D and 3D-numerical approach.

Figure 4.
Comparison of the original geometry of the surge tank in green (a,b) with the new approach including the wall and extra excavation (c,d)—normal flow direction under steady operation marked with blue arrows— indicates the filling pipe which was used as an upstream measurement point and marks the downstream measurement point.

Figure 5.
Numerical results for a constant discharge of 7.079 ms—comparison of the original geometry of the surge tank (left column) with the new approach including the wall and extra excavation (right)—streamlines (upper row) and cross section at the -plane (lower row).
Figure 5.
Numerical results for a constant discharge of 7.079 ms—comparison of the original geometry of the surge tank (left column) with the new approach including the wall and extra excavation (right)—streamlines (upper row) and cross section at the -plane (lower row).

Figure 6.
Comparison of the measurement of a starting and closing transient operation case compared with two exemplary 1D-numerical simulations with two different roughness value in the headrace tunnel.
Figure 6.
Comparison of the measurement of a starting and closing transient operation case compared with two exemplary 1D-numerical simulations with two different roughness value in the headrace tunnel.

Figure 7.
Time series of the measured values for the measurement points and for the simulated break of the penstock—the second y-axis at the right shows the differences of to the top height of the wall (1453 m) as well as the second measurement .
Figure 7.
Time series of the measured values for the measurement points and for the simulated break of the penstock—the second y-axis at the right shows the differences of to the top height of the wall (1453 m) as well as the second measurement .


Table 1.
Analysis of the zero measurement at the two added points and , existing pressure measurements at both penstocks and and the water level () in the upper reservoir ().
Table 1.
Analysis of the zero measurement at the two added points and , existing pressure measurements at both penstocks and and the water level () in the upper reservoir ().
| min | max | mean | max−min | [m] | - [m] | |
|---|---|---|---|---|---|---|
| [bar] | 2.42 | 2.45 | 2.44 | 0.03 | 1462.26 | −0.18 |
| [bar] | 2.35 | 2.38 | 2.37 | 0.03 | - | - |
| [bar] | 41.68 | 41.76 | 41.75 | 0.08 | 1470.10 | 7.66 |
| [bar] | 41.92 | 42.00 | 41.97 | 0.08 | 1472.36 | 9.92 |
| [m] | 1462.38 | 1462.50 | 1462.44 | 0.12 | 1462.44 | 0.00 |
Table 2.
Evaluation of the local head loss , local head loss coefficient with a reference velocity defined at the upstream connecting headrace tunnel (HRT) and the kinetic energy flux coefficient of the downstream cross section depending on the distance for the original geometry in comparison with the submerged wall—constant discharge of 7.079 m/s.
| = 2 m | = 7 m | = 18 m | = 30 m | |||||||||
|---|---|---|---|---|---|---|---|---|---|---|---|---|
| [cm] | [-] | [-] | [cm] | [-] | [-] | [cm] | [-] | [-] | [cm] | [-] | [-] | |
| original | 3.84 | 0.24 | 2.081 | 3.91 | 0.25 | 1.009 | 6.42 | 0.41 | 1.079 | 7.22 | 0.46 | 1.055 |
| wall | 15.30 | 0.97 | 1.637 | 15.92 | 1.01 | 1.016 | 18.77 | 1.19 | 1.041 | 19.31 | 1.22 | 1.056 |
| difference | 11.46 | 0.72 | 12.01 | 0.76 | 12.35 | 0.78 | 12.09 | 0.76 | ||||
Publisher’s Note: MDPI stays neutral with regard to jurisdictional claims in published maps and institutional affiliations. |
© 2021 by the authors. Licensee MDPI, Basel, Switzerland. This article is an open access article distributed under the terms and conditions of the Creative Commons Attribution (CC BY) license (https://creativecommons.org/licenses/by/4.0/).
Share and Cite
MDPI and ACS Style
Gabl, R.; Wippersberger, M.; Seibl, J.; Kröner, C.; Gems, B. Submerged Wall Instead of a Penstock Shutoff Valve—Alternative Protection as Part of a Refurbishment. Water 2021, 13, 2247. https://doi.org/10.3390/w13162247
AMA Style
Gabl R, Wippersberger M, Seibl J, Kröner C, Gems B. Submerged Wall Instead of a Penstock Shutoff Valve—Alternative Protection as Part of a Refurbishment. Water. 2021; 13(16):2247. https://doi.org/10.3390/w13162247
Chicago/Turabian StyleGabl, Roman, Markus Wippersberger, Jakob Seibl, Christian Kröner, and Bernhard Gems. 2021. "Submerged Wall Instead of a Penstock Shutoff Valve—Alternative Protection as Part of a Refurbishment" Water 13, no. 16: 2247. https://doi.org/10.3390/w13162247
Note that from the first issue of 2016, this journal uses article numbers instead of page numbers. See further details here.