Article

F-Specific RNA Bacteriophage Transport in Stream Water: Hydro-Meteorological Controls and Association with Suspended Solids

by
Núria Martínez-Carreras
1,*,
Leslie Ogorzaly
1,*,
Cécile Walczak
1,
Christophe Merlin
2,
Emmanuelle Montargès-Pelletier
3,4,
Christophe Gantzer
2,
Jean-François Iffly
1,
Henry-Michel Cauchie
1 and
Christophe Hissler
1
1
Environmental Research and Innovation Department (ERIN), Luxembourg Institute of Science and Technology (LIST), L-4422 Belvaux, Luxembourg
2
Université de Lorraine, CNRS, LCPME, F-54000 Nancy, France
3
Université de Lorraine, CNRS, LIEC, F-54000 Nancy, France
4
LTSER Zone Atelier Moselle, F-54000 Nancy, France
*
Authors to whom correspondence should be addressed.
Water 2021, 13(16), 2250; https://doi.org/10.3390/w13162250
Submission received: 30 June 2021 / Revised: 30 July 2021 / Accepted: 2 August 2021 / Published: 18 August 2021

Abstract

:
F-specific RNA bacteriophages (FRNAPHs) are commonly used as indicators of faecal and viral contamination in waters. Once they enter surface waters, the exact role of suspended solids, sediments and hydro-meteorological factors in their fluvial fate and transport is poorly understood, and long-term studies (e.g., over years) are lacking. In this study, FRNAPH concentrations and genogroup distribution were measured in the Orne River (France) during two years at weekly intervals, and during four storm runoff events. Hydro-meteorological driving factors were investigated at both time scales. FRNAPH concentrations and genogroups at different depths of a riverbank sediment core were also examined to better discriminate the origin of the faecal pollution. During low flows, the FRNAPH and the suspended solid transport were decoupled and the FRNAPH concentrations were mainly correlated with the air and water temperature. During storm runoff events, the FRNAPH concentrations only showed a significant correlation with conductivity, turbidity and water discharge. Despite the uncertainty of the predictions, multi parameter regression models using hydro-meteorological variables were suitable to predict log transformed FRNAPHs’ concentrations at low flows with a standard error of 0.46. Model performance using the storm runoff events dataset was low. This study highlights different driving factors at low flows and during storm runoff events, and the need to measure at both time scales to better understand phage transport dynamics in surface water.

1. Introduction

Many surface waters, namely lakes, rivers, estuaries and seas, receive untreated or partially treated wastewater all over the world. Evidence showed the difficulty to completely remove viruses from anthropogenic waste with conventional water treatment processes [1], whereas spills caused by service chain failures or overflows can also occur even if cutting-edge treatment systems are in place. Similarly, heavy rainfall can induce overland flow in agricultural fields [2,3,4] and the discharge of untreated faecal waste to downstream aquatic ecosystems [5,6]. As a result, the surface waters impacted by anthropic activities often exhibit high levels of microbial faecal pollution, including viruses pathogenic to humans and animals, as well as faecal bacteriophages.
After decades of using faecal bacterial indicators to assess the microbial quality of water, extensive scientific evidence demonstrated their limitations to accurately predict viral risk [7]. Consequently, regulations are progressively adding other indicators, such as faecal bacteriophages [8] (e.g., the new European directive [9] on the quality of water intended for human consumption or the EU recommendation for water reuse [10]). Among those indicators, F-specific RNA bacteriophages (FRNAPHs) were suggested to be relevant indicators of faecal and viral contamination [11,12,13]. Indeed, FRNAPHs cannot grow outside their host cell (commonly found in the lower intestine of humans and warm-blooded animals), and their multiplication is unlikely in the environment due to the following parameters linked to bacteria host cells: low concentrations, the absence of receptor used by the phage (i.e., F-pili) and low metabolism [14,15]. FRNAPHs can be classified into the following four genogroups [5,16]: genogroups I and II (FRNAPH I and II) belong to the genus of Levivirus, whereas genogroups III and IV (FRNAPH III and IV) to the genus Allolevivirus. The genotyping method allows for the discrimination of the origin of faecal pollution, since FRNAPH II and III are mostly found in human wastes and urban wastewater, while FRNAPH I and IV are in higher concentrations in animal wastes [17]. The correlation was underlined between the concentration of FRNAPH II and the presence of human pathogenic viruses (adenovirus, norovirus) in rivers or oysters grown in polluted seawater [5,18].
Once they reach the stream, viral particles are submitted to various biotic and abiotic stressors that drive their fate in aquatic environments, the most impacting being temperature and sunlight [19,20]. The distance travelled from a wastewater discharge [21], the contamination events [22], the survival and transport properties of the virus [23] and the hydro-meteorological conditions (e.g., temperature, flow rate, salinity and pH) [24] are other factors influencing the fate of viral pollution on surface water. Fauvel et al. [4,23] monitored the propagation of FRNAPHs along a 3-km river transect in the Alzette River (Luxembourg). Their results showed that the inactivation of infectious FRNAPHs was the major process causing in situ viral particle decrease. In the studied ecosystem, the estimated distance necessary to remove 90% of infectious FRNAPHs (D90) was estimated to range from 2.8 to 9.5 km, depending on the hydro-meteorological conditions (temperature, season and water flow).
Different FRNAPH abundances have been reported in different matrices, including the water column [5], suspended solids [4,25], sediment deposed in the channel bed [26] and epilithic biofilms [27]. Some studies reported greater abundances in channel bed sediment than in the water column, which were then suggested to act as a reservoir for enteric viruses [25] and to protect them against proteolytic enzymes or other degrading factors (e.g., water temperature, pH and solar radiation) [28,29]. Nonetheless, a recent review by Martín-Díaz et al. [30] evidenced a great divergence in bacteriophage detection methods in different types of solid and semisolid matrices (sludge, biosolids, sediments and soils), calling for improved and standardised methodologies.
Monitoring the level of viruses in water at sufficiently high spatiotemporal resolution presently limits progress to accurately quantify fluxes and loads during longer time scales. Kay et al. [31] pointed out that river microbiological water quality has not been measured as part of harmonised regulatory monitoring programs and, hence, extensive time sequences of data do not exist. This, together with the large uncertainties of source and transport variables [32], hinders progress to assess and model viral pollution dynamics at a river basin scale. In this respect, most of the microbial fate and transport models described thus far focused on faecal indicator bacteria [33,34], while only some also include pathogens, allowing a direct assessment of health risks [35,36,37]. It is argued that modelling FRNAPH loads in rivers [38] can shed some light on the influence of hydro-meteorological and suspended solids and sediment transport parameters on virus concentrations, resulting in a better understanding of transport processes and eventually leading to better predictive tools.
The exact role of suspended solids, sediments and hydro-meteorological factors in the fluvial fate and transport of viral particles is poorly understood. This study aimed at deciphering the interplay between FRNAPHs and suspended solids in the water column in relation to hydro-meteorological drivers and in contrasting hydrological conditions, i.e., at low flow and during storm runoff events. The FRNAPH concentrations and genogroup distribution were measured in the Orne River (France) during two years at weekly intervals, and during four storm runoff events. The FRNAPH concentrations and the genogroups at different depths of a riverbank sediment core were also examined. The data collected were used to determine (i) whether FRNAPHs were transported in association with suspended solids, (ii) whether the FRNAPH and suspended solids transport was controlled by the same hydro-meteorological drivers, (iii) whether those drivers were different at low flow and during storm runoff events and, finally, (iv) whether it was possible to predict the FRNAPH concentrations from hydro-meteorological variables.

2. Materials and Methods
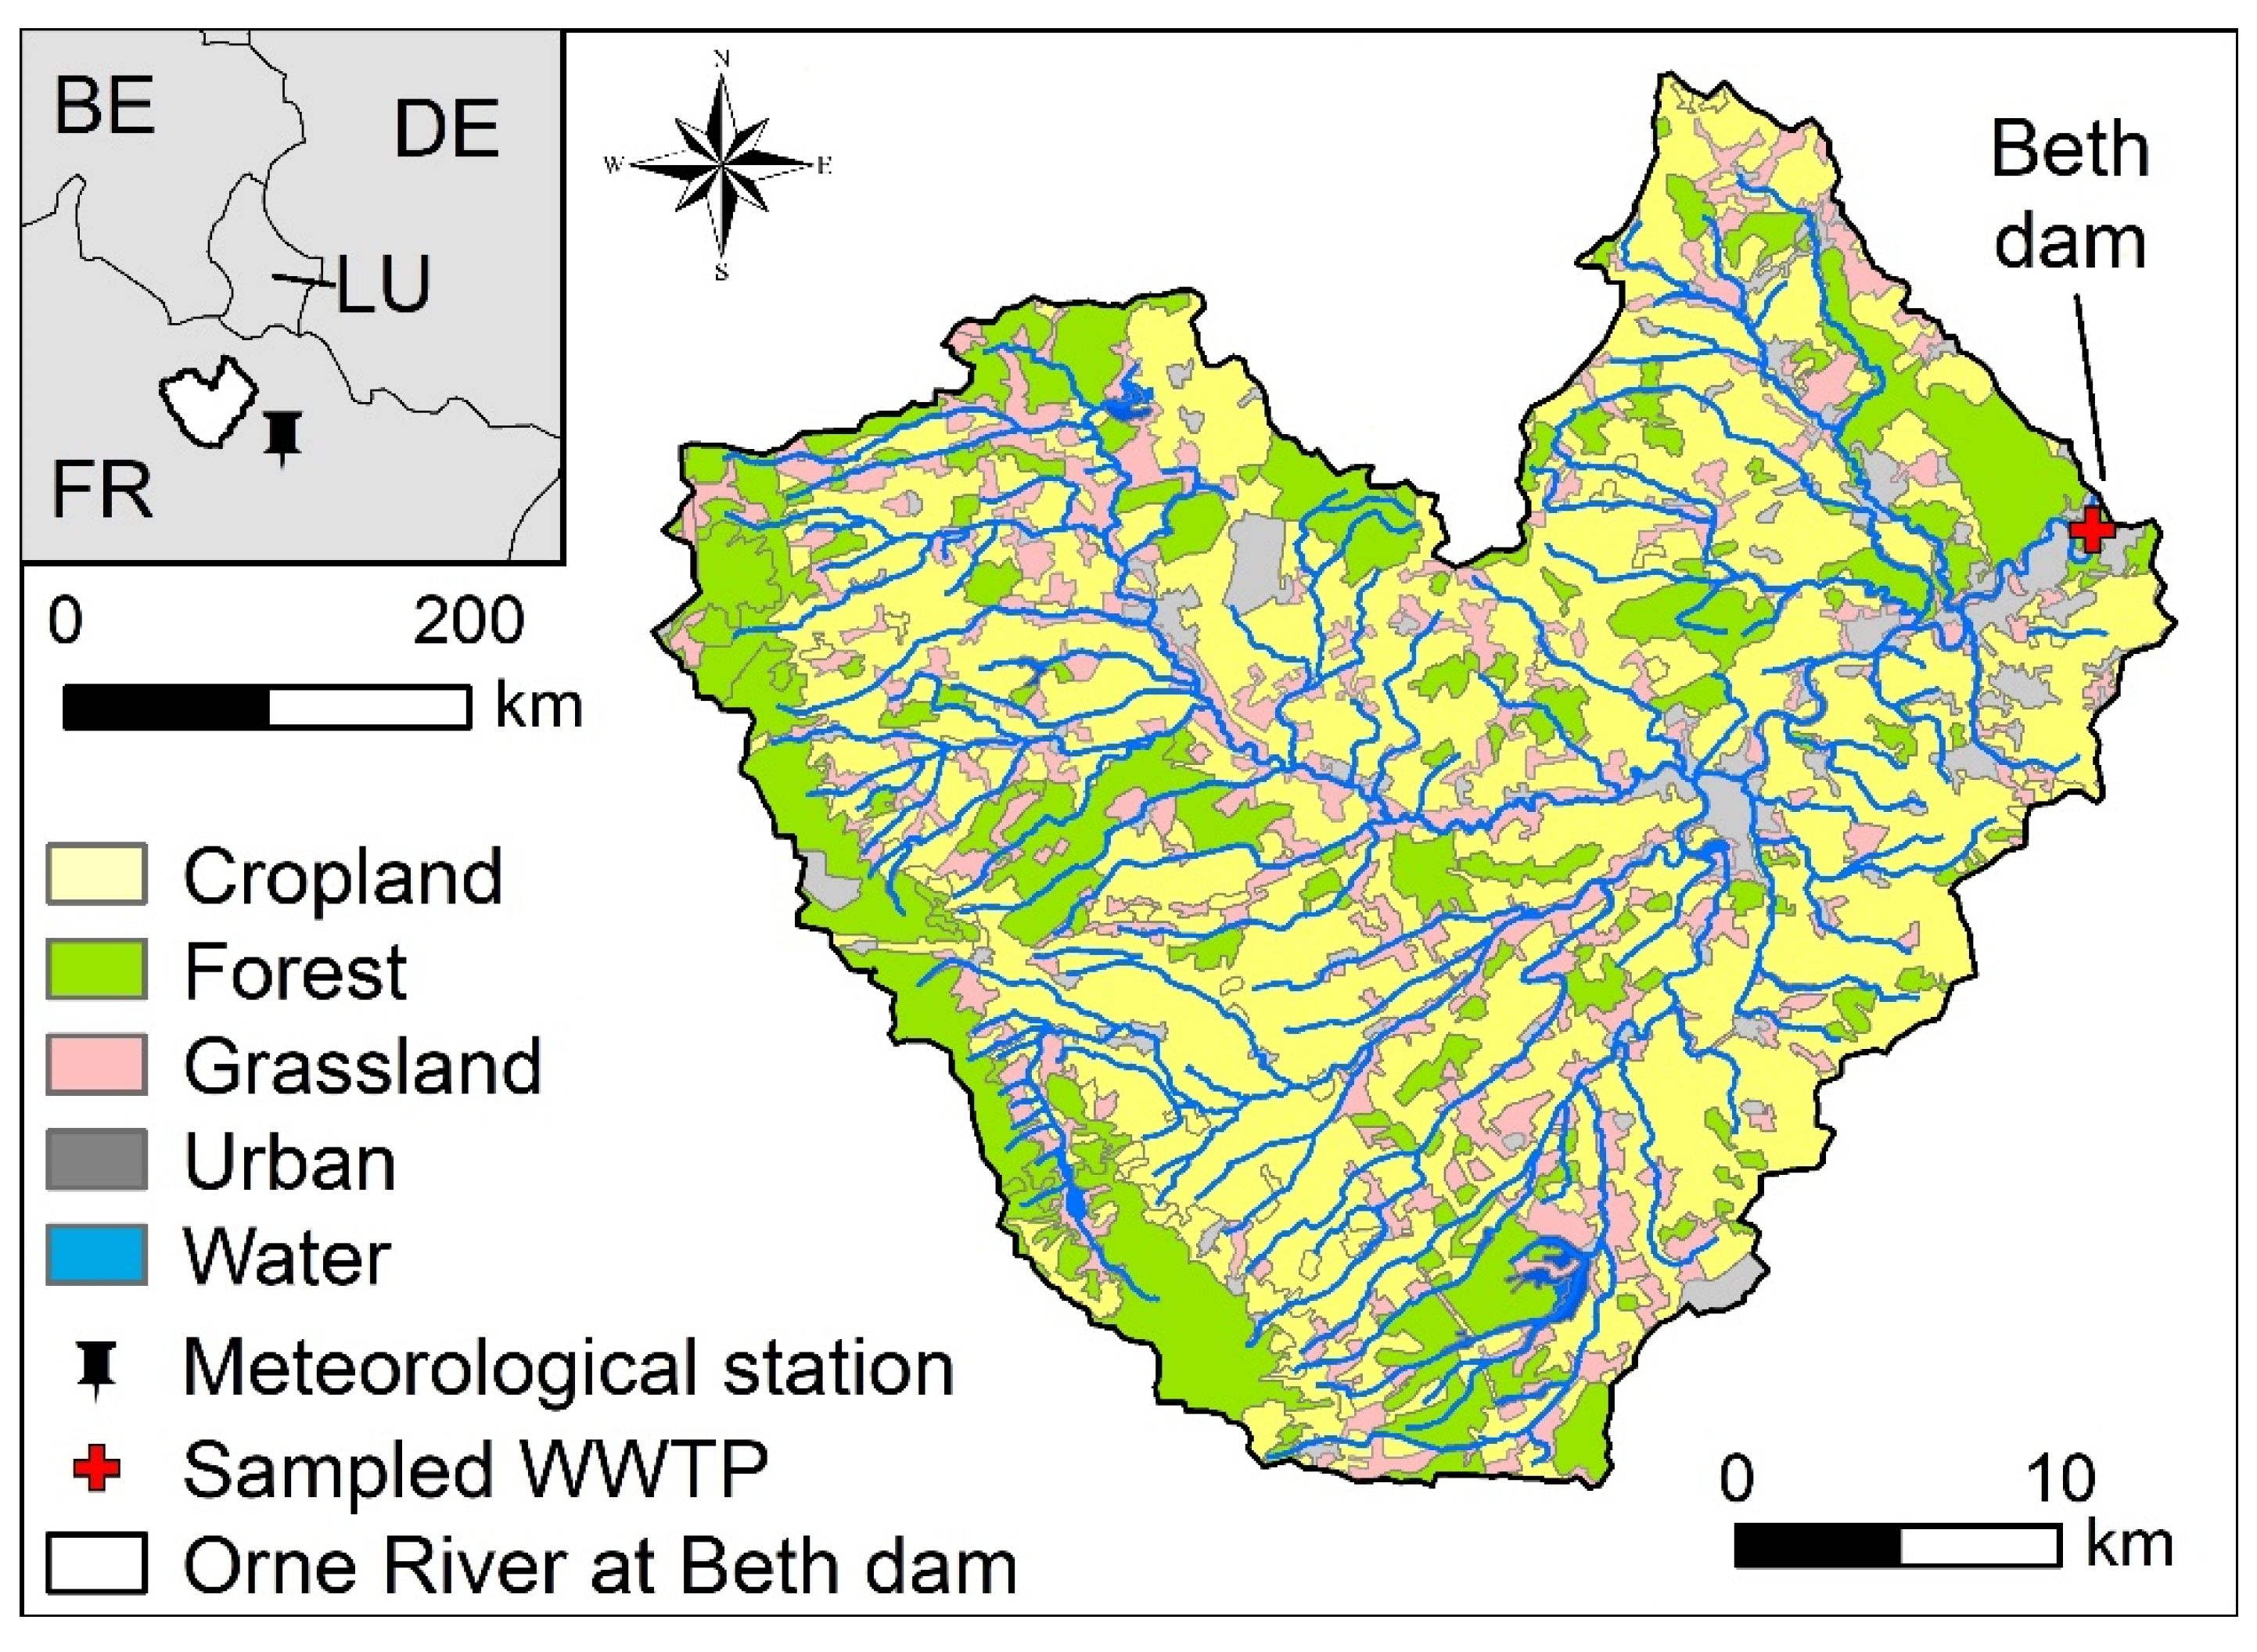
2.1. Study Area

The Orne River (northeast of France) drains a surface of ca. 1250 km2 (Figure 1). It is a left-hand tributary of the Moselle River that flows through France, Luxembourg and Germany before joining the Rhine River in Koblenz. The geology of the watershed can be divided into the following two main parts [39]: a clayey (marl) depression in the western part of the catchment (Woëvre region) and a deeply calcareous plateau in the eastern part (Pays-Haut region). The Beth sampling site in this study (Orne River at Beth; 1147 km2) is located ≈15 km upstream of the Orne River catchment outlet. In the sub-catchment, forest (23% area) dominates in the western headwaters, whereas cropland (54%) and grassland (16%) extend over the catchment. Urban and industrial areas (5%) are mainly located along the stream network.
The economy of the Orne valley relied on steelmaking (and related, such as iron mining) activities during the 20th century. As a consequence of these activities, soils, sediments and water bodies were highly contaminated with the spreading of materials enriched in iron, other metallic elements and persistent organic pollutants, such as polycyclic aromatic hydrocarbons (PAHs) [39]. Several small dams were also built along the river to create water reservoirs mainly for industrial purposes. This is the case of the ‘Beth dam’ (Figure 1), which was constructed in 1958 at the beginning of the period of highest production in the region (1960–1988). In 1988, a dredging of the Orne River was carried out from Jœuf to the city of Moyeuvre [40].
Previous studies in the catchment looked into the mineral and chemical characterisation of settled sediments, englobing the identification of lithogenic and anthropogenic sources [39]. Losson et al. [41] investigated the hydrodynamics of the river and the mobilisation of sediments upstream of the Beth dam, and Lepesqueure et al. [42] applied a sediment transport model in a cross-section of the Orne River to investigate the importance of grain-size distribution, sediment density and suspended solids concentrations on the model results. The Beth sampling site in this study coincides with the downstream site used by [42]. A wastewater treatment plant (Moyeuvre-Grande; active sludge, nitrogen and phosphorus treatment; 51,400 inhabitant-equivalents [43]) discharges its water ≈0.9 km upstream of the Beth dam (referred hereafter as WWTP; Figure 1).

2.2. Experimental Set-Up and Sampling

Water level was measured every 15 min at the Beth site using a bubble sensor OTT-CBS (OTT HydroMet, Kempten, Germany). Data were automatically sent to a local server using an autonomous station, DuoSens (OTT HydroMet, Kempten, Germany). Water discharge was calculated using gauging data obtained with an acoustic Doppler current profiler (Streampro ADCP; Teledyne Marine, Daytona Beach, FL, USA). A turbidity meter (YSI 600 OMS; YSI Inc./Xylem Inc., Yellow Springs, OH, USA) measuring turbidity, water temperature and conductivity was installed at the same site from October 2016. Global solar radiation, air temperature and precipitation were measured ≈40 km south-east of Beth by Météo France (station Aéroport M.N.L.; Goin, Moselle). The total rainfall and runoff at the catchment outlet were 718 and 347 mm during the first sampled year, respectively (September 2015–August 2016). Precipitation amounts were lower during the second sampled year (484 mm) and only a small number of events occurred, resulting in an annual runoff of 105 mm (September 2016–August 2017) (Figure 3).
Weekly stream water samples (2-L) were collected manually using a bucket attached to a rope from the Beth dam from September 2015 to October 2017 (n = 91). Major cross-section variability was assessed by carrying out three cross-section campaigns and measuring FRNAPH and suspended solids concentrations across the sampling section at different discharges (Table S1 in the Supplementary Material). Additionally, four flood events of different intensity were sampled at the same location. The two first events were grab sampled as for the weekly samples in November 2015 (n = 7) and February 2016 (n = 13), whereas an automatic water sampler (24 1-litre bottles; Teledyne ISCO, Lincoln, NE USA) located above the dam was used for the two last events that occurred in December 2018 (n = 31) and March 2019 (n = 50). The outflow of the WWTP was sampled manually at irregular intervals from December 2018 to March 2019 (n = 17).
The sediment core was sampled from a sediment bar located along the channel bank on February 2014 following the procedure described by Kanbar et al. [39] and using a piston corer (Beeker corer; referred as ‘river bank sediment core’). The core was sealed and transported to the laboratory in a vertical position before being sliced in 2–3 cm layers into an N2-filled glove bag to avoid oxidation and stored at −80°C until analysis.

2.3. Laboratory Analysis

Turbidity was measured in the laboratory using a portable turbidimeter (HACH 2100Q, Loveland, CO, USA; NTU units) and suspended solid concentration by filtering a known sub-sample volume through 1.2-micrometre Whatman GF/C glass fibre filters (Whatman Ltd., Kent, UK) by means of a Millipore vacuum pump. Before water filtration, the filters were dried at 105 °C for more than 2 h, desiccated and weighed. After water filtration, the filters were dried out again at 105 °C and reweighed. The weight difference provided the total amount of suspended solids retained on the filter. Suspended solid concentration was calculated by dividing the total amount of solid retained in the filters by the volume of the filtered samples.
FRNAPHs were measured in four different matrices referred as ‘bulk column’ samples (raw water sample), ‘filtrated water’ (water sample after filtration on 1.2-micrometre Whatman GF/C glass fibre filters), ‘suspended solid’ (particulate matter transported in suspension) and ‘river bank sediment core’ (river bank sediment, 130 cm deep measurements at 3 cm intervals). For all types of samples, the concentration of infectious FRNAPHs was determined using Salmonella enterica serovar Typhimurium strain WG49 (Collection Institut Pasteur, CIP 10344) and the double-agar-layer technique, as described in the ISO standard 705-1:2001, including the RNase (R6513, Sigma) test. Nalidixic acid (Ref. 169900250, Acros Organics) was added to the media for limiting the growth of the abundant bacterial flora. Negative and positive controls (MS2 phage) were included in all the analysis. Plates were incubated overnight at 37 °C before plaque forming units (PFU) counting. For water samples (bulk and filtrated water), FRNAPHs were enumerated in either 4 × 5 mL or 6 × 5 mL of water, depending on the samples collected, and their concentrations were expressed in PFU/1L. For the November 2015 and February 2016 campaigns (storm runoff events), samples were stored at −20 °C prior to analysis and both infectious FRNAPHs and genogroups quantification were caried out within one month, once all the samples were collected for a given event. For suspended solids, an elution step of FRNAPH from suspended solids was required. For this purpose, 1 litre of bulk water was filtered through 1.2-micrometre Whatman GF/C glass fibre filters (identical to that used to determine suspended solid concentration), previously saturated using a 5% beef extract solution (Ref. 212610, Difco Beef extract, Gibco) to prevent bacteriophage adhesion to the filtration material. After filtration, the filter was submerged in a 7-millilitre solution of pyrophosphate buffer (0.01 M, pH 7; Ref. 221368, Sigma), as previously described [26,36], and incubated for 30 min with a 400-rpm orbital shaking. The filter was finally removed, and the supernatant was centrifuged for 4 min at 3220× g to remove the suspended solids. The recovery solution was then collected and directly analysed (6 × 1 mL) for the infectious FRNAPH detection using the plaque assay method. Results were expressed in PFU/L, corresponding to the number of viral particles attached to suspended solid in 1 L of water. FRNAPHs in filtrated water and suspended solids were measured for the weekly samples from February to September 2016 (n = 28) and discontinued afterwards. For the riverbank sediment core, infectious FRNAPHs were tentatively recovered from 1 g of frozen sediments vigorously dispersed in 20 mL of phosphate buffer saline (PBS; Ref. P3813, Sigma), by direct plating onto using a standard double-agar-layer technique, as described above.
Prior to the FRNAPH genogroup detection, a clarification of surface water was performed by centrifugation at 3000× g for 10 min at 4 °C. Then, an ultracentrifugation of 98 mL of supernatant at 235,000× g for 1 h 30 min at 4 °C (L-90K Ultracentrifuge, Beckman Coulter OptimaTM; Beckman Coulter, Inc., Indianapolis, IN, USA) was performed to concentrate phage particles [4,44]. Each pellet was resuspended in 1 mL of the Nuclisens lysis buffer (Biomérieux, France) and stored at −80 °C until the next steps of sample treatment. For riverbank sediment, bacteriophage RNAs were extracted from 0.25 g of frozen core slices dispersed in 1 mL of PBS. The RNA extraction was performed using the Nuclisens Magnetic Extraction kit (Biomérieux, France). The elution step was carried out in 100 µL of elution buffer (Biomérieux, France) and extracted nucleic acids were stored at −80 °C. For riverbank sediment, the RNA extraction above was preceded by a standard phenol/chloroform/isoamyl alcohol (25:24:1) extraction and followed by an extra-RNA purification step using the Agencourt® RNAClean™ kit (Beckman Coulter, Inc., Indianapolis, IN, USA). Genogroup detection and quantification were performed using the quantitative real-time RT-PCR (RT-qPCR) method developed by Ogorzaly and Gantzer [45] on either a ViiA™ 7 Real-Time PCR System or a Step One Plus Real-Time PCR System (both from Applied Biosystems®, Life Technologies Inc., Carlsbad, CA, USA). Two modifications were brought to this method with the use of TaqMan® Environmental MasterMix 2.0 (Applied Biosystems®, Life Technologies Inc., Carlsbad, CA, USA) in a final volume of 25 µL. The RNA genomic concentration of each genogroup (gc/100 mL) was determined thanks to standard curves as previously described [4]. For FRNAPH I, II, III and IV, the slopes of the curves were, respectively, −3.49, −3.69, −3.50 and −3.45 with a squared correlation coefficient (R2) of 0.999 for FRNAPH I, II and III and 0.998 for FRNAPH IV. PCR amplification efficiencies were, thus, estimated to be 93, 87, 93 and 95%, respectively. A detection limit of 10 genome copies per RT-qPCR reaction was determined for the four genogroups.

2.4. Statistical Analysis

Data were analysed with the R software, version 4.0.2 [46]. The laboratory uncertainty associated with the results was estimated by error propagation. The outflow from the WWTP was estimated at approximately weekly intervals (when data are available [43]) by dividing the outflow ammonium daily load (kg/day) by the outflow mean daily ammonium concentration (mg/L). The FRNAPH loads from the WWTP were calculated by multiplying the weekly outflows by the average FRNAPH WWTP concentration.
The hysteretic relationships between suspended solids and FRNAPH concentrations with discharge were assessed qualitatively for the sampled events following the procedure described by Williams [47]. Clockwise (positive) hysteresis can be attributed to earlier suspended solids/FRNAPH peak occurrence, either due to suspended solids/FRNAPH increase at the earlier stage of the event or to a rapid decline at the latter stages before the peak discharge. These are normally associated to the liberation of fine solids trapped within the bedload and disturbed by the arrival of the event wave, or to the mobilisation of neighbouring sources. On the other hand, the counterclockwise (negative) hysteresis occurs due to intensive suspended solid increase after the discharge peak. This hysteretic loop is generally associated to the activation of sources that are located further upstream, at the upper part of the slopes.
Spearman correlations were calculated between the log-transformed FRNAPHs measured at Beth, and the hydrological and meteorological variables displayed in Table 1 (function ‘cor’ computing the correlation between each pair of variables using all complete pairs of observations of those variables). The variables presenting a right-skewed distribution were log transformed in order to reach a linear relation between FRNAPH concentrations and the explanatory variables and ensure homogeneity of variance. The non-parametric Mann–Whitney test was applied to determine whether there was a significant difference in the distributions of two groups of data based upon the ranking of scores from both groups using the ‘wilcox.test’ function in R. A regression model to predict log-transformed FRNAPH concentrations from the values of the hydrological and meteorological variables was build using the least squares method and the R package StatDA, version 1.7.4 [48]. A leave-one-out cross-validation was carried out using the ‘caret’ R package [49]. FRNAPH concentrations below the detection limit were not considered in both the correlation and regression analysis. Turbidity, water temperature and conductivity values for the last two events were taken from the turbidity meter.

3. Results

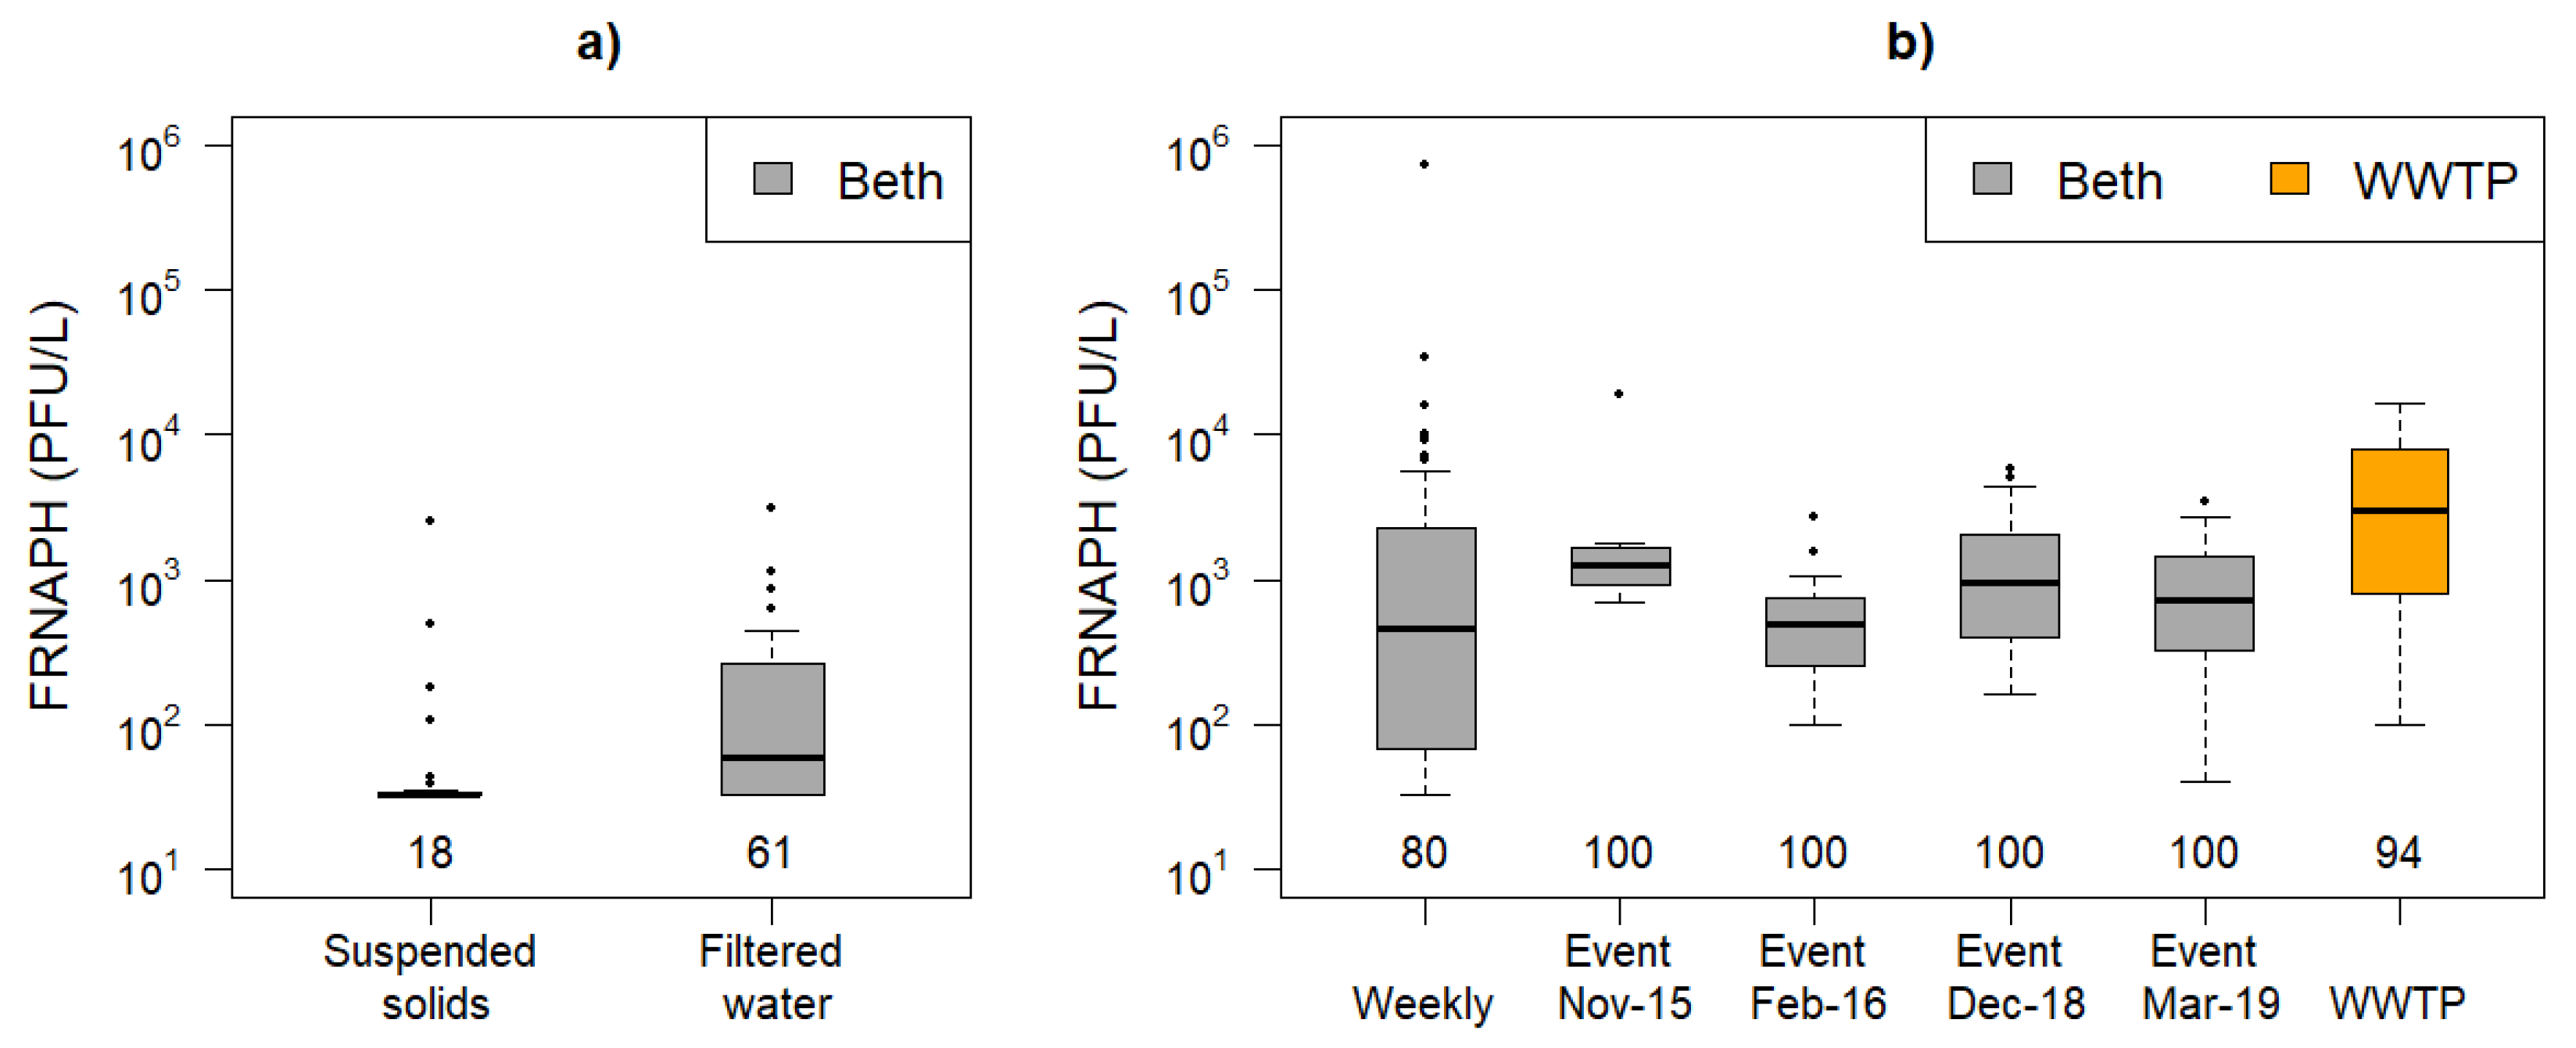
3.1. F-Specific RNA Bacteriophage Concentrations

The levels of FRNAPH contamination in suspended solids were negligible (mean 56.1 PFU/L) and phages were only detected in 18% of the samples. The FRNAPH concentrations in the filtrated water were higher (mean 290.3 PFU/L) and phages were detected in 61% of the samples (Figure 2a). The distributions of FRNAPH concentrations in suspended solids and filtrated water were significantly different (Mann–Whitney test, p < 0.01), whereas the distributions of FRNAPH concentrations in filtrated water and bulk water weekly samples were not significantly different (Mann–Whitney test, p = 0.65; when comparing the same samples collected from February to September 2017).
Figure 2b shows the bulk water FRNAPH concentrations measured during the weekly sampling, the four sampled events and the discharge of the wastewater treatment plant (WWTP). Slightly higher concentrations were measured at the WWTP than at the bulk water weekly samples, showing a minimum impact of the water discharged from the WWTP. The FRNAPH concentrations measured during the four storm runoff events fell within the values measured during the weekly sampling campaign, with the mean event concentrations decreasing as follows: November 2015, December 2018, March 2019 and February 2016 (Figure 2b). When merging all the event measurements, the data distribution was not significantly different than the distribution of the weekly sampling data (Mann–Whitney test, p = 0.086).
The riverbank sediment core data showed that the FRNAPH concentrations were below the detection level at all depths, but some genome copies were detected at the uppermost layer (Table S2 in the Supplementary Material).
The weekly bulk water samples showed seasonality in the FRNAPH concentrations (Figure 3b). These values were higher during late autumn and winter when the air temperature was lower. The suspended solid concentration increased with the river discharge (Spearman rank correlation = 0.33; p < 0.01), reaching a maximum concentration of 131.5 mg/L in June 2016. The FRNAPH and suspended solid concentrations followed the discharge pattern (Spearman rank correlations = 0.60 and 0.33, respectively; p < 0.01), showing no dilution effect during the wet seasons. However, the high river discharge values measured during the largest discharge events (February and June 2016) were poorly sampled.
The results obtained at the storm runoff event scale showed that some events presented clockwise hysteretic loops between the suspended solid concentration and the river discharge, whereas others presented anti-clockwise hysteretic loops (Figure 4). Independently of the hysteretic pattern between the suspended solid concentration and the river discharge, the FRNAPH concentrations always increased at the beginning of the raising limb and decreased before the discharge peak, always resulting in clockwise hysteretic loops. For instance, the event that occurred in November 2015 (Figure 4a) presented an anti-clockwise hysteretic loop between the suspended solid concentration and the river discharge (Figure 4c), but a clockwise loop between the FRNAPH concentrations and the river discharge (Figure 4b). Moreover, when both the suspended solid concentration and the FRNAPH concentrations presented clockwise hysteretic loops, the peak rarely occurred simultaneously (e.g., Figure 4d,j).
The average daily discharge from the WWTP located upstream from the sampling point was estimated to be ≈4800 m3/day (September 2015–August 2017) with an average FRNAPH concentration of ≈4900 PFU/L. The FRNAPH loads from the WWTP remained low along the sampled period (Figure 3c). The FRNAPH concentrations in the bulk water samples collected weekly were slightly lower than those measured in the WWTP (average concentration of ≈10,100 PFU/L), showing a minimum impact of the WWTP effluent contribution to the FRNAPH downstream concentrations.

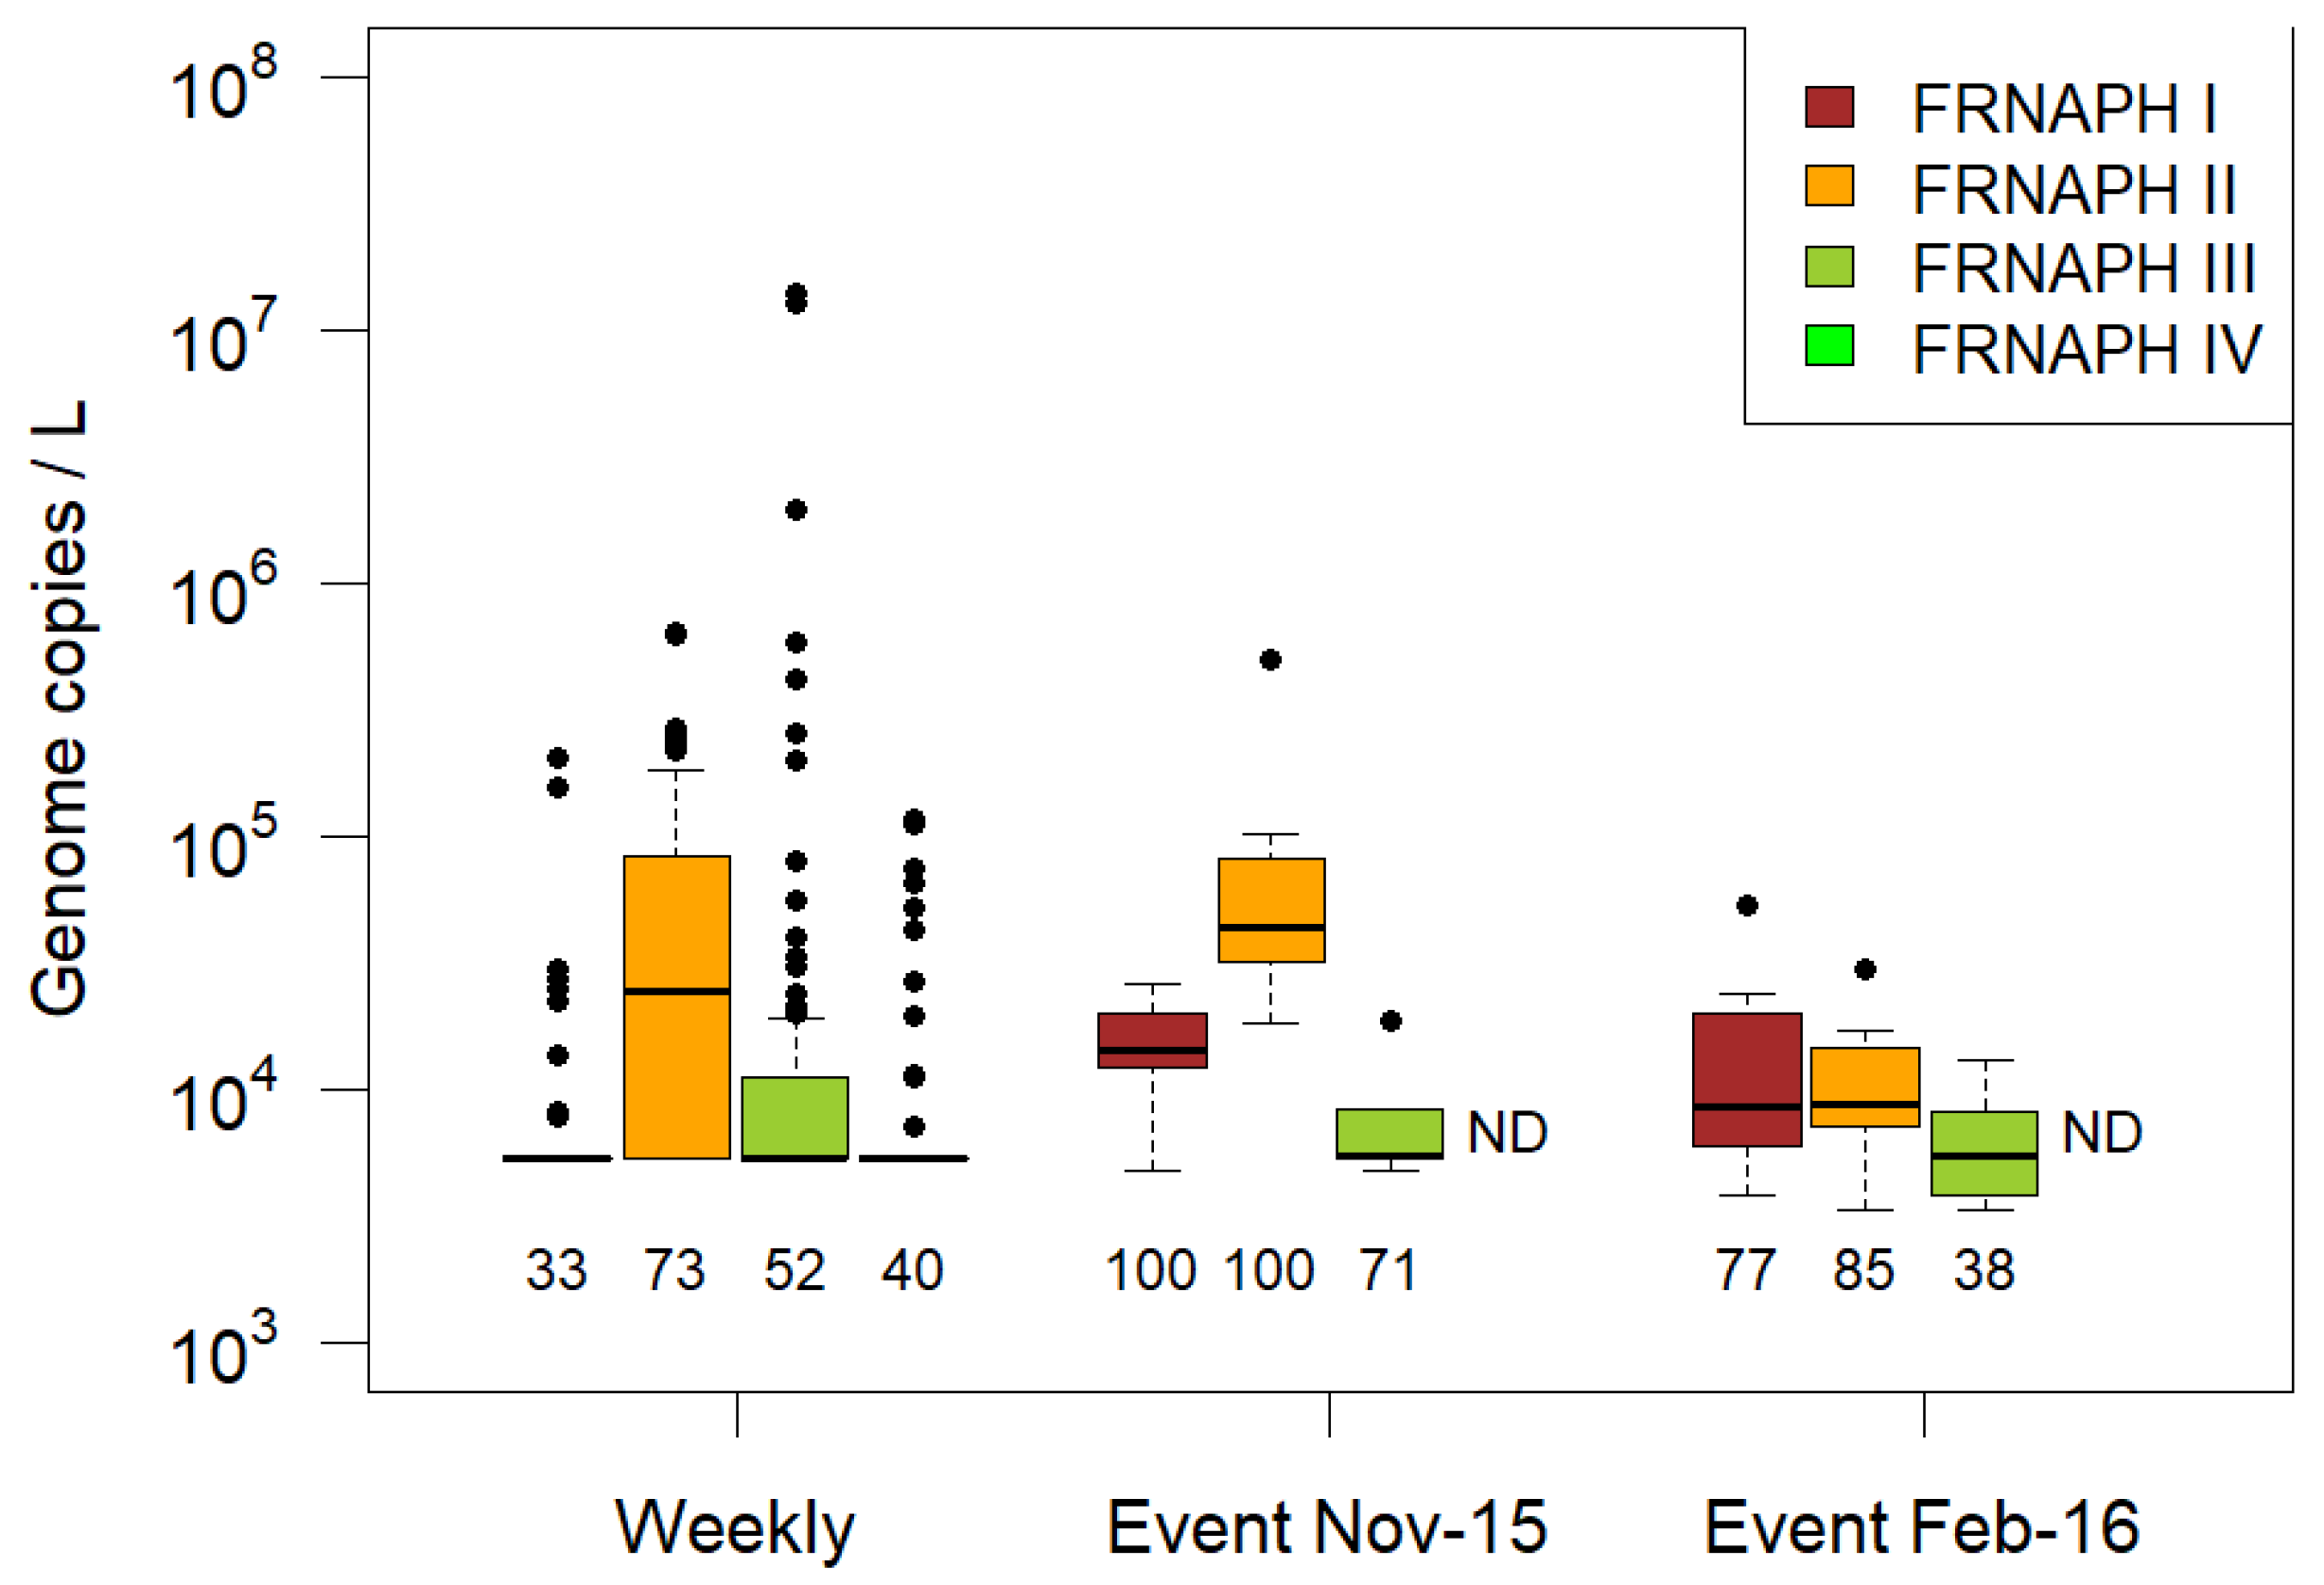
3.2. FRNAPH Genogroups

The genogroup diversity measured during the two first runoff events was larger than for the weekly sampling (Figure 5). In the weekly samples, FRNAPH II was the main genogroup detected, whereas FRNAPH II and FRNAPH I dominated during the runoff events. The concentration of genome copies was larger during the first runoff event that occurred in November 2015 than in the larger runoff event that occurred in February 2016.

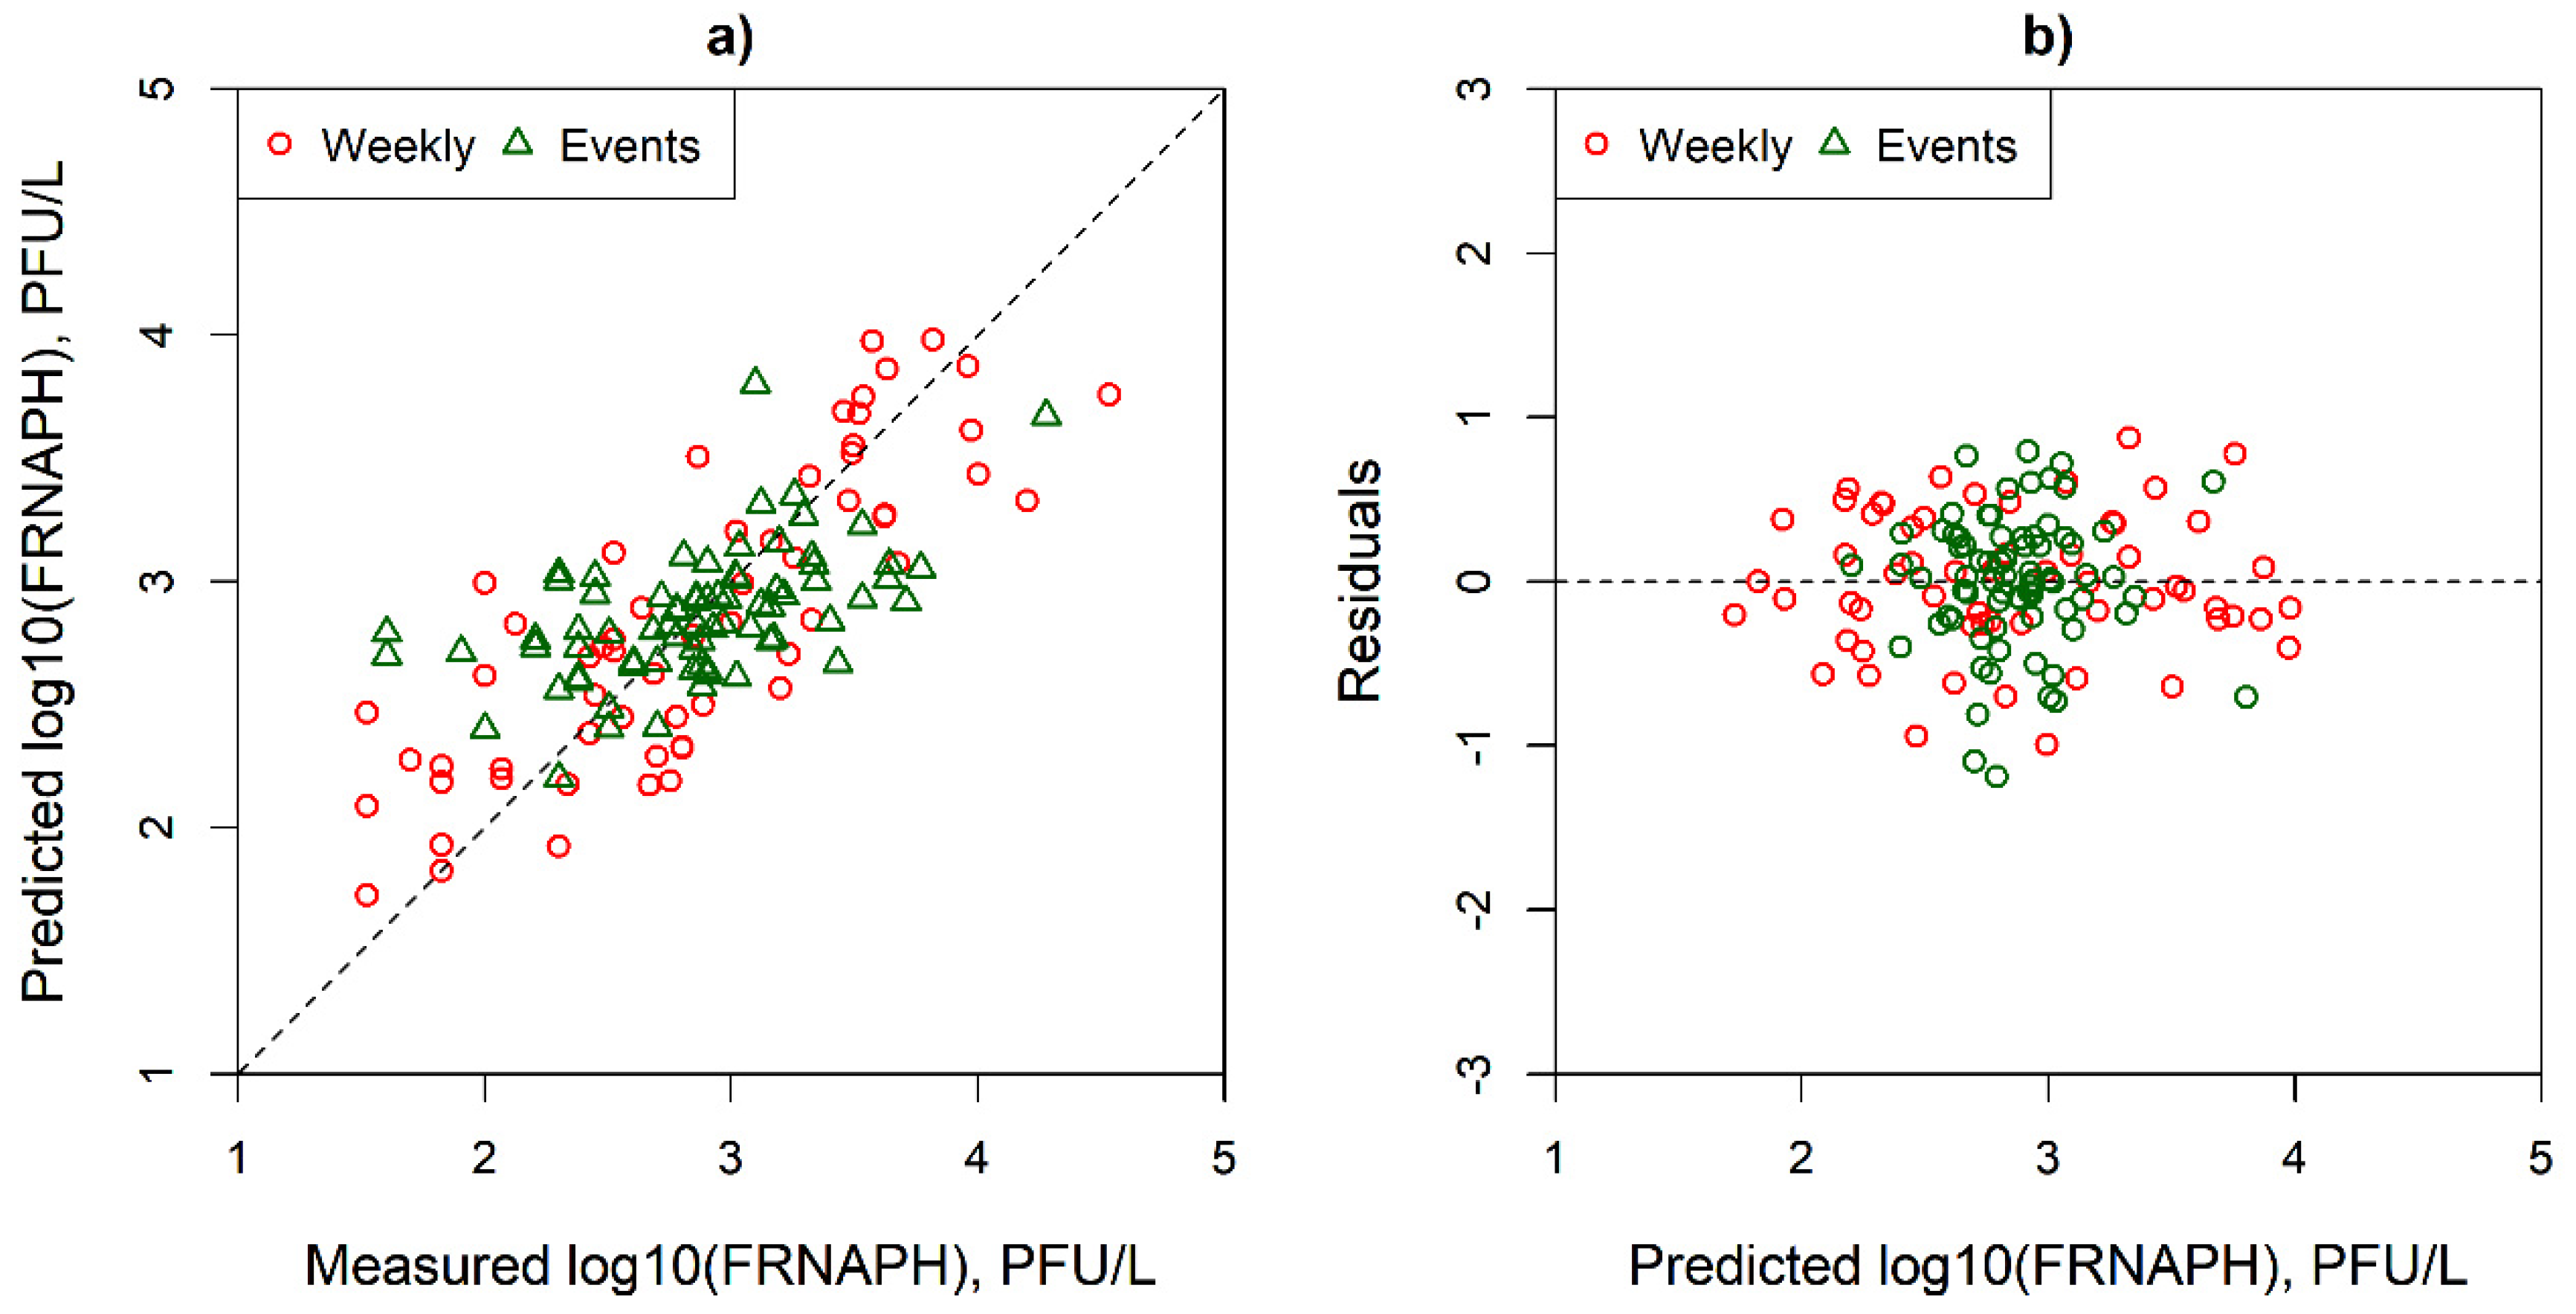
3.3. Simple and Multi Parameter Regression

Simple Spearman correlations between FRNAPH, suspended solid concentration, hydrological and meteorological variables showed contrasting results for the weekly and the runoff events’ sampling campaigns (Table 2). The weekly samples showed that the FRNAPH concentrations were principally correlated with water and air temperature, whereas the correlations with water conductivity, river discharge, solar radiation and turbidity were weaker. On the contrary, the samples collected during the runoff events presented less significant and inverse correlations with turbidity and discharge, and a positive correlation with water conductivity. They also presented very weak correlations with the meteorological variables.
Either the FRNAPH concentrations measured on the weekly or the runoff event samples correlated with the suspended solid concentration. The latest was shown to be significantly correlated with turbidity and, to a lesser extent, water conductivity, antecedent rainfall and discharge.
The quality of the regression models built to predict the log-transformed FRNAPH concentrations measured at both weekly and runoff event time scales using the hydrological and meteorological variables are shown in Table 3. Both models adequately explained the data variability (the associated p-values of the F-statistics do not exceed 0.005). The calculation performed for the weekly values was able to predict 67% of the variance for the measured FRNAPH concentrations. The intercept and solar radiation parameters significantly contributed to this regression model, whereas the log-transformed suspended solid discharge and suspended solid concentrations contributed to a lesser extent. The positive and negative coefficients for the log-transformed river discharge and water temperature, respectively, indicate that the log-transformed FRNAPH concentration increased with the river discharge and decreased with the water temperature. The leave-one-out cross-validation r2 was 0.54. Figure 6a presents a graphical inspection of the fit between the measured and predicted values. The residuals versus the predicted values are shown in Figure 6b, where it is possible to observe that predictions across the range of the explanatory variables were made with similar precision. The residual standard error was 0.46.
The calculation performed with the runoff event dataset (Table 3; Figure 6) was able to predict only 30% of the variance in the measured FRNAPH concentrations. None of the parameters contributed significantly to the model. The residual standard error was of the same order of magnitude (0.43) as it was when predicting the log-transformed FRNAPH concentrations using the weekly dataset. However, the leave-one-out cross-validation r2 value was significantly lower (0.12), showing a very low model performance.

4. Discussion

4.1. Interplay between FRNAPHs and Suspended Solids in the Water Column

In the Orne River (France), FRNAPHs were not found to be transported in association with the predominant suspended solids at low flows. When separating the suspended solids from the water by filtration, FRNAPHs were mainly detected in the filtrated water (Figure 2). Furthermore, low and non-significant correlations were found between the FRNAPH concentrations and turbidity (0.39), and between the FRNAPH concentrations and suspended solid concentrations (0.26), respectively (Table 2).
The association between the FRNAPHs and the suspended solids could not be fully discarded during storm runoff events. As for the weekly sampling, the results showed weak correlations between the FRNAPHs’ concentrations and turbidity (−0.39) and the suspended solid concentrations (−0.24). The low correlations could be associated with the dominant contribution of suspended solid sources containing low or no FRNAPHs, and the bonding of FRNAPHs to particles originating from a source with a minor mass contribution to solid flow could not be discarded. However, a separation of suspended solids from water by filtration was not carried out for the event samples. When doing so, Fauvel et al. [36] reported that the free or bound status of FRNAPHs could be strongly influenced by hydro-meteorological conditions, with a favoured binding at the discharge peak but also, to a certain extent, during the recession limb.
The nature of the suspended solids could also influence the partitioning of infectious FRNAPHs, namely their size and composition. Several studies demonstrated that FRNAPH could be associated with particles ranging from fine to very fine sand [26,50,51]. In addition, the presence of iron-bearing phases in the Orne River sediments associated to steelmaking activities [39] could also explain the low proportion of bound infectious FRNAPHs, since previous studies have shown that the presence of iron oxides can inactivate virus particles [52,53,54]. However, there is no evidence of steel-making sediment remobilisation in the sampling site, and the suspended solids sampled by Kanbar [55] presented iron concentrations similar to those measured upstream of the steelmaking impacted zone.
Finally, the different FRNAPH genogroups have been shown to present different adhesion to suspended solids. In batch experiments performed in river water, sorption to complex environmental solid matrices was detectable for the strains belonging to FRNAPH II, III and IV, but not to FRNAPH I [36]. FRNAPH I showed lower adhesion capabilities compared to FRNAPH II and, to a lesser extent, FRNAPH III and IV [56,57]. Even if FRNAPH II dominated in our site, the results did not suggest adhesion to the suspended solids. A possible explanation could be the unfavourable conditions in the river. The latter authors suggested the importance of salt concentration in the establishment of interaction between FRNAPH and solid surfaces, the decrease in the ionic strength of the solution leading to a reduction in the surface concentration of adhered phages.
During low flows, the FRNAPH concentrations increased during the wet season and decreased during the dry season, being inversely correlated with the air and water temperature (Figure 2; Table 2). The suspended solid concentration followed a different pattern, showing rather low concentrations along the sampling period and higher concentrations during storm runoff events. Decoupling between FRNAPH and suspended solid transport was also observed at the runoff event scale (Figure 3). Both clockwise and counterclockwise hysteretic loops between the suspended solid concentration and the river discharge were observed, but the hysteretic loops between the FRNAPH concentration and the river discharge were always clockwise. Furthermore, when both loops were clockwise, the peaks of the suspended solids and the FRNAPH concentrations were not synchronised in most cases. Our results showed a quicker increase in the FRNAPH concentrations during the runoff raising limbs, which could eventually be explained by two different hypotheses. On the one hand, previous studies reported a greater abundance of faecally derived viruses in the bed sediment than in the overlay water column [58] and a remobilisation of phages bound to riverbed sediments during the hydrograph raising limb [4]. However, in this section of the Orne River, fine sediment deposits in the riverbed were not evidenced and phages were solely detected in a very low concentration in the first centimetres (1–3 cm) of the riverbank sediment core (Table S2 in the Supplementary Material). Further, a systematic increase in the suspended solid concentrations before discharge peaks was not observed. Hence, the increase in FRNAPH during the raising limb could be explained by the activation of FRNAPH sources in the vicinity of the sampling site. A WWTP origin of FRNAPH was discarded, as evidence showed the limited influence of the upstream WWTP (Figure 3c), but as the sewage network is mainly unitary, one could think about a first flush originating at the collectors themselves due to sewer overflows. This hypothesis is difficult to address with the genogroup data, because, despite the fact that FRNAPH genogroup II was the most abundant during the first event (Figure 4) [5], both genogroups FRNAPH II (rather human origin) and I (rather animal origin) presented similar abundance during the second event.
Using the same protocol, Fauvel et al. [36] found a phage-solid association during the peak of rainfall runoff events, but also to a certain extent during the recession phase compared to low flow conditions. The authors also found that infectious genogroup II was more abundant in riverbed sediments than in surface water. None of these features were observed in the Orne River. However, both sites are different in terms of geology, land use and anthropogenic influences. Fauvel et al.’s [36] site received the water of a smaller and more urbanised area, and was influenced by four WWTPs located in the 10 km stretch upstream from the sampling site. We hypothesise that these factors could result in different water pH, ionic strength and a different charge/hydrophobicity of both the suspended solids and phages [56,57]. Suspended solids are composed of a complex matrix of microbial communities, organic and mineral particles [59] and, as argued by Fauvel et al. [26], it is difficult to elucidate the interaction mechanisms between suspended solids, viruses and the heterogeneous environmental matrix, which are in a continuous state of change and are affected by site-specific hydrodynamics conditions. Future research is needed in this respect.

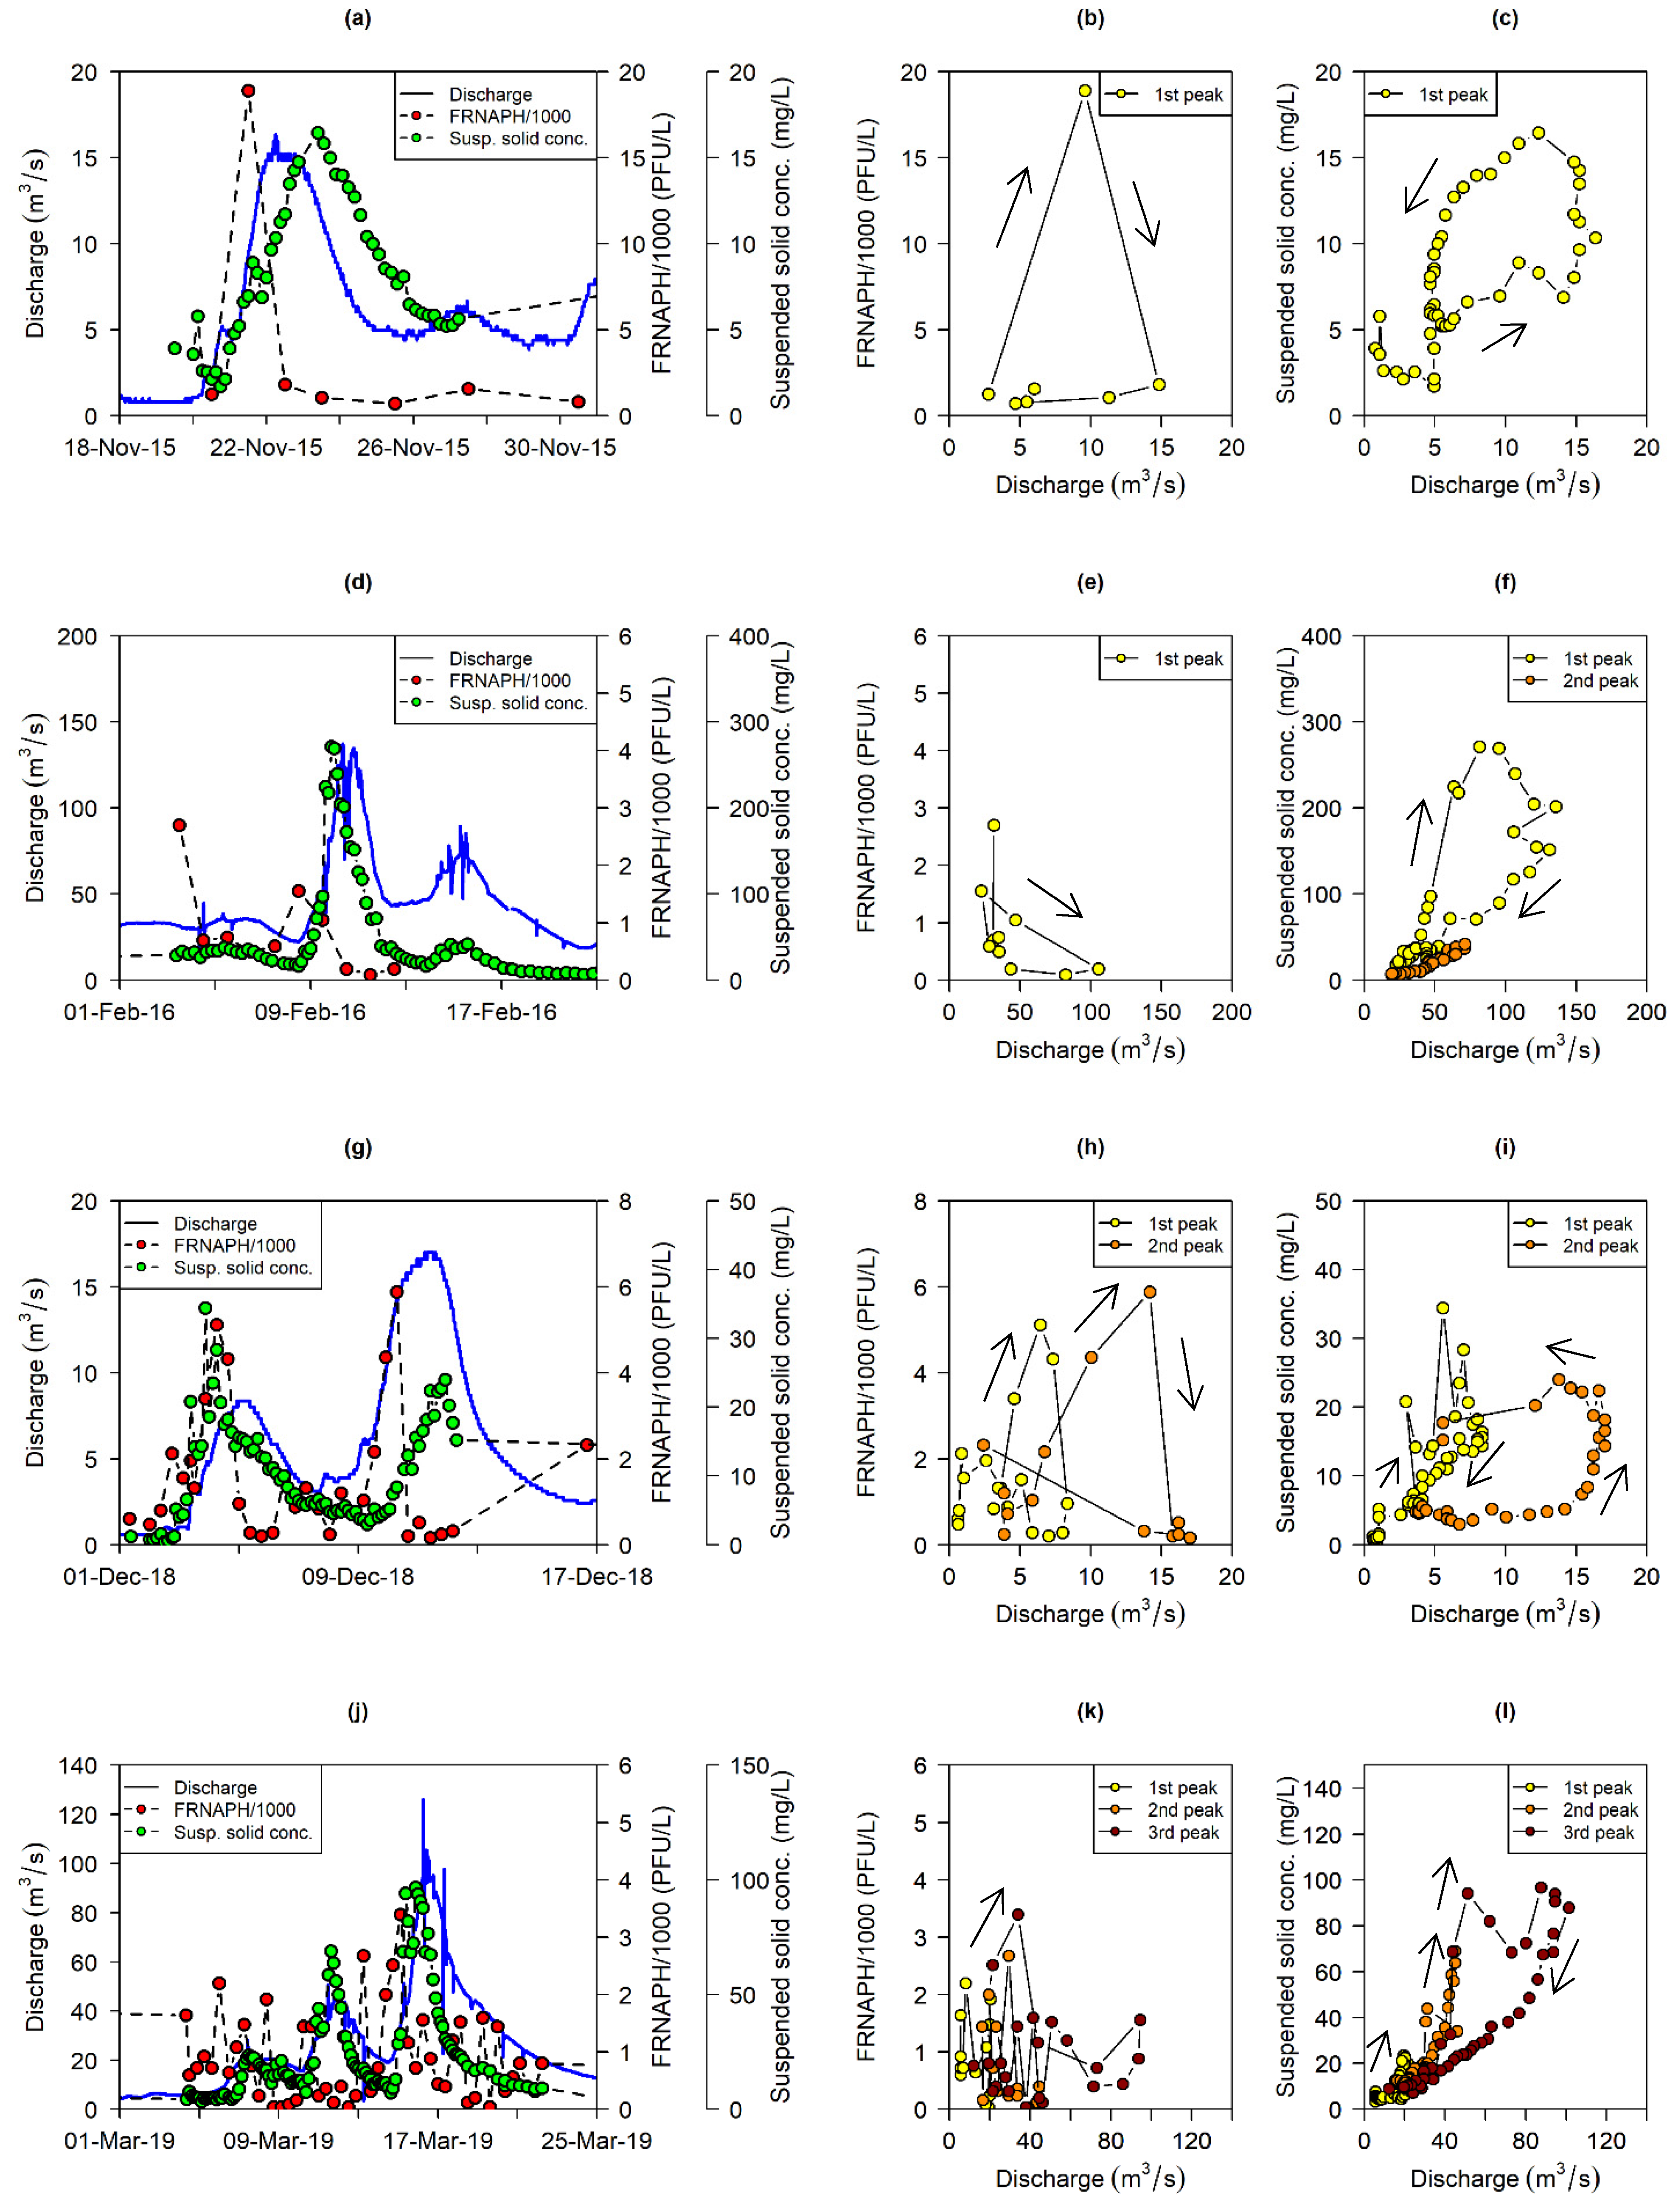
4.2. FRNAPH Controlling Factors at Low Flows and during Storm Runoff Events

Different hydro-meteorological factors affected the FRNAPH concentration at two complementary time scales in the Orne River. The FRNAPH concentration measured weekly over two years correlated to water and air temperature, whereas the runoff event-based measurements correlated with turbidity, water conductivity and river discharge (Table 2). Similarly, different factors contributed significantly to the regression models to predict log-transformed FRNAPH concentrations at both time scales (Table 3). The most significant predictions were obtained for the weekly dataset (Figure 6), demonstrating their capability for FRNAPH concentration modelling. However, the regression model using storm runoff data showed a rather low performance when using a leave-one-out cross-validation approach.
As our results showed a decoupling between the FRNAPH and the suspended solid concentrations, we modelled the total concentrations of phages in the water column. As argued by de Brauwere et al. [38], there is no evidence of different sanitary risk whether a bacterial faecal indicator is attached to particles in the water column or not, and water quality standards are expressed in terms of total concentration. The same applies for viral indicators when discussing the sanitary risk in terms of exposure. However, if the attachment to suspended solids was to be necessary for the viruses to settle in the riverbed, the absence of interaction would limit the formation of viral reservoirs in the settled sediments and, thus, decrease the risk associated to the remobilisation of the sediment-associated viruses.
The model results should be carefully considered before being applied in prediction mode because concentrations and environmental parameters are known to present a non-stationary behaviour for a given study site and might significantly change over time. Similarly, the modelling of FRNAPH fate and transport remains to be further explored as an in-depth understanding of the processes taking place in river systems is still missing. In some locations, such as the Orne River, where the FRNAPH concentrations are decoupled from the suspended solid transport, it is not easy to take advantage of suspended solid transport models to predict phage dynamics in surface water. Furthermore, a mechanistic understanding of the mobilisation process of FRNAPHs at the beginning of storm events and their origin is also missing.
Our study highlights the relevance of combining different sampling strategies, targeting runoff events on one hand to decipher the water and particle contributions to the running waters, and developing systematic sampling on the other hand to obtain global tendencies and a better understanding of the whole process. We could also show the importance of long-term monitoring on several hydrological years to better understand phage dynamics, which would also be necessary to investigate long term trends.

Supplementary Materials

The following are available online at https://www.mdpi.com/article/10.3390/w13162250/s1, Table S1: “Cross section variability of suspended solids and F-specific RNA bacteriophage (FRNAPH; limit of detection, LOD = 0.05 PFU/L) concentrations during three sampling days (03/03/2015, 11/03/2015 and 30/03/2015) at the Orne at Beth sampling site”, and Table S2: “F-specific RNA bacteriophage (FRNAPH) concentrations (limit of detection, LOD = 4 PFU/mL) and concentration of genome copies of FRNAPH I, II, III and IV (positive but not quantifiable, NQ) measured in the river bank sediment core (§Section 2.2)”.

Author Contributions

Conceptualisation: N.M.-C., L.O. and C.H.; installation of field equipment: J.-F.I.; sampling: N.M.-C., L.O., C.W., C.M., E.M.-P. and J.-F.I.; FRNAPH protocols and FRNAPH data acquisition: L.O., C.W., C.M. and C.G.; other laboratory work: N.M.-C., E.M.-P. and C.H.; data treatment: N.M.-C. and L.O.; writing—original draft preparation: N.M.-C., L.O. and C.H.; writing—review and editing: N.M.-C., L.O., C.W., C.M., E.M.-P., C.G., J.-F.I., H.-M.C. and C.H.; funding acquisition and project administration: C.H. and E.M.-P. All authors have read and agreed to the published version of the manuscript.

Funding

This research was mainly funded by the Luxembourg National Research Fund (FNR) and the French National Research Agency (ANR-14-CE01-0019) in the framework of the FNR INTER ANR research program (contract no. INTER/ANR/13/9441502). The Long-Term Ecosystem Research (LTER) France, the Water Agency Rhin-Meuse and the Region Lorraine through the research network of the Zone Atelier Moselle (ZAM) partially funded this work.

Institutional Review Board Statement

Not applicable.

Informed Consent Statement

Not applicable.

Data Availability Statement

All the data used in the manuscript will be made available on the data repository ORDAR (Research Data Repository of the ‘Observatory Earth Environment of Lorraine’), including (i) discharge data, (ii) phage data (weekly and storm runoff events sampling), (iii) genome data (weekly and storm runoff events sampling), (iv) suspended solid concentration, turbidity, temperature data (weekly and storm runoff events sampling), (v) cross-section phage and suspended solid concentration data, (vi) in situ turbidity and temperature measurements, and (vii) core phage and genogroup data. Rainfall, air temperature and solar radiation data can be made available by Météo France upon request (https://publitheque.meteo.fr, accessed on 30 June 2021). Wastewater treatment plant data can be downloaded from the Water Information System Rhine-Meuse (https://rhin-meuse.eaufrance.fr/?lang=en, accessed on 30 June 2021).

Acknowledgments

The authors acknowledge feedback from all the members of the MOBSIED project team (https://mobised.liec.univ-lorraine.fr). Jérôme Juilleret, Cyrille Taillez and Jérémy Lepesqueur are acknowledged for their help with field equipment and sampling. We also acknowledge the valuable assistance from Romain Rivet, Remi Leblay, Delphine Collard and Magalie Labbe for sampling and FRNAPH and genogroup analysis; from Laurence Mansuy-Huault, Hussein Kanbar, Allan Bauer, Patrick Billard and Benoit Losson for carrying out the core sampling; and from Allan Bauer, Renaud Gley, Mathieu Le Meur and Laurence Mansuy-Huault for carrying out the sampling of the first and second events. Luc Manceau, Benoit Losson and Allan Bauer are acknowledged for installing the water level sensor and generating the discharge data. Météo France is also acknowledged for providing rainfall, air temperature and solar radiation data. The authors specially thank their funding agencies: the Luxembourg National Research Fund (FNR), the French National Research Agency (ANR) and the research network of the Zone Atelier Moselle (ZAM).

Conflicts of Interest

The authors declare no conflict of interest. The funders had no role in the design of the study; in the collection, analyses, or interpretation of data; in the writing of the manuscript, or in the decision to publish the results.

References

  1. Sano, D.; Amarasiri, M.; Hata, A.; Watanabe, T.; Katayama, H. Risk management of viral infectious diseases in wastewater reclamation and reuse: Review. Environ. Int. 2016, 91, 220–229. [Google Scholar] [CrossRef] [Green Version]
  2. Fong, T.-T.; Lipp, E.K. Enteric Viruses of Humans and Animals in Aquatic Environments: Health Risks, Detection, and Potential Water Quality Assessment Tools. Microbiol. Mol. Biol. Rev. 2005, 69, 357–371. [Google Scholar] [CrossRef] [Green Version]
  3. Rodríguez, R.A.; Gundy, P.M.; Rijal, G.K.; Gerba, C.P. The Impact of Combined Sewage Overflows on the Viral Contamination of Receiving Waters. Food Environ. Virol. 2012, 4, 34–40. [Google Scholar] [CrossRef] [PubMed]
  4. Fauvel, B.; Cauchie, H.M.; Gantzer, C.; Ogorzaly, L. Contribution of hydrological data to the understanding of the spatio-temporal dynamics of F-specific RNA bacteriophages in river water during rainfall-runoff events. Water Res. 2016, 94, 328–340. [Google Scholar] [CrossRef] [PubMed]
  5. Ogorzaly, L.; Tissier, A.; Bertrand, I.; Maul, A.; Gantzer, C. Relationship between F-specific RNA phage genogroups, faecal pollution indicators and human adenoviruses in river water. Water Res. 2009, 43, 1257–1264. [Google Scholar] [CrossRef] [PubMed]
  6. Hassard, F.; Gwyther, C.L.; Farkas, K.; Andrews, A.; Jones, V.; Cox, B.; Brett, H.; Jones, D.L.; McDonald, J.E.; Malham, S.K. Abundance and Distribution of Enteric Bacteria and Viruses in Coastal and Estuarine Sediments—A Review. Front. Microbiol. 2016, 7, 1692. [Google Scholar] [CrossRef] [PubMed] [Green Version]
  7. Savichtcheva, O.; Okabe, S. Alternative indicators of fecal pollution: Relations with pathogens and conventional indicators, current methodologies for direct pathogen monitoring and future application perspectives. Water Res. 2006, 40, 2463–2476. [Google Scholar] [CrossRef] [PubMed]
  8. Jofre, J.; Lucena, F.; Blanch, A.R. Coliphages as a Complementary Tool to Improve the Management of Urban Wastewater Treatments and Minimize Health Risks in Receiving Waters. Water 2021, 13, 1110. [Google Scholar] [CrossRef]
  9. Directive 2020/2184. Directive (EU) 2020/2184 of the European Parliament and of the Council of 16 December 2020 on the quality of intended water for human consumption. Off. J. Eur. Communities 2020, 435, 1–62. [Google Scholar]
  10. 2020/741 Regulation (EU). European Parliament and of the Council of 25 May 2020 on minimum requirements for water reuse. Off. J. Eur. Union 2020, 177, 32–55. [Google Scholar]
  11. Field, K.G.; Samadpour, M. Fecal source tracking, the indicator paradigm, and managing water quality. Water Res. 2007, 41, 3517–3538. [Google Scholar] [CrossRef] [PubMed]
  12. Mauffret, A.; Caprais, M.-P.; Gourmelon, M. Relevance of Bacteroidales and F-Specific RNA Bacteriophages for Efficient Fecal Contamination Tracking at the Level of a Catchment in France. Appl. Environ. Microbiol. 2012, 78, 5143–5152. [Google Scholar] [CrossRef] [PubMed] [Green Version]
  13. McMinn, B.R.; Ashbolt, N.J.; Korajkic, A. Bacteriophages as indicators of faecal pollution and enteric virus removal. Lett. Appl. Microbiol. 2017, 65, 11–26. [Google Scholar] [CrossRef] [PubMed] [Green Version]
  14. Muniesa, M.; Jofre, J. Factors influencing the replication of somatic coliphages in the water environment. Antonie Van Leeuwenhoek 2004, 86, 65–76. [Google Scholar] [CrossRef] [PubMed]
  15. Jofre, J. Is the replication of somatic coliphages in water environments significant? J. Appl. Microbiol. 2009, 106, 1059–1069. [Google Scholar] [CrossRef]
  16. Bollback, J.P.; Huelsenbeck, J.P. Phylogeny, Genome Evolution, and Host Specificity of Single-Stranded RNA Bacteriophage (Family Leviviridae). J. Mol. Evol. 2001, 52, 117–128. [Google Scholar] [CrossRef] [PubMed]
  17. Cole, D.; Long, S.C.; Sobsey, M.D. Evaluation of F+ RNA and DNA Coliphages as Source-Specific Indicators of Fecal Contamination in Surface Waters. Appl. Environ. Microbiol. 2003, 69, 6507–6514. [Google Scholar] [CrossRef] [Green Version]
  18. Hartard, C.; Banas, S.; Loutreul, J.; Rincé, A.; Benoit, F.; Boudaud, N.; Gantzer, C. Relevance of F-Specific RNA Bacteriophages in Assessing Human Norovirus Risk in Shellfish and Environmental Waters. Appl. Environ. Microbiol. 2016, 82, 5709–5719. [Google Scholar] [CrossRef] [Green Version]
  19. Bertrand, I.; Schijven, J.F.; Sánchez, G.; Wyn-Jones, P.; Ottoson, J.; Morin, T.; Muscillo, M.; Verani, M.; Nasser, A.; de Roda Husman, A.M.; et al. The impact of temperature on the inactivation of enteric viruses in food and water: A review. J. Appl. Microbiol. 2012, 112, 1059–1074. [Google Scholar] [CrossRef]
  20. Boehm, A.B.; Silverman, A.I.; Schriewer, A.; Goodwin, K. Systematic review and meta-analysis of decay rates of waterborne mammalian viruses and coliphages in surface waters. Water Res. 2019, 164, 114898. [Google Scholar] [CrossRef]
  21. Rajala, R.L.; Heinonen-Tanski, H. Survival and transfer of faecal indicator organisms of wastewater effluents in receiving lake waters. Water Sci. Technol. 1998, 38, 191–194. [Google Scholar] [CrossRef]
  22. Westrell, T.; Teunis, P.; van den Berg, H.; Lodder, W.; Ketelaars, H.; Stenström, T.A.; de Roda Husman, A.M. Short- and long-term variations of norovirus concentrations in the Meuse river during a 2-year study period. Water Res. 2006, 40, 2613–2620. [Google Scholar] [CrossRef] [PubMed] [Green Version]
  23. Fauvel, B.; Gantzer, C.; Cauchie, H.M.; Ogorzaly, L. In Situ Dynamics of F-Specific RNA Bacteriophages in a Small River: New Way to Assess Viral Propagation in Water Quality Studies. Food Environ. Virol. 2017, 9, 89–102. [Google Scholar] [CrossRef] [Green Version]
  24. Skraber, S.; Gassilloud, B.; Gantzer, C. Comparison of Coliforms and Coliphages as Tools for Assessment of Viral Contamination in River Water. Appl. Environ. Microbiol. 2004, 70, 3644–3649. [Google Scholar] [CrossRef] [PubMed] [Green Version]
  25. Skraber, S.; Schijven, J.; Italiaander, R.; Husman, A.M.d.R. Accumulation of enteric bacteriophage in fresh water sediments. J. Water Health 2009, 7, 372–379. [Google Scholar] [CrossRef] [Green Version]
  26. Fauvel, B.; Cauchie, H.-M.; Gantzer, C.; Ogorzaly, L. Influence of physico-chemical characteristics of sediment on the in situ spatial distribution of F-specific RNA phages in the riverbed. FEMS Microbiol. Ecol. 2019, 95, fiy240. [Google Scholar] [CrossRef]
  27. Mackowiak, M.; Leifels, M.; Hamza, I.A.; Jurzik, L.; Wingender, J. Distribution of Escherichia coli, coliphages and enteric viruses in water, epilithic biofilms and sediments of an urban river in Germany. Sci. Total Environ. 2018, 626, 650–659. [Google Scholar] [CrossRef]
  28. Templeton, M.R.; Andrews, R.C.; Hofmann, R. Inactivation of particle-associated viral surrogates by ultraviolet light. Water Res. 2005, 39, 3487–3500. [Google Scholar] [CrossRef]
  29. Bradford, S.A.; Tadassa, Y.F.; Jin, Y. Transport of Coliphage in the Presence and Absence of Manure Suspension. J. Environ. Qual. 2006, 35, 1692–1701. [Google Scholar] [CrossRef]
  30. Martín-Díaz, J.; Lucena, F.; Blanch, A.R.; Jofre, J. Review: Indicator bacteriophages in sludge, biosolids, sediments and soils. Environ. Res. 2020, 182, 109133. [Google Scholar] [CrossRef]
  31. Kay, D.; Edwards, A.C.; Ferrier, R.C.; Francis, C.; Kay, C.; Rushby, L.; Watkins, J.; McDonald, A.T.; Wyer, M.; Crowther, J.; et al. Catchment microbial dynamics: The emergence of a research agenda. Prog. Phys. Geogr. Earth Environ. 2007, 31, 59–76. [Google Scholar] [CrossRef]
  32. Cho, K.H.; Pachepsky, Y.A.; Oliver, D.M.; Muirhead, R.W.; Park, Y.; Quilliam, R.S.; Shelton, D.R. Modeling fate and transport of fecally-derived microorganisms at the watershed scale: State of the science and future opportunities. Water Res. 2016, 100, 38–56. [Google Scholar] [CrossRef]
  33. Kim, M.; Boithias, L.; Cho, K.H.; Silvera, N.; Thammahacksa, C.; Latsachack, K.; Rochelle-Newall, E.; Sengtaheuanghoung, O.; Pierret, A.; Pachepsky, Y.A.; et al. Hydrological modeling of Fecal Indicator Bacteria in a tropical mountain catchment. Water Res. 2017, 119, 102–113. [Google Scholar] [CrossRef] [PubMed]
  34. Islam, M.M.M.; Sokolova, E.; Hofstra, N. Modelling of river faecal indicator bacteria dynamics as a basis for faecal contamination reduction. J. Hydrol. 2018, 563, 1000–1008. [Google Scholar] [CrossRef]
  35. Dorner, S.M.; Anderson, W.B.; Slawson, R.M.; Kouwen, N.; Huck, P.M. Hydrologic Modeling of Pathogen Fate and Transport. Environ. Sci. Technol. 2006, 40, 4746–4753. [Google Scholar] [CrossRef] [PubMed]
  36. Fauvel, B.; Ogorzaly, L.; Cauchie, H.M.; Gantzer, C. Interactions of infectious F-specific RNA bacteriophages with suspended matter and sediment: Towards an understanding of FRNAPH distribution in a river water system. Sci. Total Environ. 2017, 574, 960–968. [Google Scholar] [CrossRef] [PubMed] [Green Version]
  37. Demeter, K.; Derx, J.; Komma, J.; Parajka, J.; Schijven, J.; Sommer, R.; Cervero-Aragó, S.; Linder, G.; Zoufal-Hruza, C.M.; Linke, R.; et al. Modelling the interplay of future changes and wastewater management measures on the microbiological river water quality considering safe drinking water production. Sci. Total Environ. 2021, 768, 144278. [Google Scholar] [CrossRef] [PubMed]
  38. de Brauwere, A.; Ouattara, N.K.; Servais, P. Modeling Fecal Indicator Bacteria Concentrations in Natural Surface Waters: A Review. Crit. Rev. Environ. Sci. Technol. 2014, 44, 380–2453. [Google Scholar] [CrossRef] [Green Version]
  39. Kanbar, H.J.; Montargès-Pelletier, E.; Losson, B.; Bihannic, I.; Gley, R.; Bauer, A.; Villieras, F.; Manceau, L.; El Samrani, A.G.; Kazpard, V.; et al. Iron mineralogy as a fingerprint of former steelmaking activities in river sediments. Sci. Total. Environ. 2017, 599–600, 540–553. [Google Scholar] [CrossRef]
  40. Garcier, R.J. Rivers we can’t bring ourselves to clean–historical insights into the pollution of the Moselle River (France), 1850–2000. Hydrol. Earth Syst. Sci. 2007, 11, 1731–1745. [Google Scholar] [CrossRef] [Green Version]
  41. Losson, B.; Manceau, L.; Kanbar, H.J.; Waldvogel, Y.; Delus, C.; Mansuy-Huault, L.; Hissler, C.; Montargès-Pelletier, E. Orne River hydrodynamic and effect on sediment transport in the backwater zone of the Beth Dam (Lorraine, France). Géomorphol. Relief Process. Environ. 2020, 1, 3–17. [Google Scholar] [CrossRef]
  42. Lepesqueur, J.; Hostache, R.; Martínez-Carreras, N.; Montargès-Pelletier, E.; Hissler, C. Sediment transport modelling in riverine environments: On the importance of grain-size distribution, sediment density, and suspended sediment concentrations at the upstream boundary. Hydrol. Earth Syst. Sci. 2019, 23, 3901–3915. [Google Scholar] [CrossRef] [Green Version]
  43. The Water Information System Rhine-Meuse. Available online: https://rhin-meuse.eaufrance.fr (accessed on 30 June 2021).
  44. Skraber, S.; Langlet, J.; Kremer, J.R.; Mossong, J.; De Landtsheer, S.; Even, J.; Muller, C.P.; Hoffmann, L.; Cauchie, H.-M. Concentration and Diversity of Noroviruses Detected in Luxembourg Wastewaters in 2008–2009. Appl. Environ. Microbiol. 2011, 77, 5566–5568. [Google Scholar] [CrossRef] [PubMed] [Green Version]
  45. Ogorzaly, L.; Gantzer, C. Development of real-time RT-PCR methods for specific detection of F-specific RNA bacteriophage genogroups: Application to urban raw wastewater. J. Virol. Methods 2006, 138, 131–139. [Google Scholar] [CrossRef]
  46. R Core Team. R: A Language and Environment for Statistical Computing; R Foundation for Statistical Computing: Vienna, Austria, 2020. [Google Scholar]
  47. Williams, G.P. Sediment concentration versus water discharge during single hydrologic events in rivers. J. Hydrol. 1989, 111, 89–106. [Google Scholar] [CrossRef]
  48. Reimann, C.; Filzmoser, P.; Garrett, R.G.; Dutter, R. Statistical Data Analysis Explained: Applied Environmental Statistics with R; John Wiley & Sons, Ltd.: Hoboken, NJ, USA, 2008. [Google Scholar]
  49. Kuhn, M. Building Predictive Models in R Using the caret Package. J. Stat. Softw. 2008, 28, 1–26. [Google Scholar] [CrossRef] [Green Version]
  50. Knappett, P.S.K.; Emelko, M.B.; Zhuang, J.; McKay, L.D. Transport and retention of a bacteriophage and microspheres in saturated, angular porous media: Effects of ionic strength and grain size. Water Res. 2008, 42, 4368–4378. [Google Scholar] [CrossRef] [PubMed]
  51. Treumann, S.; Torkzaban, S.; Bradford, S.A.; Visalakshan, R.M.; Page, D. An explanation for differences in the process of colloid adsorption in batch and column studies. J. Contam. Hydrol. 2014, 164, 219–229. [Google Scholar] [CrossRef]
  52. Chu, Y.; Jin, Y.; Yates, M.V. Virus Transport through Saturated Sand Columns as Affected by Different Buffer Solutions. J. Environ. Qual. 2000, 29, 1103–1110. [Google Scholar] [CrossRef]
  53. Schijven, J.F.; Hassanizadeh, S.M. Removal of Viruses by Soil Passage: Overview of Modeling, Processes, and Parameters. Crit. Rev. Environ. Sci. Technol. 2000, 30, 49–127. [Google Scholar] [CrossRef]
  54. Zhuang, J.; Jin, Y. Interactions between viruses and goethite during saturated flow: Effects of solution pH, carbonate, and phosphate. J. Contam. Hydrol. 2008, 98, 15–21. [Google Scholar] [CrossRef] [PubMed]
  55. Kanbar, H.J. What the Orne River Tells about the Former Steelmaking Activities: Chemical and Mineralogical Investigations on Sediment. Ph.D. Thesis, Université de Lorraine, Vandoeuvre-les-Nancy, France, en Cotutelle avec l’Université Libanaise, Beirut, Liban, 2017. [Google Scholar]
  56. Dika, C.; Ly-Chatain, M.H.; Francius, G.; Duval, J.F.L.; Gantzer, C. Non-DLVO adhesion of F-specific RNA bacteriophages to abiotic surfaces: Importance of surface roughness, hydrophobic and electrostatic interactions. Colloids Surf. A Physicochem. Eng. Asp. 2013, 435, 178–187. [Google Scholar] [CrossRef]
  57. Langlet, J.; Gaboriaud, F.; Duval, J.F.L.; Gantzer, C. Aggregation and surface properties of F-specific RNA phages: Implication for membrane filtration processes. Water Res. 2008, 42, 2769–2777. [Google Scholar] [CrossRef] [PubMed]
  58. Maranger, R.; Bird, D.F. High concentrations of viruses in the sediments of Lac Gilbert, Québec. Microb. Ecol. 1996, 31, 141–151. [Google Scholar] [CrossRef] [PubMed]
  59. Droppo, I.G. Rethinking what constitutes suspended sediment. Hydrol. Process. 2001, 15, 1551–1564. [Google Scholar] [CrossRef]
Figure 1. Land use map of the Orne River basin at the Beth sampling site. Location of the meteorological station (Météo France, Aéroport M.N.L.) and sampled wastewater treatment plant (WWTP). Source land use map: European Environment Agency-Corine Land Cover 2018. Catchment and river network delineated using the digital elevation model MNT BD ALTI® (Source: National Institute of Geographic and Forest Information (IGN-F), France) and the program ArcGIS 10.5.
Water 13 02250 g001
Figure 2. Box plot representation of the F-specific RNA bacteriophage (FRNAPH) concentrations in the Orne River at the Beth sampling location (a) in the suspended solids and filtrated water collected during the weekly campaign from February to September 2017 (n = 28; LOQ = 33 PFU/L) and (b) in the bulk water samples collected during the weekly campaign (n = 91; LOQ = 33 PFU/L), and the four runoff events that occurred during November 2015 (n = 7; LOQ = 50 PFU/L), February 2016 (n = 13; LOQ = 50 PFU/L), December 2018 (n = 31; LOQ = 33 PFU/L) and March 2019 (n = 50; LOQ = 33 PFU/L), and in the effluent of the wastewater treatment plant (WWTP) at irregular intervals from December 2018 to March 2019 (n = 17; LOQ = 100 PFU/L). Numbers below the boxes indicate % of samples from which FRNAPH were detected.
Water 13 02250 g002
Figure 3. (a) Solar radiation, air temperature and rainfall measured at the Méteo France station Aéroport M.N.L., (b) river discharge, weekly F-specific RNA bacteriophage (FRNAPH) and suspended solid concentrations in the Orne River basin recorded at the Beth sampling site. The green shadows represent the 95% confidence interval for the FRNAPH measurements. The dashed grey horizontal line shows the FRNAPH limit of quantification. (c) Suspended solid and FRNAPH fluxes at Beth and FRNAPH flux from the wastewater treatment plant (WWTP) located 0.9 km upstream.
Water 13 02250 g003
Figure 4. River discharge (Q), F-specific RNA bacteriophage concentrations (FRNAPH) and suspended solid concentration measured during the four runoff events in (a) November 2015, (d) February 2016, (g) December 2018 and (j) March 2019. For each runoff event, relationship between river discharge and FRNAPHs concentrations (b,e,h,k), and between discharge and suspended solid concentrations (c,f,i,l).
Water 13 02250 g004
Figure 5. Concentration of genome copies of F-specific RNA bacteriophage (FRNAPH) I, II, III and IV measured in the weekly samples and during the storm runoff events occurring in November 2015 and February 2016. The genogroup FRNAPH IV was not measured in the samples collected during the runoff events. Numbers below the boxes indicate % of samples from which genome copies were detected.
Water 13 02250 g005
Figure 6. (a) Scatter plot between the measured and predicted log-transformed FRNAPH concentrations, and (b) the residuals versus predicted log-transformed FRNAPH concentrations from the hydrological and meteorological variables for the weekly and event datasets.
Water 13 02250 g006
Table 1. Hydrological and meteorological variables.
GroupVariable DescriptionUnits
Hydrological variablesLog10 transformed turbidityNTU
Log10 transformed suspended solid concentrationmg/L
Log10 transformed dischargem3/s
ConductivityµS/cm
Water temperature°C
Meteorological variablesAntecedent precipitation: 5, 10-daysmm
Air temperature°C
Solar radiationW/m2
Table 2. Spearman correlation analysis between FRNAPH and suspended solid concentrations, hydrological and meteorological variables for the ‘Weekly’ and the ‘Events’ dataset (Weekly/Events). Values with significant correlations (p < 0.01) are in bold.
Weekly/Eventsa.b.c.d.e.f.g.h.i.j.
a. FRNAPH1
b. Conductivity0.52/0.371
c. Water temp.0.72/0.160.45/0.261
d. Turbidity0.39/−0.390.61/−0.78−0.28/−0.091
e. Susp. solid conc.0.26/−0.240.43/−0.77−0.05/−0.250.74/0.731
f. Air temperature0.64/0.130.37/0.210.90/0.21−0.17/−0.140.07/−0.081
g. Solar radiation0.45/−0.170.25/−0.180.59/−0.24−0.15/0.000.09/0.140.63/0.101
h. 5-day ant. rainfall0.26/0.180.34/−0.02−0.08/0.180.44/0.150.32/0.34−0.08/0.07−0.07/−0.031
i. 10-day ant. rainfall0.17/−0.030.57/−0.320.01/0.130.48/0.200.36/0.250.04/−0.300.02/−0.020.71/0.441
j. Discharge0.60/−0.300.51/−0.950.51/−0.300.57/0.730.33/0.780.39/−0.21−0.09/0.220.37/0.080.30/0.251
Table 3. Regression model to predict the log-transformed FRNAPH concentrations from the hydrological and meteorological variables using the weekly dataset (n = 60) and the runoff events dataset (n = 74); the intercept is an estimated additive parameter of the regression model that ensures that the hyperplane passes through the average of both the response and the explanatory variables; the regression coefficients determine the tilt of the hyperplane [48]; significant values (p < 0.01) are in bold.
DataWeekly 1Events 2
VariableCoef.Std. Errort-ValuePr
(>|t|)
Sign. 3Coef.Std. Errort-ValuePr
(>|t|)
Sign. 3
(Intercept)2.720.763.570.00***1.221.340.910.37
Log10 transformed turbidity−0.770.46−1.660.10 −0.460.33−1.410.16
Log10 transformed suspended solid concentration0.890.352.520.01*−0.070.25−0.270.79
Log10 transformed discharge0.510.212.400.02*0.440.281.580.12
Conductivity0.000.001.180.25 0.000.001.480.14
Water temperature0.080.033.120.00**0.020.050.410.69
Antecedent precipitation: 5-days0.010.011.080.29 0.010.011.330.19
Antecedent precipitation: 10-days0.000.010.340.73 0.010.010.920.36
Air temperature−0.010.02−0.350.73 0.030.021.490.14
Solar radiation0.000.00−0.200.84 0.000.00−0.920.36
1 Residual standard error: 0.46 on 50 degrees of freedom (DF). Multiple R2: 0.67, F-statistic: 11.49 on 9 and 50 DF, p-value < 0.0001. Adjusted R2: 0.62. Leave-one-out cross-validation R2: 0.54. 2 Residual standard error: 0.43 on 64 DF. Multiple R2: 0.30, Adjusted R2: 0.20. F-statistic: 2.98 on 9 and 64 DF, p-value < 0.005. Leave-one-out cross-validation R2: 0.12. 3 Significance codes: 0.0001, ′***’; 0.001, ‘**’; 0.01, ‘*’.
Publisher’s Note: MDPI stays neutral with regard to jurisdictional claims in published maps and institutional affiliations.

