
Optimal Multi-Sectoral Water Resources Allocation Based on Economic Evaluation Considering the Environmental Flow Requirements: A Case Study of Yellow River Basin


Abstract
:1. Introduction
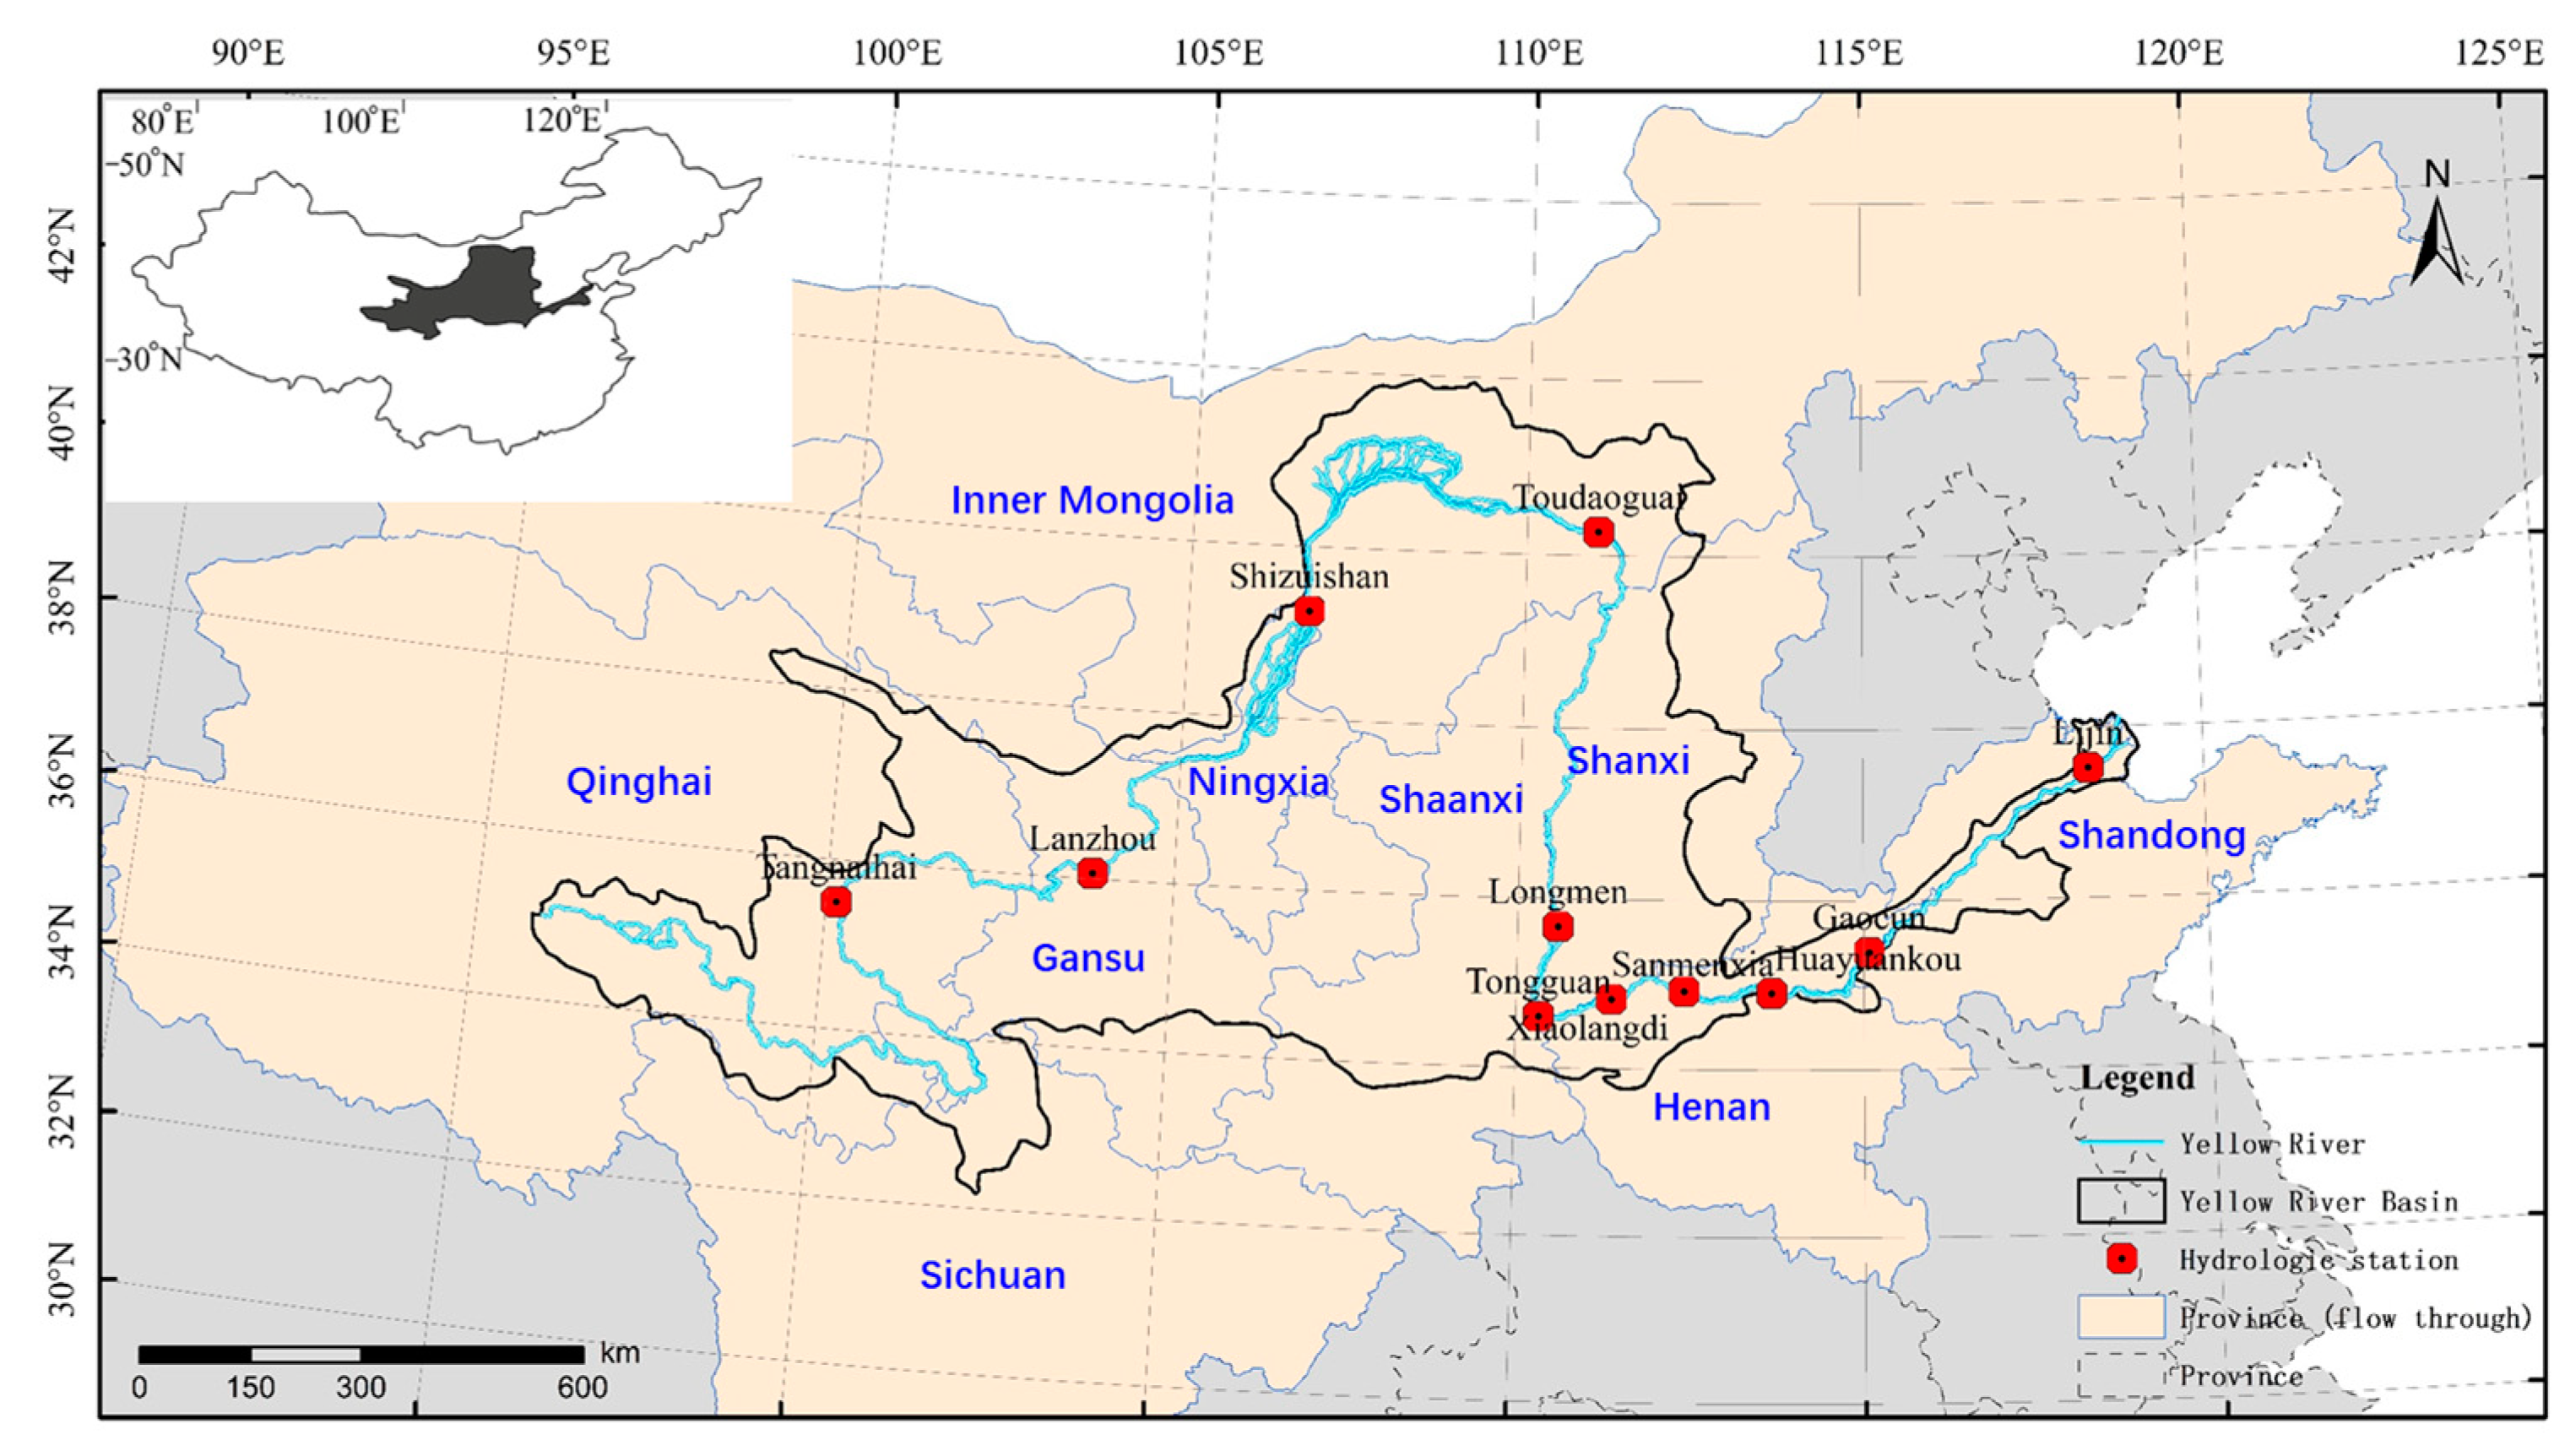
2. Study Area
3. Materials and Methods
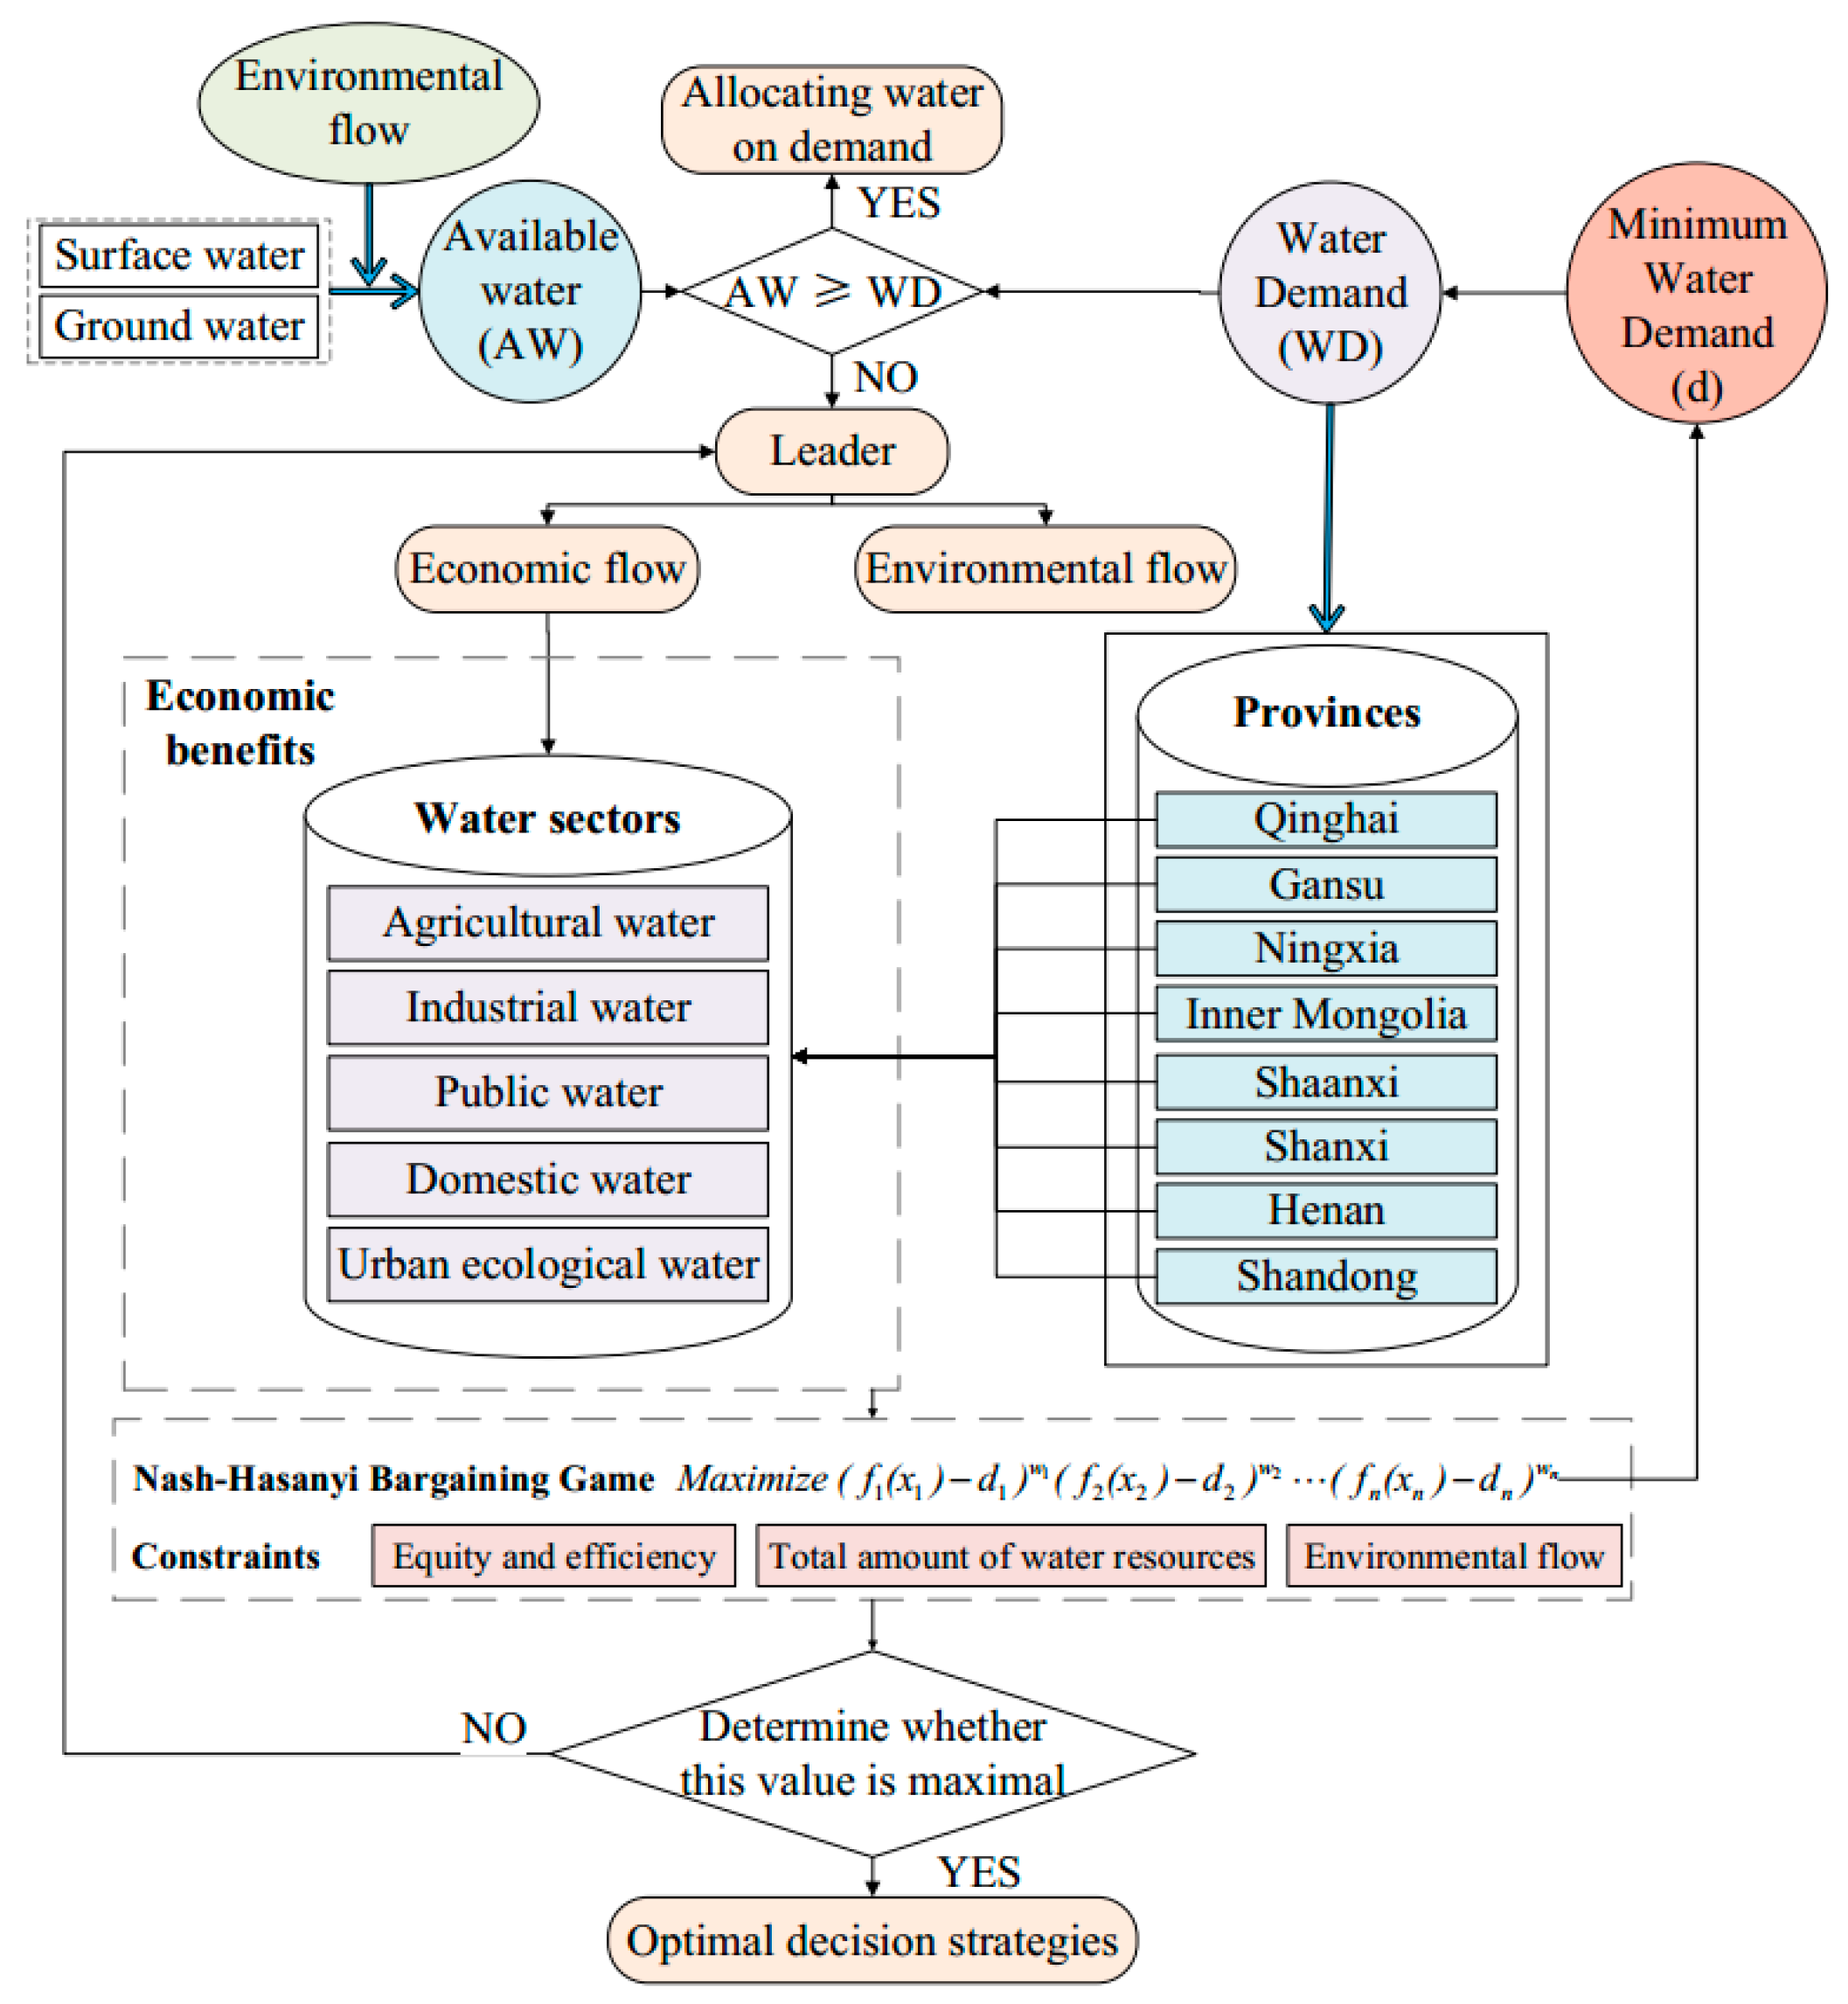
3.1. A General Framework
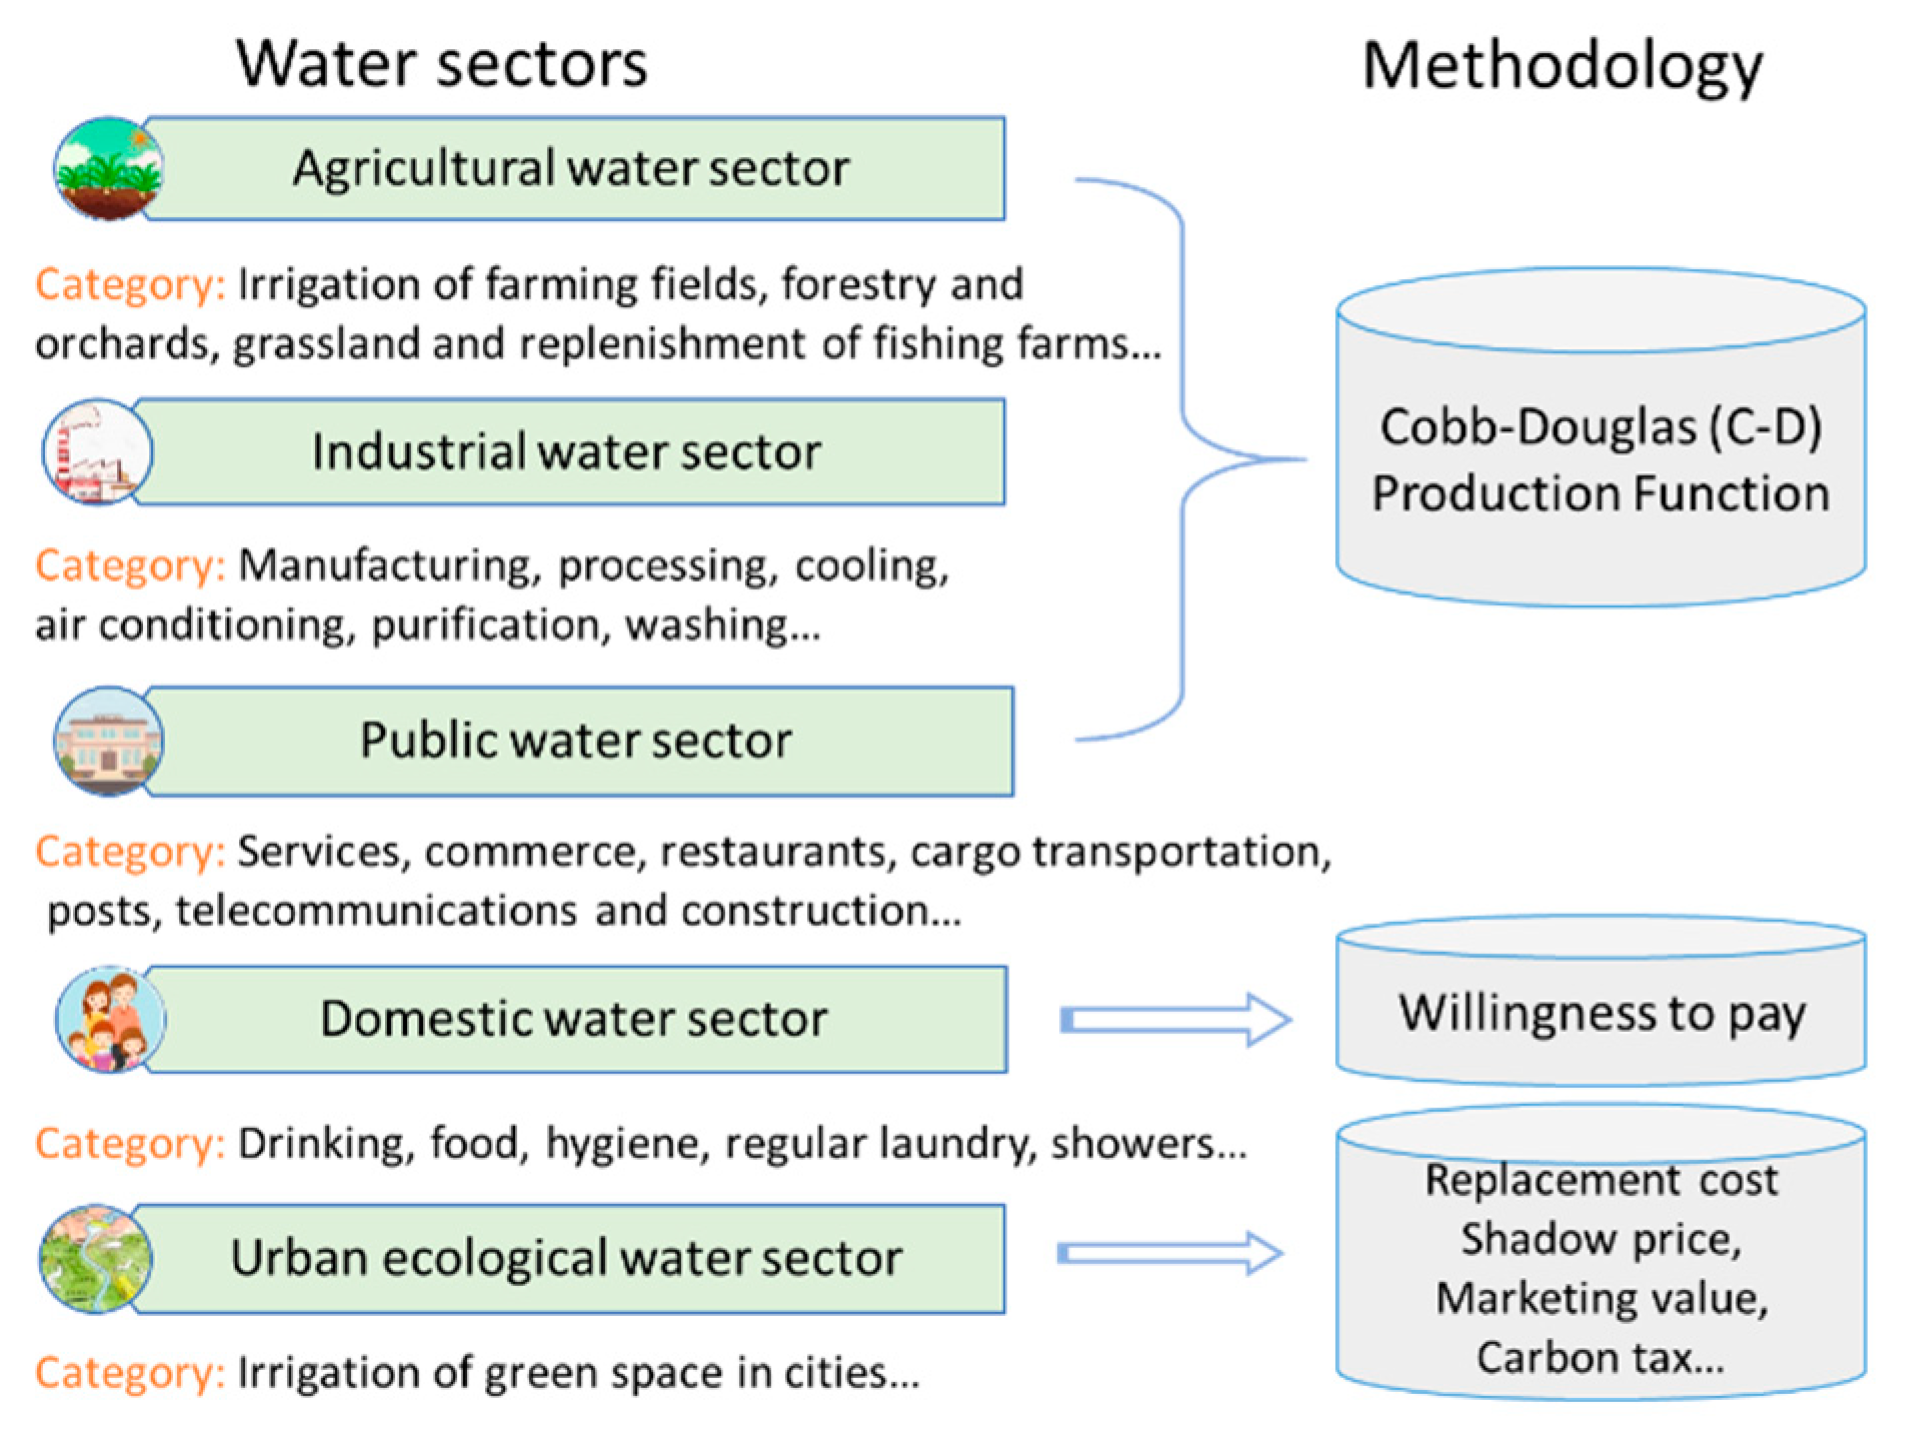
3.2. Methods Evaluating the Values of Five Water Sectors
3.2.1. Agricultural, Industrial, and Public Water Sectors
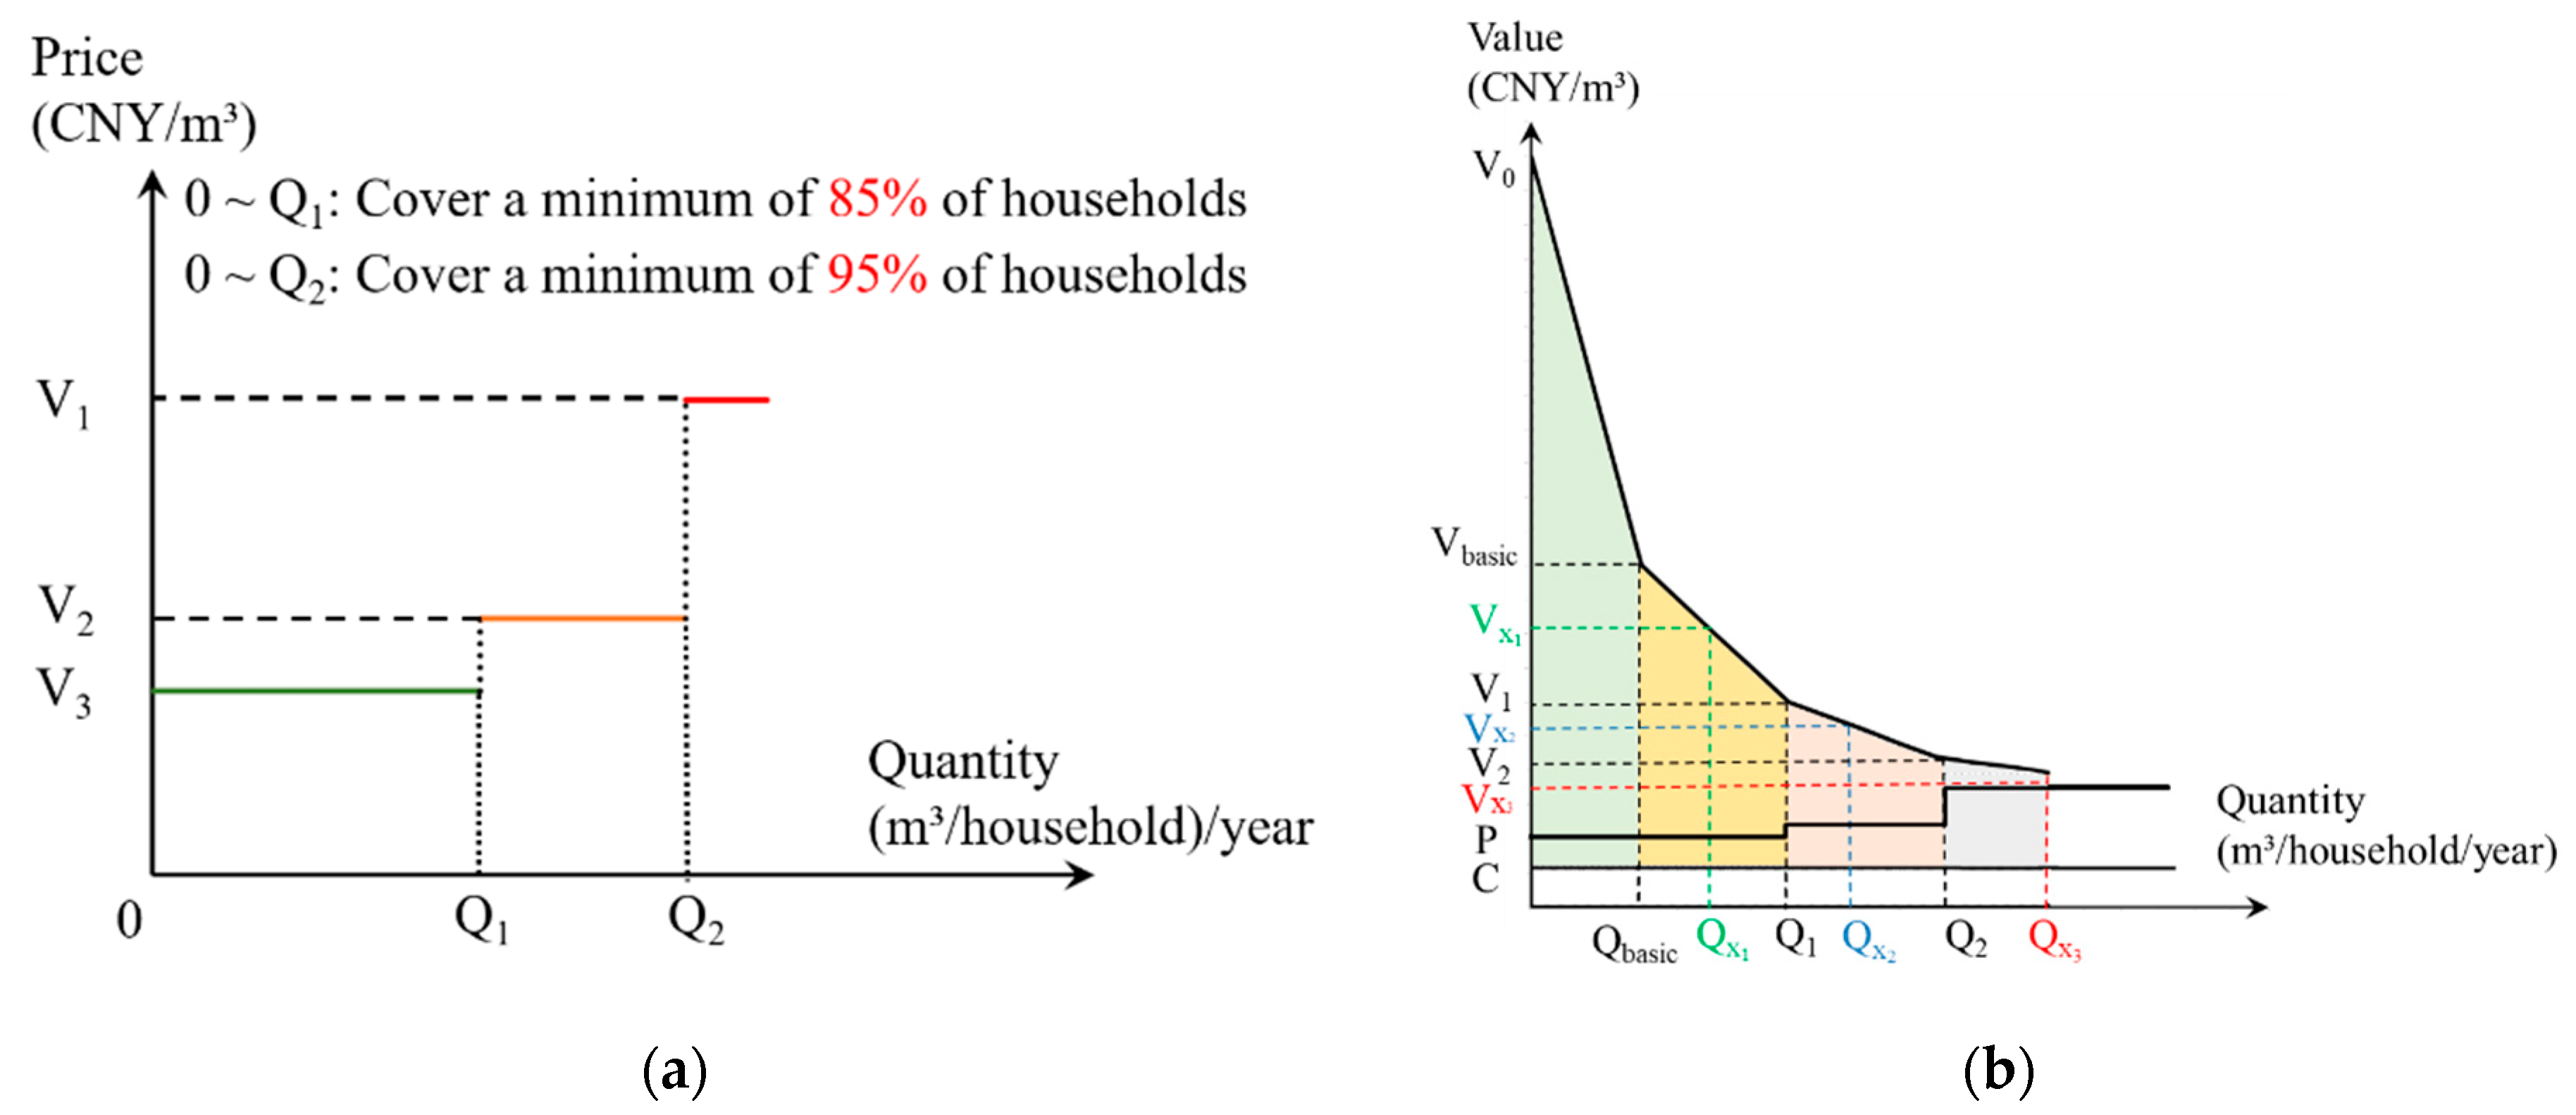
3.2.2. Domestic Water Sector
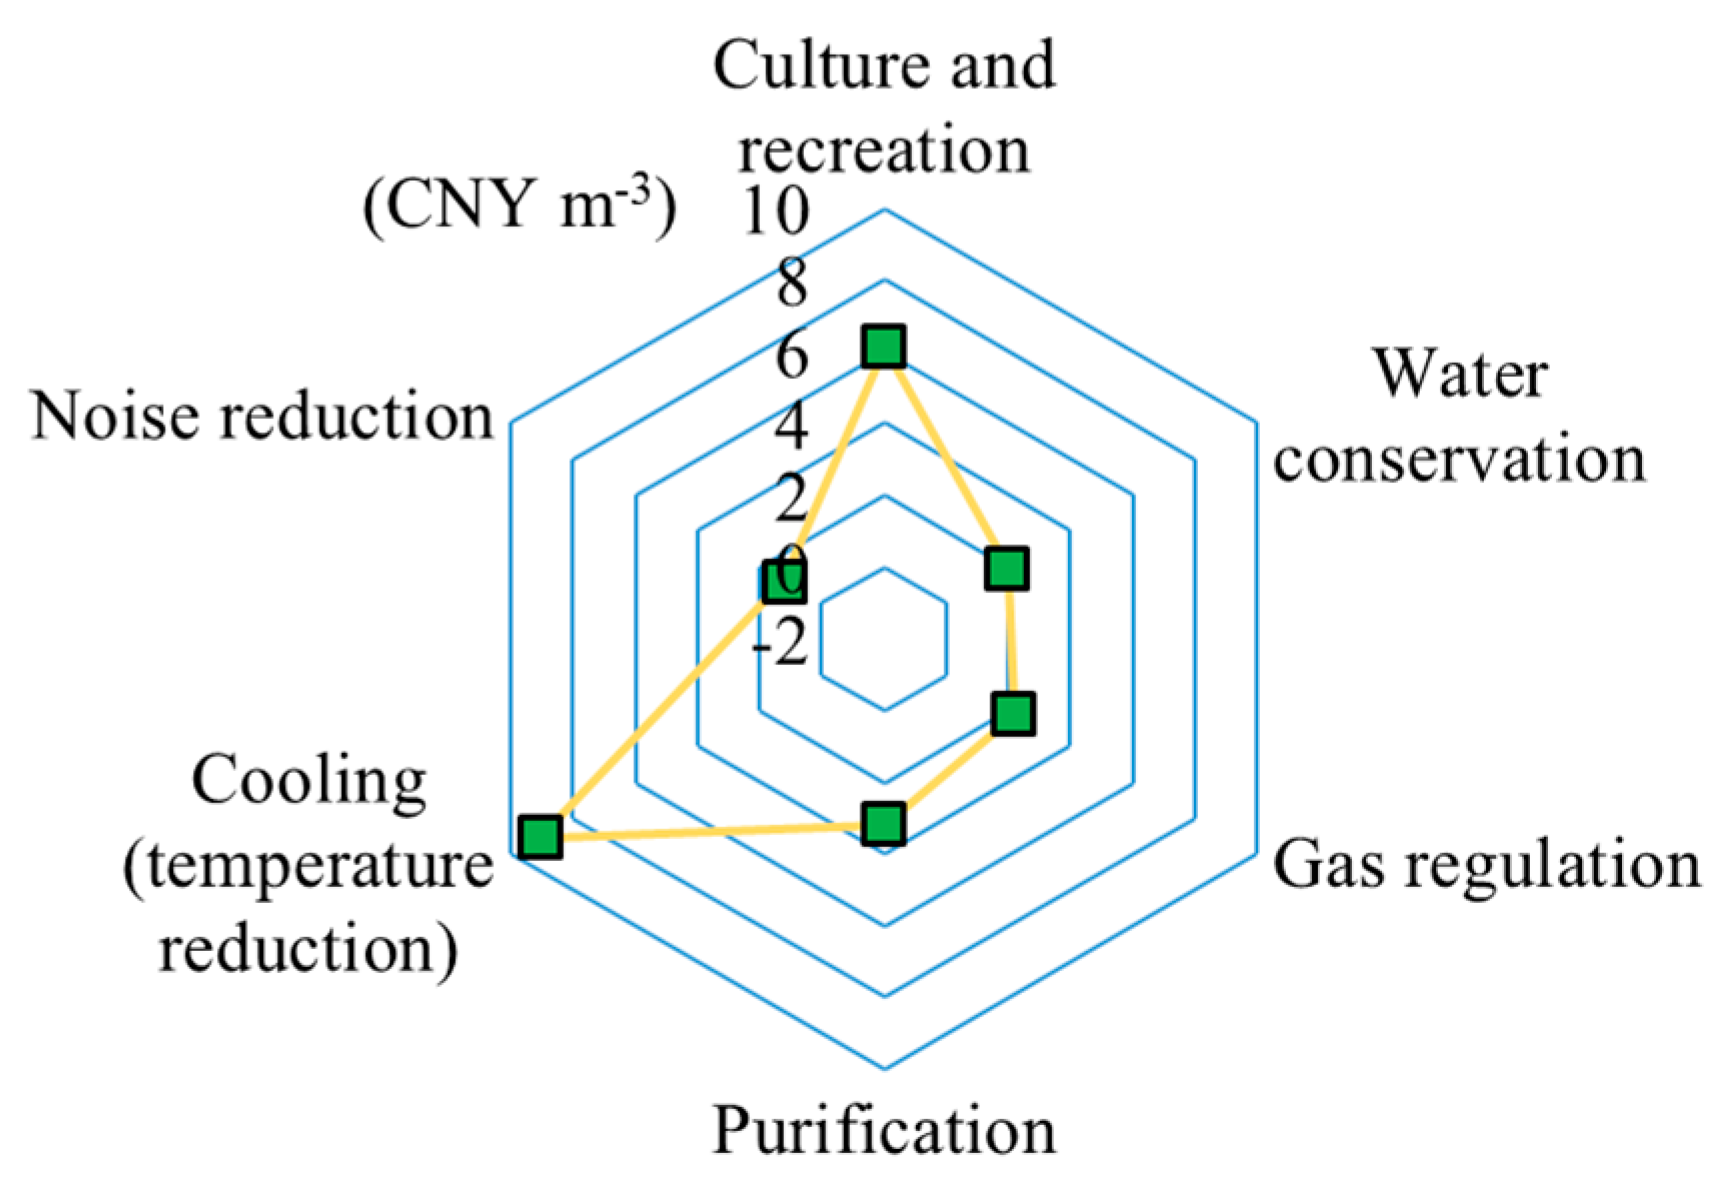
3.2.3. Urban Ecological Water Use Sector
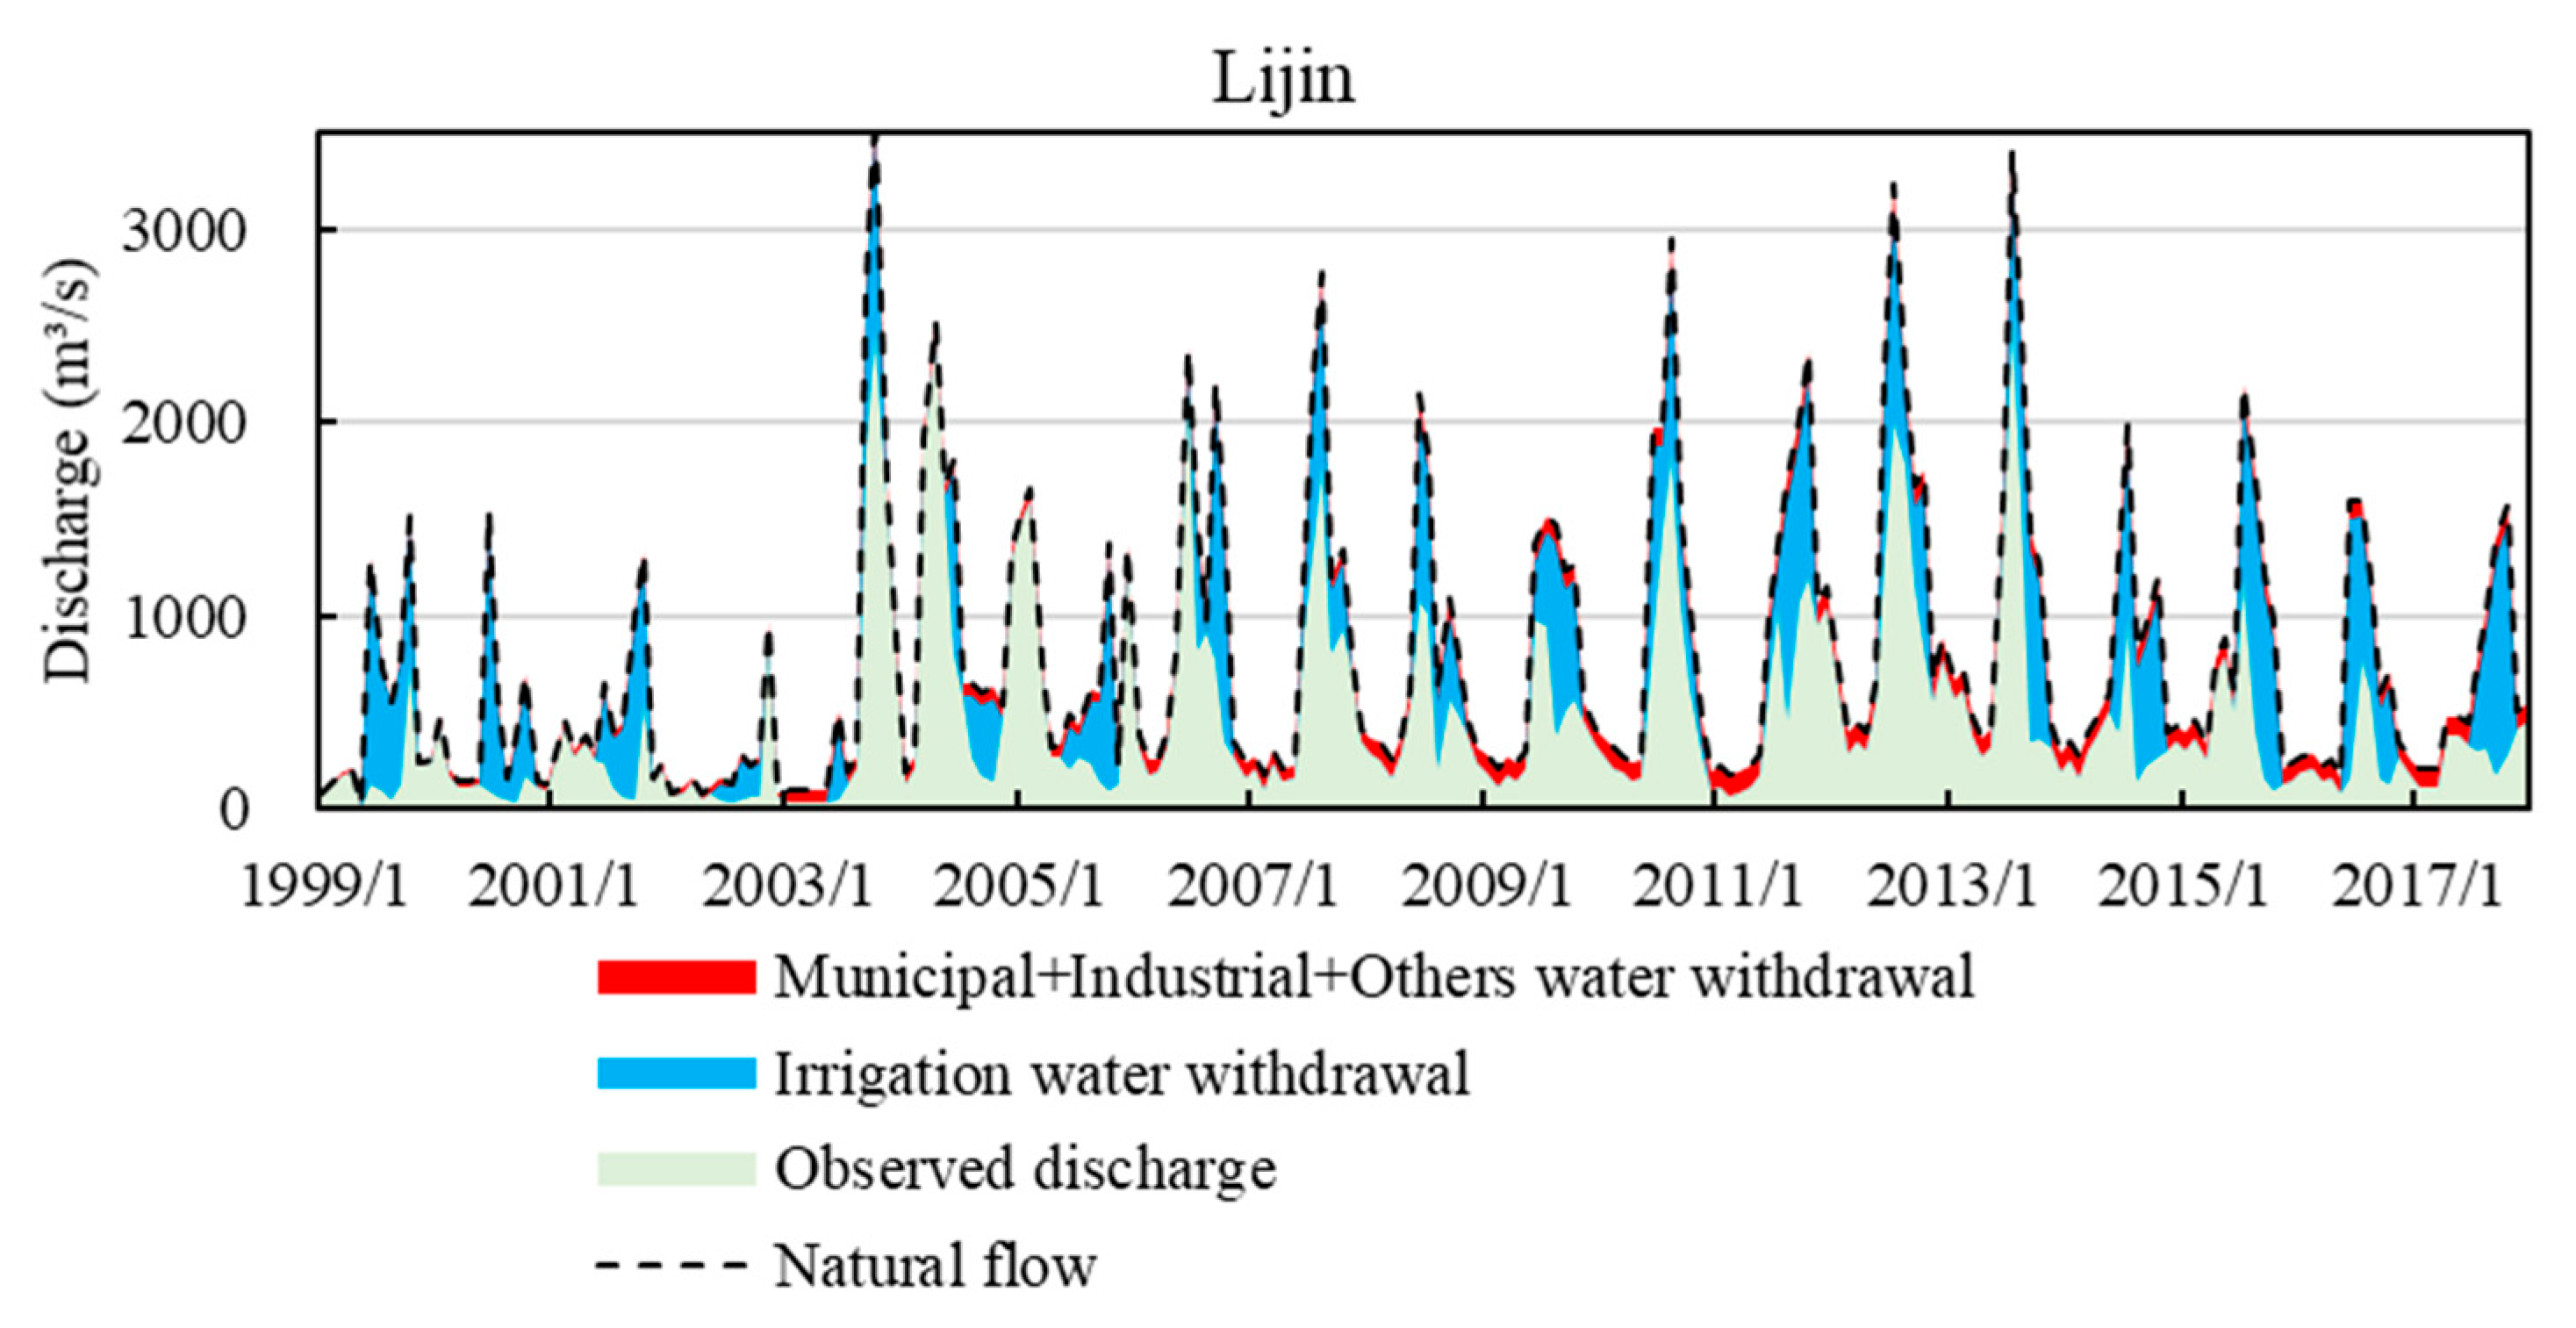
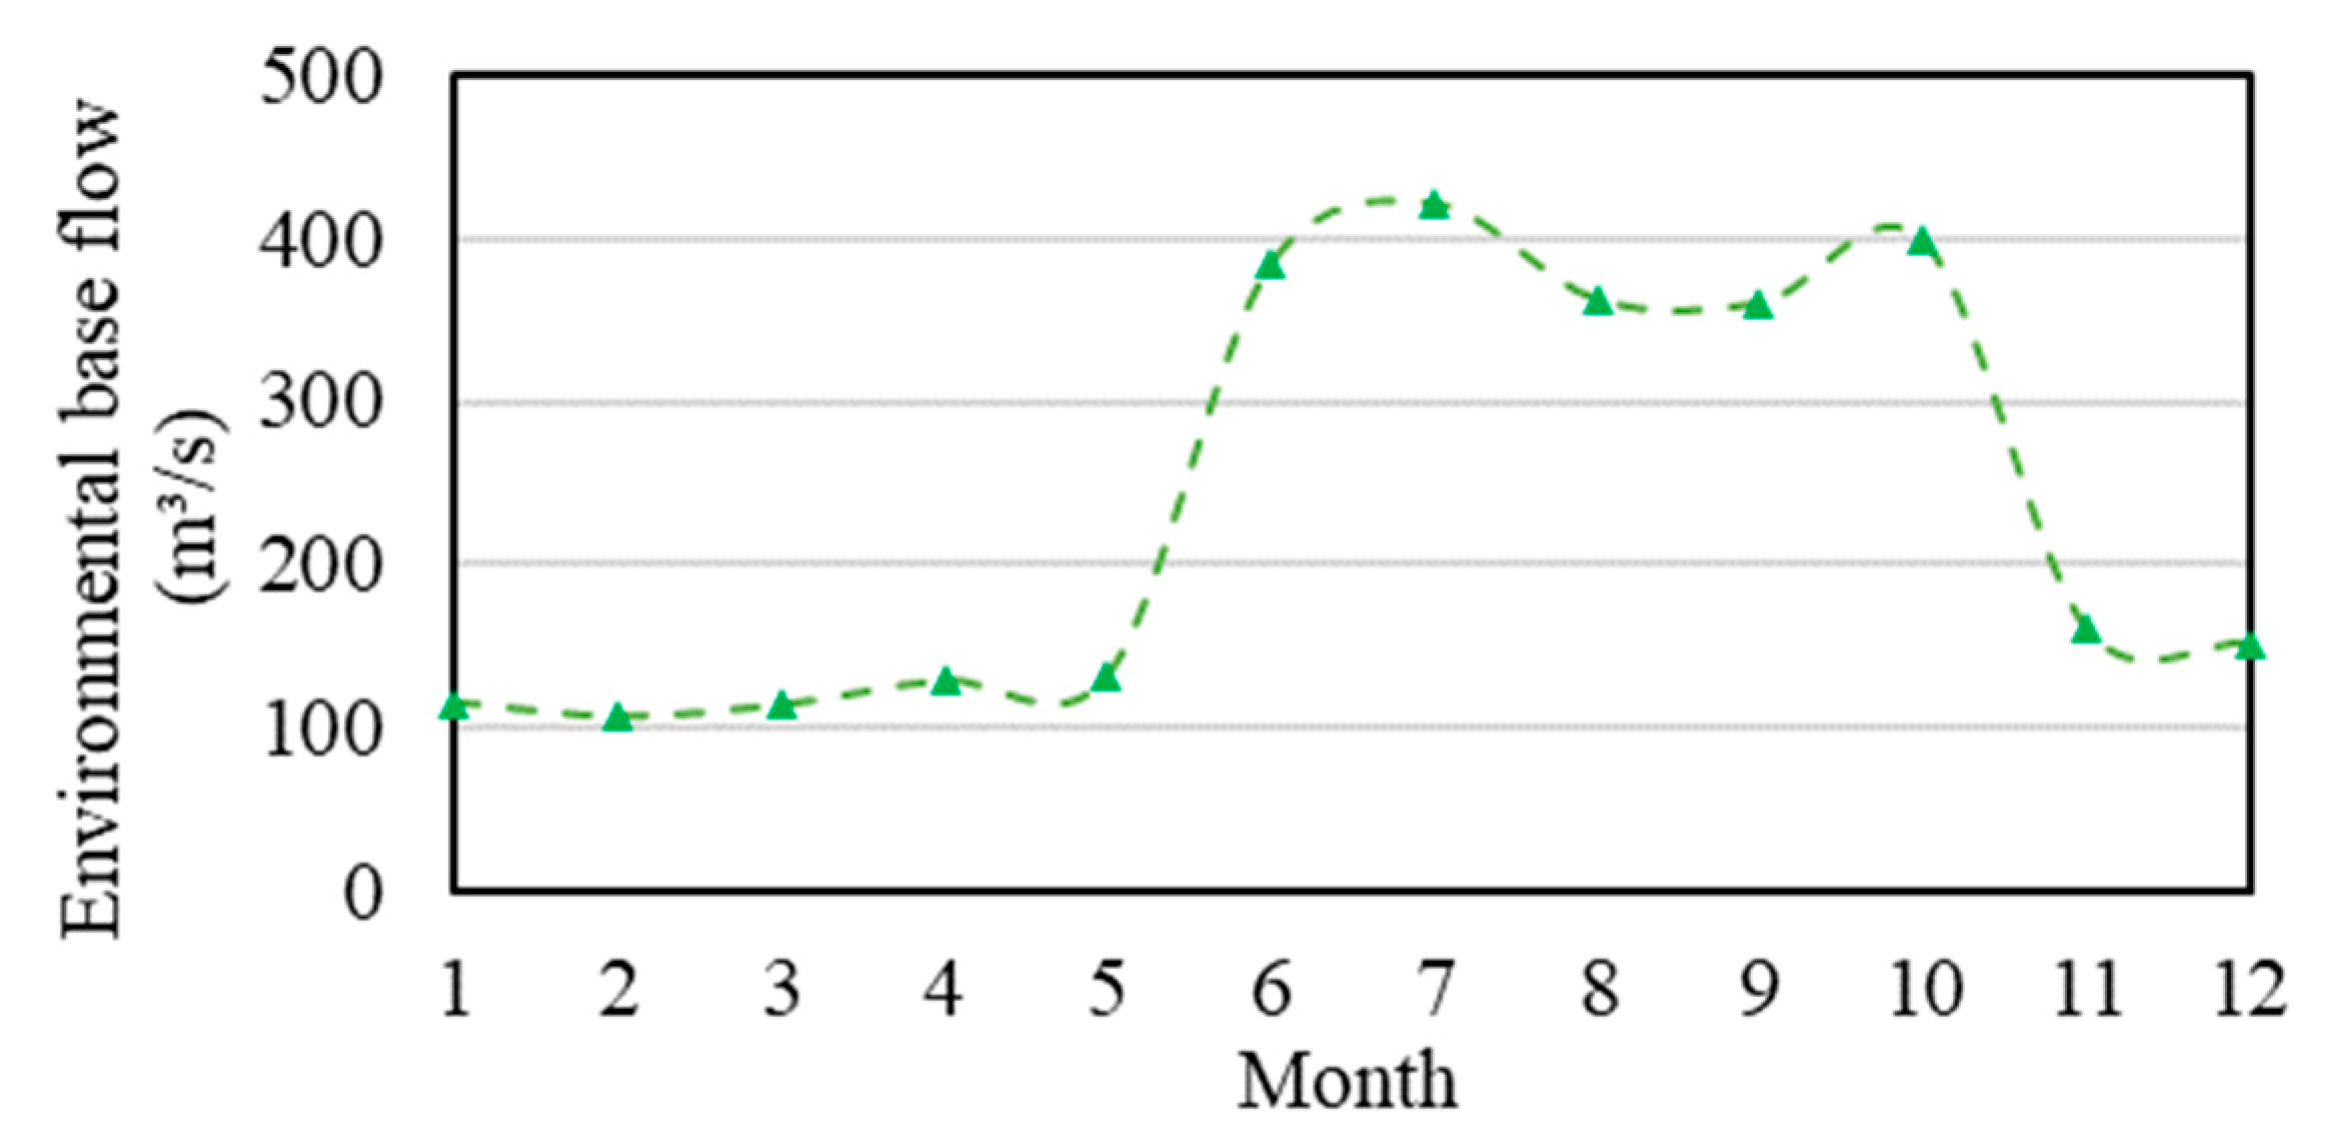
3.3. Method of Quantifying Monthly Naturalized Flow and Environmental Base Flow
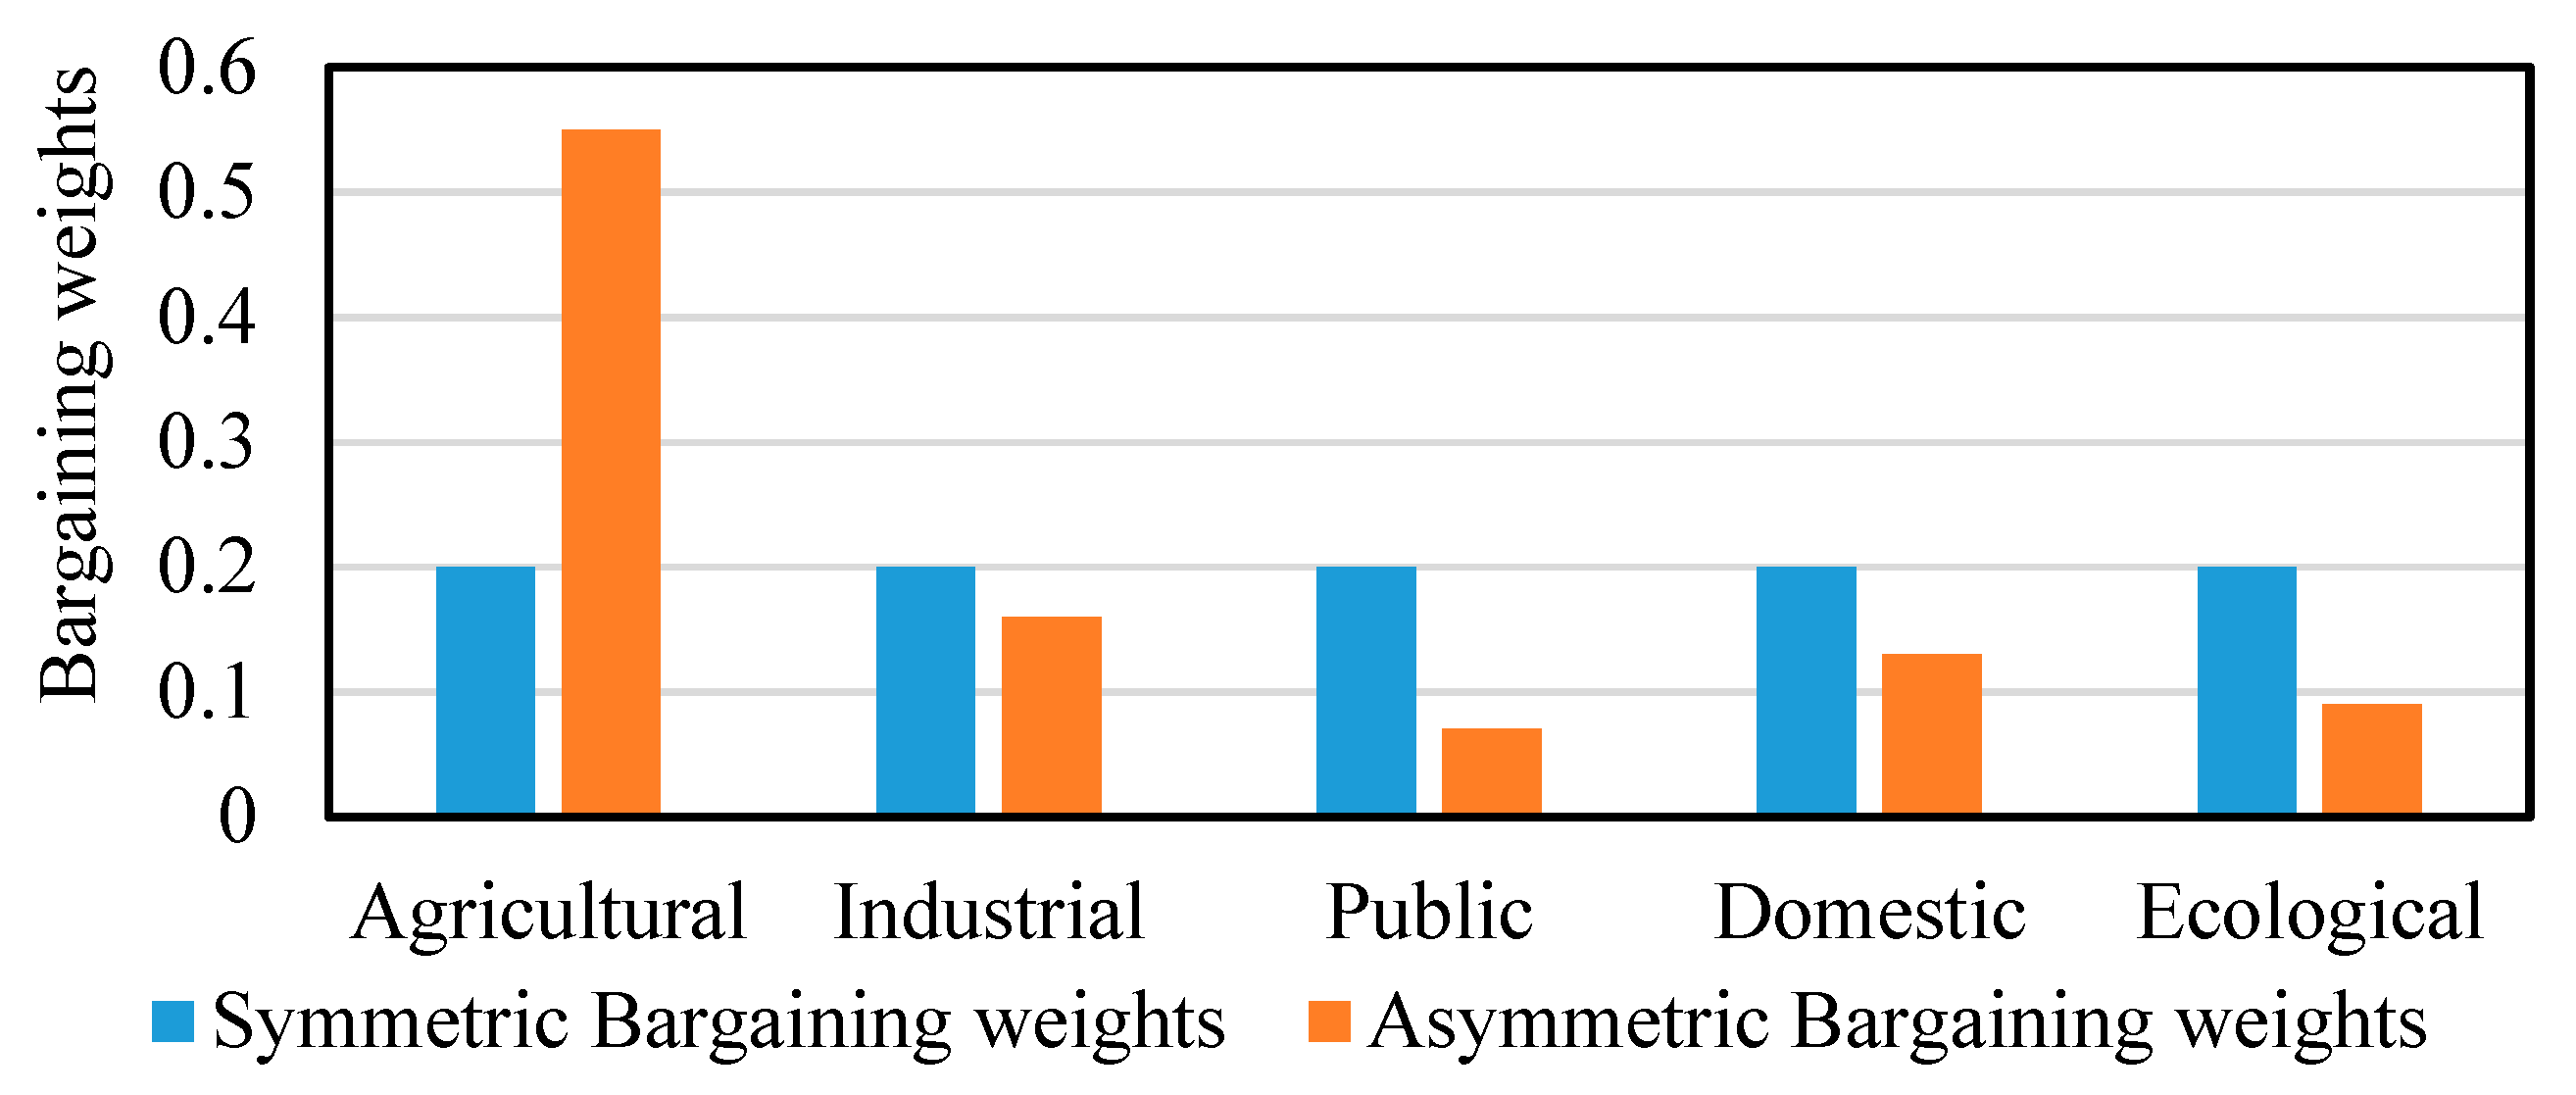
3.4. Water Allocation Model: Asymmetric Nash–Harsanyi Game Model
3.5. Data
4. Results and Discussions
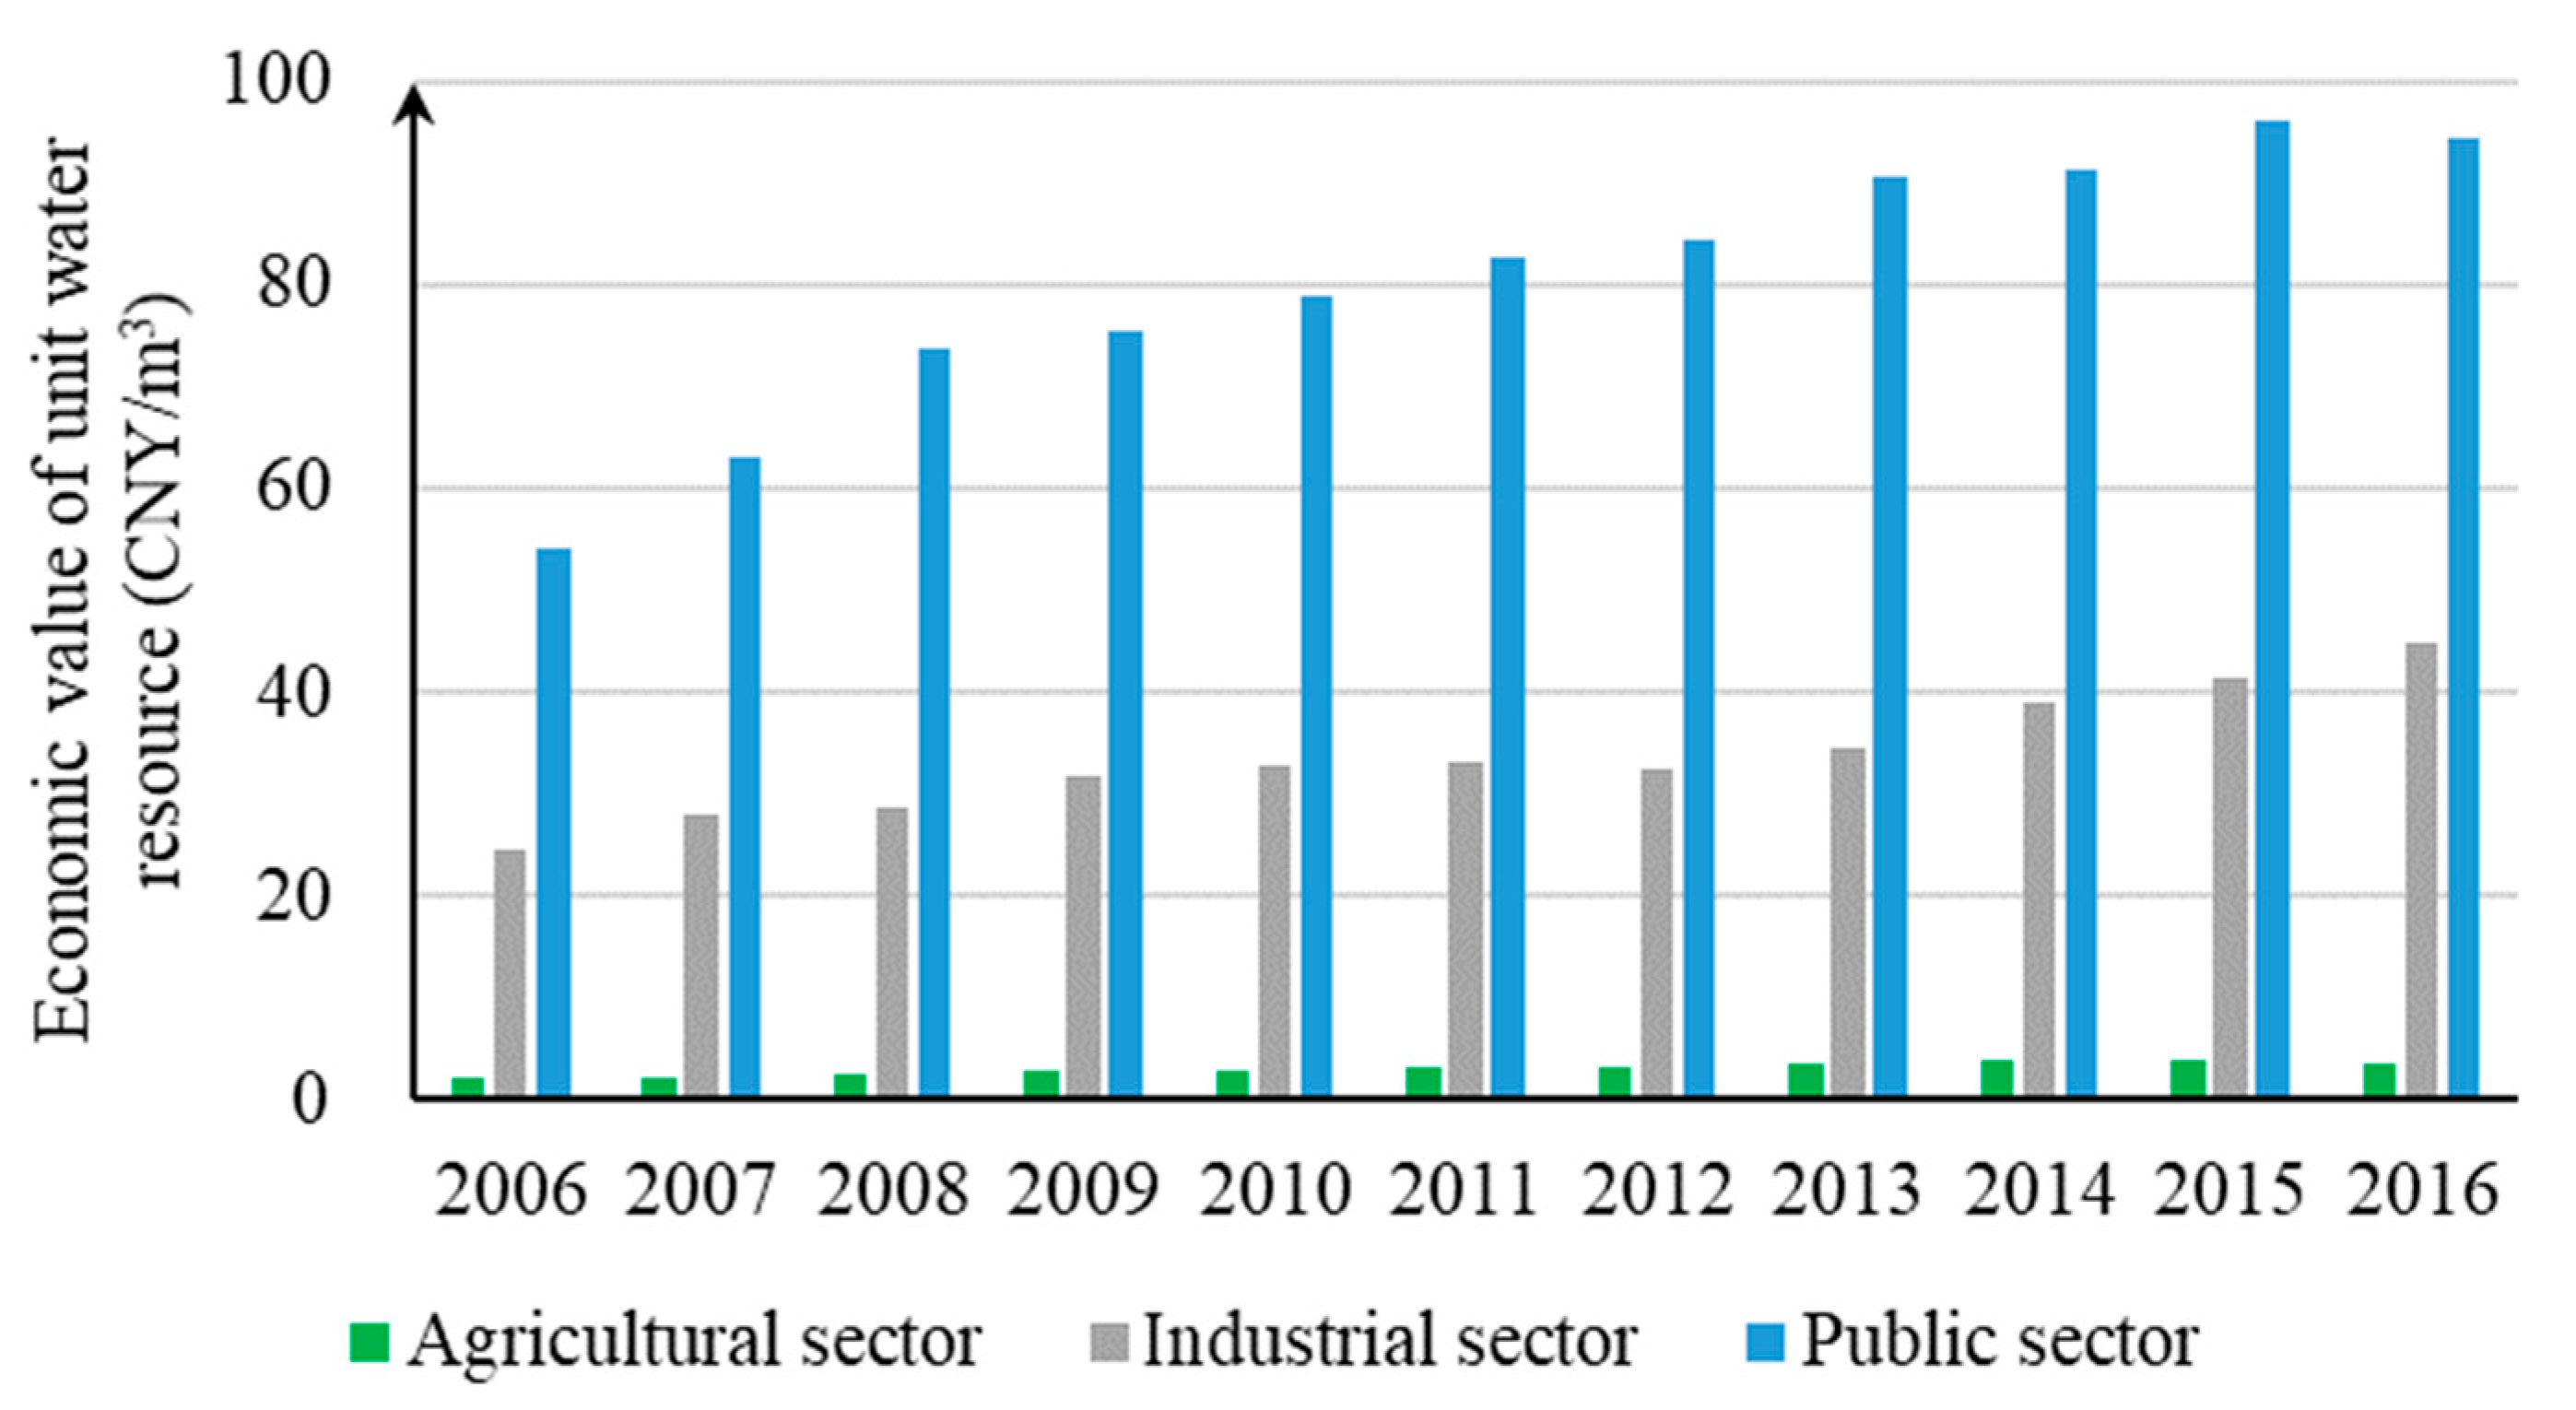
4.1. Economic Benefit of Five Water Use Sectors
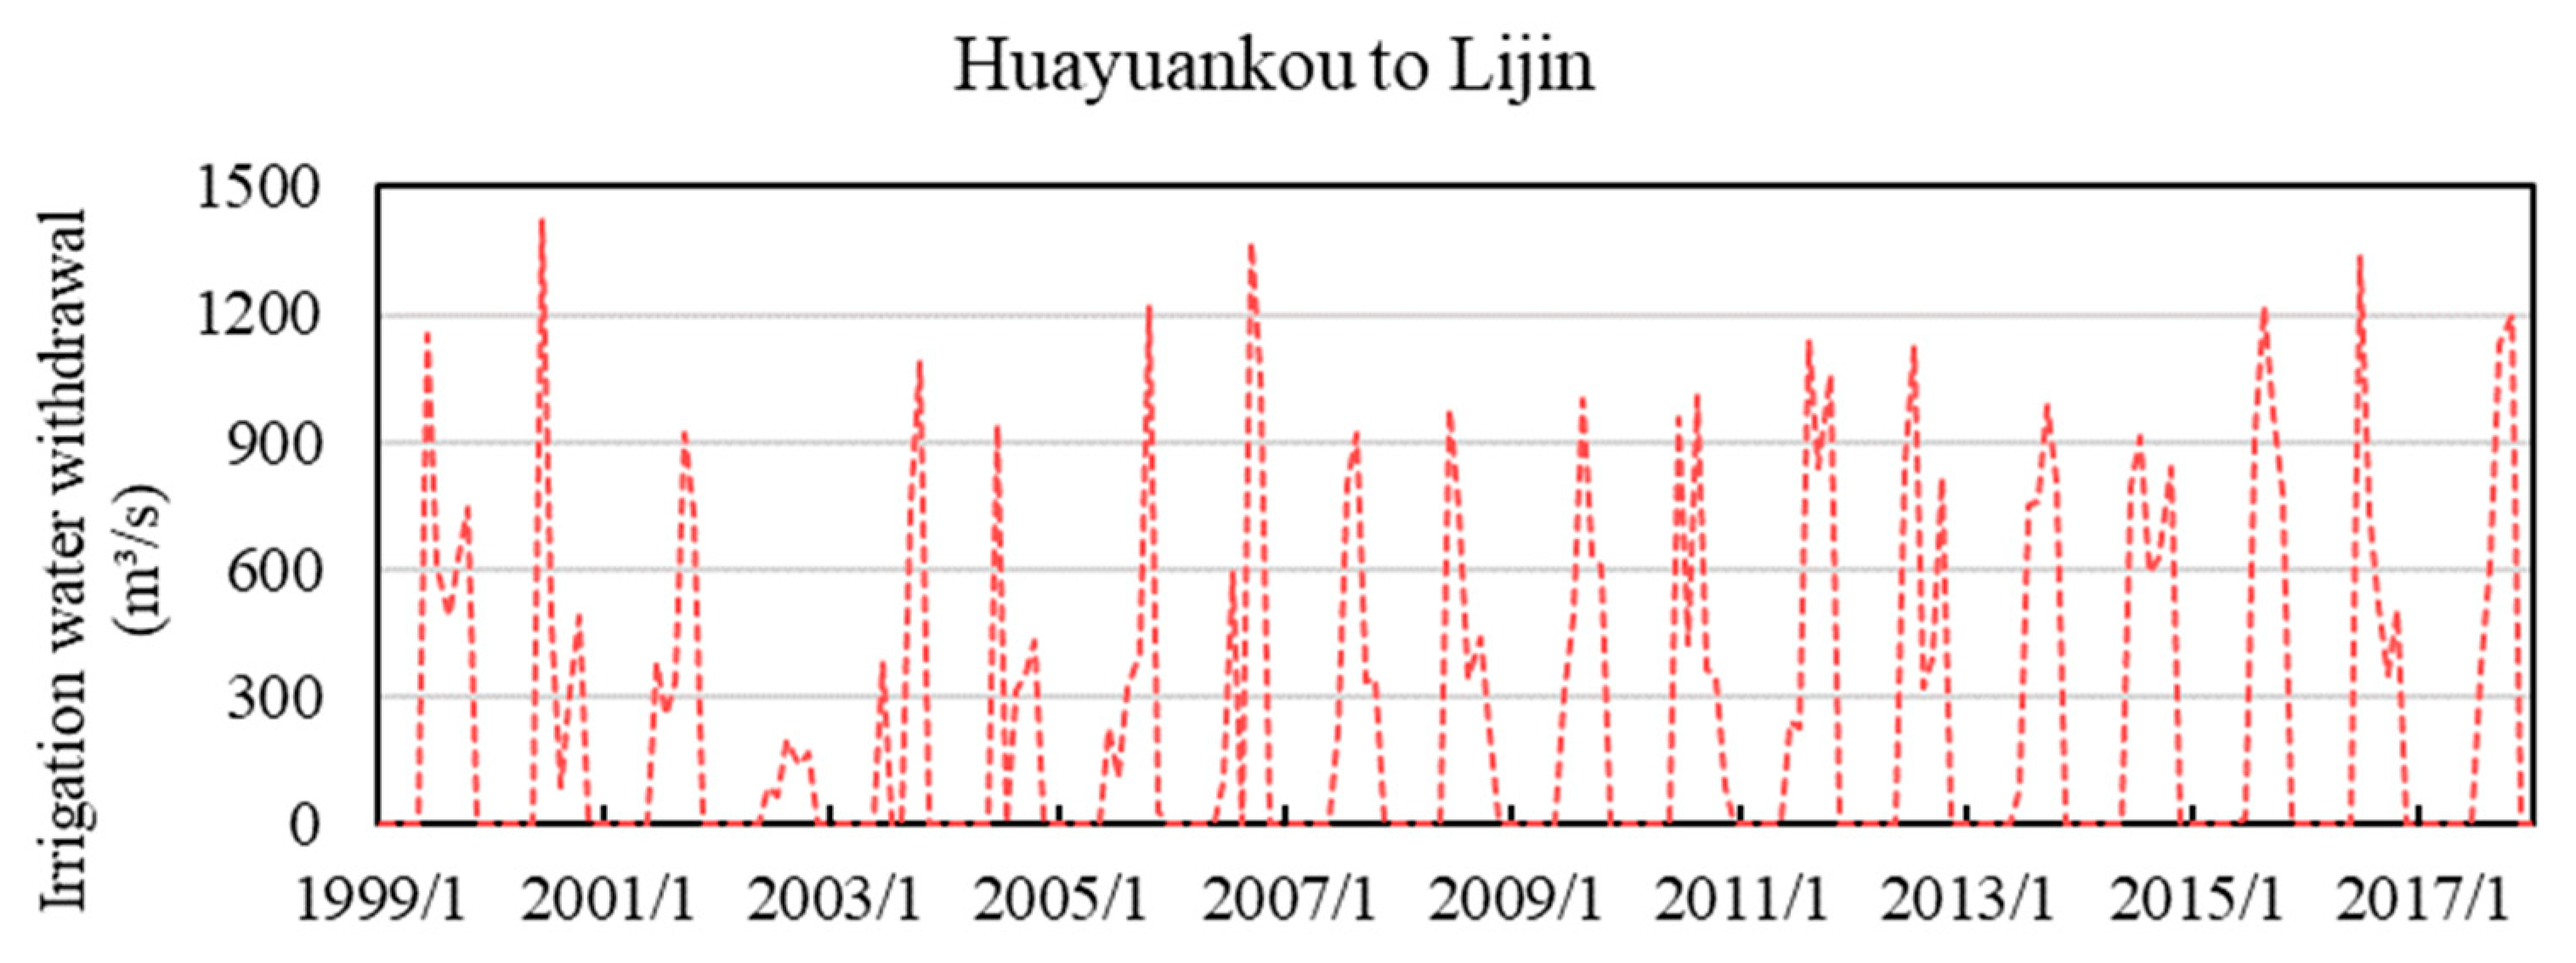
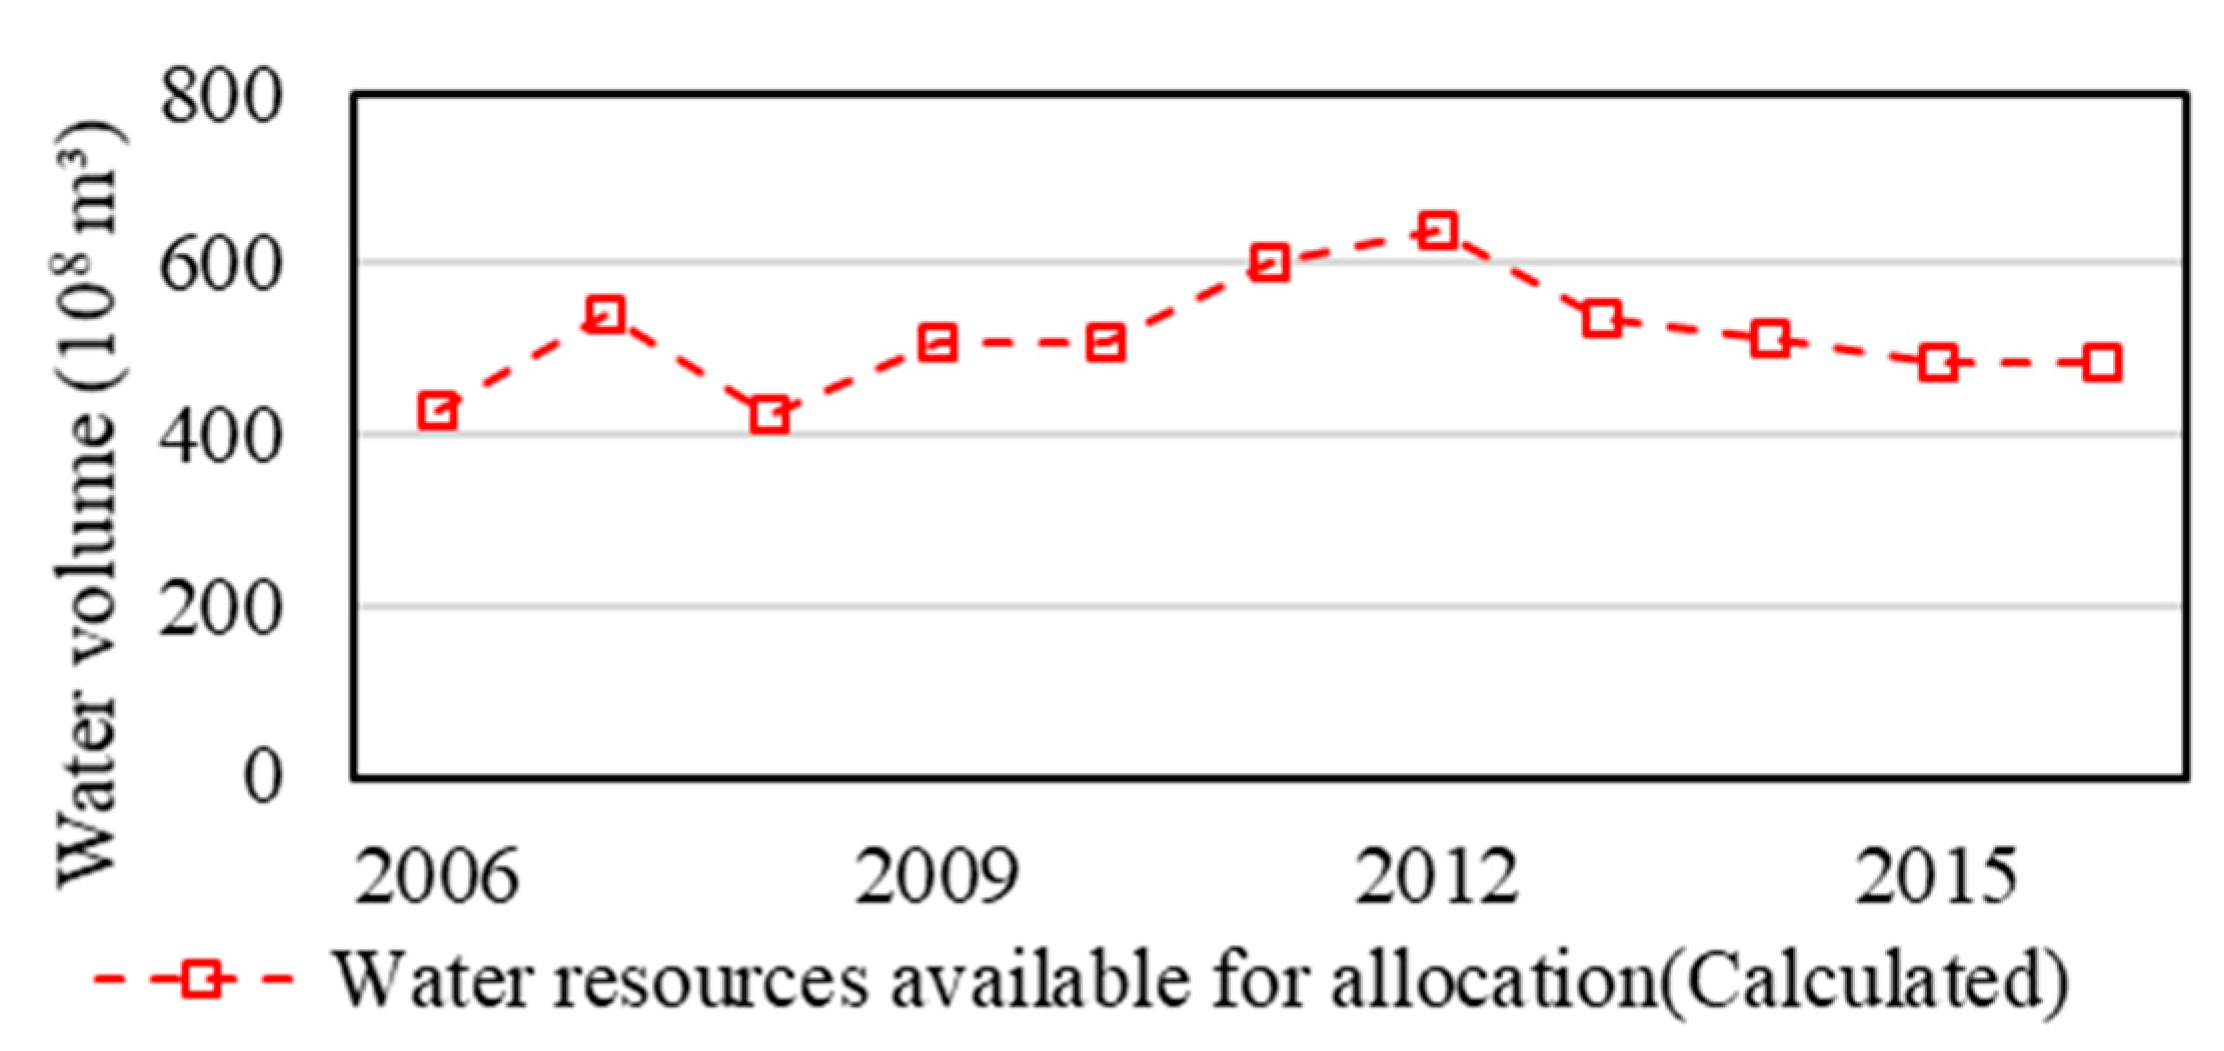
4.2. Monthly Naturalized Flow and Environmental Base Flow
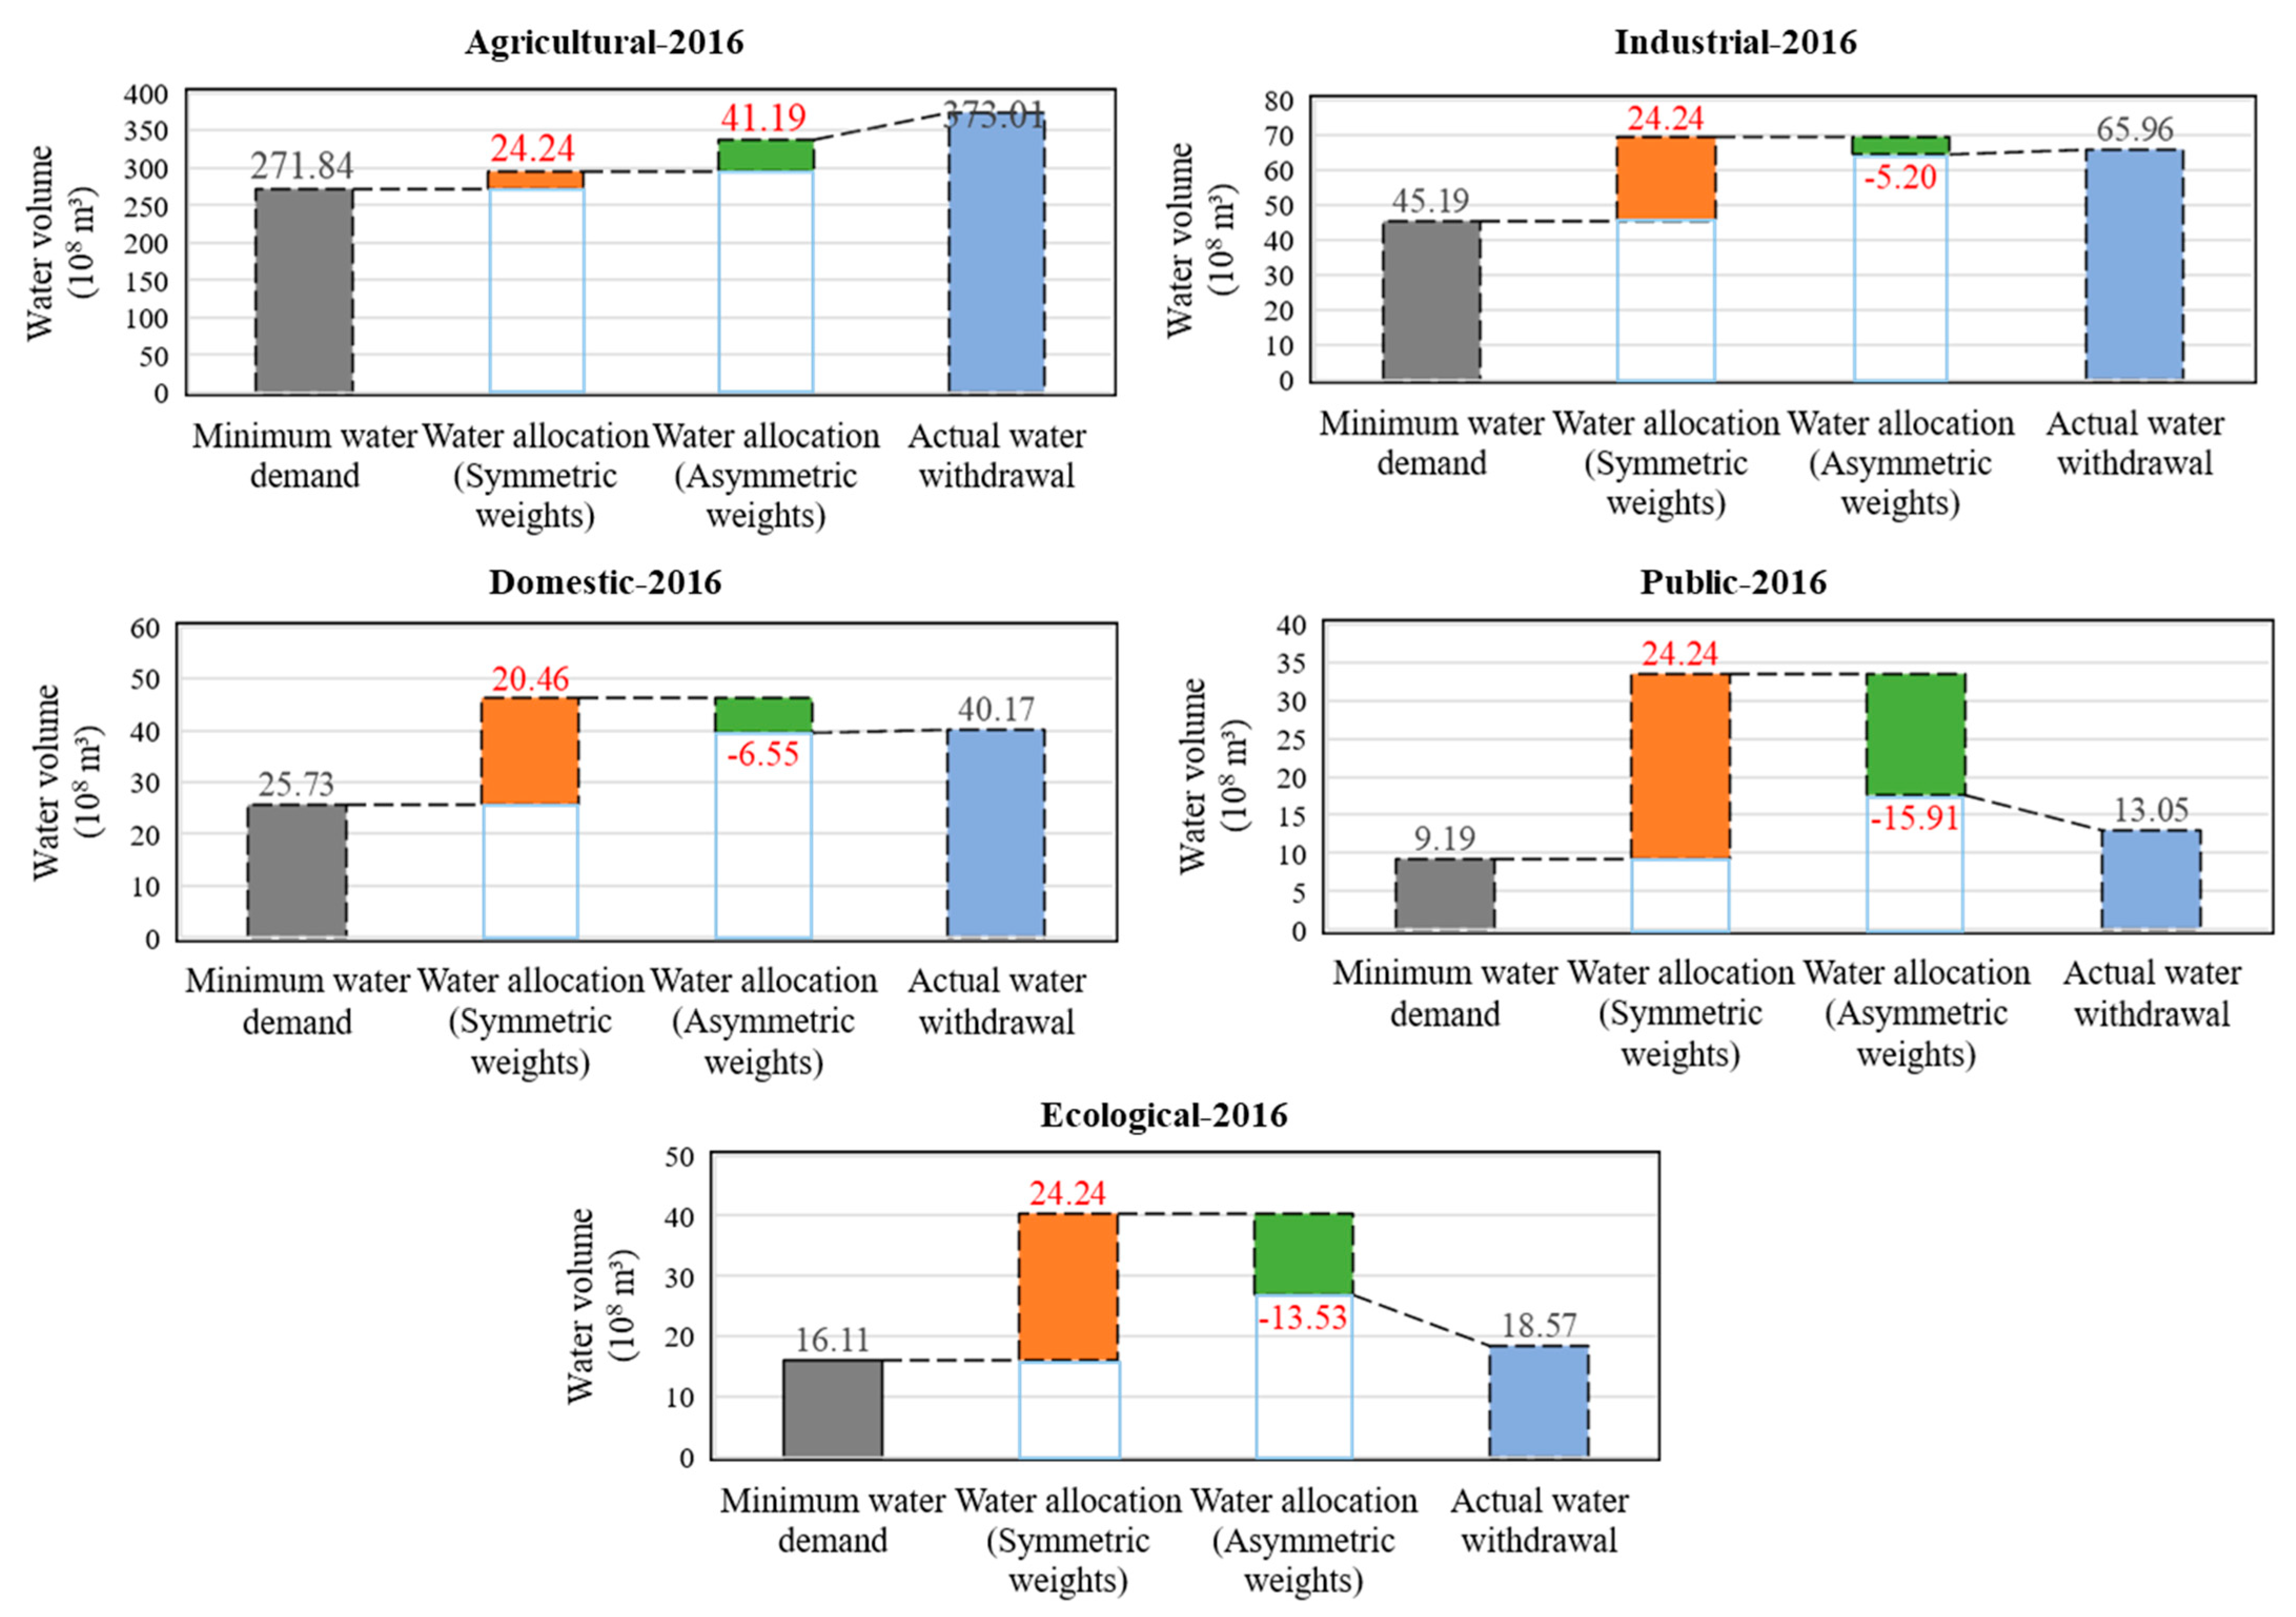
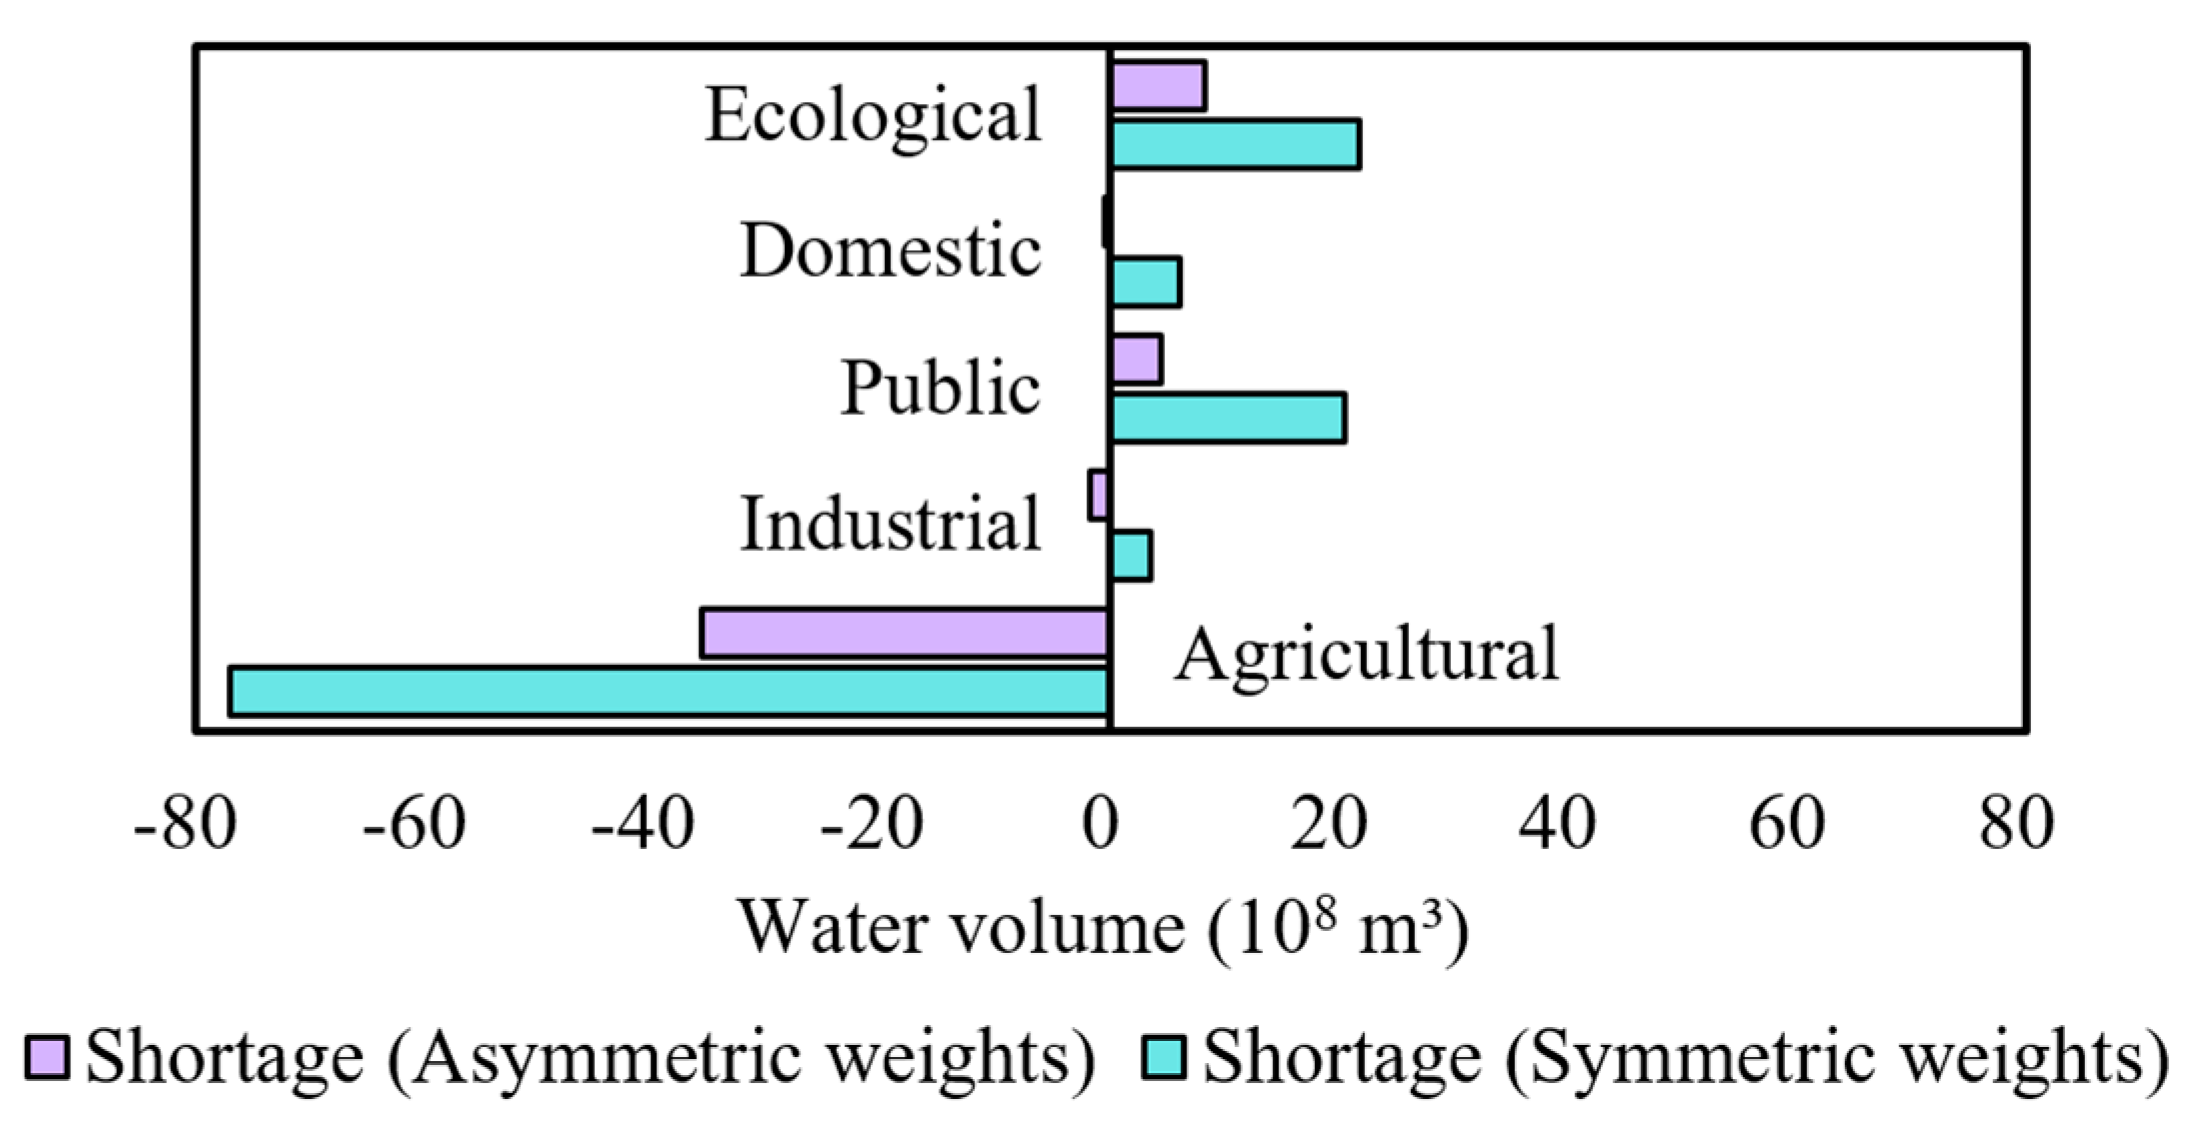
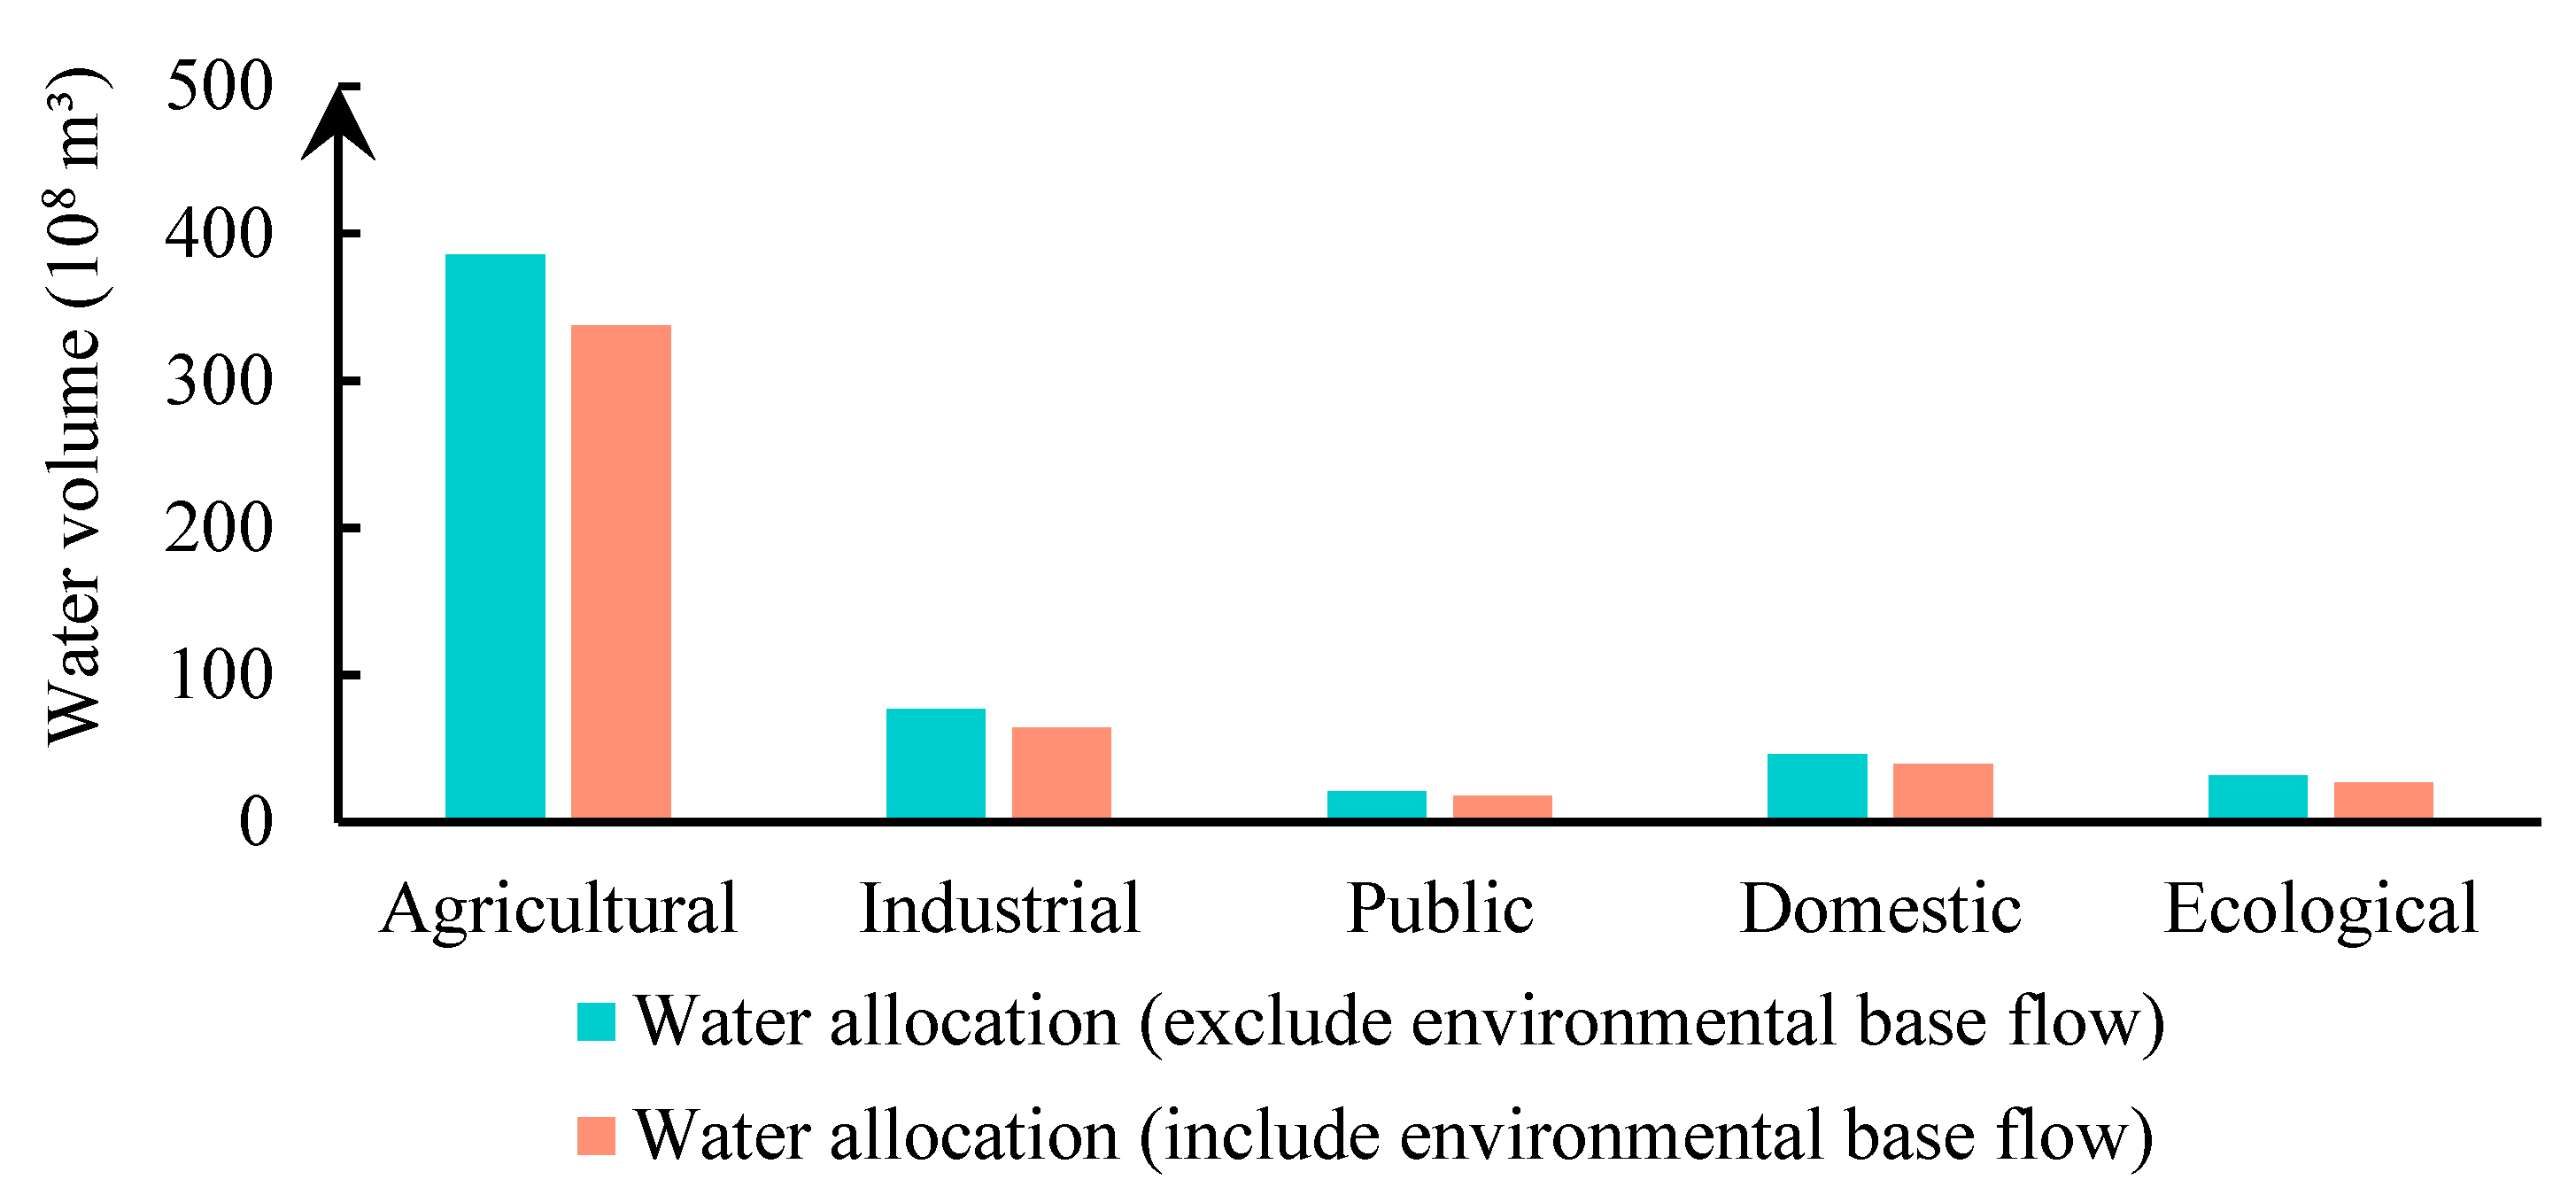
4.3. Water Allocation between Five Water Sectors
5. Conclusions
Author Contributions
Funding
Institutional Review Board Statement
Informed Consent Statement
Data Availability Statement
Conflicts of Interest
References
- Oki, T.; Quiocho, R.E. Economically challenged and water scarce: Identification of global populations most vulnerable to water crises. Int. J. Water Resour. Dev. 2020, 36, 416–428. [Google Scholar] [CrossRef] [Green Version]
- Oki, T.; Kanae, S. Global Hydrological Cycles and World Water Resources. Science 2006, 313, 1068–1072. [Google Scholar] [CrossRef] [PubMed] [Green Version]
- Liu, J.; Yang, H.; Gosling, S.N.; Kummu, M.; Flörke, M.; Pfister, S.; Hanasaki, N.; Wada, Y.; Zhang, X.; Zheng, C.; et al. Water scarcity assessments in the past, present, and future. Earth’s Future 2017, 5, 545–559. [Google Scholar] [CrossRef] [PubMed]
- Ferguson, C.R.; Pan, M.; Oki, T. The Effect of Global Warming on Future Water Availability: CMIP5 Synthesis. Water Resour. Res. 2018, 54, 7791–7819. [Google Scholar] [CrossRef]
- Schewe, J.; Heinke, J.; Gerten, D.; Haddeland, I.; Arnell, N.W.; Clark, D.B.; Dankers, R.; Eisner, S.; Fekete, B.M.; Colón-González, F.J.; et al. Multimodel assessment of water scarcity under climate change. Proc. Natl. Acad. Sci. USA 2014, 111, 3245–3250. [Google Scholar] [CrossRef] [Green Version]
- Gain, A.K.; Wada, Y. Assessment of Future Water Scarcity at Different Spatial and Temporal Scales of the Brahmaputra River Basin. Water Resour. Manag. 2014, 28, 999–1012. [Google Scholar] [CrossRef]
- Vörösmarty, C.J.; Green, P.; Salisbury, J.; Lammers, R.B. Global Water Resources: Vulnerability from Climate Change and Population Growth. Science 2000, 289, 284–288. [Google Scholar] [CrossRef] [Green Version]
- Tu, Y.; Zhou, X.; Gang, J.; Liechty, M.; Xu, J.; Lev, B. Administrative and market-based allocation mechanism for regional water resources planning. Resour. Conserv. Recycl. 2015, 95, 156–173. [Google Scholar] [CrossRef]
- Piao, S.; Ciais, P.; Huang, Y.; Shen, Z.; Peng, S.; Li, J.; Zhou, L.; Liu, H.; Ma, Y.; Ding, Y.; et al. The impacts of climate change on water resources and agriculture in China. Nature 2010, 467, 43–51. [Google Scholar] [CrossRef]
- Zhang, Q.; Dong, W.; Wen, C.; Li, T. Study on factors affecting corn yield based on the Cobb-Douglas production function. Agric. Water Manag. 2019, 228, 105869. [Google Scholar] [CrossRef]
- Di, D.; Wu, Z.; Wang, H.; Huang, S. Optimal water distribution system based on water rights transaction with administrative management, marketization, and quantification of sediment transport value: A case study of the Yellow River Basin, China. Sci. Total Environ. 2020, 722, 137801. [Google Scholar] [CrossRef]
- Mitrică, B.; Mitrică, E.; Enciu, P.; Mocanu, I. An approach for forecasting of public water scarcity at the end of the 21st century, in the Timiş Plain of Romania. Technol. Forecast. Soc. Chang. 2017, 118, 258–269. [Google Scholar] [CrossRef]
- Moore, B.C.; Coleman, A.M.; Wigmosta, M.S.; Skaggs, R.L.; Venteris, E.R. A High Spatiotemporal Assessment of Consumptive Water Use and Water Scarcity in the Conterminous United States. Water Resour. Manag. 2015, 29, 5185–5200. [Google Scholar] [CrossRef]
- Dworak, T.; Berglund, M.; Laaser, C.; Strosser, P.; Roussard, J.; Grandmougin, B.; Kossida, M.; Kyriazopoulou, I.; Berbel, J.; Kolberg, S. EU Water Saving Potential (Part 1—Report); Institute for International and European Environmental Policy: Berlin, Germany, 2007; pp. 900–949. [Google Scholar]
- Biswas, A.K. Integrated Water Resources Management: A Reassessment: A water forum contribution. Water Int. 2004, 29, 248–256. [Google Scholar] [CrossRef]
- UNESCO. Water: A Shared Responsibility—The United Nations World Water Development Report 2. Dev. Pract. 2007, 17, 309–311. [Google Scholar] [CrossRef]
- Oki, T. Water Resources Management and Adaptation to Climate Change. In Water Security, Climate Change and Sustainable Development; Biswas, A.K., Tortajada, C., Eds.; Springer: Singapore, 2016; pp. 27–40. ISBN 978-981-287-976-9. [Google Scholar]
- WWAP (United Nations World Water Assessment Programme). The United Nations World Water Development Report 2015: Water for a Sustainable World; UNESCO: Paris, France, 2015. [Google Scholar]
- Mianabadi, H.; Mostert, E.; Zarghami, M.; van de Giesen, N. A new bankruptcy method for conflict resolution in water resources allocation. J. Environ. Manag. 2014, 144, 152–159. [Google Scholar] [CrossRef]
- Degefu, D.M.; He, W.; Yuan, L.; Zhao, J.H. Water Allocation in Transboundary River Basins under Water Scarcity: A Cooperative Bargaining Approach. Water Resour. Manag. 2016, 30, 4451–4466. [Google Scholar] [CrossRef]
- Xiao, Y.; Hipel, K.W.; Fang, L. Incorporating Water Demand Management into a Cooperative Water Allocation Framework. Water Resour. Manag. 2016, 30, 2997–3012. [Google Scholar] [CrossRef]
- Chen, Y.; Lu, H.; Li, J.; Ren, L.; He, L. A leader-follower-interactive method for regional water resources management with considering multiple water demands and eco-environmental constraints. J. Hydrol. 2017, 548, 121–134. [Google Scholar] [CrossRef]
- Degefu, D.M.; He, W.; Yuan, L.; Min, A.; Zhang, Q. Bankruptcy to Surplus: Sharing Transboundary River Basin’s Water under Scarcity. Water Resour. Manag. 2018, 32, 2735–2751. [Google Scholar] [CrossRef]
- Fu, J.; Zhong, P.-A.; Zhu, F.; Chen, J.; Wu, Y.-N.; Xu, B. Water Resources Allocation in Transboundary River Based on Asymmetric Nash–Harsanyi Leader–Follower Game Model. Water 2018, 10, 270. [Google Scholar] [CrossRef] [Green Version]
- Patel, S.S.; Ramachandran, P. An optimization model and policy analysis of water allocation for a river basin. Sustain. Water Resour. Manag. 2018, 4, 433–446. [Google Scholar] [CrossRef]
- Qin, J.; Fu, X.; Peng, S.; Xu, Y.; Huang, J.; Huang, S. Asymmetric Bargaining Model for Water Resource Allocation over Transboundary Rivers. Int. J. Environ. Res. Public Health 2019, 16, 1733. [Google Scholar] [CrossRef] [Green Version]
- Neverre, N.; Dumas, P. Projecting and valuing domestic water use at regional scale: A generic method applied to the Mediterranean at the 2060 horizon. Water Resour. Econ. 2015, 11, 33–46. [Google Scholar] [CrossRef] [Green Version]
- Shaw, W.D. Water Resource Economics and Policy: An Introduction; Edward Elgar Publishing: Cheltenham, UK, 2005. [Google Scholar]
- Harou, J.J.; Pulido-Velazquez, M.; Rosenberg, D.; Medellín-Azuara, J.; Lund, J.R.; Howitt, R.E. Hydro-economic models: Concepts, design, applications, and future prospects. J. Hydrol. 2009, 375, 627–643. [Google Scholar] [CrossRef] [Green Version]
- Diaz, G.E. AQUARIUS, a Modeling System for River Basin Water Allocation; US Department of Agriculture, Forest Service, Rocky Mountain Forest and Range Experiment Station: Fort Collin, CO, USA, 1997. [Google Scholar]
- Lei, B. Study on Assessment of Utility of Agricultural Water Resources. Ph.D. Thesis, Chinese Academic of Agricultural Sciences, Beijing, China, 2010. [Google Scholar]
- Gu, X. Study of Evaluation Economic Benefits about Industrial Water in Lanzhou. Ph.D. Thesis, Lanzhou University, Lanzhou, China, 2012. [Google Scholar]
- Davijani, M.H.; Banihabib, M.; Anvar, A.N.; Hashemi, S. Optimization model for the allocation of water resources based on the maximization of employment in the agriculture and industry sectors. J. Hydrol. 2016, 533, 430–438. [Google Scholar] [CrossRef]
- Griffin, R. Water Resource Economics: The Analysis of Scarcity, Policies, and Projects; MIT Press: London, UK, 2016. [Google Scholar]
- Guo, Y.; Shen, Y. Agricultural water supply/demand changes under projected future climate change in the arid region of northwestern China. J. Hydrol. 2016, 540, 257–273. [Google Scholar] [CrossRef]
- Gao, Y.; Yu, M. Assessment of the economic impact of South-to-North Water Diversion Project on industrial sectors in Beijing. J. Econ. Struct. 2018, 7, 4. [Google Scholar] [CrossRef] [Green Version]
- Bierkens, M.F.P.; Reinhard, S.; De Bruijn, J.A.; Veninga, W.; Wada, Y. The Shadow Price of Irrigation Water in Major Groundwater-Depleting Countries. Water Resour. Res. 2019, 55, 4266–4287. [Google Scholar] [CrossRef] [Green Version]
- Wang, J.; Hou, B.; Jiang, D.; Xiao, W.; Wu, Y.; Zhao, Y.; Zhou, Y.; Guo, C.; Wang, G. Optimal Allocation of Water Resources Based on Water Supply Security. Water 2016, 8, 237. [Google Scholar] [CrossRef] [Green Version]
- Zhang, F.; Tan, Q.; Zhang, C.; Guo, S.; Guo, P. A Regional Water Optimal Allocation Model Based on the Cobb-Douglas Production Function under Multiple Uncertainties. Water 2017, 9, 923. [Google Scholar] [CrossRef] [Green Version]
- Ward, F. The economic value of water in agriculture: Concepts and policy applications. Hydrol. Res. 2002, 4, 423–446. [Google Scholar] [CrossRef]
- Divakar, L.; Babel, M.; Perret, S.; Das Gupta, A. Optimal allocation of bulk water supplies to competing use sectors based on economic criterion—An application to the Chao Phraya River Basin, Thailand. J. Hydrol. 2011, 401, 22–35. [Google Scholar] [CrossRef]
- Safari, N.; Zarghami, M.; Szidarovszky, F. Nash bargaining and leader–follower models in water allocation: Application to the Zarrinehrud River basin, Iran. Appl. Math. Model. 2014, 38, 1959–1968. [Google Scholar] [CrossRef]
- Su, X.; Li, J.; Singh, V.P. Optimal Allocation of Agricultural Water Resources Based on Virtual Water Subdivision in Shiyang River Basin. Water Resour. Manag. 2014, 28, 2243–2257. [Google Scholar] [CrossRef]
- Li, M.; Fu, Q.; Singh, V.P.; Liu, D. An interval multi-objective programming model for irrigation water allocation under uncertainty. Agric. Water Manag. 2018, 196, 24–36. [Google Scholar] [CrossRef]
- Cheng, B.; Li, H.; Yue, S. Quantity of Reasonable Distribution of River Ecological Basic Flow Considering the Economic Value of its Own Ecological Functions: A Case Study in the Baoji Section of the Weihe River, China. Water Resour. Manag. 2020, 34, 1111–1122. [Google Scholar] [CrossRef]
- Cheng, B.; Li, H.; Yue, S.; Huang, K. A conceptual decision-making for the ecological base flow of rivers considering the economic value of ecosystem services of rivers in water shortage area of Northwest China. J. Hydrol. 2019, 578, 124126. [Google Scholar] [CrossRef]
- Ahmad, I.; Tang, D. Multi-objective Linear Programming for Optimal Water Allocation Based on Satisfaction and Economic Criterion. Arab. J. Sci. Eng. 2016, 41, 1421–1433. [Google Scholar] [CrossRef]
- Young, R.; Loomis, J. Determining the Economic Value of Water: Concepts and Methods, 2nd ed.; Routledge: New York, NY, USA, 2014. [Google Scholar]
- Ozbafli, A.; Jenkins, G.P. Estimating the willingness to pay for reliable electricity supply: A choice experiment study. Energy Econ. 2016, 56, 443–452. [Google Scholar] [CrossRef]
- Chatterjee, C.; Triplett, R.; Johnson, C.K.; Ahmed, P. Willingness to pay for safe drinking water: A contingent valuation study in Jacksonville, FL. J. Environ. Manag. 2017, 203, 413–421. [Google Scholar] [CrossRef] [PubMed]
- Shao, W.; Yang, D.; Hu, H.; Sanbongi, K. Water Resources Allocation Considering the Water Use Flexible Limit to Water Shortage—A Case Study in the Yellow River Basin of China. Water Resour. Manag. 2008, 23, 869–880. [Google Scholar] [CrossRef]
- Cai, X.; Yang, Y.; Zhao, J.; Ringler, C. Can water allocation in the Yellow River Basin be improved? In Insights from a Multi-Agent System Model; International Food Policy Research Institute: Washington, DC, USA, 2011; Discussion Papers. [Google Scholar]
- Xia, C.; Pahl-Wostl, C. The Development of Water Allocation Management in The Yellow River Basin. Water Resour. Manag. 2012, 26, 3395–3414. [Google Scholar] [CrossRef]
- Wang, Y.; Peng, S.; Jiang, G.; Fang, H. Thirty Years of the Yellow River Water Allocation Scheme and future Prospect. In Proceedings of the 2018 International Symposium on Water Resources System and Operations (ISWRSO 2018), Beijing, China, 12–14 October 2018. [Google Scholar] [CrossRef]
- Tan, Y.; Dong, Z.; Xiong, C.; Zhong, Z.; Hou, L. An optimal allocation model for large complex and ecological needs. Water 2019, 11, 843. [Google Scholar] [CrossRef] [Green Version]
- Tian, G.; Han, X.; Zhang, C.; Li, J.; Liu, J. Virtual Water Flows Embodied in International and Interprovincial Trade of Yellow River Basin: A Multiregional Input-Output Analysis. Sustainability 2020, 12, 1251. [Google Scholar] [CrossRef] [Green Version]
- Cai, X.; Rosegrant, M.W. Optional water development strategies for the Yellow River Basin: Balancing agricultural and ecological water demands. Water Resour. Res. 2004, 40, 69–80. [Google Scholar] [CrossRef] [Green Version]
- Xiang, X.; Svensson, J.; Jia, S. Will the energy industry drain the water used for agricultural irrigation in the Yellow River basin? Int. J. Water Resour. Dev. 2016, 33, 69–80. [Google Scholar] [CrossRef] [Green Version]
- Liu, L.; Ma, J.; Hao, X.; Li, Q. Limitations of Water Resources to Crop Water Requirement in the Irrigation Districts along the Lower Reach of the Yellow River in China. Sustainability 2019, 11, 4680. [Google Scholar] [CrossRef] [Green Version]
- Yang, W. A multi-objective optimization approach to allocate environmental flows to the artificially restored wetlands of China’s Yellow River Delta. Ecol. Model. 2011, 222, 261–267. [Google Scholar] [CrossRef]
- Yang, Z.; Sun, T.; Cui, B.; Chen, B.; Chen, G. Environmental flow requirements for integrated water resources allocation in the Yellow River Basin, China. Commun. Nonlinear Sci. Numer. Simul. 2009, 14, 2469–2481. [Google Scholar] [CrossRef]
- Zhang, Q.; Singh, V.P.; Li, J. Eco-Hydrological Requirements in Arid and Semiarid Regions: Case Study of the Yellow River in China. J. Hydrol. Eng. 2013, 18, 689–697. [Google Scholar] [CrossRef]
- Hua, Y.; Cui, B. Environmental flows and its satisfaction degree forecasting in the Yellow River. Ecol. Indic. 2018, 92, 207–220. [Google Scholar] [CrossRef]
- Madani, K. Game theory and water resources. J. Hydrol. 2010, 381, 225–238. [Google Scholar] [CrossRef]
- Madani, K.; Zarezadeh, M.; Morid, S. A new framework for resolving conflicts over transboundary rivers using bankruptcy methods. Hydrol. Earth Syst. Sci. 2014, 18, 3055–3068. [Google Scholar] [CrossRef] [Green Version]
- Nash, J.F.J. Two-Person Cooperative Games. J. Econom. Soc. 1953, 21, 128–140. Available online: http://www.jstor.org/stable/1906951REFERENCES. (accessed on 1 January 2021). [CrossRef]
- Harsanyi, J.C. A Bargaining Model for the Cooperative n-Person Game; Department of Economics, Stanford University: Stanford, CA, USA, 1958. [Google Scholar]
- Harsanyi, J.C. A simplified bargaining model for the n-person cooperative game. In Papers in Game Theory; Theory and Decision Library; Springer: Dordrecht, The Netherlands, 1982; Volume 28, pp. 44–70. [Google Scholar] [CrossRef]
- Yellow River Conservancy Commission (YRCC). Bulletin of Yellow River Water Resources; Yellow River Conservancy Commission (YRCC): Zhengzhou, China, 1999–2018. [Google Scholar]
- State Develop Planning Commission (SDPC); Ministry of Electricity and Water. Report of Yellow River Available Water Amount Distribution; State Develop Planning Commission (SDPC): Beijing, China, 1987. [Google Scholar]
- State Develop Planning Commission (SDPC). Yellow River Water Dispatch Rules; State Develop Planning Commission (SDPC): Beijing, China, 2006. [Google Scholar]
- Yellow River Conservancy Commission (YRCC). Comprehensive Plan for the Yellow River Basin (2012–2030); State Develop Planning Commission (SDPC): Zhengzhou, China, 2013. [Google Scholar]
- Ma, W.; Opp, C.; Yang, D. Spatiotemporal supply-demand characteristics and economic benefits of crop water footprint in the semi-arid region. Sci. Total Environ. 2020, 738, 139502. [Google Scholar] [CrossRef] [PubMed]
- Mouratiadou, I.; Biewald, A.; Pehl, M.; Bonsch, M.; Baumstark, L.; Klein, D.; Popp, A.; Luderer, G.; Kriegler, E. The impact of climate change mitigation on water demand for energy and food: An integrated analysis based on the Shared Socioeconomic Pathways. Environ. Sci. Policy 2016, 64, 48–58. [Google Scholar] [CrossRef] [Green Version]
- National Development and Reform Commission (NDRC). We Will Accelerate the Establishment of a Perfect of Urban Resident Ladder Water Price System of Guidance; National Development and Reform Commission (NDRC): Beijing, China, 2014. [Google Scholar]
- Duan, Y.; Lei, Y.; Wu, B.; Peng, D. Evaluation and dynamic study on the ecological service value for urban green space system in Zhengzhou. Ecol. Sci. 2016, 35, 81–88. (In Chinese) [Google Scholar]
- Liang, D.; Chen, X.; Zhang, P. Analysis and evaluation of economic benefit of the urban open space. Probl. For. Econ. 2012, 32, 458–460. (In Chinese) [Google Scholar]
- Costanza, R.; D’Arge, R.; De Groot, R.; Farber, S.; Grasso, M.; Hannon, B.; Limburg, K.; Naeem, S.; O’Neill, R.V.; Paruelo, J.; et al. The value of the world’s ecosystem services and natural capital. Nature 1997, 387, 253–260. Available online: https://royalroads.on.worldcat.org/oclc/4592801201 (accessed on 15 January 2021). [CrossRef]
- Costanza, R.; De Groot, R.; Sutton, P.; Van Der Ploeg, S.; Anderson, S.J.; Kubiszewski, I.; Farber, S.; Turner, R.K. Changes in the global value of ecosystem services. Glob. Environ. Chang. 2014, 26, 152–158. [Google Scholar] [CrossRef]
- Zoulia, I.; Santamouris, M.; Dimoudi, A. Monitoring the effect of urban green areas on the heat island in Athens. Environ. Monit. Assess. 2008, 156, 275–292. [Google Scholar] [CrossRef] [PubMed]
- Hamada, S.; Ohta, T. Seasonal variations in the cooling effect of urban green areas on surrounding urban areas. Urban For. Urban Green. 2010, 9, 15–24. [Google Scholar] [CrossRef]
- Dickinson, D.C.; Hobbs, R. Cultural ecosystem services: Characteristics, challenges and lessons for urban green space research. Ecosyst. Serv. 2017, 25, 179–194. [Google Scholar] [CrossRef]
- Zhang, C.; Wu, Q.; Peng, J. Calculation of the value and evaluation of the function for ecosystem services of urban green space: A case study in Nanjing. Ecol. Sci. 2019, 38, 142–149. (In Chinese) [Google Scholar]
- Li, X.; Lei, S.; Feng, J. Assessing the value of cultural ecosystem services in urban green space of Beijing. J. Arid. Land Resour. Environ. 2019, 33, 33–39. (In Chinese) [Google Scholar]
- Dou, Y.; Zhen, L.; De Groot, R.; Du, B.; Yu, X. Assessing the importance of cultural ecosystem services in urban areas of Beijing municipality. Ecosyst. Serv. 2017, 24, 79–90. [Google Scholar] [CrossRef]
- Hanasaki, N.; Kanae, S.; Oki, T.; Masuda, K.; Motoya, K.; Shirakawa, N.; Shen, Y.; Tanaka, K. An integrated model for the assessment of global water resources—Part 1: Model description and input meteorological forcing. Hydrol. Earth Syst. Sci. 2008, 12, 1007–1025. [Google Scholar] [CrossRef] [Green Version]
- Hanasaki, N.; Kanae, S.; Oki, T.; Masuda, K.; Motoya, K.; Shirakawa, N.; Shen, Y.; Tanaka, K. An integrated model for the assessment of global water resources—Part 2: Applications and assessments. Hydrol. Earth Syst. Sci. 2008, 12, 1027–1037. [Google Scholar] [CrossRef] [Green Version]
- Hanasaki, N.; Fujimori, S.; Yamamoto, T.; Yoshikawa, S.; Masaki, Y.; Hijioka, Y.; Kainuma, M.; Kanamori, Y.; Masui, T.; Takahashi, K.; et al. A global water scarcity assessment under Shared Socio-economic Pathways—Part 1: Water use. Hydrol. Earth Syst. Sci. 2013, 17, 2375–2391. [Google Scholar] [CrossRef] [Green Version]
- Hanasaki, N.; Fujimori, S.; Yamamoto, T.; Yoshikawa, S.; Masaki, Y.; Hijioka, Y.; Kainuma, M.; Kanamori, Y.; Masui, T.; Takahashi, K.; et al. A global water scarcity assessment under Shared Socio-economic Pathways—Part 2: Water availability and scarcity. Hydrol. Earth Syst. Sci. 2013, 17, 2393–2413. [Google Scholar] [CrossRef] [Green Version]
- Tennant, D.L. Instream flow regimens for fish, wildlife, recreation and related environmental resources. Fisheries 1976, 1, 6–10. [Google Scholar] [CrossRef]
- Huang, K.; Li, H.; Cheng, B.; Tian, R. Application status and improvement ideas of river ecological base flow based on Tennant method. J. Water Resour. Water Eng. 2019, 147, 106–113. (in Chinese). [Google Scholar]
- Kyriazi, Z.; Lejano, R.; Maes, F.; Degraer, S. A cooperative game-theoretic framework for negotiating marine spatial allocation agreements among heterogeneous players. J. Environ. Manag. 2017, 187, 444–455. [Google Scholar] [CrossRef] [PubMed]
- Fu, J.; Zhong, P.-A.; Chen, J.; Xu, B.; Zhu, F.; Zhang, Y. Water Resources Allocation in Transboundary River Basins Based on a Game Model Considering Inflow Forecasting Errors. Water Resour. Manag. 2019, 33, 2809–2825. [Google Scholar] [CrossRef]
- National Bureau of Statistics of China (NBSC). China Statistical Yearbook 2000–2018; China Statistics Press: Beijing, China, 2001–2019. [Google Scholar]
- National Development and Reform Commission (NDRC). National Agricultural Product Cost-Benefit Data Compilation 2005–2018; China Statistics Press: Beijing, China, 2005–2018. [Google Scholar]
- National Bureau of Statistics of China (NBSC). China Industry Statistical Yearbook 2006–2018; China Statistics Press: Beijing, China, 2007–2019. [Google Scholar]
- Ministry of Housing and Urban-Rural Development of the People’s Republic of China (MOHURD). China Urban Construction Yearbook 2006–2017; China Statistics Press: Beijing, China, 2006–2017. [Google Scholar]
- National Development and Reform Commission (NDRC); Ministry of Housing, Urban-Rural Development of the People’s Republic of China (MOHURD). Guiding Opinions on Accelerating the Establishment and Improvement of the Block Water Price System for Urban Residents. 2013. Available online: http://www.gov.cn/zhengce/2016-05/22/content_5075654.htm (accessed on 3 May 2021).
- China Water Price Network China Water Price. 2021. Available online: http://www.h2o-china.com/ (accessed on 2 May 2021).
- Yuan, X.-C.; Wei, Y.-M.; Pan, S.-Y.; Jin, J.-L. Urban Household Water Demand in Beijing by 2020: An Agent-Based Model. Water Resour. Manag. 2014, 28, 2967–2980. [Google Scholar] [CrossRef]
- Che, J.; Fu, Y.; Wu, Z. Investigation and analysis of Beijing residents’ household water level and water structure. J. China Rural. Water Conserv. Hydropower 2015, 2, 93. (In Chinese) [Google Scholar]
- Sun, J.; Shen, B.; Wang, Z. Different water price model based on basic demand and marginal cost. Yellow River 2015, 10, 50–53. (In Chinese) [Google Scholar]
- Van Houtven, G.L.; Pattanayak, S.K.; Usmani, F.; Yang, J.-C. What are Households Willing to Pay for Improved Water Access? Results from a Meta-Analysis. Ecol. Econ. 2017, 136, 126–135. [Google Scholar] [CrossRef] [Green Version]
- Zhu, Q.; Shen, B.; Sun, J. Application of willingness to pay method in the calculation of Beijing’s water resources fee. Yellow River 2015, 10, 58–61. (In Chinese) [Google Scholar]


| Categories | Water Use |
|---|---|
| Basic water requirements | Drinking, food, and hygiene (e.g., hand washing); highly valued |
| Intermediate needs | Additional hygiene (regular laundry, showers, etc.); less valued than the first category. |
| Supplementary consumption | Further indoor uses (e.g., leisure bath) or outdoor uses (lawn watering, pool, fountain, etc.); least valued |
Publisher’s Note: MDPI stays neutral with regard to jurisdictional claims in published maps and institutional affiliations. |
© 2021 by the authors. Licensee MDPI, Basel, Switzerland. This article is an open access article distributed under the terms and conditions of the Creative Commons Attribution (CC BY) license (https://creativecommons.org/licenses/by/4.0/).
Share and Cite
Zhang, C.-Y.; Oki, T. Optimal Multi-Sectoral Water Resources Allocation Based on Economic Evaluation Considering the Environmental Flow Requirements: A Case Study of Yellow River Basin. Water 2021, 13, 2253. https://doi.org/10.3390/w13162253
Zhang C-Y, Oki T. Optimal Multi-Sectoral Water Resources Allocation Based on Economic Evaluation Considering the Environmental Flow Requirements: A Case Study of Yellow River Basin. Water. 2021; 13(16):2253. https://doi.org/10.3390/w13162253
Chicago/Turabian StyleZhang, Cheng-Yao, and Taikan Oki. 2021. "Optimal Multi-Sectoral Water Resources Allocation Based on Economic Evaluation Considering the Environmental Flow Requirements: A Case Study of Yellow River Basin" Water 13, no. 16: 2253. https://doi.org/10.3390/w13162253