Article

Integration of Water Quality Indices and Multivariate Modeling for Assessing Surface Water Quality in Qaroun Lake, Egypt

1
Hydrogeology, Evaluation of Natural Resources Department, Environmental Studies and Research Institute, University of Sadat City, Sadat City 32897, Egypt
2
Environmental Geology, Surveying of Natural Resources in Environmental Systems Department, Environmental Studies and Research Institute, University of Sadat City, Sadat City 32897, Egypt
3
Agricultural Engineering, Surveying of Natural Resources in Environmental Systems Department, Environmental Studies and Research Institute, University of Sadat City, Sadat City 32897, Egypt
4
Geology Department, Faculty of Science, Damanhour University, Damanhour 22511, Egypt
5
Biology Department, College of Science and Humanities, Prince Sattam bin Abdulaziz University, Al-Kharj 11940, Saudi Arabia
6
Agricultural Engineering, Evaluation of Natural Resources Department, Environmental Studies and Research Institute, University of Sadat City, Sadat City 32897, Egypt
7
Geology Department, Faculty of Science, Menoufia University, Shiben El Kom 51123, Egypt
8
Soil and Water Department, Faculty of Agriculture, Kafrelsheikh University, Kafr El-Sheikh 33516, Egypt
9
Biology Department, College of Science, King Khalid University, Abha 61321, Saudi Arabia
10
Botany Department, Faculty of Science, Kafrelsheikh University, Kafr El-Sheikh 33516, Egypt
*
Author to whom correspondence should be addressed.
Water 2021, 13(16), 2258; https://doi.org/10.3390/w13162258
Submission received: 10 July 2021 / Revised: 14 August 2021 / Accepted: 15 August 2021 / Published: 18 August 2021
(This article belongs to the Section Water Quality and Contamination)

Abstract

:
Water quality has deteriorated in recent years as a result of rising population and unplanned development, impacting ecosystem health. The water quality parameters of Qaroun Lake are contaminated to varying degrees, particularly for aquatic life consumption. For that, the objective of this work is to improve the assessments of surface water quality and to determine the different geo-environmental parameters affecting the lake environmental system in Qaroun Lake utilizing the weighted arithmetic water quality index (WAWQI) and four pollution indices (heavy metal pollution index (HPI), metal index (MI), contamination index (Cd), and pollution index (PI), that are enhanced by multivariate analyses as cluster analysis (CA), principal component analysis (PCA), and support vector machine regression (SVMR). Surface water samples were collected at 16 different locations from the lake during years 2018 and 2019. Thirteen physiochemical parameters were measured and used to calculate water quality indices (WQIs). The WQIs of Qaroun Lake such WAWQI, HPI, MI, Cd, PI revealed a different degree of contamination, with respect to aquatic life utilization. The WQIs result revealed that surface water in the lake is unsuitable, high polluted, and seriously affected by pollution for an aquatic environment. The PI findings revealed that surface water samples of Qaroun Lake were significantly impacted by Al, moderately affected by Cd and Cu, and while slightly affected by Zn due to uncontrolled releases of domestic and industrial wastewater. Furthermore, increasing salinity accelerates the deterioration of the lake aquatic environment. Therefore, sewage and drainage wastewater should be treated before discharging into the lake. The SVMR models based on physiochemical parameters presented the highest performance as an alternative method to predict the WQIs. For example, the calibration (Val.) and the validation (Val.) models performed best in assessing the WQIs with R2 (0.99) and with R2 (0.97–0.99), respectively. Finally, a combination of WQIs, CA, PCA, and SVMR approaches could be employed to assess surface water quality in Qaroun Lake.

1. Introduction

The natural environment has been severely distorted by industrialization and uncontrolled urbanization. Lakes are the world’s most productive, varied, and interacting ecosystems. The aquatic ecosystem is made up of the biological community, physiochemical elements, and their interactions. A complex interplay of physical and biological processes exists within the aquatic environment, and changes do not occur in isolation. On the other hand, an ecosystem has often evolved over time, with species becoming adapted to their surroundings [1,2].
Water quality indicators have received a lot of attention in recent years in water environment research because of the potential for toxic effects, persistence, and bioaccumulation issues that can harm aquatic ecosystems [3,4]. Agricultural activities, several industrial, and urbanization processes can pollute the environment and lead to water ecosystem contamination, endangering aquatic biota and humans [5,6]. Water quality is a crucial component of surface water management, thus evaluating surface water quality for aquatic environments in developing nations is a critical issue in recent times. One of Egypt’s most important inland-aquatic habitats is Qaroun Lake, which is a closed basin that serves as a primary reservoir for agricultural drainage water in Fayoum Province [6]. During the autumn and winter seasons, the lake is an important location for fishing, salt manufacture, tourism, and migrating birds [7]. Because of the greatest richness in biological life, archeological monuments, and geologic formations [8], both natural processes (rain, abrasion, soil erosion, etc.) and human inputs (urban, agricultural, and industrial activities) impose pressure on surface water quality in the lake [9,10]. Along the lake’s southern edge, there are several pollution sources, including agricultural and urban wastewater discharged by Fayoum Province, as well as fisheries [11,12].
Fayoum Province discharges 450 million m3 of untreated effluent into the lake each year [13]. El-Bats and El-Wadi are the two primary drains that receive massive volumes of household, industrial, and agricultural wastewater, which putting a lot of strain on aquatic life in the lake. The quantity and quality of water supply from various sources has a significant impact on water quality, because lakes are still waters that cannot clean themselves, they are more vulnerable to contamination than other water bodies [14]. Because of the growing human population and the associated increase in pollution dangers, lake monitoring and evaluation has become an important issue of lake management. As a result, lake water quality management is required to analyze these effects and provide a path to the long-term socioeconomic and environmental sustainability of this essential resource [13].
The physiochemical parameters such as temperature, pH, TDS, Al, Ba, Cd, Cr, Cu, Fe, Pb, Mn, Ni and Zn are regarded as key indicators and essential markers of water quality and a crucial characteristic in determining water suitability for aquatic life. Since the increasing of trace elements above the limit of quantification can affect water quality and damage the environment and anthropogenic activities [15,16]. The heavy metal; as Zn is poisonous in excessive amounts, despite the fact that it is “vital” components for life organisms [17].
Water quality has deteriorated in recent years because of rising population and unplanned development, impacting ecosystem health. In order to understand the impacts on water quality and living creatures, it is necessary to investigate water quality parameters in aquatic environments. Natural and human processes, as well as the transfer of nutrients and trace elements to surface waters have an impact on water quality in any region [9,10,18,19]. Water quality indices (WQIs) are crucial in this process, which are considered a communication tool for transferring water quality data and should be calculated to monitor water quality [20,21,22]. Therefore, some documented water quality indices, such as WAWQI, HPI, MI, Cd and PI were utilized in this research to determine the current state of surface water hydrochemistry and the appropriateness of water for aquatic ecosystems. PIs are helpful techniques for assessing surface water quality which reflect the cumulative impacts of trace elements to indicate overall water quality and contamination degree [23,24,25]. Water pollution indices are considered an efficient method of ensuring safety by developing a control plan for monitoring the development, expansion, urban production, and direction of human activities in order to prevent negative effects on water quality resources [26,27,28].
The WAWQI is an arithmetic weighted technique for classifying water quality based on purity levels [29]. The HPI is a useful tool for assessing the impact of specific trace elements on overall water quality and perceptions of surface water suitable for human consumption [30]. Furthermore, the MI takes into account the cumulative effects of trace elements, allowing for a quick evaluation of overall water quality [31]. The Cd evaluates the degree of pollution impacts on water quality in terms of specific trace elements. In addition, PI evaluates the relative toxicity of particular metals separately, which represents the combined impact of all metals on water quality and contamination level [32]. Therefore, the degree of pollution by trace element is measured as a combination of the individual contamination parameters via means of cumulative effects of trace elements that are regarded harmful to the aquatic environment.
Multivariate analysis of environmental data is widely used to identify potential pollution sources that affect water systems, and it is a significant approach for dependable water resource management as well as quick pollution issue solutions [33,34,35]. In the evaluation and monitoring of trace element contamination of water, cluster analysis (CA) and principal component analysis (PCA) are often used [36,37]. The CA and PCA were used to classify metals or investigated parameters into distinct factors/groups based on the predicted source of contribution and also, can assist in the organization and simplification of huge data sets in order to give useful insight [38]. Furthermore, water quality may be evaluated utilizing a geographic information system (GIS) as well as multivariate statistical modeling. Through interconnected layers of component geographical information, GIS can reflect the real environment [39,40]. GIS makes it simpler to analyze landscape features by providing spatial data that are not readily available through field research [41,42]. The geoprocessing models are crucial because they automate and record various phases of geospatial processing, as well as the complete geospatial data management process [43]. Pollution indices assist in identifying and mapping pollution levels, as well as determining present and prospective negative impacts on the aquatic system.
Combination of the WAWQI and PIs is a useful and practical method for detecting surface water quality using machine learning models such as support vector machine regression (SVMR), which are necessary for policymakers to understand the current state of surface water quality and its control mechanisms. In addition, this is useful in determining the best treatment techniques to address specific problems [28,44,45,46,47]. To calculate these indices by tradition equations methods require several steps, accuracy in the calculation, time and high effort to convert a large number of water characterization data into a single value (WAWQI or PIs) to describe the level of water quality [29,48]. To overcome this problem, the SVMR could be used since it is a common method for specifying non-linear between a set of independent variables and response variables [45,49,50]. The SVMR use a several data of water characterization as into a single index to improve water parameter estimation. As a result, the water indices such as WAWQI and PIs can be analyzed simultaneously using this approach throughout a wide range of water characterization data. The SVM can translate data into a new high-dimensional space using a kernel function. Then, using a subset of sample cases known as support vectors, a predictive model is formed [49,50,51]. To the best of our knowledge, little research has compared the performance of SVMR in predicting WQIs using water characterization data. Several distinct water quality indexing methods are used in this study to offer a comparison outcome of their results. Therefore, the objectives of this work were to (i) assess the appropriateness of surface water for aquatic environments using the WAWQI; (ii) assess the contamination risk of surface water using PIs; (iii) classify physiochemical parameters into distinct groups/factors using CA and PCA; and (iv) evaluate the efficiency of SVMR models based on physical parameters and trace elements to predict the WAWQI as well as based on trace elements to predict PIs.

2. Materials and Methods

2.1. Study Area

Qaroun Lake is part of the Fayoum Depression, which was produced by natural circumstances in the northeastern section of Egypt’s Western Desert. It is considered a closed shallow semi-saline lake lying between longitudes 30°24′ and 30°50′ E and latitudes 29°24′ and 29°33′ N (Figure 1), with an area of about 200 km2 and forming the deepest part in the Fayoum Depression with no outflow except evaporation [52]. The research area is rectangular and elongated in shape, with average measurements of 45 km in length, 5.7 km in width, and 4.2 m in depth [53]. The urban and agricultural regions border the lake on the south and east, while the uninhabited desert lands border it on the north and west.
Qaroun Lake serves as a large natural reservoir for various effluents (agricultural, household, sewage, and industrial wastes) that flow through the eastern and southern drains from a great portion of Fayoum Province [7]. The drainage system has two major drains (El-Bats and El-Wadi) as well as several subsidiary drains (Sheikh Allam and Bahr Qaroun) that go to the lake (Figure 1). The investigated catchment is located in Egypt’s desert region, where the temperature is typically warm and dry, with a hot, long dry summer and a moderate, short winter [53]. Low seasonal rainfall (10 mm/y) and a high evaporation rate (7.3 mm/day) are further characteristics of the study area [54,55].

2.2. Sampling and Analyses

Water samples were obtained from 16 points across Qaroun Lake in July (dry season) over two years 2018 and 2019 (Figure 1). The location of the collected samples was determined by UTM coordinates using handheld MAGELLAN GPS 315. Physical properties of the water samples such as T °C, pH, and TDS were measured in situ using a calibrated YSI Professional Plus handheld multi-parameter instrument (Hanna HI 9811-5). Some 500 mL polyethylene bottles with pre-marked labels and acidified with nitric acid to a pH less than 2 were used to collect surface water samples. The bottles were immediately closed and stored in a 4 °C refrigerator until further examination. Standard analytical procedures [56] were used to analyze trace elements such as Al, Ba, Cd, Cr, Cu, Fe, Pb, Mn, Ni and Zn using inductively coupled plasma mass spectrometer (ICAP TQ ICP-MS Thermo Fisher Scientific Inc., Waltham, MA, USA) at Environmental and Food Lab, University of Sadat City, which accredited according to ISO/IEC 17025/2017. The findings are shown in Table 1. Duplicates were performed during the analysis for quality assurance and quality control (QA/QC) of the surface water samples to provide better data confidence from the analytical procedure. Also, the precision of the method was certain by testing certified reference materials (ERM-CA713).

2.3. Indexing Approach

2.3.1. Weighted Arithmetic Water Quality Index (WAWQI)

The WAWQI assess water quality based on the degree of purity using the most routinely measured water quality criteria. The WAWQI is the most appropriate index for determining the overall quality of surface water for aquatic utilization, and it is defined by mathematical approaches using the equation published by Rown et al. [29]. The weighted arithmetic approach is used to compute the WAWQI according to Equation (1):
WAWQI = i = 1 n Q i W i
Each variable’s sub-quality index is called Qi, Wi the weight unit of the specified variable is Wi, and there were 13 physicochemical characteristics (n = 13) that were expressed in mg/L. According to the Canadian Council of Ministers of the Environment, the calculated value of Qi is based on the surface water concentration (Ci) and the standard (Si) for each surface water parameter’s aquatic life value [57], as shown in Equation (2):
Q i = C i S i × 100
W i = w i w i
The recommended standards are used to calculate wi for each parameter [57] by Equation (4):
wi = K/Si
The proportionality constant is K.
To calculate the WAWQI, a weight must be assigned to each surface water parameter (wi), and the relative weight (Wi) and quality rating range (Qi) must be calculated. Therefore, Wi values were assigned for selected physicochemical (Table 1), while wi was computed using Equation (4). The arithmetic weight approach was used to assign weighted values. The weights (wi) and arithmetic weights (Wi) for the water parameters are presented in Table 2.

2.3.2. Pollution Indices (PIs)

HPI, proposed by Prasad and Bose [58], MI, proposed by Tamasi and Cini [48], Cd, established by Backman et al. [59], and PI, proposed by Caerio et al. [32], are the four techniques utilized in this work. The pollution indices including the HPI, MI, Cd and PI were assessed for the concentrations of selected ten trace elements in Table 1 according to the following equations:

Heavy Element Pollution Index (HPI)

Each chosen parameter was given a rating or weight (Wi) to create the HPI index [60]. A toxicity index (HPI) based on mathematical weights of trace elements were used to reflect overall water quality with respect to the recommended standard guidelines (Si) for each metal for aquatic environment [57]. The concentration limits, i.e., the standard permitted value (Si) and maximum desired value (Ii) for each parameter, were obtained from the [57] standards (Table 2) for computing the HPI for the current water quality data. Therefore, the HPI values were estimated according to Equation (5):
HPI = i = 1 n W i Q i i 1 n W i
where Wi and Qi indicate the unit weights and the sub-indices for selected trace elements in Table 1 and the number of trace elements being tracked is n = 10.
The sub-index (Wi) and (Qi) are calculated by Equations (6) and (7):
Wi = K/Si = 1/Si
where K is the proportionality constant and Si is the ith parameter’s standard allowable value.
Q i = i = 1 n ( M i I i ) ( S i I i ) × 100
The monitored value of heavy metal, ideal, and standard values of I parameter, respectively, are M, I and S. The symbol (−) denotes the numerical difference between the two numbers, but the algebraic sign is ignored. Low trace element pollution (HPI < 100), trace element pollution with threshold risk (HPI = 100), and excessive heavy metal pollution (HPI > 100) were the three categories for HPI values [58,61,62].

Metal Index (MI)

The Metal Index (MI) is a technique for determining the overall quality of water in terms of metals. It is based on a complete trend evaluation of the current state [61]. Therefore, the MI according to Equation (8) represents water quality conditions under metal stress.
MI = i = 1 n H c H m a x  
where Hc is the concentration of trace elements, Hmax is the maximum permitted concentration for each metal, and i is the ith sample [48].

Contamination Index (Cd)

The degree of contamination (Cd) was calculated and measured based on the contamination factors of specific trace elements that exceeded acceptable limits [32,61], according to Equations (9) and (10):
C d = i = 1 n C fi
C fi = C Ai C Ni 1
where Cfi is the contamination factor for each trace element, the analytical value for each metal is CAi, CNi is the acceptable concentration for each metal, and CNi is referred to as MAC (Table 2).

Pollution Index (PI)

For trace elements, pollution impact on surface water was assessed using PI values based on individual metal computations and classified into five groups (Table 3), which reflect the individual contamination effect of each trace element on surface water quality according to Equation (11):
PI = [ ( C i S i ) m a x 2 + ( C i S i ) m i n 2 ] 2
where Ci is the metal concentration and Si is the metal level in relation to the metal concentration in water [32,63].

2.4. Data Analysis

The physicochemical parameters and WQIs were statistically analyzed using to compute statistical variables (e.g., minimum, maximum, mean, and standard deviation). The Pearson correlation coefficient was utilized to establish the relationships between WQIs, physical and chemical characteristics of water samples, as well as the significance thresholds at 0.05 and 0.001. For water quality evaluations, the CA and PCA are applied to enhance the identification of effective contaminant components in surface water based on transforming data from chemical analyses into recognizable patterns [64,65,66,67]. The CA and PCA were utilized to recognize the sources or factors that were responsible for changes in water quality by converting the original variables into a new set. PAST software (version 3.25) was used to process above statistically analyzed of the physicochemical parameters and WQIs, Pearson correlation coefficient and the analytical chemical findings of the physicochemical concentrations for CA and PCA. The maps are created using GIS methodology version 10, which is based on inverse distance weighted interpolation (IDW), which is one of the most basic and widely used interpolation methods for mapping various characteristics [6,68,69]. Using ArcGIS’s IDW tool, the statistical relationships between the known locations were identified, and the concentrations of trace elements in the research area were calculated.

2.5. Support Vector Machine Regression

The SVMR algorithm is a machine learning theory that can be used to classify and recognize patterns. Version 10.2 of the unscramble X program (CAMO Software AS, Oslo, Norway) was used to construct the SVMR models. The SVMR model was used to establish calibration (Cal.) and validation (Val.) models of the WAWQI based on three physical parameters and ten trace elements as input data and for PIs with respect to ten trace elements (Table 1). For example, the SVMR of calibration model for testing a single dependent variable (e.g., contamination index (Cd) used several independent variables (e.g., Al, Ba, Cd, Cr, Cu, Fe, Pb, Mn, Ni and Zn). The measured datasets were randomly divided into two sets of progressions, 67 percent training and 33 percent testing datasets, to construct the models. The performance of SVMR for (Cal.) and (Val.) models was evaluated to predict the WQIs based on four criteria (determination coefficient (R2), root mean square error (RMSE), mean absolute deviation (MAD), and accuracy (Acc). The optimal model was selected based on the lowest RMSE and MAD, as well as the highest R2 and Acc.
R2, is computed according to Equations (12)–(15) as the following:
R 2 = 1 i = 1 n W Q I o i W Q I f i 2 i = 1 n W Q I o i 2
The RMSE is calculated with the following equation:
RMSE = i = 1 n W Q I o i W Q I f i 2 n
The MAD determines the precision of constant variables, as seen below:
MAD = i = 1 n W Q I o i W Q I f i n
The Acc is calculated with the following equation:
Acc = 1 abs ( mean W Q I f i W Q I o i W Q I o i )
W Q I o i represents the observed value, and n represents the number of data points. WQIfi, on the other hand, is the predicted value.

3. Results and Discussion

3.1. Physicochemical Data

Physiochemical parameters play an important role in water quality evaluations and are a valuable source for learning about water chemistry and quality. Table 4 shows statistical descriptions of physicochemical characteristics regarding trace elements in surface water samples taken from Qaroun Lake over two years. Temperature is a key element in the aquatic environment and one of the variables that determines water quality, which controls biological, physical, and chemical activities in water. The water temperature varied between a minimum of 28.8 °C to maximum of 34.2 °C; with an annual average of 31.5 °C during summer across two years. Although, water in Qaroun Lake lies in the optimal range for most of the aquatic organisms, the steep temperature gradients, can have direct harmful effects on fish according to CCME [57] for aquatic life. In addition, the surface water pH values varied from 7.8 to 8.4, with a mean of 8.2, which fell in the range of acceptable water for the aquatic environment system according to the guidelines of the CCME [57]. The pH values of the surface water samples indicated a slightly acidic to alkaline water as well as an increase in planktonic algae photosynthetic activity [70]. The TDS values for the collected samples ranged between 27,652.27 mg/L and 39,056.09 mg/L, with a mean value of 35,679.37 mg/L. Because of the effect of evaporation associated with very high solute dissolution and continuous recharging from agricultural, domestic, sewage, and industrial wastes in the closed lake, the TDS values in the obtained samples revealed that the surface water at Qaroun Lake was semi-saline type (e.g., 10,000–100,000 mg/L).
On the other hand, the trace element concentrations of Al, Ba, Cd, Cr, Cu, Fe, Pb, Mn, Ni and Zn showed mean values of 0.29, 0.053, 0.21, 0.016, 0.012, 0.10, 0.0068, 0.005, 0.004, and 0.003 mg/L, respectively as the following trend: Al > Ba > Fe > Ni > Cu > Zn > Pb > Mn > Cr > Cd. To the best of our knowledge, trace elements in water come from two sources: natural (rock weathering and soil leaching) and anthropogenic (urban residential and industrial waste and chemical fertilizer usage). The trace elements concentrations in the collected water samples differed significantly between samples, indicating that the surface water was contaminated by Al, Ba, Cd, Cu, Mn, and Zn, at levels that were higher than the proposed permissible limits for the protection of aquatic life according to the CCME [57]. The obtained physicochemical results for the studied area were agreement with the results reported by many studies in this region [26,71]. For example, the result averages of the researched parameters were compared with the variables studied of Wadi El-Rayan Lakes in Fayoum Province utilizing eight heavy metals (Cd, Cr, Cu, Fe, Mn, Ni, Pb, and Zn) to assess metal pollution in the Lakes’ water [26]. According to the findings, Pb and Cd concentrations in the upper lake exhibited a temporal significant difference (p < 0.05), but Fe, Ni, Zn, and Cu values showed a highly spatial significant difference (p < 0.01). These findings revealed that the discharge of untreated effluents, sewage, and agricultural chemicals into the lakes via the El-Wadi drain and the increasing rate of water evaporation result in increased metal levels, potentially reversing the dramatic transformation story of Qaroun Lake and the deterioration of the aquatic environment.
Furthermore, a long-term change of water quality characteristics and metal pollution load of Fe, Mn, Zn, Cu, and Cd of heavily polluted Mediterranean Lakes in Egypt, were investigated [72]. The comparison of the five lakes revealed an increase in most metal values at Qaroun Lake, Mariut Lake, Manzala Lake, and Burullus Lake, except Mn, which had higher levels than Manzala Lake. Burullus Lake was rated third, followed by Idku Lake. The results (Table 5) revealed that the values of all examined metals in several northern Egyptian lakes exceed the CCME permitted levels [57].

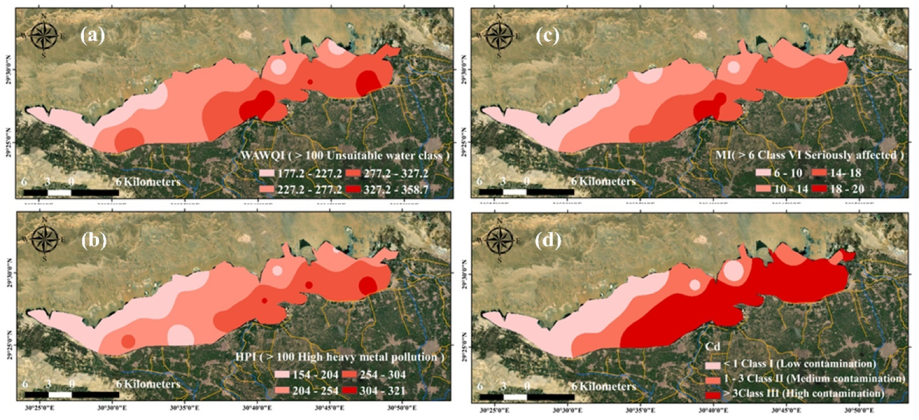
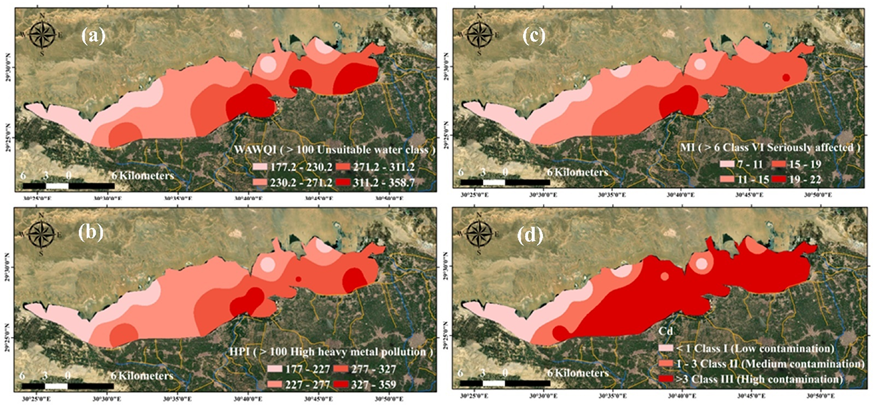
3.2. Water Quality Indices

Table 6 presented statistical descriptions of water quality indices such as the WAWQI, HPI, MI, and Cd over two years. The WAWQI values ranged from 154.591 to 358.788, with a mean value of 252.461, and the findings obtained revealed that 100% of water samples were unsuitable water categories and not recommended for the aquatic environment (Table 7). The spatial distribution map of WAWQI values of the surface water in the study area increasing from northwest to southeast direction indicates that most of the surface water quality degradation was observed near the downstream of drainage network in front El-Bats and El-Wadi drains at the end of drain discharging in the lake (Figure 2a and Figure 3a). This may be attributed to runoff untreated agricultural and municipal wastewater into the lake.
The HPI values ranged from 154.5875 to 358.8039, with a mean value of 252.4668, which presented that 100% of samples were above the critical HPI value, representing water highly polluted by trace elements (Figure 2b and Figure 3b). The MI values of the surface water samples ranged from 6.343048to 22.7259, and according to the MI findings, trace elements had a significant impact on all surface water samples (Table 7). Based on the spatial variation map of MI findings, in the northeastern and southwestern regions of the lake, surface water samples were more influenced by trace elements (Figure 2c and Figure 3c). The PIs including the HPI, and MI showed that surface water of Qaroun Lake was highly polluted and seriously affected by heavy metals for the aquatic ecosystem. The heavy metal pollution increased gradually from the southeast to northwest direction (Figure 2b,c and Figure 3b,c).
The computed values for Cd of water samples presented that the Cd values ranged from −3.65695 to 12.7259. The Cd calculated found that 50% of surface water samples had positive values (Cd > 1), indicating highly contaminated surface, and about 16% of samples indicating medium contaminated water (Figure 2d and Figure 3d), while the remaining samples about 34% had negative values (Cd < 1), indicating better water quality for aquatic environment with respect to trace elements (Figure 2d and Figure 3d). The Cd values revealed the degree of contamination by metals across two years resulting from continuous rapped discharging of untreated wastewater from the drains, especially in the front of the lake (Figure 2d and Figure 3d).
A comparison of the spatial distribution maps of the WAWQI and PIs findings (Figure 2 and Figure 3) indicated a decrease in surface water quality for aquatic utilization. There are no noticeable changes in the spatial distribution of WQIs for the lake between two years because of slight increase in physicochemical characteristics across two years.
The water quality degradation in Qaroun Lake showed that according to HPI, surface water was severely polluted, and heavy metals had a significant impact, according to MI. While significant levels of water contamination for Al, Cd, Cu, and Zn revealed differences in the evaluation schemes for metal concentrations [57]. The study area’s surface water quality was deteriorating due to rising amounts of swept-out effluents from various drains into the lake.
Based on the classification of PI levels, the PI data revealed two groups of trace element effects (Table 8). The PI values obtained demonstrated that Al had a severe impact on the surface water samples (Figure 4). (PI = 3.51), moderately affected by Cd (PI = 2.43) and Cu (PI = 2.76), and slightly affected by Zn (PI = 1.69), while there were no effects exerted by Ba, Cr, Fe, Pb, Mn, and Ni (PI < 1.0) as shown in Figure 4. The PI results revealed that the surface water points were strongly affected by Al and moderately affected by Cd and Cu, while slightly affected by Zn (Table 2). According to the obtained PI results, the high loadings of Al and Cu may be attributed to industrial activities, while the high loading of Cd and Zn revealed anthropogenic activities and poor sanitation infrastructure. For example, Goher et al. [26] applied PIs for assessing the water quality status in Wadi El-Rayan Lakes. According to metal index values, all selected surface water samples from the Lakes are seriously threatened with metal pollution, and the PI values showed that surface water of Wadi El-Rayan Lakes were slightly affected by Cr, and Pb and moderately affected by Cd and Cu, while no pollution effect by Fe, Mn, Zn, and Ni for aquatic utilization.
According to foregoing findings, the PIs in Qaroun Lake have tended to rise, because of uncontrolled releases of domestic and industrial wastewater. Therefore, combining the WAWQI and PIs is a useful and practical method for assessing surface water quality in aquatic ecosystems using physicochemical characteristics in relation to trace elements.

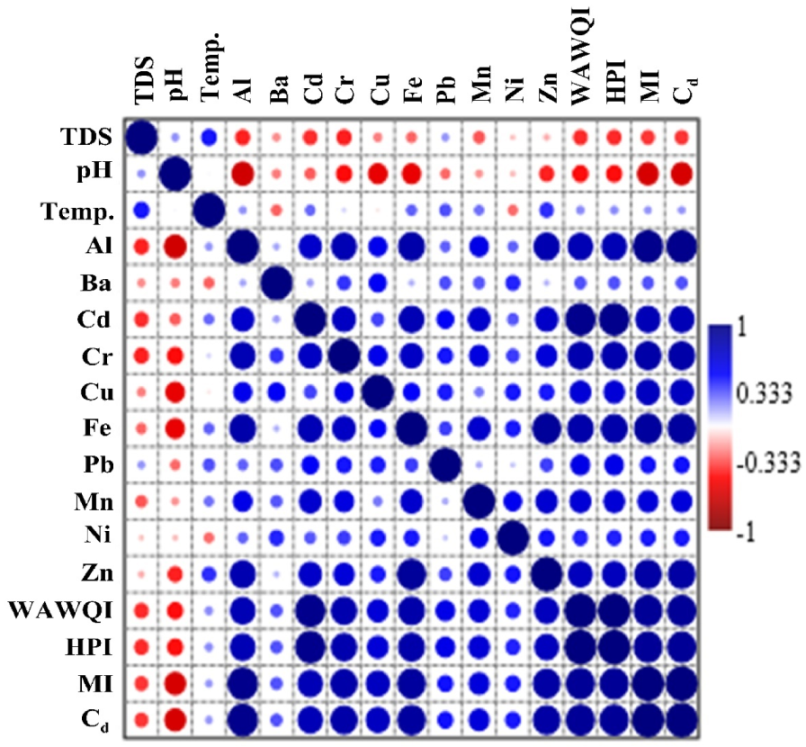
3.3. Correlation Matrix between WQIs and Physicochemical Parameters

The correlation between physiochemical parameters, WAWQI and three PIs were computed via simple regressions as presented in Figure 5. The WAWQI vs. HPI, MI and Cd showed a high positive and significant correlation, with r = 0.91 for MI and Cd and with r = 0.91 for HPI. The significant correlation coefficients for the matrix of physiochemical parameters, WAWQI and three PIs varied from 0.51 to 1.00. The correlations among four water quality indicators and physiochemical parameters indicated that TDS, temperature, Ba, and Ni showed non-significant correlation with the four water quality indicators. On other hand, there were positive and strong correlation between four water quality indicators with Al, Cd, Cr, Cu, Fe, Mn and Zn and r varied from 0.64 to 0.95. Moderate correlation between WAWQI and HPI was found, with r = 0.59. Al showed the highest correlation coefficient with the MI and Cd with r = 0.95, Cd showed the highest correlation coefficient with the WAWQI and HPI, with r = 0.94 and Zn showed the highest correlation coefficient with the MI and Cd, with r = 0.85.

3.4. Multivariate Statistical Analysis

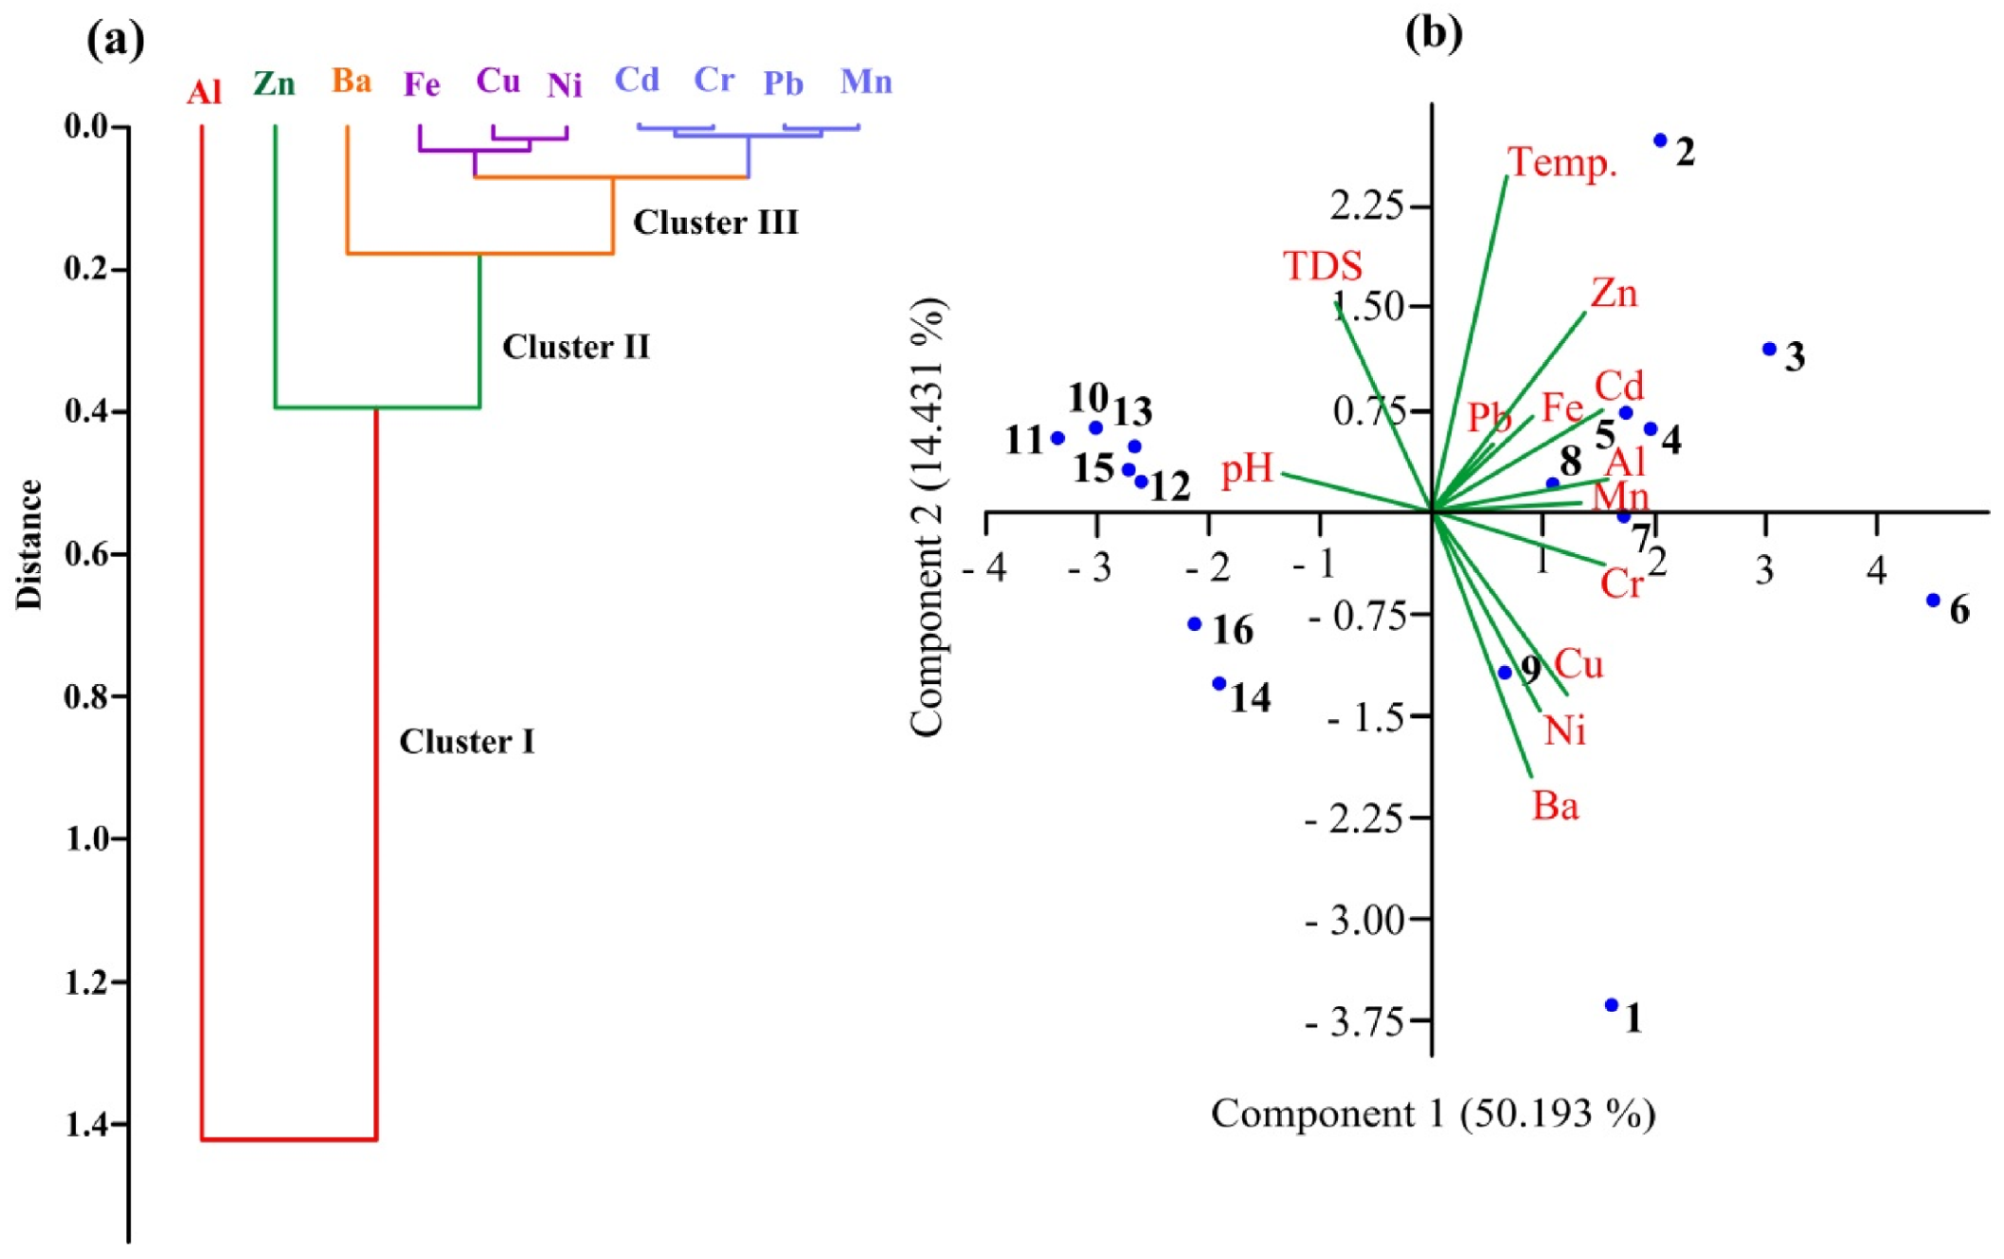
3.4.1. Cluster Analysis

The CA was used to identify water quality changes and to classify various physicochemical characteristics by transforming the initial variables into a new set of variables associated with water. Three forms of clustering were discovered in the CA findings for trace elements, including Al and Zn (Cluster I). Another cluster includes Ba (Cluster II), which was further split into two sub-clusters, one representing Fe, Cu, and Ni and the other representing Cd, Cr, and Mn (Figure 6a). High contributions of Al, Zn, and Ba may be attributable to industrial and agricultural wastewater arising from human actions, according to the CA of the physicochemical (Figure 6a). Trace elements such as Fe, Cu, Ni, Cd, Cr, Pb and Mn are included in a distinct cluster, revealing anthropogenic activities and quickly increasing industry sectors in Fayoum Province. Therefore, the main causes of trace element pollution in Qaroun Lake revealed industrial leaching and precipitation with increasing human activities [76,77].

3.4.2. Principal Component Analysis

Figure 6b shows the results of a PCA for physicochemical characteristics regarding trace elements for surface water stations over two years. PC1 explained 50.193% of total variance was prevailed by large positive loading of T °C, Zn, Cd, Al, Mn, Cr, Cu, Ni, Fe, Pb, and Ba especially from sample 1 to 9. PC2, (pH and TDS) 14.431% of the total variations were highly associated at samples 12 and 15, (Figure 6b). All trace components were clustered together in positive loading combinations, which revealed a strong relationship between the variables. The existence of ten essential main principal components showed the influence of trace elements on surface water quality in the research region, according to the PCA results. Therefore, PC1 showed maximum loading of T °C, Al, Cd, Mn, Fe, Pb and Zn in samples No. 2, 3, 4, 5, and 8, while PC2 showed maximum loading of pH and TDS in samples No. 1, 6, and 9 (Figure 6b). The PCA of surface water samples for the physicochemical parameters revealed the loadings of Al, Cd, Ba, Ni, Cu, Cr, Mn, Fe, Pb and Zn on PC1 and the loadings of pH and TDS on PC2 (Figure 6b). These findings could be attributable to industrial and anthropogenic operations in the research region [78,79,80], that lead to contamination of Qaroun Lake by individual metals, especially the high loadings of Ba, Cr, Cd, and Zn. Furthermore, phosphorus fertilizers are a source of several harmful trace metals such as Cd, Cr, and Zn, which are mostly anthropogenic origin [16,81,82].
Most surface water locations in the research area had high contaminated water, as shown by a strong agreement between PCA and Cd. Agriculture runoff, discharge of industrial wastewater, and urban sewage through the estuary have all developed near the research area in recent years, as evidenced by the integration of trace element contributions in PCA and PIs. Therefore, combining PCA and PI for surface water quality assessment regarding trace elements is a beneficial and adaptable approach that holds exceptional potential and provides unique insights.

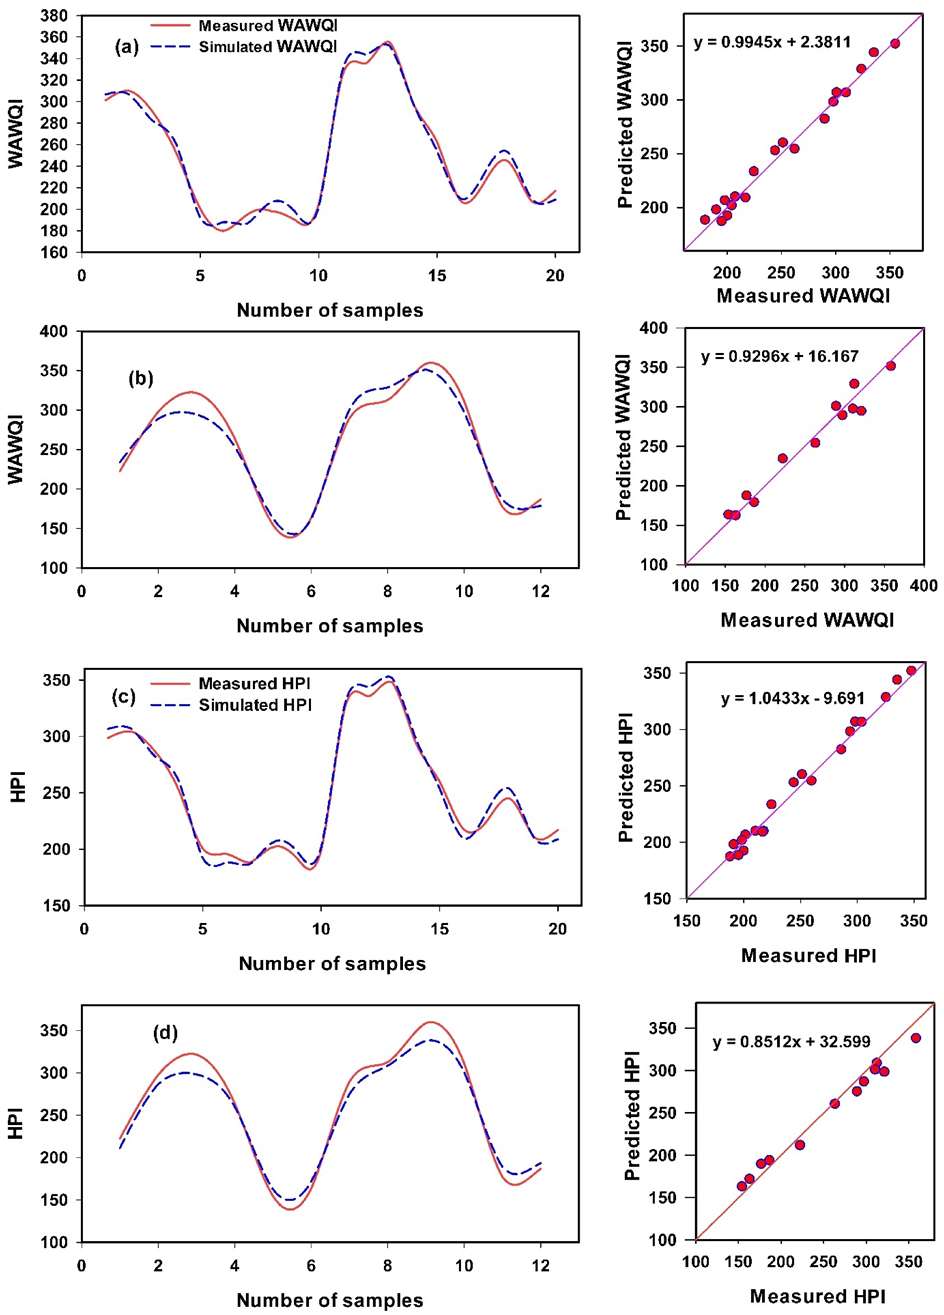
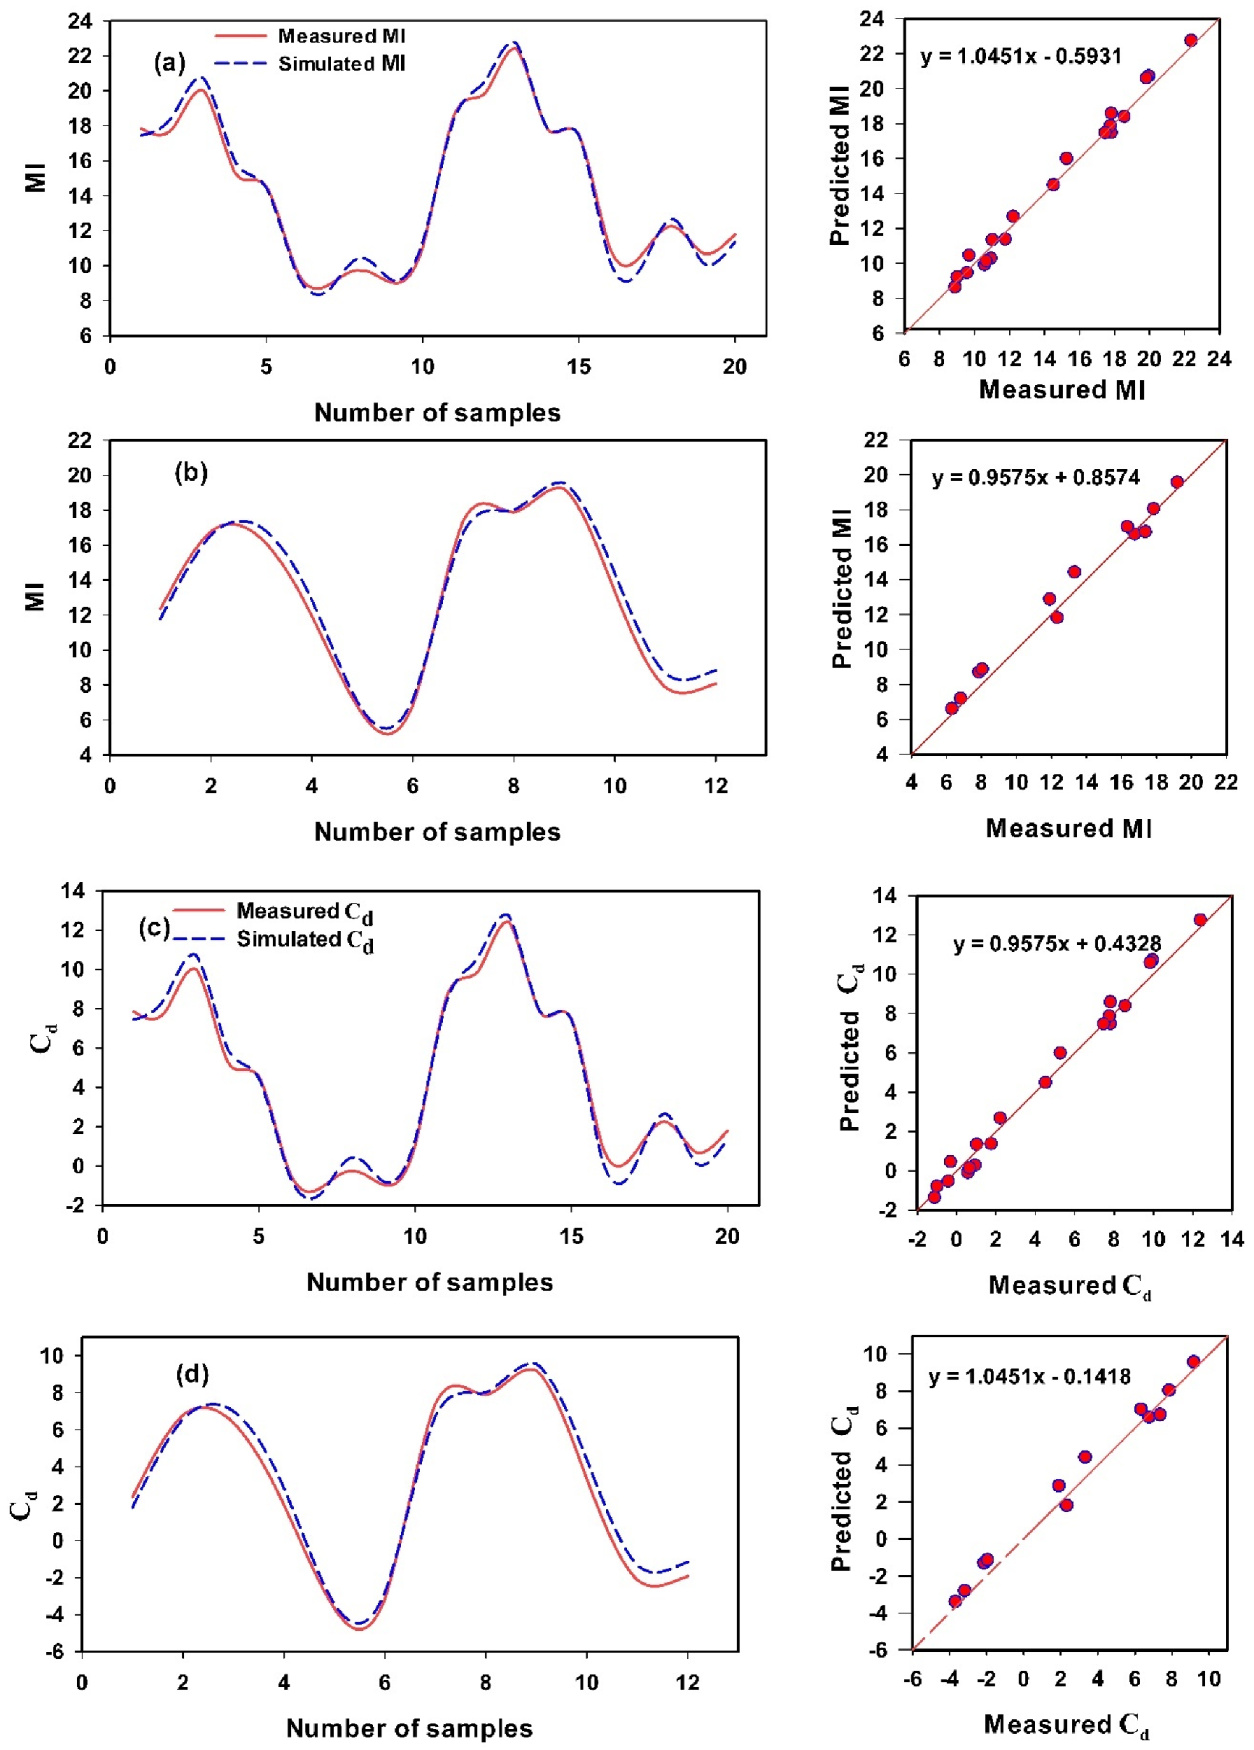
3.5. The Support Vector Machine Regression Models to Predict Water Quality Indices

The mathematical methods can be used to calculate accurate estimation of the WAWQI, HPI, MI and Cd of surface water based on physiochemical parameters. Although, these methods are accurately but require more time, efforts, and several steps to converts several input data to obtain on single value as output data. The SVMR is easy method to predict single model including multiple response variables as input data [46,50,83]. The SVMR model can solve both regression and classification problems, as well as mapping low-dimensional nonlinear input to high-dimensional output [49,51].
Table 9 shows the R2, RMSE, MAD, and Acc of the calibrating and validating datasets of the SVMR models based on all three physical parameters and ten trace elements to predict WAWQI and based on ten trace elements to predict HPI, MI and Cd of surface water quality. Generally, the SVMR models provide a more accurate estimation of the different WQIs in both calibrating and validating datasets. For example, R2 was 0.99 in the calibrating datasets and from 0.97 to 0.99 in the validating ones. The RMSE of validation model was 12.64, 12.65, 0.63 and 0.63 for WAWQI, HPI, MI and Cd, respectively. The MAD of validation model was 11.16, 11.23, 0.56 and 0.56 for WAWQI, HPI, MI and Cd, respectively. The Acc of the Cal. models varied from 0.995 to 0.999 and the Acc of the Val. models varied from 0.966 to 0.998. Measured data plotted against the predicted WAWQ and HPI values are in Figure 7; the plots for MI and Cd are in Figure 8.
From the calibrating to validating testing periods, the SVMR model demonstrated a very minimal decline in performance quality (R2, RMSE, MAD, and Acc) for all four WQIs (Table 9 and Figure 7 and Figure 8). Figure 7 and Figure 8 show matching and 1:1 scatter plot and of the measured and predicted values of calibration and validation models of the WAWQI and PIs of SVMR for water samples analysis. A very small discriminating insight emerges in Figure 7 and Figure 8, which displays the small difference between predicted and measured of four indices values for the calibrating and validating phases. The equation slope of the Cal. models varied from 0.957 to 1.045 and the equation slope of the Val. models varied from 0.851 to 1.045 (Figure 7 and Figure 8).
To the best of our knowledge, the topic of applying machine learning (SVMR) to predict the WAWQI, HPI, MI, and Cd using physiochemical factors has not been addressed. Recently, multivariate regression models based on partial least squares regression (PLSR), and stepwise multiple linear regressions (SMLR) can accurately predict water quality indices [28]. For both the Cal. and Val. Models, Gad et al. [28] reported that PLSR based on data for many trace elements was accurate to predict PLs and drinking water quality index (DWQI) and R2 ranged from 0.98 to 1.00 for the Cal. models and 0.88 to 0.99 for the Val. models. As well as PIs and the DWQI of the SMLR models, which included major ions and heavy metals as input data, provided the best prediction for both indices with R2 = 1. Principal component regression (PCR) and SVMR were found to be robust models for predicting six irrigation water quality indices in the Cal. and Val. models by Elsayed et al. [46], with R2 ranging from 0.48 to 0.99. In addition, multiple linear regression (MLR) including physicochemical parameters as input data were found by Chen and Liu [84] to be useful in estimating water quality variables such as chlorophyll disk depth, total phosphorus and, dissolved oxygen, with R2 values of 0.55, 0.31, and 0.64, respectively. Finally, the findings of this research show that SVMR has the ability to predict WAWQI, HPI, MI, and Cd in surface water.

4. Conclusions

In this study, water quality indices (IWQs), multivariate statistical techniques such as CA and PCA and machine learning as SVMR based on physicochemical were tested to characterize the suitability of surface water quality for aquatic utilization in Qaroun Lake, Egypt. According to the acquired analytical data, the surface water in the analyzed area of Qaroun Lake was semi-saline water type, and the trace element contents as the following trend of Al > Ba > Fe > Ni > Cu > Zn > Pb > Mn > Cr > Cd. The surface water was heavily influenced by Al, moderately influenced by Cd and Cu, while slightly influenced by Zn. Surface water quality of Qaroun Lake has deteriorated due to widespread use of agricultural fertilizer and pesticides, industrial activity, and insufficient drainage networks. As well as the WQIs, which are confirmed by multivariate statistical analysis, indicate that industrial effluents and landfill leachates/municipal sewage were considering the primary sources of trace element contamination in Qaroun Lake. So that, the use of effective wastewater treatment procedures prior to disposal into the lake will contribute to greater remediation of surface water quality deterioration in the investigated region. In calibration and validation datasets, the SVMR models performed well in estimating the four WQIs of surface water quality in Qaroun Lake, with the best R2 values, lowest RMSE and MAD values, and maximum slope values. From the calibrating to validating testing periods, the SVMR model demonstrated a very minimal decline in performance quality (R2, RMSE, MAD, and Acc) for all four WQIs. Therefore, utilization of physicochemical parameters and water quality indices supported by GIS techniques, multivariate modelling and machine learning is a useful and practical method for determining the quality of surface water and its progression.

Author Contributions

Conceptualization, M.G. and A.H.S.; methodology, M.G., M.M.A.E.-S., M.F., H.H., S.E., M.M.K., F.S.M. and A.H.S.; software, M.G., M.M.A.E.-S., M.F., H.H., S.E., M.M.K., F.S.M. and A.H.S.; validation, M.G., M.M.A.E.-S., M.F., H.H., S.E., M.M.K., F.S.M. and A.H.S.; formal analysis, M.G., M.M.A.E.-S., M.F., H.H., S.E., M.M.K., F.S.M. and A.H.S.; investigation, M.G., M.M.A.E.-S., M.F., H.H., S.E., M.M.K., F.S.M. and A.H.S.; resources, E.M.E.; data curation, M.G., M.M.A.E.-S., M.F., H.H., S.E., M.M.K., F.S.M. and A.H.S.; writing—original draft preparation, M.G., M.M.A.E.-S., M.F., H.H., S.E., M.M.K., F.S.M. and A.H.S.; writing—review and editing, A.M.A. and E.M.E.; supervision, E.M.E.; project administration, E.M.E.; funding acquisition, E.M.E. All authors have read and agreed to the published version of the manuscript.

Funding

This research was funded by the Deanship of Scientific Research at King Khalid University, grant number RGP. 1/60/42.

Institutional Review Board Statement

Not applicable.

Informed Consent Statement

Not applicable.

Data Availability Statement

Data are contained within the article.

Conflicts of Interest

The authors declare no conflict of interest.

References

  1. Shakweer, L.M.; Abbas, M.M. Effect of ecological and biological factors on the uptake and concentration of trace elements by aquatic organisms at EdkuLake. Egypt. J. Aquat. Res. 2005, 31, 271–288. [Google Scholar]
  2. Rakib, M.R.J.; Jolly, Y.N.; Begum, B.A.; Choudhury, T.R.; Fatema, K.J.; Islam, M.S.; Ali, M.M.; Idris, A.M. Assessment of trace element toxicity in surface water of a fish breeding river in Bangladesh: A novel approach for ecological and health risk evaluation. Toxin Rev. 2021. [Google Scholar] [CrossRef]
  3. Carr, G.M.; Neary, J.P. Water quality for ecosystem and human health. United Nations Environment Programme Global Environment Monitoring System/Water Programme; GEMS Burlington: Burlington, ON, Canada, 2006. [Google Scholar]
  4. Censi, P.; Spoto, S.E.; Saiano, F.; Sprovieri, M.; Mazzola, S.; Nardone, G.; Ottonello, D. Heavy metals in coastal water systems. A case study from the northwestern Gulf of Thailand. Chemosphere 2006, 64, 1167–1176. [Google Scholar] [CrossRef] [PubMed]
  5. Doherty, V.F.; Ogunkuade, O.O.; Kanife, U.C. Biomarkers of oxidative stress and heavy metal levels as indicators of environmental pollution in some selected fishes in Lagos, Nigeria. Am.-Eurasian J. Agric. Environ. Sci. 2010, 7, 359–365. [Google Scholar]
  6. El-Zeiny, A.M.; El Kafrawy, S.B.; Ahmed, M.H. Geomatics based approach for assessing Qaroun Lake pollution. Egypt. J. Remote Sens. Space Sci. 2019, 22, 279–296. [Google Scholar] [CrossRef]
  7. Fouda, M.; Fishar, M.R.A. Information sheet on Ramsar wetlands (RIS)—2009–2012. Ramsar Site 2012, 32, 1–11. [Google Scholar]
  8. EEAA/NCS (Egyptian Environmental Affairs Agency/Nature Conservation Sector). Qaroun Protected Area Management Plane—Draft; EEAA: Cairo, Egypt, 2007; p. 73. Available online: https://www.eeaa.gov.eg/portals/0/eeaaReports/NCSCB/Management%20Plans/QPA%20MP.pdf (accessed on 16 August 2021).
  9. Zhao, Y.; Xia, X.H.; Yang, Z.F.; Wang, F. Assessment of water quality in Baiyangdian Lake using multivariate statistical techniques. Procedia Environ. Sci. 2012, 13, 1213–1226. [Google Scholar] [CrossRef] [Green Version]
  10. Wu, Z.; Wang, X.; Chen, Y.; Cai, Y.; Deng, J. Assessing river water quality using water quality index in Lake Taihu Basin, China. Sci. Total Environ. 2018, 612, 914–922. [Google Scholar] [CrossRef]
  11. Ali, M.H.H.; Abdel-Satar, A.M. Studies of some heavy metals in water, sediment, fish and fish diets in some fish farms in El-Fayoum Province, Egypt. Egypt J. Aquat. Res. 2005, 31, 261–273. [Google Scholar]
  12. Rifaat, A.E.; Ahdy, H.H.H.; Saadawy, M.M. Metal fluxes across sediment-water interface in Lake Qarun, Egypt. JAKU Earth Sci. 2012, 23, 87–100. [Google Scholar] [CrossRef]
  13. El-Sayed, S.A.; Moussa, E.M.M.; El-Sabagh, M.E.I. Evaluation of heavy metal content in Qaroun Lake, El-Fayoum, Egypt. Part I: Bottom sediments. J. Radiat. Res. Appl. Sci. 2015, 8, 276–285. [Google Scholar] [CrossRef] [Green Version]
  14. Dalakoti, H.; Mishra, S.; Chaudhary, M.; Singal, S.K. Appraisal of water quality in the lakes of Nainital District through numerical indices and multivariate statistics, India. Int. J. River Basin Manag. 2017, 16, 1–11. [Google Scholar] [CrossRef]
  15. Rupakheti, D.; Tripathee, L.; Kang, S.; Sharma, C.M.; Paudyal, R.; Sillanpää, M. Assessment of water quality and health risks for toxic trace elements in urban Phewa and remote Gosainkunda lakes, Nepal. Hum. Ecol. Risk Assess. 2017, 23, 959–973. [Google Scholar] [CrossRef]
  16. Kükrer, S.; Mutlu, E. Assessment of surface water quality using water quality index and multivariate statistical analyses in Saraydüzü Dam Lake, Turkey. Environ. Monit. Assess. 2019, 191, 71–87. [Google Scholar] [CrossRef]
  17. Bai, J.; Cui, B.; Chen, B.; Zhang, K.; Deng, W.; Gao, H.; Xiao, R. Spatial distribution and ecological risk assessment of heavy metals in surface sediments from a typical plateau lake wetland, China. Ecol. Modell. 2011, 222, 301–306. [Google Scholar] [CrossRef]
  18. Smith, V.H. Effects of eutrophication on maximum algal biomass in lake and river ecosystems. Inland Waters 2016, 6, 147–154. [Google Scholar] [CrossRef] [Green Version]
  19. Ustaoğlu, F.; Taş, B.; Tepe, Y.; Topaldemir, H. Comprehensive assessment of water quality and associated health risk by using physicochemical quality indices and multivariate analysis in Terme River, Turkey. Environ. Sci. Pollut. Res. 2021. [Google Scholar] [CrossRef]
  20. Ball, R.O.; Church, R.L. Water quality indexing and scoring. J. Environ. Eng. 1980, 106, 757–771. [Google Scholar]
  21. Hasan, M.M.; Ahmed, M.S.; Adnan, R.; Shafiquzzaman, M. Water quality indices to assess the spatiotemporal variations of Dhaleshwari river in central Bangladesh. Environ. Sustain. Indic. 2020, 8, 100068. [Google Scholar] [CrossRef]
  22. Kamboj, V.; Kamboj, N.; Bisht, A. An overview of water quality indices as promising tools for assessing the quality of water resources. In Advances in Environmental Pollution Management: Wastewater Impacts and Treatment Technologies; Agriculture and Environmental Science Academy: Haridwar, India, 2020; pp. 188–214. [Google Scholar]
  23. Sheykhi, V.; Moore, F. Geochemical characterization of Kor River water quality, Fars Province, Southwest Iran. Water Qual. Expo. Health 2012, 4, 25–38. [Google Scholar] [CrossRef]
  24. Sobhanardakani, S.; Yari, A.R.; Taghavi, L.; Tayebi, L. Water quality pollution indices to assess the heavy metal contamination, case study: Groundwater resources of Asadabad Plain in 2012. Arch. Hyg. Sci. 2016, 5, 221–228. [Google Scholar]
  25. Khan, R.; Saxena, A.; Shukla, S.; Sekar, S.; Senapathi, V.; Wu, J. Environmental contamination by heavy metals and associated human health risk assessment: A case study of surface water in Gomti River Basin, India. Environ. Sci. Pollut. Res. 2021. [Google Scholar] [CrossRef] [PubMed]
  26. Goher, M.E.; Mahdy, E.M.; Abdo, M.H.; El Dars, F.M.; Korium, M.A.; Elsherif, A.S. Water quality status and pollution indices of Wadi El-Rayan lakes, El-Fayoum, Egypt. Sustain. Water Resour. Manag. 2019, 5, 387–400. [Google Scholar] [CrossRef]
  27. Gad, M.; El-Hattab, M. Integration of water pollution indices and DRASTIC model for assessment of groundwater quality in El Fayoum Depression, Western Desert, Egypt. J. Afr. Earth Sci. 2019, 158, 103554. [Google Scholar] [CrossRef]
  28. Gad, M.; Elsayed, S.; Moghanm, F.S.; Almarshadi, M.H.; Alshammari, A.S.; Khedher, K.M.; Eid, E.M.; Hussein, H. Combining water quality indices and multivariate modeling to assess surface water quality in the Northern Nile Delta, Egypt. Water 2020, 12, 2142. [Google Scholar] [CrossRef]
  29. Brown, R.M.; McCleiland, N.J.; Deininger, R.A.; O’Connor, M.F. A Water Quality Index—Crossing the Psychological Barrier. Proc. Int. Conf. Water Poll. Res. 1972, 6, 787–797. [Google Scholar]
  30. Prasad, B.; Kumari, S. Heavy metal pollution index of ground water of an abandoned open cast mine filled with fly ash: A case study. Mine Water Environ. 2008, 27, 265–267. [Google Scholar] [CrossRef]
  31. Reza, R.; Singh, G.; Manish, J. Application of heavy metal pollution index for ground water quality assessment in Angul District of Orissa, India. Int. J. Res. Chem. Environ. 2011, 1, 118–122. [Google Scholar]
  32. Caerio, S.; Costa, M.H.; Ramos, T.B.; Fernandes, F.; Silveira, N.; Coimbra, A.; Painho, M. Assessing heavy metal contamination in Sado Estuary sediment: An index analysis approach. Ecol. Indic. 2005, 5, 155–169. [Google Scholar] [CrossRef]
  33. De Bartolomeo, A.; Poletti, L.; Sanchini, G.; Sebastiani, B.; Morozzi, G. Relationship among parameters of lake polluted sediments evaluated by multivariate statistical analysis. Chemosphere 2004, 55, 1323–1329. [Google Scholar] [CrossRef]
  34. Kalamaras, N.; Michalopoulou, H.; Byun, H.R. Detection of drought events in Greece using daily precipitation. Hydrol. Res. 2010, 41, 126–133. [Google Scholar] [CrossRef]
  35. Wang, M.; Markert, B.; Chen, W.; Peng, C.; Ouyang, Z. Identification of heavy metal pollutants using multivariate analysis and effects of land uses on their accumulation in urban soils in Beijing, China. Environ. Monit. Assess. 2012, 184, 5889–5897. [Google Scholar] [CrossRef]
  36. Prasanna, M.V.; Praveena, S.M.; Chidambaram, S.; Nagarajan, R.; Elayaraja, A. Evaluation of water quality pollution for heavy metal contamination monitoring: A case study from Curtin Lake, Miri City, East Malaysia. Environ. Earth Sci. 2012, 67, 1987–2001. [Google Scholar] [CrossRef]
  37. Tariq, R.S.; Shah, M.H.; Shaheen, N.; Khalique, A.; Manzoor, S.; Jaffar, M. Multivariate analysis of selected metals in tannery effluents and related soil. J. Hazard. Mater. 2005, 122, 17–22. [Google Scholar] [CrossRef]
  38. Chen, K.; Jiao, J.J.; Huang, J.; Huang, R. Multivariate statistical evaluation of trace elements in groundwater in a coastal area in Shenzhen, China. Environ. Pollut. 2007, 147, 771–780. [Google Scholar] [CrossRef]
  39. Yazidi, A.; Saidi, S.; Mbarek, N.B.; Darragi, F. Contribution of GIS to evaluate surface water pollution by heavy metals: Case of Ichkeul Lake (Northern Tunisia). J. Afr. Earth Sci. 2017, 134, 166–173. [Google Scholar] [CrossRef]
  40. Gu, C.; Zhang, Y.; Peng, Y.; Leng, P.; Zhu, N.; Qiao, Y.; Li, Z.; Li, F. Spatial Distribution and Health Risk Assessment of Dissolved Trace Elements in Groundwater in southern China. Sci. Rep. 2020, 10, 7886. [Google Scholar] [CrossRef]
  41. Elbeih, S.F.; El-Zeiny, A.M. Qualitative assessment of groundwater quality based on land use spectral retrieved indices: Case study Sohag Governorate, Egypt. Remote Sens. Appl. Soc. Environ. 2018, 10, 82–92. [Google Scholar] [CrossRef]
  42. Maliqi, E.; Jusufi, K.; Singh, S.K. Assessment and Spatial Mapping of Groundwater Quality Parameters Using Metal Pollution Indices, Graphical Methods and Geoinformatics. Anal. Chem. Lett. 2020, 10, 152–180. [Google Scholar] [CrossRef]
  43. Hamidu, H.; Halilu, F.B.; Yerima, K.M.; Garba, L.M.; Suleiman, A.A.; Kankara, A.I.; Abdullahi, I.M. Heavy metals pollution indexing, geospatial and statistical approaches of groundwater within Challawa and Sharada industrial areas, Kano City, North-Western Nigeria. SN Appl. Sci. 2021, 3, 690. [Google Scholar] [CrossRef]
  44. Ahmed, U.; Mumtaz, R.; Anwar, H.; Shah, A.A.; Irfan, R.; García-Nieto, J. Efficient water quality prediction using supervised machine learning. Water 2019, 11, 2210. [Google Scholar] [CrossRef] [Green Version]
  45. Xu, G.; Ren, X.; Yang, Z.; Long, H.; Xiao, J. Influence of landscape structures on water quality at multiple temporal and spatial scales: A case study of Wujiang River Watershed in Guizhou. Water 2019, 11, 159. [Google Scholar] [CrossRef] [Green Version]
  46. Elsayed, S.; Hussein, H.; Moghanm, F.S.; Khedher, K.M.; Eid, E.M.; Gad, M. Application of irrigation water quality indices and multivariate statistical techniques for surface water quality assessments in the Northern Nile Delta, Egypt. Water 2020, 12, 3300. [Google Scholar] [CrossRef]
  47. Egbueri, J.C. Prediction modeling of potentially toxic elements’ hydrogeopollution using an integrated Q-mode HCs and ANNs machine learning approach in SE Nigeria. Environ. Sci. Pollut. Res. 2021. [Google Scholar] [CrossRef]
  48. Tamasi, G.; Cini, R. Heavy metals in drinking waters from Mount Amiata (Tuscany, Italy) possible risks from arsenic for public health in the province of Siena. Sci. Total Environ. 2004, 327, 41–51. [Google Scholar] [CrossRef]
  49. Azamathulla, H.M.; Haghiabi, A.H.; Parsaie, A. Prediction of side weir discharge coefficient by support vector machine technique. Water Sci. Technol. Water Supply 2016, 16, 1002–1016. [Google Scholar] [CrossRef] [Green Version]
  50. Noori, R.; Yeh, H.-D.; Abbasi, M.; Kachoosangi, F.T.; Moazami, S. Uncertainty analysis of support vector machine for online prediction of five-day biochemical oxygen demand. J. Hydrol. 2015, 527, 833–843. [Google Scholar] [CrossRef]
  51. Azamathulla, H.M.; Wu, F.-C. Support vector machine approach for longitudinal dispersion coefficients in natural streams. Appl. Soft. Comput. 2011, 11, 2902–2905. [Google Scholar] [CrossRef]
  52. Abdel Wahed, M.S.M.; Mohamed, E.A.; Wolkersdorfer, C.; El-Sayed, M.I.; Adel M’nif, A.; Sillanpa, M. Assessment of water quality in surface waters of the Fayoum watershed, Egypt. Environ. Earth Sci. 2015, 74, 1765–1783. [Google Scholar] [CrossRef]
  53. Baioumy, H.M.; Kayanne, H.; Tada, R. Reconstruction of lake-level and climate changes in Lake Qarun, Egypt, during the last 7000 years. J. Great Lakes Res. 2010, 36, 318–327. [Google Scholar] [CrossRef]
  54. Flower, R.J.; Stickley, C.; Rose, N.L.; Peglar, S.; Fathi, A.A.; Appleby, P.G. Environmental changes at the desert margin: An assessment of recent paleolimnological records in Lake Qarun, Middle Egypt. J. Paleolimnol. 2006, 35, 1–24. [Google Scholar] [CrossRef]
  55. Ali, R.R.; Abdel Kawy, W.A.M. Land degradation risk assessment of El Fayoum depression, Egypt. Arab. J. Geosci. 2013, 6, 2767–2776. [Google Scholar] [CrossRef]
  56. APHA. Standard Methods for the Examination of Water and Wastewater; American Public Health Association: Washington, DC, USA, 2012. [Google Scholar]
  57. CCME (Canadian Council of Ministers of the Environment). For the protection of aquatic life. In Canadian Environmental Quality Guidelines; Canadian Council of Ministers of the Environment: Winnipeg, MB, Canada, 2007. [Google Scholar]
  58. Prasad, B.; Bose, J.M. Evaluation of heavy metal pollution index for surface and spring water near a limestone mining area of the Lower Himalayas. Environ. Geol. 2001, 41, 183–188. [Google Scholar] [CrossRef]
  59. Brraich, O.S.; Jangu, S. Evaluation of water quality pollution indices for heavy metal contamination monitoring in the water of Harike Wetland (Ramsar site), India. Int. J. Sci. Res. Publ. 2015, 5, 1–6. [Google Scholar]
  60. Backman, B.; Bodis, D.; Lahermo, P.; Rapant, S.; Tarvainen, T. Application of a groundwater contamination index in Finland and Slovakia. Environ. Geol. 1997, 36, 55–64. [Google Scholar] [CrossRef]
  61. Edet, A.E.; Offong, O.E. Evaluation of water quality pollution indices for heavy metal contamination monitoring. A study case from Akpabuyo-Odukpani area, Lower Cross River Basin (south Nigeria). Geo. J. 2002, 4, 295–304. [Google Scholar] [CrossRef]
  62. Nasrabadi, T. An index approach to metallic pollution in river waters. Int. J. Environ. Res. 2015, 9, 385–394. [Google Scholar]
  63. Goher, M.E.; Farhat, H.I.; Abdo, M.H.; Salem, S.G. Metal pollution assessment in the surface sediment of Lake Nasser, Egypt. Egypt J. Aquat. Res. 2014, 40, 213–224. [Google Scholar] [CrossRef] [Green Version]
  64. Matiatos, I.; Alexopoulos, A.; Godelitsas, A. Multivariate statistical analysis of the hydrogeochemical and isotopic composition of the groundwater resources in northeastern Peloponnesus (Greece). Sci. Total Environ. 2014, 476, 577–590. [Google Scholar] [CrossRef]
  65. Kamtchueng, B.T.; Fantong, W.Y.; Wirmvem, M.J. Hydrogeochemistry and quality of surface water and groundwater in the vicinity of Lake Monoun, West Cameroon: Approach from multivariate statistical analysis and stable isotopic characterization. Environ. Monit. Assess. 2016, 188, 524. [Google Scholar] [CrossRef]
  66. Kumar, V.; Sharma, A.; Chawla, A.; Bhardwaj, R.; Thukral, A.K. Water quality assessment of River Beas, India, using multivariate and remote sensing techniques. Environ. Monit. Assess. 2016, 188, 137. [Google Scholar] [CrossRef] [PubMed]
  67. Rakotondrabe, F.; Ngoupayou, J.R.; Mfonka, Z. Water quality assessment in the Betare-Oya gold mining area (East-Cameroon): Multivariate statistical analysis approach. Sci. Total Environ. 2018, 610, 831–844. [Google Scholar] [CrossRef] [PubMed]
  68. Burrough, P.A. Principles of geographical information systems for land resources assessment. Geo. Int. 1986, 1, 54. [Google Scholar] [CrossRef]
  69. Watson, D.F. Contouring: A guide to the analysis and display of spatial data. Comput. Methods Geosci. 1992, 10, 321. [Google Scholar]
  70. Khalifa, N. Population dynamics of Rotifera in Ismailia Canal, Egypt. J. Biodivers. Environ. Sci. 2014, 4, 58–67. [Google Scholar]
  71. Abd El-Aal, R.F.; El Sayed, S.M.; Attia, M.S.; Donia, N.S.; Goher, M.E. Pollution indices and distribution pattern of heavy metals in Qarun Lake water, Egypt. Egypt. J. Aquat. Biol. Fish. 2020, 24, 593–607. [Google Scholar] [CrossRef]
  72. Ali, M.H.H.; Abdel-Satar, A.M.; Goher, M.E.-M. Present Status and Long-Term Changes of Water Quality Characteristics in Heavily Polluted Mediterranean Lagoon, Lake Mariut, Egypt. IJRDO J. Appl. Sci. 2017, 3, 66–82. [Google Scholar]
  73. Ali, M.H. Assessment of some water quality characteristics and determination of some heavy metals in Lake Manzalah, Egypt. J. Aquat. Biol. Fish. 2008, 12, 133–154. [Google Scholar] [CrossRef] [Green Version]
  74. Nafea, E.M.A.; Zyada, M.A. Biomonitoring of heavy metals pollution in Lake Burullus, Northern Delta, Egypt. Affrican J. Environ. Sci. Technol. 2015, 9, 1–7. [Google Scholar]
  75. Saeed, S.M.; Shaker, I.M. Assessment of Heavy Metals Pollution in Water and Sediments and Their Effect on Oreochromis niloticus in The Northern Delta Lakes, Egypt. In Proceedings of the 8th International Symposium on Tilapia in Aquaculture, Cairo, Egypt, 12–14 October 2008. [Google Scholar]
  76. Avila, P.F.; Oliveira, J.S.; da Silva, E.F.; Fonseca, E.C. Geochemical signatures and mechanisms of trace elements dispersion in the area of the Vale das Gatas mine (Northern Portugal). J. Geochem. Explor. 2005, 85, 17–29. [Google Scholar] [CrossRef]
  77. Masoud, A.H.; El-Fakharany, I.I.; Abd El-Razik, M.A.S. Monitoring of some agrochemical pollutants in surface water in Kafr El-Sheikh Governorate. J. Pest. Cont. Environ. Sci. 2007, 15, 21–41. [Google Scholar]
  78. Xiao, M.; Bao, F.; Wang, S.; Cui, F. Water quality assessment of the Huaihe River segment of Bengbu (China) using multivariate statistical techniques. Water Res. 2016, 43, 166–176. [Google Scholar] [CrossRef]
  79. Wang, J.; Liu, G.; Liu, H.; Lam, P.K. Multivariate statistical evaluation of dissolved trace elements and a water quality assessment in the middle reaches of Huaihe River, Anhui, China. Sci. Total Environ. 2017, 583, 421–431. [Google Scholar] [CrossRef]
  80. Kumar, V.; Sharma, A.; Kumar, R.; Bhardwaj, R.; Thukral, A.K.; Rodrigo-Comino, J. Assessment of heavy-metal pollution in three different Indian water bodies by combination of multivariate analysis and water pollution indices. Hum. Ecol. Risk Assess. 2018, 26, 1–16. [Google Scholar] [CrossRef]
  81. Mattigod, S.V.; Page, A.L. Assessment of metal pollution in soils. In Applied Environmental Geochemistry; Thornton, I., Ed.; Academic Press Inc.: London, UK, 1983; pp. 355–394. [Google Scholar]
  82. Hu, Y.; Liu, X.; Bai, J.; Shih, K.; Zeng, E.Y.; Cheng, H. Assessing heavy metal pollution in the surface soils of a region that had undergone three decades of intense industrialization and urbanization. Environ. Sci. Pollut. Res. 2013, 20, 6150–6159. [Google Scholar] [CrossRef]
  83. Noori, R.; Karbassi, A.R.; Moghaddamnia, A.; Han, D.; Zokaei-Ashtiani, M.H.; Farokhnia, A.; Gousheh, M.G. 2011. Assessment of input variables determination on the SVMmodel performance using PCA, Gamma test, and forwardselection techniques for monthly stream flow prediction. J. Hydrol. 2011, 401, 177–189. [Google Scholar] [CrossRef]
  84. Chen, W.B.; Liu, W.C. Water quality modeling in reservoirs using multivariate linear regression and two neural network models. Adv. Artif. Neural. Syst. 2015, 2015, 521721. [Google Scholar] [CrossRef] [Green Version]
Figure 1. Location map of Qaroun Lake and measuring points.
Water 13 02258 g001
Figure 2. Spatial distribution maps of water quality indices in year 2018: (a) WQWQI, (b) HPI, (c), MI, (d) Cd.
Water 13 02258 g002
Figure 3. Spatial distribution maps of water quality indices in year 2019: (a) WQWQI, (b) HPI, (c), MI, (d) Cd.
Water 13 02258 g003
Figure 4. 3-D Pie chart presenting the relative pollution index in Qaroun Lake over two years.
Water 13 02258 g004
Figure 5. The relationships between physicochemical parameters and WQIs across two years.
Water 13 02258 g005
Figure 6. Multivariate statistical analysis for physicochemical parameters of surface water samples in Qaroun Lake across two years: (a) Cluster analysis and (b) Principal component analysis.
Water 13 02258 g006
Figure 7. Comparison between calibrating series (a,c) and validating series (b,d) for WAWQI and HPI using the SVMR model. Statistical analysis results were added in Table 9.
Water 13 02258 g007
Figure 8. Comparison between calibrating series (a,c) and validating series (b,d) for MI and Cd using the SVMR model. Statistical analysis results were added in Table 9.
Water 13 02258 g008
Table 1. The WAWQI estimates for the surface water parameters are based on the arithmetic weights in the present study.
ParameterAquatic Life *Arithmetic Weight (Wi)Sub-Quality Index (Qi)WAWQI
Temp.280.0000792.220.006379047
pH6.5–90.00002107.850.002398024
TDS5000.000016908.320.008601328
Al0.10.00623170.001.058306921
Ba0.050.0124597.601.215185358
Cd0.0010.62253240.00149.4080359
Cr0.010.0622538.002.365627235
Cu0.0040.15563275.0042.79917694
Fe0.30.002085.260.010928921
Pb0.0070.0889397.148.63924017
Mn0.050.012459.400.117036295
Ni0.0250.0249059.201.474159287
Zn0.050.01245143.641.788414189
wi = 1
* All physicochemical parameters are expressed in mg/L except temperature (T °C) and pH.
Table 2. Arithmetic rating method for computation of HPI, MI, Cd and PI.
Trace Element
(mg/L)
Si (mg/L)
(CCME, 2007)
MACiUnit Weight WiSub Index QiWi × Qi
Al0.11000.006231300.809368515
Ba0.05500.0124588.21.098250815
Cd0.00110.62259220136.9700563
Cr0.01100.06226332.054550845
Cu0.00440.15565317.549.41817373
Fe0.33000.002084.530.009408044
Pb0.00770.0889482.857.369446444
Mn0.05500.012458.20.102104951
Ni0.025250.0249056.81.414527127
Zn0.05500.012451912.378298251
∑(Wi) = 1 ∑(Wi × Qi)
Table 3. Levels of pollution according to PI.
ClassPI ValueEffect
1<1No effect
21–2Slightly affected
32–3Moderately affected
43–5Strongly affected
5>5Seriously affected
Table 4. Statistical description of water quality parameters in Qaroun Lake over two years.
Water Quality Parameters
T °CpHTDSAlBaCdCrCuFePbMnNiZn
First year 2018 (n = 16)
Min29.47.80027,652.2700.0400.0450.0020.0030.0020.0160.0060.0040.0110.061
Max34.28.40038,752.0400.7200.0680.0050.0050.0220.0290.0080.0080.0200.163
Mean31.3568.24435,580.9400.2990.0530.0030.0040.0130.0210.0070.0060.0160.102
SD1.1680.1362634.4370.2460.0070.0010.0040.0050.0040.0010.0010.0030.037
Second year 2019 (n = 16)
Min29.47.828,840.430.040.04470.00240.0030.00170.01550.00570.00420.0110.06052
Max34.28.439,056.090.720.06780.00450.00540.02190.0290.00810.00770.02040.16271
Mean31.356258.2437535,777.810.29850.0530250.0032590.0040750.0125510.0211190.00680.0056380.0162560.101624
SD1.1678860.1364732442.0750.2457470.007240.0017570.0006860.005250.0042550.0005930.0010520.0028410.037036
Data across two years (n = 32)
Min29.47.827,652.270.040.04470.00240.0030.00170.01550.00570.00420.0110.06052
Max34.28.439,056.090.720.06780.00450.00540.02190.0290.00810.00770.02040.16271
Mean31.356258.2437535,679.370.290.0530250.0032590.0040750.0125510.0211190.00680.0056380.0162560.101624
SD1.1488950.1342542500.7740.241750.0071220.0017450.0006740.0051650.0041860.0005840.0010350.0027950.036433
All water quality parameters are expressed in mg/L except temperature (T °C) and pH, SD: standard deviation.
Table 5. Comparison between heavy metals content (mg/L) in Qaroun Lake and some northern Egyptian Lakes.
Egyptian LakesFeMnZnCuCdRef.
Qaroun0.015–0.0290.004–0.0070.060–0.1620.001–0.0210.0024–0.0045Present study
Mariut0.522–1.9520.02–0.0850.023–0.08650.003–0.0880.0025–0.0127[72]
Manzalah0.447–1.2120.334–0.9250.036–0.0930.003–0.0080.0022–0.0056[73]
Burullus0.025–0.06-0.018–0.0550.011–0.0330.0029–0.0085[74]
Idku0.08–1.890.003–0.0880.004–0.050.002–0.024ND–0.008[75]
Permissible level0.30.050.030.0020.001[57]
Table 6. Statistical description of water quality indices in Qaroun Lake over two years.
Water Quality Indices (WQIs)
WAWQIHPIMICd
First year 2018 (n = 16)
Min154.591154.58756.343048−3.65695
Max321.625321.637420.6933810.69338
Mean234.5054234.509612.92142.921396
SD55.8139355.819474.3663844.366384
Second year 2019 (n = 16)
Min177.240177.23827.883352−2.11665
Max358.788358.803922.725912.7259
Mean269.1347270.42414.687344.687343
SD63.303561.377654.7530744.753074
Data across two years (n = 32)
Min154.591154.58756.343048−3.65695
Max358.788358.803922.725912.7259
Mean252.461252.466813.804373.804369
SD60.5197660.52574.5783644.578364
SD: standard deviation.
Table 7. Classification of surface water sampling for aquatic life according to water quality indices (WQIs).
WQIsRangeWater ClassSamples (%)
First Year (2018)Second Year (2019)Across Two Years
Weighted arithmetic water quality index
(WAWQI)
0–25Excellent 000
26–50Good 000
51–75Poor 000
76–100Very poor 000
>100Unsuitable100% (16 samples)100% (16 samples)100% (32 samples)
Metal index (HPI)<100Low polluted 000
>100High polluted100% (16 samples)100% (16 samples)100% (32 samples)
Trace element evaluation index
(MI)
<0.3Very pure000
0.3–1.0Pure000
1.0–2.0Slightly affected000
2.0–3.0Moderately affected000
3.0–6.0Strongly affected000
>6.0Seriously affected100% (16 samples)100% (16 samples)100% (32 samples)
Contamination index
(Cd)
>1Low37% (6 samples)31% (5 samples)34% (11 samples)
1–3Medium19% (3 sample)13% (2 sample)16% (5 samples)
<3High44% (7 samples)56% (9 samples)50% (16 sample)
Table 8. Assessment of surface water quality according to the effects of trace elements across two years.
Trace ElementPIClassEffect
First YearSecond YearAcross Two Years
Al3.413.613.51IVStrongly affected
Ba0.720.810.765INo effect
Cd2.302.552.425IIIModerately affected
Cr0.280.310.295INo effect
Cu2.772.752.76IIIModerately affected
Fe0.050.050.05INo effect
Pb0.650.710.68INo effect
Mn0.080.090.085INo effect
Ni0.480.460.47INo effect
Zn1.631.741.685IISlightly affected
Table 9. Performance criteria of SVMR models for four water quality indices.
Water Quality Indices (WQIs)Performance Criteria
R2RMSEMADAcc
Calibration modelsWAWQI0.99 ***6.706.140.995
HPI0.99 ***6.185.600.997
MI0.99 ***0.480.420.999
Cd0.99 ***0.480.420.996
Validation modelsWAWQI0.97 ***12.6411.160.998
HPI0.99 ***12.6511.230.989
MI0.99 ***0.630.560.966
Cd0.99 ***0.630.560.970
R2, RMSE, MAD, and Acc indicate coefficient of determination, root mean square error, mean absolute deviations, and accuracy of the model, respectively. Levels of significance: ***: p < 0.001.
Publisher’s Note: MDPI stays neutral with regard to jurisdictional claims in published maps and institutional affiliations.

