
Valuing Enhanced Hydrologic Data and Forecasting for Informing Hydropower Operations
by
 , ,
, ,
Han Guo
1,* ,
,
Martha Conklin
1,
Tessa Maurer
2,
Francesco Avanzi
3,
Kevin Richards
4 and
Roger Bales
1,5 1
Environmental Systems Graduate Group, University of California, Merced, CA 95343, USA
2
Blue Forest Conservation, Sacramento, CA 95818, USA
3
CIMA Research Foundation, Via Armando Magliotto 2, 17100 Savona, Italy
4
Pacific Gas and Electric Company, San Francisco, CA 94105, USA
5
Department of Civil and Environmental Engineering, University of California, Berkeley, CA 94720, USA
*
Author to whom correspondence should be addressed.
Water 2021, 13(16), 2260; https://doi.org/10.3390/w13162260
Submission received: 22 July 2021
/
Revised: 10 August 2021
/
Accepted: 16 August 2021
/
Published: 19 August 2021
(This article belongs to the Special Issue Impact of River Hydrology on Hydraulic Engineering and Hydropower)
Abstract
:Climate change is rapidly modifying historic river flows and snowpack conditions in the Sierra Nevada in California and other seasonally snow-covered mountains. Statistical forecasting methods based on regressing summer flow against spring snow water equivalent, precipitation, and antecedent runoff are thus becoming increasingly inadequate for water-resources decision making, which can lead to missed opportunities in maximizing beneficial uses, including the value of hydropower resources. An enhanced forecasting method using a process-based model and spatially distributed wireless sensor data offers more accurate runoff forecasts. In this paper, we assessed the forecasting accuracy of these two forecasting methods by applying them to two tributaries within the North Fork Feather River basin in California. The result shows the enhanced forecasting method having better accuracy than the statistical model. In addition, a hydropower simulation showed a considerable increase in energy value with the enhanced forecasting informing reservoir operations. The investment analysis on applying this method shows an average internal rate of return of 31% across all scenarios, making this forecasting method an attractive way to better inform water-related decisions for hydropower generation in the context of climate change.
1. Introduction
Renewable electricity is critical to mitigating the impacts of climate change [1]. In 2018, California committed to sourcing 100% of retail electricity sales to end users from eligible renewable energy resources by 2045 [2]. With such rapid growth of renewable energy, there are concerns over how to effectively integrate large amounts of intermittent power generation into the electrical grid. These variable sources include renewables such as wind or solar power, which follow daily and seasonal patterns [3] that are not necessarily aligned with energy demand. Hydropower is also of increasing importance as renewables replace fossil-fuel-based electricity generation and thus change the timing of both electricity supply and price fluctuations. Some hydropower resources that have enough directly available and usable water storage can serve as a dispatchable technology, which can be used to accommodate the intermittency and help maintain grid frequency and voltage. Therefore, optimizing the operation of hydroelectric power plants and generating electricity at the necessary times can help to reach renewable energy production goals synergistically with other renewable energy sources.
Currently, most operations of California’s mountain hydropower and water-supply reservoirs use statistical forecasts based on historical snowpack and runoff data. These statistical forecasts also inform water-allocation decisions by California’s Department of Water Resources (DWR) and other water agencies. A notable example is DWR’s Bulletin 120, which from February to June provides seasonal forecasts of streamflow based on multiple regression of historical data [4]. However, climate warming is modifying historical river flow and snowpack patterns, thereby impacting the accuracy of the statistical methods. Therefore, it is increasingly important to supplement the widely used statistical forecasts with emerging, timely, accurate data and information on near-real-time hydrologic fluxes (rain, snowfall, snowmelt) and stores (snowpack, subsurface moisture).
Improvements in ground-based data, combined with remote sensing data, machine learning, and data assimilation techniques for hydrologic models, can improve hydrologic forecasting and thus contribute to adaption policies. Avanzi et al. [5] used such an approach in the Feather River basin in the northern Sierra Nevada to recalibrate the precipitation runoff modeling system (PRMS) and provide an enhanced forecasting method for more accurate hydrologic predictions. In that work, the ground-based measurements from spatially distributed wireless sensor networks deployed around operational measurement sites supported improvements to temperature and precipitation data. Temperature regressions derived from monthly temperature lapse rates with elevation were corrected based on a distributed sensor network and other ground-based data, particularly improving estimates at high-elevation, snow-dominated sites. Daily sensor network data also allowed for expansion of sites used to correct spatial precipitation maps, improving runoff flow volume estimates by up to 79%. These improvements were the result of a multiobjective recalibration approach that benefited from expanded ground-based sensor networks and state-of-the-art water-balance data products [6].
The aim of the research reported in this paper was to estimate the economic value of using improved hydrologic data for hydropower systems in snow-dominated mountain basins, taking the Upper North Fork Feather River Hydropower Project and associated powerhouses, operated by Pacific Gas and Electric Company (PG&E), as a case study. We investigated the extent of increased accuracy in an enhanced forecasting method using improved data and the extent of the resulting improvement in the timing of hydropower generation, compared to the traditional statistical methods. Since the enhanced forecasting method requires investment in the establishment and maintenance of the information infrastructure, we conducted an investment analysis under different cost and hydrologic conditions using the internal rate of return (IRR) as an indicator, which is a discount rate that makes the net present value of all cash flows equal to zero in a discounted cash flow analysis [7].
2. Materials and Methods
Our approach followed three steps. First, we obtained the forecasting data of the target tributaries (1 October to 30 September in California) using the two forecasting methods and compared them with the historical runoff to assess their forecasting skill. Second, based on the forecasted runoff, we simulated the hydropower system and the water releases, with historical runoff data and hourly electricity prices as model inputs, to estimate the energy value over time and compare the difference between the two forecasting methods. Third, we estimated the IRR of investing in this enhanced forecasting method based on the differences in energy value under different hydrological and cost scenarios.
2.1. Study Site and Hydropower System
We focused on the North Fork of the Feather River, an important tributary of northern California’s Sacramento River, located at the conjunction between the Sierra Nevada and the Cascade Range (Figure 1). A major tributary of the Feather River, the East Branch, meets the North Fork near Belden and is less developed for water resources than is the main stream of the North Fork [5].
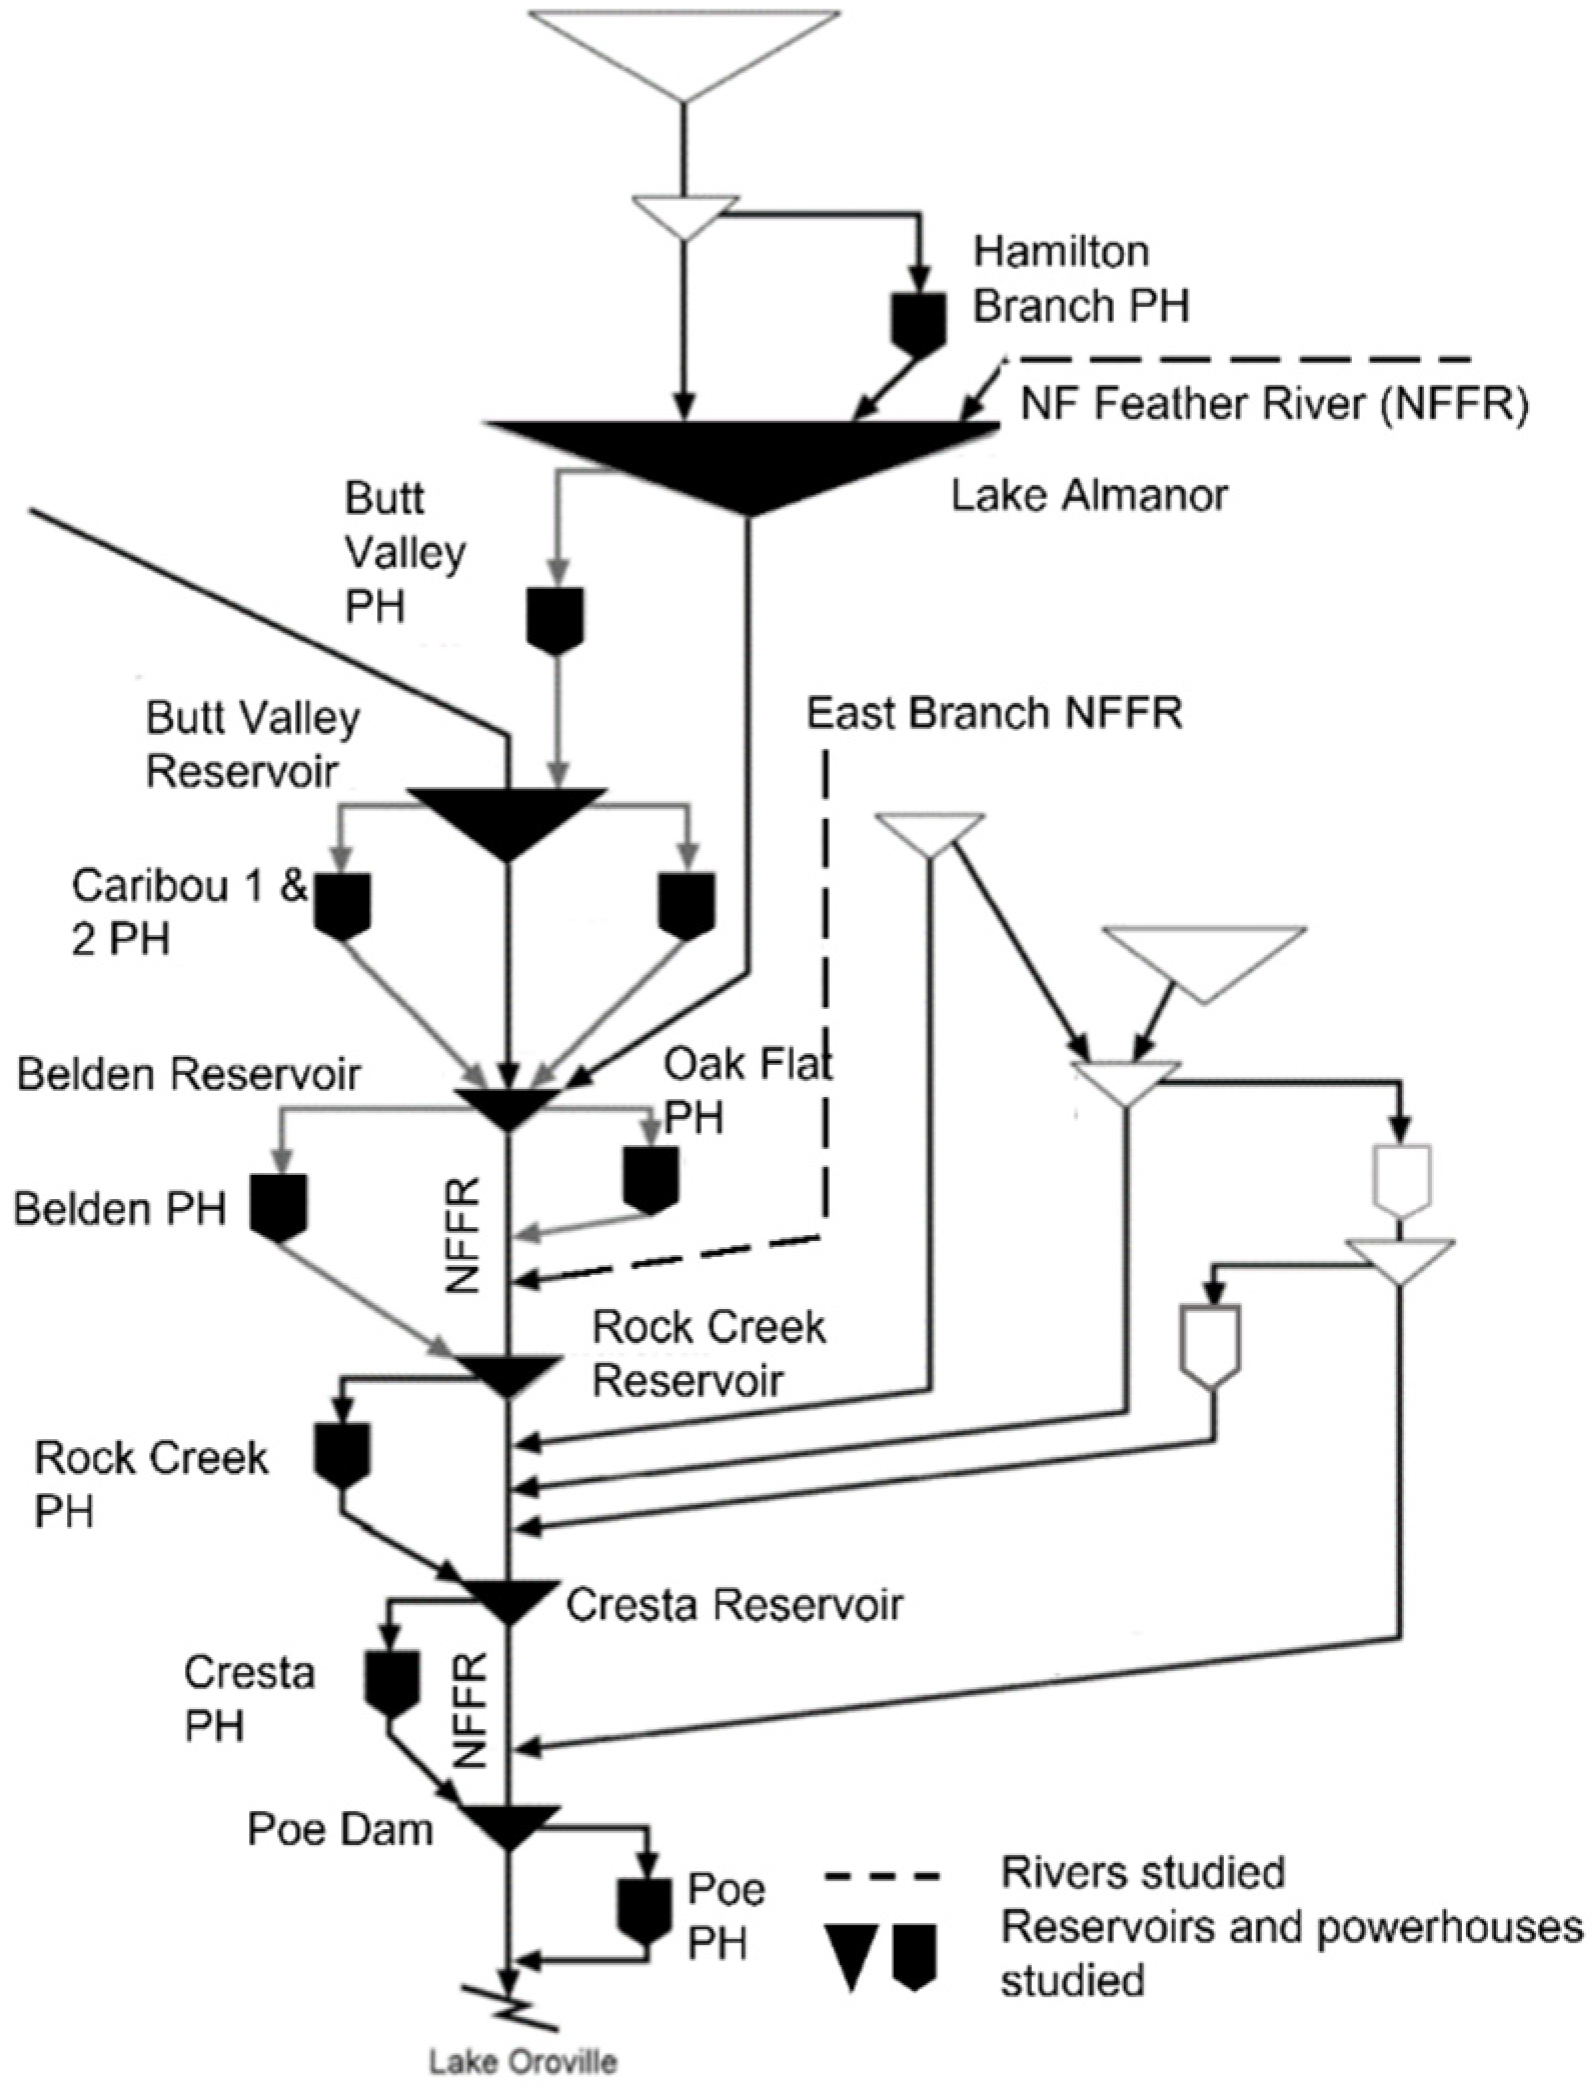
The hydropower system we studied consists of the Upper North Fork Feather River Project and related upstream and downstream reservoirs and powerhouses operated by PG&E, including six reservoirs and nine powerhouses in total (Figure 2). We focused on the impacts of two specific tributaries supplying this hydropower system—the North Fork Feather River feeding Lake Almanor, the largest reservoir of this system, and the mostly unregulated East Branch basin, which has a large impact on the downstream reservoirs and powerhouses.
To select representative water years for analysis, we ranked 33 years of runoff data (from the United States Geological Survey) for these two rivers from 1985 to 2017, where 15 years are considered average years, and selected 5 average water years among them—2002, 2003, 2009, 2010, and 2012. These years offer the greatest potential for an increase in energy value with improved forecast since there is flexibility to optimize water releases during the spring. Wet years require larger and more constant releases to avoid flooding potential, whereas, in dry years, minimal water is released during the spring in order to maximize storage and availability later in the season. For each selected year, we focused on the time period when runoff volume is relatively significant in California, from late spring to September [8].
2.2. Hydrologic Forecasting Data
2.2.1. Enhanced Forecasting Method
The enhanced forecasting method involved three steps, reported elsewhere [9,10]. First, spatially distributed wireless sensor networks (WSNs) were deployed to continuously measure temperature, relative humidity, snow depth, and soil moisture at representative locations (three clusters of sensors, 12 sensors for each cluster following arguments in Oroza et al. [11]). The second step was to extend data measured from wireless-sensor networks to larger spatial scales by integrating point sensor data with remote sensing and machine learning to create spatial maps of snow water equivalent. The third step involved improving the hydrologic forecasting model with the information provided by the previous two steps [5].
On the Feather River, PG&E is currently using PRMS, a physical-process-based modeling system with distributed parameters developed to predict the water-balance response to climate and land use [12]. Computations of hydrologic processes are driven by historical, current, and/or projections of climate. At a minimum, daily minimum and maximum air temperature and precipitation are required for a PRMS simulation. Simulations operate on a daily time step, with time periods from days to centuries [13]. The complete set of model parameters for the Feather River were from the previous calibration using a combination of a priori expert knowledge and fit to streamflow data [14]. Using ground-based data from meteorological stations and wireless sensor networks, a more accurate and robust temperature distribution method was designed for the updated PRMS model. In addition to measured runoff and the spatially distributed snow water equivalent products, evapotranspiration maps based on remote sensing products [15] were used for a multistep, multiobjective recalibration strategy. Finally, temperature, snow depth, and soil moisture data from the wireless sensor networks were used to evaluate model performance with respect to precipitation phase, snow accumulation, and ablation patterns, and soil water storage. In this analysis, we used the input data for the selected water years to generate streamflow estimates from the recalibrated model. Estimates for seasonal forecasts starting on a given day (e.g., 1 May) were generated using an ensemble prediction method, as explained in Koczot et al., [14]. Observed input data were used to drive the model up to the simulation date, after which a suite of model outputs was generated with historical data for the remainder of the water year. The median estimate was used as a predicted flow volume [14].
2.2.2. Statistical Method
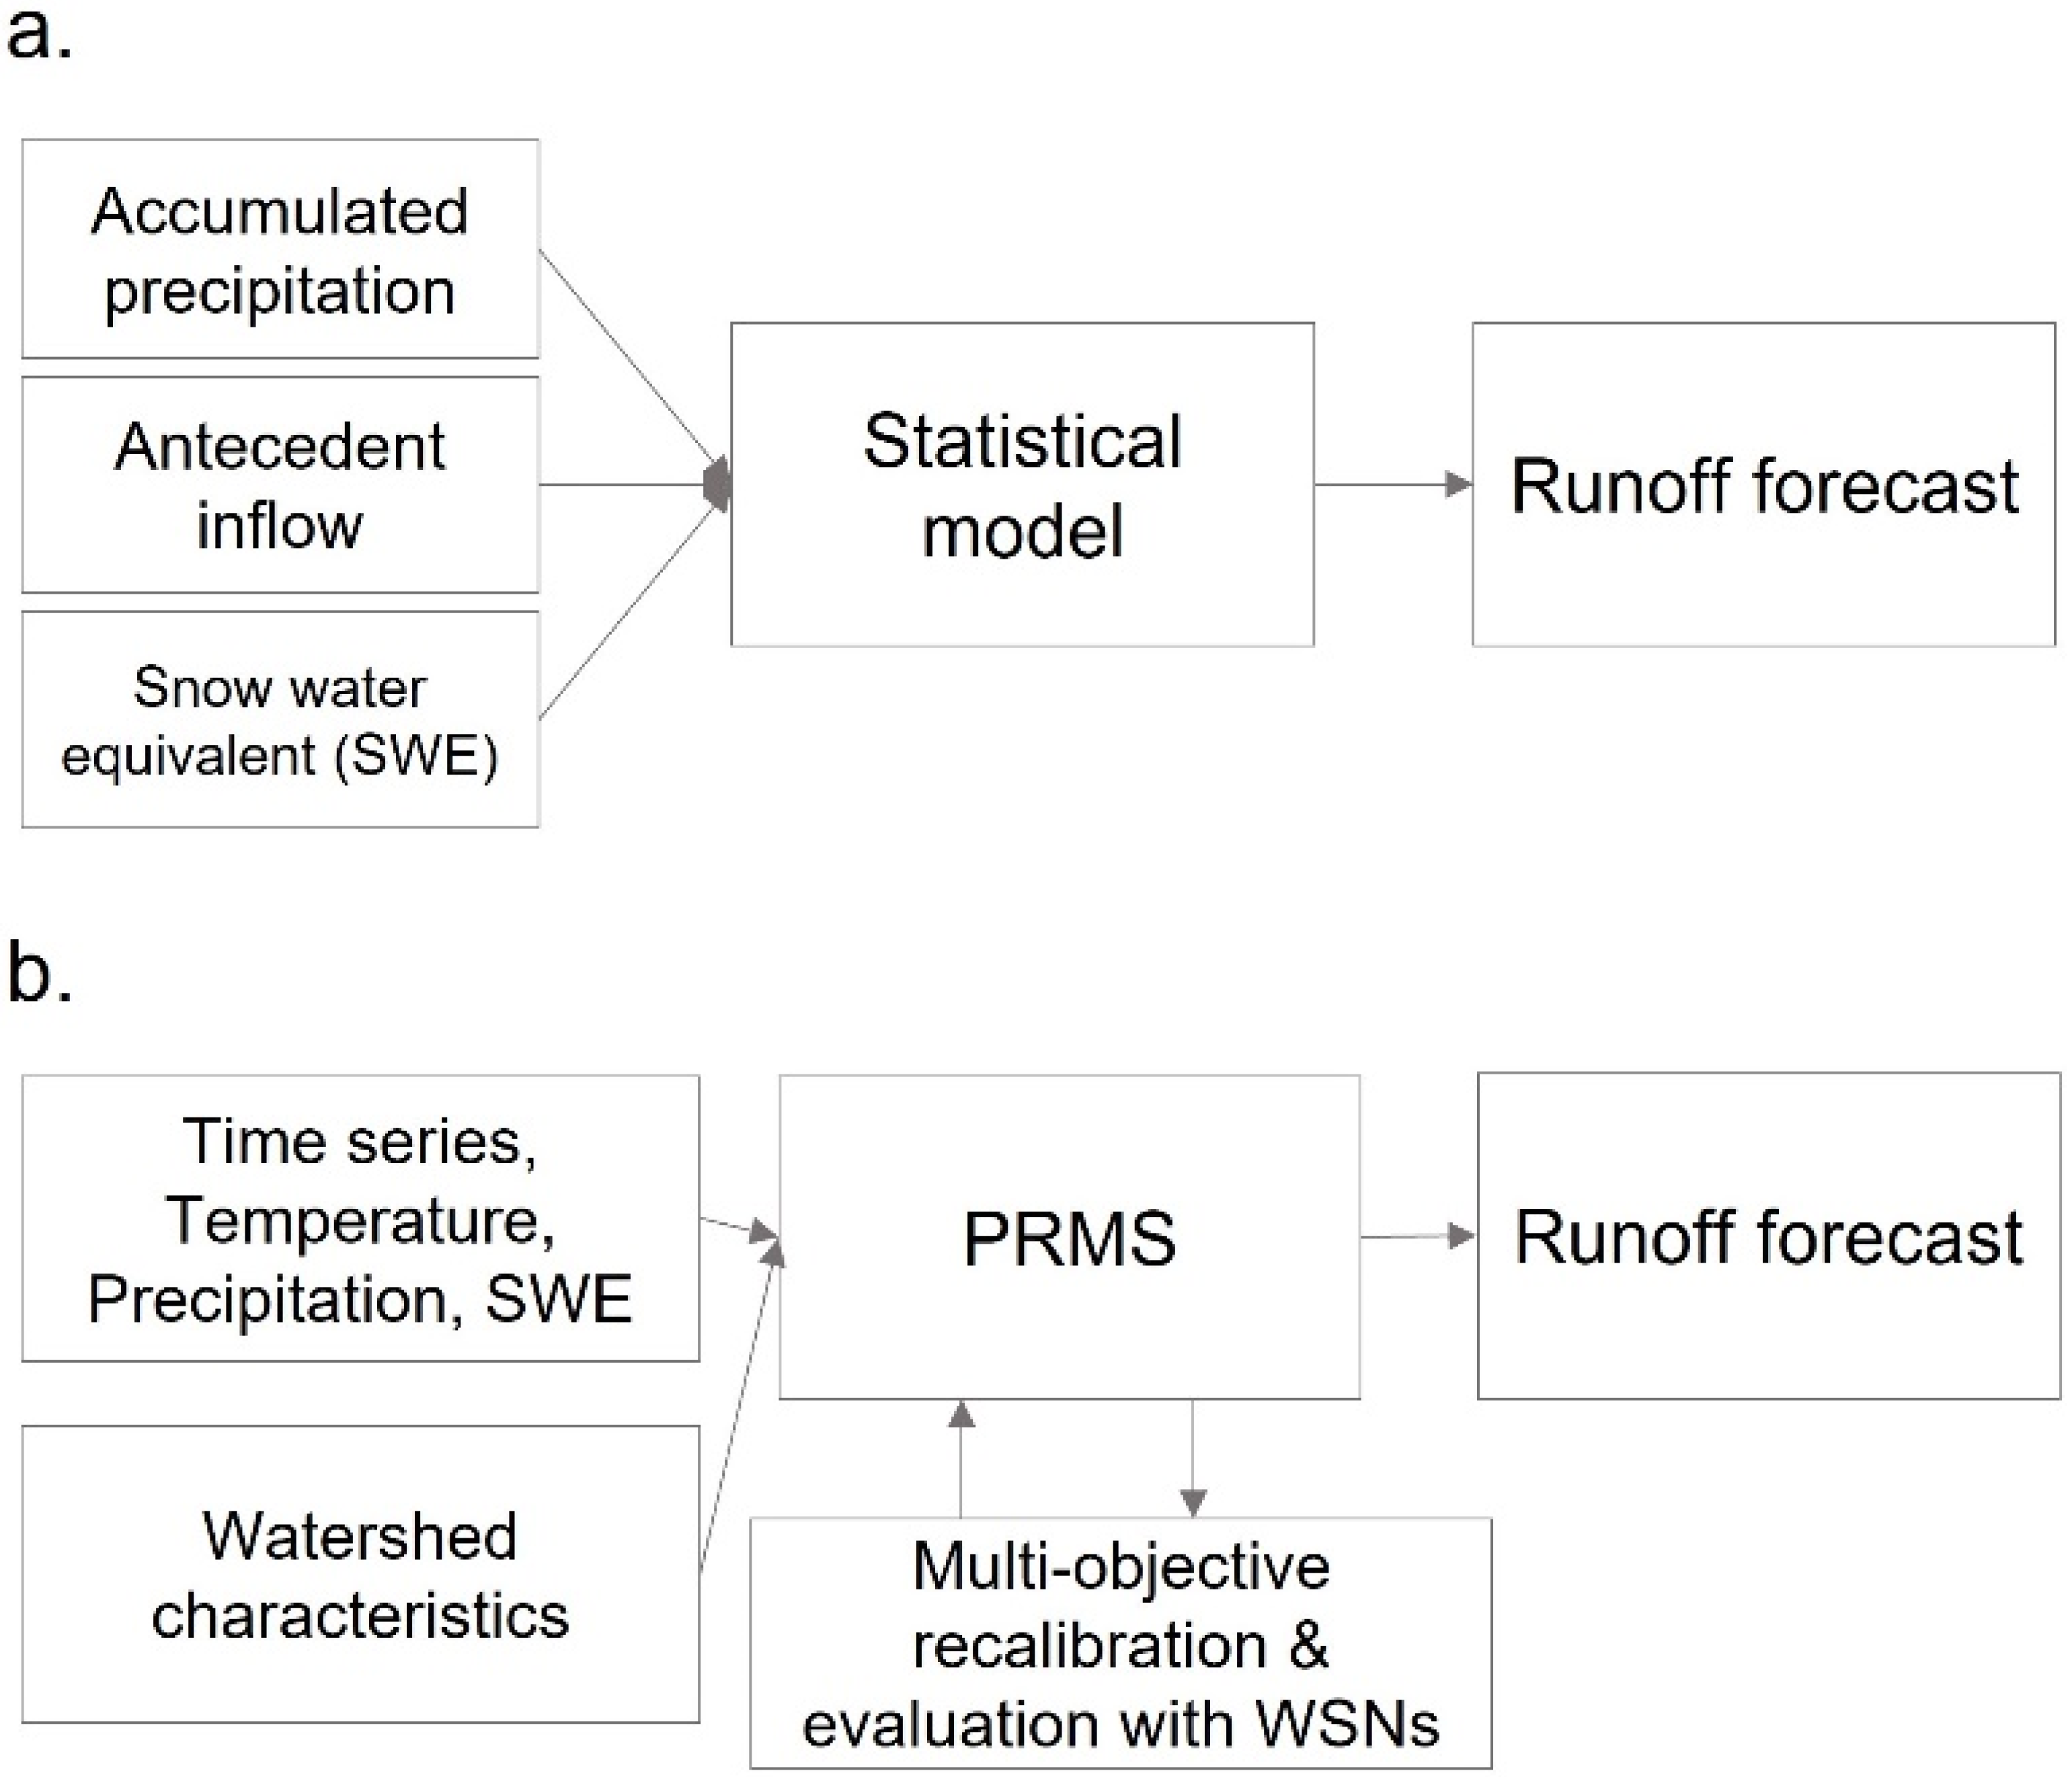
The statistical method relies on multiple regression to relate a collection of predictors to a predictand, the seasonal streamflow volume (Figure 3) as follows:
where the target-period streamflow (Q) is a function of three general categories of predictor variables: snow water equivalent (SWE), accumulated precipitation (P), and antecedent runoff (RO). The statistical model relies on standard multiple regression to develop its forecast equations. SWE and P are weighted indices of observations at multiple locations in and around the watershed. For the Feather watershed, with its heterogeneous topography, SWE was further divided into high- and low-elevation indices and updated monthly with the new snow surveys. Q and RO data were obtained from historical records [4]. This statistical method is an established approach in operational water supply forecasting in the western US and is assumed as a benchmark of current practices in this paper [16].
Q = f (SWE, P, RO),
2.3. Hydropower Simulation Model
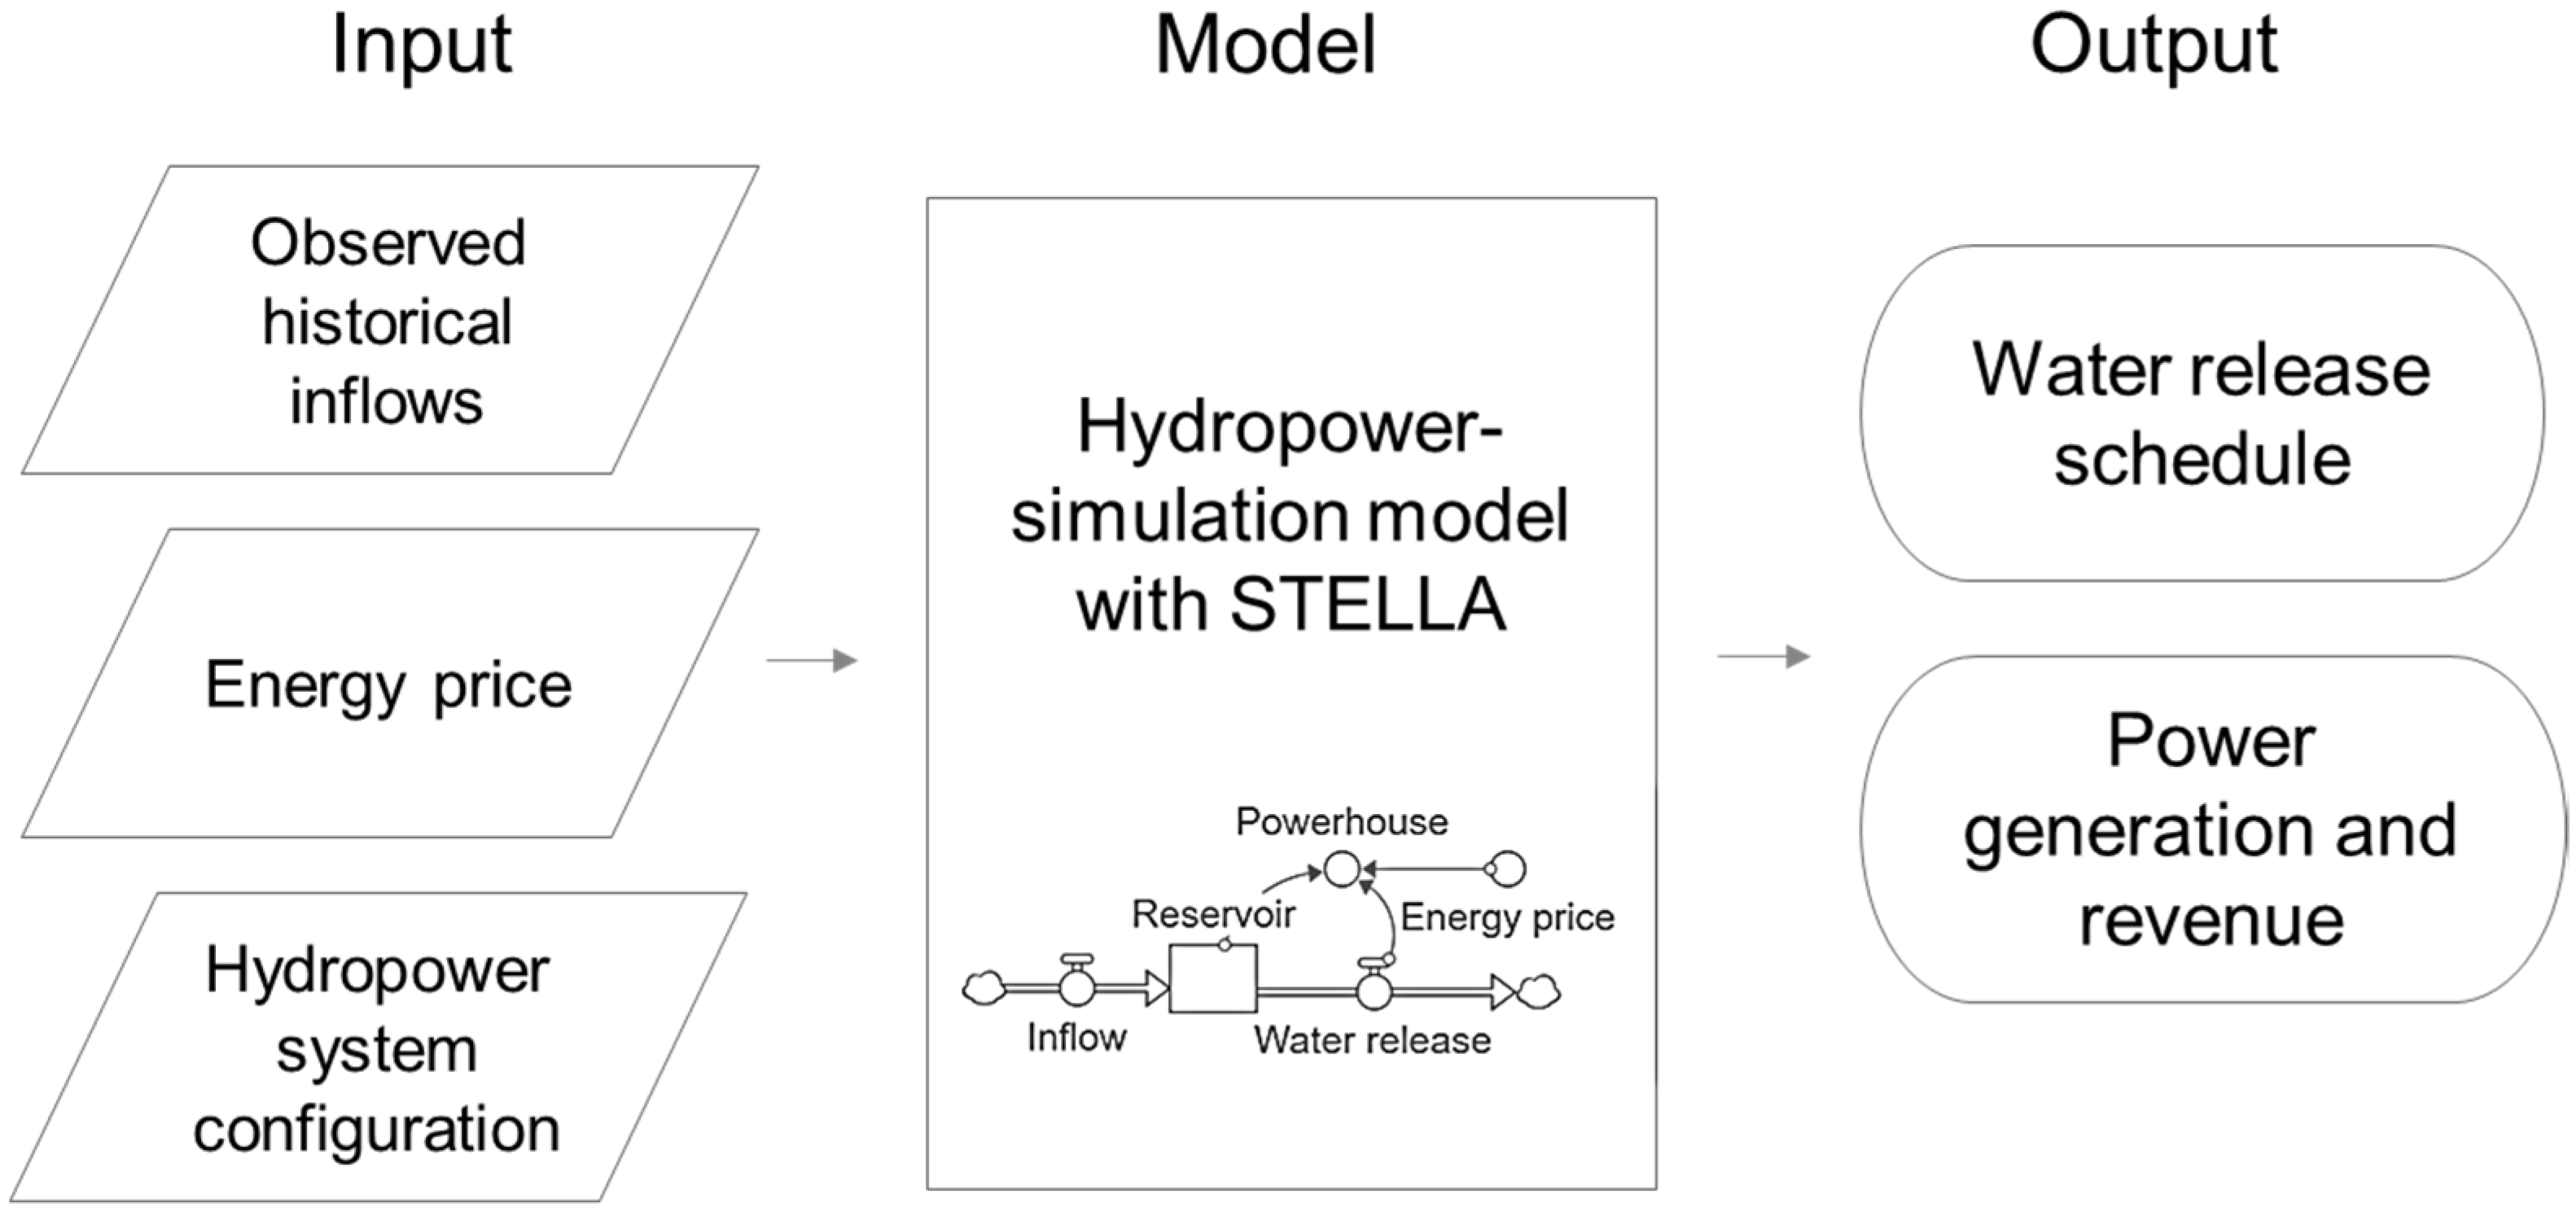
We used the systems thinking, experimental learning laboratory with animation (STELLA) software to simulate the power generation of the hydropower system. STELLA is a visual programming language for system dynamics modeling. The environment of the model provides several general building blocks through which specific units of the hydropower system can be modeled. These basic building blocks are referred to as stock, flow, converter, and connector. The integration of these building blocks can be used to model various dynamic systems. In the model, six reservoirs, accumulated energy, and energy value are represented by stocks, inflows and outflows are represented by flows, and the mathematical relationships and operation rules, including the power generation calculation for nine powerhouses and water release strategies, are represented by connectors and converters (Figure 4).
The total power generation (E) and energy value (R) are calculated by
where i is the time, j is the powerhouse, is the energy price at time i, is the energy produced for powerhouse j at time i, is the overall efficiency, is the water density, is the water release for powerhouse j at time i, and is the average water head for powerhouse j at time i. This dynamic system means that the release from an upstream reservoir becomes an input to the immediate downstream reservoir, while the water head of one reservoir is determined by both inflow and water release of that reservoir. The water head and the volume of water released (determined by the maximum flow rate of the powerhouses and the duration of water release) will together determine the amount of electricity generated. The water release rules that estimate system constraints and requirements versus objectives include (1) 172.69 million m3 drawdown of Lake Almanor from May to September and (2) water releases are made during hours when the energy price is highest.
Forecasts of runoff are used to control the timing of water releases. When more water is predicted, water will be released when energy prices are low, and when less water is predicted, water will be released when energy prices are high. The real-time energy price information could be obtained online to support the hydropower operation. This rule avoids spills and allows reservoir levels to drop appropriately but not excessively to maximize energy value. Different release timing determined by different forecast accuracies can thus affect energy value.
There are six reservoirs and nine powerhouses in total in this hydropower system (Figure 2). The Upper North Fork Feather River Project comprises three reservoirs and five powerhouses. The largest reservoir is Lake Almanor, a natural, largely spring-fed lake that was augmented by the construction of Canyon Dam. The other two reservoirs are Butt Valley, located on Butt Creek and Belden Forebay. The five powerhouses are Butt Valley, Caribou 1 and 2, Belden, and Oak Flat. Water levels in Lake Almanor are maintained by releases through the Prattville intake, which conveys flows to the Butt Valley reservoir, as well as through the multilevel outlet structure at Canyon dam, which releases flows into the North Fork Feather River. The Butt Valley reservoir serves as an afterbay for the Butt Valley Powerhouse. Water from Butt Creek as well as North Fork water diverted through the Butt Valley Powerhouse is fed through tunnels from Butt Valley Reservoir to two powerhouses on the North Fork near Caribou. The Belden forebay reservoir serves as an afterbay for the Caribou 1 and 2 powerhouses, and most of the water from Belden forebay is diverted to the Belden Powerhouse. Oak Flat Powerhouse is located at Belden Dam and generates power from instream flow releases to the North Fork. Other powerhouses outside the Upper North Fork Feather River Project include Hamilton Branch, Rock Creek, Cresta, and Poe. Attributes of the reservoirs and the powerhouses are shown in Table 1 and Table 2.
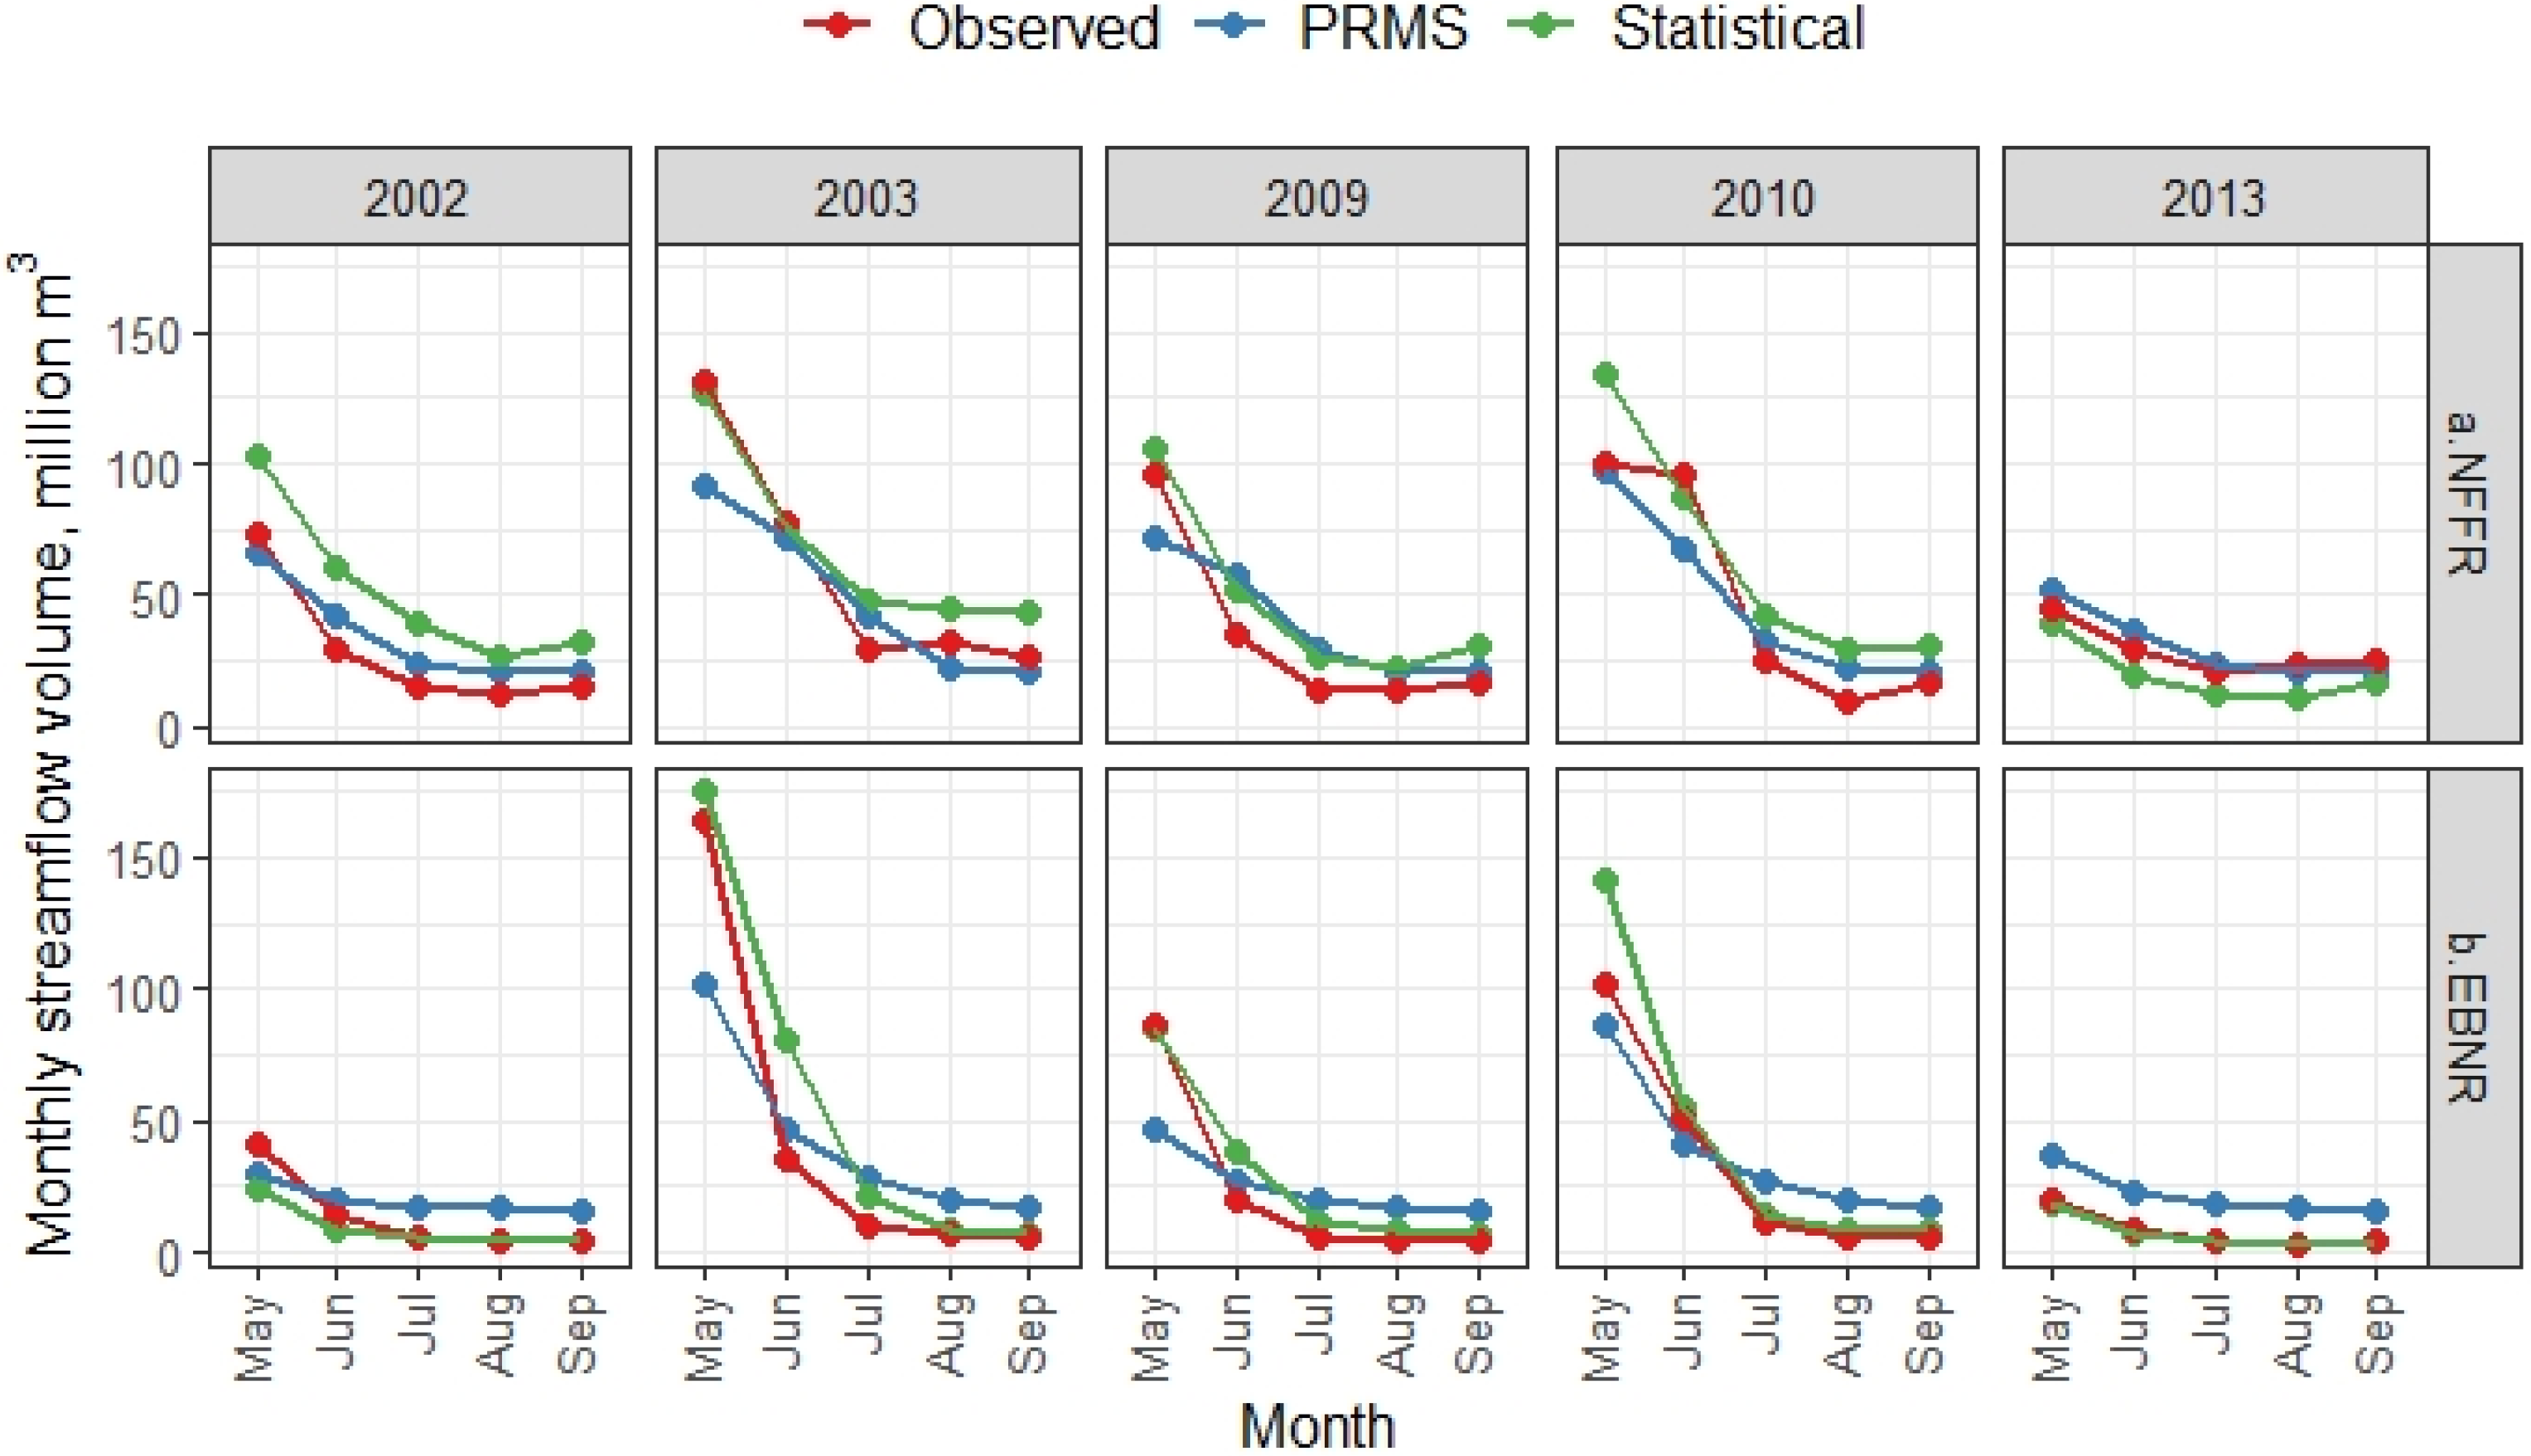
For both methods, the monthly forecasted runoff declined from spring into summer and showed a recession curve similar to that observed. The historical runoff data were obtained from USGS (Figure 5). To assess the forecasting skill of the two methods, we used a skill score that normalizes the result by the difference of each observation from the mean (Table 3). The mean absolute error (MAE) has dimensions and depends on the magnitude of the runoff. A zero skill score indicates no skill in using the historical average observation as the forecast, a negative value indicates that using the average would be better than using the forecast, and a skill score of one indicates perfect skill [17].
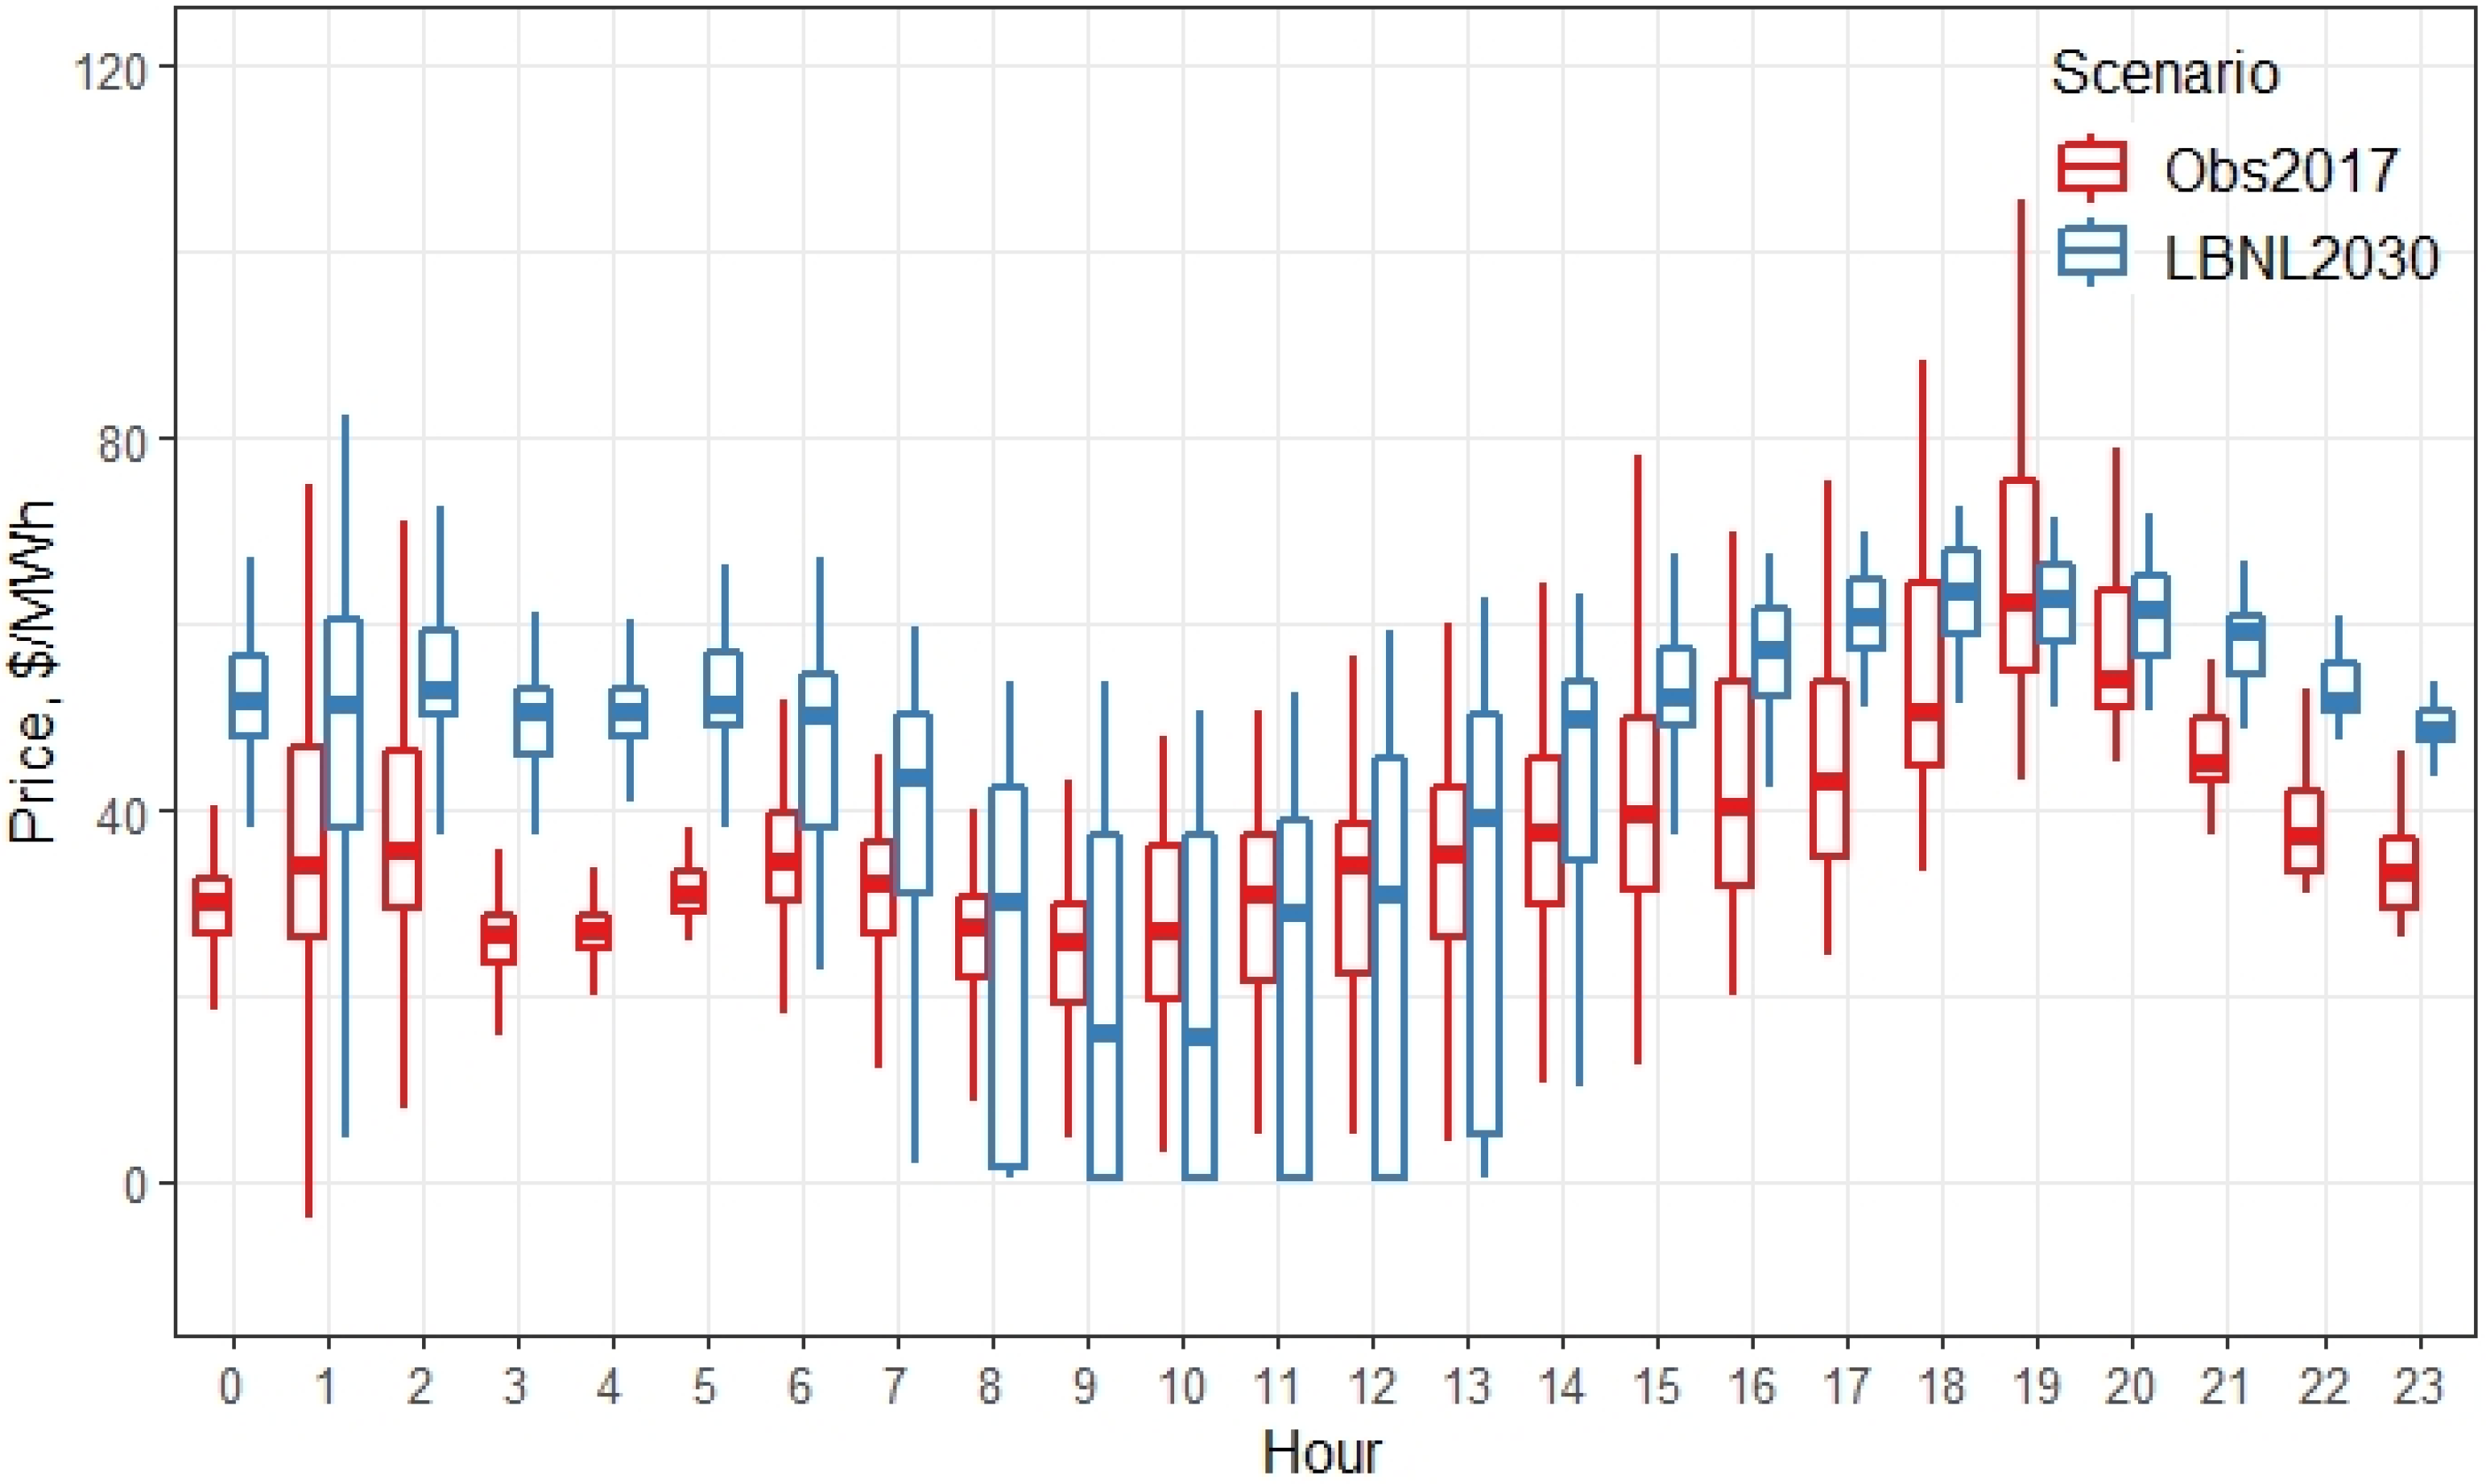
We evaluated hydropower generation under two price scenarios, which we refer to as Obs2017 and LBNL2030. These two scenarios have hourly energy prices over a year. The Obs2017 price scenario uses the hourly day-ahead energy price for the Northern California region in 2017 and was obtained from the California Independent System Operator (CAISO). CAISO oversees the operation of California’s bulk electric power system, transmission lines, and electricity market generated and transmitted by its member utilities. Hourly electricity prices are projected to become more volatile in the future with greater renewable penetration [18]. This is already happening to some extent, and thus the Obs2017 scenario represents a good baseline for potential power generation.
The “LBNL2030” price scenario was obtained from Seel et al. [18] and predicts hourly energy prices in 2030 based on the 2016 energy prices and considering the increasing penetrations of variable renewable energy. We selected the scenario of high solar penetration based on the current proportion of wind and solar generation in California, along with a limited-capacity-balancing expansion model for nonvariable renewable energy (VRE), in which non-VRE generation can be influenced by the introduction of VREs to the grid (i.e., VREs may displace non-VRE generation resources; see Seel et al. [18] for details). The LBNL2030 prices represent a relatively balanced future scenario, compared to the Obs2017 prices. The hourly electricity prices of the two scenarios are shown in Figure 6. These energy price data are used on an hourly basis when simulating hydropower generation.
2.4. Investment Assessment
To assess the value of investing in an enhanced forecasting method, we used the internal rate of return [7]. The IRR can serve as an appropriate index for either accepting or rejecting an investment. A minimum attractive rate of return (MARR) will be indicated by the project decision maker. An IRR exceeding this MARR indicates an “attractive” investment. The cost of the enhanced forecasting method includes the initial development cost and annual operation and maintenance cost. For this study specifically, we assumed an investment period of 10 years. We considered the different values of the initial development investment and the annual cost to calculate the IRR. Based on the internal pricing information, the initial development cost of the forecasting system is estimated to be between USD 400,000 (low initial development cost) and USD 500,000 (high initial development cost), which includes the cost of acquisition and installation of the sensors and hardware for wireless sensor networks. The annual cost is estimated to be between USD 30,000 (low annual cost) and USD 70,000 (high annual cost), which includes additional payments to maintain the field sensors, costs for maintaining the data system, and preparation of the value-added products. These are incremental operational costs, as the sensors are co-located with existing meteorological stations, and the PRSM modeling is an upgrade of current modeling.
We considered two hydrologic scenarios. One is that within the 10-year investment period, 7 years are extremely dry or wet, resulting in very little additional benefit. The other scenario is the opposite, under which most years are average years that lead to great potential for energy-value increase. We used Monte Carlo simulation to randomly reproduce each scenario 10,000 times and then calculated the average IRR.
3. Results
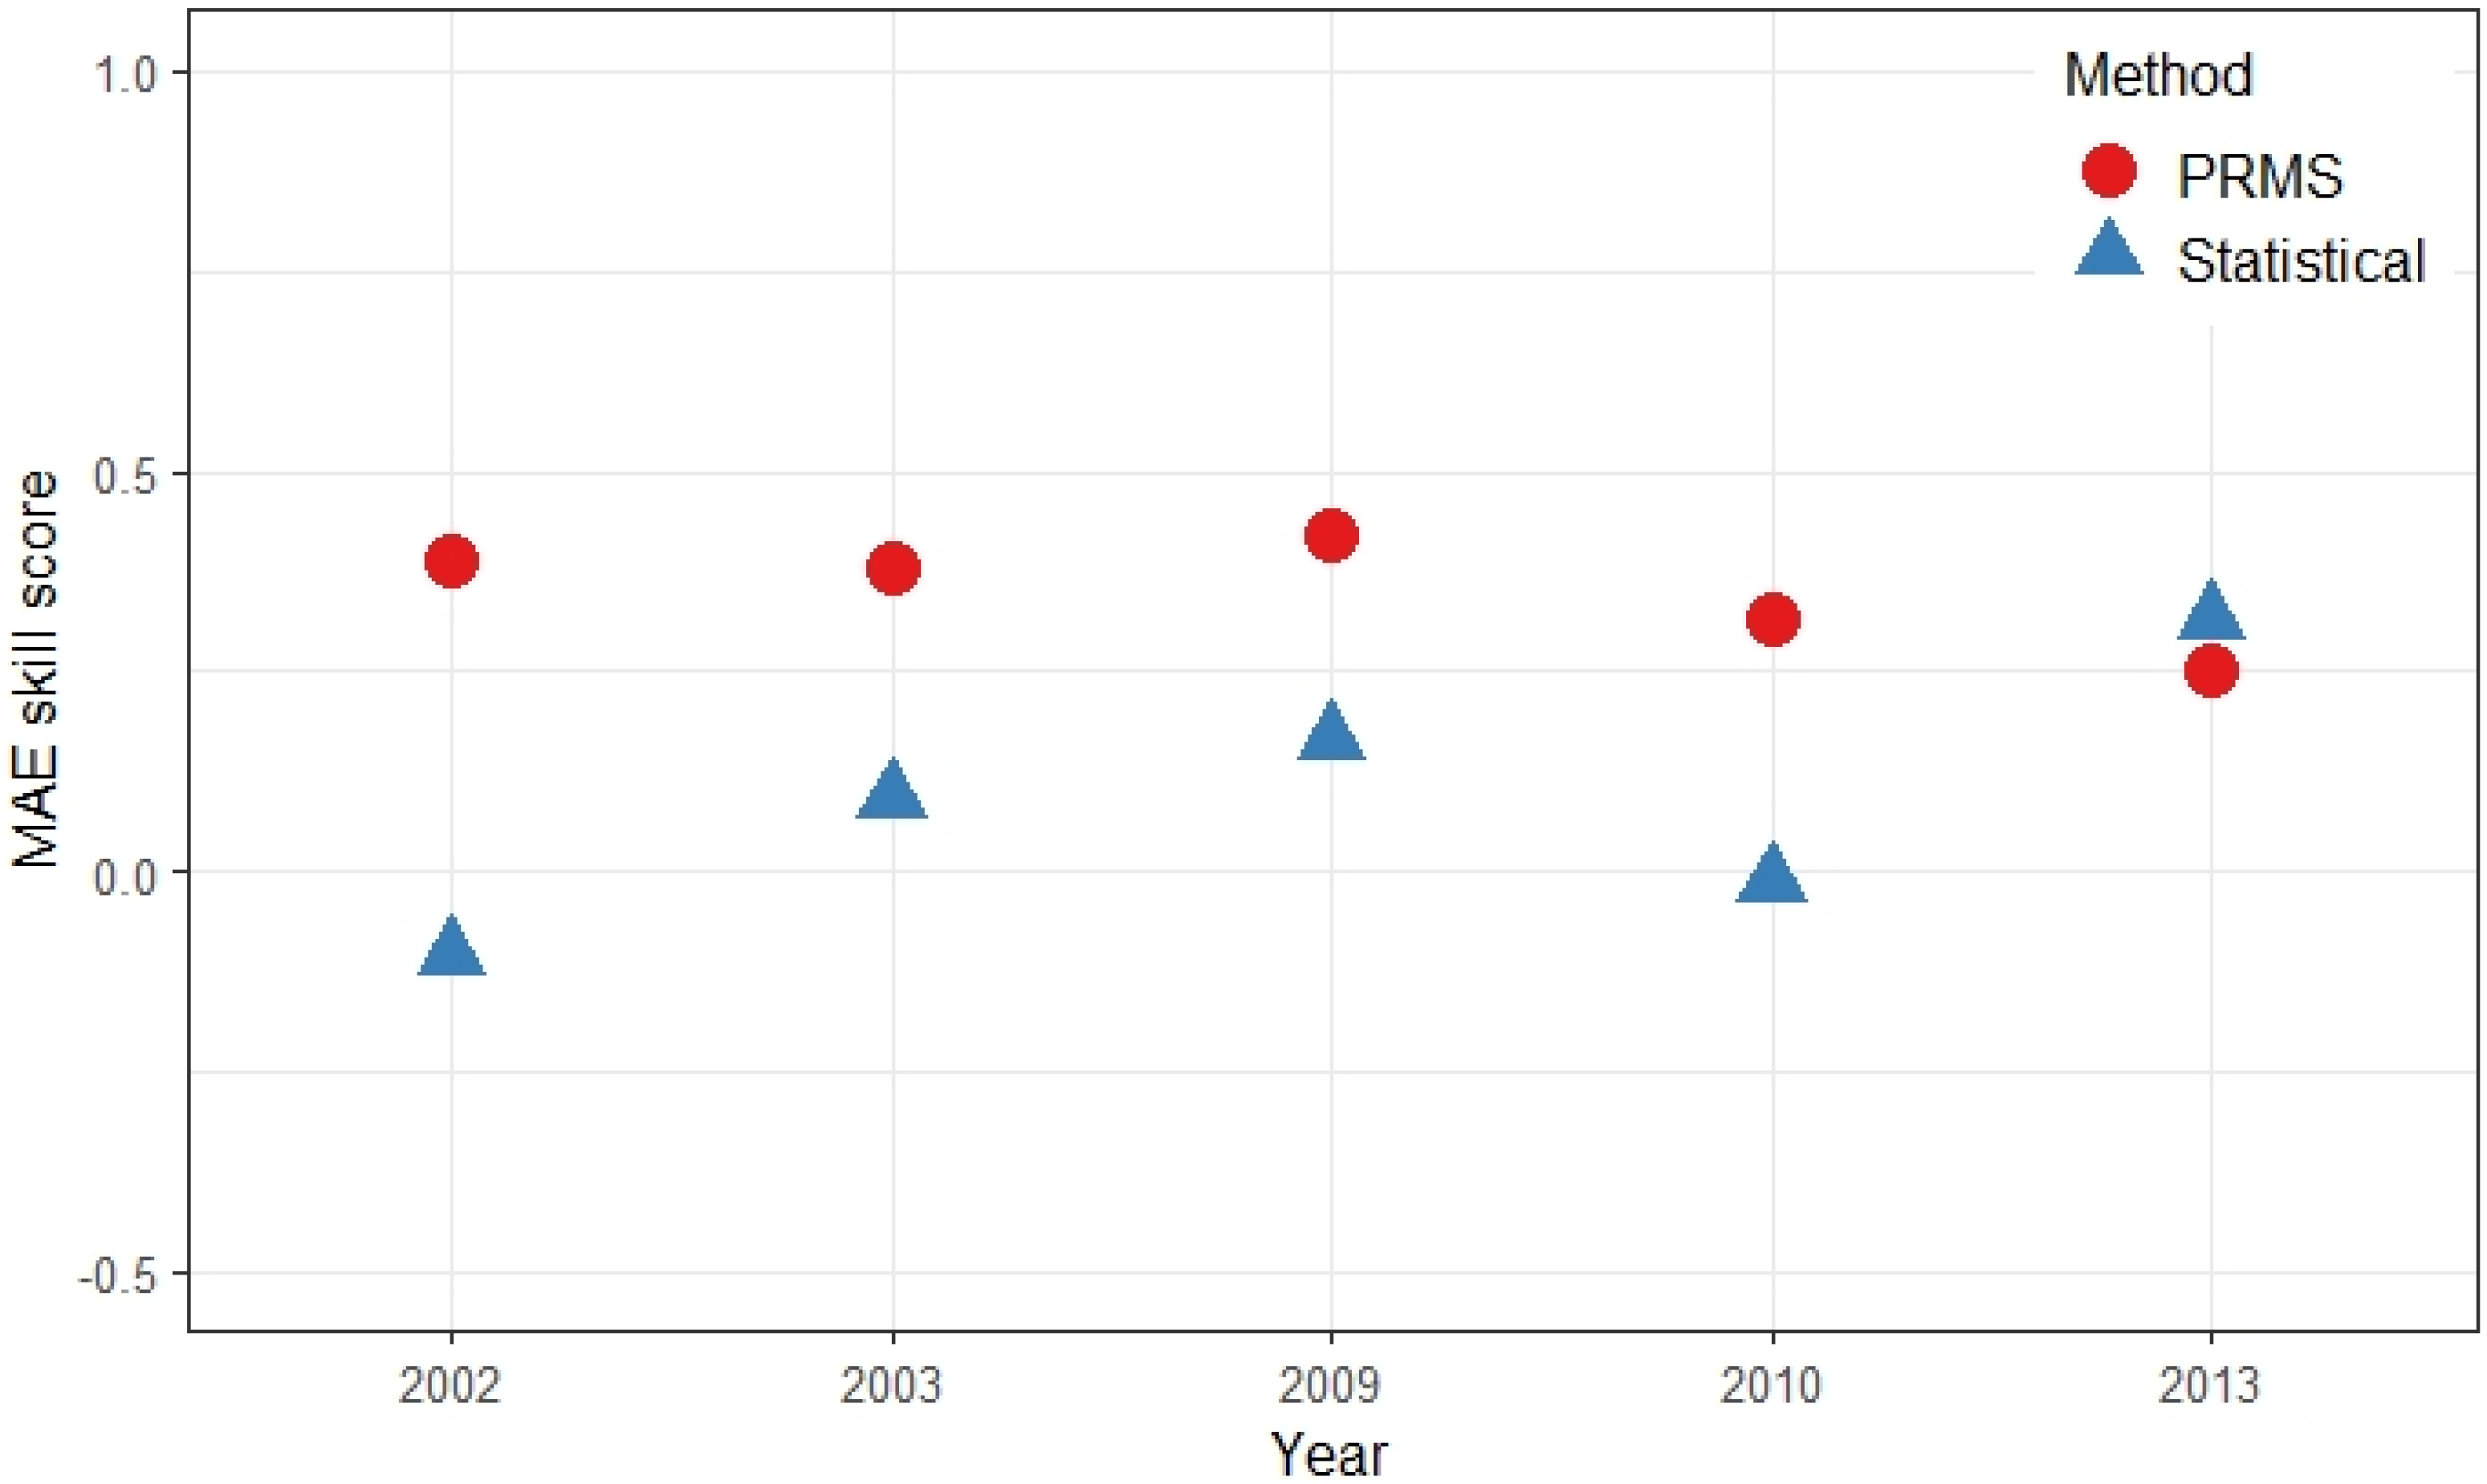
In four of five years chosen, i.e., 2002, 2003, 2009, 2010, the MAE skill scores of the enhanced forecasting method are higher than those of the statistical method, by an average of 0.34. The only exception is 2013, when the MAE score of the enhanced forecasting method is 0.06 lower than the score of the statistical method. That is, in most years, the enhanced forecasting method had better forecasting accuracy than the statistical method in terms of monthly runoff (Figure 7).
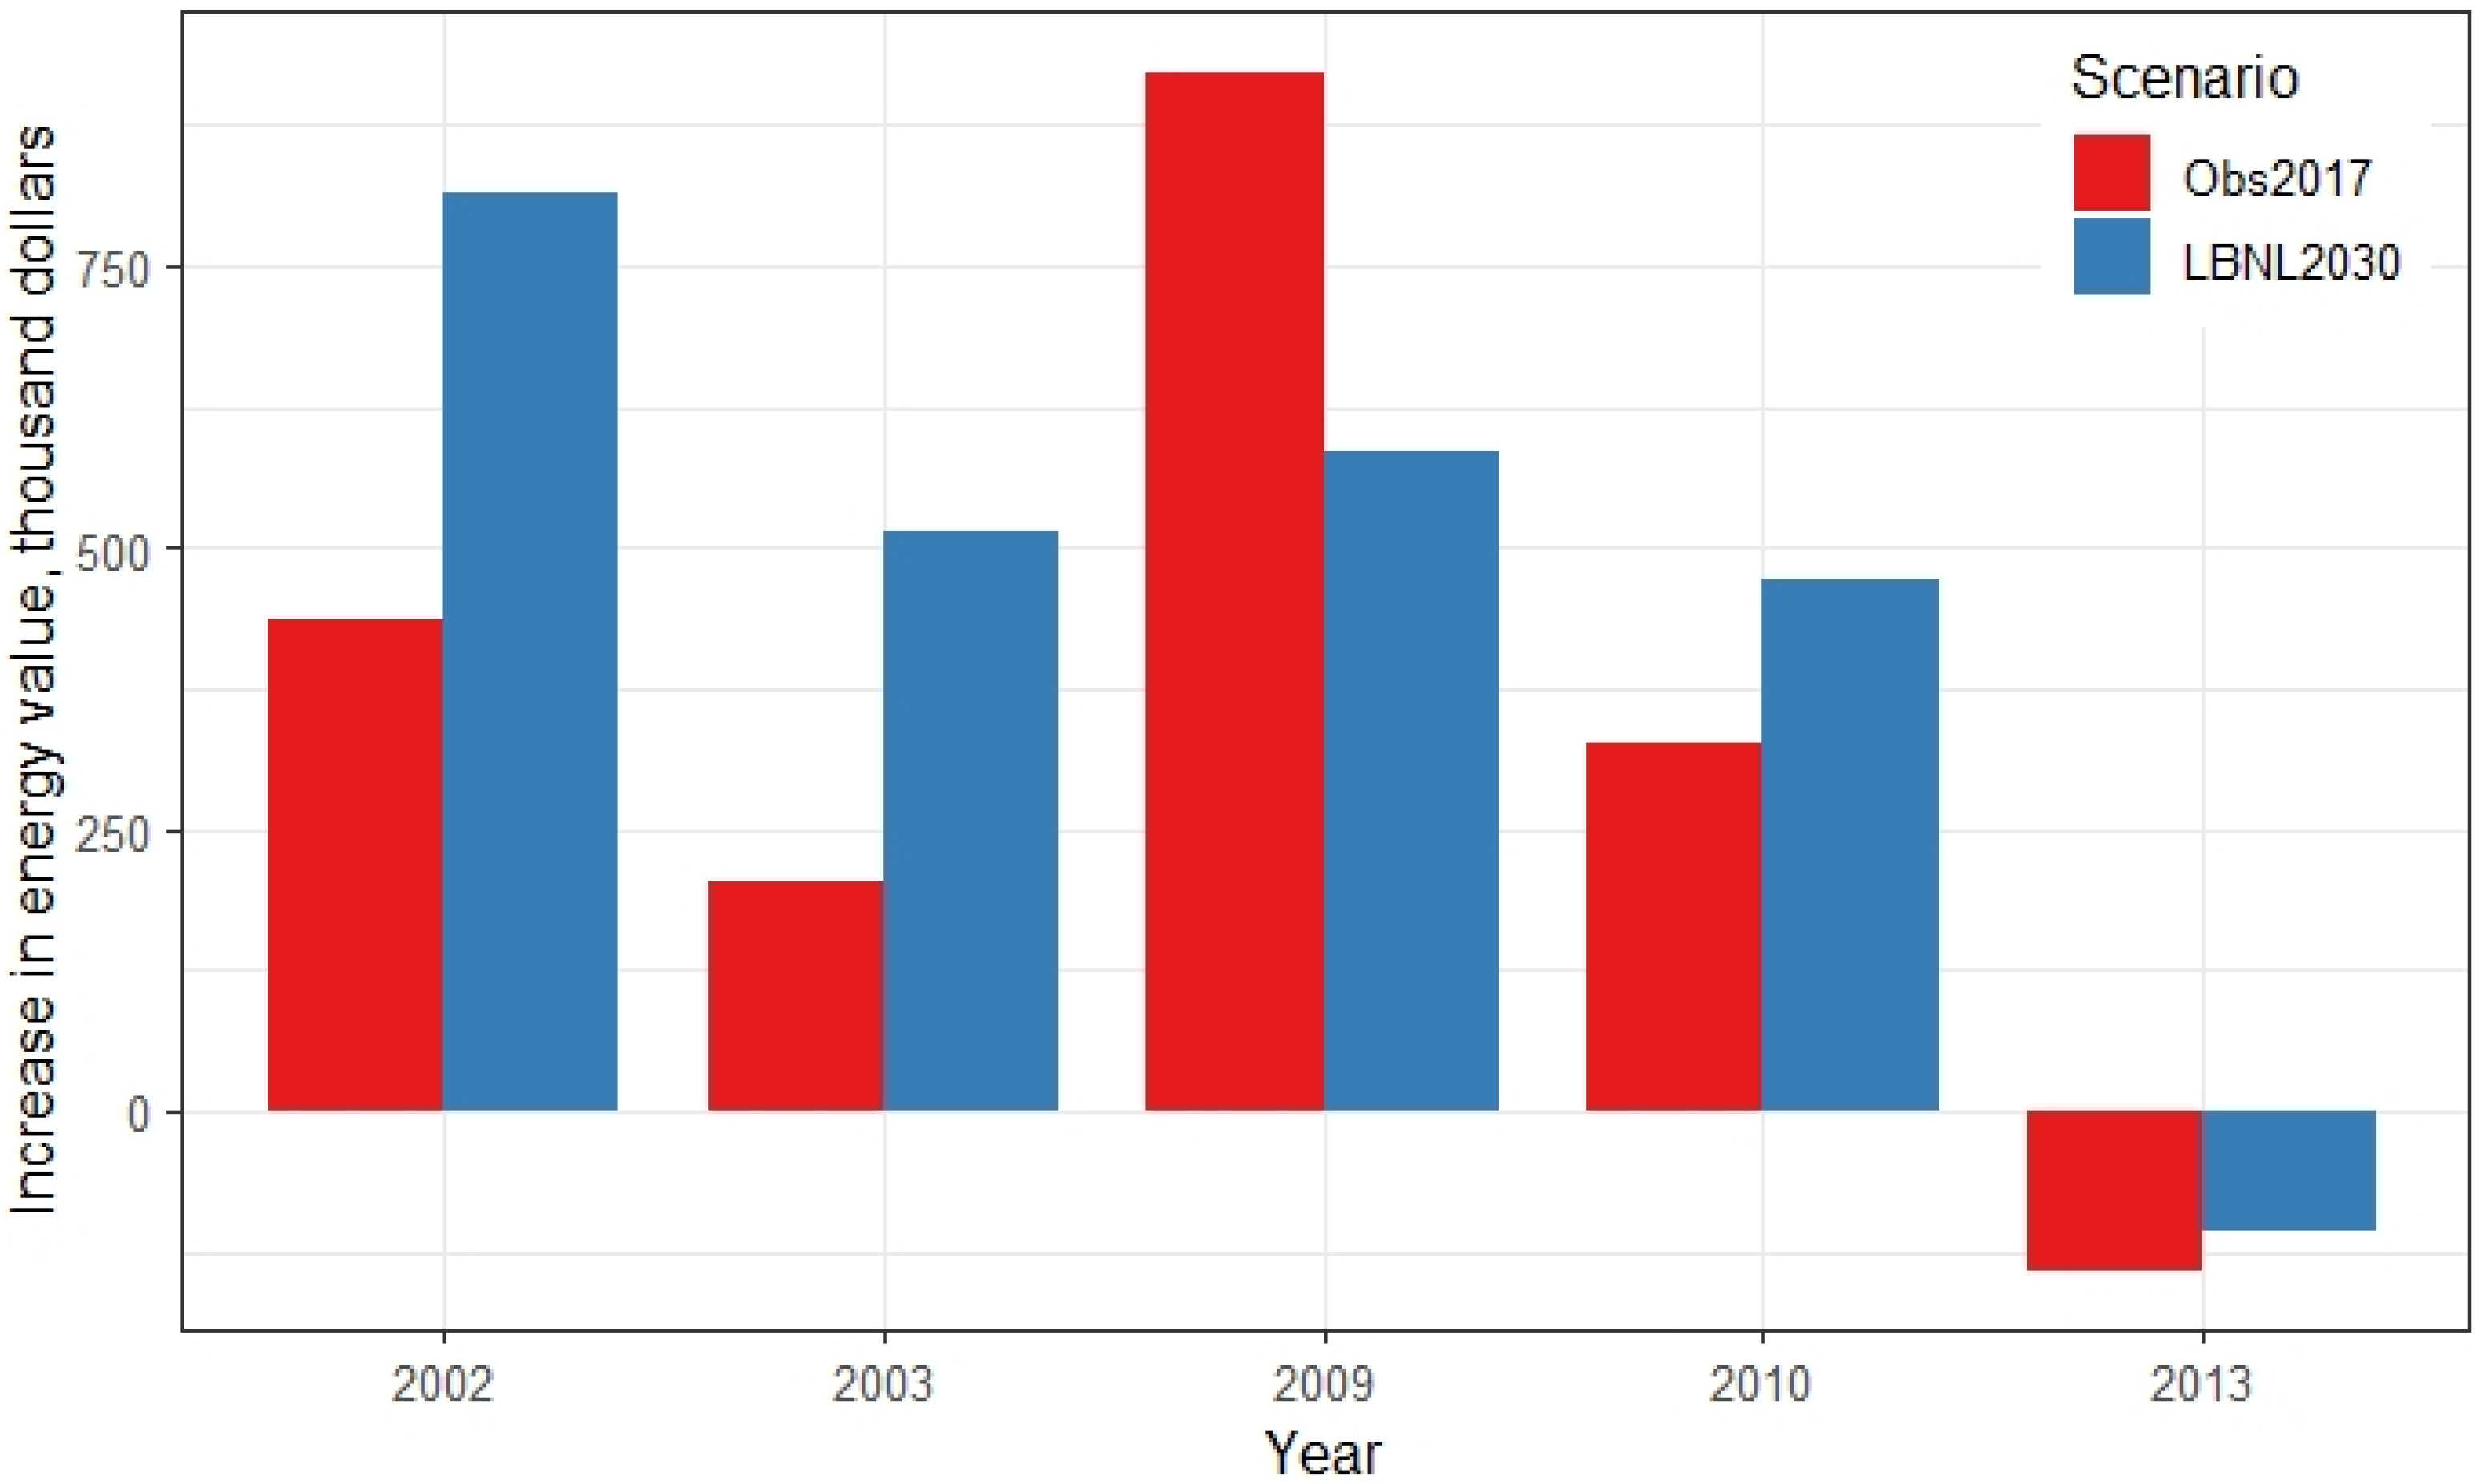
Applying the enhanced forecasting method to hydropower generation, 80% of the selected years show greater energy value, compared to the statistical forecasting method under both price scenarios (Figure 8 and Figure 9). The annual power generation remains the same for both forecasting methods, as it is the actual inflow for hydropower generation, regardless of the forecasting method used. The annual energy value of the five years studied increased by an average value of USD 0.35 million and USD 0.46 million, which are 1.1% and 1.5%, using the enhanced forecasting method, under Obs2017 and LBNL 2030 price scenarios, respectively. The annual energy value with the largest increase is USD 0.92 million (3.1%) in 2009 under Obs2017, and USD 0.81 million (3.1%) in 2002 under LBNL 2020.
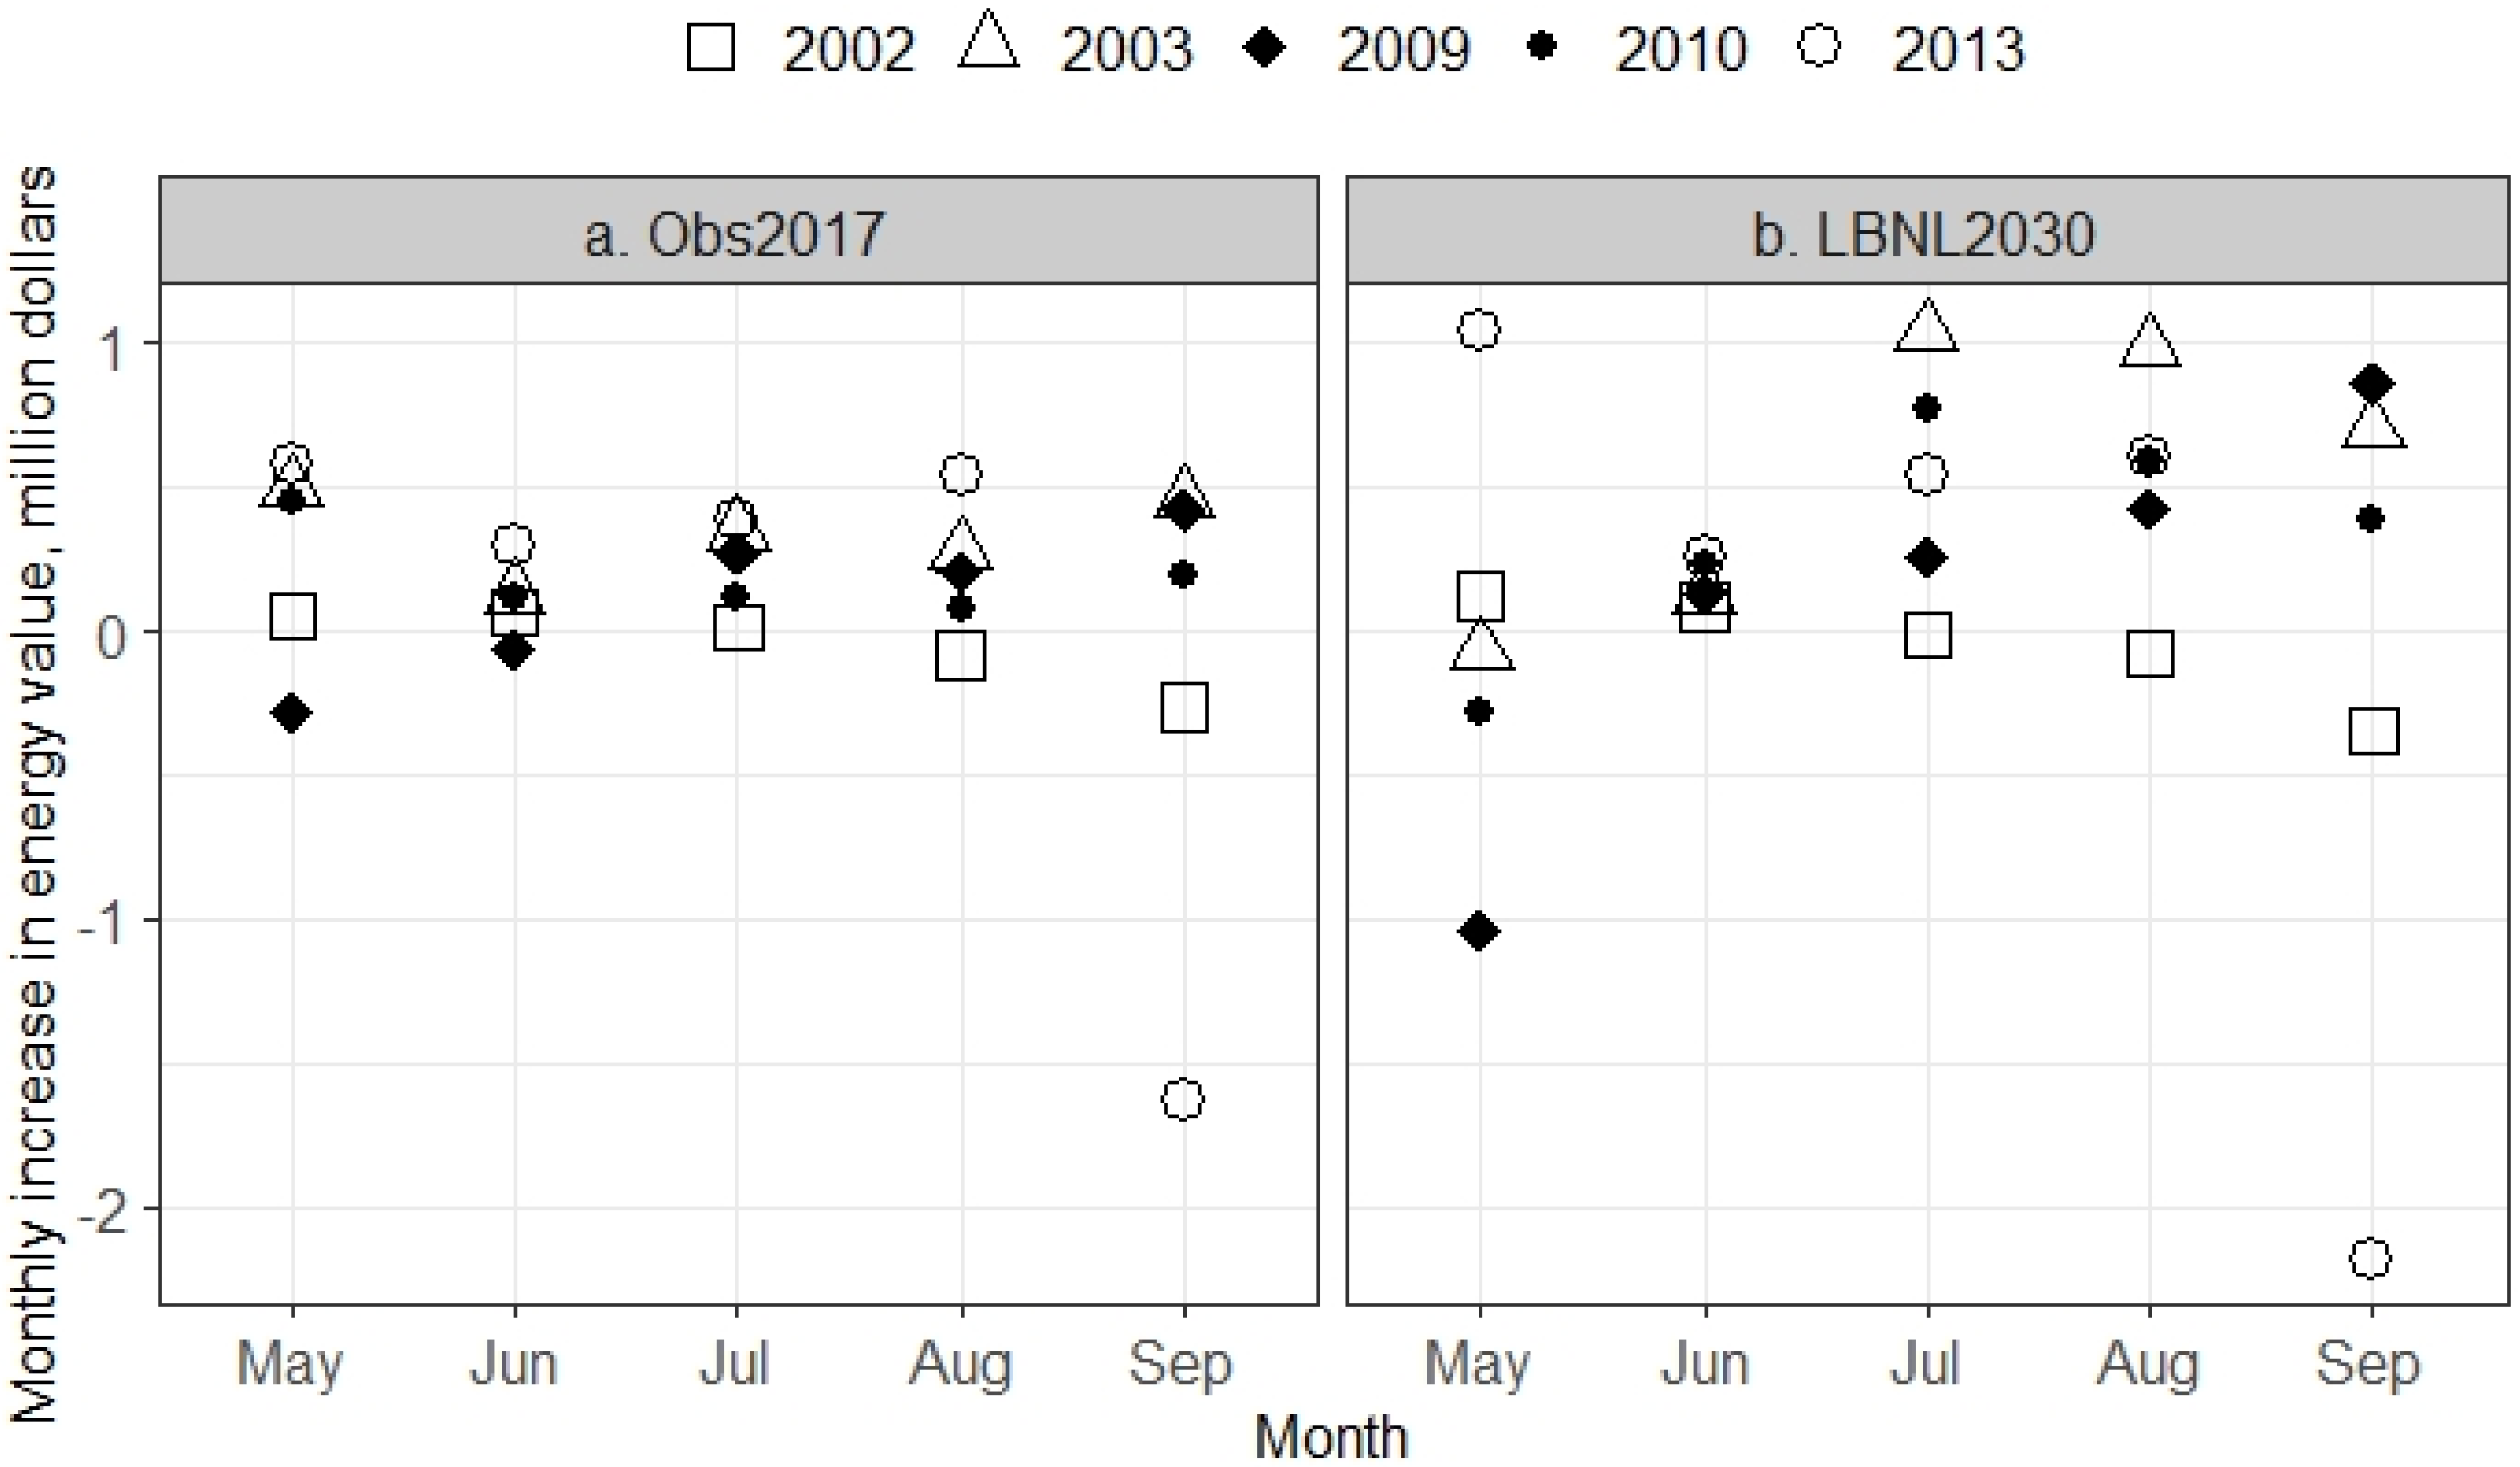
Considering results on a sub-annual basis, not every month will see an increase in energy value using the enhanced forecasting method. In some months, the income is equal or even lower. This may be because the operation strategy will adjust the monthly discharge based on the difference in the total amount and distribution of the annual runoff to maximize the annual energy value.
The IRRs calculated under different scenarios are shown in Table 4. In both price scenarios, high initial development cost and high annual cost result in the lowest IRR, and, conversely, low initial development cost and low annual cost result in the highest IRR, which is reasonable since IRR is sensitive to cost.
Energy price is another factor influencing the IRR; the IRRs are higher in scenario LBNL 2030 than in scenario Obs2017. The factor that has the most significant impact on IRR is the number of years in which considerable additional benefits can be obtained in the 10 years. The results show that the average IRR of applying the enhanced forecasting method in all scenarios exceeds 31%. Furthermore, in the most optimistic scenario, in which most years are average years when we can obtain considerable additional power generation benefits and with overall lowest costs, the IRR exceeds 75%. If the decision maker sets the minimum attractive rate of lower than 31%, then this investment is justified with the projected IRR.
4. Discussion
In practice, the forecasts of inflow to reservoirs can dynamically inform reservoir-release decisions and thus help enable hydropower systems to maximize their energy value. More accurate forecasts can help in optimizing reservoir operations by reducing overflow, raising water head for power generation, and generating power when the hourly electricity price is high. Therefore, the enhanced forecasting method can lead to an increase in energy value, which would benefit both hydropower companies and customers. In addition to the contribution of the enhanced forecasting to informed decision making on energy production, safety and environmental issues arising from climate change can also be better managed by enabling more efficient operation of water release and flood control through better data. “With better and more usable data informing water management, California’s existing water resources could better meet urban, agricultural, ecological and industrial needs” [19].
Climate change scenarios involving lower precipitation and/or runoff in two Sierra Nevada basins were found to directly reduce energy generation and revenues [20]. This is in part due to winter inflow increasing due to more precipitation falling as rain versus snow, as well as earlier snowmelt driven by higher temperatures [21]. This leads to an increased chance of reservoir spillage and lost generation potential. Thus, the timing of snowmelt and the precipitation phase (snow or rain) affect generation patterns, total generation, and power values across California’s high-elevation hydropower system [22]; however, the response of these systems, in terms of energy generation, depends on the climate change scenario, making simple adjustments to operations elusive [23,24]. Thus, with continued warming, the traditional operating rules are becoming increasingly inadequate to optimally manage water resources, thereby affecting both hydropower generation and energy value.
Compared with some other hydrologic forecasting methods, such as the deterministic and probabilistic hydrologic forecasts method proposed by Fernando [25] and the method using numerical weather prediction models for forecast proposed by Shahryar [26], the characteristic of the enhanced forecasting method is that the PRMS model used for forecasting is calibrated with near-real-time data. Data from the distributed sensor networks are more representative of snow distribution in mountain regions and allow better detection of precipitation timing and phase [27], which can be critical in determining subsequent streamflow peaks, especially in the Sierra Nevada, which is largely covered by forests and characterized by complex topography. In the Sierra Nevada, inflow to reservoirs has historically been regulated by the melting snowpack [28]. With climate change, it is projected that a warmer atmosphere will decrease the snowpack, accelerate the melting of the snow and thus result in more wintertime runoff. Therefore, compared to the statistical method, the enhanced forecasting method has more advantages in that the multiattribute distributed sensor network can provide continuous, accurate, spatially distributed real-time data on precipitation phase and timing, snowpack, and soil moisture storage, snowmelt, temperature, relative humidity and solar radiation [27]. In addition, though this study focused on the Feather River basin and hydropower system of PG&E, the results of this research are also applicable to other hydropower systems in watersheds across the Sierra Nevada and other mountains facing similar climatic conditions and hydrologic processes to the Feather River basin.
In a possible future scenario, we expect more variable hydrologic conditions due to climate change. Therefore, those scenarios in the IRR analysis with more dry/wet years reflect such expectations. Although such a trend is detrimental to hydropower generation, the application of the enhanced forecasting method is still promising in terms of return on investment. The average IRRs for all scenarios characterized by a majority of extremely dry or wet years are 14.2% and 11.1% for price scenarios LBNL2030 and Obs2017, respectively. Additionally, since the LBNL2030 price scenario represents a future condition considering the increasing penetrations of variable renewable energy, a higher IRR means that in the future, when there is more solar generation as renewable energy, the investment in enhanced forecasting method will obtain a higher return.
5. Conclusions
An enhanced forecasting method that uses improved near-real time, spatially distributed hydrologic information can improve hydropower forecasts for systems in mountain basins similar to that in the Feather River basin. Even though benefits of hydropower scheduling accrue mainly in average years versus extremely wet or dry years, the return on investment in the system can be significant. In our study, this was evidenced by an average internal rate of return averaging over 31%. This benefit was realized mainly from better data, plus a small improvement in the hydrologic forecasting tool already in use. Therefore, investing in this enhanced forecasting method is feasible from the perspective of increasing the energy value of hydropower generation, especially for hydropower systems using outdated hydrologic forecasting methods and deeply affected by climate change.
Author Contributions
Conceptualization, R.B. and M.C.; methodology, H.G., T.M., F.A. and K.R.; software, H.G., T.M., F.A. and K.R.; validation, H.G. and T.M.; formal analysis, H.G.; investigation, F.A.; resources, K.R.; writing—original draft preparation, H.G.; writing—review and editing, H.G., M.C., T.M., F.A., K.R. and R.B.; visualization, H.G.; supervision, R.B.; project administration, R.B. All authors have read and agreed to the published version of the manuscript.
Funding
This research was supported by California Energy Commission contract EPC-14-067, USDA National Institute of Food and Agriculture grant 2018-67004-24705.
Institutional Review Board Statement
Not applicable.
Informed Consent Statement
Not applicable.
Data Availability Statement
Not Applicable.
Conflicts of Interest
The authors declare no conflict of interest.
References
- Rouhani, O.M.; Niemeier, D.; Gao, H.O.; Bel, G. Cost-benefit analysis of various California renewable portfolio standard targets: Is a 33% RPS optimal? Renew. Sustain. Energy Rev. 2016, 62, 1122–1132. [Google Scholar] [CrossRef] [Green Version]
- Koseff, A. California approves goal for 100 % carbon-free electricity by 2045. Sacram. Bee 2018, 10. [Google Scholar]
- Chang, M.K.; Eichman, J.D.; Mueller, F.; Samuelsen, S. Buffering intermittent renewable power with hydroelectric generation: A case study in California. Appl. Energy 2013, 112, 1–11. [Google Scholar] [CrossRef]
- Rosenberg, E.A.; Wood, A.W.; Steinemann, A.C. Statistical applications of physically based hydrologic models to seasonal streamflow forecasts. Water Resour. Res. 2011, 47. [Google Scholar] [CrossRef]
- Avanzi, F.; Maurer, T.P.; Malek, S.A. Feather River Hydrologic Observatory: Improving Snowpack Forecasting for Hydropower Generation Using Intelligent Information Systems; California Energy Commission: Sacramento, CA, USA, 2018.
- Maurer, T.; Avanzi, F.; Oroza, C.A.; Glaser, S.D.; Conklin, M.; Bales, R.C. Optimizing spatial distribution of watershed-scale hydrologic models using Gaussian Mixture Models. Environ. Model. Softw. 2021, 142, 105076. [Google Scholar] [CrossRef]
- Park, C.S. Fundamentals of Engineering Economics; Prentice Hall: Upper Saddle River, NJ, USA, 2004; ISBN 0130307912. [Google Scholar]
- Dettinger, M.D.; Cayan, D.R. Large-scale atmospheric forcing of recent trends towards early snowmelt runoff in California. J. Clim. 1995, 8, 606–623. [Google Scholar] [CrossRef] [Green Version]
- Malek, S.A.; Glaser, S.D.; Bales, R.C. Wireless Sensor Networks for Improved Snow Water Equivalent and Runoff Estimates. IEEE Access 2019, 7, 18420–18436. [Google Scholar] [CrossRef]
- Avanzi, F.; Maurer, T.; Glaser, S.D.; Bales, R.C.; Conklin, M.H. Information content of spatially distributed ground-based measurements for hydrologic-parameter calibration in mixed rain-snow mountain headwaters. J. Hydrol. 2020, 582, 124478. [Google Scholar] [CrossRef]
- Oroza, C.A.; Zheng, Z.; Glaser, S.D.; Tuia, D.; Bales, R.C. Optimizing embedded sensor network design for catchment-scale snow-depth estimation using LiDAR and machine learning. Water Resour. Res. 2016, 52, 8174–8189. [Google Scholar] [CrossRef] [Green Version]
- Markstrom, S.L.; Niswonger, R.G.; Regan, R.S.; Prudic, D.E.; Barlow, P.M. GSFLOW—Coupled Ground-Water and Surface-Water Flow Model Based on the Integration of the Precipitation-Runoff Modeling System (PRMS) and the Modular Ground-Water Flow Model (MODFLOW-2005). U.S. Geol. Surv. 2008, 6, 240. [Google Scholar]
- Markstrom, S.L.; Regan, R.S.; Hay, L.E.; Viger, R.J.; Webb, R.M.T.; Payn, R.A.; LaFontaine, J.H. PRMS-IV, the Precipitation-Runoff Modeling System, Version 4. U.S. Geol. Surv. Tech. Methods 2015, 6, B7. [Google Scholar] [CrossRef]
- Koczot, K.M.; Jeton, A.E.; McGurk, B.J.; Dettinger, M.D. Precipitation-Runoff Processes in the Feather River Basin, Northeastern California, with Prospects for Streamflow Predictability, Water Years 1971–1997; Scientific Investigations Report 2004-5202; US Geolological Survey: Denver, CO, USA, 2004.
- Roche, J.W.; Ma, Q.; Rungee, J.; Bales, R.C. Evapotranspiration Mapping for Forest Management in California’s Sierra Nevada. Front. For. Glob. Chang. 2020, 3, 39. [Google Scholar] [CrossRef]
- Harrison, B.; Bales, R. Skill Assessment of Water Supply Forecasts for Western Sierra Nevada Watersheds. J. Hydrol. Eng. 2016, 21, 04016002. [Google Scholar] [CrossRef] [Green Version]
- Harrison, B.; Bales, R. Skill assessment of water supply outlooks in the Colorado River basin. Hydrology 2015, 2, 112–131. [Google Scholar] [CrossRef] [Green Version]
- Seel, J.; Mills, A.; Wiser, R.; Deb, S.; Asokkumar, A.; Hassanzadeh, M.; Aarabali, A. Impacts of High Variable Renewable Energy Futures on Wholesale Electricity Prices, and on Electric-Sector Decision Making; Lawrence Berkeley National Laboratory: Berkeley, CA, USA, 2018; p. 53.
- Cantor, A.; Kiparsky, M.; Kennedy, R.; Hubbard, S.; Bales, R.; Pecharroman, L.C.; Guivetchi, K.; McCready, C.; Darling, G. Data for Water Decision Making: Informing the Implementation of California’s Open and Transparent Water Data Act through Research and Engagement; Lawrence Berkeley National Laboratory: Berkeley, CA, USA, 2018; p. 56. [CrossRef]
- Vicuña, S.; Dracup, J.A.; Dale, L. Climate change impacts on two high-elevation hydropower systems in California. Clim. Chang. 2011, 109, 151–169. [Google Scholar] [CrossRef]
- Forrest, K.; Tarroja, B.; Chiang, F.; AghaKouchak, A.; Samuelsen, S. Assessing climate change impacts on California hydropower generation and ancillary services provision. Clim. Chang. 2018, 151, 395–412. [Google Scholar] [CrossRef]
- Madani, K.; Lund, J.R. Estimated impacts of climate warming on California’s high-elevation hydropower. Clim. Chang. 2010, 102, 521–538. [Google Scholar] [CrossRef] [Green Version]
- Madani, K.; Guégan, M.; Uvo, C.B. Climate change impacts on high-elevation hydroelectricity in California. J. Hydrol. 2014, 510, 153–163. [Google Scholar] [CrossRef]
- Rheinheimer, D.E.; Viers, J.H.; Sieber, J.; Kiparsky, M.; Mehta, V.K.; Ligare, S.T. Simulating high-elevation hydropower with regional climate warming in the west slope, Sierra Nevada. J. Water Resour. Plan. Manag. 2014, 140, 714–723. [Google Scholar] [CrossRef]
- Fan, F.M.; Schwanenberg, D.; Alvarado, R.; Assis dos Reis, A.; Collischonn, W.; Naumman, S. Performance of Deterministic and Probabilistic Hydrological Forecasts for the Short-Term Optimization of a Tropical Hydropower Reservoir. Water Resour. Manag. 2016, 30, 3609–3625. [Google Scholar] [CrossRef] [Green Version]
- Ahmad, S.K.; Hossain, F. Maximizing energy production from hydropower dams using short-term weather forecasts. Renew. Energy 2020, 146, 1560–1577. [Google Scholar] [CrossRef]
- Cui, G.; Bales, R.; Rice, R.; Anderson, M.; Avanzi, F.; Hartsough, P.; Conklin, M. Detecting rain–snow-transition elevations in mountain basins using wireless sensor networks. J. Hydrometeorol. 2020, 21, 2061–2081. [Google Scholar] [CrossRef]
- Vicuna, S.; Leonardson, R.; Hanemann, M.W.; Dale, L.L.; Dracup, J.A. Climate change impacts on high elevation hydropower generation in California’s Sierra Nevada: A case study in the Upper American River. Clim. Chang. 2007, 87, 123–137. [Google Scholar] [CrossRef]
Figure 1.
Maps of California and the Feather River basin.

Figure 2.
Schematic diagram of the hydropower system in this study from the Upper North Fork Feather River Hydroelectric Project (FERC 2105).
Figure 2.
Schematic diagram of the hydropower system in this study from the Upper North Fork Feather River Hydroelectric Project (FERC 2105).

Figure 3.
Flowchart of the two runoff forecasting methods: (a) the statistical forecast and (b) the enhanced forecast using PRMS and wireless sensor data.
Figure 3.
Flowchart of the two runoff forecasting methods: (a) the statistical forecast and (b) the enhanced forecast using PRMS and wireless sensor data.

Figure 4.
Flowchart of the hydropower simulation model.

Figure 5.
Monthly runoff forecasts: (a) North Fork Feather River (NFFR) as inflow to Lake Almanor and (b) East Branch of the North Fork (EBNR), generated by two forecasting methods and the observed runoff data.
Figure 5.
Monthly runoff forecasts: (a) North Fork Feather River (NFFR) as inflow to Lake Almanor and (b) East Branch of the North Fork (EBNR), generated by two forecasting methods and the observed runoff data.

Figure 6.
Hourly electricity price of the two price scenarios. Hourly mean values are represented by the horizontal line and interquartile ranges are represented by the boxes and vertical lines.
Figure 6.
Hourly electricity price of the two price scenarios. Hourly mean values are represented by the horizontal line and interquartile ranges are represented by the boxes and vertical lines.

Figure 7.
Comparison of the MAE skill score of the two forecasting methods.

Figure 8.
The monthly increase in energy value (“enhanced forecasting method”–“statistical”) of the selected years under two price scenarios.
Figure 8.
The monthly increase in energy value (“enhanced forecasting method”–“statistical”) of the selected years under two price scenarios.

Figure 9.
The annual increase in energy value using the enhanced forecasting method under two price scenarios.
Figure 9.
The annual increase in energy value using the enhanced forecasting method under two price scenarios.


Table 1.
The reservoirs.
| Reservoirs | Gross Storage, Million m3 | Initial Value Set in the Model, Million m3 |
|---|---|---|
| Lake Almanor | 1409.8 | 1134.8 |
| Butt Valley | 61.5 | 54.3 |
| Belden | 3.1 | 2.5 |
| Rock Creek | 5.4 | 5.0 |
| Cresta | 5.1 | 4.6 |
| Poe | 142.0 | 113.6 |
Table 2.
The powerhouses.
| Powerhouses | Normal Capacity, MW | Maximum Flow m3 s−1 |
|---|---|---|
| Hamilton Branch | 4.8 | 200 |
| Butt Valley | 41.0 | 60.0 |
| Caribou 1 | 75.0 | 31.5 |
| Caribou 2 | 120.0 | 41.5 |
| Oak Flat | 1.3 | 4.0 |
| Belden | 125.0 | 68.2 |
| Rock Creek | 112.0 | 81.6 |
| Cresta | 70.0 | 99.4 |
| Poe | 120.0 | 104.8 |
Table 3.
The summary of measurements of forecast skill.
| Skill Measure | Equation 1 |
|---|---|
| Mean absolute error (MAE) | MAE = |
| MAE skill score | SSMAE = 1 − MAE/MAEcl where MAEcl = |
1 Variable: is the observation, is the mean of the observation, is the forecast, n is the number of observations.
Table 4.
Calculation of internal rate of return under the two prices scenarios.
| Internal Rate of Return (%) | LBNL2030 | Obs2017 | ||
|---|---|---|---|---|
| Extreme Dry/Wet Years Mostly | Average Years Mostly | Extreme Dry/Wet Years Mostly | Average Years Mostly | |
| High initial cost and high annual cost | 5.8 | 48.9 | 5.6 | 33.3 |
| High initial cost and low annual cost | 17.0 | 57.2 | 13.0 | 41.4 |
| Low initial cost and high annual cost | 10.2 | 62.4 | 8.6 | 39.6 |
| Low initial cost and low annual cost | 23.6 | 72.3 | 17.2 | 53.0 |
Publisher’s Note: MDPI stays neutral with regard to jurisdictional claims in published maps and institutional affiliations. |
© 2021 by the authors. Licensee MDPI, Basel, Switzerland. This article is an open access article distributed under the terms and conditions of the Creative Commons Attribution (CC BY) license (https://creativecommons.org/licenses/by/4.0/).
Share and Cite
MDPI and ACS Style
Guo, H.; Conklin, M.; Maurer, T.; Avanzi, F.; Richards, K.; Bales, R. Valuing Enhanced Hydrologic Data and Forecasting for Informing Hydropower Operations. Water 2021, 13, 2260. https://doi.org/10.3390/w13162260
AMA Style
Guo H, Conklin M, Maurer T, Avanzi F, Richards K, Bales R. Valuing Enhanced Hydrologic Data and Forecasting for Informing Hydropower Operations. Water. 2021; 13(16):2260. https://doi.org/10.3390/w13162260
Chicago/Turabian StyleGuo, Han, Martha Conklin, Tessa Maurer, Francesco Avanzi, Kevin Richards, and Roger Bales. 2021. "Valuing Enhanced Hydrologic Data and Forecasting for Informing Hydropower Operations" Water 13, no. 16: 2260. https://doi.org/10.3390/w13162260
Note that from the first issue of 2016, this journal uses article numbers instead of page numbers. See further details here.