Article

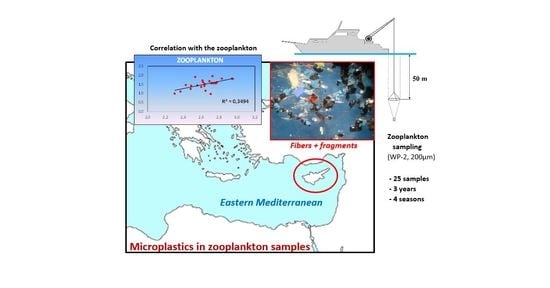
Microplastics Investigation Using Zooplankton Samples from the Coasts of Cyprus (Eastern Mediterranean)

by
Grigoria Vasilopoulou
1,
George Kehayias
2,*,
Demetris Kletou
3,4,
Periklis Kleitou
3,
Vassilios Triantafyllidis
5,
Anastasios Zotos
6,
Konstantinos Antoniadis
7,
Maria Rousou
7,
Vassilis Papadopoulos
7,
Polina Polykarpou
8 and
George Tsiamis
1
1
Department of Environmental Engineering, University of Patras, Seferi 2, 30100 Agrinio, Greece
2
Department of Food Science and Technology, University of Patras, Charilaou Trikoupi End, 30100 Agrinio, Greece
3
Marine and Environmental Research (MER) Lab, Limassol 4533, Cyprus
4
Department of Maritime Transport and Commerce, Frederick University, Limassol 3080, Cyprus
5
Department of Business Administration of Food & Agricultural Enterprises, University of Patras, Seferi 2, 30100 Agrinio, Greece
6
Department of Biosystems & Agricultural Engineering, University of Patras, Nea Ktiria, 30200 Mesolonghi, Greece
7
Department of Fisheries and Marine Research, Ministry of Agriculture, Rural Development and the Environment, Nicosia 2033, Cyprus
8
Water Development Department, Ministry of Agriculture, Rural Development and the Environment, Nicosia 2033, Cyprus
*
Author to whom correspondence should be addressed.
Water 2021, 13(16), 2272; https://doi.org/10.3390/w13162272
Submission received: 5 August 2021 / Revised: 16 August 2021 / Accepted: 17 August 2021 / Published: 19 August 2021
(This article belongs to the Special Issue Microplastics in Water Bodies and in the Environment)

Abstract

:
The Mediterranean Sea has the highest accumulation of microplastics in the world. Although numerous studies about microplastic’s abundance and distribution have been conducted, the majority sampled surface waters. Especially for the Eastern Mediterranean, there is no information concerning the deeper strata. This study fills this gap by studying the microplastic spatial and temporal distribution along the coasts of Cyprus, utilizing zooplankton samples collected from the entire 0–50 m depth layer. The average microplastics’ abundance was 41.31 ± 22.41 items/m3 indicating that the Eastern Mediterranean seems to be much more polluted than the western basin. The fibers outnumbered the abundance of the fragments by a factor of ten. Most fibers were sized between 0.5 and 1.0 mm, and 81.24% were transparent. The average area of the fragments was ≤0.05 mm2, and most of them were hard-rounded (53.38%). The microplastics to zooplankton ratio ranged between 0.021 and 0.241. A positive correlation was found between the abundance of microplastics and the total zooplankton, especially the copepods. Studies of microplastics in zooplankton samples taken from the water column are expected to provide better insights into the role of these pollutants in marine ecosystems.

Graphical Abstract

1. Introduction

Plastic, derived from petrochemicals, is among the greatest human inventions that were brought into large-scale global production during the mid-20th century, altering our lives [1]. However, large quantities of plastic debris, estimated to be from 4.8 to 12.7 million tones [2] enter the sea, physically and chemically degrading in the water, breaking down to minute fragments of plastic debris, termed microplastics [3]. Since the first reports of plastic litter in the oceans in the early 1970s, microplastics account for about 92% of the total plastic [4]. They have been reported from almost all marine environments and have been found in species spanning all levels of marine food webs. Although concerns have been raised about the hazardous effects of microplastics [5], the understanding of these effects in the marine environment is poor, mainly due to the lack of data on microplastics distribution and dynamics in different parts of aquatic ecosystems [6].
Due to their low specific density, most of the microplastics are accumulating at the sea surface, especially within the neustonic habitat [3], which is defined as the layer a few centimeters below the air-water interface. This is the reason that most of the studies on their abundance distribution have been confined to the surface layer [7]. However, recent information has verified the transport of microplastics to deeper waters through physical and biological processes [1]. Therefore, studies limited to collection in surface waters have the potential to overestimate prevalence of debris in the water column [8]. Considering that the surface water forms only a tiny proportion of the total water in the world’s oceans and that the environmental conditions in this neustonic environment are not the same as with those in the deeper waters, there is a need to investigate microplastics’ abundance in the entire water column and their impacts on the biotic elements [8].
Semi-enclosed basins are especially vulnerable, since they retain pollutants for a longer time, accumulating potentially hazardous substances in larger concentrations. The Mediterranean Sea is the largest and deepest enclosed sea on Earth, accounting for one-third of the world’s maritime traffic [9]. Moreover, due to the high population density around the coastal areas, the intense fishing and touristic activities and the absence of significant surface outflow, the Mediterranean Sea is exposed to the highest amount of plastic pollution around the world [10,11,12], and thus it was characterized as “a large bowl of plastic soup” [13]. This is probably the reason why the Mediterranean Sea is one of the most sampled areas for floating microplastics [9]. However, most of these studies have been confined to the surface layers. Furthermore, there are only a few studies conducted in the Eastern Mediterranean [14,15,16,17], and there are limited studies in the Levantine basin [9,18], where the waters are highly oligotrophic [19].
Microplastics are of the same size scale as that of planktonic organisms; thus, they are potentially available for consumption by several plankton predators [20], which possibly mistake them for food [21]. Therefore, it is relevant to address the size of microplastics in the water column, as prey size is one of the main constraints that determines zooplankton feeding [22]. Moreover, microplastics and zooplankton may drift and follow similar distributional patterns driven by the hydrological conditions and the general seawater circulation. Surprisingly, to the best of our knowledge, there are only two studies in which quantification of microplastics in samples collected for zooplankton analysis has been attempted [6,23].
Considering the above, the present study is the first attempt to record the microplastics in the 0–50 m depth layer in the Eastern Mediterranean, utilizing zooplankton samples collected around Coastal Cyprus during a three-year period. The objectives of this investigation were to provide new insights concerning the following: (i) the spatial and temporal abundance distribution of microplastics (types, sizes and colors) in an area of the Eastern Mediterranean for which there is no previous information; and (ii) the relation of the microplastics to zooplankton collected in the samples, which may suggest their potential impact on various taxa and their incorporation into the marine food web.

2. Materials and Methods
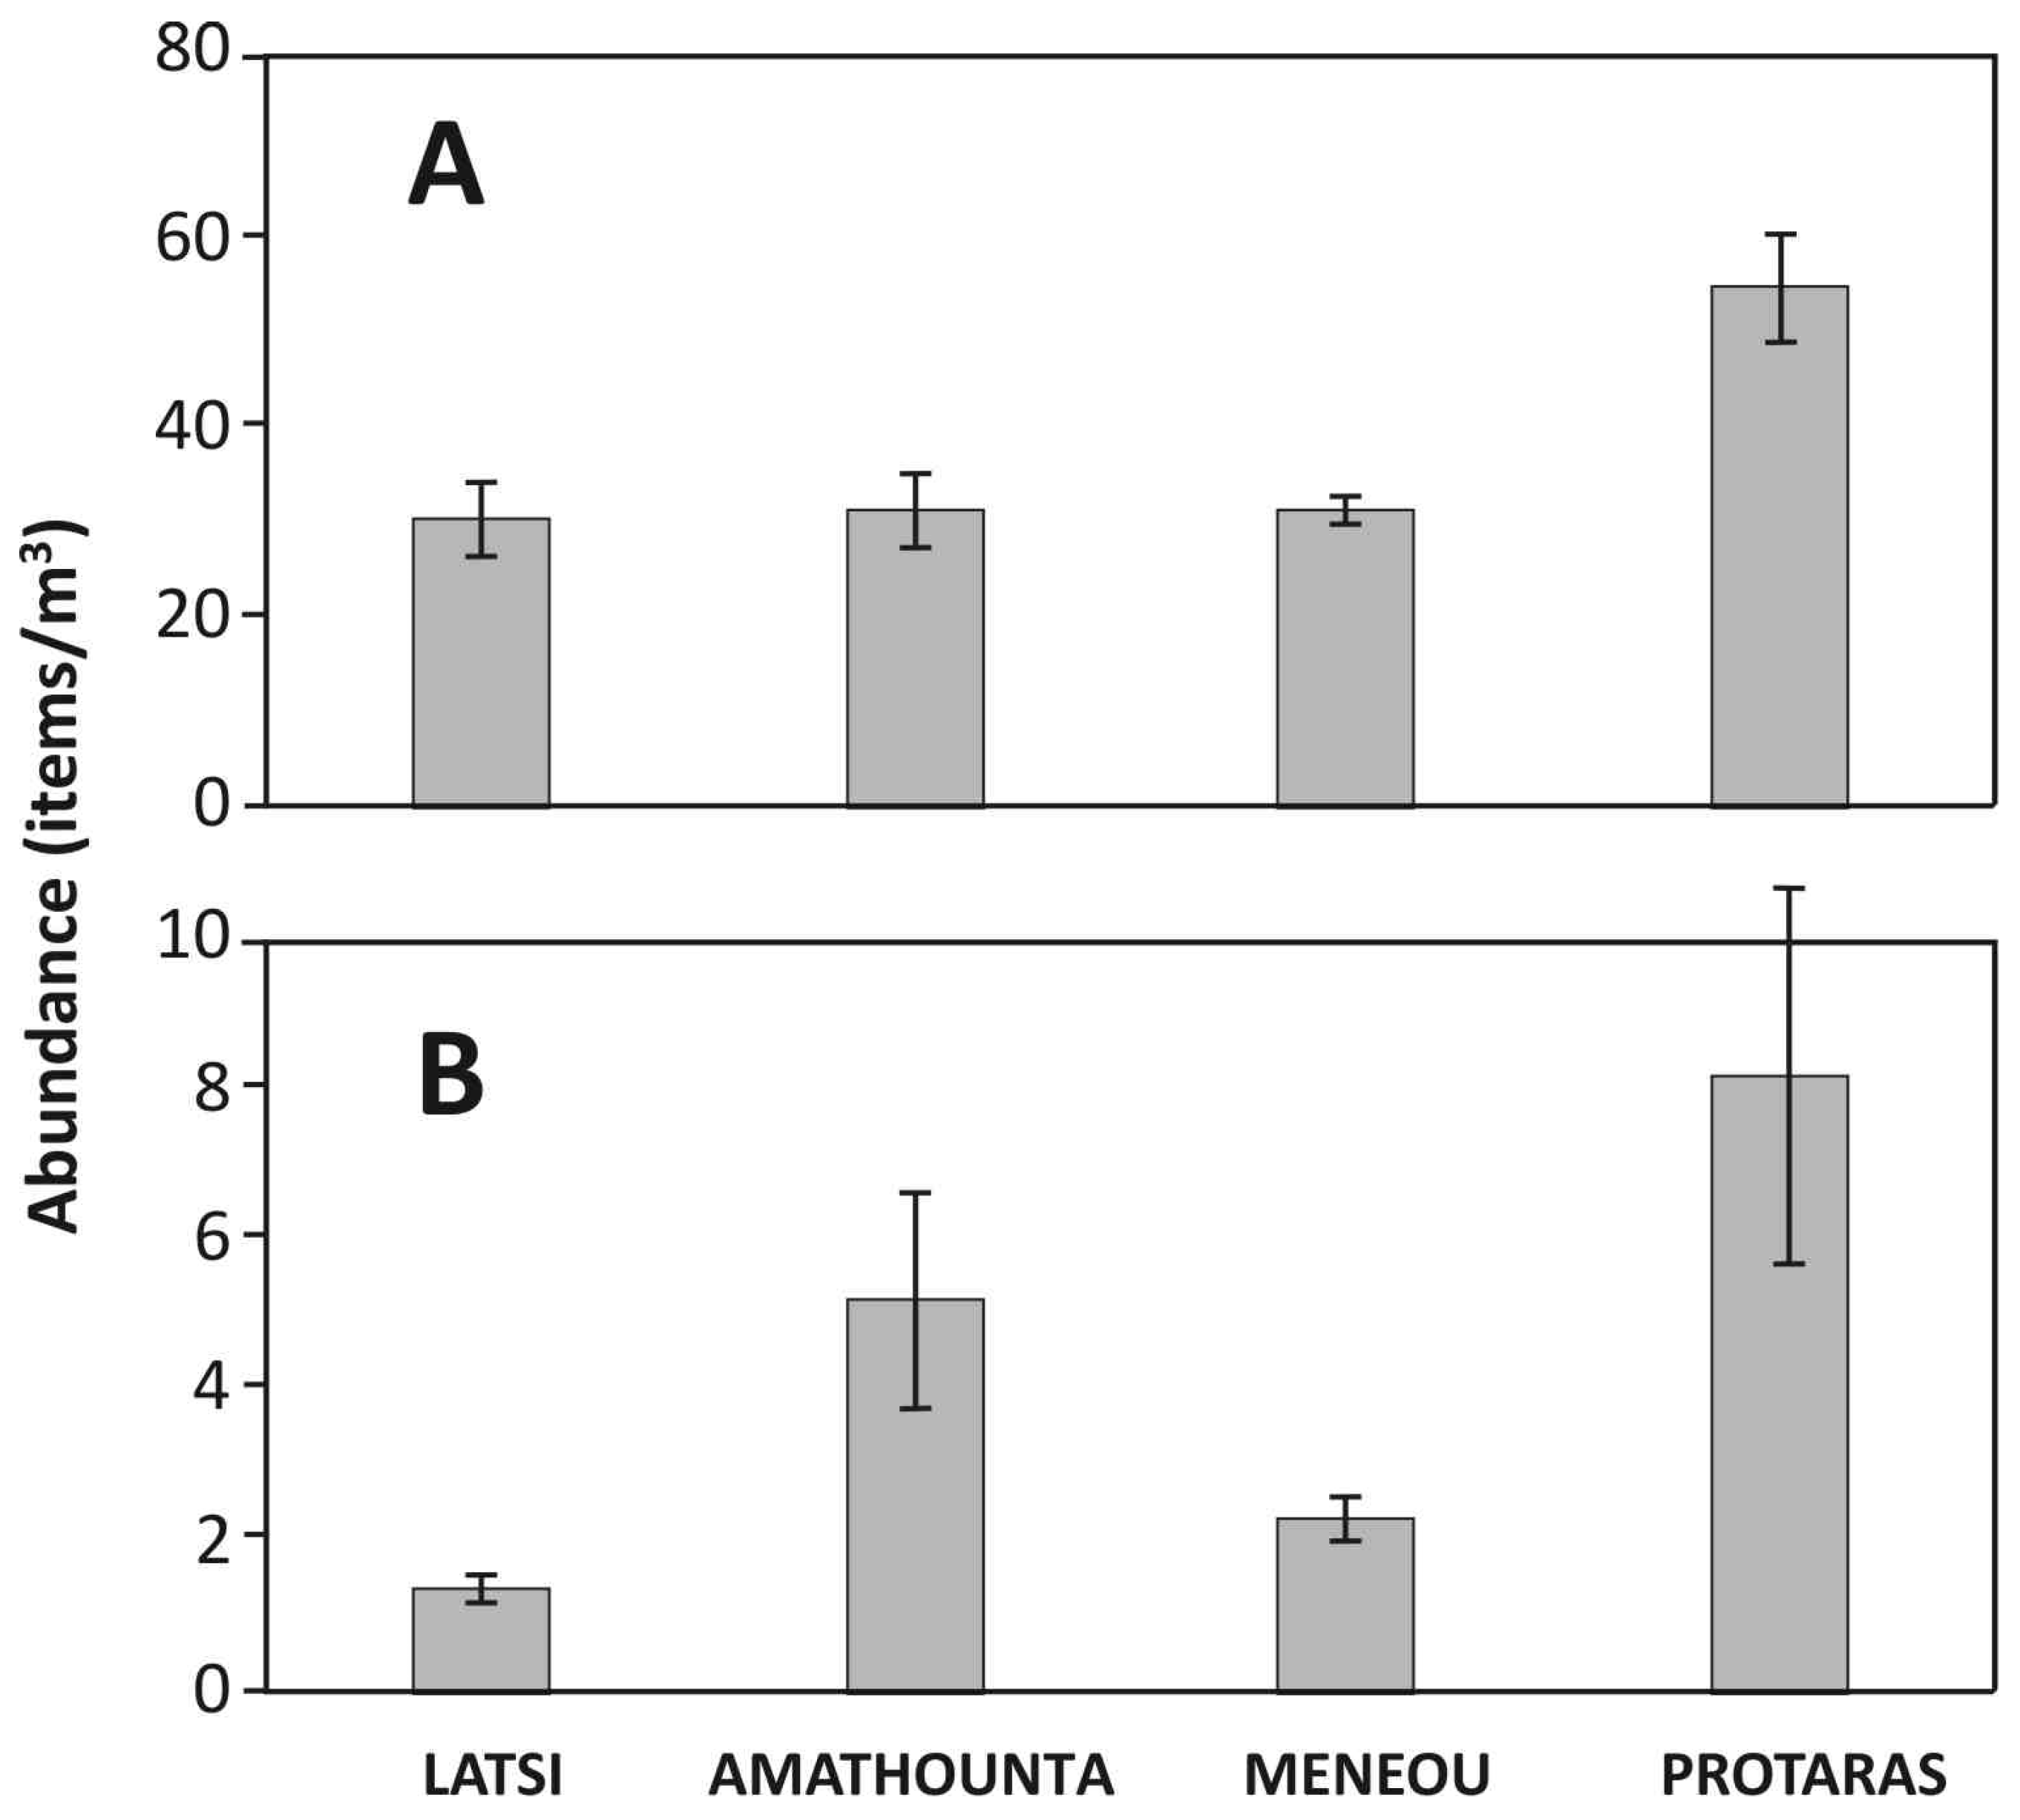
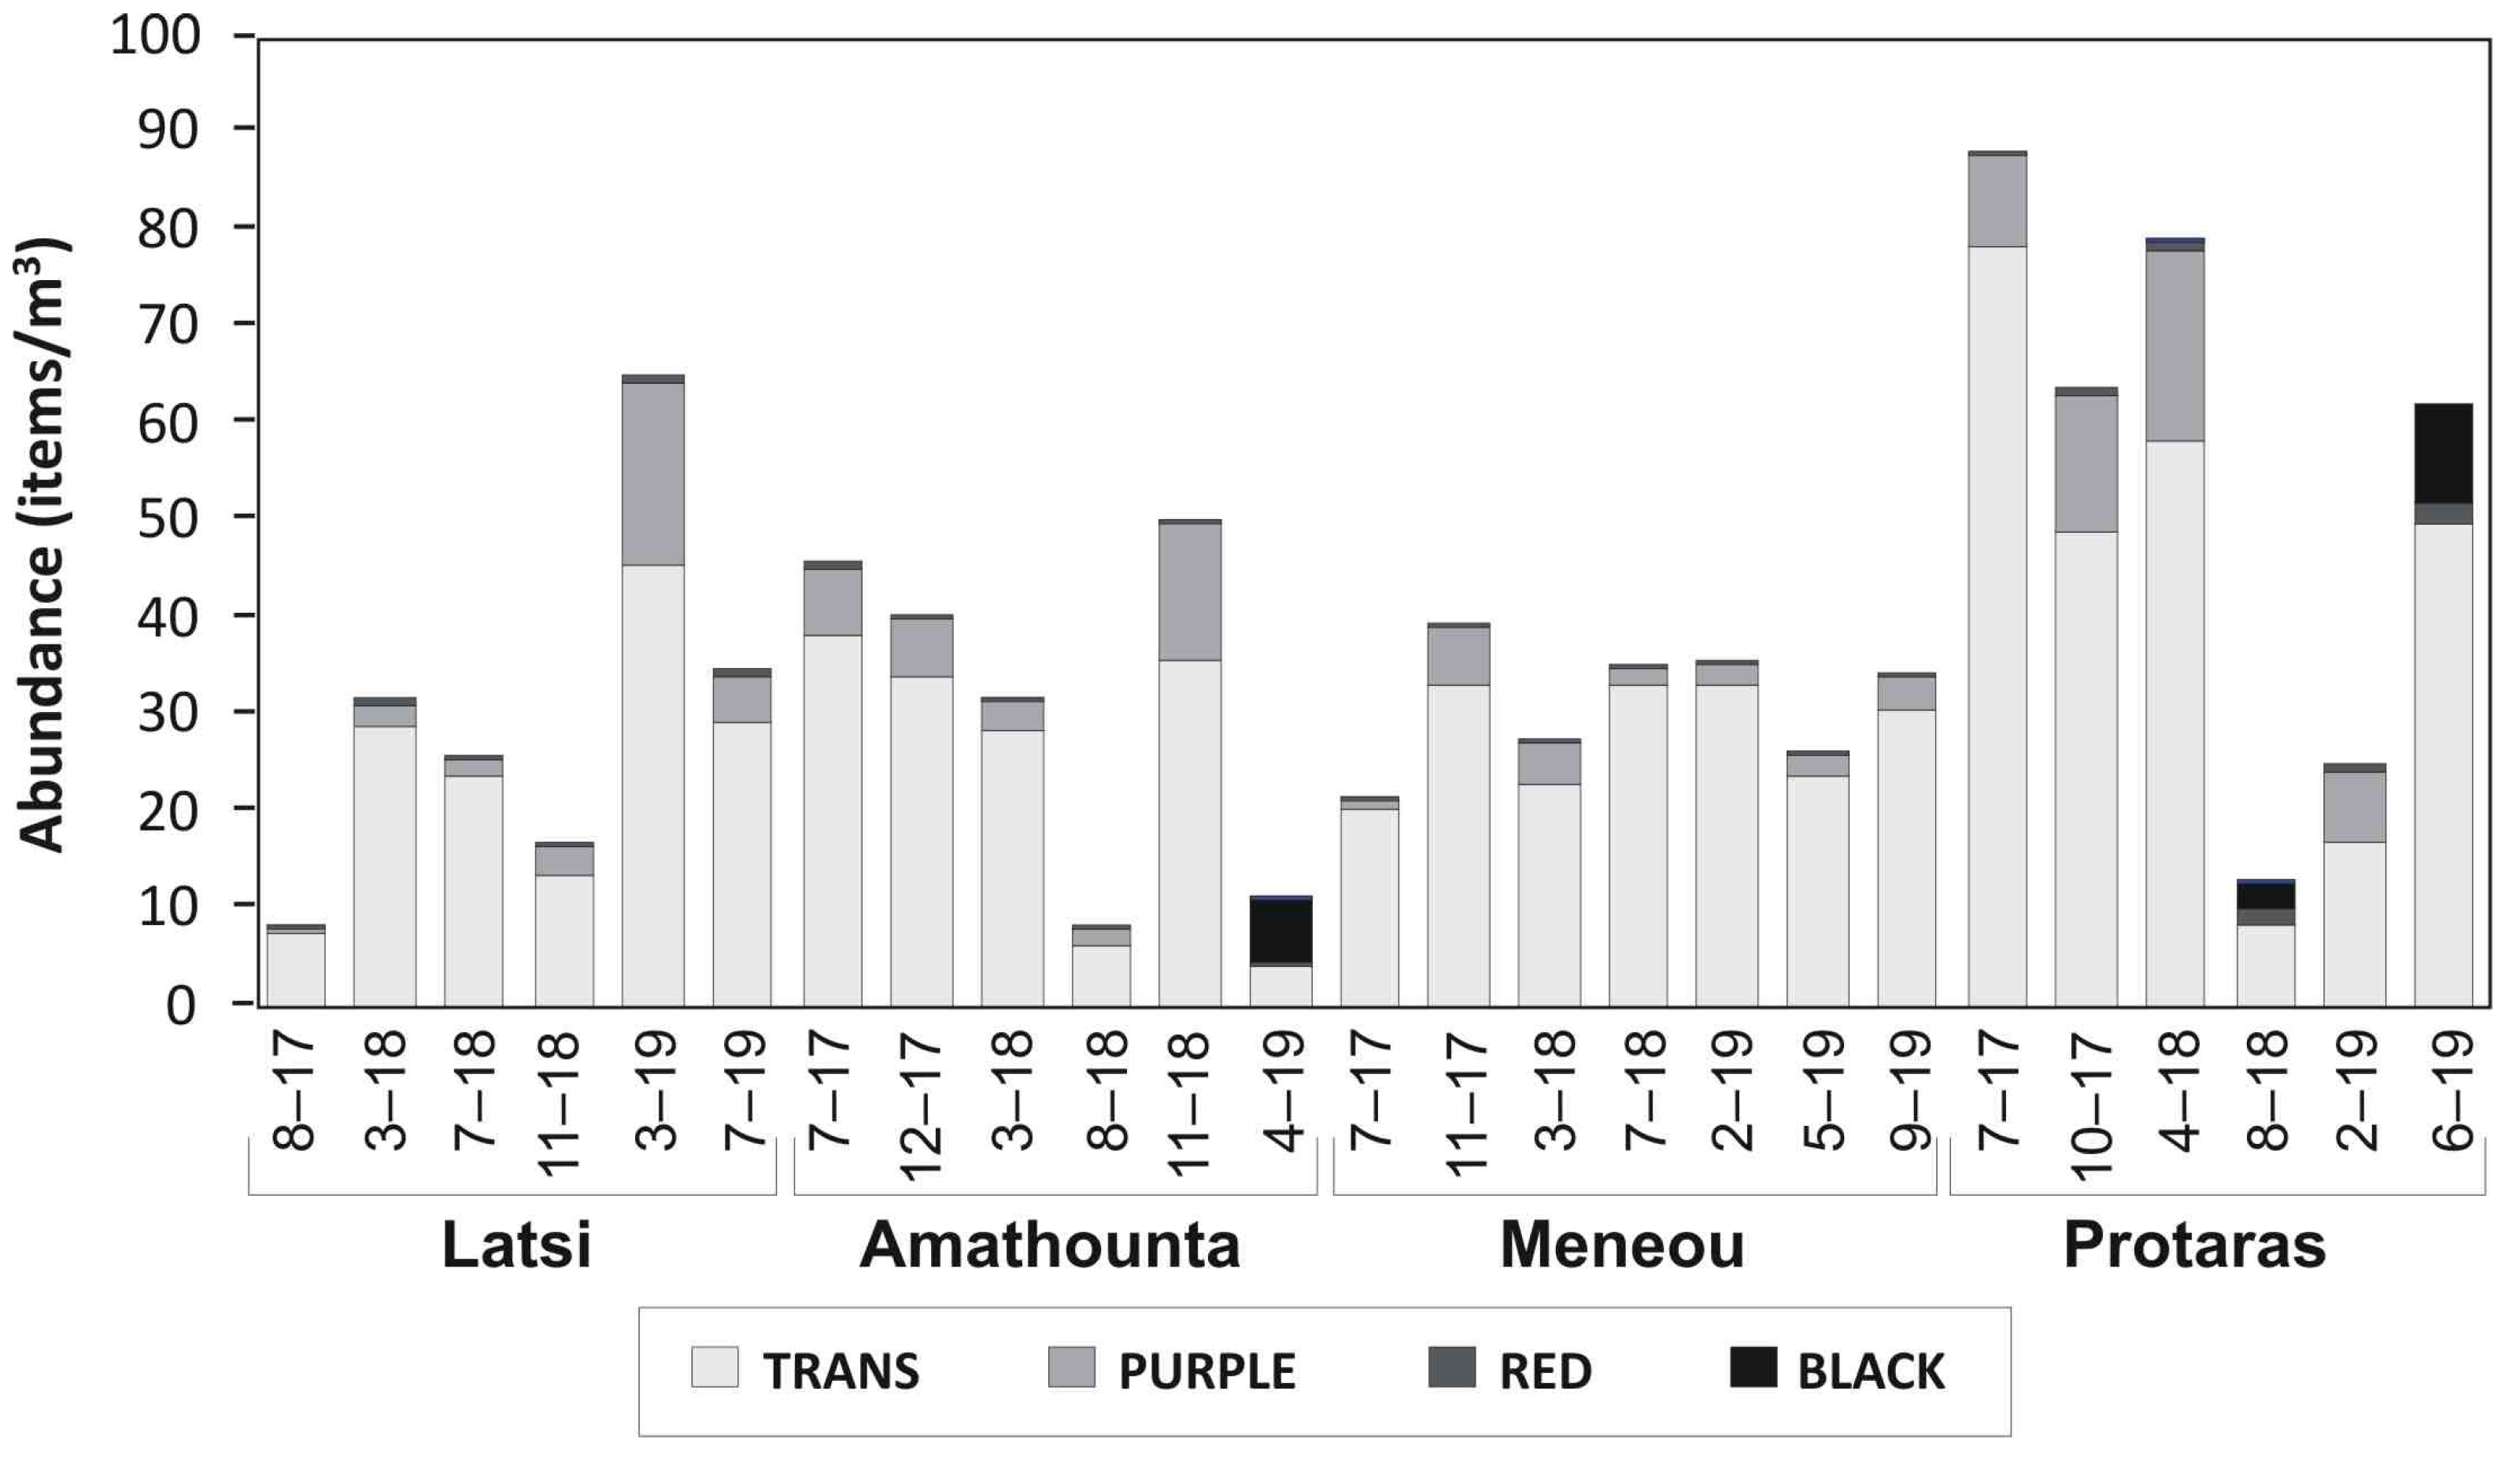
The study was conducted in the coastal area of Cyprus between July 2017 and September 2019 (Supplementary Materials Table S1). Twenty-five zooplankton samples were collected by the Department of Fisheries and Marine Research of the Ministry of Agriculture, Rural Development and the Environment of the Republic of Cyprus, from four stations (Figure 1) corresponding to the areas of Latsi (Station 1), Amathounta (Station 2), Meneou (Station 3) and Protaras (Station 4). The samples were collected as part of the implementation of the Marine Strategy Framework Directive (2008/56/EC). The samples were collected by using a WP-2 (57 cm in diameter, mesh size 200 μm), conducting vertical hauls from 50 m to the surface. A flowmeter was used to calculate the volume of filtered water. The net was thoroughly washed before each sampling in order to remove any possible contamination. After each haul, the zooplankton samples were kept in clean 250 mL plastic jars and preserved in 4% borax buffered formaldehyde.
In the laboratory, each sample was washed through a small conical net (50 μm mesh size) to remove the formaldehyde. This small net was made by folding a square piece of gauze, which was thoroughly rinsed with tap water each time. All samples were examined in glass Petri dishes, under an inverted Leica DMIL microscope (Leica Microsystems, Wetzlar, Germany) and an Optika SLX-3 stereoscope (OPTIKA ITALY, Ponteranica-BG, Italy), by two different researchers, to reduce operator bias during sorting. Photos were taken by using a microscope eyepiece camera Optika CB-5 (OPTIKA ITALY, Ponteranica-BG, Italy) for most microplastic fragments. For each fragment found in the samples, the length and width were measured, using the micrometric scale of the microscope, while, in the case of the fibers, only the length was measured. All the plastic particles were carefully hand-picked, using laboratory tweezers, and transferred to glass jars. The particles were then counted and classified according to their shape and color. All the data were normalized to the total volume filtered and expressed as items per cubic meter (n/m3).
The contamination risks were avoided as far as possible during the sample preparation by cleaning all the materials used for collecting and sorting samples and measuring microplastics (i.e., glass plates and steel needles and forceps) and by working in controlled conditions, while wearing cotton lab coats and nitrile gloves. Samples were kept covered, except during microscopic investigation.
The classification of microplastics by size, shape and colour was performed according to Doyle et al. (2011) [24] and Hidalgo-Ruz et al. (2012) [25]. The fibers were separated according to their color and length, while, for the fragments, six different morphotypes were recognized and recorded as follows (Figure 2): (1) ‘hard rounded’ (HR) = fragments having irregular rounded shape, with smooth or rough surface (Figure 2a); (2) ‘soft rounded’ (SR) = fragments having soft and flexible or sponge-like shape (Figure 2b); (3) ‘hard flattened’ (HF) = fragments having flat and hard surface with their thickness being proportionally too small (Figure 2c); (4) ‘soft flattened’ (SF) = fragments having flat but soft surface with their thickness being proportionally too small (Figure 2d); (5) ‘membrane like’ (ML) = fragments had a flat and too-slender shape, so light may penetrate them (Figure 2e); and (6) ‘cable like’ (CL) = fragments having cable-like shape with much greater length than width, with soft or hard surface being either smooth or rough (Figure 2f).
Due to the difficulty of discriminating the transparent plastic fibers from other fiber-like organic material, specific needles with a curved top were used to exercise pressure in the middle of the fiber. If a permanent deformation was noticed in the pressing spot, the fiber was considered synthetic and counted [26]. Accordingly, in cases of doubt for some fragments, a needle with a candescent top was used to perform a melting test; particles that melted when heated by touching were considered plastics [6].
In the same samples, the zooplankton samples were analyzed by following the standard protocol of HELCOM Programme [27]. Results of the analysis of the zooplankton organisms are not presented here. However, since the microplastics were recovered together with the zooplankton organisms for which the sampling was intended, it would be interesting to explore the relation of the microplastics abundance with the respective abundance of the total zooplankton, as well as the major groups. Data on the microplastics abundance were analyzed by non-parametric statistics applying the Kruskal–Wallis test for comparisons between sampling sites, seasons and years. Pearson correlation analysis between the abundance of the total zooplankton and the total number of fibers and fragments was applied. Pearson correlation analysis was also applied to establish a possible relation between microplastics and zooplankton. All the analyses were performed with IBM SPSS 25, and the significance level was set at 95% (p = 0.05).

3. Results

The analysis of 25 zooplankton samples from four coastal areas of Cyprus revealed the presence of microplastics in all the samples, mainly composed by fibers and, to a lesser extent, fragments (Figure 3). The fibers outnumbered reaching a total number of 11,582 and an average abundance of 37.13 items/m3 (Standard Deviation = ±21.33 items/m3). On the contrary, 1124 fragments were found with an average abundance of 4.19 ± 7.29 items/m3. Due to these differences, the results about the fibers and the fragments are presented separately.

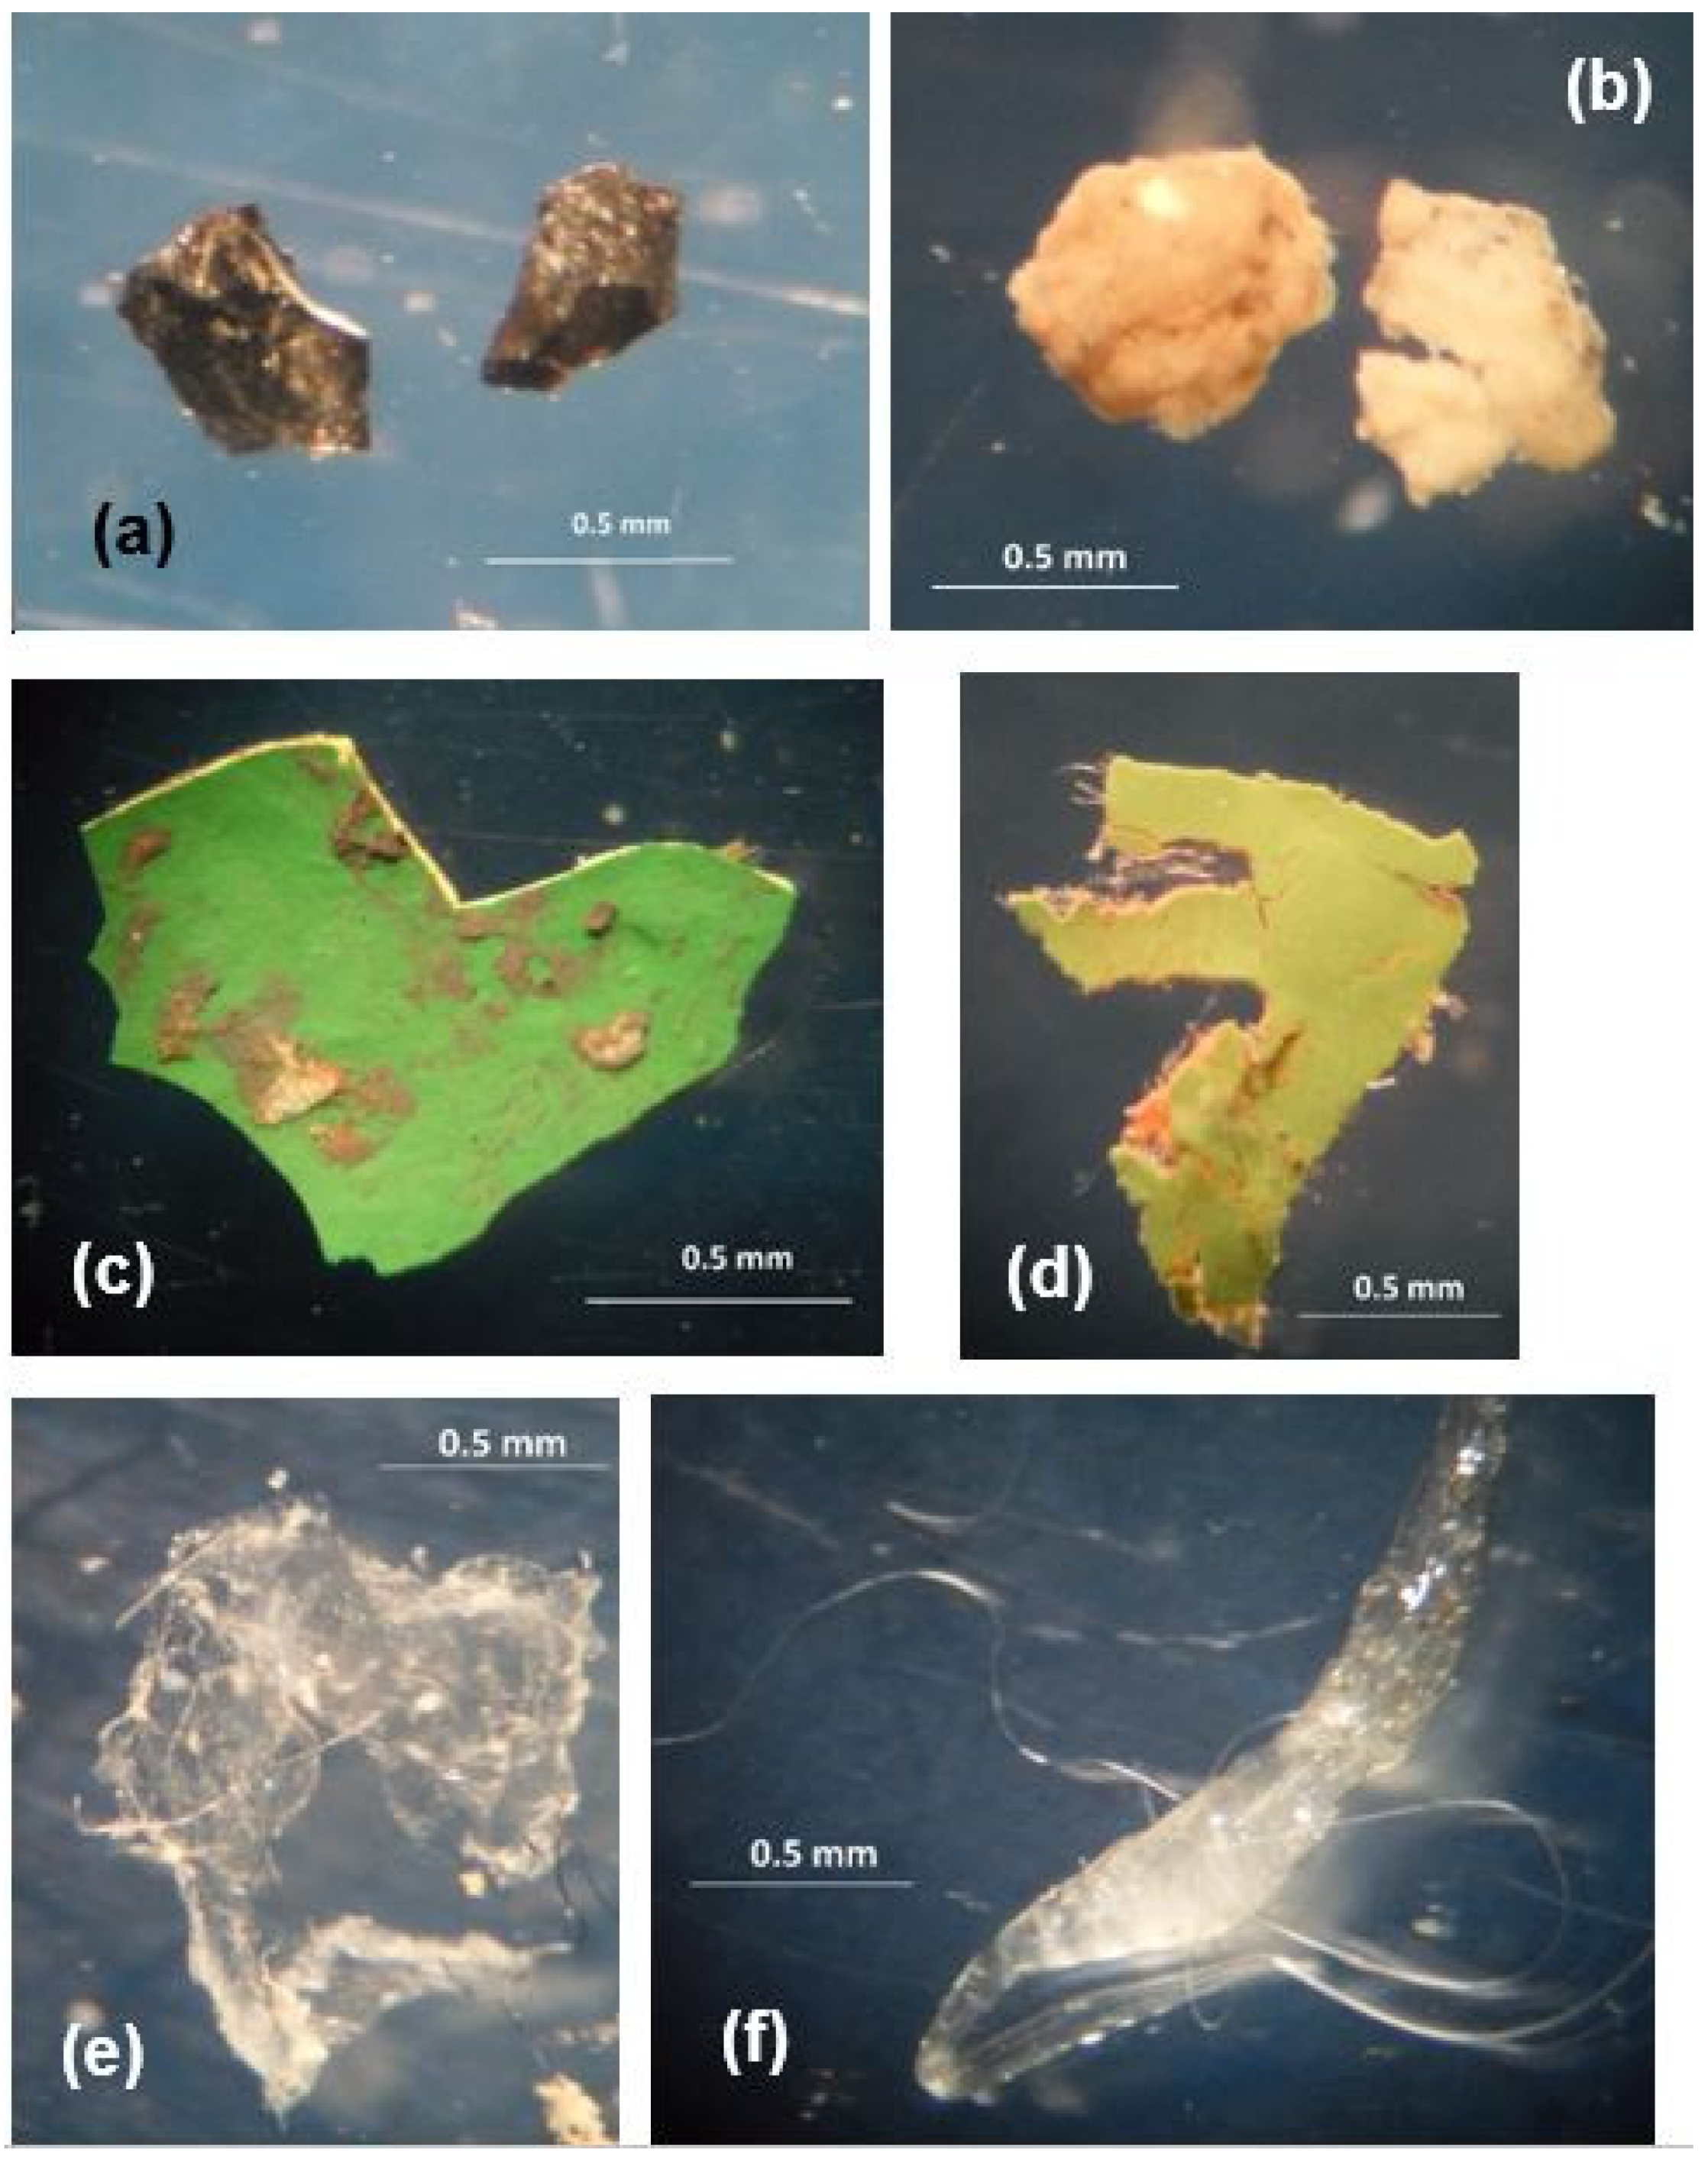
3.1. Microplastic Fibers

The fibers were found in various sizes and colors. The transparent fibers dominated in all the samples accounting for 81.64%, with their percentage ranging from 36.1% to 93.4% (Figure 4). Among the other colors, the purple fibers accounted for 13.93% and followed by black (2.70%) and red (1.68%). Moreover, five blue and one green fiber were found. Most of the fibers were small-sized, having a length up to 1 mm, and accounted for 51.34% of the total number of fibers, with the size class of ≤0.5 mm accounting for 20.80% of the total number (Figure 5). In addition, 87.54% of the overall fibers was shorter than 2 mm.
The maximum abundance of fibers was recovered in Protaras (St. 4) in July 2017 (88.5 items/m3, while the minimum in Amathounta (St. 2) in August 2018 (8.4 items/m3). There were no statistically significant differences in the abundance of the total number of fibers among the four sampling locations, neither among the three years or the four seasons (Kruskal–Wallis test, p > 0.05).

3.2. Microplastic Fragments

The microplastic fragments recovered from the 25 zooplankton samples varied in shape, color and dimensions. Most of them had the ‘hard rounded’ (HR) morphotype (53.38%), followed by the ‘hard flattened’ (HF) morphotype (27.85%). The others, namely the ‘membrane like’ (ML), the ‘soft rounded’(SR), the ‘cable like’ (CL) and the ‘soft flattened’ (SF) fragments, accounted for 6.32%. 5.16%, 4.20% and 3.20%, respectively (Table 1). The abundance (n/m3) of the fragments varied among the 25 samples taken in different months and years in the four sampling sites. No statistically significant difference was found among the abundance of microplastic fragments among the four sampling sites and years (Kruskal–Wallis test, p > 0.05). However, statistically significant difference was found among the four seasons, and specifically, in the winter samples, the fragments were present in higher abundances than the other three seasons. These differences were observed for the total fragments, but also for the HR morphotype (Kruskal–Wallis test, p = 0.032 and p = 0.038, respectively)
Utilizing the measurements of the fragments’ dimensions, we estimated their area in mm2, and it is presented for all the sampling occasions (Figure 6). The results showed that the area of the fragments varied considerably between 0.02 and 9.6 mm2. Almost one-quarter of them were in the smallest category of 0.02 mm2, while a proportion of 62.3% were in the size class of ≤0.05 mm2 (Figure 7). Generally, only a few fragments were large enough to be distinguished with bare eye. The color that prevailed among the fragments was the transparent (32.83% in total), followed by the black (22.15%), the white (18.15%) and the yellow (10.68%), while all the remaining colors (blue, red, orange, green, brown and silver) accounted for 16.19% (Figure 8).

3.3. Correlation with the Zooplankton

The ratio of plastic abundance to zooplankton abundance varied between 0.021 and 0.241 and accounted on average for 0.088 ± 0.130. There were no statistically significant differences of this ratio among the four sampling locations, neither among the three years or the four seasons (Kruskal–Wallis test, p > 0.05). Pearson correlation analysis between the abundance of the total zooplankton and the total number of fibers and fragments (Figure 9A) proved positive and significant (r2 = 0.350, p = 0.002), while when only the total copepods were considered (Figure 9B), the correlation decreases (r2 = 0.323, p = 0.003). When the same correlations were performed using only the fibers (Figure 9C,D), there was no actual distinction (r2 = 0.349, p = 0.002 and r2 = 0.351, p = 0.001, respectively). However, when only the results from the Latsi area were considered (Figure 9E,F), there was a powerful positive correlation in the interrelation of the total fibers with both the total zooplankton and the total copepods (r2 = 0.923, p = 0.001 and r2 = 0.955, p = 0.001, respectively). Moreover, this correlation remained almost identical when only the transparent fibers and the total copepods were considered (r2 = 0.953, p = 0.001), while it was reduced in the case of the total zooplankton (r2 = 0.851, p = 0.009).

4. Discussion

Most studies concerning the abundance of microplastics in the world’s oceans relied on horizontal samplings in the surface layer to provide information about the floating objects [1]; however, there is a need to investigate their distribution in the water column. In the Mediterranean, there are only four studies concerning microplastic’s abundance in the water column, with three of them conducted in the western basin [28,29,30]. Only the report of Güven et al. (2017) [15] accounted for the Eastern Mediterranean (Turkish Coasts). In all these studies, the same field methodology in the collection of the zooplankton samples was applied (e.g., WP-2 net, with the same size and porosity, conducting vertical tows); thus, direct comparisons can be made. In contrast to the present study, Baini et al. (2018) [28] reported that plastic debris was present in 37% out of total water column samples, with a total number of 21 items isolated, having a mean abundance of 0.16 ± 0.47 items/m3. Fossi et al. (2012) [29] reported the presence of microplastics in 13 out of 23 surface samples, while they did not find any microplastic item in the water column samples. Lefebvre et al. (2019) [30] found microplastics in all the water column samples, with an average concentration of 3.08 ± 3.04 items/m3. On the other hand, Güven et al. (2017) [15] reported numerical data concerning the microplastics abundance from only the surface samples. This means that the present results are the first estimates of the abundance of microplastics in samples collected vertically from 0 to 50 m depth in the Eastern Mediterranean. The present abundance estimates for the microplastic pollution are at least ten times larger than the highest values reported in the three reports of Fossi et al. (2012) [29], Baini et al. (2018) [28] and Lefebvre et al. (2019) [30]. Moreover, microplastics were found in all the samples of the present study, thus pointing out their continuous presence in the coastal waters of Cyprus. Although such high differences across regions could be explained by (i) differences in methodology to identify microplastics (e.g., polymer analysis); (ii) oceanographic processes, such as local currents or winds; and (iii) sociogeographical factors, such as coastal geography, coastal population, and distance from plastic source input [31], the present report reveals that the Eastern Mediterranean seems to be, by far, the most polluted area of the entire basin. The porosity of the nets used in the sampling of microplastics seems to play a crucial role on the estimates of their abundance in the water. Most studies of microplastic abundance are based on hauls with a mesh porosity of around 300 μm [32]; however, there is evidence of underestimation [6,22,33]. Thus, when a net with thinner mesh size (e.g., 90 μm instead of 300 μm) was used, microplastic abundance was nearly ten-fold higher [6]. This means that the actual abundance of microplastics in the water may be greater.
Despite the large number of studies on the distribution of microplastics worldwide, there is lack of a comprehensive understanding of their concentrations, cycling and fate in the vertical axis of the marine environment, constraining our ability to implement effective large-scale policy and conservation strategies. The sampling of the whole water column provides more accurate information about the real density of the microplastics than surface samplings; however, all microplastics, theoretically, could result from their presence at and close to the surface. Despite the existence of a few studies in which microplastics have been sampled and identified from subsurface depths [1], none of these studies conducted sampling at constant depth intervals (e.g., at 10 m depth) to provide a real image of the vertical distribution of microplastics. This is the correct way to identify accumulations of microplastic particles in different strata of the water column, in order to evaluate their implications in the marine ecosystem, and this should be considered in future investigation plans.
Among the factors that complicate comparisons between studies is the difficulty in the identification and verification of the plastic status of the fragments and especially the transparent fibers that resemble biological structures. The chemical composition of the microplastic polymers is usually confirmed with Raman spectroscopy or Fourier Transform Infrared Microscopes [3], which were not available in the present study. Instead, simple techniques were applied, such as testing the plastic status of the fibers by pressing each fiber with a fine needle to see whether there is a permanent deformation, or the use of a needle with candescent top to see whether particles are melted when heated by touching [6,26]. These applications were time-consuming processes and, in most of the cases, required the use of high magnification (×100) in the inverted microscope. Given a potentially great number of transparent fibers in the samples and that spectral analysis of all of them faces time issues and budgetary constraints, this simple technique may be established for future investigations.
The fibers made most of the total microplastics found in the samples being an order of magnitude more abundant than the fragments. Considering similar studies in the Mediterranean, Güven et al. (2017) [15] found 70% of the ingested microplastics by fish to be fibers. Moreover, Lefebvre et al. (2019) [30] reported that most of the debris and absolutely all microplastics isolated from the water samples were observed under the shape of fibers. Microfibers represent the dominant fraction of microplastic pollution in the marine environment, contribute the largest portion of anthropogenic microparticle pollution in the ocean and the most ingested type of anthropogenic particle by marine organisms [34]. After ingestion, fibers can cause blockages in the digestive tract and undergo accumulation within the organisms [20], but also, they act as a vector for several dangerous components, being able to release them into the environment or the organisms [35,36]. Textile fibers, including common polymers, such as polyester, polyamide and acrylic, have a higher density than that of seawater, which results to a greater participation than the fragments in the deeper strata [37]. Generally, fibers are likely underestimated, because they are also classified among aggregates, while they are not systematically considered as microplastics and are sometimes excluded from datasets, as they may come from air contamination [38]. Lefebvre et al. (2019) [30] highlighted the need for a particular attention to fiber-shaped microplastics due to their ubiquity in aquatic environments and re-current ingestion.
The size of the microplastics is a highly important parameter because it can affect their ingestion by filter feeders or even predators from different trophic levels. The present results showed that, in the coastal area of Cyprus, most of the microplastic fibers were smaller than 1 mm, while most of the fragments had an area of less than 0.05 mm2, being usually smaller than 0.3 mm2. In contrast to this study, Baini et al. (2018) [28] found that the most abundant size class of microplastics in surface samples was 1–2.5 mm, while the items with sizes below 0.5 mm represented the minor portion of the total microplastics and claimed that this dimensional pattern has also been previously observed in studies conducted in the Mediterranean Sea and in other ocean basins [28]. It seems then that, in deeper strata, the average size of the microplastics is smaller. This can be explained by considering that the smaller the microplastic, the bigger its area in which biofouling may occur, which is a process that elevates the density of the particle [24]. Thus, considering that microplastics are differentially distributed in water columns, sampling should be performed both at the surface and column midwater, also because the presence of organisms that may potentially ingest microplastics are not restricted only to the surface [22].
The color of microplastics is another parameter which may act as a cue to the organisms that may mistake the microplastics for their prey. In the present investigation, the transparent hue dominated in the microplastic debris mainly in fibers rather than the fragments. Van der Hal et al. (2017) [17] reported that light-colored (white or transparent) fragments were, by far, more abundant than all other microplastic colors and types in the coasts of Israel. On the other hand, Güven et al. (2017) [15], from the southern coasts of Turkey, found the blue color to be the most frequent in the case of fibers (50.5%) and the fragments (56.4%), but also in the stomach content of fishes. In other studies, outside the Mediterranean, the most common colors were blue and white [22,39,40]. According to Ory et al. (2017) [41], a positive selection of blue microplastics for ingestion has been found for fish. However, information on color preference, especially among invertebrates, remains uncertain and requires a closer attention. It is expected also that the colors of the microplastics that prevail, as well as their composition, may reflect to their sources of origin. However, the apparent dominance of the transparent fibers in the present study is not supported by similar findings. Taking in mind that most of these transparent fibers were also very small in size (<0.5 mm), which makes their identification hard, along with the difficulty in the verification of their plastic origin, it seems probable that the transparent fibers of this size are underestimated, or even missed from counting in most studies. This, along with indifference about the fibers in the microplastic samples by several studies, may pose a serious issue about the actual abundance of these particles in the marine ecosystems.
While no spatial and temporal differences were found concerning the abundance of the fibers, the fragments were more abundant in the winter samples. Factors influencing the accumulation of plastic and microplastic items can be related to the distance from input sources (e.g., rivers, wastewater-treatment plants and urban sewage), as well as the distance to the coast [42,43]. The distance from the coast was more or less similar for all sampling stations; however, the area investigated is characterized by a variety of anthropogenic pressures. On the southern coasts of Cyprus, there are two main possible pollution sources. The city of Limassol, hosting the largest commercial port of the country, and the city of Larnaka are inhabited by 240,000 and 145,000 residents, respectively. The climatic conditions of Cyprus have a considerably stable periodicity as far as the seasonal rainfall is concerned; the period from late autumn to early spring is the most wet. Thus, higher runoff from streams and torrents is expected in winter, which may explain a greater outflow of microplastic debris to the sea. Particularly as the winter samples are concerned, it must be pointed that the two of the three were taken in the winter of 2019, which was one of the rainiest years in the recent history of the island. It is suggested, then, that in certain cases, the land weather conditions may be able to alter the amount of microplastics entering the oceans [44]. In this case, the microplastic outflow in the Mediterranean, as well as in the world’s oceans, must be correlated with global climate change phenomena.
The ratio of microplastics to zooplankton abundance in the present study fluctuated between 0.021 and 0.241. This comparison of the microplastic to zooplankton abundance in depths other than the surface may be considered the first in the Mediterranean, while only a few similar reports around the world existed. The present values are in the same range with the reports of Frias et al. (2014) [23] for the Portuguese Coasts; however, the investigators conducted surface sampling, and they did not find any fibers. Collignon et al. (2014) [7] reported ratios between 0.002 and 2.63 in respect to size of the microplastics from surface samples collected in the Bay of Calvi (Western Mediterranean). Lattin et al. (2004) [45], in California, found ratio values less than 0.2 in mid-depth samples, while Moore et al. (2001) [46] found the ratio to be nearly 0.2 in surface samples from the North Pacific Central Gyre.
This study may be the first to correlate the abundance of zooplankton with microplastics in the vertical axis; thus, comparable data do not exist. The results showed a significant correlation between the total microplastics (fibers and fragments) with the total zooplankton, as well as with the copepods, being the dominant group (unpublished data). Further inspection showed that this correlation was ought to the very solid correlation of the fibers with the zooplankton in the Latsi area. It is interesting to point that the data from this area came from different years and seasons. Although it is difficult to interpret these findings, it is suggested that this interrelation may be owed to the particular hydrodynamic of the area. The presence of anticyclonic gyres, isolated eddies and the combined effect induced by wind and water currents may create unstable plastic retention areas affecting the sampling activities [28]. Water circulation around Cyprus is complex and influenced by permanent, transient and recurrent circulation features. According to Hannides et al. (2015) [47], the mesozooplankton along the southern coasts of Cyprus (Amathounta, Meneou and Protaras) is primarily influenced by the eastward branch of the Mid-Mediterranean Jet, as well as by eddies and local current systems that form south of the island. In contrast, along the northwest coast of Cyprus (Latsi), the mesozooplankton is influenced by the westward-moving Asia Minor Current and associated local flow phenomena [48]. Unfortunately, except for surface measurements of temperature, salinity, pH and dissolved oxygen, no vertical profiles of environmental parameters were taken in the sampling locations to provide a solid basis about the hydrodynamics of the studied areas.

5. Conclusions

The present investigation is the first to provide data on the microplastics abundance in the entire 0–50 m depth layer, being the most productive in the Eastern Mediterranean; however, the lack of vertically stratified samples does not allow any statement on the vertical distribution of microplastics in this layer. The results show that, in comparison with the western basin, the Eastern Mediterranean seems to be much more polluted with microplastic debris, especially in the form of fibers. However, these comparisons may be taken with caution since these differences may be owed to the lack of standardization on the methods for the estimation of microplastics. On the other hand, the present investigation highlights the use of zooplanktonic samples collected from the water column and not only from the surface. Among the elements to support this are the following: (i) the evidence that the microplastics can distribute in large quantities not only on the surface, but they can sink in various depths; (ii) using the same samples one can conduct direct comparisons with the biotic components that might be affected by the microplastics; (iii) since the typical collection of vertical zooplankton samples is usually combined with vertical profiles of hydrological parameters, this can assist in the understanding of the spatial distribution of microplastics; and (iv) for logistic reasons, as the field excursions in the marine environment are considered rather expensive. For all of these reasons, a uniform sampling protocol according to which vertically stratified samples are collected by using the same apparatus (closing plankton nets) as for the zooplankton samples should be considered in the future.

Supplementary Materials

The following are available online at https://www.mdpi.com/article/10.3390/w13162272/s1. Supplement material: Raw data. Table S1: The abundance (items/m3) of the six morphotypes of microplastic fragments recovered from each of the 25 samples taken in Latsi, Amathounta, Meneou and Protaras areas during 2017–2019. HR: ‘hard rounded’, SR: ‘soft rounded’, HF: ‘hard flattened’, SF: ‘soft flattened’, ML: ‘membrane like’, CL: ‘cable like’. Table S2: The size class distribution of the microplastic fragments recovered from each of the 25 samples taken in Latsi, Amathounta, Meneou and Protaras areas during 2017–2019. The numbers of microplastic items are given. Table S3: The calculated area (as mm2) of the total number of microplastic fragments found in each of the 25 samples in the four sampling areas (Latsi, Amathounta, Meneou and Protaras) during the years 2017–2019. Table S4: The abundance (items/m3) of the different colors of microplastic fibers recovered from each of the 25 samples taken in Latsi, Amathounta, Meneou and Protaras areas during 2017–2019. Table S5: The size class distribution of the microplastic fibers recovered from each of the 25 samples taken in Latsi, Amathounta, Meneou and Protaras areas during 2017–2019. The numbers of microplastic items are given.

Author Contributions

Investigation, G.V.; data curation, G.V.; writing, G.V., D.K., P.K., V.T., A.Z., K.A., M.R., V.P., P.P. and G.T.; original draft preparation, G.V.; conceptualization, G.K.; supervision, G.K.; review and editing, G.K., D.K., P.K., V.T., A.Z., K.A., M.R., V.P., P.P. and G.T.; data curation, D.K. and P.K.; methodology, V.T. and A.Z.; sampling, K.A. and M.R. All authors have read and agreed to the published version of the manuscript.

Funding

This research was funded by the Ministry of Agriculture, Rural Development and Environment of Cyprus, Water Development Department, grant number ΥΥ 01/2018. The samples were collected by the Department of Fisheries and Marine Research (DFMR) as part of the implementation of the Marine Strategy Framework Directive (MSFD) 2008/56/EC.

Institutional Review Board Statement

Not applicable.

Informed Consent Statement

Not applicable.

Data Availability Statement

The data presented in this study are openly available as Supplementary Materials, in the form of a PDF document (Vasilopoulou et al. 2021—Supplementary material.pdf).

Acknowledgments

We would like to thank DFMR staff for the sample collection.

Conflicts of Interest

The authors declare no conflict of interest. The Water Development Department of the Ministry of Agriculture, Rural Development and Environment of Cyprus had no role in the design of the study. However, members of this Department assisted in the writing, reviewing and editing of the manuscript. The Department of Fisheries and Marine Research (DFMR) had collected the samples used in this investigation and assisted in the writing, reviewing and editing of the manuscript.

References

  1. Choy, C.A.; Robison, B.H.; Gagne, T.O.; Erwin, B.; Firl, E.; Halden, R.U.; Hamilton, J.A.; Katija, K.; Lisin, S.E.; Rolsky, C.; et al. The vertical distribution and biological transport of marine microplastics across the epipelagic and mesopelagic water column. Sci. Rep. 2019, 9, 1–9. [Google Scholar] [CrossRef] [PubMed] [Green Version]
  2. Jambeck, J.R.; Geyer, R.; Wilcox, C.; Siegler, T.R.; Perryman, M.; Andrady, A.; Narayan, R.; Law, K.L. Plastic waste inputs from land into the ocean. Science 2015, 347, 768–771. [Google Scholar] [CrossRef]
  3. Andrady, A.L. Microplastics in the marine environment. Mar. Pollut. Bull. 2011, 62, 1596–1605. [Google Scholar] [CrossRef] [PubMed]
  4. Eriksen, M.; Lebreton, L.C.M.; Carson, H.S.; Thiel, M.; Moore, C.J.; Borerro, J.C.; Galgani, F.; Ryan, P.G.; Reisser, J. Plastic pollution in the world’s oceans: More than 5 trillion plastic pieces weighing over 250,000 tons afloat at sea. PLoS ONE 2014, 9, e111913. [Google Scholar] [CrossRef] [PubMed] [Green Version]
  5. Thompson, R.C.; Moore, C.J.; vom Saal, F.S.; Swan, S.H. Plastics, the environment and human health: Current consensus and future trends. Philos. Trans. R. Soc. 2009, 364, 2153–2166. [Google Scholar] [CrossRef]
  6. Gorokhova, E. Screening for microplastic particles in plankton samples: How to integrate marine litter assessment into existing monitoring programs? Mar. Pollut. Bull. 2015, 99, 271–275. [Google Scholar] [CrossRef]
  7. Collignon, A.; Hecq, J.H.; Galgani, F.; Collard, F.; Goffart, A. Annual variation in neustonic micro- and meso-plastic particles and zooplankton in the Bay of Calvi (Mediterranean-Corsica). Mar. Pollut. Bull. 2014, 79, 293–298. [Google Scholar] [CrossRef] [PubMed] [Green Version]
  8. Liu, K.; Courtene-Jones, W.; Wang, X.; Song, Z.; Wei, N.; Li, D. Elucidating the vertical transport of microplastics in the water column: A review of sampling methodologies and distributions. Water Res. 2020, 186, 116403. [Google Scholar] [CrossRef] [PubMed]
  9. Pedrotti, M.L.; Mazzocchi, M.G.; Lombard, F.; Galgani, F.; Kerros, M.E.; Henry, M.; Elineau, A.; Petit, S.; Fernandez-de-Puelles, M.L.; Gasparini, S.; et al. TARA Mediterranean Expedition: Assessing the impact of microplastics on Mediterranean ecosystem. In Proceedings of the International Conference on Microplastic Pollution in the Mediterranean Sea, Capri, Italy, 26–29 September 2017; Cocca, M., Di Pace, E., Errico, M., Gentile, G., Montarsolo, A., Mossotti, R., Eds.; Springer Water: Cham, Switzerland. [Google Scholar] [CrossRef]
  10. Reisser, J.; Shaw, J.; Wilcox, C.; Hardesty, B.D.; Proietti, M.; Thums, M.; Pattiaratchi, C. Marine plastic pollution in waters around Australia: Characteristics, concentrations, and pathways. PLoS ONE 2013, 8, e80466. [Google Scholar] [CrossRef] [PubMed] [Green Version]
  11. Ryan, P.G. A simple technique for counting marine debris at sea reveals steep litter gradients between the Straits of Malacca and the Bay of Bengal. Mar. Pollut. Bull. 2013, 69, 128–136. [Google Scholar] [CrossRef] [PubMed]
  12. Ruiz-Orejon, L.F.; Sarda, R.; Ramis-Pujol, J. Floating plastic debris in the Central and Western Mediterranean Sea. Mar. Environ. Res. 2016, 120, 136–144. [Google Scholar] [CrossRef] [PubMed]
  13. Suaria, G.; Avio, C.G.; Mineo, A.; Lattin, G.L.; Magaldi, M.G.; Belmonte, G.; Moore, C.J.; Regoli, F.; Aliani, S. The Mediterranean Plastic Soup: Synthetic polymers in Mediterranean surface waters. Sci. Rep. 2016, 6, 37551. [Google Scholar] [CrossRef] [Green Version]
  14. Cozar, A.; Sanz-Martin, M.; Marti, E.; Gonzalez-Gordillo, J.I.; Ubeda, B.; Galvez, J.A.; Irigoien, X.; Duarte, C.M. Plastic accumulation in the Mediterranean Sea. PLoS ONE 2015, 10, e0121762. [Google Scholar] [CrossRef] [Green Version]
  15. Güven, O.; Gökdağ, K.; Jovanović, B.; Kıdeyş, A.E. Microplastic litter composition of the Turkish territorial waters of the Mediterranean Sea, and its occurrence in the gastrointestinal tract of fish. Environ. Pollut. 2017, 223, 286–294. [Google Scholar] [CrossRef]
  16. Gündoğdu, S.; Çevik, C. Micro-and mesoplastics in Northeast Levantine coast of Turkey: The preliminary results from surface samples. Mar. Pollut. Bull. 2017, 118, 341–347. [Google Scholar] [CrossRef]
  17. Van der Hal, N.; Ariel, A.; Angel, D.L. Exceptionally high abundances of microplastics in the oligotrophic Israeli Mediterranean coastal waters. Mar. Pollut. Bull. 2017, 116, 151–155. [Google Scholar] [CrossRef] [PubMed]
  18. Kornilios, S.; Drakopoulos, P.G.; Dounas, C. Pelagic tar, dissolved/dispersed petroleum hydrocarbons and plastic distribution in the Cretan sea, Greece. Mar. Pollut. Bull. 1998, 36, 989–993. [Google Scholar] [CrossRef]
  19. Siokou, I.; Zervoudaki, S.; Velaoras, D.; Theocharis, A.; Christou, E.D.; Protopapa, M.; Pantazi, M. Mesozooplankton vertical patterns along an east-west transect in the oligotrophic Mediterranean Sea during early summer. Deep-Sea Res. Part II 2019, 164, 170–189. [Google Scholar] [CrossRef]
  20. Wright, S.L.; Thompson, R.C.; Galloway, T.S. The physical impacts of microplastics on marine organisms: A review. Environ. Pollut. 2013, 178, 483–492. [Google Scholar] [CrossRef]
  21. Desforges, J.P.W.; Galbraith, M.; Ross, P.S. Ingestion of microplastics by zooplankton in the Northeast Pacific Ocean. Arch. Environ. Contam. Toxicol. 2015, 69, 320–330. [Google Scholar] [CrossRef] [PubMed]
  22. Figueiredo, G.M.; Vianna, T.M.P. Suspended microplastics in a highly polluted bay: Abundance, size, and availability for mesozooplankton. Mar. Pollut. Bull. 2018, 135, 256–265. [Google Scholar] [CrossRef]
  23. Frias, J.P.G.L.; Otero, V.; Sobral, P. Evidence of microplastics in samples of zooplankton from Portuguese coastal waters. Mar. Environ. Res. 2014, 95, 89–95. [Google Scholar] [CrossRef]
  24. Doyle, M.J.; Watson, W.; Bowlin, N.M.; Sheavly, S.B. Plastic particles in coastal pelagic ecosystems of the Northeast Pacific ocean. Mar. Environ. Res. 2011, 71, 41–52. [Google Scholar] [CrossRef] [PubMed]
  25. Hidalgo-Ruz, V.; Gutow, L.; Thompson, R.C.; Thiel, M. Microplastics in the marine environment: A review of the methods used for identification and quantification. Environ. Sci. Technol. 2012, 46, 3060–3075. [Google Scholar] [CrossRef] [PubMed]
  26. Bagaev, A.; Mizyuk, A.; Khatmullina, L.; Isachenko, I.; Chubarenko, I. Anthropogenic fibres in the Baltic Sea water column: Field data, laboratory and numerical testing of their motion. Sci. Total Environ. 2017, 599–600, 560–571. [Google Scholar] [CrossRef] [PubMed]
  27. HELCOM. Manual for Marine Monitoring in the COMBINE Programme of HELCOM. 2017. Available online: http://www.helcom.fi/Documents/Action%20areas/Monitoring%20and%20assessment/Manuals%20and%20Guidelines/Manual%20for%20Marine%20Monitoring%20in%20the%20COMBINE%20Programme%20of%20HELCOM.pdf (accessed on 15 May 2021).
  28. Baini, M.; Fossi, M.C.; Galli, M.; Caliani, I.; Campani, T.; Finoia, M.G.; Panti, C. Abundance and characterization of microplastics in the coastal waters of Tuscany (Italy): The application of the MSFD monitoring protocol in the Mediterranean Sea. Mar. Pollut. Bull. 2018, 133, 543–552. [Google Scholar] [CrossRef]
  29. Fossi, M.C.; Panti, C.; Guerranti, C.; Coppola, D.; Giannetti, M.; Marsili, L.; Panti, C.; de Sabata, E.; Clò, S. Are baleen whales exposed to the threat of microplastics? A case study of the Mediterranean fin whale (Balaenoptera physalus). Mar. Pollut. Bull. 2012, 64, 2374–2379. [Google Scholar] [CrossRef] [PubMed]
  30. Lefebvre, C.; Saraux, C.; Heitz, O.; Nowaczyk, A.; Bonnet, D. Microplastics FTIR characterisation and distribution in the water column and digestive tracts of small pelagic fish in the Gulf of Lions. Mar. Pollut. Bull. 2019, 142, 510–519. [Google Scholar] [CrossRef] [PubMed]
  31. Barnes, D.K.A.; Galgani, F.; Thompson, R.C.; Barlaz, M. Accumulation and fragmentation of plastic debris in global environments. Philos. Trans. R. Soc. 2009, 364, 1985–1998. [Google Scholar] [CrossRef] [PubMed] [Green Version]
  32. Van Sebille, E.; Wilcox, C.; Lebreton, L.; Maximenko, N.; Hardesty, B.D.; Van Franeker, J.A.; Eriksen, M.; Siegel, D.; Galgani, F.; Law, K.L. A global inventory of small floating plastic debris. Environ. Res. Lett. 2015, 10, 124006. [Google Scholar] [CrossRef]
  33. Cole, M.; Webb, H.; Lindeque, P.K.; Fileman, E.S.; Halsband, C.; Galloway, T.S. Isolation of microplastics in biota-rich seawater samples and marine organisms. Sci. Rep. 2014, 4, 1–8. [Google Scholar] [CrossRef] [PubMed] [Green Version]
  34. Reineccius, J.; Appelt, J.-S.; Hinrichs, T.; Kaiser, D.; Stern, J.; Prien, R.D.; Waniek, J.I. Abundance and characteristics of microfibers detected in sediment trap material from the deep subtropical North Atlantic Ocean. Sci. Total Environ. 2020, 738, 140354. [Google Scholar] [CrossRef] [PubMed]
  35. Mathalon, A.; Hill, P. Microplastic fibers in the intertidal ecosystem surrounding Halifax Harbor, Nova Scotia. Mar. Pollut. Bull. 2014, 81, 69–79. [Google Scholar] [CrossRef]
  36. Remy, F.; Collard, F.; Gilbert, B.; Compère, P.; Eppe, G.; Lepoint, G. When microplastic is not plastic: The ingestion of artificial cellulose fibers by macrofauna living in seagrass Macrophytodetritus. Environ. Sci. Technol. 2015, 49, 11158–11166. [Google Scholar] [CrossRef] [PubMed]
  37. Cesa, F.S.; Turra, A.; Baruque-Ramos, J. Synthetic fibers as microplastics in the marine environment: A review from textile perspective with a focus on domestic washings. Sci. Total Environ. 2017, 598, 1116–1129. [Google Scholar] [CrossRef]
  38. Dris, R.; Gasperi, C.; Mirande, C.; Mandin, C.; Guerrouache, M.; Langlois, V.; Tassin, B. A first overview of textile fibers, including microplastics, in indoor and outdoor environments. Environ. Pollut. 2017, 221, 453–458. [Google Scholar] [CrossRef] [Green Version]
  39. Lusher, A.; Burke, A.; O’Connor, A.; Officer, R. Microplastic pollution in the Northeast Atlantic Ocean: Validated and opportunistic sampling. Mar. Pollut. Bull. 2014, 88, 325–333. [Google Scholar] [CrossRef]
  40. Castro, R.O.; Silva, M.L.; Marques, M.R.C.; de Araújo, F.V. Evaluation of microplastics in Jurujuba Cove, Niterói, RJ, Brazil, an area of mussels farming. Mar. Pollut. Bull. 2016, 110, 555–558. [Google Scholar] [CrossRef]
  41. Ory, N.C.; Sobral, P.; Ferreira, J.L.; Thiel, M. Amberstripe scad Decapterus muroadsi (Carangidae) fish ingest blue microplastics resembling their copepod prey along the coast of Rapa Nui (Easter Island) in the South Pacific subtropical gyre. Sci. Total Environ. 2017, 586, 430–437. [Google Scholar] [CrossRef] [PubMed]
  42. Pedrotti, M.L.; Petit, S.; Elineau, A.; Bruzaud, S.; Crebassa, J.-C.; Dumontet, B.; Marti, E.; Gorsky, G.; Cózar, A. Changes in the floating plastic pollution of the Mediterranean Sea in relation to the distance to land. PLoS ONE 2016, 11, e0161581. [Google Scholar] [CrossRef] [Green Version]
  43. Ryan, P.G.; Cole, G.; Spiby, K.; Nel, R.; Osborne, A.; Perold, V. Impacts of plastic ingestion on post-hatchling loggerhead turtles off South Africa. Mar. Pollut. Bull. 2016, 107, 155–160. [Google Scholar] [CrossRef] [PubMed]
  44. Mansui, J.; Darmon, G.; Ballerini, T.; Canneyt, O.; Ourmieres, Y.; Miaud, C. Predicting marine litter accumulation patterns in the Mediterranean basin: Spatio-temporal variability and comparison with empirical data. Prog. Oceanogr. 2020, 182, 102268. [Google Scholar] [CrossRef]
  45. Lattin, G.L.; Moore, C.J.; Zellers, A.F.; Moore, S.L.; Weisberg, S.B. A comparison of neustonic plastic and zooplankton at different depths near the southern California shore. Mar. Pollut. Bull. 2004, 49, 291–294. [Google Scholar] [CrossRef]
  46. Moore, C.J.; Moore, S.L.; Leecaster, M.K.; Weisberg, S.B. A comparison of plastic and plankton in the North Pacific central gyre. Mar. Pollut. Bull. 2001, 42, 1297–1300. [Google Scholar] [CrossRef]
  47. Hannides, C.; Siokou, I.; Zervoudaki, S.; Frangoulis, C.; Lange, M. Mesozooplankton biomass and abundance in Cyprus coastal waters and comparison with the Aegean Sea (eastern Mediterranean). Mediterr. Mar. Sci. 2015, 16, 373–384. [Google Scholar] [CrossRef] [Green Version]
  48. Zodiatis, G.; Lardner, R.; Hayes, D.R.; Georgiou, G.; Sofianos, S.; Skliris, N.; Lascaratos, A. Operational ocean forecasting in the Eastern Mediterranean: Implementation and evaluation. Ocean Sci. 2008, 4, 31–47. [Google Scholar] [CrossRef] [Green Version]
Figure 1. The map of Cyprus with the four sampling stations (St.1–St.4) situated in the areas of Latsi, Amathounta, Meneou and Protaras, respectively.
Water 13 02272 g001
Figure 2. Photos of microplastic fragments that belong to the six morphotypes. (a) HR = ‘hard rounded’, (b) SR = ‘soft rounded’, (c) HF = ‘hard flattened’, (d) SF = ‘soft flattened’, (e) ML = ‘membrane like’, (f) CL = ‘cable like’. Description of these morphotypes is provided within the text.
Water 13 02272 g002
Figure 3. The average abundance (items/m3) ± Standard Error of the microplastic fibers (A) and fragments (B) recovered from the samples taken in the four sampling areas (Latsi, Amathounta, Meneou and Protaras) during 2017–2019.
Water 13 02272 g003
Figure 4. The cumulative abundance (items/m3) of the different colors of the microplastic fibers recovered from each of the 25 samples in the four sampling areas (Latsi, Amathounta, Meneou and Protaras) during 2017–2019. (In each sample, the first number refers to the sampling month and the last two numbers to the sampling year).
Water 13 02272 g004
Figure 5. Length size distribution of the overall microplastic fibers (as items/m3) recovered from the total number of samples collected in the four sampling areas (Latsi, Amathounta, Meneou and Protaras) during 2017–2019.
Water 13 02272 g005
Figure 6. The calculated area (as mm2) of the total number of microplastic fragments found in each of the 25 samples in the four sampling areas (Latsi, Amathounta, Meneou and Protaras) during the years 2017–2019. (In each sample, the first number refers to the sampling month and the last two numbers to the sampling year).
Water 13 02272 g006
Figure 7. Size classes distribution (%) of the area (in mm2) covered by the overall microplastic fragments found in all the samples collected during 2017–2019.
Water 13 02272 g007
Figure 8. The (%) proportion of the different colors of the overall microplastic fragments recovered from the total number of samples in the four sampling areas (Latsi, Amathounta, Meneou and Protaras) during the years 2017–2019. (TRA = transparent, BLA = black, BLU = blue, RED = red, WHI = white, YEL = yellow, ORA = orange, GRE = green, BRO = brown, SIL = silver).
Water 13 02272 g008
Figure 9. Pearson correlation between the abundance of the total microplastics (fibers and fragments) with (A) the total zooplankton and (B) the total copepods. Pearson correlation between the abundance of the total fibers with (C) the total zooplankton and (D) the total copepods. Pearson correlation between the abundance of the total fibers in just the area of Latsi with (E) the total zooplankton and (F) the total copepods. The values are log(X + 1) transformed. The Pearson correlation coefficient (r2) and the significance level (p) are given on the diagrams.
Water 13 02272 g009
Table 1. Abundance (items/m3) of the different morphotypes of microplastic fragments in each of the samples collected from the four areas (Latsi—LA, Amathounta—AM, Meneou—ME and Pro-taras—PR). The six morphotypes of fragments are HR = ‘hard rounded’, SR = ‘soft rounded’, HF = ‘hard flattened’, SF = ‘soft flattened’, ML = ‘membrane like’, CL = ‘cable like’. Description of these morphotypes is provided within the text. (The two first letters in the code name of each sample refers to the area of sampling, followed by the sampling month and the sampling year.)
SampleHRHFSRSFMLCLTotal
LA 8–170.210.310.140.000.030.030.72
LA 3–180.540.130.070.001.080.131.96
LA 7–180.460.980.050.100.000.151.75
LA 11–180.350.390.120.080.040.241.22
LA 3–191.030.410.310.000.000.001.75
LA 7–190.150.530.080.000.080.000.83
AM 7–170.450.450.250.000.000.151.30
AM 12–171.373.590.000.000.000.425.39
AM 3–180.100.760.100.000.000.000.96
AM 8–180.521.380.170.000.000.092.16
AM 11–181.080.830.170.170.080.582.92
AM 4–190.260.660.000.040.300.041.29
ME 7–170.880.960.160.000.000.162.15
ME 11–170.711.290.350.120.240.002.71
ME 3–180.980.980.420.000.000.002.39
ME 7–180.500.320.130.130.000.001.07
ME 2–1917.172.280.220.540.000.1120.33
ME 5–190.671.350.380.000.380.002.79
ME 9–190.770.770.140.070.000.211.96
PR 7–170.743.090.620.120.000.374.94
PR 10–170.301.800.100.000.200.002.40
PR 4–180.100.580.190.680.290.192.04
PR 8–180.350.180.000.000.000.440.96
PR 2–1930.670.560.000.002.580.1133.93
PR 6–190.421.560.521.250.940.104.79
Total60.7926.164.683.306.243.54104.71
Publisher’s Note: MDPI stays neutral with regard to jurisdictional claims in published maps and institutional affiliations.

